
Observations of Gas-Phase Alkylamines at a Coastal Site in the East Mediterranean Atmosphere

Environmental Chemical Processes Laboratory, Department of Chemistry, Voutes Campus, University of Crete, 70013 Heraklion, Greece
*
Author to whom correspondence should be addressed.
Atmosphere 2021, 12(11), 1454; https://doi.org/10.3390/atmos12111454
Submission received: 13 October 2021
/
Revised: 29 October 2021
/
Accepted: 29 October 2021
/
Published: 3 November 2021
(This article belongs to the Special Issue Ammonia in a Changing Atmosphere)
Abstract
:Atmospheric amines are ubiquitous compounds in the atmosphere, having both natural and anthropogenic origin. Recently, they have been identified as important contributors to new particle formation in the atmosphere, but observations of their atmospheric concentrations are scarce. In the present study we introduce the first systematic long-term observations of gas-phase amines measurements in the East Mediterranean atmosphere. Air samples were collected at the Finokalia monitoring station of the University of Crete during a 3.5-year period from January 2013 to July 2016, and analyzed after extraction using a high-performance liquid chromatography triple quadrupole mass spectrometer. The detected alkylamines were the sum of dimethylamine and ethylamine (DMA+EA), trimethylamine (TMA), diethylamine (DEA) and triethylamine (TEA). DMA+EA and TMA were the most abundant alkylamines, with concentrations spanning from the detection limit to 78.0 and 69.8 pptv, and average concentrations of 7.8 ± 12.1 and 7.5 ± 12.4 pptv, respectively. Amines showed pronounced seasonal variability with DMA+EA and TMA concentrations being higher in winter. Statistical analysis of the observations showed different sources for each of the studied amines, except for DMA+ΕA and DEA that appear to have common sources in the region. This analysis points to a marine source of TMA and animal husbandry in the area as a potential source of TEA. None of the alkylamines is correlated with other anthropogenic sources. Furthermore, no clear association was found between the seasonality of NPF events and alkylamines concentrations, while a clear correlation was detected between the seasonality of nucleation mode particle (dp < 25 nm) number concentrations and alkylamine concentrations, indicating that amines may contribute to nucleation mode particles’ production.
1. Introduction
Alkylamines are derivatives of ammonia, where H atoms are replaced by alkyl (R) structures and can be distinguished in primary (RNH2), secondary (R2NH) and tertiary (R3N) amines. They constitute a small fraction of the organic nitrogen compounds in the atmosphere [1,2]. Amines are stronger bases than ammonia, with a very important but lower than ammonia’s acid-neutralizing capability and atmospheric concentrations as much as 14–23% of that of ammonia [3]. In the atmosphere, alkylamines are oxidized very rapidly by hydroxyl (OH) radicals, proceeded by H-abstraction, with lifetimes of <16 h for methylamine, about 11 h for ethylamine (EA, (C2H5)NH2), 4.6–7 h for trimethylamine (TMA, (CH3)3N), 4.3 h from dimethylamine (DΜA, (CH3)2NH), 2.3–3.4 h for diethylamine (DEA, (C2H5)2NH) and 3 h for triethylamine (TEA, (C2H5)3N) at room temperature [4,5]. Imines, ammonia, amides, formaldehyde, nitroamines, nitrosamines, and aminoaldehydes are among the identified oxidation products, and several of them have cancerogenic properties [5,6]. To a lesser extent, they also react with ozone, starting with O addition to N, and, when present, with nitrate radicals and chlorine atoms, proceeded by H abstraction [5]. Amines are also taken up by aerosols, a process that reduces their lifetime by at least 30% [7]. Their high reactivity, in combination with their neutralizing capacity, impedes the detection of amines in the atmosphere. Thermodynamic calculations with the E-AIM model suggest that several amine salts can be formed in the atmosphere, although chlorides and nitrates of TMA, as well as aniline and N-methylaniline, have dissociation constants much larger than those of ammonium salt; therefore, it is unlikely that they will form when ammonia is present [8]. However, these calculations do not include updated experimental data for amines like in [9,10,11]. Amine gas-to-particle partitioning depends on aerosol pH, as is the case for ammonia [8].
Amines are ubiquitous compounds, with about 150 amines and 30 amino acids identified in the atmosphere [12], and they are emitted by a variety of natural and anthropogenic sources. The main anthropogenic sources are animal husbandry and various industrial processes such as the food industry, chemical and leather manufacturing; amines are also used as absorption solvents for CO2 post-combustion capture, while combustion, composting operation and automobiles also emit amines. Natural emissions include from the ocean, biomass burning, vegetation, and geologic sources (volcanic eruptions and soil) [12,13].
Alkylamines participate in aerosol formation contributing to new particle formation (NPF) and growth [14,15,16,17,18,19]. Because of their higher basicity, amines are likely to bind to sulfuric acid more efficiently than ammonia. Therefore, they have been identified as key player in NPF by stabilizing small molecular clusters and enhancing sulfuric-acid-driven particle formation more efficiently than ammonia [20]. Controlled experiments in chambers showed that a few pptv of dimethylamine are able to enhance the particle nucleation rate by more than three orders of magnitude compared to NH3 [20,21,22].
Gas-phase alkylamines have been measured with various analytical methods both online and offline. Atmospheric samples for offline amine analysis have been collected in solid-phase micro-extraction fiber and analyzed by gas chromatography coupled with mass spectrometry (GC-MS) [23]. Kieloaho et al. [24] have collected air samples in phosphoric-acid-impregnated fiberglass filters and analyzed them with a high-performance liquid chromatography coupled with mass spectrometry (HPLC-MS) [25]. Dawson et al. [26] collected ion exchange resins samples and analyzed them with ion chromatography (IC). Akyüz et al. [27,28] percolated atmospheric amine samples through the acid solution that had been analyzed with a GC-MS system.
Online methods have been used in order to detect gas-phase alkylamines, such as chemical ionization mass spectrometry (CIMS) [29,30,31], ambient pressure proton transfer mass spectrometry (AmPMS) [32,33], chemical ionization atmospheric pressure interface time-of-flight mass spectrometry (CI-APi-TOF) [34,35], high-resolution time-of-flight chemical ionization (HRToF-CIMS) [36,37], ion chromatography instrument for measuring aerosols and gases in ambient air, coupled with mass spectrometry (MARGA-MS) [38], and an ambient ion monitor ion chromatograph (AIM-IC) [39,40]
Currently, measurements of amines in the atmospheric gas-phase are limited, mostly covering short time-periods and mainly cities, urban and suburban areas. Only a few studies were performed in rural or boreal environments [16,24,29,30,33,34,38], a few in agricultural areas [35,39], and even less in coastal environments [13,33]. They report atmospheric concentrations up to 40 pptv for dimethylamine and ethylamine both in urban [37] and forested regions [24] during the warm period. For diethylamine, concentrations as high as 150 pptv have been observed in rural areas of the US [33]. For trimethylamine, concentrations up to 80 pptv have been reported for forested areas in Finland [29]. On the other hand, low concentrations as close as the detection limit have been reported both in forested and urban areas for all the alkylamines under study. For example, mean concentrations of DMA < 0.15 pptv [34], TMA ~1 pptv [30,39], DEA 0.3 and ΤΕA 0.1 pptv [25] were measured. These reported differences in the mixing ratios of amines reflect source and sink variability, but also differences in the sampling and analytical methods.
For the present study, the methodology developed by Kieloaho et al. [24] for sample collection and analysis for detecting gas-phase alkylamines was optimized and standardized [41] for samples collected at the Finokalia station in the Eastern Mediterranean [42]. Using this methodology, dimethylamine, ethylamine, trimethylamine, diethylamine and triethylamine were detected in gas-phase at the Finokalia station in Crete. The first long- term measurements of amines in the Eastern Mediterranean with samples systematically collected from January 2013 to July 2016 are here presented. They enable the determination of the variability and the seasonal cycles of amines at Finokalia. The observed concentrations of amines were compared with concurrent observations of other pollutants, NPF events and nucleation mode particles’ number concentrations measured at the same site. Simultaneous submicron aerosol size distribution measurements with a scanning mobility particle sizer (SMPS) analyzer [43] enabled the investigation of NPF events and their seasonality in the East Mediterranean.
2. Materials and Methods
2.1. The Site
Measurements of the present study took place at the atmospheric observatory of the University of Crete at Finokalia, Crete, Greece (35°20′ N, 25°40′ E, 250 m a.s.l). The Finokalia station (http://finokalia.chemistry.uoc.gr/ accessed on 31 May 2021) is part of the ACTRIS (Aerosols, Clouds, and Trace Gases Research Infrastructure) Network and is located at a remote coastal site in the north east part of the island of Crete. The station has negligible influence from local anthropogenic sources as the nearest large urban center is the city of Heraklion located about 50 km to the west of the station, and is facing the sea within the wind sector of 90–270°. The location is well characterized by atmospheric measurements and is representative of the East Mediterranean atmosphere [42,43,44].
2.2. Sample Collection
Filter air samples were collected at 3 m above ground level from January 2013 to July 2016. Every week, three samples were collected in parallel, a weekly (144 h of sampling) and two 72 h of sampling. In the present study, the results of the 72 h samples, that are the most abundant, are presented in order to obtain a clear view of amines variability.
Air samples filters were collected using a pump at a flow rate of 16 L/min and were protected against direct sunlight and rain. A triple filter holder was used to simultaneously collect 3 filters for each air sample. First, a polytetrafluoroethylene (PTFE) filter (ZefluorTM 2.0 μm, 47 mm, Pall Corporation, Ann Arbor, MI, USA) was used to collect the particles. Then, a glass fiber filter (GFF, 0.7 μm, 47 mm, Whatman International Ltd., Maidstone, UK) impregnated with a solution of sodium carbonate/glycerole was used for trapping sulfur dioxide as sulfate (SO42−). Finally, a second GFF filter impregnated with 5% phosphoric acid (H3PO4) solution in methanol was used for trapping gas-phase amines as salts, as suggested by Rampfl et al. [45]. After impregnation, the methanol was removed from the filters in a drying oven at 65 °C with air circulation. Bromocresol green was used as acid-base indicator for the visualization of the sorbent saturation. Amines reacted with H3PO4 and formed aminium phosphate (R3NH+H2PO4−). Heterogeneous uptakes of TEA and TMA vapor by aqueous and solid inorganic aerosol surrogates as ammonium nitrate and ammonium sulfate may result in negative artifacts, due to uptake of the amines on particles collected on the PTFE filter, as described in detail in Chan and Chan [46] and Lloyd et al. [47]. Therefore, the here reported measurements could underestimate the TMA concentrations. Collected samples were subsequently transported to the laboratory where they were stored in refrigerators (−18 °C). Further details on the collection of samples are represented in Tzitzikalaki et al. [41].
2.3. Analytical Method
The analytical method is based on the procedure introduced by Kieloaho et al. [24] with optimizations for our samples and system. Onto each filter, an internal standard, deuterated diethyl-d10-amine (d10-DEA, C/D/N Isotopes Inc., Pointe-Claire, QC, Canada), was injected. This was analyzed following the same procedure with the other amines in order to evaluate the extraction efficiency of the method for each sample and correct the results accordingly. The median extraction efficiency was found to be 69%, with values ranging from 10% to 99%. Contrary to the extraction procedure presented by Kieloaho et al. [24], in the present study the extraction of H3PO4-impregnated filters with ultrapure water produced too acidic extracts for the analytical column and chromatograms’ deformation. The use of a buffer solution to control the pH of the extracts improved chromatograms. The optimal pH and the appropriate buffer solution have been determined by performing several sensitivity tests, using different concentrations of buffer solutions of potassium phosphate, pyrolidine and NH4OH/NH4Cl [41]. Therefore, aminium ions were extracted from the H3PO4-impregnated filters with a buffer solution of NH4OH/NH4Cl of 8.58 pH in an ultrasonic bath for 1 h.
The extracts were analyzed by a high-performance liquid chromatography triple quadrupole mass spectrometer (TSQ Quantum Mass Spectrometer System, Thermo Finnigan, San Jose, CA, USA). The reverse-phase HPLC was equipped with a LC pump, injector, and autosampler (Surveyor Autosampler, San Jose, CA, USA). A Discovery® HS F5 HPLC was used as the analytical column (10 cm × 2.1 mm, 3 μm). A Discovery® HS F5 Guard Column Kit (2 cm × 2.1 mm, 3 μm) (Supelco Analytical, Bellefonte, PA, USA) was used as the pre-column. As solvents, acetonitrile and water, with 0.02% of formic acid as the ion-exchange reagent, were used. The analysis time was 40 min with 200 μL/min flow rate. The 33% shorter analytical column and 20% lower flow rate compared to those used by Kieloaho et al. [24] have led to 25% longer analysis time. Gradient elution was performed with an increasing content of acetonitrile of 5% for 5 min, 25% for 7 min, 50% for 23 min and acetonitrile was decreased to 5% for the last 5 min. The chromatograms were divided into segments for each amine, and for each segment a target compound-specific mass range was followed by a mass spectrometric analysis, in order to achieve higher analytical precision. The following m/z have been used for the detection of the amines: TEA, molecular ion m/z 102, fragments m/z 58.1 and 74; DEA, molecular ion m/z 74, fragment m/z 46.2; TMA, molecular ion m/z 60, fragment m/z 44.2; DMA, molecular ion m/z 46, fragment m/z 31.2; EA, molecular ion m/z 46, fragment m/z 31.2; d-10 DEA, molecular ion m/z 84, fragment m/z 34.2.
The analytical column did not allow the separation of all the alkylamines, and hence DMA and EA, which have the same molecular masses, were handled as a pair in the present study. The precision of the analysis was derived by performing six parallel analyses of standard solutions, calculated as the percentage coefficient of variation and found to be 2–8%. The detection limits (LOD) were reported as three times the standard deviations of the field blanks and were 1.7, 0.8, 0.2 and 0.5 pptv for DMA+EA, TMA, DEA and TEA, respectively.
2.4. Auxilary Observations
Measurements of trace gas concentrations (listed below) and number size distribution of aerosol particles by an SMPS analyser [43] at the Finokalia station were used to correlate the alkylamines concentrations with them to investigate possible common sources and biochemical processes that affect their levels. For the determination of NH3 concentrations, parts of the H3PO4-impregnated filters (the third triplet filter) were extracted with ultrapure water in an ultrasonic bath. The extracts were analyzed as NH4+ using a cation chromatography with a CS12A analytical column.
Analysis of ammonia (NH3), nitrate (NO3−), sulfate (SO42−) chloride (Cl−), sodium (Na+), potassium (K+), calcium (Ca++) and magnesium (Mg++) ions took place by ion chromatography using the standard operation procedures of the Environmental Chemical Processes Laboratory of the University of Crete [48]. For the determination of gas-phase SO2 and HNO3 concentrations, the GFF filter that was impregnated with a solution of sodium carbonate/glycerol was extracted with ultrapure water in an ultrasonic bath. The extracts containing SO42− and NO3− were analyzed by anion chromatography equipped with an AS4A-SC (4 × 150 mm) analytical column, an AG4A-SC (4 × 50 mm) pre-column and an ASRS 300 suppressor. A mixture of 3.4/3.6 mM NaHCO3/Na2CO3 was used as eluent. The analysis was isocratic and lasted 15 min with flow rate 1.5 mL/min. In addition, for the determination of aerosol-phase ions concentrations (Cl−, Na+, K+, Ca++, Mg++, SO42− and NO3−), the PTFE filters (the first filter of the filter holder) were analyzed by ion chromatography [48].
Particle number size distributions were measured in the diameter range of 9−848 nm every five minutes with a TROPOS type custom-built SMPS, in order to identify NPF events at Finokalia station. For the identification of the NPF event days, the approach of Dal Maso et al. [49] was followed according to Kalivitis et al. [43]. Beyond NPF events, nucleation mode particle number concentrations were determined using the SMPS measurements.
Finally, black carbon mass concentrations were derived from absorption measurements using the aethalometer instrument and the specific mass absorption efficiency (MAE) that was calculated from aerosol absorption coefficient (babs) at 950 nm. Two different Magee Scientific aethalometers were used, a model AE31 from the beginning of our measurements until October of 2014, and a model AE33 afterwards. The contribution of fossil fuel and wood burning to black carbon (black carbon fossil fuel and black carbon wood burning) was also calculated according to Sciare et al. [50].
2.5. Data Analysis
Factor analysis, a multivariate exploratory technique, was applied in order to examine common sources of the various amines with other pollutants measured at Finokalia station. The distributions of the major cations and anions, NH3 and black carbon, were statistically correlated with the measured alkylamines concentrations. For the analysis of cations, anions and ammonia, the simultaneously collected filters by the triple filter holder were used, so samples for these chemicals and of amines were collected in parallel having the same time resolution.
3. Results and Discussion
3.1. Alkylamines Concentrations
The alkylamine measurements performed at Finokalia observatory during a 3.5 years period from 2013 to 2016 are here presented. Table 1 provides the number of 72 h air samples in which the studied alkylamines were detected to be above the LOD. It also reports the detection limit of each alkylamine. DMA+ΕA, TMA, DEA were detected above detection limits in 65%, 68% and 44% of the air samples, respectively. TEA, with concentrations close to the detection limit, was detected in about 10% of our samples.
DMA+EA and TMA were the most abundant alkylamines throughout the whole period, with average concentrations of 7.8 ± 12.0 and 7.5 ± 12.4 pptv, respectively. The average concentration of DEA was 1.1 ± 3.5 pptv and the average concentration of TEA was 0.6 ± 0.4 pptv.
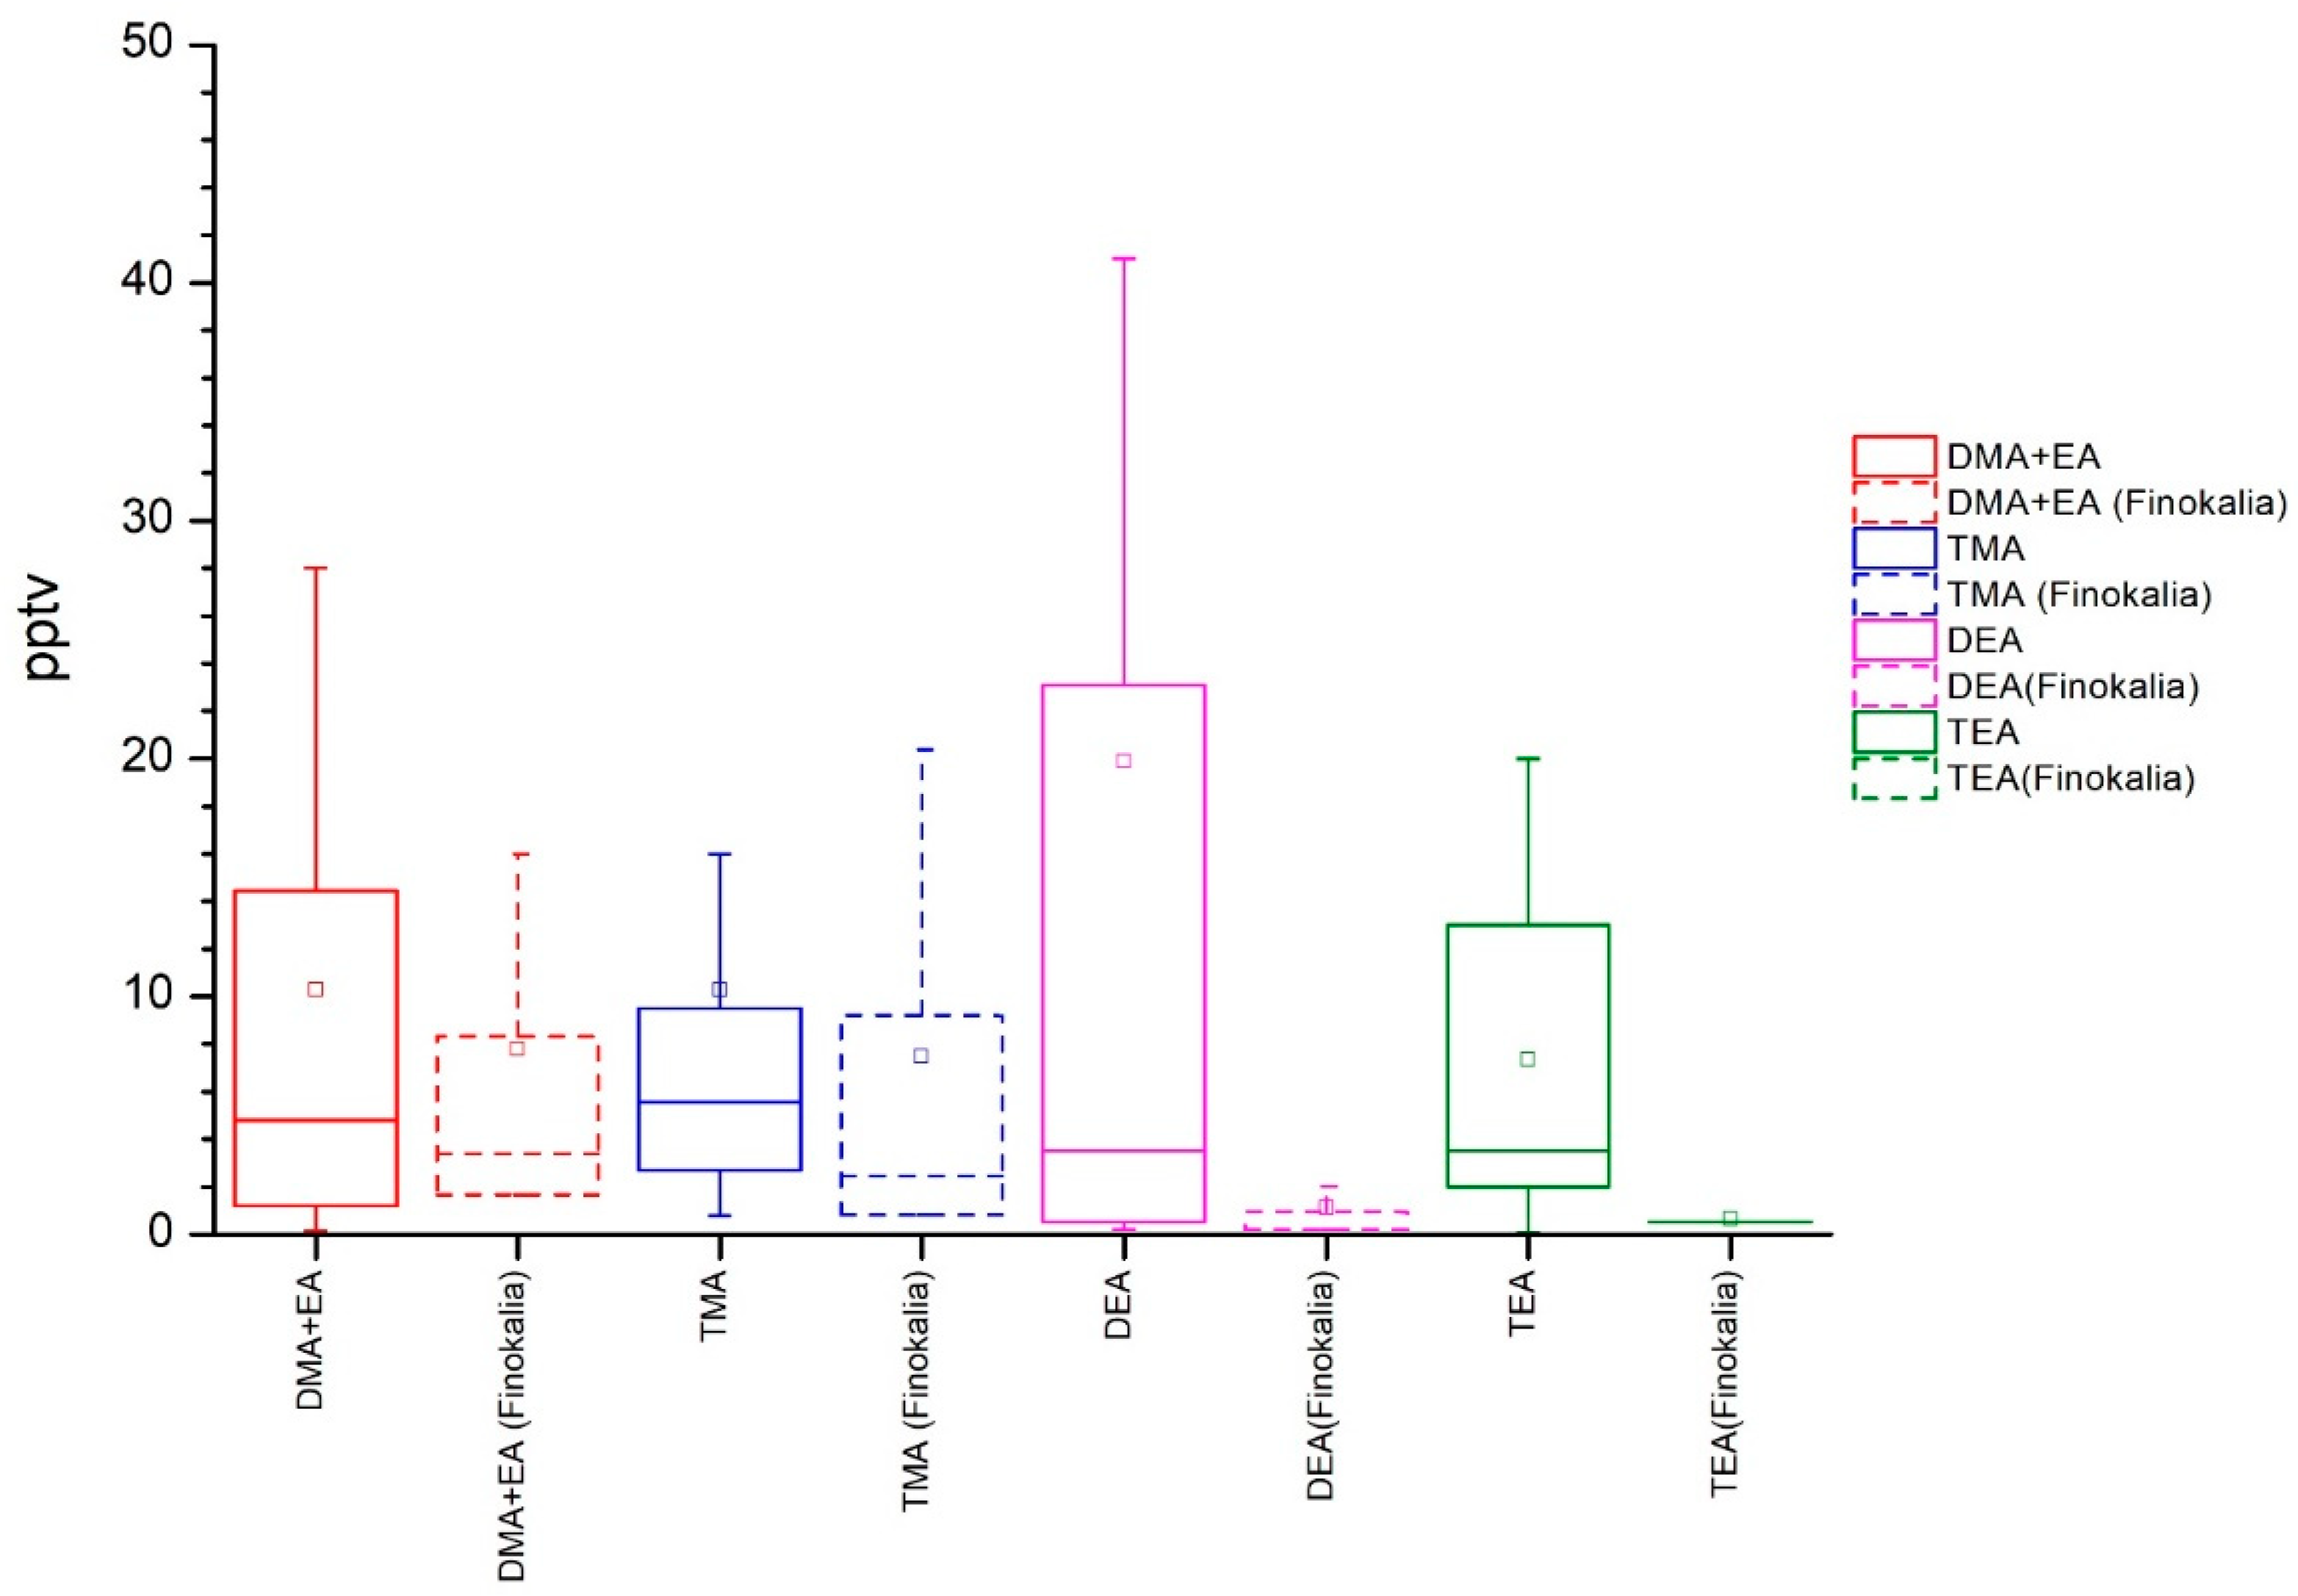
In Table 2, our results are compared with indicative concentrations measured at different environments during field studies and reported in the literature. The concentrations of DMA+EA and TMA fall within the range of reported values worldwide, and they are close to the median concentration of the studies listed in Table 2. Nevertheless, concentrations of DEA and TEA are close to the lower limits of the concentrations reported in the literature, and show large variability as it is depicted in Figure 1.
Yao et al. [37], in the urban environment of Shanghai, and Kieloaho et al. [24], in a rural forest, measured the highest concentrations of DMA+EA, at 40 ± 14.3 and 42 ± 30 pptv, respectively. These values are five times higher than those measured at Finokalia. However, DMA+EA’s abundance in the Eastern Mediterranean is close to that in suburban [31] and rural agricultural environments [39]. DMA+EA observations at the boreal forest field station at Hyytiälä [29,38] are lower than at Finokalia and very low compared to Kieloaho et al. [24] measurements. However, the DMA+EA concentrations at Finokalia are 3.5 times smaller than those reported for the coastal site during summer [33], while TMA, DEA and TEA observations at Finokalia compare well with coastal observations [13,33].
TMA concentrations reported for Hyytiälä and Lemont, Oklahoma (OK) [24,29,33], are 3 to 10 times higher than our observations. However, at other locations—like, for instance, Lewes, DE, USA; Vielbrunn, Germany; Kent, OH, USA [13,21,22,23,41]—TMA concentrations are close to those measured at Finokalia, which are therefore within the range of reported values. Hemmilä et al. [38] observations varied from LOD to 6.1 pptv, with the highest TMA concentration being 18% smaller than the Finokalia average. It is remarkable that the highest concentrations of TMA at Hyytiälä measured by Hemmilä et al. [38] are 13 times lower than those reported by Sellegri et al. [29] for the same location but during a different period, with most probably different ambient conditions. This observation indicates significant temporal variability in amine concentrations.
3.2. Alkylamines Seasonality
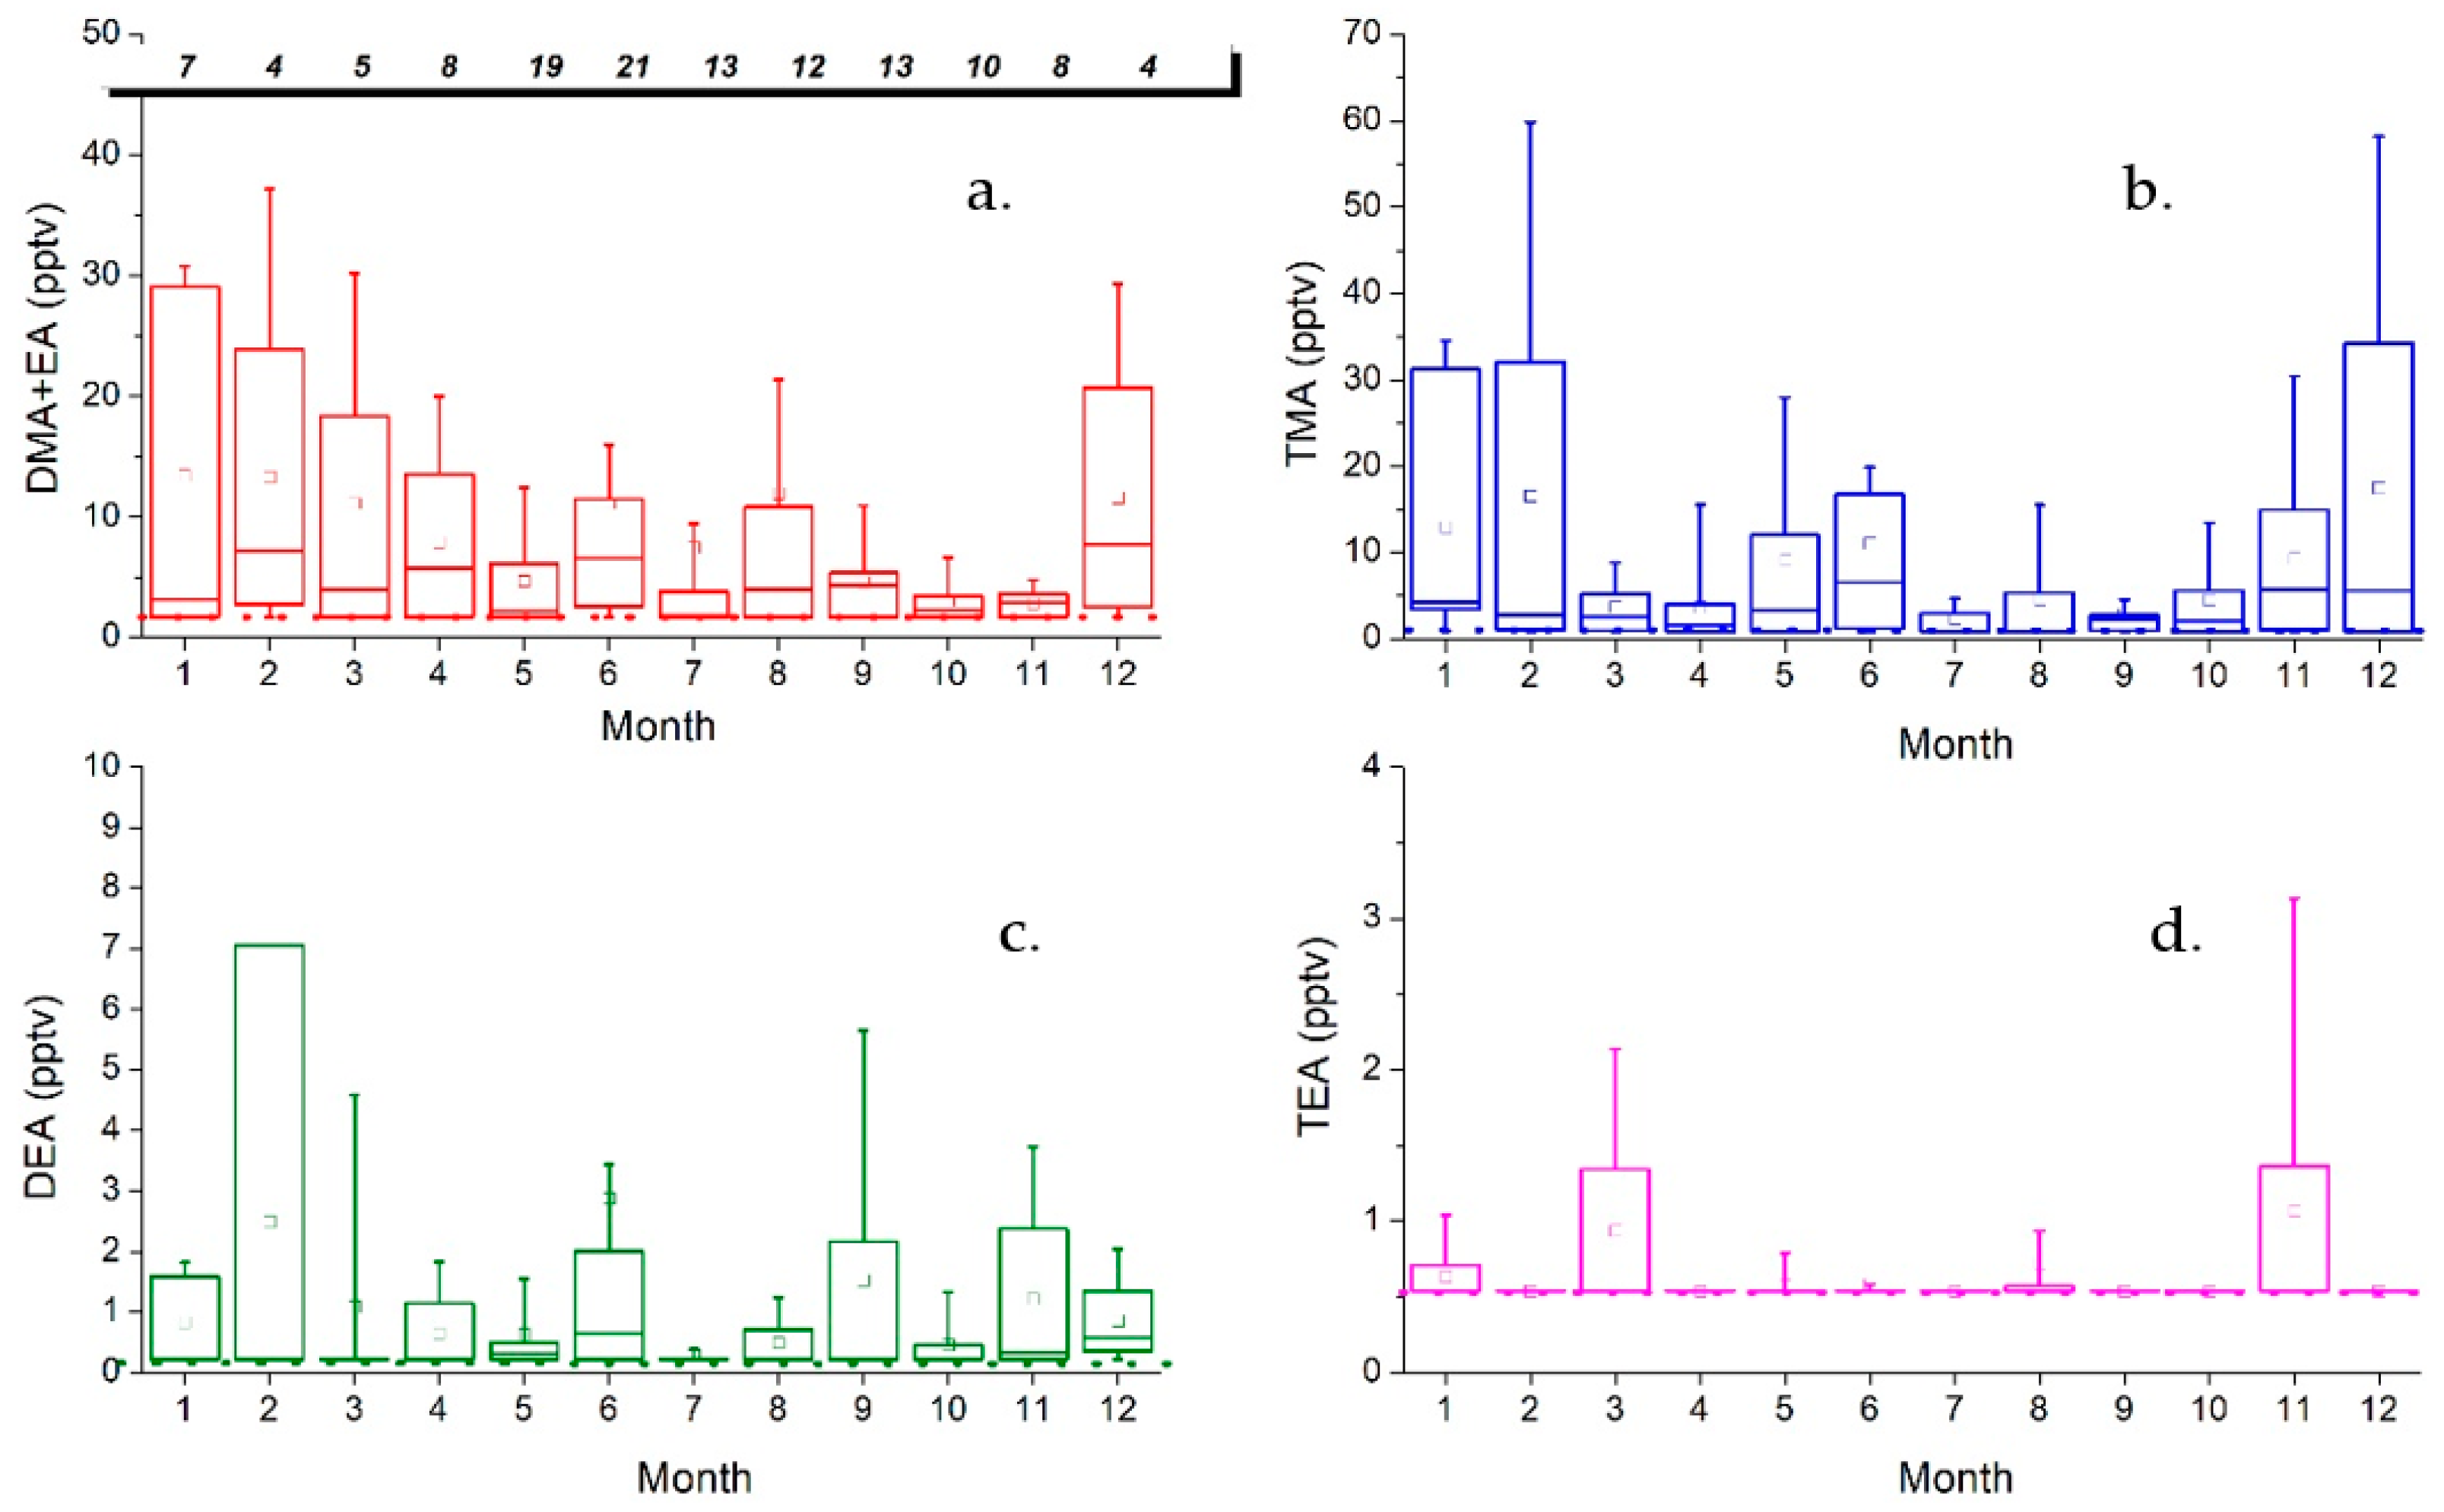
Figure 2 depicts the monthly average concentrations of all amines observed at Finokalia from 2013 to 2016. DMA+EA concentrations show a maximum in winter (mean of 12.9 pptv and values up to about 37.2 pptv). Similarly, ΤΜA concentrations show a winter maximum with values up to 59.8 pptv. A secondary seasonal maximum can be seen in TMA’s concentrations with a mean of 10.2 pptv during May and June. DEA concentrations do not present any clear seasonality. Similarly to DMA+EA and TMA, DEA observations show a maximum during February. However, most TEA measurements are close to LOD, and most concentrations that are above LOD are observed during March and November.
Most of the earlier reported studies (Table 2) were performed over short periods of time and did not provide information on the seasonal variability of amines. Akyüz et al. [27] measured DMA, EA, DEA and other amines during the summers (May to September) of 2004–2005 and winters (October to April) of 2005–2006. In a second study, the same alkylamines were measured during the summer and winter of 2006–2007 [28], but the measurements were not systematic and continuous. Field campaigns of alkylamine observations over longer periods were performed at Hyytiälä, Finland, for ten months (March–December 2015, [38]) and for six months (May–October 2011, [24]). From these two studies, the seasonality of alkylamines can be retrieved only partially, since there is no data for an entire year.
DMA+EA and TMA at Finokalia show similar seasonality with two maxima, in winter and in spring. Winter maximum for these alkylamines was also observed at Zonguldak, Turkey by Akyüz et al. [27,28], who reported higher means and peak concentrations of alkylamines in winter than in summer, probably due to the increased emissions from coal-fired domestic and central heating during winter. The situation is different at Hyytiälä, as both DMA and TMA showed maximum concentrations in July, indicating biogenic sources. TMA concentrations peaked at the end of March suggesting that melting snow and the ground could be TMA’s sources [38]. Finokalia station represents a Mediterranean coastal remote environment that is different from that of a boreal forest. The area is characterized by the existence of two seasons equally distributed throughout the year, the dry (April to September) and the wet season (October to April). During the wet season, phrygana vegetation grows because of the rainfall; there is no snow in the area and the temperature is higher as the site is located in the subtropics. Additionally, animal husbandry activity takes place mainly during the wet season. A sheep flock settles nearby the station every wet season and moves to higher altitudes in spring to find food and cooler temperatures, where it stays during the dry season. Husbandry is the major anthropogenic source of alkylamines in the region and may explain the winter maximum of DMA+ΕA, TMA and the DEA maximum during February. The second maximum could be attributed to the burning of dry biomass before summer and to natural sources like the ocean, since phytoplankton abundance is increased during the spring-bloom.
3.3. Factor Analysis-Source Identification
In order to investigate the sources of the studied amines in the region, an exploratory factor analysis was performed, considering the various amines together with the measurements of other pollutants also measured at Finokalia station (Table 3). The concentrations of alkylamines were analyzed together with those of major cations and anions measured in parallel with alkylamines: sodium (Na+), ammonium (NH4+), magnesium (Mg++), chloride (Cl−), nitrate (NO3−), sulfate (SO42−), as well as of ammonia (NH3), black carbon from fossil fuel combustion (black carbon fossil fuel) and black carbon from biomass burning (black carbon wood burning). Varimax-rotated factor analysis was applied on 72 h data since all variables were averaged to the 72 h period of the amine samples. We found that the data can be interpreted on the basis of five common factors accounting for 75.7% of the total variance of the system (Table 3). The first factor has high correlations of Na+, Cl−, and Mg++, which are typical components of sea-water, and TMA, and explains 26.3% of the total variance. This factor can be attributed to marine emissions, suggesting that TMA is probably of marine origin. Factor 2 explains 16.7% of the total variance in the system, and can be attributed to anthropogenic sources, since it is highly correlated with NH4+, SO42−, and black carbon fossil fuel, which have anthropogenic origin. None of the studied amines are related to the anthropogenic factor. In Factor 3, DMA+ΕA and DEA are grouped together, suggesting that they have common sources, and 13.2% of the total variance is explained by this factor. It is difficult to attribute Factor 3 to a specific source or combination of sources, though vegetation and bacterial activity in soils could be some of them [51]. More auxiliary tracers are needed to enable identification of the common sources of these amines. TEA has common sources with ammonia, such as animal husbandry or soils, as these species are grouped together in Factor 4 which explains 11.4% of the total variance. Finally, black carbon wood burning is the unique parameter in Factor 5, which explains an additional 8.1% of the total variance and is linked to biomass burning.
The factor analysis showed that different amines have different sources, except for DMA+ΕA and DEA which are grouped together. In addition, the analysis suggested that none of the studied amines were related to the anthropogenic factor. Finokalia station is located at a remote coastal site, far away from anthropogenic activities, and is subject to long range transport of pollutants.
However, alkylamine lifetimes are of only a few hours (Table 4), limiting transport to the station only from the close-by regions. Thus, alkylamines sources are local. Moreover, the factor analysis showed that TMA is probably of marine origin, in accordance with Van Neste et al. [13] observations that suggested the ocean as a source for TMA. Freshour et al. [33] measured dimethyl sulfoxide in a marine site, and its spikes during low tide conditions were accompanied by spikes in TMA, suggesting low tide as their common source. In line with this finding, a study in the marine atmosphere of China’s marginal seas showed that TMA concentrations generally increased with increasing ambient temperature and sea surface speeds, indicating that the surface sea water releases TMA [52]. In addition, the correlation between TEA and NH3 suggests that they have common sources. At Finokalia, samples have been collected outdoors and rapidly stored to avoid any contamination by indoor air before and during sample preparation for chemical analysis. This eliminates any potential influence from indoor sources of TEA and NH3 as reported for NH3 by [53], and for TEA emitted indoors, for instance, from freshly applied painting [54]. Therefore, the common sources of TEA and NH3 are most probably associated with agricultural activities that are known to contribute 85–98% of the atmospheric NH3 emissions [55]. These emissions are attributed to the direct breakdown of mineral fertilizer and more importantly to the breakdown of organic matter (such as urea) from animal wastes, suggesting that animal husbandry in the area is probably the common source of NH3 and TEA.
3.4. Air Masses Back Tranjectories Analysis
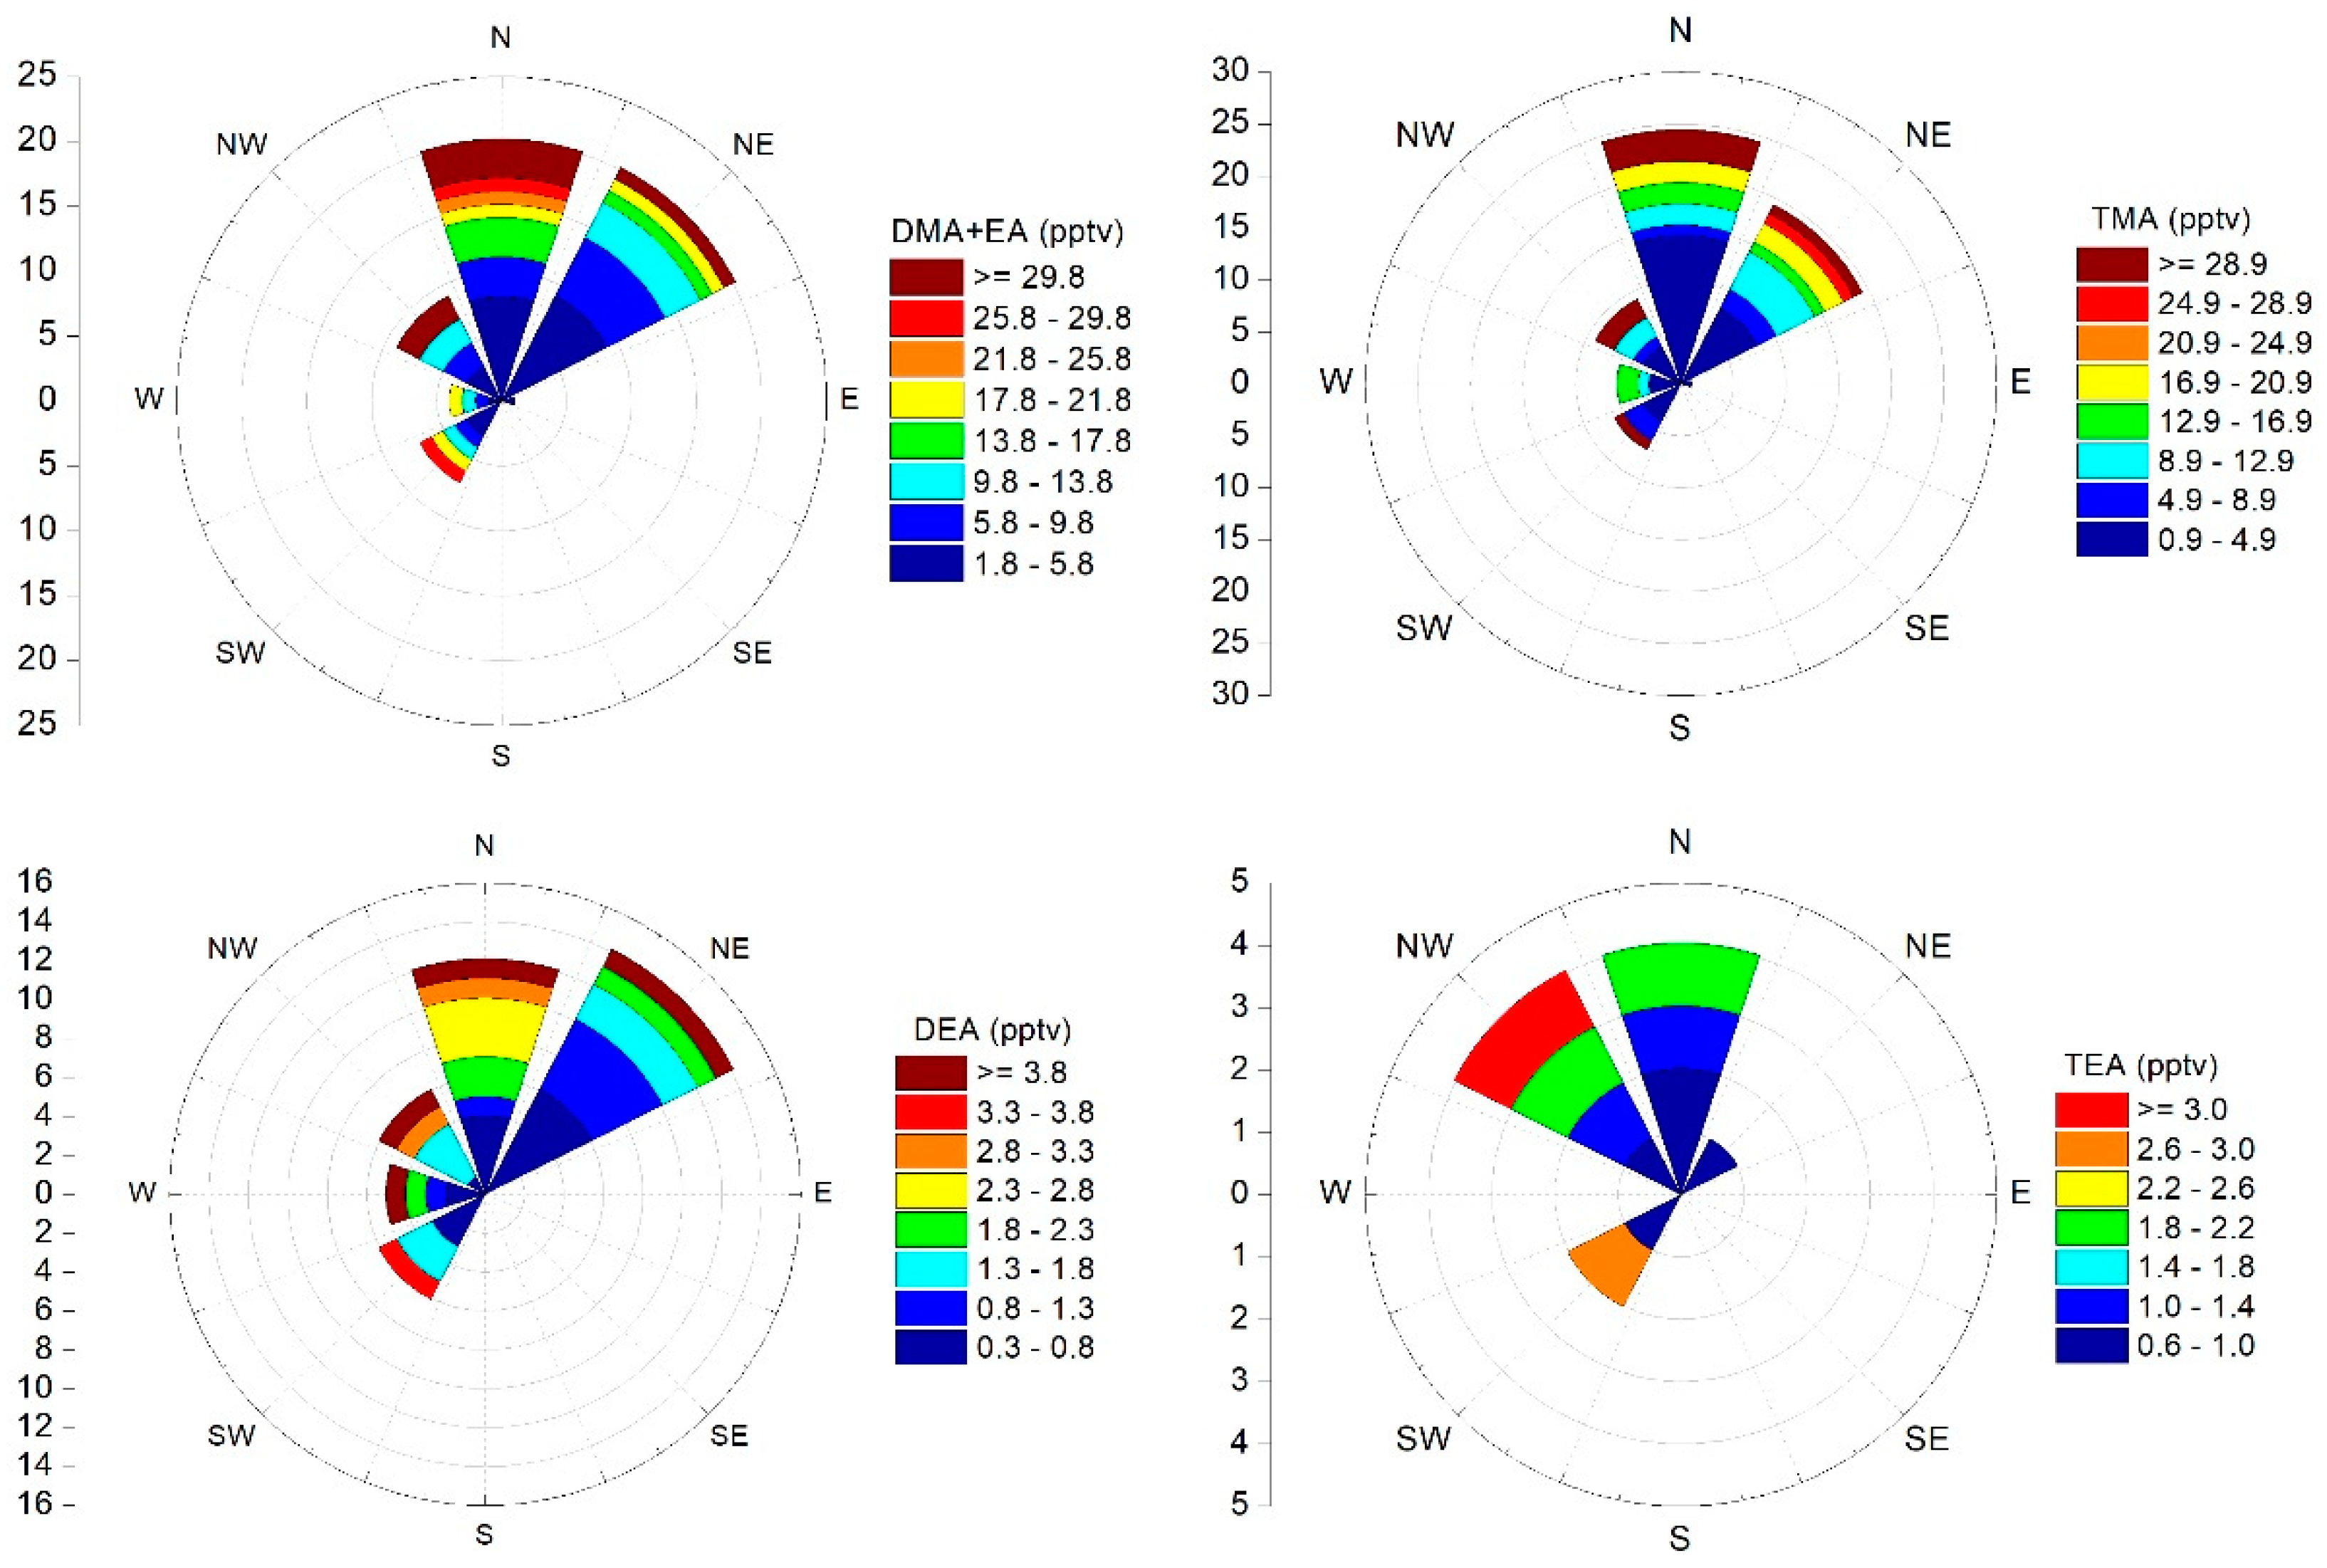
The dependence of alkylamine concentrations on the air mass origin has been investigated by performing an air mass back trajectory analysis (Figure 3). The identification of the air mass origin reflected in the wind direction was based on the five-day back-trajectories arriving at Finokalia station at 1000 m asl and calculated by the HYSPLIT model (Hybrid Single-Particle Lagrangian Integrated Trajectory Model) [56], following the methodology described in [42]. Eight sectors of air mass origin have been defined and used to classify the back trajectories. Note that Finokalia station is mainly characterized by N/NW air masses with high wind speeds [42]. However, for this analysis, we have selected to consider only the air samples that were collected under constant air mass origin for all three days of sampling. Following this procedure, the most frequent air mass origins for the analysed samples were northern (N) (33 samples) and northeastern (NE) (34 samples). Northwestern (NW), southwestern (SW), western (W), and eastern (E) wind directions were observed only for 12, 10, 9 and 1 samples, respectively; while air masses of southern (S) and southeastern (SE) origins were not sampled (Table 5).
DMA+ΕA and TMA were found to maximize in air masses coming from the N and NW, and minimize in air masses coming from the W; while for DEA and TEA, no dependence of their concentration on air mass origin can be found because of their very low concentrations (Table 5). Note, however, the large variability of their concentrations even within each sector which does not allow us to draw final conclusions. Precisely, average DMA+ΕA concentrations equal to 11.2 ± 17.3 pptv, 10.0 ± 11.8 pptv, 7.9 ± 9.2 pptv, and 7.0 ± 11.9 pptv, were measured in N, NW, SW and NE air masses, respectively. DMA+ΕA values were the lowest for W air masses with an average of 5.6 ± 6.5 pptv. TMA concentrations were 11.3 ± 18.0 pptv, 8.7 ± 14.5 pptv, and 7.3 ± 13.2 pptv, for NW, N and NE, air masses, respectively. The lowest TMA concentrations were observed in SW and W air masses equal to 5.7 ± 9.2 pptv and 5.6 ± 6.5 pptv, respectively. Both DMA+EA and TMA show their maximum concentrations in N and NW air masses and their minimum concentrations in W air masses. However, this was not the case for DEA and TEA. DEA average concentrations are 1.6 ± 6.4 pptv, 1.3 ± 2.0 pptv, 1.1 ± 1.8 pptv, 0.9 ± 1.1 pptv, and 0.8 ± 1.1 pptv for NE, NW, S, SW and N wind directions, respectively, showing no significant difference between the different wind sectors. TEA concentrations are close to the detection limit of the method; thus, no variation can be derived from these observations.
3.5. Alkylamines and NPF
In order to investigate a potential participation of alkylamines to nucleation in our region, new particle formation (NPF) events at Finokalia (Figure 4) have been identified following Dal Maso et al. [49] and using the measured scanning mobility particle sizer (SMPS) size distributions during the studied period (2013–2016). Days were manually inspected and classified as ‘NPF event days’ when a clear new nucleation mode and subsequent growth to larger diameters was observed; as ‘non-event days’ when no nucleation mode was observed; and as ‘undefined days’ when either no clear growth was seen in nucleation mode particles or new particles appear into the Aitken mode [43].
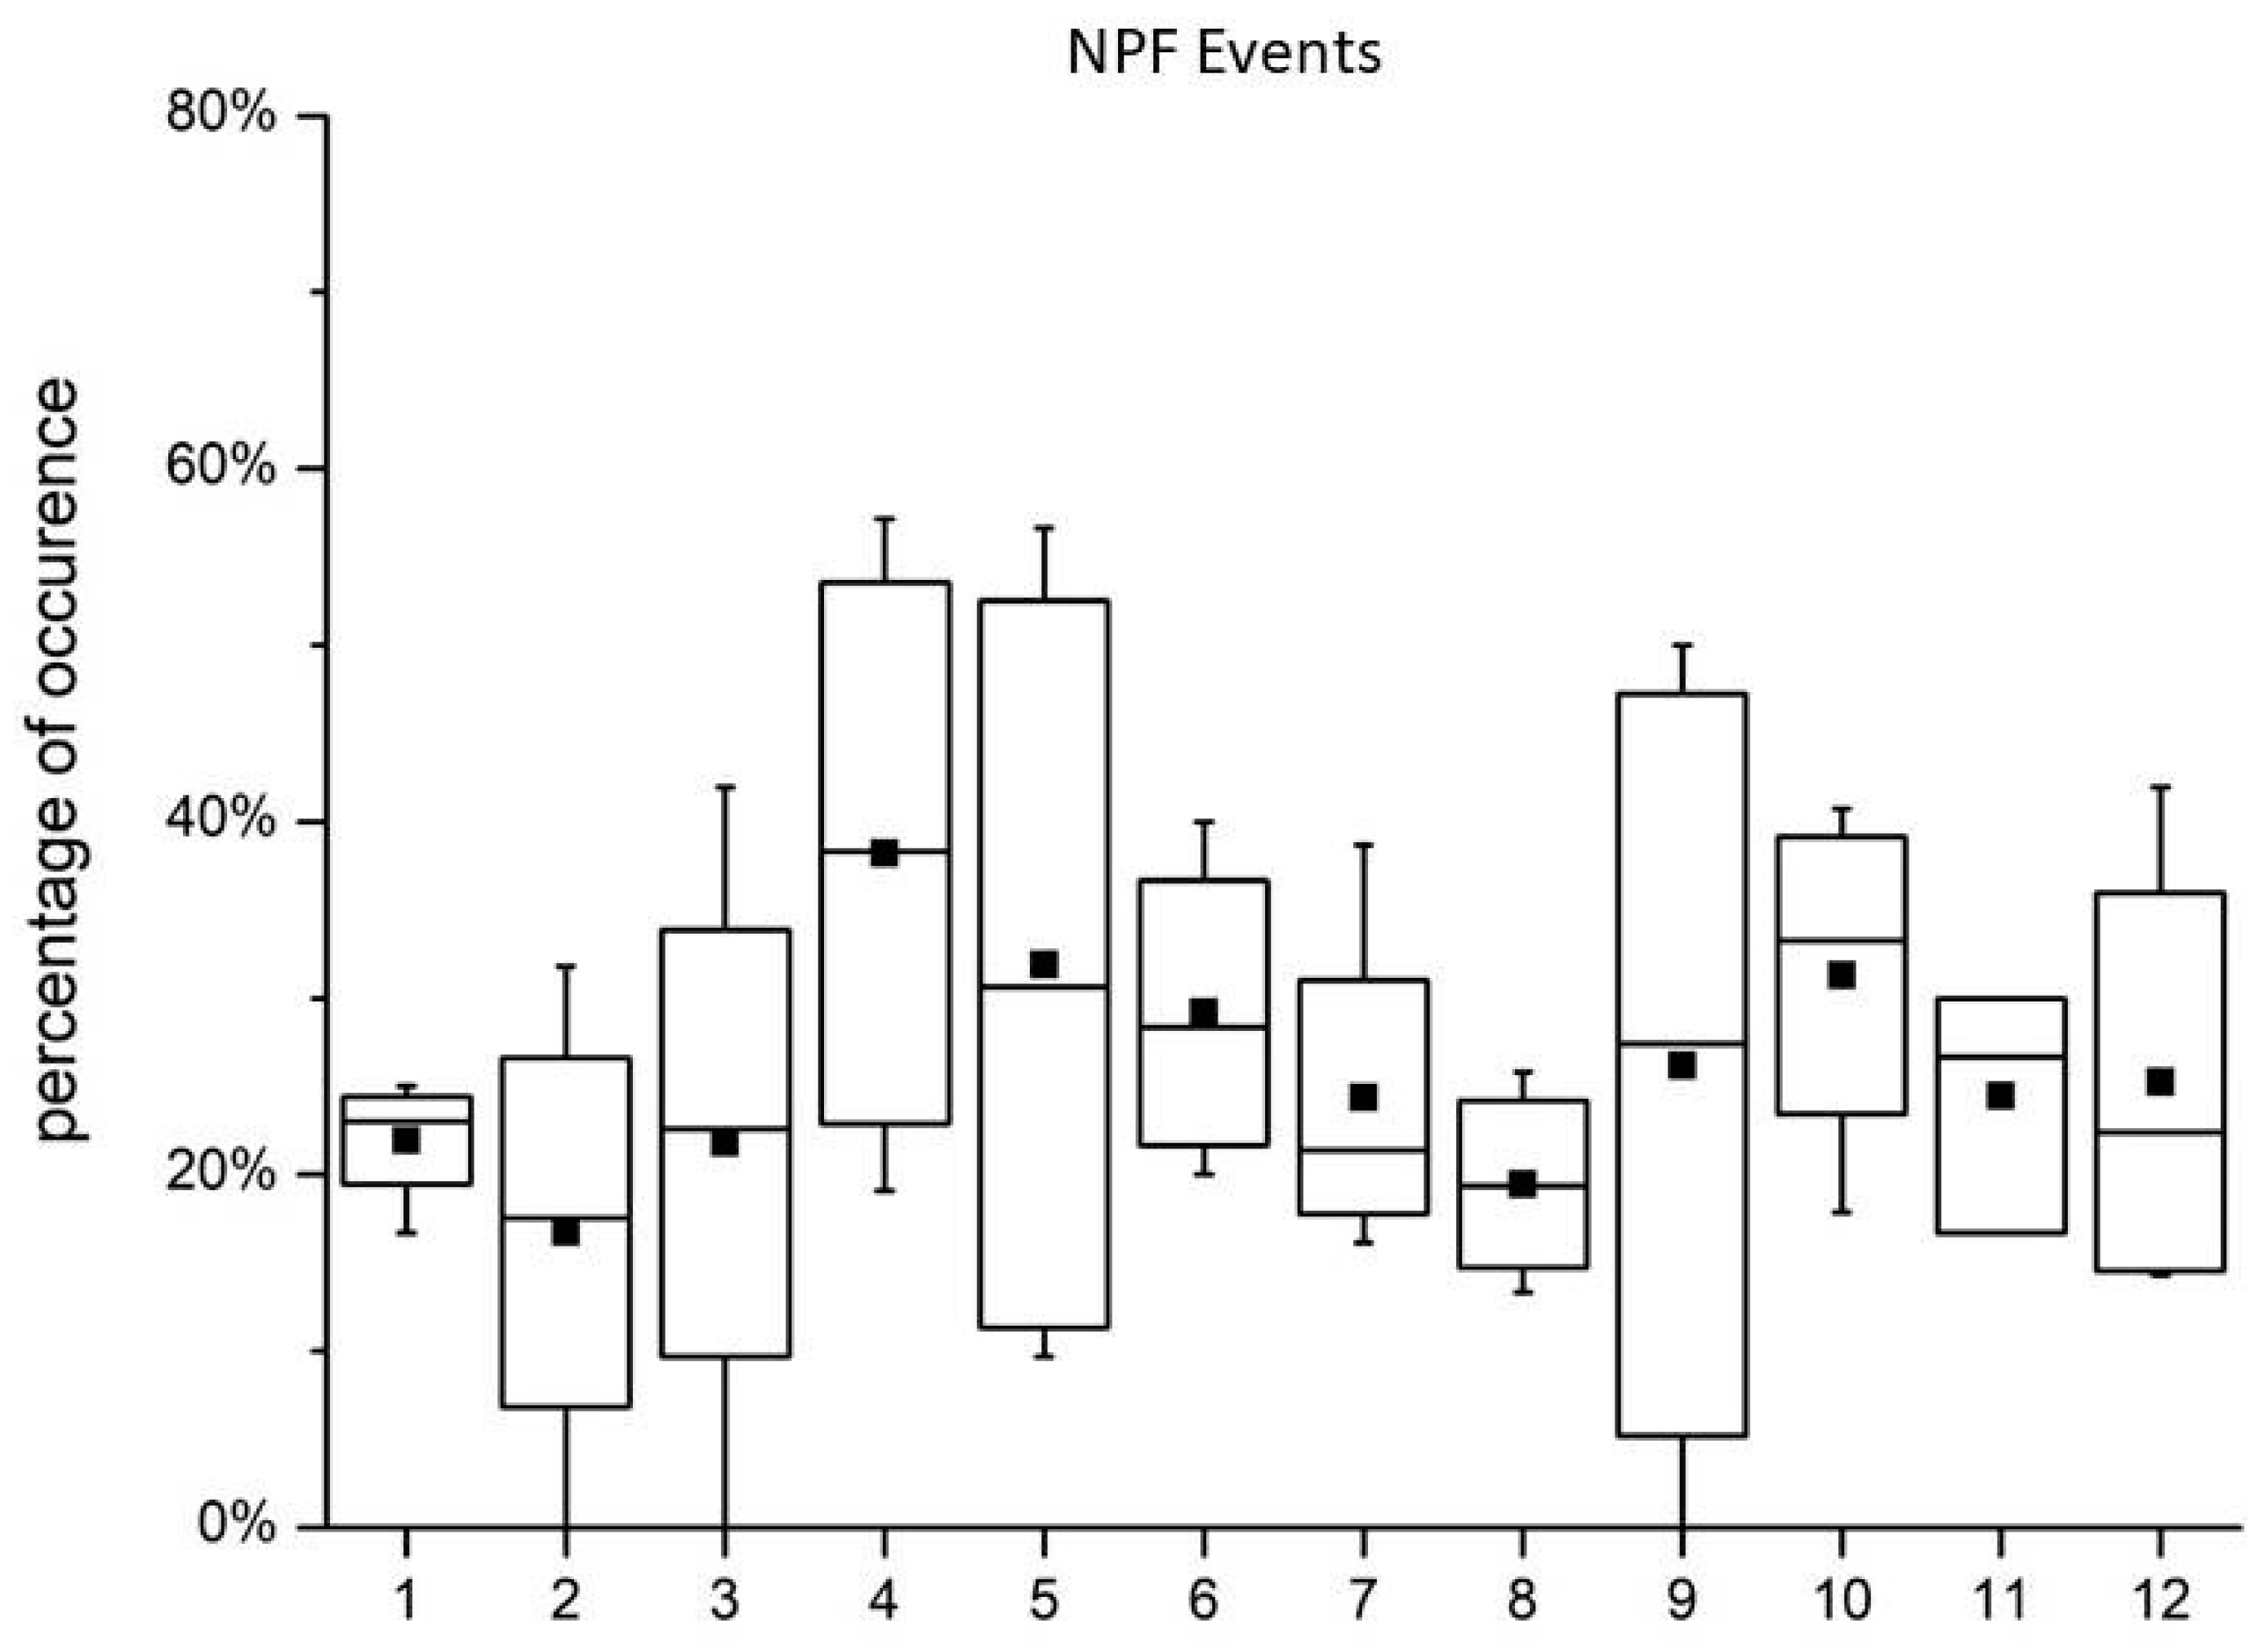
The frequency of NPF events presented two maxima, the first in spring (April and May), and the second in September. As discussed earlier, the amines that showed clear seasonality were DMA+ΕA and ΤΜA. These amines showed maximum concentrations during winter, when NPF events minimize. Thus, there was not a clear link between the NPF events and amine concentrations. It is worth mentioning here that Finokalia station is far from any significant human activity, without any settlement upwind from the station and with the nearest small settlement of less than five inhabited houses being 2 km downwind from the station; therefore, no nucleation mode particle emissions are expected to affect the stations from this settlement.
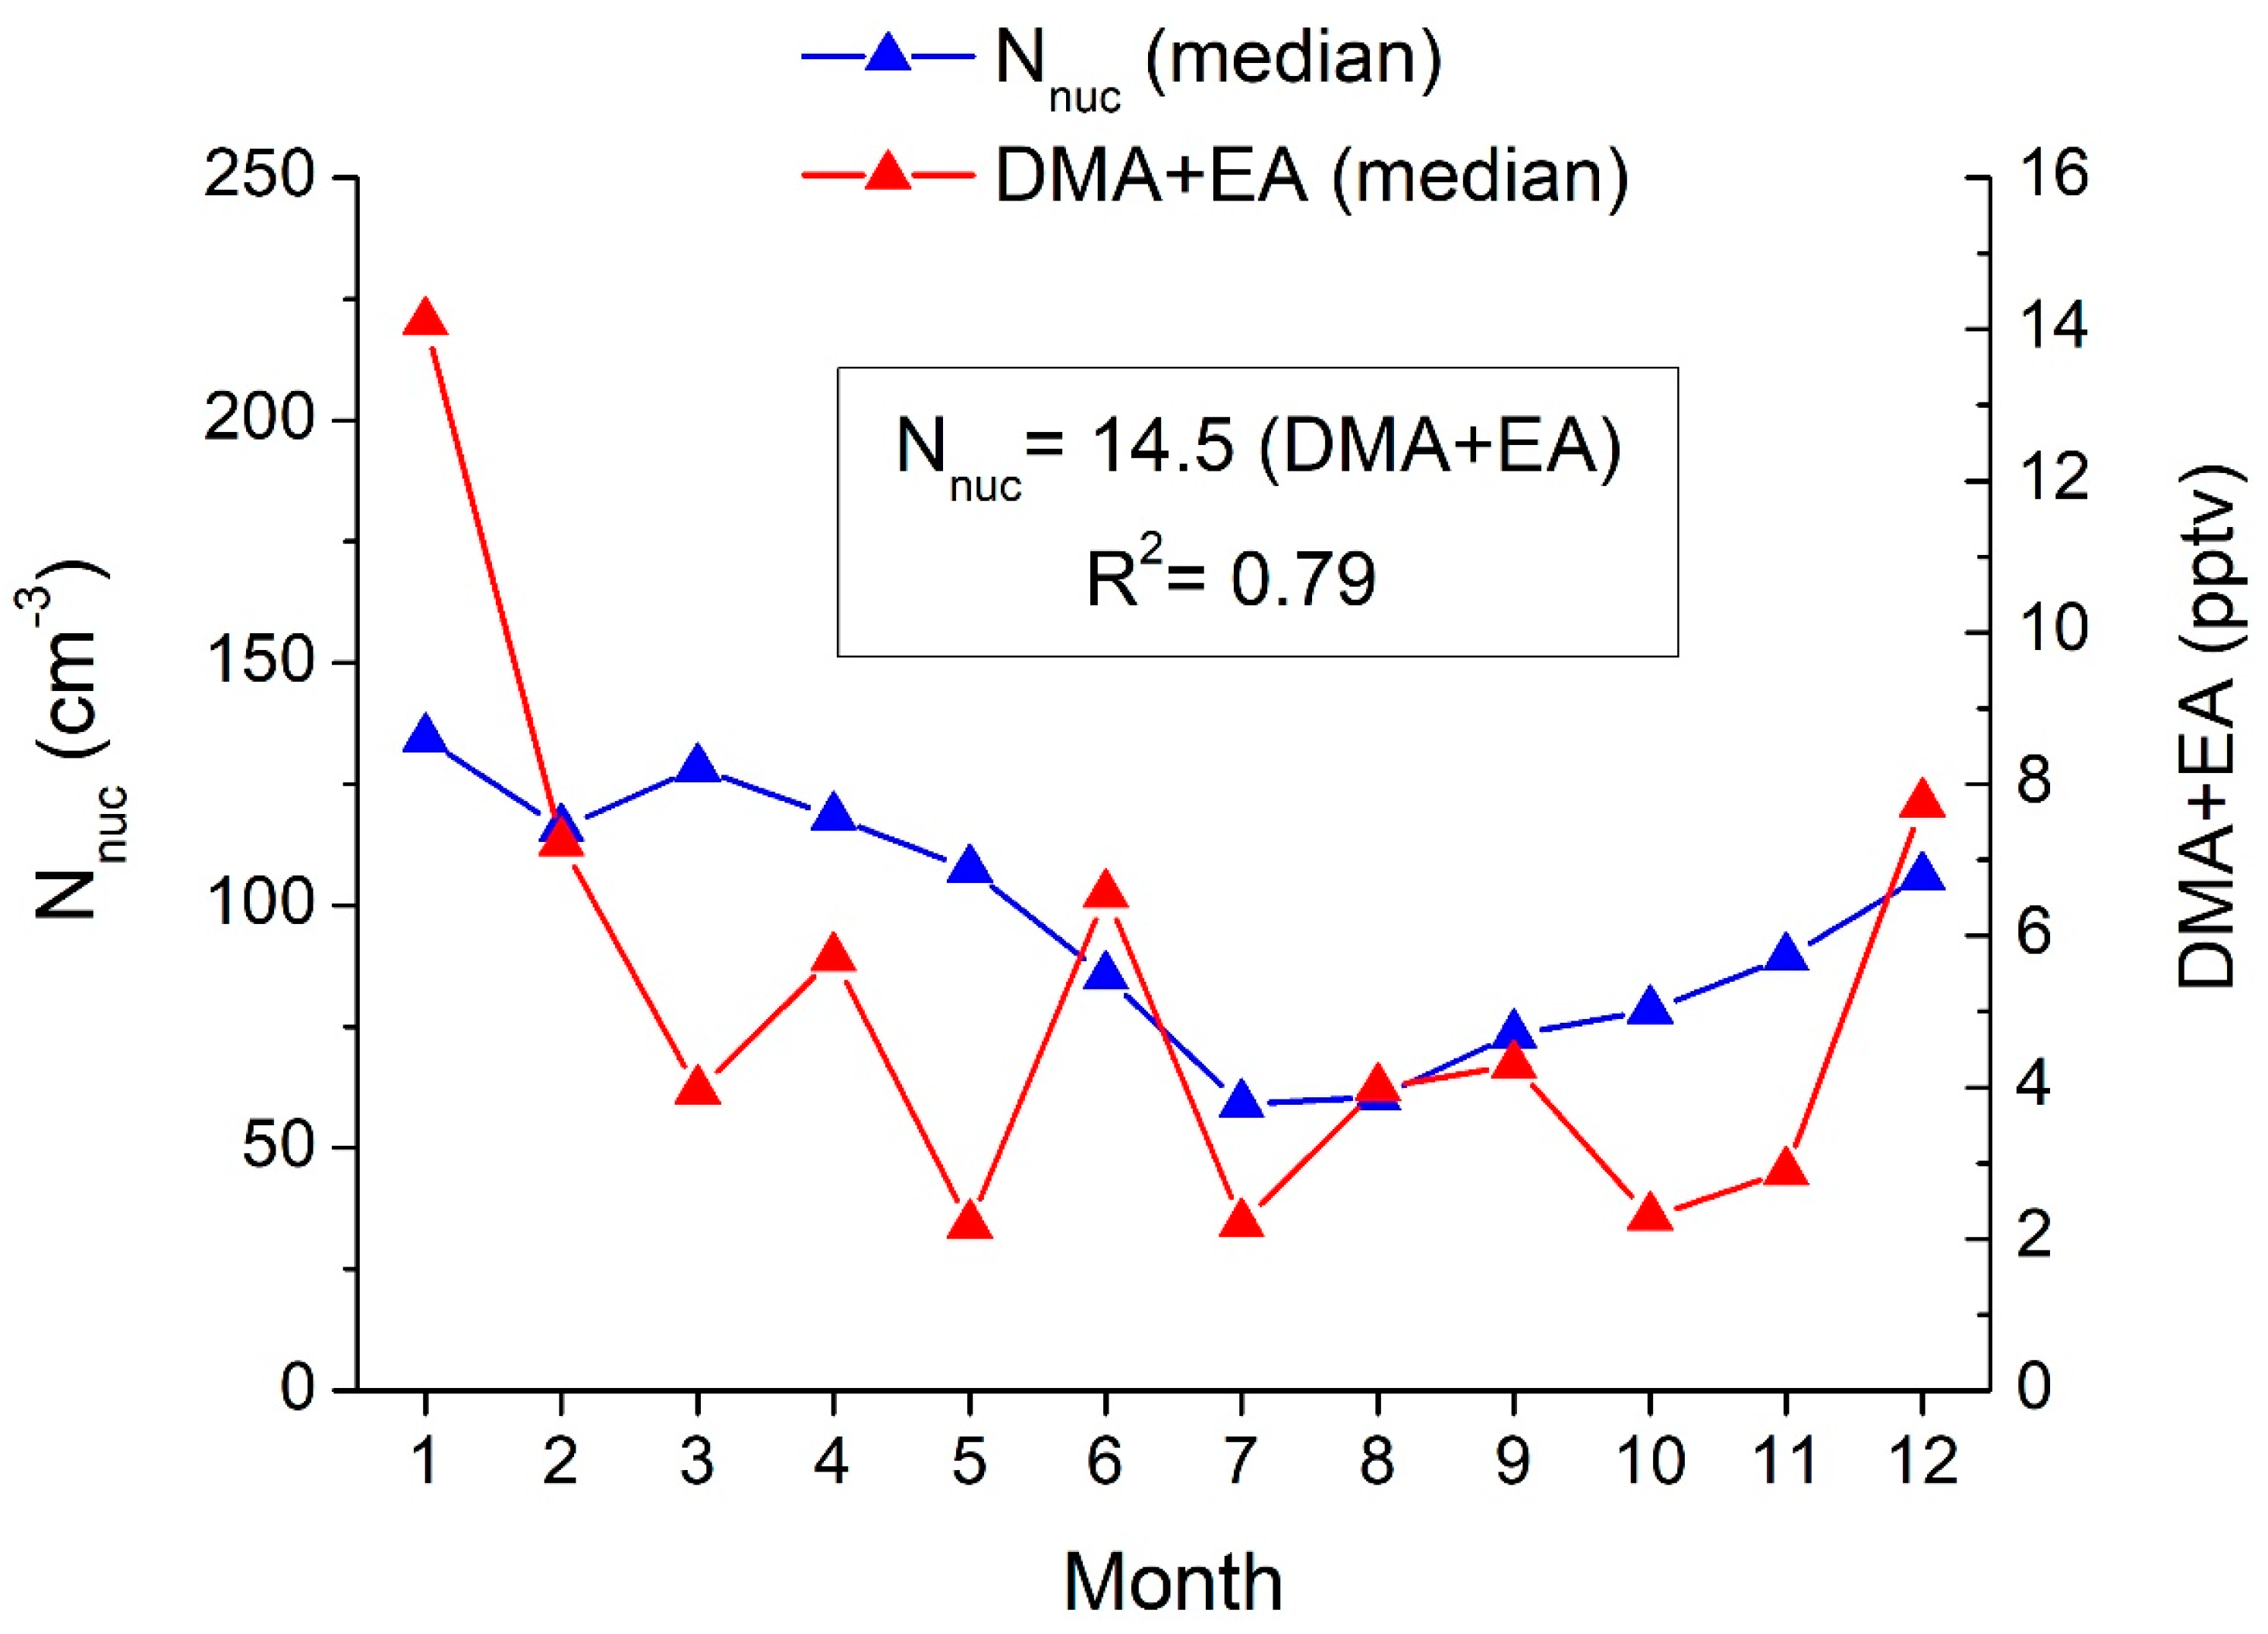
At Finokalia station, it was observed that nucleation mode particles’ number concentration presented different seasonal variability than NPF occurrence [43]. As no other major source of ultrafine particles can be found in the area, their main production mechanism is still NPF. To further investigate the correlation between NPF and alkylamines, the seasonal variation of the concentrations of nucleation mode particles, with diameters less than 25 nm (Figure 5), were compared with the amines’ concentrations. This comparison reveals that the presence of gaseous amines at Finokalia coincided with the presence of nucleation mode particles. The nucleation mode particle concentrations showed a maximum in winter, just like DMA+EA and TMA concentrations did. The fact that alkylamine concentrations have the same seasonal distribution as the nucleation mode suggests that amines may contribute to the production of nucleation mode particles, as Kalivitis et al. [43] have also observed in the area.
Field observations of amines and their relation to NPF are ambiguous. Kieloaho et al. [24] showed there was not a direct correlation between C2- and C4-amines and NPF in a Finish boreal forest; while at Hyytiälä, in the same forest, Sellegri et al. [29] reported concentrations of C3-amines that were higher during the NPF events than the non-event days. Conversely, an anti-correlation between NPF occurrence and amine concentrations was observed by Kürten et al. [35] and attributed to the efficient uptake of amines by nucleation clusters and small particles during NPF. Therefore, amines seem not to inhibit the NPF, but are involved in nucleation. Kürten et al. [35] could not clarify if amines are involved in the very first steps of nucleation or are depleted due to clusters that nucleate without the involvement of amines but grow with their contribution. Efficient uptake of amines in the particle-phase has also been reported in previous field study [30]. Moreover, Hemmilä et al. [38] showed that DMA correlated positively with small 1.1–2 nm aerosols when both soil and air were humid, but did not correlate with slightly larger aerosols with size range 2–3 nm, suggesting that DMA took part in the initial steps of NPF. Overall, the observed complexity in the relationship between atmospheric amines and NPF in the field requires further investigation combining observations with numerical modeling.
4. Conclusions
In the present study, unique long-term observations of alkylamines in the gas-phase at Finokalia station in the East Mediterranean over a period of 3.5 years from 2013 to 2016 are presented. A total of 124 samples of 72 h duration each have been analyzed by high-performance liquid chromatography triple quadrupole mass spectrometry and presented here.
DMA+EA and TMA were observed to be the most abundant alkylamines throughout the whole period. Amines showed pronounced seasonal variability, with DMA+EA and TMA concentrations higher in winter. The here measured DMA+EA concentrations were found to be 3.5 times smaller than those reported for a coastal site during summer [33], while TMA, DEA and TEA observations compared well with other coastal observations [13,33,52].
A factor analysis showed that different amines have different sources, except for DMA+ΕA and DEA, which have common sources. TMA is attributed to marine sources. TEA is grouped with NH3, therefore pointing to animal husbandry or soils in the area as the potential common source of NH3 and TEA. None of the observed alkylamines are correlated with anthropogenic sources. In addition to the interspecies correlation, a correlation with wind direction did not show any clear dependence of alkylamine concentrations with wind direction.
Finally, while no correlation was found between the seasonality of alkylamines and that of NPF events, a clear similarity was detected between the seasonality of nucleation mode particle number concentrations and alkylamines concentrations, indicating that amines may contribute to nucleation mode particles’ production. To further investigate this finding, chemical and thermodynamic modeling is needed that will link the observed concentrations of alkylamines with the nucleation model particles. Such investigation is the topic of an ongoing follow-up study.
Author Contributions
Conceptualization, Μ.Κ. and Ν.Κ.; methodology, Ε.Τ.; software, Ε.Τ.; validation, Ε.Τ. and Ν.Κ.; formal analysis, Ε.Τ.; writing—original draft preparation, E.T.; writing—review and editing, M.K. and N.K.; visualization, Ν.Κ.; supervision, Μ.Κ.; funding acquisition, N.K. and M.K. All authors have read and agreed to the published version of the manuscript.
Funding
This research is co-financed by Greece and the European Union (European Social Fund- ESF) through the Operational Programme “Human Resources Development, Education and Lifelong Learning 2014–2020” in the context of the project “Ammonia and amines effect on new particle formation in the eastern Mediterranean—ACTION” (MIS 5048424).
Institutional Review Board Statement
Not applicable.
Informed Consent Statement
Not applicable.
Data Availability Statement
The data are available from the corresponding authors upon request.
Acknowledgments
We thank S. Pergantis and A. Kouvarakis for their advice with the HPLC-TSQ analytical device; G. Kouvarakis for logistical support at Finokalia station; E. Barbopoulou, G. Panagiotopoulou and M. Thomaidi for assistance during sample extractions and analyses; and A-J. Kieloaho, H. Hellén and H. Hakola for training E.T. on the initial analytical method. We also thank the five reviewers for their comments that helped improve the presentation of the manuscript.
Conflicts of Interest
The authors declare no conflict of interest.
References
- Cornell, S.E.; Jickells, T.D.; Cape, J.N.; Rowland, A.P.; Duce, R.A. Organic Nitrogen Deposition on Land and Coastal Environments: A Review of Methods and Data. Atmos. Environ. 2003, 37, 2173–2191. [Google Scholar] [CrossRef]
- Cornell, S.E. Atmospheric Nitrogen Deposition: Revisiting the Question of the Importance of the Organic Component. Environ. Pollut. 2011, 159, 2214–2222. [Google Scholar] [CrossRef]
- Sorooshian, A.; Murphy, S.M.; Hersey, S.; Gates, H.; Padro, L.T.; Nenes, A.; Brechtel, F.J.; Jonsson, H.; Flagan, R.C.; Seinfeld, J.H. Comprehensive Airborne Characterization of Aerosol from a Major Bovine Source. Atmos. Chem. Phys. 2008, 8, 5489–5520. [Google Scholar] [CrossRef] [Green Version]
- Schade, G.W.; Crutzen, P.J. Emission of Aliphatic Amines from Animal Husbandry and Their Reactions: Potential Source of N2O and HCN. J. Atmos. Chem. 1995, 22, 319–346. [Google Scholar] [CrossRef]
- Lee, D.; Wexler, A.S. Atmospheric Amines—Part III: Photochemistry and Toxicity. Atmos. Environ. 2013, 71, 95–103. [Google Scholar] [CrossRef]
- NIOSH. Carcinogen List by National Institute for Occupational Safetyand Health (NIOSH). Available online: http://www.cdc.gov/niosh/topics/cancer/npotocca.html (accessed on 31 October 2021).
- Yu, F.; Luo, G. Modeling of Gaseous Methylamines in the Global Atmosphere: Impacts of Oxidation and Aerosol Uptake. Atmos. Chem. Phys. 2014, 14, 12455–12464. [Google Scholar] [CrossRef] [Green Version]
- Ge, X.; Wexler, A.S.; Clegg, S.L. Atmospheric Amines—Part II. Thermodynamic Properties and Gas/Particle Partitioning. Atmos. Environ. 2011, 45, 561–577. [Google Scholar] [CrossRef]
- Chu, Y.; Chan, C.K. Reactive Uptake of Dimethylamine by Ammonium Sulfate and Ammonium Sulfate-Sucrose Mixed Particles. J. Phys. Chem. A 2017, 121, 206–215. [Google Scholar] [CrossRef]
- Chu, Y.; Sauerwein, M.; Chan, C.K. Hygroscopic and Phase Transition Properties of Alkyl Aminium Sulfates at Low Relative Humidities. Phys. Chem. Chem. Phys. 2015, 17, 19789–19796. [Google Scholar] [CrossRef] [PubMed]
- Chan, L.P.; Chan, C.K. Role of the Aerosol Phase State in Ammonia/Amines Exchange Reactions. Environ. Sci. Technol. 2013, 47, 5755–5762. [Google Scholar] [CrossRef]
- Ge, X.; Wexler, A.S.; Clegg, S.L. Atmospheric Amines—Part I. A Review. Atmos. Environ. 2011, 45, 524–546. [Google Scholar] [CrossRef]
- Van Neste, A.; Duce, R.A.; Lee, C. Methylamines in the Marine Atmosphere. Geophys. Res. Lett. 1987, 14, 711–714. [Google Scholar] [CrossRef]
- Erupe, M.E.; Viggiano, A.A.; Lee, S.-H. The Effect of Trimethylamine on Atmospheric Nucleation Involving H2SO4. Atmos. Chem. Phys. 2011, 11, 4767–4775. [Google Scholar] [CrossRef] [Green Version]
- Kulmala, M.; Petäjä, T.; Mönkkönen, P.; Koponen, I.K.; Dal Maso, M.; Aalto, P.P.; Lehtinen, K.E.J.; Kerminen, V.-M. On the Growth of Nucleation Mode Particles: Source Rates of Condensable Vapor in Polluted and Clean Environments. Atmos. Chem. Phys. 2005, 5, 409–416. [Google Scholar] [CrossRef] [Green Version]
- Kulmala, M.; Kontkanen, J.; Junninen, H.; Lehtipalo, K.; Manninen, H.E.; Nieminen, T.; Petäjä, T.; Sipilä, M.; Schobesberger, S.; Rantala, P.; et al. Direct Observations of Atmospheric Aerosol Nucleation. Science 2013, 339, 943–946. [Google Scholar] [CrossRef] [PubMed]
- Yu, H.; McGraw, R.; Lee, S.-H. Effects of Amines on Formation of Sub-3 Nm Particles and Their Subsequent Growth. Geophys. Res. Lett. 2012, 39. [Google Scholar] [CrossRef] [Green Version]
- Zhang, R. Getting to the Critical Nucleus of Aerosol Formation. Science 2010, 328, 1366–1367. [Google Scholar] [CrossRef] [PubMed] [Green Version]
- Zhang, R.; Khalizov, A.; Wang, L.; Hu, M.; Xu, W. Nucleation and Growth of Nanoparticles in the Atmosphere. Chem. Rev. 2012, 112, 1957–2011. [Google Scholar] [CrossRef] [PubMed]
- Kurtén, T.; Loukonen, V.; Vehkamäki, H.; Kulmala, M. Amines Are Likely to Enhance Neutral and Ion-Induced Sulfuric Acid-Water Nucleation in the Atmosphere More Effectively than Ammonia. Atmos. Chem. Phys. 2008, 8, 4095–4103. [Google Scholar] [CrossRef] [Green Version]
- Kürten, A.; Li, C.; Bianchi, F.; Curtius, J.; Dias, A.; Donahue, N.M.; Duplissy, J.; Flagan, R.C.; Hakala, J.; Jokinen, T.; et al. New Particle Formation in the Sulfuric Acid-Dimethylamine-Water System: Reevaluation of CLOUD Chamber Measurements and Comparison to an Aerosol Nucleation and Growth Model. Atmos. Chem. Phys. 2018, 18, 845–863. [Google Scholar] [CrossRef] [Green Version]
- Almeida, J.; Schobesberger, S.; Kürten, A.; Ortega, I.K.; Kupiainen-Määttä, O.; Praplan, A.P.; Adamov, A.; Amorim, A.; Bianchi, F.; Breitenlechner, M.; et al. Molecular Understanding of Sulphuric Acid–Amine Particle Nucleation in the Atmosphere. Nature 2013, 502, 359–363. [Google Scholar] [CrossRef] [Green Version]
- Parshintsev, J.; Rönkkö, T.; Helin, A.; Hartonen, K.; Riekkola, M.-L. Determination of Atmospheric Amines by On-Fiber Derivatization Solid-Phase Microextraction with 2,3,4,5,6-Pentafluorobenzyl Chloroformate and 9-Fluorenylmethoxycarbonyl Chloride. J. Chromatogr. A 2015, 1376, 46–52. [Google Scholar] [CrossRef] [PubMed]
- Kieloaho, A.-J.; Hellén, H.; Hakola, H.; Manninen, H.E.; Nieminen, T.; Kulmala, M.; Pihlatie, M. Gas-Phase Alkylamines in a Boreal Scots Pine Forest Air. Atmos. Environ. 2013, 80, 369–377. [Google Scholar] [CrossRef]
- Hellén, H.; Kieloaho, A.-J.; Hakola, H. Gas-Phase Alkyl Amines in Urban Air; Comparison with a Boreal Forest Site and Importance for Local Atmospheric Chemistry. Atmos. Environ. 2014, 94, 192–197. [Google Scholar] [CrossRef]
- Dawson, M.L.; Perraud, V.; Gomez, A.; Arquero, K.D.; Ezell, M.J.; Finlayson-Pitts, B.J. Measurement of Gas-Phase Ammonia and Amines in Air by Collection onto an Ion Exchange Resin and Analysis by Ion Chromatography. Atmos. Meas. Tech. 2014, 7, 2733–2744. [Google Scholar] [CrossRef] [Green Version]
- Akyüz, M. Simultaneous Determination of Aliphatic and Aromatic Amines in Indoor and Outdoor Air Samples by Gas Chromatography—Mass Spectrometry. Talanta 2007, 71, 486–492. [Google Scholar] [CrossRef] [PubMed]
- Akyüz, M. Simultaneous Determination of Aliphatic and Aromatic Amines in Ambient Air and Airborne Particulate Matters by Gas Chromatography-Mass Spectrometry. Atmos. Environ. 2008, 42, 3809. [Google Scholar] [CrossRef]
- Sellegri, K.; Hanke, M.; Umann, B.; Arnold, F.; Kulmala, M. Measurements of Organic Gases during Aerosol Formation Events in the Boreal Forest Atmosphere during QUEST. Atmos. Chem. Phys. 2005, 5, 373–384. [Google Scholar] [CrossRef] [Green Version]
- You, Y.; Kanawade, V.P.; de Gouw, J.A.; Guenther, A.B.; Madronich, S.; Sierra-Hernández, M.R.; Lawler, M.; Smith, J.N.; Takahama, S.; Ruggeri, G.; et al. Atmospheric Amines and Ammonia Measured with a Chemical Ionization Mass Spectrometer (CIMS). Atmos. Chem. Phys. 2014, 14, 12181–12194. [Google Scholar] [CrossRef] [Green Version]
- Yu, H.; Lee, S.-H. Chemical Ionisation Mass Spectrometry for the Measurement of Atmospheric Amines. Environ. Chem. 2012, 9, 190–201. [Google Scholar] [CrossRef] [Green Version]
- Hanson, D.R.; McMurry, P.H.; Jiang, J.; Tanner, D.; Huey, L.G. Ambient Pressure Proton Transfer Mass Spectrometry: Detection of Amines and Ammonia. Environ. Sci. Technol. 2011, 45, 8881–8888. [Google Scholar] [CrossRef]
- Freshour, N.A.; Carlson, K.K.; Melka, Y.A.; Hinz, S.; Panta, B.; Hanson, D.R. Amine Permeation Sources Characterized with Acid Neutralization and Sensitivities of an Amine Mass Spectrometer. Atmos. Meas. Tech. 2014, 7, 3611–3621. [Google Scholar] [CrossRef] [Green Version]
- Sipilä, M.; Sarnela, N.; Jokinen, T.; Junninen, H.; Hakala, J.; Rissanen, M.P.; Praplan, A.; Simon, M.; Kürten, A.; Bianchi, F.; et al. Bisulfate – Cluster Based Atmospheric Pressure Chemical Ionization Mass Spectrometer for High-Sensitivity (< 100 PpqV) Detection of Atmospheric Dimethyl Amine: Proof-of-Concept and First Ambient Data from Boreal Forest. Atmos. Meas. Tech. 2015, 8, 4001–4011. [Google Scholar] [CrossRef] [Green Version]
- Kürten, A.; Bergen, A.; Heinritzi, M.; Leiminger, M.; Lorenz, V.; Piel, F.; Simon, M.; Sitals, R.; Wagner, A.C.; Curtius, J. Observation of New Particle Formation and Measurement of Sulfuric Acid, Ammonia, Amines and Highly Oxidized Organic Molecules at a Rural Site in Central Germany. Atmos. Chem. Phys. 2016, 16, 12793–12813. [Google Scholar] [CrossRef] [Green Version]
- Zheng, J.; Ma, Y.; Chen, M.; Zhang, Q.; Wang, L.; Khalizov, A.F.; Yao, L.; Wang, Z.; Wang, X.; Chen, L. Measurement of Atmospheric Amines and Ammonia Using the High Resolution Time-of-Flight Chemical Ionization Mass Spectrometry. Atmos. Environ. 2015, 102, 249–259. [Google Scholar] [CrossRef]
- Yao, L.; Wang, M.-Y.; Wang, X.-K.; Liu, Y.-J.; Chen, H.-F.; Zheng, J.; Nie, W.; Ding, A.-J.; Geng, F.-H.; Wang, D.-F.; et al. Detection of Atmospheric Gaseous Amines and Amides by a High-Resolution Time-of-Flight Chemical Ionization Mass Spectrometer with Protonated Ethanol Reagent Ions. Atmos. Chem. Phys. 2016, 16, 14527–14543. [Google Scholar] [CrossRef] [Green Version]
- Hemmilä, M.; Hellén, H.; Virkkula, A.; Makkonen, U.; Praplan, A.P.; Kontkanen, J.; Ahonen, L.; Kulmala, M.; Hakola, H. Amines in Boreal Forest Air at SMEAR II Station in Finland. Atmos. Chem. Phys. 2018, 18, 6367–6380. [Google Scholar] [CrossRef] [Green Version]
- VandenBoer, T.C.; Petroff, A.; Markovic, M.Z.; Murphy, J.G. Size Distribution of Alkyl Amines in Continental Particulate Matter and Their Online Detection in the Gas and Particle Phase. Atmos. Chem. Phys. 2011, 11, 4319–4332. [Google Scholar] [CrossRef] [Green Version]
- VandenBoer, T.C.; Markovic, M.Z.; Petroff, A.; Czar, M.F.; Borduas, N.; Murphy, J.G. Ion Chromatographic Separation and Quantitation of Alkyl Methylamines and Ethylamines in Atmospheric Gas and Particulate Matter Using Preconcentration and Suppressed Conductivity Detection. J. Chromatogr. A 2012, 1252, 74–83. [Google Scholar] [CrossRef]
- Tzitzikalaki, E.; Kalivitis, N.; Panagiotopoulou, G.; Kanakidou, M. Observations of Alkylamines in the East Mediterranean Atmosphere. In Proceedings of the 15th International Conference on Meteorology, Climatology and Atmospheric Physics COMECAP 2021, Ioannina, Greece, 26–29 September 2021; Bartzokas, A., Nastos, P., Eds.; Hellenic Meteorological Society: Ioannina, Greece, 2021; pp. 185–189. [Google Scholar]
- Mihalopoulos, N.; Stephanou, E.; Kanakidou, M.; Pilitsidis, S.; Bousquet, P. Tropospheric Aerosol Ionic Composition in the Eastern Mediterranean Region. Tellus Ser. B Chem. Phys. Meteorol. 1997, 49B, 314–326. [Google Scholar] [CrossRef]
- Kalivitis, N.; Kerminen, V.-M.; Kouvarakis, G.; Stavroulas, I.; Tzitzikalaki, E.; Kalkavouras, P.; Daskalakis, N.; Myriokefalitakis, S.; Bougiatioti, A.; Manninen, H.E.; et al. Formation and Growth of Atmospheric Nanoparticles in the Eastern Mediterranean: Results from Long-Term Measurements and Process Simulations. Atmos. Chem. Phys. 2019, 19, 2671–2686. [Google Scholar] [CrossRef] [Green Version]
- Lelieveld, J.; Berresheim, H.; Borrmann, S.; Crutzen, P.J.; Dentener, F.J.; Fischer, H.; Feichter, J.; Flatau, P.J.; Heland, J.; Holzinger, R.; et al. Global Air Pollution Crossroads over the Mediterranean. Science 2002, 298, 794–799. [Google Scholar] [CrossRef] [Green Version]
- Rampfl, M.; Mair, S.; Mayer, F.; Sedlbauer, K.; Breuer, K.; Niessner, R. Determination of Primary, Secondary, and Tertiary Amines in Air by Direct or Diffusion Sampling Followed by Determination with Liquid Chromatography and Tandem Mass Spectrometry. Environ. Sci. Technol. 2008, 42, 5217–5222. [Google Scholar] [CrossRef] [PubMed]
- Chan, L.P.; Chan, C.K. Displacement of Ammonium from Aerosol Particles by Uptake of Triethylamine. Aerosol Sci. Technol. 2012, 46, 236–247. [Google Scholar] [CrossRef] [Green Version]
- Lloyd, J.A.; Heaton, K.J.; Johnston, M.V. Reactive Uptake of Trimethylamine into Ammonium Nitrate Particles. J. Phys. Chem. A 2009, 113, 4840–4843. [Google Scholar] [CrossRef] [PubMed]
- Paraskevopoulou, D.; Liakakou, E.; Gerasopoulos, E.; Mihalopoulos, N. Sources of Atmospheric Aerosol from Long-Term Measurements (5 years) of Chemical Composition in Athens, Greece. Sci. Total Environ. 2015, 527–528, 165–178. [Google Scholar] [CrossRef] [PubMed]
- Dal Maso, M.; Kulmala, M.; Riipinen, I.; Wagner, R. Formation and Growth of Fresh Atmospheric Aerosols: Eight Years of Aerosol Size Distribution Data from SMEAR II, Hyytiälä, Finland. Boreal Environ. Res. 2005, 10, 323–336. [Google Scholar]
- Sciare, J.; d’Argouges, O.; Sarda-Estève, R.; Gaimoz, C.; Dolgorouky, C.; Bonnaire, N.; Favez, O.; Bonsang, B.; Gros, V. Large Contribution of Water-Insoluble Secondary Organic Aerosols in the Region of Paris (France) during Wintertime. J. Geophys. Res. Atmos. 2011, 116, D22203. [Google Scholar] [CrossRef] [Green Version]
- Sintermann, J.; Neftel, A. Ideas and Perspectives: On the Emission of Amines from Terrestrial Vegetation in the Context of New Atmospheric Particle Formation. Biogeosciences 2015, 12, 3225–3240. [Google Scholar] [CrossRef] [Green Version]
- Chen, D.; Shen, Y.; Wang, J.; Gao, Y.; Gao, H.; Yao, X. Mapping Gaseous Amines, Ammonia, and Their Particulate Counterparts in Marine Atmospheres of China’s Marginal Seas: Part 1—Differentiating Marine Emission from Continental Transport. Atmos. Chem. Phys. Discuss. 2021, 2021, 1–26. [Google Scholar] [CrossRef]
- Li, M.; Weschler, C.J.; Bekö, G.; Wargocki, P.; Lucic, G.; Williams, J. Human Ammonia Emission Rates under Various Indoor Environmental Conditions. In Proceedings of the 16th Conference of the International Society of Indoor Air Quality & Climate (Indoor Air 2020), Online, 1–4 November 2020. [Google Scholar]
- Pluschke, P.; Schleibinger, H. Indoor Air Pollution, The Handbook of Environmental Chemistry 64, 2nd ed.; Springer: Berlin/Heidelberg, Germany, 2018. [Google Scholar] [CrossRef]
- Hertel, O.; Skjøth, C.; Reis, S.; Bleeker, A.; Harrison, R.; Cape, J.N.; Fowler, D.; Skiba, U.; Simpson, D.; Jickells, T.; et al. Governing Processes for Reactive Nitrogen Compounds in the European Atmosphere. Biogeosciences 2012, 9, 4921–4954. [Google Scholar] [CrossRef] [Green Version]
- Draxler, R.; Hess, G. An Overview of the HYSPLIT_4 Modeling System for Trajectories, Dispersion, and Deposition. Aust. Meteorol. Mag. 1998, 47, 295–308. [Google Scholar]
Figure 1.
Average concentrations of DMA+ΕA, ΤΜA, DEA and TEA measured in different environments as they are reported in Table 2 (box plots with solid lines) and measured at Finokalia (box plots with dashed lines). Whiskers represent the 5th and 95th percentiles, box edges are 25th and 75th percentiles, the line in the box is the median, the open square is the mean of the reported values, concentration in pptv.

Figure 2.
Seasonal average variation in concentrations (in pptv) of (a) DMA+EA, (b) TMA, (c) DEA, and (d) TEA at Finokalia station over the period 2013–2016. Whiskers represent 5th and 95th percentiles, box edges are 25th and 75th percentiles, the line in the box is the median, and the open square is the mean.

Figure 3.
Trajectory analysis for DMA+ΕA, ΤΜA, DΕA and TEA measured on filters collected in air masses with constant origin for all three days of sampling. Y axis shows the number of samples, amine concentrations are in pptv.
Figure 3.
Trajectory analysis for DMA+ΕA, ΤΜA, DΕA and TEA measured on filters collected in air masses with constant origin for all three days of sampling. Y axis shows the number of samples, amine concentrations are in pptv.

Figure 4.
Seasonal average variation of NPF in percentage of occurrence at Finokalia station over the period 2013–2016. Whiskers represent the 5th and 95th percentiles, box edges are 25th and 75th percentiles, the line in the box is the median, and the solid square is the mean.
Figure 4.
Seasonal average variation of NPF in percentage of occurrence at Finokalia station over the period 2013–2016. Whiskers represent the 5th and 95th percentiles, box edges are 25th and 75th percentiles, the line in the box is the median, and the solid square is the mean.

Figure 5.
Monthly median variation of nucleation mode particle number concentration and DMA+EA amine concentration at Finokalia during the studied period.
Figure 5.
Monthly median variation of nucleation mode particle number concentration and DMA+EA amine concentration at Finokalia during the studied period.


Table 1.
Total number of 72 h samples, number of samples with amine concentrations above LOD, average alkylamine concentration (in pptv), LOD and maximum measured concentration for each alkylamine.
Table 1.
Total number of 72 h samples, number of samples with amine concentrations above LOD, average alkylamine concentration (in pptv), LOD and maximum measured concentration for each alkylamine.
| DMA+EA | TMA | DEA | TEA | |
|---|---|---|---|---|
| Number of samples | 124 | 124 | 124 | 124 |
| Number of samples above LOD | 80 | 84 | 54 | 13 |
| Average (pptv) | 7.8 ± 12.0 | 7.5 ± 12.4 | 1.1 ± 3.5 | 0.6 ± 0.4 |
| LOD (pptv) | 1.7 | 0.8 | 0.2 | 0.5 |
| Maximum value (pptv) | 78.0 | 69.5 | 37.5 | 3.1 |
Table 2.
Comparison of this work with gaseous amines measured in different environments means (with standard deviation when available) or range (minimum to maximum) of concentrations (in pptv). Column M provides information on the analytical method.
Table 2.
Comparison of this work with gaseous amines measured in different environments means (with standard deviation when available) or range (minimum to maximum) of concentrations (in pptv). Column M provides information on the analytical method.
| Author | Place | Type | Period | M | DMA+EA | TMA | DEA | TEA |
|---|---|---|---|---|---|---|---|---|
| Akyüz et al. [27] | Zonguldak, Turkey | Urban | May–Sep. 2004–2005 | M1 | 2.18 a,b | 0.83 a | ||
| Akyüz et al. [27] | Zonguldak, Turkey | Urban | Oct.–Apr. 2005–2006 | M1 | 2.96 a,b | 0.62 a | ||
| Akyüz et al. [28] | Zonguldak, Turkey | Urban | May–Sep. 2006–2007 | M1 | 1.77 ± 0.99 a,b | 1.62 ± 0.77 a | ||
| Akyüz et al. [28] | Zonguldak, Turkey | Urban | Oct.–Apr. 2006–2007 | M1 | 3.37 ± 2.01 a,b | 2.88 ± 1.63 a | ||
| Freshour et al. [33] | DE, USA | Coastal | July–Aug. 2012 | M2 | 28 | 6 c | 3 | 2 |
| Freshour et al. [33] | OK, USA | Continental | Apr.–May 2013 | M2 | 14 | 35 c | 150 | 20 |
| Hanson et al. [32] | GA, USA | Urban | July–Aug. 2009 | M2 | 0.5–2 | 4–15 c | ~4 | 3–25 |
| Hellén et al. [25] | Helsinki, Finland | Urban | May–Aug. 2011 | M3 | 23.6 | 8.4 c | 0.3 | 0.1 |
| Hemmilä et al. [38] | Hyytiälä, Finland | Boreal forest | Mar.–Dec. 2015 d | M4 | <LOD-8.2 b | <LOD-6.1 | ||
| Kieloaho et al. [24] | Hyytiälä, Finland | Boreal forest | May–Oct. 2011 | M3 | 42 ± 30 | 21 ± 23 c | 6.5 ± 5.6 | <3.2 |
| Kürten et al. [35] | Viebrunn, Germany | Agricultural | May–June 2014 | M5 | ~1 | 1–5 c | 1–5 | 1–5 |
| Sellegri et al. [29] | Hyytiälä, Finland | Boreal forest | March 2002 | M6 | <LOD | 34–80 | ||
| Sipilä et al. [34] | Hyytiälä, Finland | Boreal forest | May–June 2013 | M5 | <0.15 b | |||
| VandenBoer et al. [40] | Toronto, Canada | Urban | June–July 2009 | M7 | <2.7 | <2.7 e | <1.0 | |
| VandenBoer et al. [39] | Egbert, Canada | Rural (agricultural) | Oct. 2010 | M7 | 6.5 ± 2.1 | ~1 e | ||
| Van Neste et al. [13] | Oahu, Hawaii | Coastal | July–Aug. 1985 | M8 | <0.3 | 0.8 ± 0.4 | ||
| Yao et al. [37] | Shangai, China | Urban | July–Aug. 2015 | M9 | 40 ± 14.3 | 1.1 ± 0.6 c | 15.4 ± 7.9 | 3.5 ± 2.2 |
| You et al. [30] | AL, USA | Rural forest | June–July 2013 | M6 | <4.8 | 1–10 c | <23.1 | <13.0 |
| You et al. [30] | OH, USA | Μoderated polluted | June–July 2013 | M6 | <4.8 | 5–10 | 10–50 | <13.0 |
| Yu and Lee [31] | OH, USA | Suburban | Nov. 2011 | M6 | 8 ± 3 | 16 ± 7 c | <41 | <8 |
| Zheng et al. [36] | Nanjing, China | Industrialized | Aug.–Sep. 2012 | M9 | 0.1–29.9 | 0.1–9.3 c | ||
| This study | Finokalia, Crete | Coastal | 2013–2016 | M3 | 7.8 ± 12.0 LOD-78.0 | 7.5 ± 12.4 LOD-69.5 | 1.1 ± 3.5 LOD-37.5 | 0.6 ± 0.4 LOD-3.1 |
a Units in ng m−3, b only DMA, c Mass 60, i.e., TMA + PA, d one week per month, e TMA + DEA. M1: Gas chromatography coupled with mass spectrometry (GC-MS); M2: Ambient pressure proton transfer mass spectrometry (AmPMS); M3: High-performance liquid chromatography coupled with mass spectrometry (HPLC-MS); M4: Ion chromatography instrument for measuring aerosols and gases in ambient air, coupled with mass spectrometer (MARGA-MS); M5: Chemical ionization atmospheric pressure interface time-of-flight mass spectrometry (CI-APi-TOF); M6: Chemical ionization mass spectrometry (CIMS); M7: Ambient ion monitor ion chromatograph (AIM-IC); M8: Gas chromatography coupled with chemiluminescent detector; M9: High-resolution time-of-flight chemical ionization mass spectrometry (HR-ToF-CIMS).
Table 3.
Varimax-rotated factor matrix (correlations between variables and factors) and corresponding probable source type for alkylamines.
Table 3.
Varimax-rotated factor matrix (correlations between variables and factors) and corresponding probable source type for alkylamines.
| Factor 1 | Factor 2 | Factor 3 | Factor 4 | Factor 5 | |
|---|---|---|---|---|---|
| DMA+EA | −0.780 | ||||
| TMA | −0.694 | ||||
| DEA | −0.823 | ||||
| TEA | −0.732 | ||||
| Na+ | −0.883 | ||||
| NH4+ | −0.729 | ||||
| Mg++ | −0.965 | ||||
| Cl− | −0.929 | ||||
| NO3− | |||||
| SO42− | −0.904 | ||||
| NH3 | −0.795 | ||||
| Black Carbon fossil fuel | −0.812 | ||||
| Black Carbon wood burning | 0.972 | ||||
| Variance explained | 26.3 | 16.7 | 13.2 | 11.4 | 8.1 |
Table 4.
Amine reactions with OH; concentration of 1 × 10⁶ (molecules/cm3) is assumed in the calculation of species lifetimes. Reaction rates and lifetimes from [5].
Table 4.
Amine reactions with OH; concentration of 1 × 10⁶ (molecules/cm3) is assumed in the calculation of species lifetimes. Reaction rates and lifetimes from [5].
| DMA | EA | TMA | DEA | TEA | |
|---|---|---|---|---|---|
| Temperature (K) | 295–298 | 295–298 | 295–298 | 298 | 298 |
| Reaction Rate (cm3/molecules/s) | (6.49–7.10) ×10−11 | (2.38–2.77) ×10−11 | (3.58–6.09) ×10−11 | (7.40–11.9) ×10−11 | 7.70 ×10⁻¹¹ |
| Lifetime (h) | 4.3 | 10–11.7 | 4.6–7 | 2.3–3.4 | 3.0 |
Table 5.
Amine concentrations (average and standard deviation in parentheses) for each air mass sector; n is the number of samples per sector. Mixed air mass origin corresponds to air masses having variable origin during the 36 h of sampling.
Table 5.
Amine concentrations (average and standard deviation in parentheses) for each air mass sector; n is the number of samples per sector. Mixed air mass origin corresponds to air masses having variable origin during the 36 h of sampling.
| Air Mass Origin | n | DMA+EA | TMA | DEA | TEA |
|---|---|---|---|---|---|
| Mixed | 25 | 4.2 (2.9) | 5.7 (7.4) | 0.8 (1.3) | 0.6 (0.3) |
| N | 33 | 11.2 (17.3) | 8.7 (14.5) | 0.8 (1.1) | 0.6 (0.3) |
| NE | 34 | 7.0 (11.9) | 7.3 (13.2) | 1.6 (6.4) | 0.6 (0.1) |
| NW | 12 | 10.0 (11.8) | 11.3 (18.0) | 1.3 (2.0) | 0.9 (0.8) |
| SW | 10 | 7.9 (9.2) | 5.7 (9.2) | 0.9 (1.1) | 0.8 (0.7) |
| W | 9 | 5.6 (6.5) | 5.6 (6.5) | 1.1 (1.8) | 0.5 (0.0) |
| E | 1 | 3.8 | 4.4 | 0.2 | 0.5 |
Publisher’s Note: MDPI stays neutral with regard to jurisdictional claims in published maps and institutional affiliations. |
© 2021 by the authors. Licensee MDPI, Basel, Switzerland. This article is an open access article distributed under the terms and conditions of the Creative Commons Attribution (CC BY) license (https://creativecommons.org/licenses/by/4.0/).
Share and Cite
MDPI and ACS Style
Tzitzikalaki, E.; Kalivitis, N.; Kanakidou, M. Observations of Gas-Phase Alkylamines at a Coastal Site in the East Mediterranean Atmosphere. Atmosphere 2021, 12, 1454. https://doi.org/10.3390/atmos12111454
AMA Style
Tzitzikalaki E, Kalivitis N, Kanakidou M. Observations of Gas-Phase Alkylamines at a Coastal Site in the East Mediterranean Atmosphere. Atmosphere. 2021; 12(11):1454. https://doi.org/10.3390/atmos12111454
Chicago/Turabian StyleTzitzikalaki, Evangelia, Nikos Kalivitis, and Maria Kanakidou. 2021. "Observations of Gas-Phase Alkylamines at a Coastal Site in the East Mediterranean Atmosphere" Atmosphere 12, no. 11: 1454. https://doi.org/10.3390/atmos12111454
Note that from the first issue of 2016, this journal uses article numbers instead of page numbers. See further details here.