Article

Infrasound Thunder Detections across 15 Years over Ivory Coast: Localization, Propagation, and Link with the Stratospheric Semi-Annual Oscillation

1
CEA (Commissariat à l’Energie Atomique et aux Energies Alternatives), DAM (Direction des Applications Militaires), DIF (DAM-Ile-de-France), F-91297 Arpajon, France
2
BGR (Federal Institute for Geosciences and Natural Resources), D-30655 Hannover, Germany
3
Laboratoire des Sciences de la Matière, de l’Environnement et de l’Energie Solaire (LASMES), Unité de Formation et de Recherche (UFR) Sciences de Structures de la Matière et Technologie (SSMT), University Felix Houphouët-Boigny (FHB), 01 BP V 34, 01 Abidjan, Côte d’Ivoire
4
Station Géophysique de Lamto, BP 31 N’Douci, Côte d’Ivoire
*
Author to whom correspondence should be addressed.
Atmosphere 2021, 12(9), 1188; https://doi.org/10.3390/atmos12091188
Submission received: 3 August 2021 / Revised: 3 September 2021 / Accepted: 9 September 2021 / Published: 14 September 2021
(This article belongs to the Special Issue Atmospheric Electricity)

Abstract

:
Every day, about one thousand thunderstorms occur around the world, producing about 45 lightning flashes per second. One prominent infrasound station of the International Monitoring System infrasound network of the Comprehensive Nuclear-Test-Ban Treaty Organization for studying lightning activity is in Ivory Coast, where the lightning rate of this region is relatively high. Infrasound defines acoustic waves with frequencies below 20 Hz, the lower limit of human hearing. Statistical results are presented in this paper based on infrasound measurements from 2004 to 2019. One-to-one association between infrasound detections from 0.5 to 5 Hz and lightning flashes detected by the World Wide Lightning Location Network within 500 km from the infrasound station is systematically investigated. Most of the infrasound signals detected at IS17 in this frequency band are due to thunder, even if the thunderstorms are located up to 500 km away from the station. A decay of the thunder amplitude with the flash distance, d, is found to scale as d−0.717 for flashes within 100 km from the station, which holds for direct propagation. Interestingly, the stratospheric detections reflect a pattern in the annual azimuth variation, which is consistent with the equatorial stratospheric semi-annual oscillation.

1. Introduction

Do elephants hear the thunder from far away well enough to make their way to recently watered regions? This possibility has been evaluated, taking into account the low-frequency hearing capacity of these pachyderms and the infrasonic thunder propagation range, by several authors (e.g., [1]). Infrasonic waves, or infrasound, are acoustic waves with frequencies lower than 20 Hz, which is approximately the lower limit of human hearing. Elephants, however, are capable of hearing sounds with frequencies of 10 Hz and possibly lower.
From a historical point of view, thunderstorm activity over different geographical regions was evaluated through an empiric index named the “keraunic level”. The site specific keraunic level is defined as the number of days in a year during which thunder has been heard at least once per day. The first estimations of global lightning activity were based on thunder hearing by humans [2]. Studies about thunder, since the 1960s, have been dedicated to the theoretical interpretation of thunder generation (whether in the audible or infrasonic domain) and to the possibility of reconstructing the acoustic sources of thunder in three dimensions. Lacroix et al. [3] have pointed out that arrays having an aperture in the kilometer range prevent precise 3D reconstruction; furthermore, Farges et al. [4] showed that beyond 20 km it is not possible to reconstruct in 3D the lightning channels.
Thunder lasts a few tens of seconds and is composed of several pulses with maximum pressure variations of a few tens of Pascals when it is recorded a few kilometers away from the flash. The spectral content of thunder ranges from about 1 Hz to several hundred Hertz with a maximum below 100 Hz [5,6,7].
Concerning the thunder generation, two mechanisms are suggested to explain the measured waveforms and their frequency content. The ‘rapidly heated channel’ mechanism was mainly described and developed by Ribner and Roy [8] as well as by Few [9,10], following previous studies dealing with shock-wave theory. This mechanism mainly explains the audible part of the thunder but fails to reproduce the amplitude of the infrasonic part. An ‘electrostatic’ mechanism, first introduced by Wilson [11], was further developed by Dessler [12] and more recently by Pasko [13] and Chum et al. [14] to reproduce the infrasonic part of the thunder, which is very directive and assumes the acoustic sources to be within the cloud. However, using 3D reconstructions of acoustic sources, Gallin et al. [15] and Lacroix et al. [7] clearly showed that most of the infrasonic signal is due to the flash channel and not from the cloud itself. The acoustic sources are co-localized with the discharges located using the electromagnetic measurements of a lightning mapping array (LMA). Very recently, Lacroix et al. [3] suggested a new model based on Few’s [9] development, which also takes into account the interference of the waves emanating from the multiple sources distributed along the flash channel. The authors showed that the amplitude level of the infrasonic part of the signal is thus comparable with or even higher than the audible one.
The extent of the thunder detection zone depends on the frequency content. In the audible part, Fleagle [16] showed that thunder can be heard from flashes less than 25 km away, while in the infrasonic part, various authors (e.g., [15,17,18]) showed that thunder can be detected up to distances between 50 and 70 km away from dedicated sensors. In addition, thunder detections can also be associated with lightning activity 200 to 300 km away from an infrasound array that is beyond the shadow zone [18], since infrasound can propagate over long distances (even more than thousands of kilometers). This is possible due to an atmospheric waveguide created by the temperature and wind speed profiles, both determining the effective sound speed (speed of sound plus along-path wind speed). Waves can be refracted at around 50 km altitude, close to the stratopause or around 100 km in the thermosphere where the temperature strongly increases, such that the effective sound speed is higher in those altitude ranges than in the troposphere. Three zones can be delineated: (i) from the source up to 70–100 km distant, where direct propagation paths are possible, (ii) beyond ~150 km, where the first stratospheric bounces can reach the ground, and (iii) from 70 to 150 km, where it is difficult to receive any signal, defining the shadow zone. Nevertheless, propagation into the shadow zone is possible as perturbations of temperature and wind speed profiles introduce scattering (e.g., [19]).
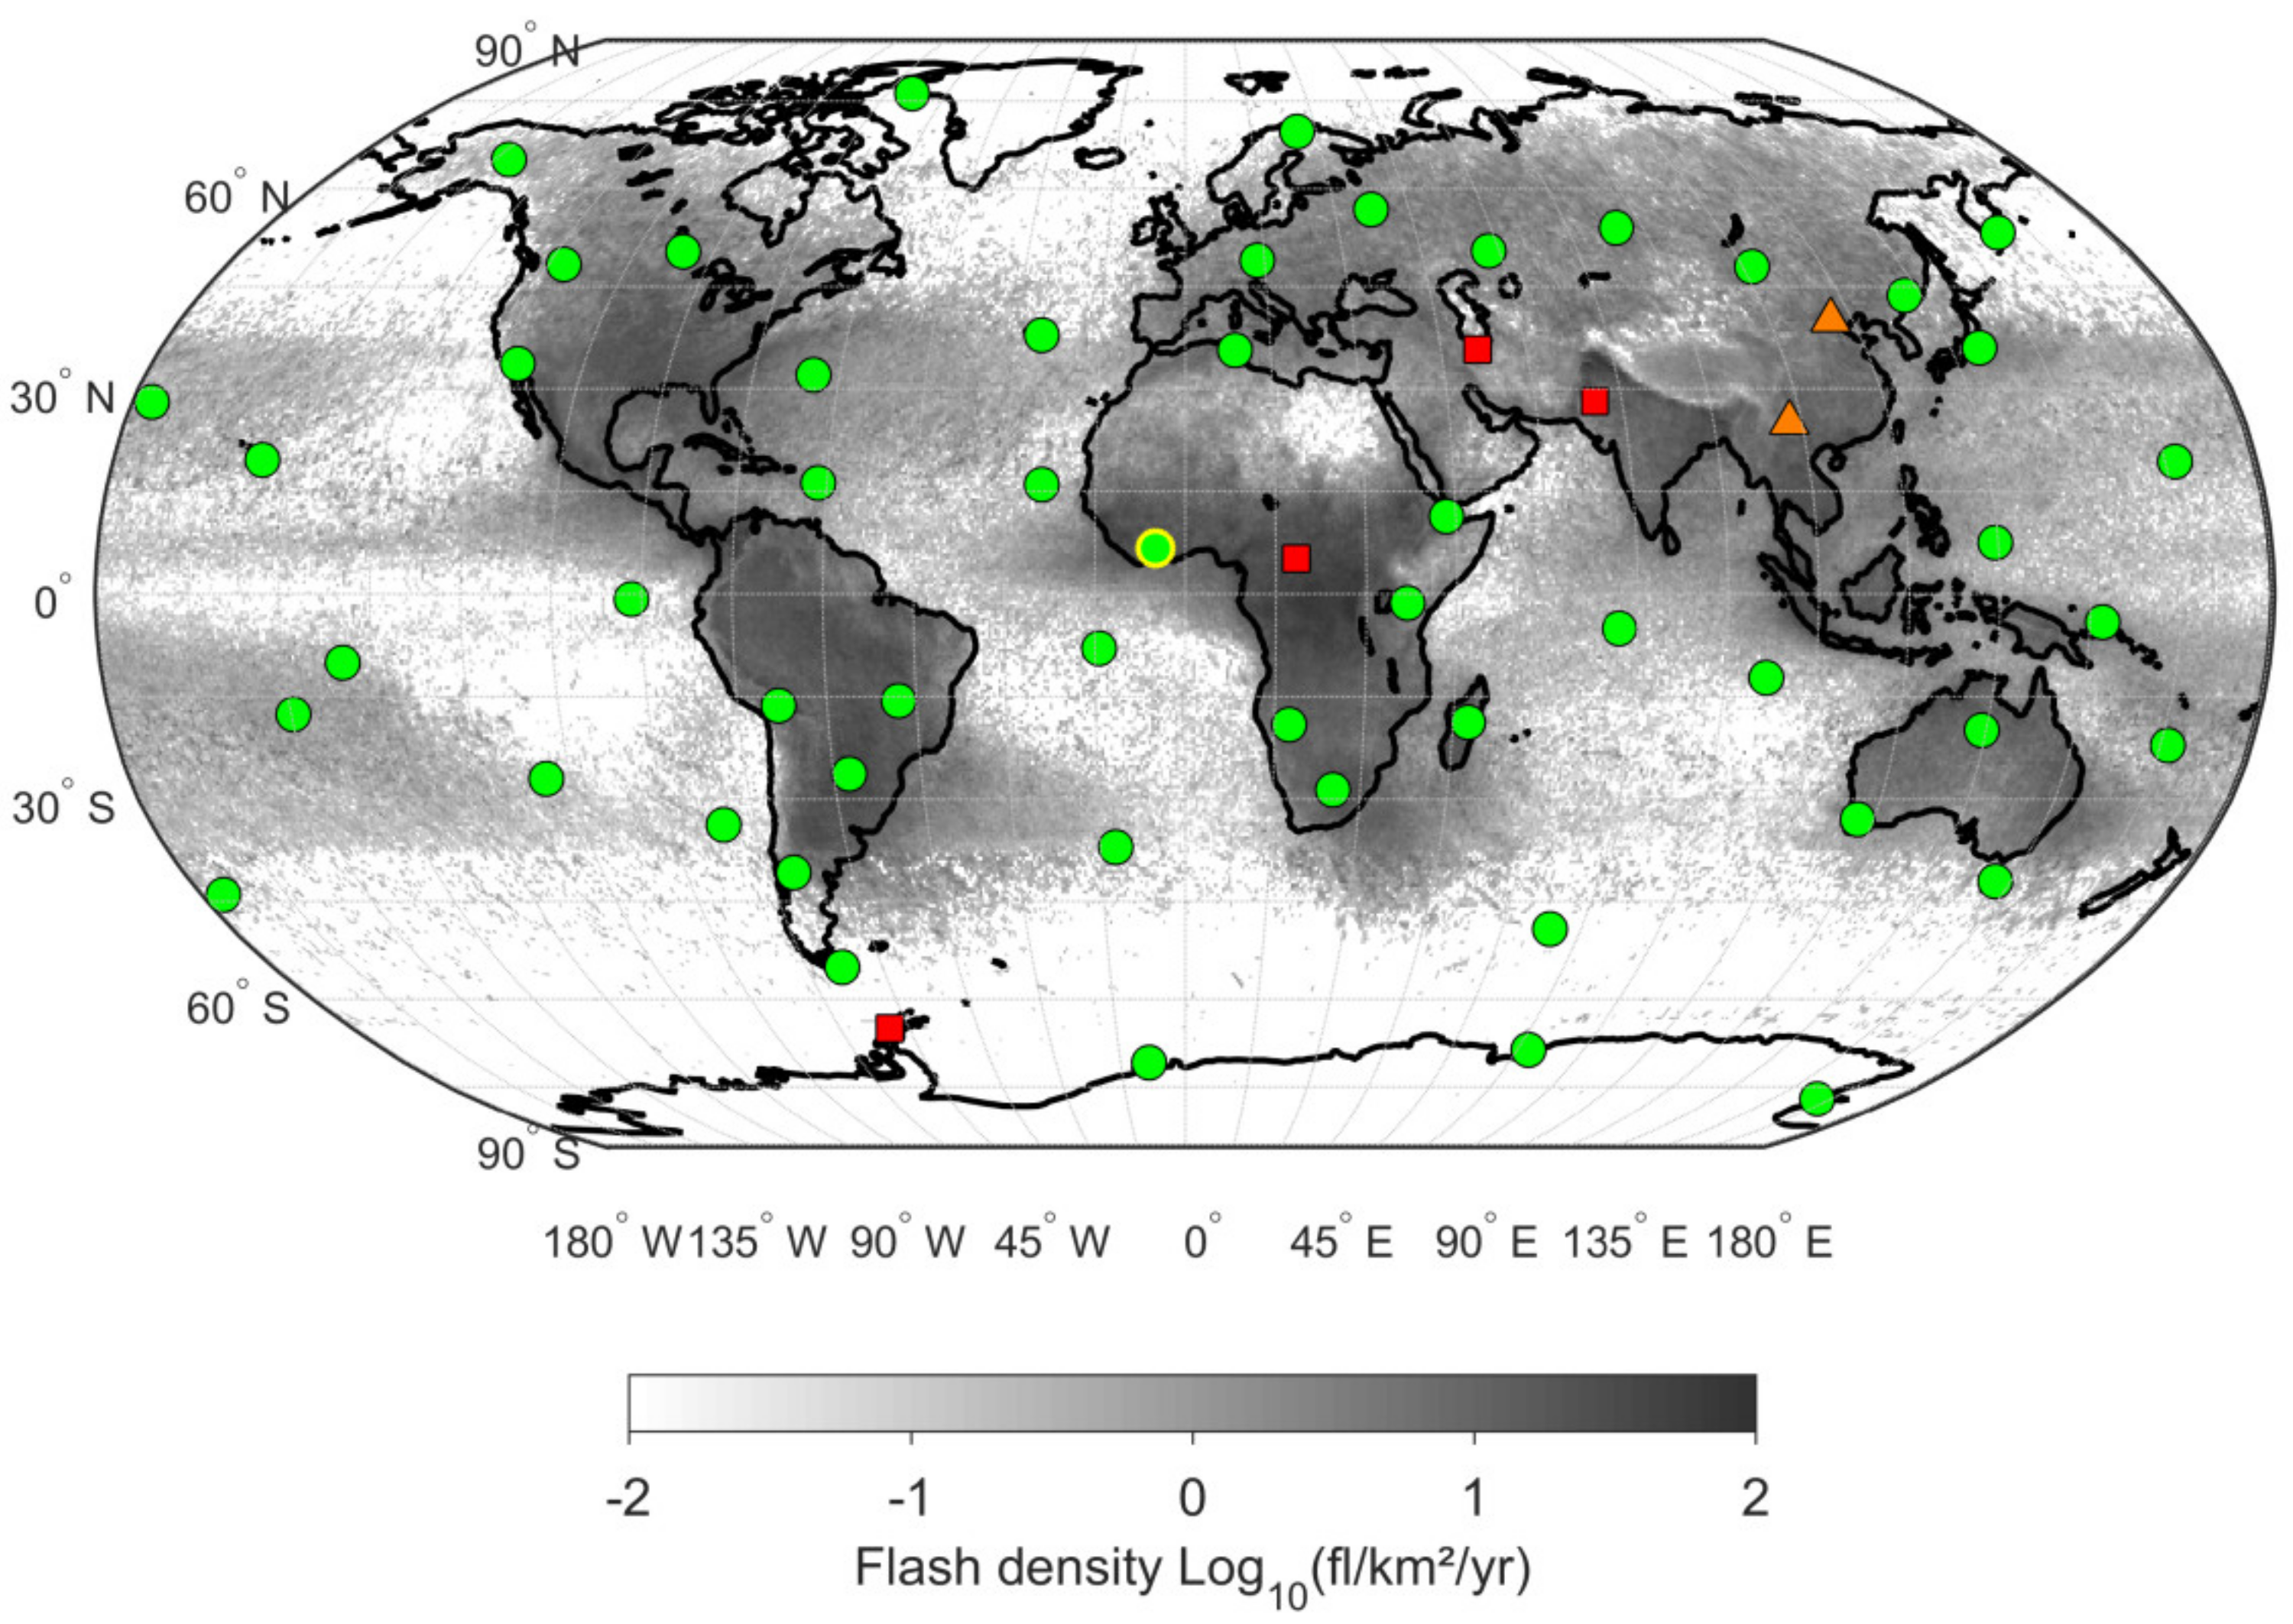
Since the Comprehensive Nuclear-Test-Ban Treaty (CTBT) was opened for signature in 1996, the International Monitoring System (IMS) has been deployed for providing evidence of potential clandestine nuclear tests. Four techniques are used for this purpose, including infrasound measurements. This network will be composed of 60 infrasound stations distributed uniformly over the surface of the globe [20]. Today, 88% of this network is operational (Figure 1). As the IMS network is unique by its global and homogeneous coverage as well as its data quality, it is able to monitor different kinds of natural atmospheric sources, such as exploding meteoroids, volcanic eruptions, hurricanes, earthquakes, ocean swelling, and lightning, or anthropogenic sources (e.g., [21]). Figure 1 shows that there are several IMS stations located in regions with high lightning activity, particularly in the tropical zone. One of them is IS17 located in Ivory Coast, which has been in operation since 2002. Within the Inter-Tropical Convergence Zone, this station is ideally situated to perform a long-term study of infrasonic thunder. The purpose of this paper is to evaluate the propagation conditions over a large domain (within 500 km from the station) and then to calculate the thunder amplitude decay with distance. Finally, we demonstrate the link between infrasound thunder detections and the stratospheric semi-annual oscillation, which modulates the zonal infrasound ducting in the tropical region. In Section 2, we present the available data. In Section 3, we describe the global statistics for infrasound and lightning detections. Section 4 is dedicated to the description of the method that associates one infrasound detection with one lightning flash. Finally, Section 5 and Section 6 show our results: the thunder amplitude decay with distance and the modulation of thunder infrasound detections by the equatorial semi-annual oscillation for stratospheric propagation.

2. Available Data

In this study, we consider infrasound measurements from 2004 to 2019 at the IMS station IS17 (Ivory Coast) together with the lightning electromagnetic detections of the World Wide Lightning Location Network (WWLLN).

2.1. Infrasound Measurements and Data Processing

The infrasound station IS17 is located in Dimbokro [6.67° N, 4.85° W], Ivory Coast. It is composed of four MB2000 micro-barometers forming a triangle of about 3 km aperture with a central element, which is a typical configuration of IMS stations [23]. These micro-barometers are very sensitive; they have a flat frequency response between 0.01 and 27 Hz, a sensitivity of about 0.1 mPa, and a large dynamic scale of 80 dB [24]. In order to improve the signal-to-noise ratio (by about 20 dB), infrasound arrays are connected to optimized wind-noise reduction devices [24]. These arrays, which are usually operated with a sampling frequency of 20 Hz, are able to detect and characterize low amplitude coherent infrasound signals within the background noise. The large dynamics of the sensors allow the observation of large amplitude detections close to the station and small amplitude signals from remote sources. These stations are able to detect signals in a very broad frequency band, including tidal waves (periods of up to 1 day), convective or orographic gravity waves (few minutes), swell (few seconds), as well as explosions, meteorites and lightning (from a few to tens of Hertz) (e.g., [25]).
Automatic processing of IS17 data is performed with the progressive multi-channel correlation algorithm (PMCC) [26], which estimates the wave-front parameters of coherent plane waves over the array. This array processing method was originally designed for seismic data and proved to be efficient to extract low-amplitude coherent infrasound signals among incoherent noise [27]. Currently, it is intensively used for operational processing of recordings made at IMS stations. We implemented PMCC in 15 linearly spaced bands of 0.3 Hz width between 0.5 and 5 Hz, bandpass-filtered with Chebyshev filters of second order. The lower frequency limit of 0.5 Hz was chosen, so as to avoid the strong emission from ocean swell around 0.2 Hz (e.g., [28]) and because previous studies showed that spectra of infrasonic thunder go down to between 0.5 and 1 Hz. The upper band was justified by the sampling frequency of 20 Hz. In this paper, the time window of 30 s length was advanced in time steps of 10% of the window length. For each detection, different parameters were gathered: beginning date and time, duration, frequency parameters (minimum, maximum and center frequency), and wave-front parameters such as back azimuth, apparent phase velocity, root-mean-square (RMS) and maximum amplitude.
IS17 data have been used in previous studies; for instance, Blanc et al. [29] used IS17 measurements for monitoring the atmospheric gravity waves induced by thunderstorms (i.e., convective cells). The gravity wave azimuths follow the seasonal motion of the tropical rain belt partly related to the Intertropical Convergence Zone. The authors showed that the keraunic level in Lamto (a city close to IS17) maximizes twice a year at about 15 thunder days per month, one in spring (in April-May) and the second in fall (from September to November). Costantino and Heinrich [30] showed a good agreement between simulated surface pressure disturbances using Weather Research and Forecasting (WRF) meteorological simulations and those observed in Ivory Coast. They suggested these disturbances could be due to cold pool propagation. Marlton et al. [31] utilized these gravity wave observations to derive gravity wave parameters such as the horizontal wave number, which exhibits a similar seasonal cycle.

2.2. WWLLN Lightning Locations

The WWLLN uses electric field antennas, which record the VLF radio electromagnetic waves emitted by lightning flashes, to locate return strokes all around the world with only a few dozens of sensors. During a lightning flash, a return stroke occurs when charges coming from the ground neutralize the ones inside the channel and the cloud. This part of a flash is very hot and bright. Most flashes are composed of a few return strokes (e.g., Rakov and Uman, [32]). A time of group arrival technique is used to locate the lightning strokes [33]. At least five VLF sensors are required to obtain a lightning location, thanks to the very efficient propagation of VLF waves [34]; these sensors could be several thousand kilometers away from the flash. At its beginning in 2003, this network consisted of 11 sensors [35]. This number has constantly been increasing, exceeding 70 since 2013 [36]. The WWLLN performance has improved because of, first, the increasing number of stations all around the world, and second, the enhancements in waveform processing algorithms [34]. The global median location accuracy is about 10 km [34]. The WWLLN detection efficiency ranges from 10% to 20% for the cloud to ground flashes but rises to between 50% and 80% for intense flashes (defined with peak current ≥50 kA), varying significantly over land and ocean, while being higher over oceans by a factor of 2–3 [37]. Holtzworth et al. [38] showed that the number of flashes detected all over the world has almost been stable since 2013; whereas a 50% increase from 2010 to 2013 was observed. This overall stability confirms the results inferred from optical observations of flashes by the Lighting Imaging System (LIS), which was on board the Tropical Rainfall Measuring Mission (TRMM) for 17 years [22]. Due to the WWLLN detection efficiency, only one return stroke per flash is typically recorded. Therefore, we chose to use the term flash rather than return stroke in this paper.

3. Global Statistics for Infrasound and Lightning Detections

3.1. Statistics of IS17 Infrasound Detections

Infrasound measurements have been in progress at the IS17 station since mid-2002, i.e., more than 18 years, with a lack of data of 8 months, from 23 January to 29 July 2005 and from 14 February to 16 April 2008, due to maintenance and renovation operations. Overall, 742,105 detections of coherent infrasonic signals in the band 0.5–5 Hz were made by PMCC in 5227 operating days from 2005 to the end of 2019. To remove possible anthropogenic detections, which could perturb our analysis, we pre-filtered the data, leaving 94% of detections available (more details on the algorithm and its results are given in the Supplementary Materials Section S1). Figure 2 shows statistics on the remaining detections.
Figure 2a shows the daily infrasound detection activity. The mean and median values are 124 and 91 detections per day, respectively. The maximum daily value is 828 detections, whereas 387 days have fewer than 10 detections per day. Figure 2b shows the yearly occurrence. Occurrence is defined here as the ratio of the number of infrasound detections recorded during 1 year over the number of infrasound detections recorded from 2004 to 2019. If the occurrence was constant over the entire period, the yearly occurrence should be 0.0625. After 2006 (in 2004 and 2005 the station was not in full time operation), the activity ranged between 0.05 and 0.09, where no significant trend over these 13 years could be identified. Figure 2c presents the monthly occurrence showing two seasons with increased activity: spring (from March to June) and fall (from September to December). Fall is more intense than spring by a factor of ~1.5 in terms of occurrence. Lastly, the hourly occurrence, Figure 2d, reveals a maximum of activity at 17 UT and a minimum from 9 UT to 11 UT. After 12 UT, the activity sharply rises, and it decreases more smoothly during the night (twilight starts at around 18 UT at these latitudes).
Considering wave-front parameters, the azimuthal distribution shows two main directions of arrival (Figure 2e), that is, from east to southeast (70°–150°) and from southwest to northwest (240°–320°); a minority of detections originate from the south. The center frequency distribution of the detections (Figure 2f) sharply increases from 0.5 to 1.5 Hz and slowly decreases towards higher frequencies. The median value is 2 Hz, and the 25% and 75%percentiles are 1.47 Hz and 2.67 Hz, respectively. This low frequency shape could be due to the thunder spectrum, which is not expected to be strong below 1 Hz. The median apparent phase velocity (Figure 2g) is 351 m/s and the 25% (75%) percentile value is 346 m/s (358 m/s). Finally, Figure 2h shows the amplitude occurrence. The mean and median values of the RMS amplitude are 1.3 × 10⁻³ and 2.2 × 10⁻³ Pa, respectively (25% and 75% percentiles are 0.7 × 10⁻³ and 2.3 × 10⁻³ Pa); for the maximum amplitude, mean and median amount to 16.1 × 10⁻³ and 6.6 × 10⁻³ Pa (25% and 75% percentiles are 3.3 × 10⁻³ and 14.6 × 10⁻³ Pa). The RMS amplitudes can reach 3 × 10⁻¹ Pa and the maximum peak-to-peak amplitude can be larger than 1 Pa. For the detection duration distribution (not shown in Figure 2), the mean and median values are 27 s ± 20 s and 24 s. Most of the detections (95%) are less than 60 s in duration.

3.2. Lightning Temporal and Azimuthal Distributions

The WWLLN data used in this paper are from 1 January 2005 to 31 December 2019. These data document the lightning activity in Ivory Coast, shown on a map within a square of ~1100 km zonal and meridional extent, centered on IS17 (Figure 3a). Overall, the data set contains about 15 million flashes. Maxima of activity can be localized over mountainous regions (in the northwest of Ivory Coast and over Guinea, in the north (over Mali), and in the east over Togo Mountains in Ghana) or along the Liberia or Ivory Coast (close to Abidjan) coastlines. The flash activity is relatively low (about one quarter of the maximum) and uniform within a radius of 100 km around the station. Seasonal flash density maps are available in the Supplementary Materials Section S2.
Figure 3b–e shows the variation of the lightning activity at different time resolutions. First, the daily flash occurrence is plotted in Figure 3b. The median occurrence within 500 km from IS17 is 935 flashes per day. The 25% and 75% percentiles are 267 and 2308, respectively; hence underlining a large variability. The maximum flash activity is 25,362 flashes on a single day. On more than 400 days less than 20 flashes were detected; that is about 7% of the period under consideration. Most of these days (three quarters) were in December, January or February. The yearly activity illustrated in Figure 3c qualitatively agrees with the variation depicted by Holzworth et al. [38] for the whole Earth. From 2005 to 2013, the yearly flash occurrence increased by a factor of three and then became globally stable. The monthly occurrence Figure 3d shows maxima in spring (March to May) and fall (September to November); the spring maximum exceeds the fall peak by a factor of two. Figure 3e presents the typical diurnal variability of the flash activity, with a maximum around 18 UT and a minimum around noon. The slopes around 18 UT are relatively symmetric within ±3 h. As UT is almost equal to local time, the diurnal lightning activity is maximal in the late afternoon as already observed in Africa for, instance, by Collier et al. [39]. Convection and heating of the air close to the ground contribute to the formation of cumulonimbus. As it is generally the hottest in the afternoon, the thunderstorm activity consequently maximizes in the late afternoon.
Finally, Figure 3f quantifies the azimuthal occurrence of WWLLN flashes for two ranges: within a 100 km and 500 km radius around the station, respectively. The azimuthal distribution peaks come from the place with local maxima of lightning activity shown on the map (Figure 3a).

3.3. Comparison of IS17 and WWLLN Global Statistics

By comparing the statistics of these two datasets, some elements strongly indicated that most of the infrasound detections are generated by thunder. Firstly, the duration of most of the detections, in the order of a few tens of seconds, is compatible with thunder duration. Similarly, the maximum amplitudes of the detections are consistent with the peak-to-peak values measured by Farges and Blanc [18]. Secondly, the hourly distributions for infrasound detections and flashes show a similar pattern with maximum activity around 17 or 18 UT. Thirdly, the respective monthly distributions indicate that most of the detections are recorded in spring and fall. However, infrasonic activity is stronger during fall than spring, while the opposite is true for lightning. Another discrepancy appears by comparing azimuthal distributions: the infrasound azimuthal distribution shows two main regions from east to southeast (70°–150°) and from southwest to northwest (240°–320°), whereas the azimuthal distribution in lightning reveals one main region from east to south within 100 km and one from west to southwest within 500 km from IS17. Two minima frame the latter main region. Nevertheless, for proving that most of the activity above 0.5 Hz is due to thunder, we conducted—like Farges and Blanc [18]—a systematic comparison of the temporal variation of lightning and infrasound detections. Figure 4 shows 40 days from 24 April to 3 June 2014, that are at the end of the high activity lightning season. At least one thunderstorm occurred every day within 500 km from the station. About half of them passed within 100 km. The red dots show the temporal variation of the infrasound detections in azimuth. Almost all of the infrasound that is measured occurs when a thunderstorm is present and tends to occur when the thunderstorm is close to the station. From one storm to another, we found the trends observed by Farges and Blanc [18], i.e., a good correlation when a storm is close (less than 100 km) or beyond 200 km, and a weaker detectability between 100 and 200 km, that is, when IS17 is in the shadow zone. These features were observed not only for these 40 days but also throughout the 15 years of measurements examined in this paper.

3.4. Comparison of WWLLN and Infrasound Detections for a Typical Storm

For a detailed analysis of the association of infrasound detections with thunderstorm activity and lightning flashes, we now show the comparison of the lightning activity and the infrasound detections for a typical case. In Figure 5, we compare the WWLLN flash parameters with the infrasound detection parameters for a large and long-duration thunderstorm, which occurred on 23 June 2010. Figure 5a was plotted in a similar way as Figure 4, but it focuses on a single storm. One can recognize that infrasound detections follow the track of the storm very well, particularly when it is less than 100 km from the station, between 16 and 19 UT. Figure 5b shows the temporal variation of WWLLN flash distance while Figure 5c,d depict the temporal variation of two infrasound parameters (RMS amplitude and apparent phase velocity). These data are colored with the azimuth value of the WWLLN flash detection (b) or the IS17 infrasound detection (c,d). There is a quite high number of infrasound detections when the storm is still far away from the station (~200 km), for instance, before 10 UT (Figure 5b,c). The RMS amplitude of the detections was below 5 mPa when the flashes struck beyond ~50 km and suddenly increases up to 25 mPa when the storm was very close to the station (~10 km). We also recognize a strong dispersion of the amplitude, especially when the flashes occurred close to the station. From 9 to 14 UT, most of the infrasound detections have an azimuth of about 135° and remain stable while the thunderstorm is moving to the east. It seems that IS17 is more sensitive to flashes within 200 to 300 km than those within 100 to 200 km, being inside the shadow zone. Finally, as Figure 5d shows, for flashes close to the station (<20 km), the apparent phase velocity increases, reaching up to 500 m/s. This means that the incidence angle increases. The vertical extent of the flash (up to 16 or even 18 km height at these latitudes) is thus revealed here [7,15]. This example is typical when a storm approaches from far away, gets very close to the station, and then moves away. Other cases are provided in the Supplementary Materials Section S3. They exemplify the following cases: complex thunderstorm with several intense cells passing above the station, storm in the shadow zone, storm occurring far away (>200 km) and when the stratospheric wind direction affects the infrasound detection.

4. Association Method and Results

For providing a quantitative proof of the already made qualitative association and for further studies of infrasonic thunder detection range and its variability, we automatically correlated the infrasound detections with the WWLLN locations using an association method.
For each infrasound detection, we looked for the number of WWLLN detections that are in good agreement with its azimuth within a 30 min interval (corresponding to a propagation over 500 km at about 280 m/s). The tolerance on the azimuth agreement depends on the flash distance: no constraint below 30 km, ±45° when the flash is between 30 and 70 km away from IS17, and ±30° beyond 70 km. This large tolerance takes into account the WWLLN location uncertainty with a median value of 10 km and the possible azimuth deviation during the propagation due to the winds in the middle atmosphere (e.g., [40]). Section S4 of the Supplementary Materials shows that beyond 50 km from the station, the average azimuth deviation, the difference between the azimuths of the flash and the detection, is between 5° and 11° (Figure S7).
We then obtained the proportion of infrasound detections consistent with the presence of thunderstorms within 500 km from IS17 in the previous half hour, taking into account the azimuth variation tolerance. This proportion amounted to 88%. We noticed that in the cases where there was no thunderstorm within 500 km for at least one day, that is ~1% of the time, only ~1% of the infrasound detections were recorded. We found also that 15% of the detections occurred during nearby thunderstorms (i.e., distance of less than 70 km). These values clearly show that lightning flashes induce most of the infrasound recorded from 0.5 Hz to 5 Hz at IS17.
Then, we looked for the possibility of a one-to-one association considering the effective propagation velocity (celerity), which is the ratio of the distance between the flash and the station, and the time of propagation (i.e., the difference between WWLLN detection time and the infrasound detection time). We considered celerity intervals depending on the infrasound propagation phase. We used the classification suggested by Blom et al. [41] that is 300–380 m/s for direct propagation or tropospheric propagation, 270–320 m/s for the stratospheric propagation, and 220–270 m/s for the thermospheric propagation. These celerities should not be confused with the apparent phase velocity measured at the station. If several flashes in different distance ranges are associated with the same infrasound detection, we consider the nearest lightning. This rule is justified by the results from Figure 5 and Figures S3–S6.
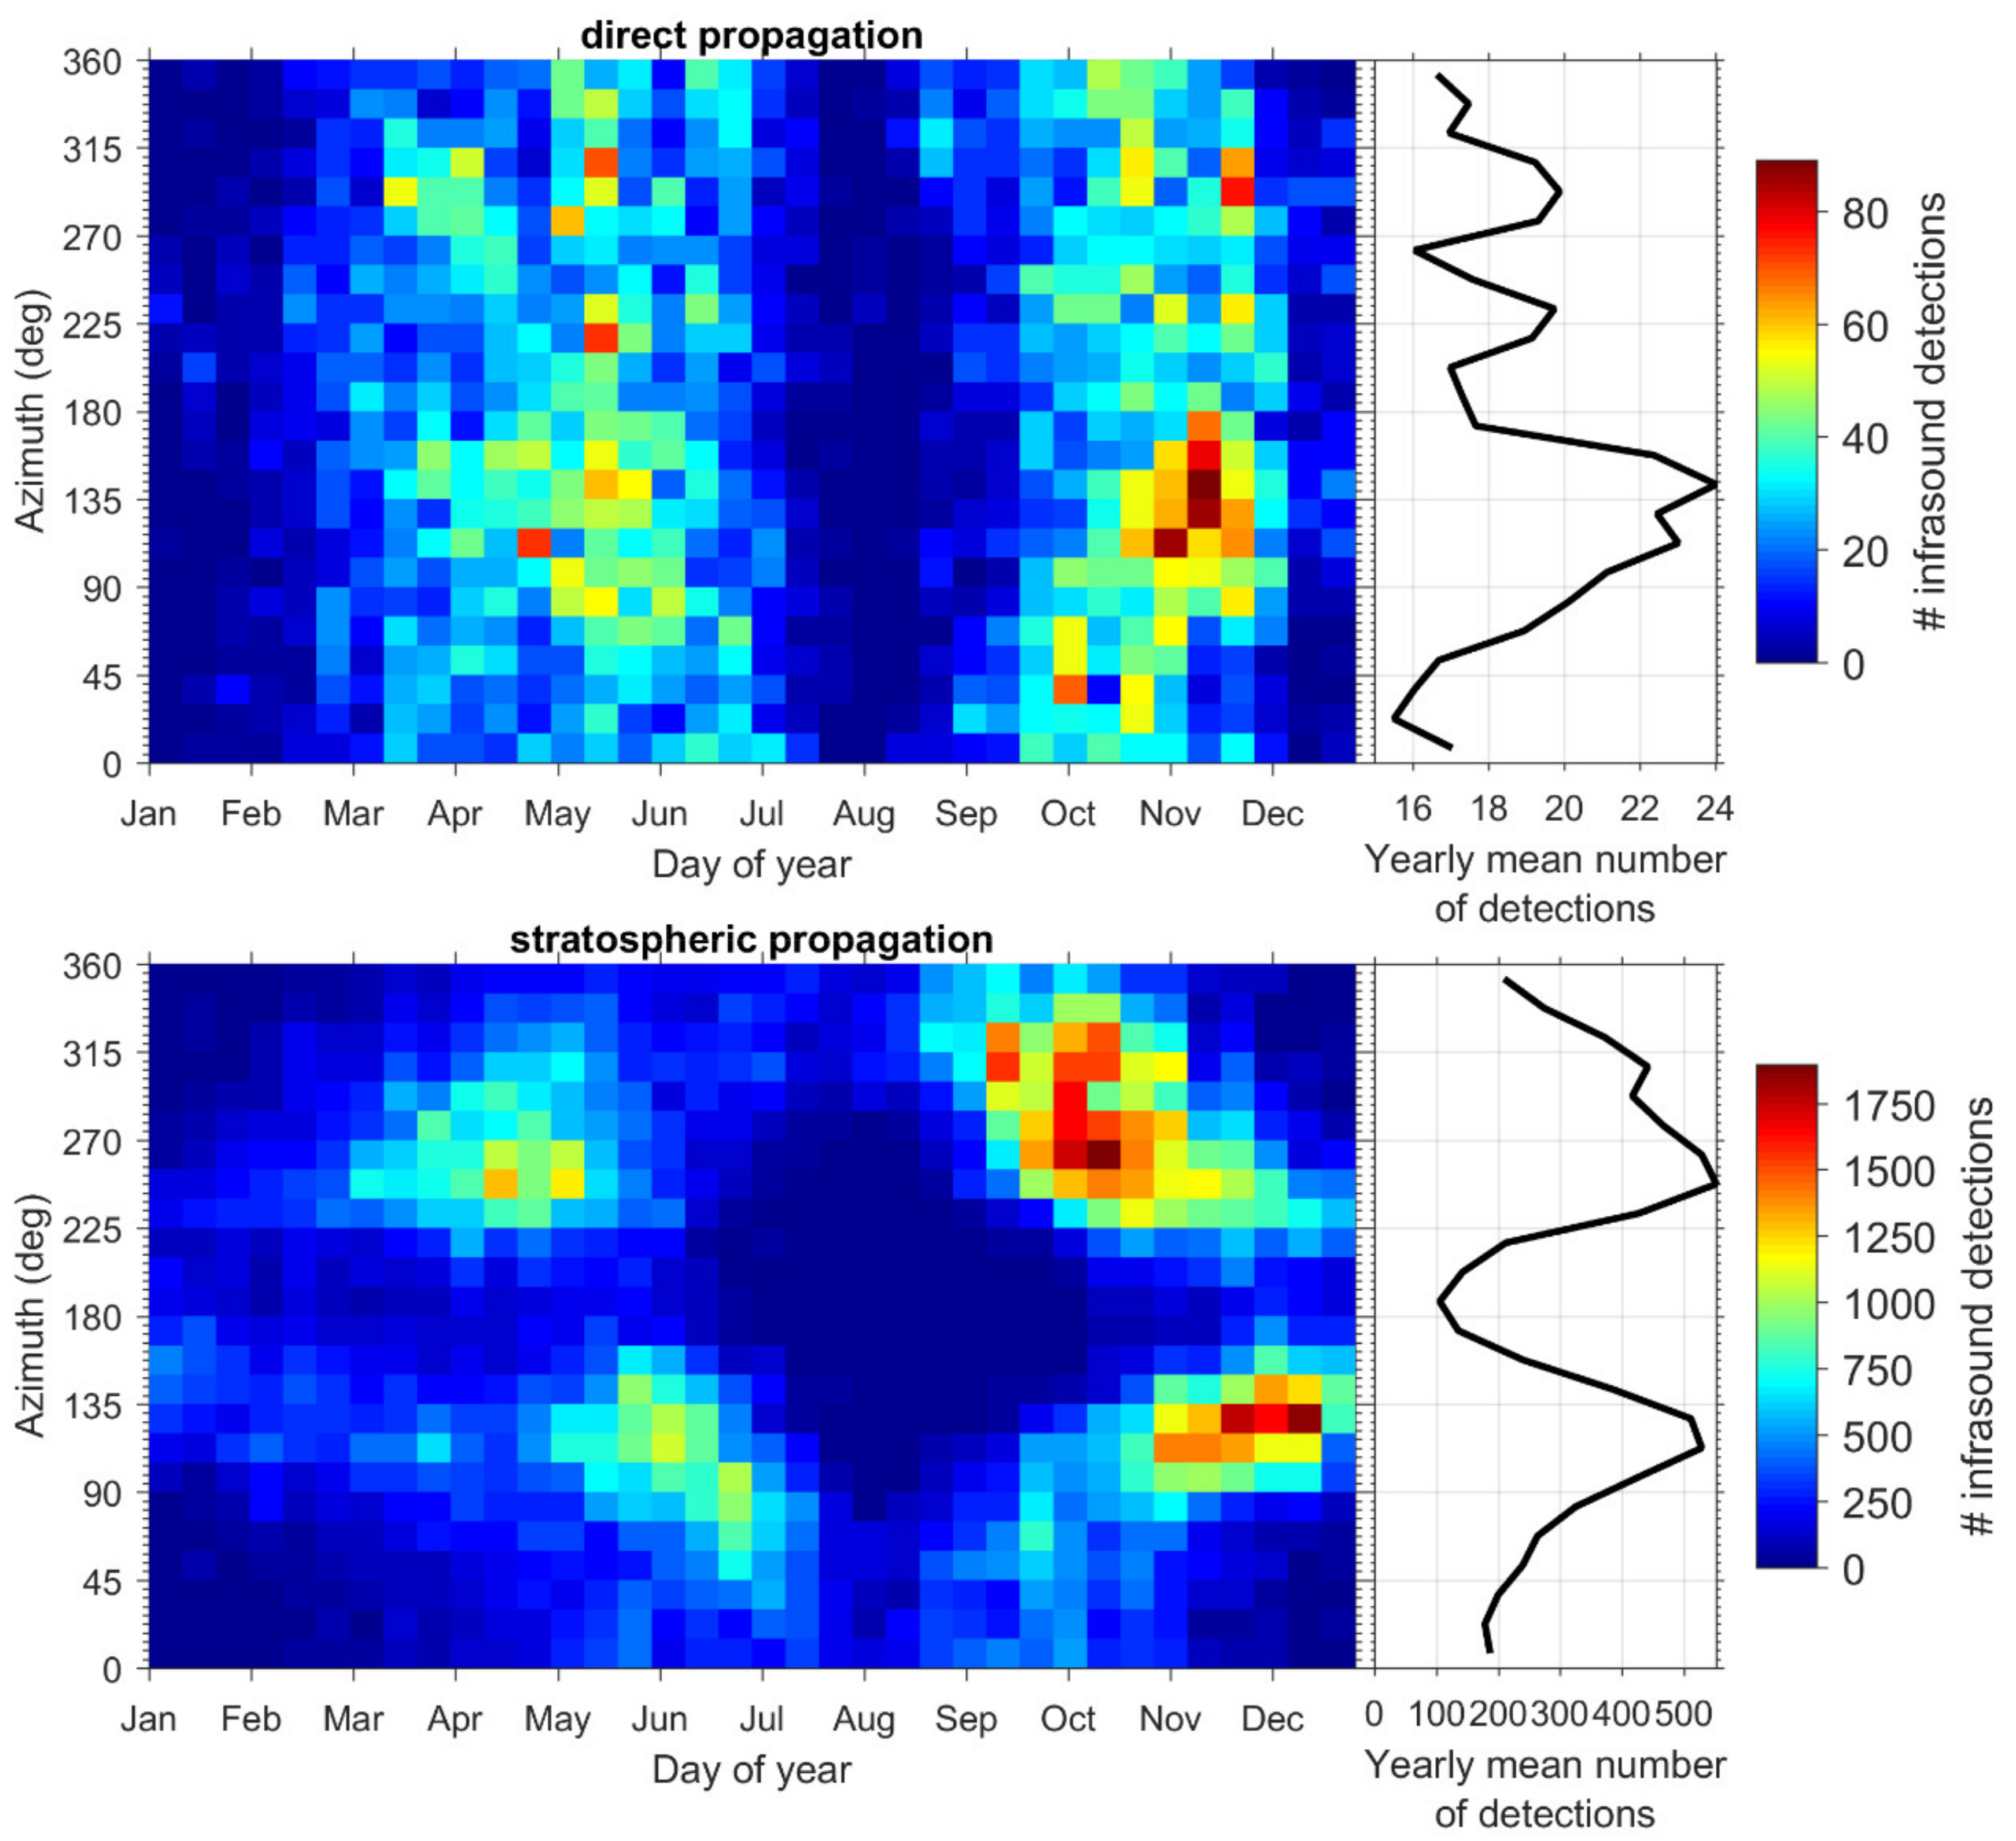
About 49% of the infrasound detections (i.e., 363, 454) are associated one-by-one with a flash using this method. These detections are distributed according to the type of propagation phase, as follows: 32,777 associated detections (or 9%) in direct or tropospheric propagation, 150,461 (or 41%) in stratospheric propagation and 180,216 (or 50%) in thermospheric propagation.
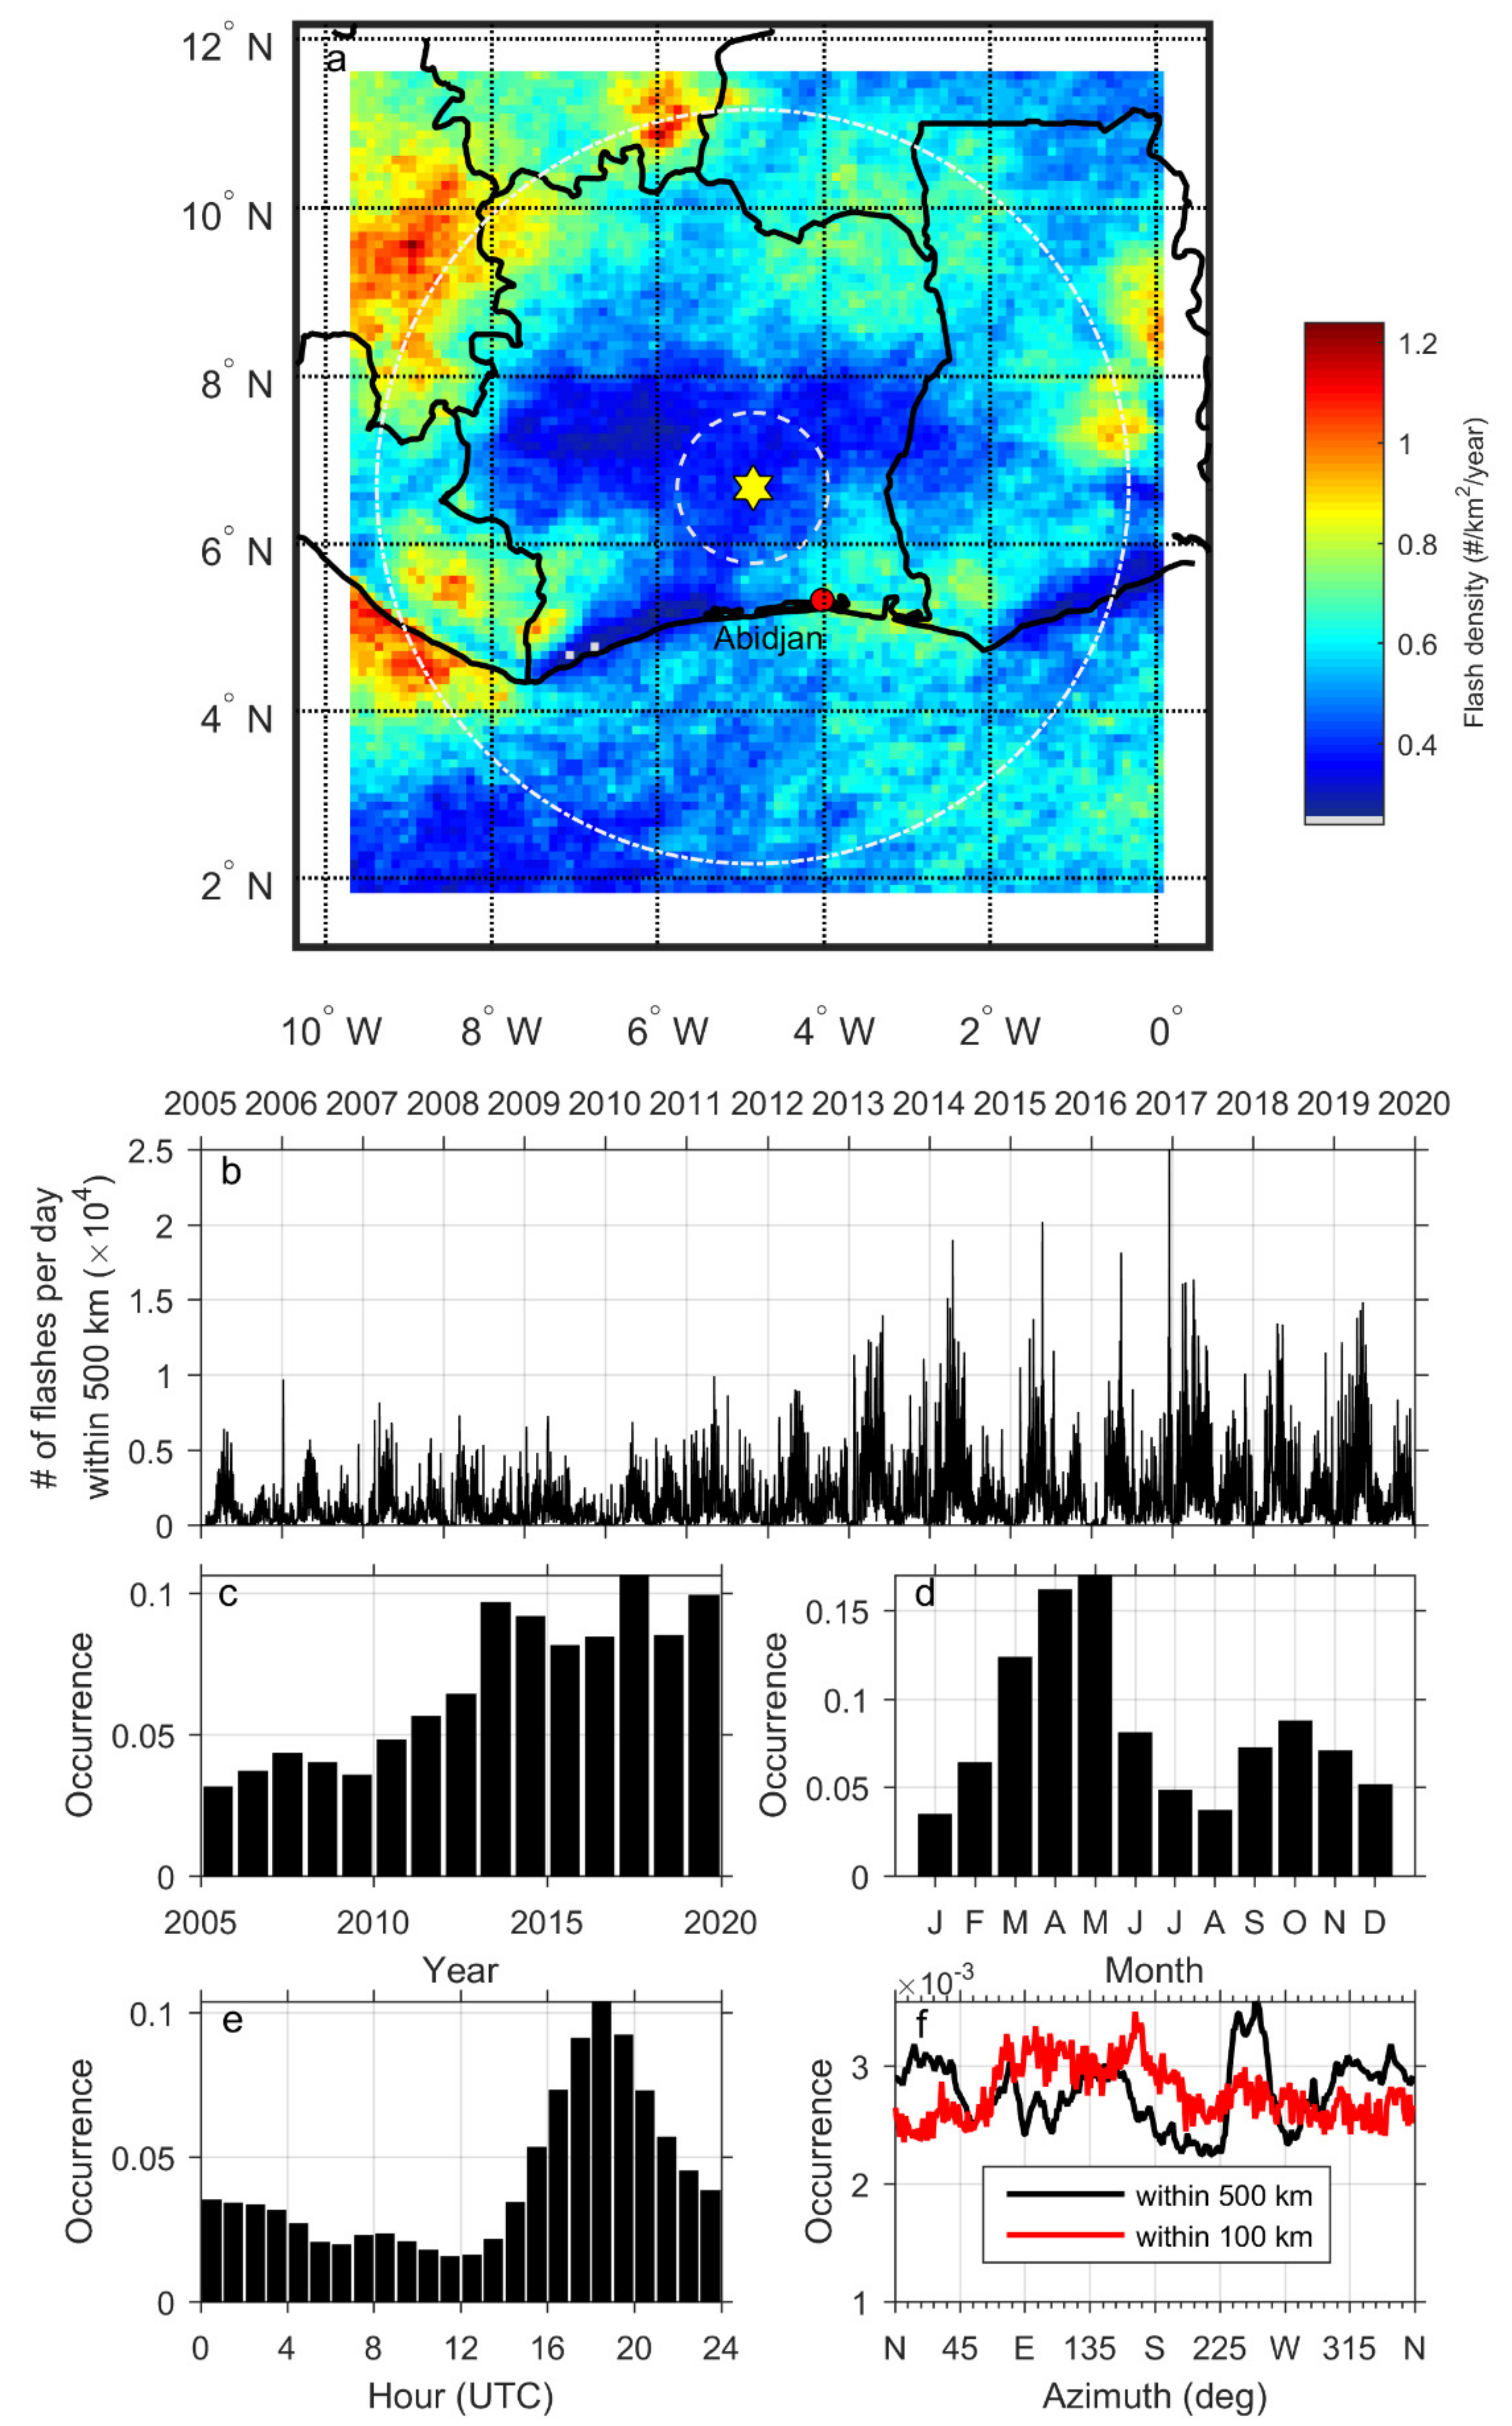
Figure 6 shows the distribution of these detections as a function of their azimuth and the day of the year when they are attributed to the tropospheric and stratospheric phases. The average azimuth distribution of the tropospheric phase detections has the same appearance as that of the WWLLN flashes at less than 100 km, showing a maximum between the east and the south (Figure 3f, red curve). Furthermore, the monthly distribution (not shown here) is also similar to that observed for WWLLN flashes, namely between March and June and between September and November (Figure 3d). A westward tropospheric waveguide forms due to the presence of a westward low level jet (LLJ) at about 4 km height in spring (MAM) and fall (SON), as shown, for instance, in Figure 1 of Marlton et al. [31]. The LLJ and its seasonal impact on the westward tropospheric infrasound guiding was confirmed by looking at vertical effective sound speed profiles obtained using ECMWF analysis products (not shown), as in Section 6, where the seasonal pattern of the stratospheric detections is discussed. This westward LLJ could account for the increased yearly mean number of detections from the 0–180° sector (Figure 6, top right).
On the other hand, the time-azimuth distribution for the stratospheric phases shows four local maxima. The average azimuth distribution reproduces the bimodal distribution seen in Figure 2e, which differs from that observed for lightning beyond 100 km (Figure 3f, black curve). In Section 6, we discuss in more detail the origin of the observed pattern and explain its link with the semi-annual oscillation.
Finally, the calculation of the detection efficiency, detailed in the Supplementary Materials Section S5, shows a very strong variability as a function of flash distance, azimuth and day of the year, ranging from less than 1% to more than 30%.

5. Thunder Amplitude Decay with Distance for Tropospheric Propagation

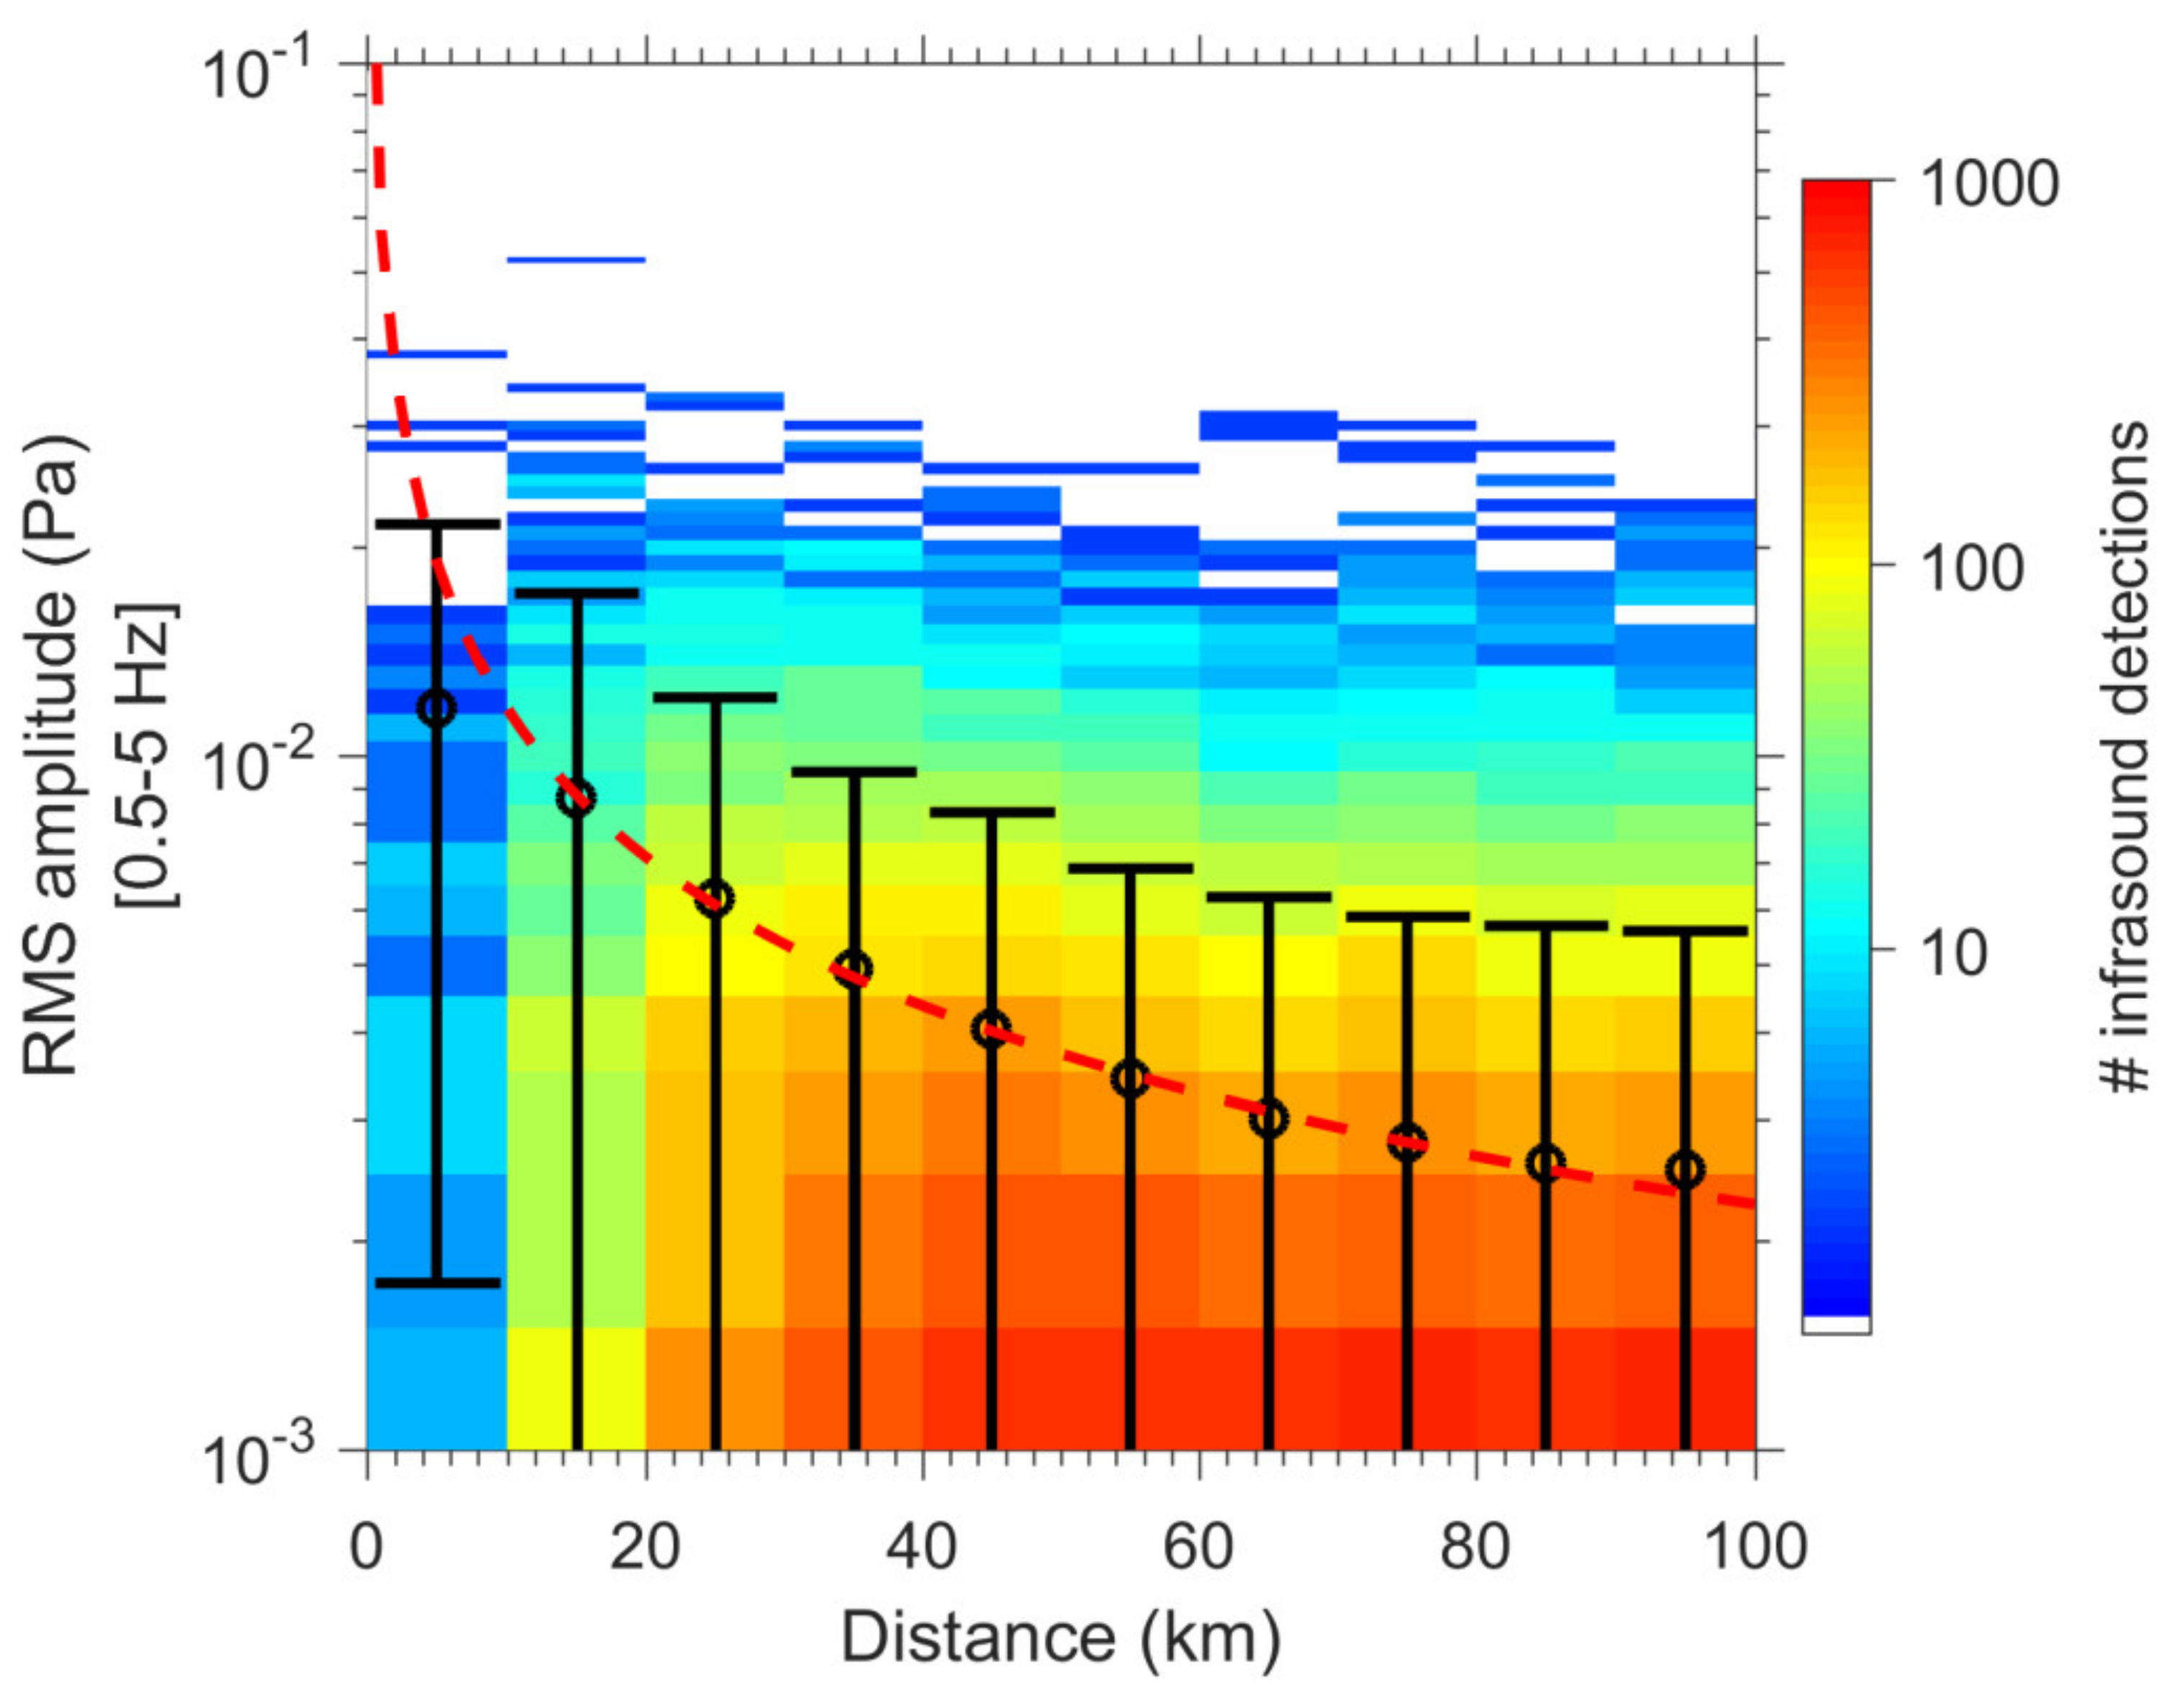
With 32,777 infrasound detections automatically associated one-to-one to a WWLLN flash within 100 km from IS17, we obtain an accurate relation (Figure 7) for the decay of the measured RMS amplitude (A, in Pa) with the associated flash distance (d in km):
A = 0.0615 × d 0.717
This power law has a Pearson correlation coefficient of 0.99 with the mean values calculated for 10-km distance intervals. We find a decay by a factor of 5 from 15 km to 95 km, which is much less than the factor of 200 (−45 dB attenuation) calculated with a linear wide-angle parabolic equation method by Le Pichon et al. [42] for a 1.6 Hz source from 20 to 80 km distances.
Some studies showed a decay of the thunder pressure as the inverse of the distance. For instance, Assink et al. [17] found that, in far field (distances larger than 20 km), the normalized acoustic pressure amplitude decays proportionally to the inverse of the distance (up to 50 km from the sensors). Similarly, Farges and Blanc [18] found a decrease proportional to the inverse of the distance up to 80 km. More recently, Lacroix et al. [3] showed that beyond 3 km from the flash, the acoustic energy normalized by the channel length decreases with the square of the distance as a spherical wave (i.e., a pressure amplitude decay as the inverse of the distance since the acoustic energy is proportional to the square of the wave amplitude).
Our results show a decay as d−0.717. Whitham [43] (chapter 9) recalled that amplitude decays with distance by d−0.5 for a line source in the linear regime, by d−0.75 for a line source in the nonlinear weak shock regime, and by d−1 for a point source in the linear regime. Propagation simulations should be performed to examine thoroughly the origin of this pressure decay factor.

6. Thunder Infrasound Detections Modulated by the Equatorial Semi-Annual Oscillation for Stratospheric Propagation

At mid latitudes, infrasound guiding is modulated by the seasonal changes in stratospheric winds [21] driven by thermal wind balance and the meridional temperature gradient, with westerly winds in the winter season and easterly winds in the summer season of both hemispheres. In tropical regions, the 6-month periodic oscillation of the stratospheric winds, known as the semi-annual oscillation (SAO), shapes the seasonal variability from the upper stratosphere to the upper mesosphere (e.g., [44]). In the low and mid stratosphere, the quasi-biennial oscillation (QBO) drives descending zonal wind reversals, whose links with the SAO above remain to be further understood (e.g., [45]). The SAO is in its westerly phase approximately from the beginning of March to the beginning of May and in its easterly phase from the beginning of August to the beginning of October. These periods slightly differ from one location to another in the tropics but hold true for IS17 at 6° N (see e.g., Figure 5 of [45]). Reanalysis products significantly differ in their representation of tropical zonal winds around the equator, thus illustrating the challenge of appropriately representing the stratospheric SAO, particularly at the stratopause where very few observational data exist [46]. ECMWF’s operational atmospheric model high-resolution analysis, produced by the Integrated Forecast System (IFS, cycle 46r1), represents the SAO fairly well. It is of note, however, that there are known issues related to non-orographic gravity waves whose representation relies on parameterizations to which the simulation of the SAO phases is sensitive [47].
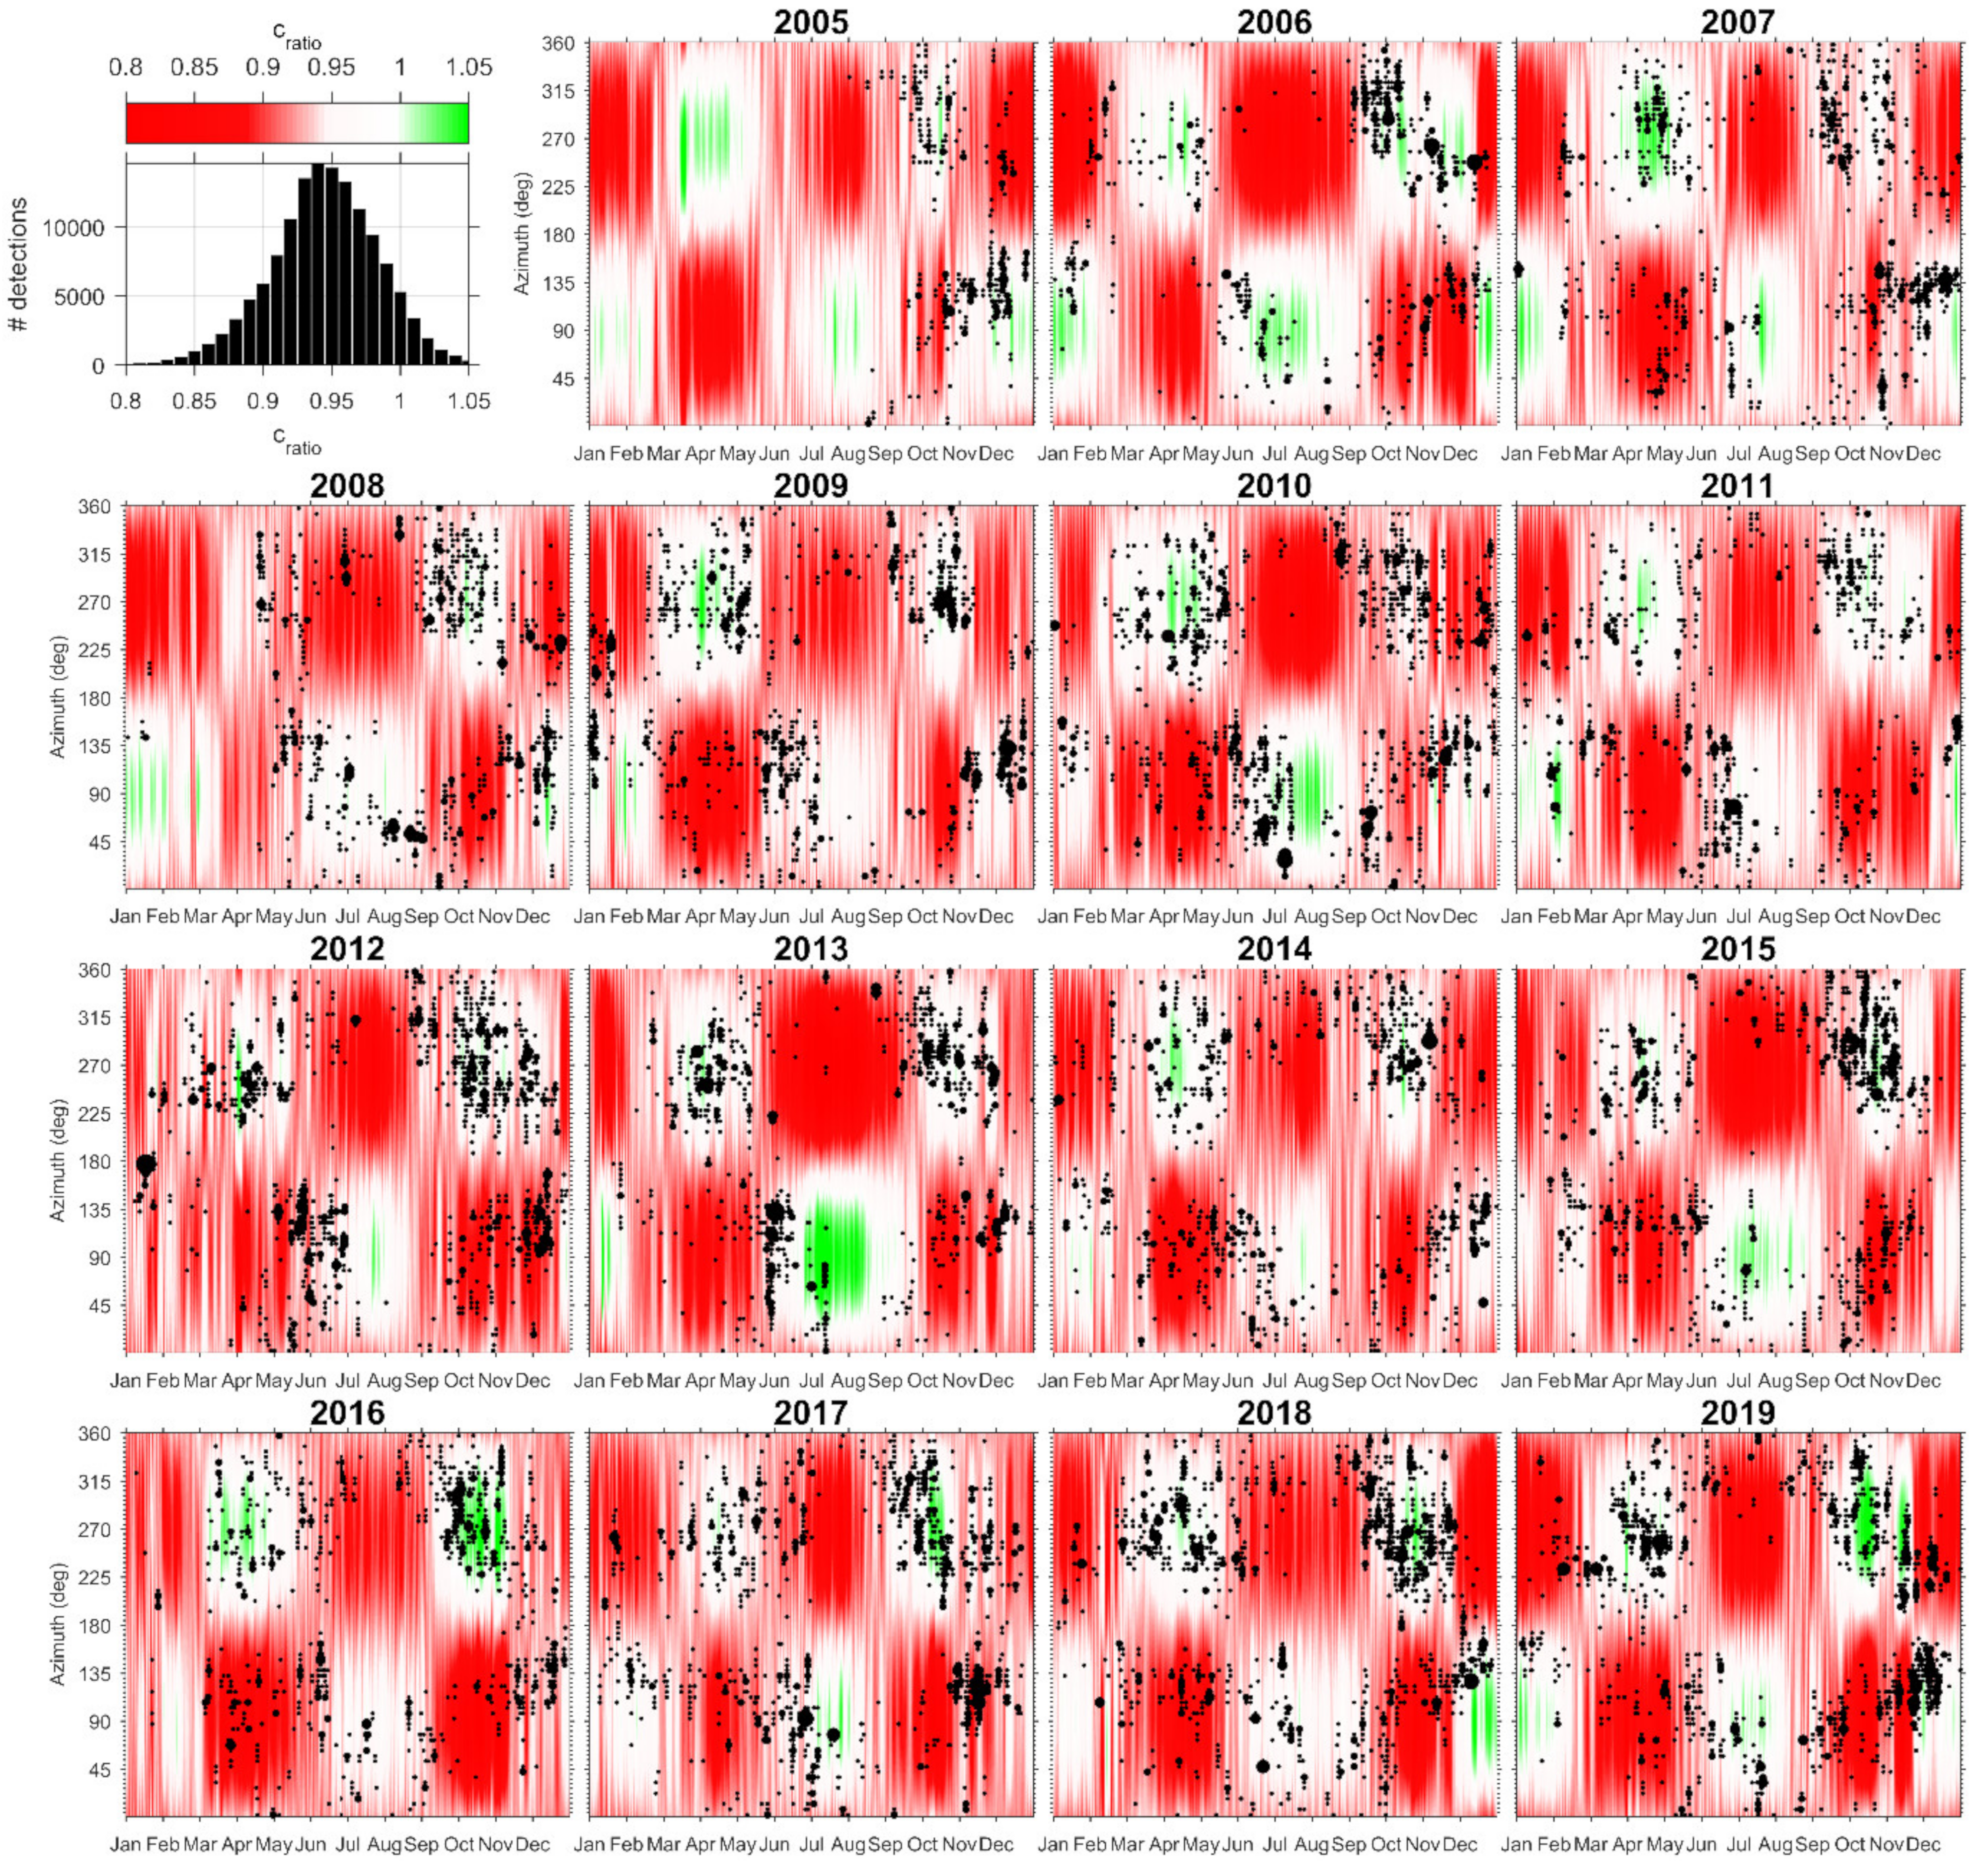
We used these IFS high-resolution analysis products (~16 km horizontal resolution and 137 vertical levels, time step 6 h) to calculate the ratio of the effective sound speed at 50 km altitude to the sound speed at the surface (cratio). The effective sound speed is the sum of the adiabatic speed of sound, driven by temperature, and of the wind speed component along the direction of propagation given the source receiver path direction. cratio is derived for IS17 from 2005 to 2019 for four times a day (0, 6, 12 and 18 UT). When cratio ≥ 1, infrasound emitted near the ground can be reflected near the stratopause and propagates back to the ground, following basic acoustic geometrics and the Snell–Descartes law.
Figure 8 shows the variability of cratio between 2005 and 2019 for all azimuths (i.e., for all infrasound propagation directions). The 6-month periodic pattern of the SAO at the stratopause clearly appears. There is great variability from one year to another because, for instance, the SAO phases are modulated by the QBO phases [45]. Considering cratio values between 0.9 and 1 is relevant for the following reasons. First, we need to account for possible occurrences of guiding that the model would miss because of the partial representation of atmospheric waves (e.g., gravity waves) in the model, which affect SAO amplitudes [47]. Second, the source of the infrasonic thunder may be actually located anywhere along the lightning flash, hence across a large portion of the troposphere (see cratio variability with source altitude study in Figure S9 and Section S6 of the Supplementary Materials). Thus, the value of the speed of sound near the ground, which we consider in the derivation of cratio, is an upper limit (ceff decreasing with height in the troposphere), and hence lower effective sound speeds in the stratosphere might be sufficient for establishing a wave guide.
In Figure 8, we superimposed the infrasound detections of thunder associated with the stratospheric wave guide as defined in Section 4. The size of the points is proportional to the number of detections for a given day and azimuth (over 5°). For the sake of clarity, we did not represent the cases with less than 3 detections per day and per 5° interval.
Overall, the spatiotemporal distribution of the thunder infrasound detections follows the pattern of the SAO. The vast majority (86%) of the detections correspond to values of cratio > 0.9. Clusters of detections clearly happen where cratio > 0.95 (white to green shaded areas), i.e., during the periods that are the most favorable to the reflection by the stratopause.
It may appear that there are more infrasound detections in the eastern sector (0°–180°) than in the western sector (180°–360°), particularly during unfavorable propagation conditions (red background color). In addition, due to only a few detections in January, July and August, i.e., during favorable conditions for arrivals from easterly directions, Figure 8 might imply that the SAO is hardly related to the detectability of lightning infrasound. However, Figure 3d and Figure S2 show that the WWLLN statistics accordingly reveal the lowest activity in these months. Figure S10 shows the distributions of cratio values for infrasound detections from the east and west during the different seasons. When the season is generally favorable to the propagation, the values of cratio are higher, with a value close to 1 (median value of 0.96 for the east and 0.97 for the west). Conversely, when the season is unfavorable, the cratio value is lower (median value of 0.92 in the east and west). We noted a higher number of detections in the east than in the west in these unfavorable periods. The substantially higher flash activity in spring and fall than in winter and summer (Figure S2) could explain this difference. Looking closely at detections corresponding to phases when the cratio is lower than about 0.93, it appears that a portion of these detections occur during short-term fluctuations of the propagation conditions, either due to a change of the stratospheric wind direction or ground temperature, hence raising the value of cratio. Finally, note that the bottom density plot of Figure 6 also shows the SAO-driven variability of infrasound thunder stratospheric detections across the whole dataset, at once. The number of westerly detections increases at equinoxes, when the stratopause SAO westerly phase begins, and a shift to easterly detections occurs with the start of the SAO easterly phase [45].
Future work will aim at focusing on the variability of infrasound thunder detections and the link with interannual variability of the SAO as well as altitude variation of reflections, which may be driven by the descending phases of westerlies and easterlies, respectively. Additionally, the inter-annual variability of the SAO may be caused by the QBO phase changes resulting in different altitudes for the SAO peak value [45], hence possibly different reflection altitudes for infrasound from thunder. Although the overall pattern of stratospheric propagation for IS17 has been identified, individual cases require further investigation. As an example, we compare the detection results of two infrasound stations in Ivory Coast, IS17 and a temporary station IS68 [48], Figure S11 in Section S8 of the Supplementary Materials. These simultaneous measurements over 1 year will help to specify the information on the middle atmospheric dynamics in tropical regions that may be extracted from infrasound thunder detections.

7. Conclusions

In this paper, we analyzed the measurements of infrasonic thunder recorded since 2004 at the IMS infrasound station IS17 located in Ivory Coast. Our analysis focused on detections in the frequency range between 0.5 and 5 Hz. We showed the main characteristics of these detections, including the distribution of the wave parameters (azimuth, amplitude, apparent phase velocity, and duration) and the temporal variability of the detection occurrence. The infrasound detections were compared with WWLLN data, while both data sets did not exhibit any long-term trend (increase or decrease) of the lightning activity over 16 years. We found a bi-annual cycle with an increased occurrence in fall and spring, and a daily peak around 17 UT. The detections had an average duration of 20 s and a maximum of 60 s, with an average RMS amplitude of a 1.3 mPa and a maximum of 0.1 Pa. The infrasonic detections showed preferential directions from the east/southeast and the southwest/northwest.
Comparing the statistics of temporal and azimuthal variability with lightning detections of the WWLLN network, we found that the infrasound detections reflect several characteristics specific to thunderstorms in Ivory Coast: the diurnal and bi-annual variability, the signal duration associated with thunder, and the amplitude range. Nevertheless, there were also deviations in the respective azimuthal distribution and a greater number of infrasound detections in the fall than in the spring, contrary to what is observed with WWLLN. One hypothesis is that the actual number of flashes in a given time window exceeds the number of infrasound arrivals that can be detected and discriminated by PMCC. The latter number is limited by the PMCC software, which only detects the dominant source in a defined time-frequency domain, and the processing configuration (e.g., window length). This may relativize the number of detections in spring, thus favoring fall over spring. In addition, between 2015 and 2019, the propagation conditions were more favorable during fall (see higher cratio in Figure 8) than during spring, in line with an increased number of detections. A qualitative comparison of the temporal evolution of lightning and infrasound detections clearly showed that high-frequency infrasound activity was strongly controlled by thunderstorm activity even when thunderstorms were located beyond 200 km from the station, even up to 500 km.
Since the infrasonic detections cover the full time of the year and the whole azimuth range, a method of one-to-one association of the infrasound detections with those of the WWLLN was proposed and applied. This method revealed that 88% of the infrasound detections actually occurred when a thunderstorm was present within 500 km in the direction of arrival of these detections. Nevertheless, WWLLN does not necessarily detect all flashes. To overcome this limitation, the method uses lightning measured in a wide time range that allows identifying the existence of a thunderstorm in a certain range of distance and azimuth. We also assumed that there is necessarily a match between the nearest lightning and the detected infrasound when the azimuth is correct (under a permissive azimuth deviation assumption). Moreover, about half of the infrasound detections were one-to-one associated with a WWLLN flash. We therefore know the distance of these infrasound sources. We identified three propagation zones: direct propagation or tropospheric propagation up to 100 km, the shadow zone from 100 km to 150 km, and stratospheric and thermospheric propagation beyond 150 km.
Inside the direct propagation zone, the amplitude of infrasound detections associated with thunder decreases with distance d as d−0.717. This attenuation is somewhat weaker than the attenuation of a spherical wave as the inverse of distance (d−1) in linear regime for a point source. Further studies will be needed to understand this evolution with distance.
The azimuth vs. day of year detection distribution reveals four maxima during the year. The comparison with the cratio shows that this pattern is mainly due to the stratospheric semi-annual oscillation, which is characteristic of the tropical latitudes. Thunder measurements could be further used to investigate middle atmosphere oscillation modes at various temporal scales, down to the day-to-day variability. These aspects will be investigated in future studies, also including joint measurements of the temporary station IS68 deployed 300 km north of IS17 in 2018.
Our study paves the way for new investigations of the propagation of infrasonic waves in the tropical zone, using other IMS stations for instance, by using thunder as a very frequent source to track middle atmosphere variability modes in equatorial regions.

Supplementary Materials

The following are available online at https://www.mdpi.com/article/10.3390/atmos12091188/s1, Figure S1: Illustration of the pre-filtering algorithm on recurrent human activity, Figure S2: Seasonal flash density maps around the IS17 station, Figure S3: Comparison of infrasound measurements and WWLLN flash detections from 19 May 2014 at 18 UT to 20 May 2014 at 09 UT, Figure S4: Comparison of infrasound measurements and WWLLN detections from 8 May 2014 at 22 UT to 9 May 2014 at 04 UT, Figure S5: Comparison of infrasound measurements and WWLLN detections on 25 June 2007 from 05 UT to 10 UT, Figure S6: Comparison of infrasound measurements and WWLLN detections from 11 July 2013 at 17 UT to 12 July 2013 at 06 UT, Figure S7: Variation with the distance of the measured azimuth deviation, Figure S8: Infrasound detection efficiency of flashes variation, Figure S9: Mean value of cratio over 15 years vs. day of the year and azimuth, Figure S10: Distributions of cratio associated with the infrasound detection for east and west azimuth range considering the different seasons, Figure S11: Comparison of infrasound detection between IS17 and IS68 station on 18 April 2018.

Author Contributions

Conceptualization, T.F.; methodology, T.F.; formal analysis, T.F. and P.H.; investigation, A.D.; data curation, P.H. and L.C.; writing—original draft preparation, T.F.; writing—review and editing, T.F., P.H., L.C., C.L. and A.L.P.; visualization, T.F. All authors have read and agreed to the published version of the manuscript.

Funding

This research received no external funding.

Institutional Review Board Statement

Not applicable.

Informed Consent Statement

Not applicable.

Data Availability Statement

We wish to thank the World Wide Lightning Location Network (http://wwlln.net (accessed on 13 September 2021)), a collaboration among over 50 universities and institutions, for providing the lightning location data used in this paper. The LIS climatology maps were obtained from NASA’s Global Hydrology and Climate Center (https://ghrc.nsstc.nasa.gov/lightning/data/data_lis_otd-climatology.html (accessed on 13 September 2021)). IMS data are available from the CTBTO for scientific purposes through the virtual Data Exploitation Centre (vDEC): https://www.ctbto.org/specials/vdec/ (accessed on 13 September 2021). ECMWF products, including the atmospheric model analysis, are partly available via www.ecmwf.int/en/forecasts/accessing-forecasts (accessed on 13 September 2021) under CC-BY 4.0 License.

Acknowledgments

The authors would like to thank the Director and the team of the Station Géophysique de Lamto in Ivory Coast for the very good and dedicated work they are doing in maintaining their infrasound network and in making the data available. The results obtained in this article would not have been possible without their involvement. The authors also thank Samuel Kristoffersen (CEA) for proofreading as well as the four anonymous referees for reviewing the manuscript.

Conflicts of Interest

The authors declare no conflict of interest.

References

  1. Kelley, M.C.; Garstang, M. On the Possible Detection of Lightning Storms by Elephants. Animals 2013, 3, 349–355. [Google Scholar] [CrossRef] [Green Version]
  2. World Meteorological Organization. World Distribution of Thunderstorm Days; Secretariat of the World Meteorological Organization: Geneva, Switzerland, 1956. [Google Scholar]
  3. Lacroix, A.; Coulouvrat, F.; Marchiano, R.; Farges, T.; Ripoll, J.-F. Acoustical energy of return strokes: A comparison between a statistical model and measurements. Geophys. Res. Lett. 2019, 46, 11479–11489. [Google Scholar] [CrossRef]
  4. Farges, T.; Coulouvrat, F.; Gallin, L.-J.; Marchiano, R. Infrasound for Detection, Localization, and Geometrical Reconstruction of Lightning Flashes. In Infrasound Monitoring for Atmospheric Studies; Le Pichon, A., Blanc, E., Hauchecorne, A., Eds.; Springer: Cham, Switzerland, 2019; pp. 911–938. [Google Scholar] [CrossRef]
  5. Holmes, C.R.; Brook, M.; Krehbiel, P.; McCrory, R. On the power spectrum and mechanism of thunder. J. Geophys. Res. 1971, 76, 2106–2115. [Google Scholar] [CrossRef]
  6. Depasse, P. Lightning acoustic signature. J. Geophys. Res. 1994, 99, 25933–25940. [Google Scholar] [CrossRef]
  7. Lacroix, A.; Farges, T.; Marchiano, R.; Coulouvrat, F. Acoustical measurement of natural lightning flashes: Reconstructions and statistical analysis of energy spectra. J. Geophys. Res. Atmos. 2018, 123, 12-040. [Google Scholar] [CrossRef]
  8. Ribner, H.S.; Roy, D. Acoustics of thunder: A quasilinear model for tortuous lightning. J. Acoust. Soc. Am. 1982, 72, 1911–1925. [Google Scholar] [CrossRef]
  9. Few, A.A. Power spectrum of thunder. J. Geophys. Res. 1969, 74, 6926–6934. [Google Scholar] [CrossRef]
  10. Few, A.A. Acoustic radiation from lightning. In Handbook of Atmospheric Electrodynamics; Volland, H., Ed.; CRC Press: London, UK, 1995; Volume 2, pp. 1–31. [Google Scholar] [CrossRef]
  11. Wilson, C.T.R. Investigations on lighting discharges and on the electric field of thunderstorms. Philos. Trans. R. Soc. Lond. Ser. A 1921, 221, 73–115. [Google Scholar] [CrossRef]
  12. Dessler, A.J. Infrasonic thunder. J. Geophys. Res. 1973, 78, 1889–1896. [Google Scholar] [CrossRef]
  13. Pasko, V.P. Mechanism of lightning-associated infrasonic pulses from thunderclouds. J. Geophys. Res. 2009, 114, D08205. [Google Scholar] [CrossRef] [Green Version]
  14. Chum, J.; Diendorfer, G.; Šindelářová, T.; Baše, J.; Hruška, F. Infrasound pulses from lightning and electrostatic field changes: Observation and discussion. J. Geophys. Res. Atmos. 2013, 118, 10653–10664. [Google Scholar] [CrossRef]
  15. Gallin, L.-J.; Farges, T.; Marchiano, R.; Coulouvrat, F.; Defer, E.; Rison, W.; Schulz, W.; Nuret, M. Statistical analysis of storm electrical discharges reconstituted from a lightning mapping system, a lightning location system, and an acoustic array. J. Geophys. Res. 1949, 121, 3929–3953. [Google Scholar] [CrossRef] [Green Version]
  16. Fleagle, R.G. The audibility of thunder. J. Acoust. Soc. Am. 1949, 21, 411–412. [Google Scholar] [CrossRef]
  17. Assink, J.D.; Evers, L.G.; Holleman, I.; Paulssen, H. Characterization of infrasound from lightning. Geophys. Res. Lett. 2008, 35, L15802. [Google Scholar] [CrossRef] [Green Version]
  18. Farges, T.; Blanc, E. Characteristics of infrasound from lightning and sprites near thunderstorm areas. J. Geophys. Res. 2010, 115, A00E31. [Google Scholar] [CrossRef] [Green Version]
  19. De Groot-Hedlin, C.D. Infrasound propagation in tropospheric ducts and acoustic shadow zones. J. Acoust. Soc. Am. 2017, 142, 1816–1827. [Google Scholar] [CrossRef] [PubMed]
  20. Christie, D.R.; Campus, P. The IMS Infrasound Network: Design and Establishment of Infrasound Stations. In Infrasound Monitoring for Atmospheric Studies; Le Pichon, A., Blanc, E., Hauchecorne, A., Eds.; Springer: Dordrecht, Germany, 2010; pp. 27–72. [Google Scholar] [CrossRef]
  21. Le Pichon, A.; Blanc, E.; Hauchecorne, A. Infrasound Monitoring for Atmospheric Studies—Challenges in Middle Atmosphere Dynamics and Societal Benefits; Springer: Cham, Switzerland, 2019. [Google Scholar] [CrossRef]
  22. Cecil, D.J.; Buechlera, D.E.; Blakeslee, R.J. Gridded lightning climatology from TRMM-LIS and OTD: Dataset description. Atmos. Res. 2014, 135, 404–414. [Google Scholar] [CrossRef] [Green Version]
  23. Marty, J. The IMS Infrasound Network: Current Status and Technological Developments. In Infrasound Monitoring for Atmospheric Studies; Le Pichon, A., Blanc, E., Hauchecorne, A., Eds.; Springer: Cham, Switzerland, 2019; pp. 3–62. [Google Scholar] [CrossRef]
  24. Ponceau, D.; Bosca, L. Low-Noise Broadband Microbarometers. In Infrasound Monitoring for Atmospheric Studies; Le Pichon, A., Blanc, E., Hauchecorne, A., Eds.; Springer: Dordrecht, Switzerland, 2010; pp. 119–139. [Google Scholar] [CrossRef]
  25. Blanc, E.; Ceranna, L.; Hauchecorne, A.; Charlton-Perez, A.; Marchetti, E.; Evers, L.G.; Kvaerna, T.; Lastovicka, J.; Eliasson, L.; Crosby, N.B.; et al. Toward an Improved Representation of Middle Atmospheric Dynamics Thanks to the ARISE Project. Surv. Geophys. 2018, 39, 171–225. [Google Scholar] [CrossRef] [Green Version]
  26. Cansi, Y. An automatic seismic event processing for detection and location: The PMCC method. Geophys. Res. Lett. 1995, 22, 1021–1024. [Google Scholar] [CrossRef]
  27. Le Pichon, A.; Cansi, Y. PMCC for infrasound data processing. Inframatics 2003, 2, 1–9. [Google Scholar]
  28. Landès, M.; Ceranna, L.; Le Pichon, A.; Matoza, R.S. Localization of microbarom sources using the IMS infrasound network. J. Geophys. Res. 2012, 117, D06102. [Google Scholar] [CrossRef] [Green Version]
  29. Blanc, E.; Farges, T.; Le Pichon, A.; Heinrich, P. Ten year observations of gravity waves from thunderstorms in western Africa. J. Geophys. Res. Atmos. 2014, 119, 6409–6418. [Google Scholar] [CrossRef]
  30. Costantino, L.; Heinrich, P. Tropical deep convection and density current signature in surface pressure: Comparison between WRF model simulations and infrasound measurements. Atmos. Chem. Phys. 2014, 14, 3113–3132. [Google Scholar] [CrossRef] [Green Version]
  31. Marlton, G.J.; Charlton-Perez, A.J.; Harrison, R.G.; Blanc, E.; Evers, L.; Le-Pichon, A.; Smets, P.S.M. Meteorological source variability in atmospheric gravity wave parameters derived from a tropical infrasound station. J. Geophys. Res. Atmos. 2019, 124, 4352–4364. [Google Scholar] [CrossRef]
  32. Rakov, V.A.; Uman, M.A. Lightning: Physics and Effects; Cambridge University: Cambridge, UK, 2003; p. 687. [Google Scholar] [CrossRef]
  33. Dowden, R.L.; Brundell, J.B.; Rodger, C.J. VLF lightning location by time of group arrival (TOGA) at multiple sites. J. Atmos. Sol. Terr. Phys. 2002, 64, 817–830. [Google Scholar] [CrossRef]
  34. Rodger, C.J.; Brundell, J.B.; Holzworth, R.H.; Lay, E.H. Growing detection efficiency of the World Wide Lightning Location Network. AIP Conf. Proc. 2009, 1118, 15–20. [Google Scholar] [CrossRef]
  35. Lay, E.H.; Holzworth, R.H.; Rodger, C.J.; Thomas, J.N.; Pinto, O.; Dowden, R.L. WWLL global lightning detection system: Regional validation study in Brazil. Geophys. Res. Lett. 2004, 31, L03102. [Google Scholar] [CrossRef] [Green Version]
  36. Hutchins, M.L.; Holzworth, R.H.; Virts, K.S.; Wallace, J.M.; Heckman, S. Radiated VLF energy differences of land and oceanic lightning. Geophys. Res. Lett. 2013, 40, 2390–2394. [Google Scholar] [CrossRef]
  37. Bürgesser, R.E. Assessment of the World Wide Lightning Location Network (WWLLN) detection efficiency by comparison to the Lightning Imaging Sensor (LIS). Q. J. R. Meteorol. Soc. 2017, 143, 2809–2817. [Google Scholar] [CrossRef]
  38. Holzworth, R.H.; McCarthy, M.P.; Brundell, J.B.; Jacobson, A.R.; Rodger, C.J. Global distribution of superbolts. J. Geophys. Res. Atmos. 2019, 124, 9996–10005. [Google Scholar] [CrossRef] [Green Version]
  39. Collier, A.B.; Hughes, A.R.W.; Lichtenberger, J.; Steinbach, P. Seasonal and diurnal variation of lightning activity over southern Africa and correlation with European whistler observations. Ann. Geophys. 2006, 24, 529–542. [Google Scholar] [CrossRef] [Green Version]
  40. Antier, K.; Le Pichon, A.; Vergniolle, S.; Zielinski, C.; Lardy, M. Multiyear validation of the NRL-G2S windfields using infrasound from Yasur. J. Geophys. Res. 2007, 112, D23110. [Google Scholar] [CrossRef] [Green Version]
  41. Blom, P.S.; Marcillo, O.; Arrowsmith, S.J. Improved Bayesian Infrasonic Source Localization for regional infrasound. Geophys. J. Int. 2015, 203, 1682–1693. [Google Scholar] [CrossRef] [Green Version]
  42. Le Pichon, A.; Ceranna, L.; Vergoz, J. Incorporating numerical modeling into estimates of the detection capability of the IMS infrasound network. J. Geophys. Res. 2012, 117, D05121. [Google Scholar] [CrossRef]
  43. Whitham, G.B. Linear and Nonlinear Waves; John Wiley & Sons Inc.: New York, NY, USA, 1999. [Google Scholar] [CrossRef]
  44. Baldwin, M.P.; Birner, T.; Brasseur, G.; Burrows, J.; Butchart, N.; Garcia, R.; Scaife, A.A. 100 years of progress in understanding the stratosphere and mesosphere. Meteorol. Monogr. 2019, 59, 27.1–27.62. [Google Scholar] [CrossRef]
  45. Smith, A.K.; Garcia, R.R.; Moss, A.C.; Mitchell, N.J. The semiannual oscillation of the tropical zonal wind in the middle atmosphere derived from satellite geopotential height retrievals. J. Atmos. Sci. 2017, 74, 2413–2425. [Google Scholar] [CrossRef]
  46. Kawatani, Y.; Hirooka, T.; Hamilton, K.; Smith, A.K.; Fujiwara, M. Representation of the equatorial stratopause semiannual oscillation in global atmospheric reanalyses. Atmos. Chem. Phys. 2020, 20, 9115–9133. [Google Scholar] [CrossRef]
  47. Polichtchouk, I.; Hogan, R.J.; Shepherd, T.G.; Bechtold, P.; Stockdale, T.; Malardel, S.; Lock, S.-J.; Magnusson, L. What Influences the Middle Atmosphere Circulation in the IFS? No. 809; European Centre for Medium-Range Weather Forecasts Technical Memoranda: Reading, UK, 2010. [Google Scholar]
  48. Kouassi, K.B.; Yoroba, U.; Madu, F.O.; Diawara, A.; Kouadio, K.; Yao, P.A. Understanding the Split Characteristics of the Tropical Mesoscale Convective System (MCS) of April 9, 2018, in Northern Ghana Using Infrasound Data. Atmos. Clim. Sci. 2021, 11, 104577. [Google Scholar] [CrossRef]
Figure 1. Location of the 60 infrasound stations of the IMS of the CTBT organization (circles) compared to the annual flash density measured from space by the LIS instrument on board the TRMM satellite (using the gridded lightning climatology dataset by Cecil et al. [22]). The color of the markers corresponds to the status of the IMS infrasound stations: green stands for certified, orange for installed or under construction and red for planned. IS17 is highlighted with a yellow circle, close to the map’s center. Note that one of the stations is not depicted here because its location is under discussion.
Atmosphere 12 01188 g001
Figure 2. Statistics on the 725,286 infrasound detections between 0.5 and 5 Hz obtained from 2004 to the end of 2019 at IS17. Temporal distributions are given for daily (a), yearly (b), monthly (c), and hourly (d) variations. The distribution of wave-front parameters is given for azimuth (e), center frequency (f), trace velocity (g), and amplitude, both RMS and maximum (h).
Atmosphere 12 01188 g002
Figure 3. Lightning activity based on WWLLN data within 500 km from the IS17 station between January 2005 and December 2019. (a) Map of the flash density around the IS17 station (yellow star); the dashed circle defines a 100-km radius centered on the station, while the dotted-dashed circle depicts a 500-km radius. (be) Temporal distribution of flash activity within 500 km from IS17: (b) daily, (c) yearly, (d) monthly, and (e) hourly. (f) Azimuthal occurrence within 500 km (black curve) or within 100 km (red) from IS17.
Atmosphere 12 01188 g003
Figure 4. Comparison of the azimuths of the infrasound detections with the ones of the WWLLN detections from 24 April to 3 June 2014. The flashes’ azimuths are calculated according to the IS17 station; they are plotted as squares, color-coded according to their distance to IS17. The infrasound detections are shown as red circles whose size is proportional to their RMS amplitude.
Atmosphere 12 01188 g004
Figure 5. Comparison of infrasound measurements and WWLLN flash detections on 23 June 2010 from 6 UT to 20 UT. (a) Comparison of the azimuths of the infrasound detections with the ones of the flashes as shown in Figure 4. (b) Temporal variation of the flash distance color-coded with the WWLLN flash azimuth. The black line is the distance of the closest flash per 5-min interval. (c) Temporal variation of the infrasound RMS amplitude color-coded with the infrasound azimuth. (d) Temporal variation of the infrasound apparent phase velocity color-coded with the infrasound azimuth.
Atmosphere 12 01188 g005
Figure 6. Distributions of the number of infrasound detections associated with WWLLN flashes for a tropospheric (top) or stratospheric (bottom) propagation in function of their azimuth and day of year of occurrence (15° × 10 days bins). The yearly mean number of detections vs. the azimuth is plotted on the right.
Atmosphere 12 01188 g006
Figure 7. Distribution of infrasound detections vs. RMS amplitude and distance. The black circles give the mean amplitude value per 10 km distance bins with their error bars. The red dashed curve is the power fit over these mean values.
Atmosphere 12 01188 g007
Figure 8. Comparison of the cratio variability (from red to green between 0.9 and 1.05) with the detections of thunder infrasound that were refracted in the stratosphere (black points whose size is proportional to the number of detections per day and per 5° interval). Note the absence of data for IS17 in the first half of 2005 and between February and April 2008. The histogram on the top left gives the distribution of cratio values for all detections.
Atmosphere 12 01188 g008
Publisher’s Note: MDPI stays neutral with regard to jurisdictional claims in published maps and institutional affiliations.

