Article

Ambient PM2.5 and Daily Hospital Admissions for Acute Respiratory Infections: Effect Modification by Weight Status of Child

by
Hironori Nishikawa
1,*,
Chris Fook Sheng Ng
1,
Lina Madaniyazi
1,2,
Xerxes Tesoro Seposo
1,
Bhim Gopal Dhoubhadel
1,3,
Dhiraj Pokhrel
4,
Amod K. Pokhrel
4,
Sharat Chandra Verma
4,
Dhruba Shrestha
5,
Ganendra Bhakta Raya
5 and
Masahiro Hashizume
1,6
1
Department of Global Health, School of Tropical Medicine and Global Health, Nagasaki University, 1-12-4 Sakamoto, Nagasaki 852-8523, Japan
2
Department of Pediatric Infectious Disease, Institute of Tropical Medicine, Nagasaki University, 1-12-4 Sakamoto, Nagasaki 852-8523, Japan
3
Department of Respiratory Infections, Institute of Tropical Medicine, Nagasaki University, 1-12-4 Sakamoto, Nagasaki 852-8523, Japan
4
LEADERS Nepal, P.O. Box 8846, 3rd Floor Radhakuti Arcade, Putalisadak, Kathmandu 44600, Nepal
5
Siddhi Memorial Hospital, Siddhi Memorial Foundation, P.O. Box 40, Bhimsensthan-7, Bhaktapur 44800, Nepal
6
Department of Global Health Policy, School of International Health, Graduate School of Medicine, The University of Tokyo, 7-3-1 Hongo, Bunkyo-ku, Tokyo 113-0033, Japan
*
Author to whom correspondence should be addressed.
Atmosphere 2021, 12(8), 1009; https://doi.org/10.3390/atmos12081009
Submission received: 3 July 2021 / Revised: 30 July 2021 / Accepted: 2 August 2021 / Published: 5 August 2021
(This article belongs to the Special Issue Effect of Particulate Matter Exposure on Vulnerable Populations)

Abstract

:
The high level of ambient particulate matter in many developing countries constitutes a major health burden, but evidence on its impact on children’s health is still limited in these regions. We conducted a time-stratified case-crossover analysis to quantify the short-term association between fine particulate matter (PM2.5) and hospital admissions due to acute respiratory infections (ARI) among children in Bhaktapur district, Nepal, and to investigate the potential modification of the effect by nutritional characteristic. We analyzed 258 children admitted to the pediatric hospital for ARI between February 2014 to February 2015. We observed evidence of increased risk on the same (lag 0) and preceding day (lag 1). The cumulative estimate of their average (lag 01) suggested each 10 μg/m3 increase in PM2.5 was associated with a relative risk (RR) of 1.16 (95% confidence interval [CI]: 1.02–1.31). The strongest evidence from a stratified analysis of three categories of weights was observed in the overweight group (RR: 1.77; 95% CI: 1.17–2.69) at lag 01, while the estimates for the normal weight and underweight groups were closer to the non-stratified estimates for all-ARI cases. The findings suggests that pediatric ARI is an important morbidity associated with inhalable PM2.5 and that more research is needed to elucidate and validate the observed dissimilarity by weight.

Graphical Abstract

1. Introduction

In Kathmandu Valley, the capital of Nepal, the air pollution level has been estimated to be five times higher than the WHO Air Quality Guidelines [1], constituting a significant public health issue due to rapid urbanization. The lack of good air quality data, notably the highly inhalable particulate matter of less than 2.5 micrometer in diameter (PM2.5), and the subpar quality of medical record keeping have resulted in a scarcity of studies important to inform policies [2]. Although the association between air pollutants and human health has been well-documented [3,4,5], most of the studies were conducted in high-income countries where results may not be directly applicable to understand the health burden of high air pollution level in cities such as Kathmandu Valley. More importantly, knowledge gaps remain given the different emission sources that can lead to different toxicities in different locations and the different population characteristics in the lower middle-income countries (LMICs especially poor countries with limited economic ability to mitigate exposure [6].
Poor air quality affects growing children differently [7]. In this age subgroup, susceptibility to air pollution can be influenced by the health status of a child [1]. In Nepal, acute respiratory infection (ARI) was responsible for about 15% of deaths among children aged under five in 2013 [8]. However, susceptibility of this subgroup to PM2.5 is not well-understood despite previous reports linking PM2.5 and ARI [9,10]. A second important risk factor affecting children in the region is malnutrition, which is a significant health burden with a substantial impact on the Disability Adjusted Life Year (DALY) in the country [11]. Thirty-six percent of children under age five are stunted (short for their age), 10% are wasted (thin for their height), 27% are underweight (thin for their age), and 1% are overweight (heavy for their height) in Nepal [12]. Likewise, the influence of the nutritional status on the health effects of PM2.5 is little studied and not well-understood.
Against this backdrop, we conducted a study (1) to quantify the short-term association between ambient PM2.5 and daily ARI hospital admissions among children, and (2) to investigate the potential modification of health effects by weight status.

2. Materials and Methods
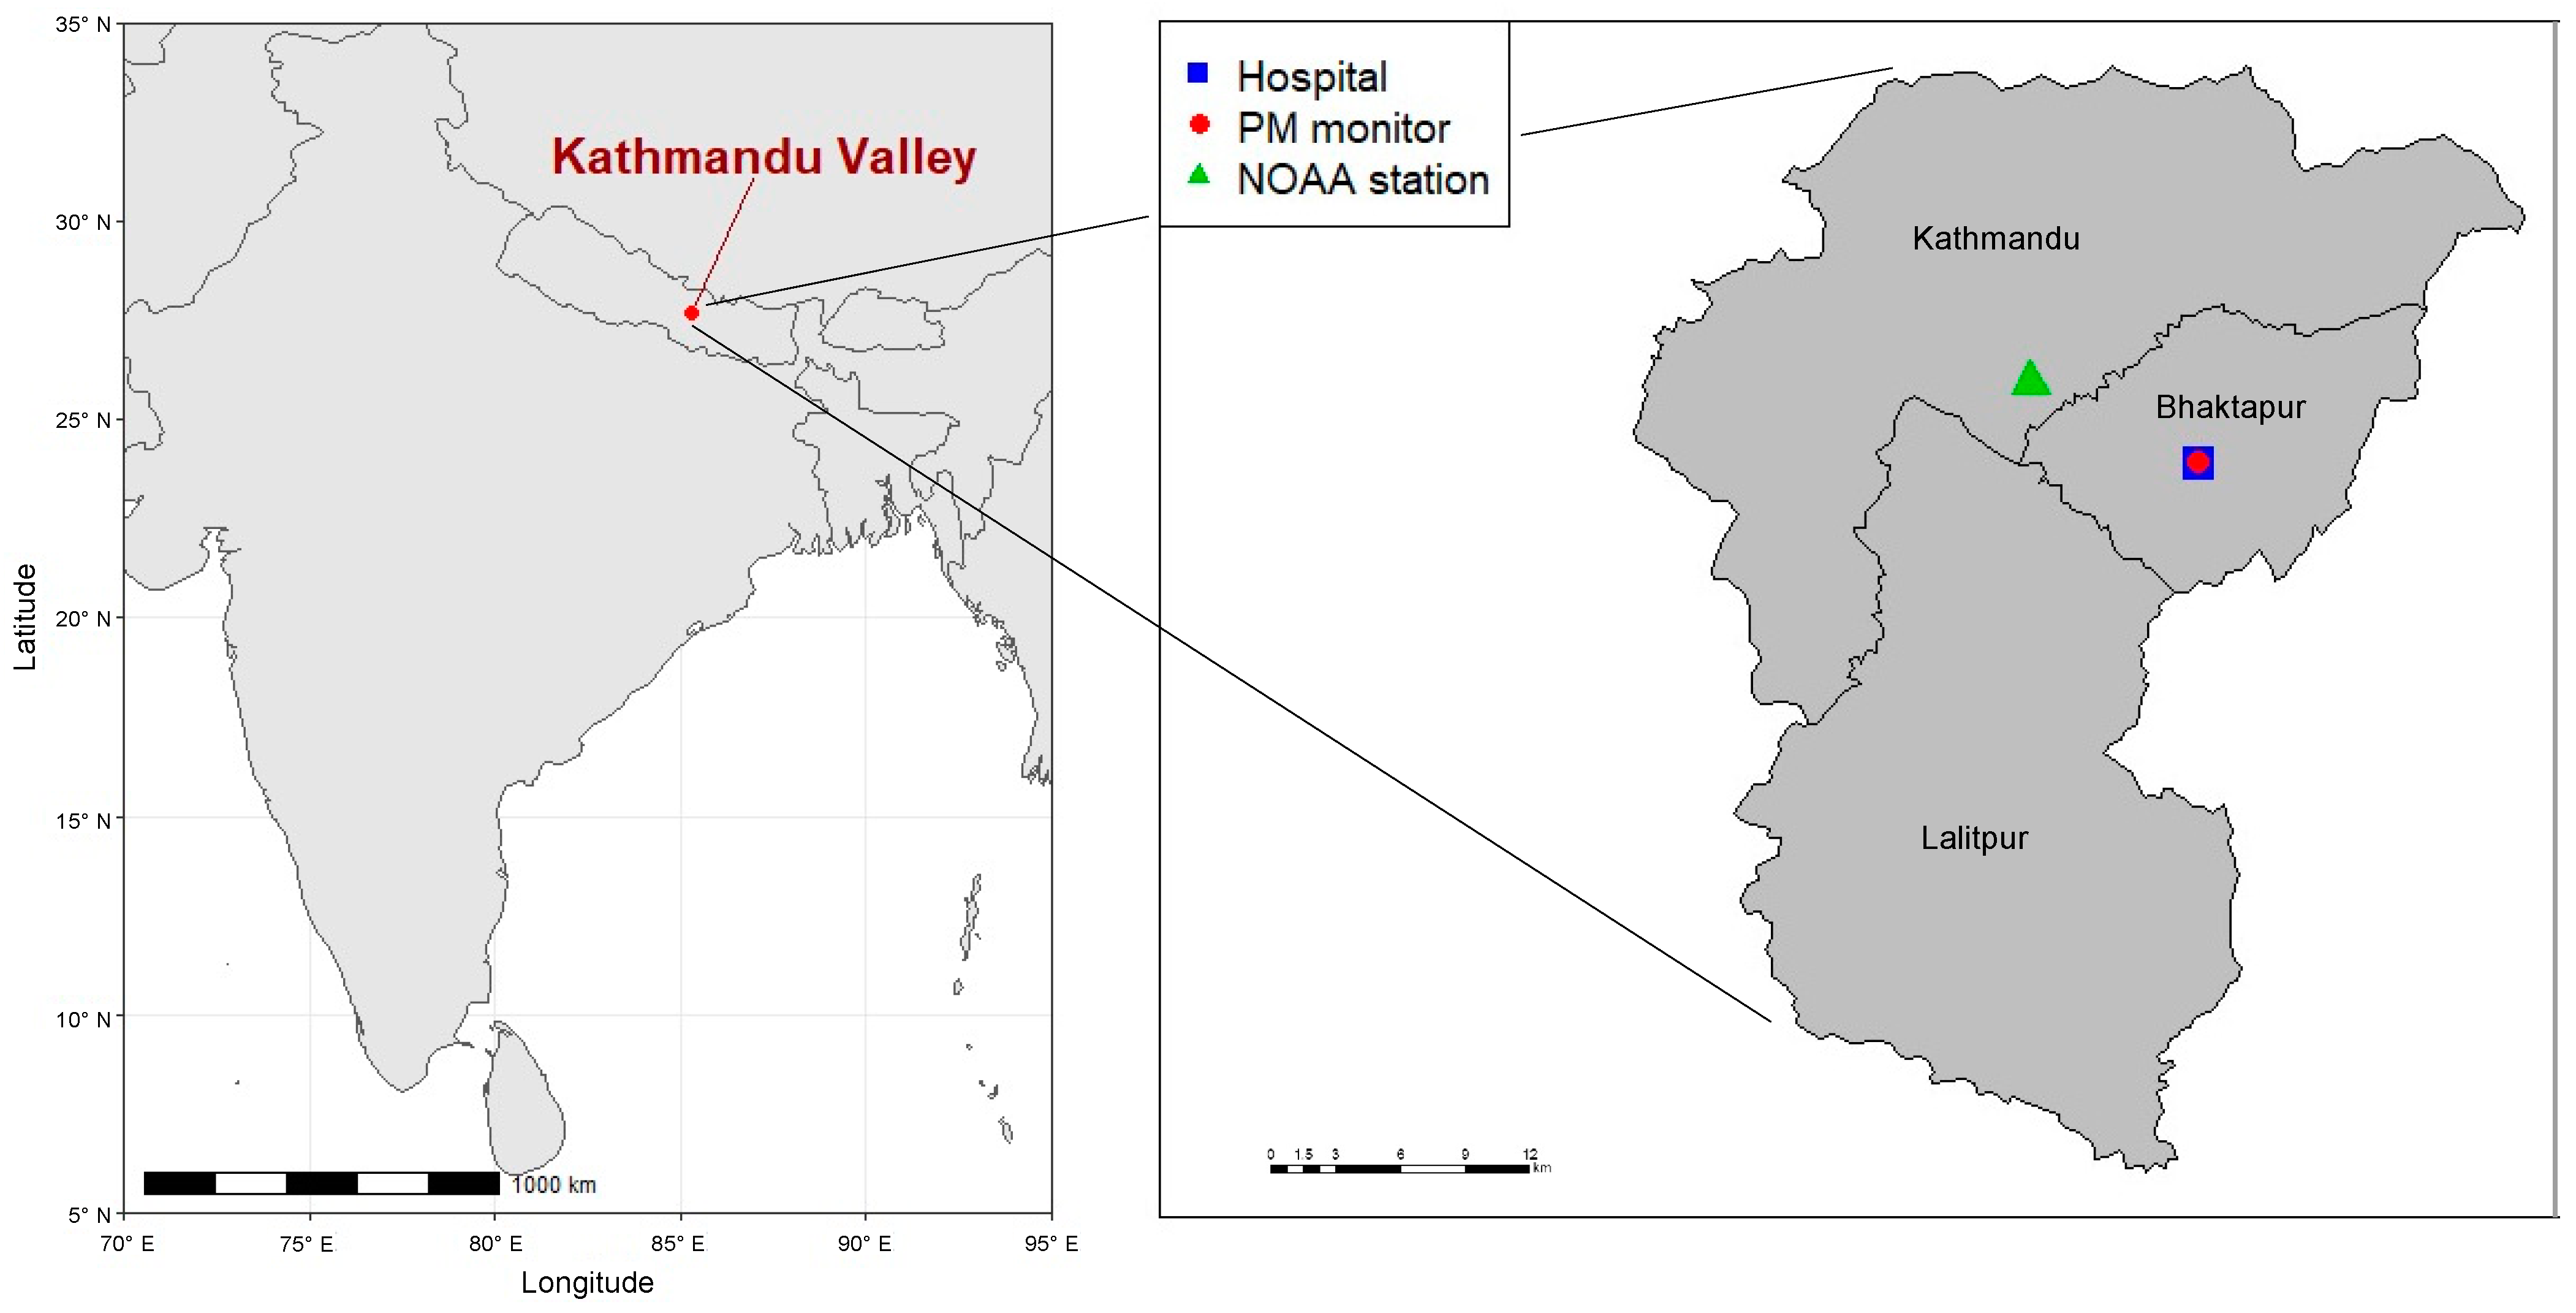
2.1. Study Site

The study location is in Bhaktapur district, one of the three districts that makes up Kathmandu Valley (Figure 1). This area is a mixture of urban and rural areas. Outdoor air pollution comes from multiple sources, such as the burning of biomass fuel in homes, moderate traffic on the nearest roads, and brick kilns on the outskirts of the city [13].

2.2. Study Design

Data on health outcomes and exposure were available from 13 February 2014 to 12 February 2015. PM2.5 data after our study period cannot be investigated since they contain lots of missing periods due to the April 2015 Nepal earthquake.
We employed a time-stratified case-crossover (TSCCO) study design to estimate the short-term associations between daily PM2.5 and ARI admissions [14,15,16]. The method is commonly used in epidemiological studies of air pollution and health [17,18,19]. Briefly, with this method, each patient serves as his/her own control, and the exposure level on the day of hospitalization (or a few days before) is compared to the exposure level on the same days of the week within the same month of hospitalization. Since control periods are derived from the same individual, the method accounts for unmeasured variables that remain constant over the study period. Seasonality is adjusted for by design using calendar months as time strata [20,21].

2.3. Data Collection

We collected the data on hospital admissions due to ARI retrospectively from the clinicians’ discharge summary and laboratory records at Siddhi Memorial Hospital. Inclusion criteria for study subjects were children under 10 years of age (n = 258), which is the recommended age range for weight-for-age categorization [22]. Those children were included who were living in Bhaktapur district and admitted to the pediatric ward with symptomatic diagnosis of ARI by clinicians. A total of 258 ARI-related hospital admissions were extracted from 1415 all-cause hospital admissions after excluding patients from other districts (n = 162) or diagnosed with other diseases (n = 984), and ineligible subjects for stratified analysis (n = 11, i.e., no-weight data (n = 2), outliers of z-score (n = 4) and above 10 years old (n = 5); Figure S1).
For each study subject, we extracted the weight and age in months, and calculated the Z-score for weight-for-age (WFA) based on this information (Epi Info Ver 7.2, CDC). The WFA represents the deviation from optimal growth by body mass in relation to chronological age, which reflects the long-term health and nutritional experience of an individual up to 10 years old [22,23]. Standard Z-score cut-off points of ±2 standard deviation (SD) were applied to classify weight into three categories—underweight (Z-score ≤ −2), normal weight (−2 < Z-score < 2), and overweight (Z-score ≥ 2). Subjects with a Z-score below −6 or above +5 (n = 4) were also excluded as those results were likely due to mismeasurement [24].
We obtained daily data on PM2.5 from the study of Nepal Health Research Council (NHRC) [25]. Ambient concentrations of PM2.5 and temperature were measured at 15-min intervals using a PM monitor (E-SAMPLER by Met One Instruments, Inc., Grants Pass, OR, U.S.A.) located on the rooftop of the hospital from where we collected the health outcome data. Daily means of ambient PM2.5 and temperature were calculated from 15-min interval data. The proportion of missing values was less than 0.1% for the two variables. Instead of relative humidity, daily data of dewpoint temperature (absolute humidity) were obtained from the NOAA station at the nearest airport.

2.4. Statistical Analysis

A conditional Poisson regression with a scale parameter for overdispersion (quasi-Poisson link function) was used to estimate the relative risk (RR) of ARI hospital admission and the 95% confidence interval (CI) for a 10 µg/m3 increase in the ambient concentration of PM2.5 [26]. First, we assumed a linear relationship between PM2.5 and ARI admissions and examined the attenuation of the association using a single-pollutant single-lag model for exposure on the same day until one week before hospitalization (lag 0 to lag 6), as well as cumulatively using the average of lags covering multiple days (lag 01 to lag 06). Our preliminary analysis suggested an association between lags 0 and 1. Based on this, we restricted all subsequent analyses to these lag days and reported results for lag 0, lag 1, and lag 01. All estimations were adjusted for potential the confounding effect of temperature [27,28] by including the previous two weeks of temperature lags using a natural cubic spline with three degrees of freedom based on the results from preliminary analysis and the possible length of lags from previous studies [29,30,31]. To examine if weight status moderated the PM2.5-ARI association, we performed stratified analyses for the three WFA categories described above.
We performed additional analyses to check the sensitivity by extending the length of temperature adjustment, by additional adjustment for dewpoint temperature, and by assessing the nonlinear association. All statistical analyses were conducted using statistical software R, version 3.6.0 (R Core Team, 2019).

3. Results

3.1. Descriptive Summary

The characteristics of 258 subjects are summarized in Table 1. The majority were male, five years old or younger, and had a normal weight.
Summary statistics are presented in Table 2. ARI admissions during the study period occurred in 171 days (46.8%) while there were no ARI admissions on the remaining 194 days (53.2%). The proportion of holidays (85, i.e., 27 national holidays and 58 Saturdays) to zero-admission days (24.2%) was slightly higher than that of non-zero-admission days (22.2%).

3.2. Main Results

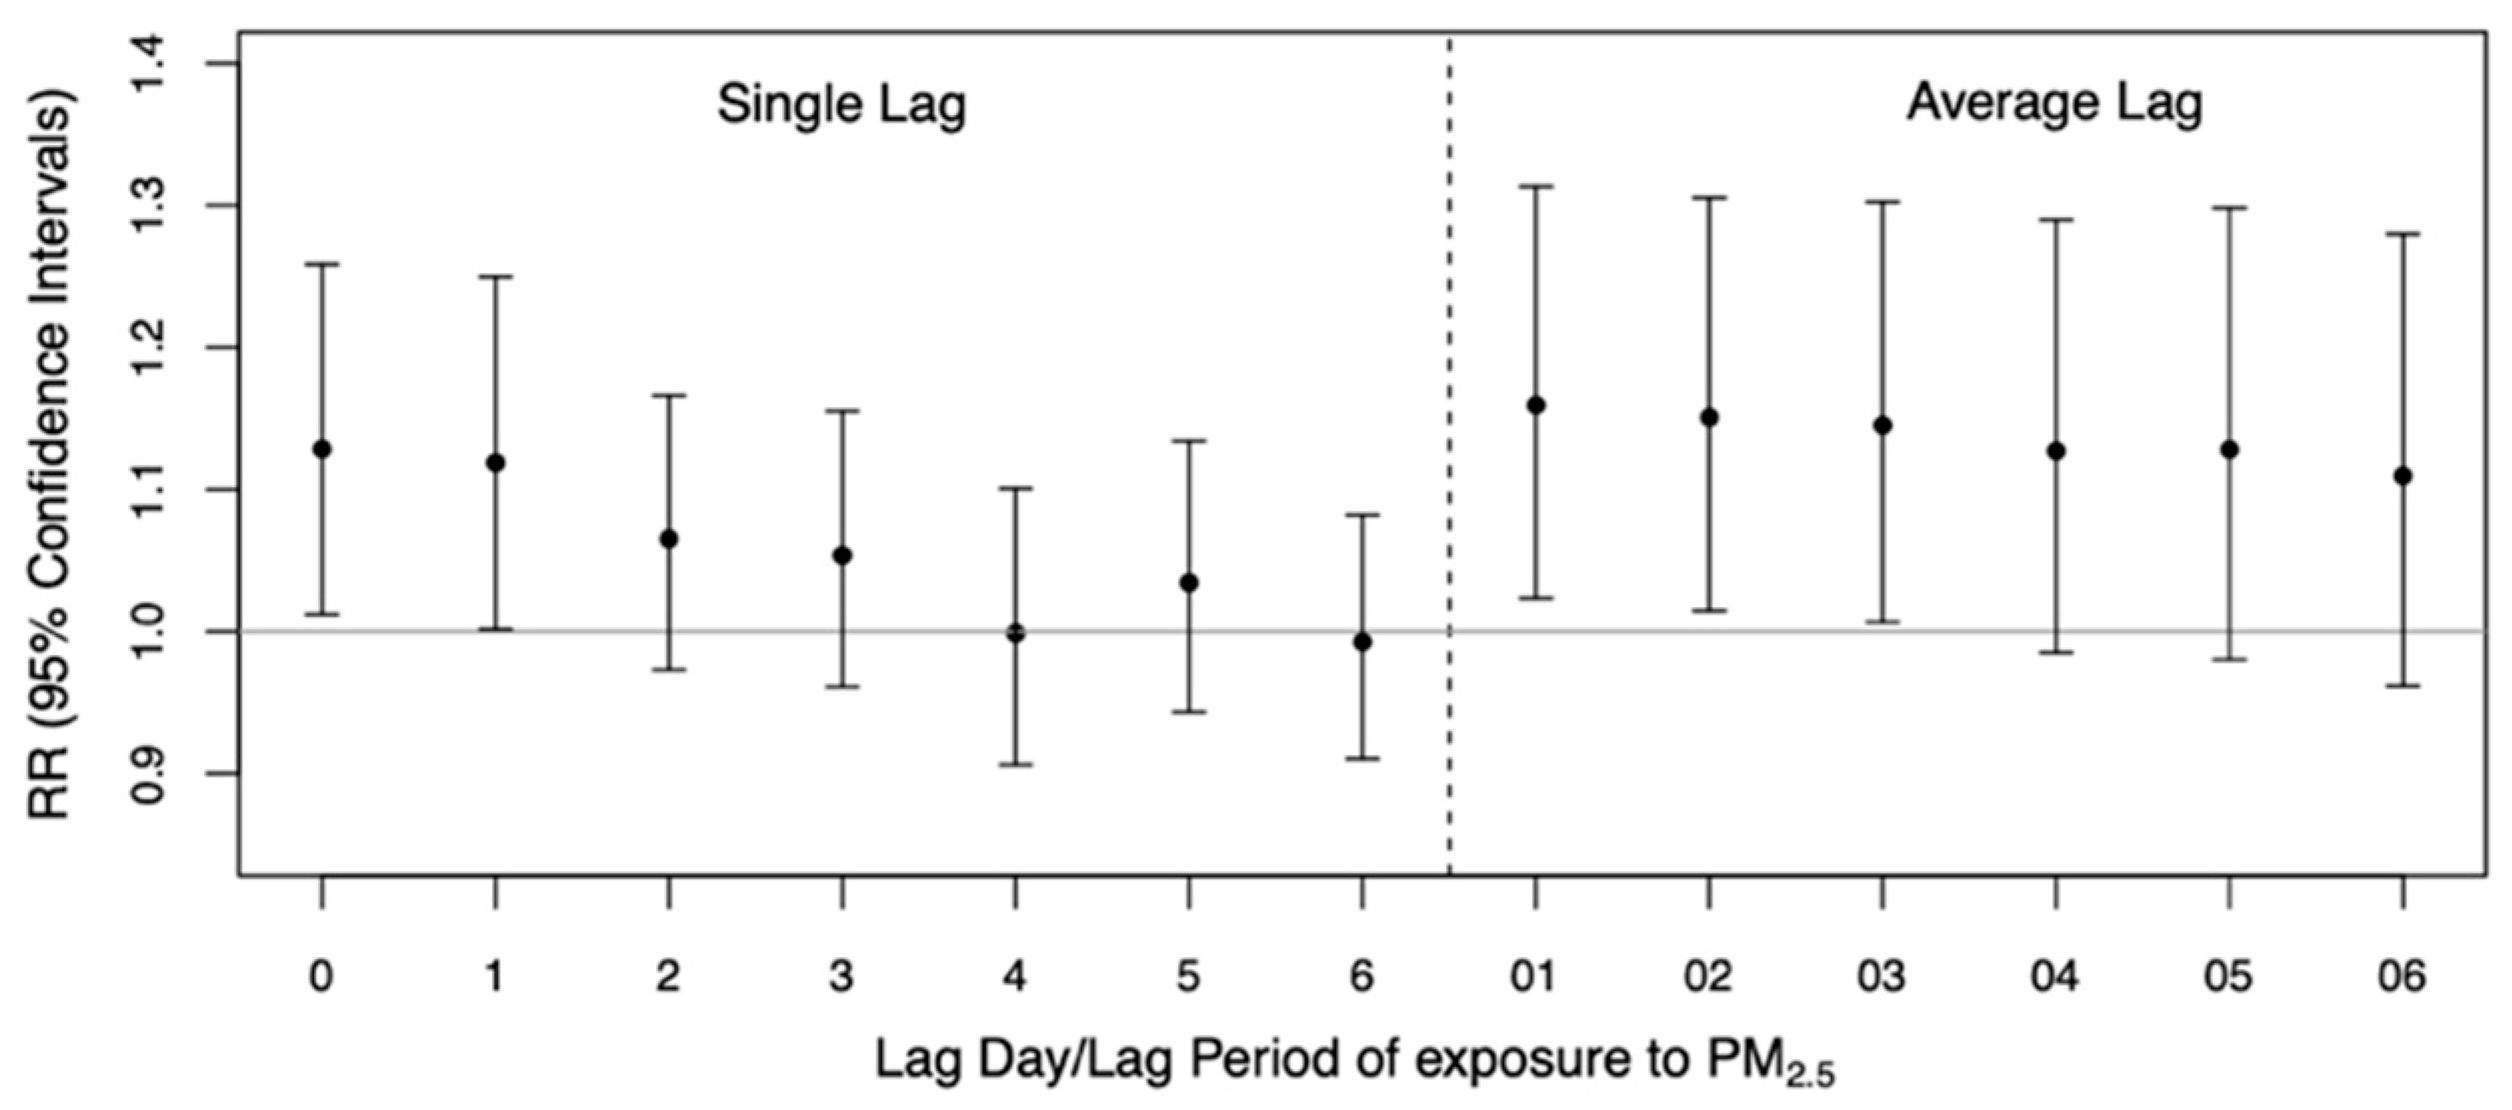
3.2.1. Results for All ARI Admissions

Figure 2 shows the estimates of RR and 95% CI for single and multi-day lags up to one week. There was evidence of associations between PM2.5 and ARI admissions at lag 0 (RR: 1.13; 95% CI: 1.01–1.26) and lag 1 (RR: 1.12; 95% CI: 1.00–1.25). The estimated association attenuated after lag 1. The largest cumulative estimate for multi-day exposure was observed at lag 01 for the average concentration of PM2.5 on the current and the previous day (RR: 1.16; 95% CI: 1.02–1.31).

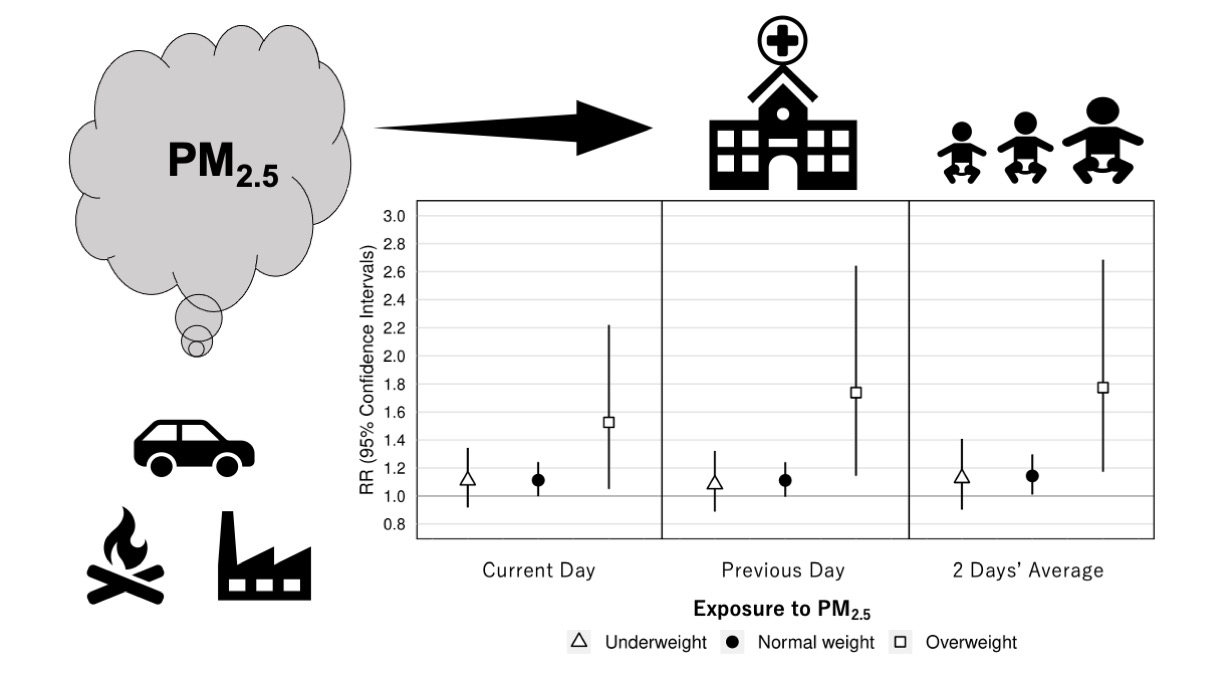
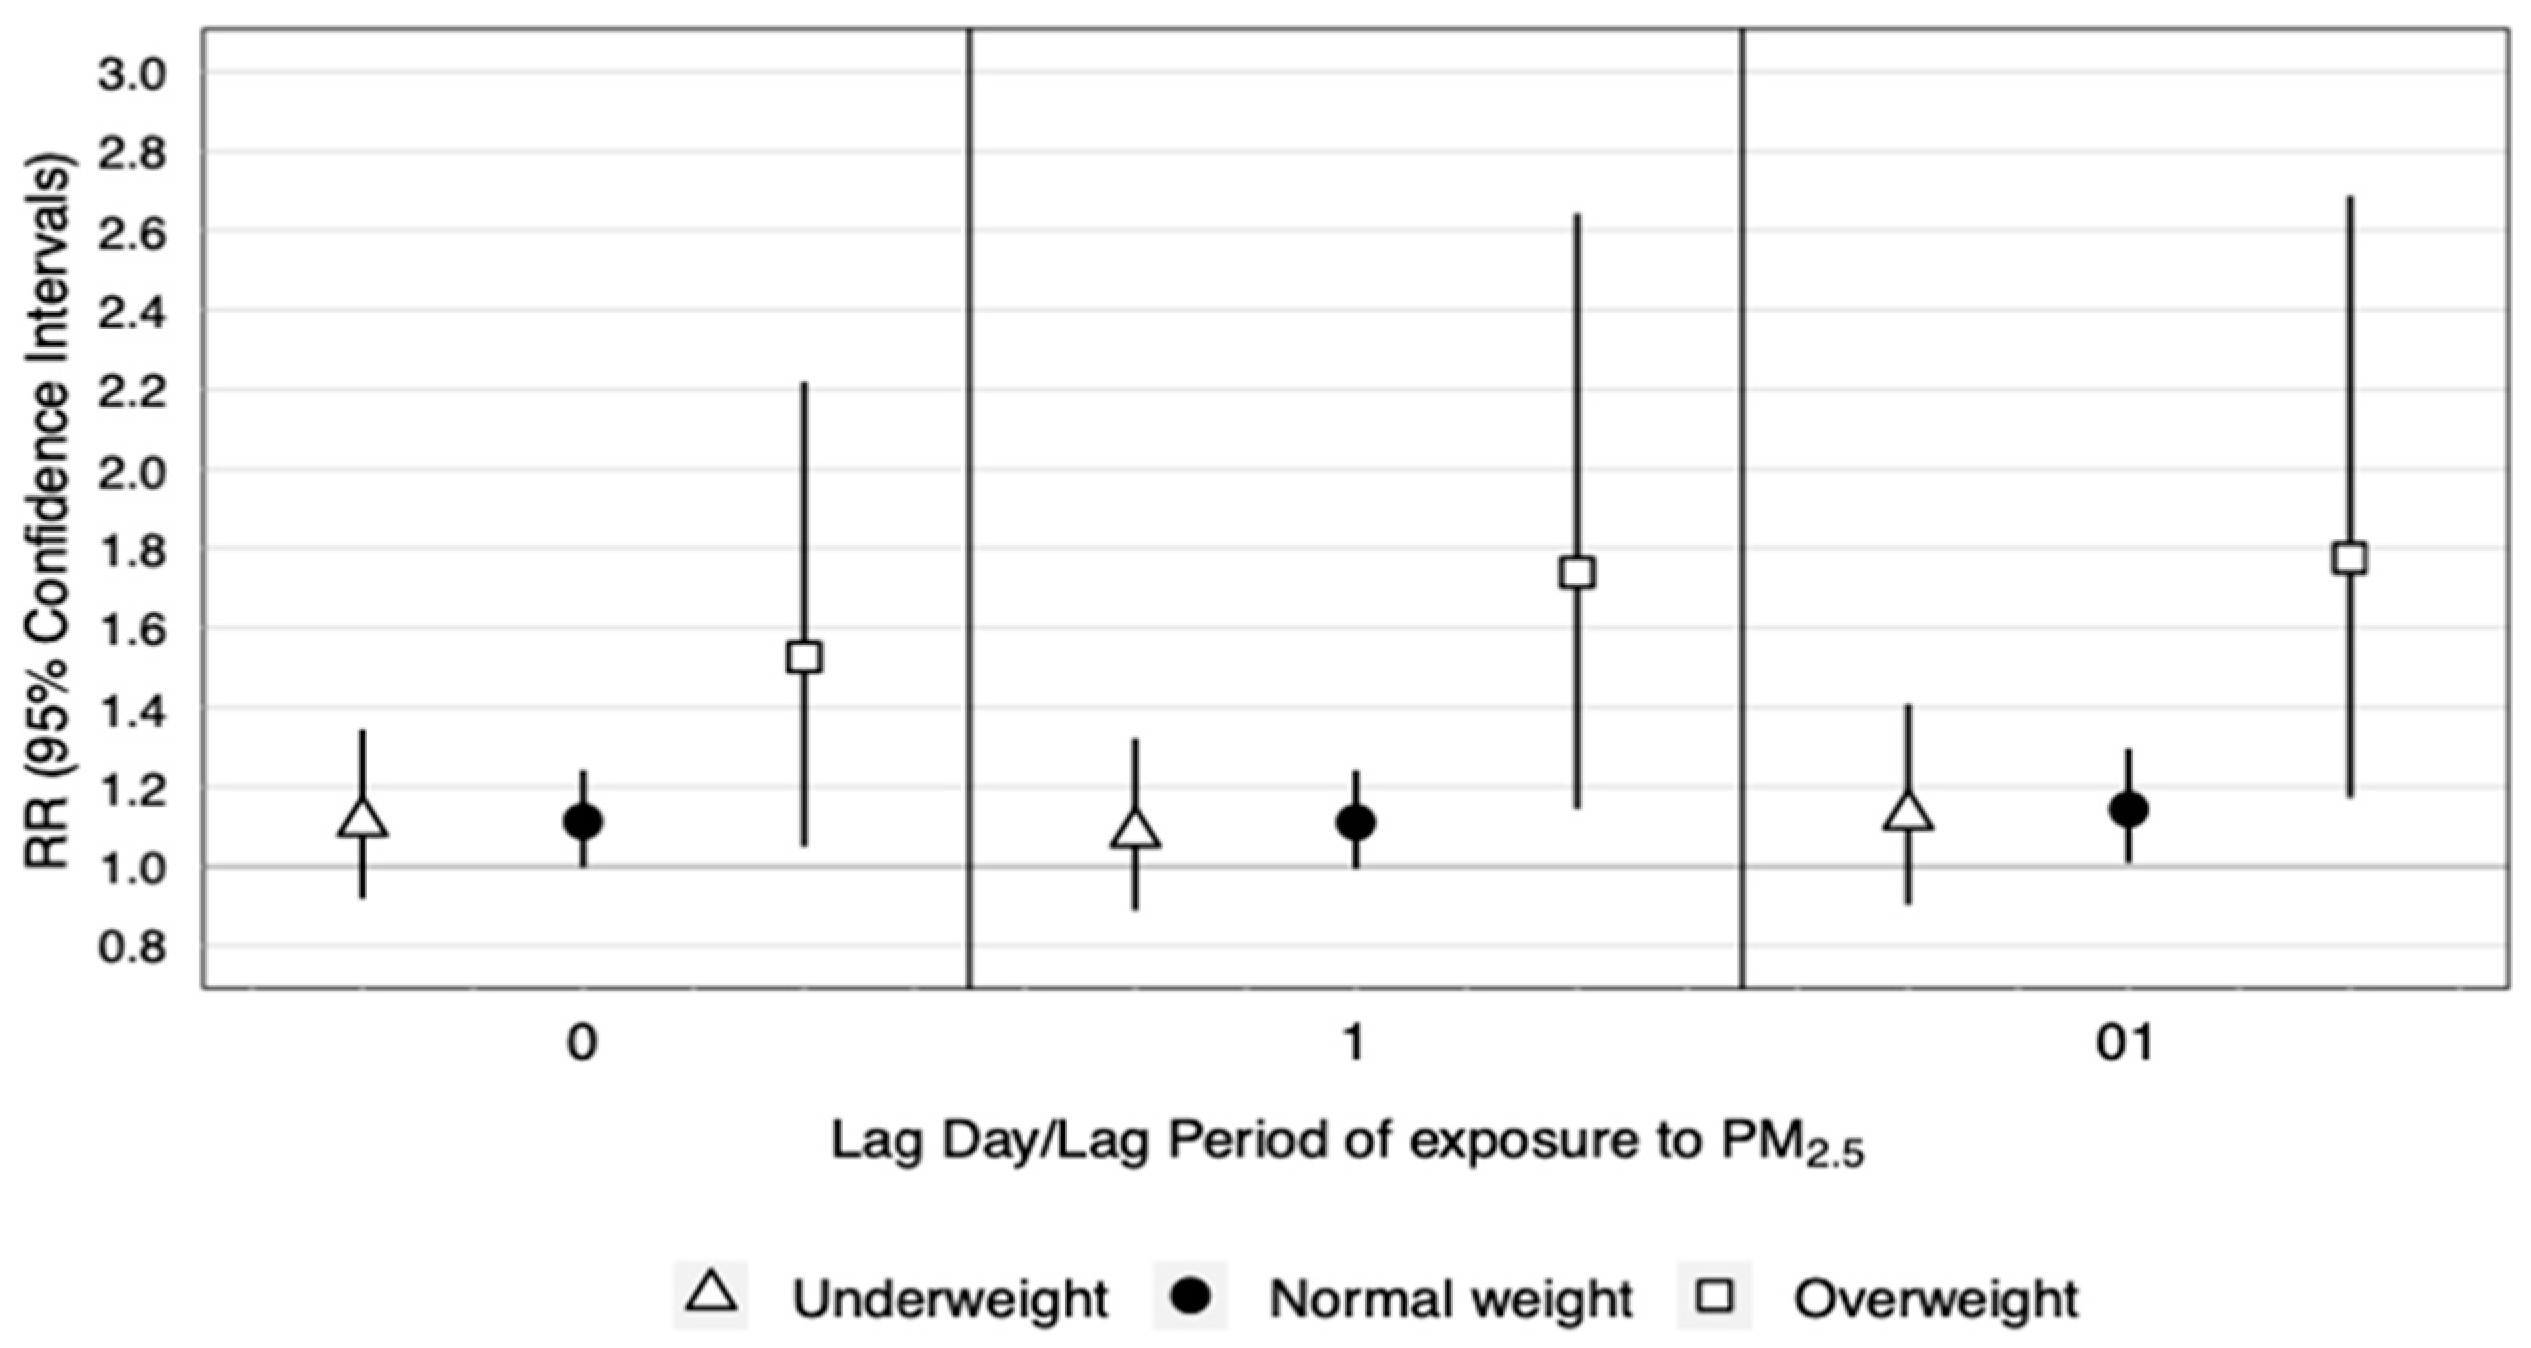
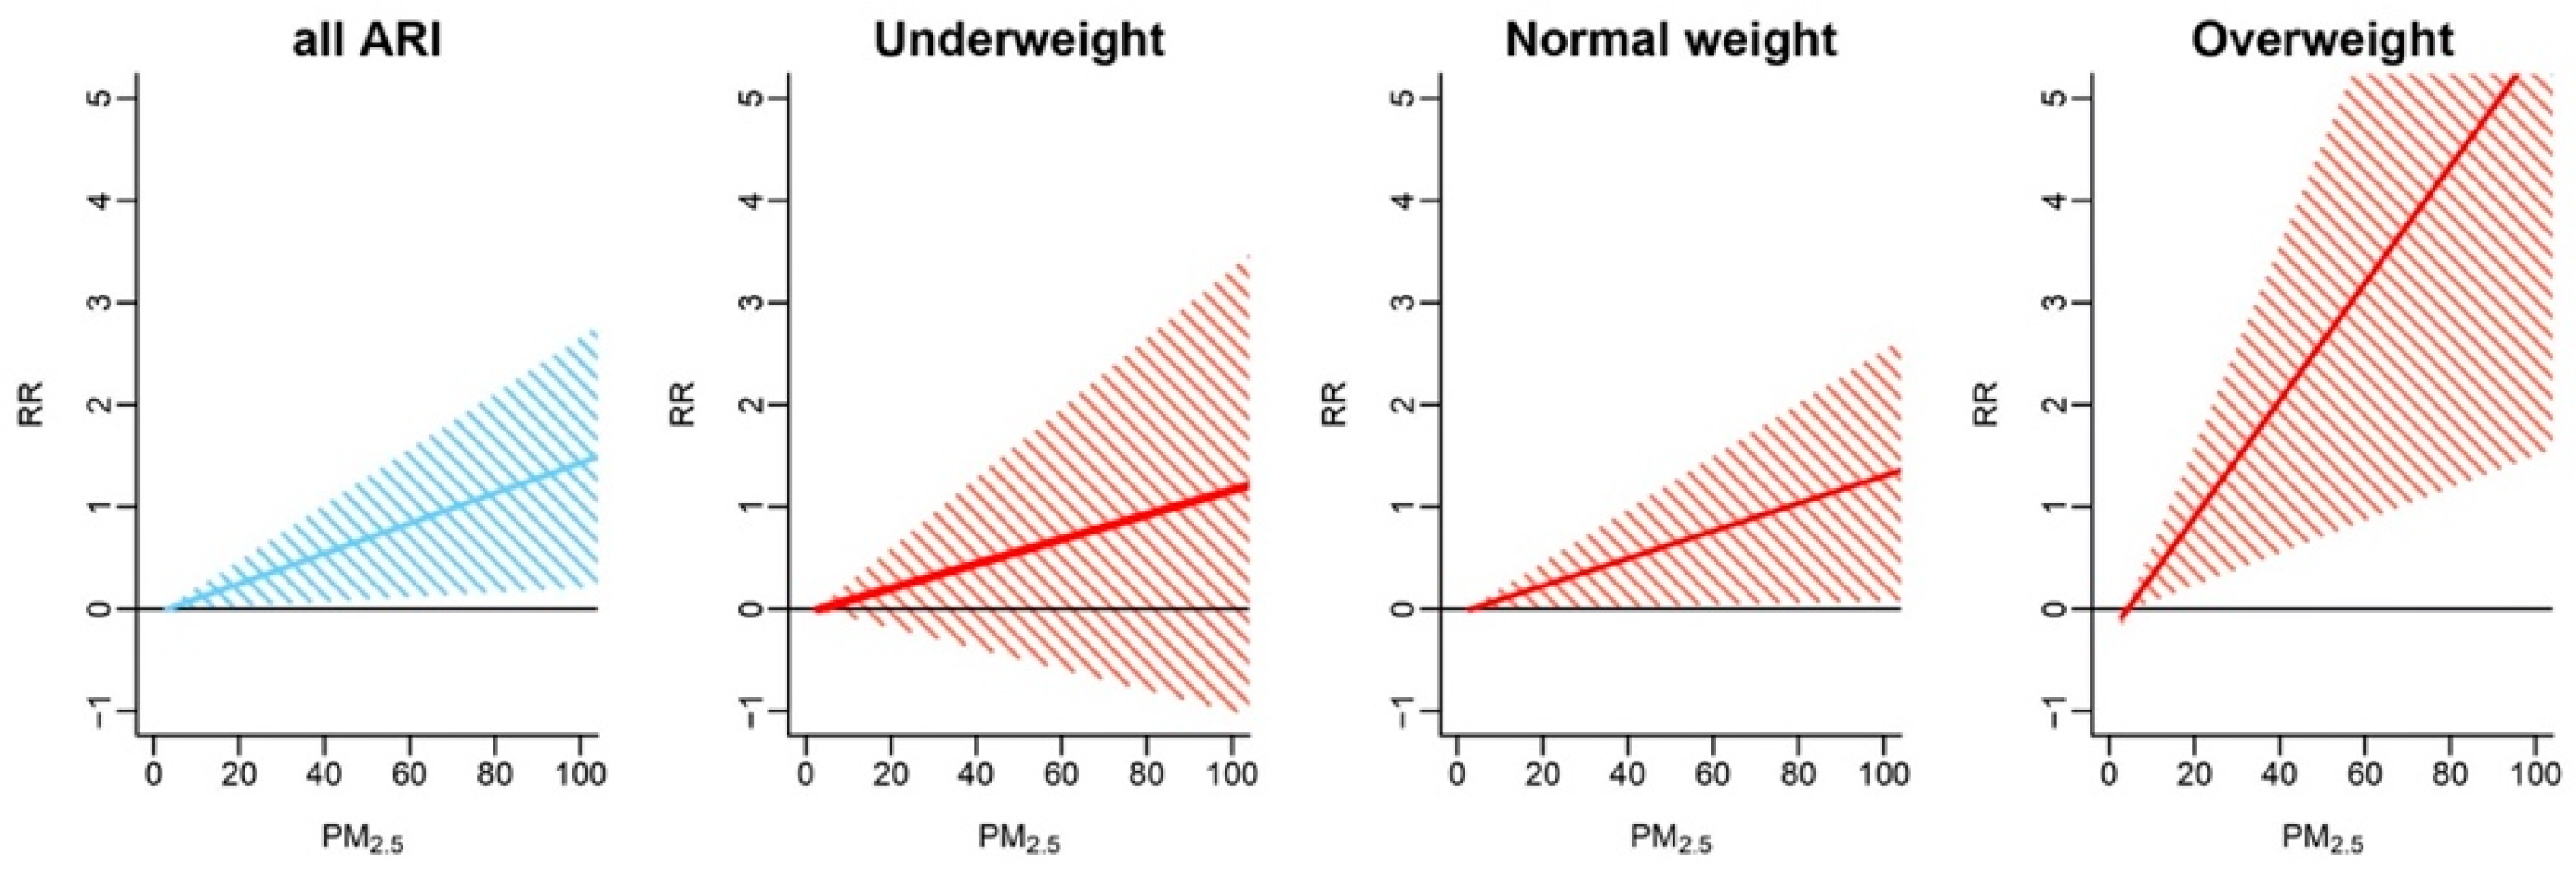
3.2.2. Results by Weight Status

Figure 3 shows the estimates by weight status at lags 0 and 1 and their average denoted by lag 01. There was no evidence of an association in the underweight group. In the normal weight group, an association was observed for average lag 01 (RR: 1.14; 95% CI: 1.01–1.30). The strongest evidence was observed in the overweight group at all lag specifications—lag 0 with RR = 1.53 (95% CI: 1.05–2.22), lag 1 with RR = 1.74 (95% CI: 1.14–2.64), and lag 01 with RR = 1.77 (95% CI: 1.17–2.69). The RR and 95% CI for each weight group are reported in Table S1. The overall and weight group-specific CRFs are illustrated in Figure 4. The slopes for all ARI in the normal weight and overweight groups are positive and above zero, with the latter being the steepest.
We assessed the sensitivity of our results. Extending the duration of adjustment for temperature up to four weeks did not affect the effect estimates. Associations did not change when additional adjustment was made for dewpoint temperature. To check for a possible nonlinear association, we expressed the main exposure in the form of a natural cubic spline with five degrees of freedom, but found no evidence supporting non-linear concentration-response functions (CRFs; difference of Akaike Information Criterion between the linear and non-linear model = 0.6, Figure S2).

4. Discussion

We investigated the short-term association between ambient PM2.5 and daily ARI hospital admissions among children under 10 years old in Bhaktapur district, Nepal. We observed evidence of associations on the day of hospital admission and one day before (i.e., lag 0 and lag 1). Our study suggests a relative risk of ARI hospital admission among the children of 1.16 (95% CI: 1.02–1.31) for an average of a 10 μg/m3 increase in the concentration of PM2.5 on the same and preceding days. The weight status among study subjects was slightly higher than national statistics, which might be due to the socioeconomic gap between urban-rural regions within the country. Further analysis by stratification suggested that the overweight children might be more susceptible to the respiratory health effects of PM2.5 than children in the normal weight or underweight categories. The risk estimate for the overweight group at lag 01 was higher than the other two groups, while the estimates for the normal weight and underweight groups were closer to the non-stratified estimates for all-ARI cases. Our study underscores the importance of elucidating heterogeneity in the short-term health effects of PM2.5, especially in the LMICs where children often suffer from multiple disease burdens. Nevertheless, further studies with a longer time-series and larger sample size, which may involve multiple hospitals or locations, are needed to corroborate our results.
In Nepal, NHRC [25] firstly collected year-round PM2.5 data and demonstrated a descriptive analysis of air quality and the health burden, with combined data from 13 major hospitals in the region. However, the estimated health risk, especially for children in highly polluted areas of the country, remains unclear. Therefore, this study used a different approach to confirm the possibly high health burden attributable to a higher level of ambient PM2.5 in the region.
In Asia, the annual average concentrations of PM2.5 in both urban and rural areas were estimated to be higher than those in North America or Europe [32]. However, limited evidence is available on the health impact of PM2.5 in these locations due to the lack of measurement of the PM2.5 concentration. Furthermore, the estimates from the previous assessments vary between locations and age groups [32,33]. For example, in Jinan, China, a comparable study [34] reported a 0.22% increase of respiratory hospital admissions among children aged 0–17 years per 10 μg/m3 increase in daily PM2.5 levels in the same lag period (average lag 01) with our study. Liu et al. used eight local hospitals’ data of 40,172 admissions due to respiratory diseases categorized into upper infection, pneumonia, and acute bronchitis based on the ICD-10 code (International Classifications of Diseases, 10th Revision). The reason why the risk estimates were higher in our study might be attributable to differences of emission sources or chemical composition, and the basic health status of the population. On the other hand, two studies in North America where the annual mean concentration level of PM2.5 was about half of that in our study area found no increased risk of hospitalization for bronchiolitis in infants [35,36].
For overweight children, increased susceptibility to the pulmonary effects of indoor PM2.5 was previously reported by an observational prospective-cohort study, which investigated indoor air pollutants among urban minority children with asthma in Baltimore, U.S.A. [37]. Lu et al. followed 148 children aged 5–17 years with persistent asthma for a year while associations between the indoor PM2.5 level and respiratory symptoms were assessed every three months. As with our study finding higher risk estimates in the overweight group, they found that overweight or obese children had more symptoms associated with indoor PM2.5 exposure than normal weight children. Two possible mechanisms of excess weight conferring susceptibility have been suggested. First, as substantial evidence reported that air pollution exposure results in increased oxidative stress, which could mediate allergic disorders [38,39], being overweight may also be associated with an underlying state of oxidative stress and inflammation, which potentially reduces the antioxidant defenses of overweight individuals [40,41]. Second, lower-airway exposure to a given airborne particle is greater in overweight than normal weight children since overweight or obese children may have greater pulmonary deposition [37,42,43,44], which might be due to s higher breathing frequency, as observed in an experiment on mice [44]. From these perspectives, weight reduction or adequate nutritional management for children might have the possibility of reducing their susceptibility to adverse respiratory health effects from the exposure to ambient air pollution.
While the current study did not find any evidence supporting a risk difference between the under- and normal-weight groups, more investigation is needed given the small number of cases. Some studies have suggested that underweight children might present a vulnerable and/or susceptible sub-population in terms of their possible lower health status or immunity level. They may also have a lower socioeconomic status or poor living conditions with potential exposure to higher environmental risks [45].
There are a few limitations worth noting. In relation to the small number of daily admissions, our findings require further investigation with more samples and a longer period, as discussed. We obtained PM2.5 data from a single monitoring station and used single-pollutant models to estimate the health effects without adjusting for other air pollutants because other monitoring station or other air pollutant data were not available in the district. Multi-pollutant models would be helpful to rule out the possibility of influences of other air pollutants on the observed associations. The hospital admission for ARI in the current study was based on a clinical diagnosis not validated by pathogen information. Hence, the ARI admissions might potentially include other diagnoses, ones not categorized into a standard disease classification such as the ICD-10.

5. Conclusions

An ambient level of PM2.5 in Bhaktapur, Nepal was associated with daily hospital admissions for ARI among children aged 10 years and below. We observed a higher risk among the overweight children who were likely to be more susceptible to the health effects of PM2.5. Our findings suggest more investigations in different populations are necessary to understand the heterogenous effects of PM2.5 among children with different weight statuses. Studies are also needed to identify the specific chemical components and emission sources that may be harmful to the subgroup in the region.

Supplementary Materials

The following are available online at https://www.mdpi.com/article/10.3390/atmos12081009/s1, Figure S1: Inclusion and exclusion criteria of ARI admissions for the study, Figure S2: Linier and non-linear forms of concentration-response functions (CRFs) (difference of Akaike Information Criterion between the linear and non-linear model = 0.6), Figure S3: Time-series plot of PM2.5 and ARI hospital admissions, Table S1: The relative risks (RR) and 95% Confidence Intervals (CI) for all ARI admissions and each weight group (Underweight, Normal Weight, Overweight).

Author Contributions

Conceptualization, H.N.; methodology, C.F.S.N.; software, C.F.S.N.; validation, C.F.S.N.; formal analysis, H.N. and C.F.S.N.; investigation, H.N.; resources, B.G.D., D.P., A.K.P., S.C.V., D.S. and G.B.R.; data curation, B.G.D., D.P., A.K.P., S.C.V., D.S. and G.B.R.; writing—original draft preparation, H.N.; writing—review and editing, C.F.S.N., L.M., X.T.S. and M.H.; visualization, H.N.; supervision, C.F.S.N., B.G.D. and M.H.; project administration, M.H.; funding acquisition, H.N. and M.H. All authors have read and agreed to the published version of the manuscript.

Funding

This research was partially supported by the Japan Student Services Organization (JASSO) for Student Exchange Support Program (Scholarship for Short-term study abroad) organized by Nagasaki University (Registrant No. HTB1817301008001).

Institutional Review Board Statement

Ethical approvals for the study were obtained from the Nepal Health Research Council (Ref. No. 771) and the Institutional Review Board of the School of Tropical Medicine and Global Health, Nagasaki University (Ref. No. 56).

Informed Consent Statement

Patient consent was waived since clinical data were retrospectively retrieved from discharge sheets and laboratory records without obtaining informed consent from each inpatient of the hospital. Research information has been posted on the notification board of the hospital from 28 October 2018 to secure the opportunity for opt-out from the study participants instead of obtaining Informed Consent directly. Research information contained key information of the study such as the purpose and procedure of using clinical data, health information to be used in the study, the scope of the data, name of a principal investigator who is responsible for data management, the procedure for rejecting participation, and contact information.

Data Availability Statement

Not applicable.

Acknowledgments

We appreciate our colleagues at Siddhi Memorial Hospital and LEADERS Nepal for providing technical support and advice on data handling.

Conflicts of Interest

The authors declare no conflict of interest.

References

  1. WHO. Air Quality Guidelines for Particulate Matter, Ozone, Nitrogen Dioxide and Sulfur Dioxide—Global Update 2005; World Health Organization: Geneva, Switzerland, 2006. [Google Scholar]
  2. Gurung, A.; Bell, M.L. The state of scientific evidence on air pollution and human health in Nepal. Environ. Res. 2013, 124, 54–64. [Google Scholar] [CrossRef] [PubMed]
  3. Dominici, F.; Peng, R.D.; Bell, M.; Pham, L.; McDermott, A.; Zeger, S.L.; Samet, J.M. Fine particulate air pollution and hospital admission for cardiovascular and respiratory diseases. JAMA 2006, 295, 1127–1134. [Google Scholar] [CrossRef] [PubMed] [Green Version]
  4. Peters, A.; Dockery, D.; Muller, J.E.; Mittleman, M. Increased particulate air pollution and the triggering of myocardial infarction. Circulation 2001, 103, 2810–2815. [Google Scholar] [CrossRef] [PubMed] [Green Version]
  5. Pope, C.A.; Muhlestein, J.B.; May, H.T.; Renlund, D.G.; Anderson, J.L.; Horne, B.D. Ischemic heart disease events triggered by short-term exposure to fine particulate air pollution. Circulation 2006, 114, 2443–2448. [Google Scholar] [CrossRef] [Green Version]
  6. Gurung, A.; Bell, M.L. Exposure to airborne particulate matter in Kathmandu Valley, Nepal. J. Expo. Sci. Environ. Epidemiol. 2012, 22, 235–242. [Google Scholar] [CrossRef]
  7. UNEP. Young and Old, Air Pollution Affects the Most Vulnerable; UN Environment Programme: Nairobi, Kenya, 2018; Available online: www.unenvironment.org/news-and-stories/blogpost/young-and-old-air-pollution-affects-most-vulnerable (accessed on 4 August 2021).
  8. WHO. World Health Statistics 2015; World Health Organization: Geneva, Switzerland, 2015. [Google Scholar]
  9. Nascimento, A.P.; Santos, J.M.; Mill, J.G.; de Souza, J.B.; Reis, N.C.J.; Reisen, V.A. Association between the concentration of fine particles in the atmosphere and acute respiratory diseases in children. Rev. Saúde Pública 2017, 51, 3. [Google Scholar] [CrossRef] [Green Version]
  10. Horne, B.D.; Joy, E.A.; Hofmann, M.G.; Gesteland, P.H.; Cannon, J.B.; Lefler, J.; Blagev, D.P.; Korgenski, E.K.; Torosyan, N.; Hansen, G.I.; et al. Short-term elevation of fine particulate matter air pollution and acute lower respiratory infection. Am. J. Respir. Crit. Care Med. 2018, 198, 759–766. [Google Scholar] [CrossRef]
  11. IHME. GBD Country Profile Compare—Nepal; Institute for Health Metrics and Evaluation: Seattle, WA, USA, 2017; Available online: www.healthdata.org/nepal (accessed on 4 August 2021).
  12. Ministry of Health, Nepal; New ERA; ICF. Nepal Demographic and Health Survey 2016; Ministry of Health, Nepal: Kathmandu, Nepal, 2017.
  13. Bates, M.N.; Chandyo, R.K.; Valentiner-Branth, P.; Pokhrel, A.K.; Mathisen, M.; Basnet, S.; Shrestha, P.S.; Strand, T.A.; Smith, K.R. Acute lower respiratory infection in childhood and household fuel use in Bhaktapur, Nepal. Environ. Health Perspect. 2013, 121, 637–642. [Google Scholar] [CrossRef] [Green Version]
  14. Levy, D.; Lumley, T.; Sheppard, L.; Kaufman, J.; Checkoway, H. Referent selection in case-crossover analyses of acute health effects of air pollution. Epidemiology 2001, 12, 186–192. [Google Scholar] [CrossRef]
  15. Lumley, T.; Levy, D. Bias in the case-crossover design: Implications for studies of air pollution. Environmetrics 2000, 11, 689–704. [Google Scholar] [CrossRef]
  16. Carracedo-Martínez, E.; Taracido, M.; Tobías, A.; Saez, M.; Figueiras, A. Case-crossover analysis of air pollution health effects: A systematic review of methodology and application. Environ. Health Perspect. 2010, 118, 1173–1182. [Google Scholar] [CrossRef]
  17. Levy, D.; Sheppard, L.; Checkoway, H.; Kaufman, J.; Lumley, T.; Koenig, J.; Siscovick, D. A case-crossover analysis of particulate matter air pollution and out-of-hospital primary cardiac arrest. Epidemiology 2001, 12, 193–199. [Google Scholar] [CrossRef]
  18. Schwartz, J. The effects of particulate air pollution on daily deaths: A multi-city case crossover analysis. Occup. Environ. Med. 2004, 61, 956–961. [Google Scholar] [CrossRef] [Green Version]
  19. Szyszkowicz, M.; Kousha, T.; Castner, J. Air pollution and emergency department visits for conjunctivitis: A case-crossover study. Int. J. Occup. Med. Environ. Health 2016, 29, 381–393. [Google Scholar] [CrossRef]
  20. Maclure, M. The case-crossover design: A method for studying transient effects on the risk of acute events. Am. J. Epidemiol. 1991, 133, 144–153. [Google Scholar] [CrossRef]
  21. Janes, H.; Sheppard, L.; Lumley, T. Case-crossover analyses of air pollution exposure data: Referent selection strategies and their implications for bias. Epidemiology 2005, 16, 717–726. [Google Scholar] [CrossRef]
  22. WHO. Growth Reference Data for 5–19 Years; World Health Organization: Geneva, Switzerland, 2007; Available online: www.who.int/growthref/en/ (accessed on 4 August 2021).
  23. WHO Multicentre Growth Reference Study Group. WHO Child Growth Standards: Length/Height-for-Age, Weight-for-Age, Weight-for-Length, Weight-for-Height and Body Mass Index-for-Age: Methods and Development; World Health Organization: Geneva, Switzerland, 2006. [Google Scholar]
  24. Mei, Z.G.; Grummer-Strawn, L.M. Standard deviation of anthropometric Z-scores as a data quality assessment tool using the 2006 WHO growth standards: A cross country analysis. Bull. World Health Organ. 2007, 85, 441–448. [Google Scholar] [CrossRef]
  25. Karki, K.B.; Dhakal, P.; Shrestha, S.L.; Joshi, H.D.; Aryal, K.K.; Poudyal, A.; Puri, S.; Verma, S.C.; Pokhrel, A.; Lohani, G.R.; et al. Situation Analysis of Ambient Air Pollution and Respiratory Effects in Kathmandu Valley, 2015; Nepal Health Research Council: Kathmandu, Nepal, 2016. [Google Scholar]
  26. Armstrong, B.G.; Gasparrini, A.; Tobías, A. Conditional Poisson models: A flexible alternative to conditional logistic case cross-over analysis. BMC Med. Res. Methodol. 2014, 14, 122. [Google Scholar] [CrossRef] [Green Version]
  27. Alessandrini, E.R.; Faustini, A.; Chiusolo, M.; Stafoggia, M.; Gandini, M.; DeMaria, M.; Antonelli, A.; Arena, P.; Biggeri, A.; Canova, C.; et al. Air pollution and mortality in twenty-five Italian cities: Results of the EpiAir2 project. Epidemiol. Prev. 2013, 37, 220–229. [Google Scholar]
  28. Baccini, M.; Biggeri, A.; Accetta, G.; Kosatsky, T.; Katsouyanni, K.; Analitis, A.; Anderson, H.R.; Bisanti, L.; D’Ippoliti, D.; Danova, J.; et al. Heat effects on mortality in 15 European cities. Epidemiology 2008, 19, 711–719. [Google Scholar] [CrossRef]
  29. Ye, X.; Wolff, R.; Yu, W.; Vaneckova, P.; Pan, X.; Tong, S. Ambient temperature and morbidity: A review of epidemiological evidence. Environ. Health Perspect. 2012, 120, 19–28. [Google Scholar] [CrossRef] [Green Version]
  30. Lessler, J.; Brookmeyer, R.; Reich, N.G.; Nelson, K.E.; Cummings, D.A.T.; Perl, T.M. Identifying the probable timing and setting of respiratory virus infections. Infect. Control. Hosp. Epidemiol. 2010, 31, 809–815. [Google Scholar] [CrossRef]
  31. Pudpong, N.; Hajat, S. High temperature effects on out-patient visits and hospital admissions in Chiang Mai, Thailand. Sci. Total. Environ. 2011, 409, 5260–5267. [Google Scholar] [CrossRef]
  32. Atkinson, R.W.; Kang, S.; Anderson, H.R.; Mills, I.C.; Walton, H. Epidemiological time series studies of PM2.5 and daily mortality and hospital admissions: A systematic review and meta-analysis. Thorax 2014, 69, 660–665. [Google Scholar] [CrossRef] [PubMed] [Green Version]
  33. Ibrahim, M.F.; Hod, R.; Nawi, A.M.; Sahani, M. Association between ambient air pollution and childhood respiratory diseases in low- and middle-income Asian countries: A systematic review. Atmos. Environ. 2021, 256, 118422. [Google Scholar] [CrossRef]
  34. Liu, J.Y.; Li, Y.F.; Li, J.; Liu, Y.; Tao, N.N.; Song, W.M.; Cui, L.L.; Li, H.C. Association between ambient PM2.5 and children’s hospital admissions for respiratory diseases in Jinan, China. Environ. Sci. Pollut. Res. 2019, 26, 24112–24120. [Google Scholar] [CrossRef]
  35. Karr, C.; Kaufman, J.; Lumley, T.; Davis, R.; Shepherd, K.; Ritz, B.; Larson, T. Effect of ambient air pollution on infant bronchiolitis. Epidemiology 2004, 15, S31–S32. [Google Scholar] [CrossRef]
  36. Karr, C.; Lumley, T.; Shepherd, K.; Davis, R.; Larson, T.; Ritz, B.; Kaufman, J. A case-crossover study of wintertime ambient air pollution and infant bronchiolitis. Environ. Health Perspect. 2006, 114, 277–281. [Google Scholar] [CrossRef]
  37. Lu, K.D.; Breysse, P.N.; Diette, G.B.; Curtin-Brosnan, J.; Aloe, C.; Williams, D.L.; Peng, R.D.; McCormack, M.C.; Matsui, E.C. Being overweight increases susceptibility to indoor pollutants among urban children with asthma. J. Allergy Clin. Immunol. 2013, 131, 1017–1023. [Google Scholar] [CrossRef] [Green Version]
  38. Romieu, I.; Castro-Giner, F.; Künzli, N.; Sunyer, J. Air pollution, oxidative stress and dietary supplementation: A review. Eur. Respir. J. 2008, 31, 179–197. [Google Scholar] [CrossRef]
  39. Bowler, R.P.; Crapo, J.D. Oxidative stress in allergic respiratory diseases. J. Allergy Clin. Immunol. 2002, 110, 349–356. [Google Scholar] [CrossRef]
  40. Holguin, F.; Fitzpatrick, A. Obesity, asthma, and oxidative stress. J. Appl. Physiol. 2010, 108, 754–759. [Google Scholar] [CrossRef]
  41. Keaney, J.F.; Larson, M.G.; Vasan, R.S.; Wilson, P.W.F.; Lipinska, I.; Corey, D.; Massaro, J.M.; Sutherland, P.; Vita, J.A.; Benjamin, E.J. Obesity and systemic oxidative stress—Clinical correlates of oxidative stress in the Framingham study. Arterioscler. Thromb. Vasc. Biol. 2003, 23, 434–439. [Google Scholar] [CrossRef] [PubMed] [Green Version]
  42. Limaye, S.; Salvi, S. Obesity and asthma: The role of environmental pollutants. Immunol. Allergy Clin. 2014, 34, 839–855. [Google Scholar] [CrossRef]
  43. Graham, D.R.; Chamberlain, M.J.; Hutton, L.; King, M.; Morgan, W.K. Inhaled particle deposition and body habitus. Occup. Environ. Med. 1990, 47, 38–43. [Google Scholar] [CrossRef] [PubMed]
  44. Shore, S.A.; Rivera-Sanchez, Y.M.; Schwartzman, I.N.; Johnston, R. Responses to ozone are increased in obese mice. J. Appl. Physiol. 2003, 95, 938–945. [Google Scholar] [CrossRef] [PubMed]
  45. O’Lenick, C.; Winquist, A.; Mulholland, J.; Friberg, M.D.; Chang, H.H.; Kramer, M.; Darrow, L.; Sarnat, S.E. Assessment of neighbourhood-level socioeconomic status as a modifier of air pollution–asthma associations among children in Atlanta. J. Epidemiol. Community Health 2016, 71, 129–136. [Google Scholar] [CrossRef]
Figure 1. Map of Kathmandu Valley showing Bhaktapur and the locations of the hospital, the PM monitor (on the rooftop of the hospital), and the NOAA station (at Tribhuvan International Airport).
Atmosphere 12 01009 g001
Figure 2. Estimates of relative risks (RR) and 95% confidence intervals of acute respiratory infection (ARI) hospital admission among children for a 10 µg/m3 increase in the daily PM2.5 concentration by single- and multi-day lags of up to one week.
Atmosphere 12 01009 g002
Figure 3. Estimates of relative risks (RR) and 95% confidence intervals of acute respiratory infection (ARI) hospital admission by weight status (underweight [n = 37], normal weight [n = 211], overweight [n = 10]) at lag 0, lag 1, and the average lag 01.
Atmosphere 12 01009 g003
Figure 4. All-subject and weight-specific concentration-response functions (CRFs) for the association between PM2.5 (average lag 01) and daily acute respiratory infection (ARI) hospital admissions in children.
Atmosphere 12 01009 g004
Table 1. Descriptive statistics for the ARI hospital admissions.
Characteristics Frequency (n = 258)
n(%)
SexMale 181 (70.2)
Female 77 (29.8)
Age (years)Infant (≤1) 132 (51.2)
Underweight16 (12.1)
Normal weight109 (82.6)
Overweight7 (5.3)
Toddler (2–5) 114 (44.2)
Underweight17 (14.9)
Normal weight94 (82.5)
Overweight3 (2.6)
Child (6–10) 12 (4.7)
Underweight4 (33.3)
Normal weight8 (66.7)
Overweight0 (0.0)
Nutritional status aUnderweight 37 (14.3)
Normal weight 211 (81.8)
Overweight 10 (3.9)
a Categorization is based on the recommended weight-for-age Z-score cut-off values ± 2 (underweight: Z-score ≤ −2, normal weight: −2 < Z-score < 2, overweight: Z-score ≥ 2). Values < −6 or >5 were excluded as an outlier [24].
Table 2. Summary statistics for daily acute respiratory infection (ARI) hospital admission, mean concentration of PM2.5, and 24-h mean temperature in Bhaktapur district of Nepal between 13 February 2014 to 12 February 2015.
Min.25th PercentileMedian75th PercentileMax.MeanSD
ARI admissions0.0 0.0 0.0 1.0 5.0 0.7 0.9
PM2.5 (μg/m3)2.0 11.6 41.0 63.6 213.7 43.5 35.9
Temperature (°C)9.4 15.1 22.4 27.1 29.8 21.2 6.4
Publisher’s Note: MDPI stays neutral with regard to jurisdictional claims in published maps and institutional affiliations.

