Article

Tracking the Endogenous Dynamics of the Solfatara Volcano (Campi Flegrei, Italy) through the Analysis of Ground Thermal Image Temperatures

1
Istituto Nazionale di Geofisica e Vulcanologia, Sezione di Napoli-Osservatorio Vesuviano, 80124 Naples, Italy
2
Ministry of Education, Universities and Research, 00153 Rome, Italy
3
Dipartimento di Ingegneria dell’Informazione ed Elettrica e Matematica Applicata/DIEM, Università degli Studi di Salerno, 84084 Fisciano, Italy
*
Author to whom correspondence should be addressed.
Atmosphere 2021, 12(8), 940; https://doi.org/10.3390/atmos12080940
Submission received: 15 June 2021 / Revised: 16 July 2021 / Accepted: 19 July 2021 / Published: 22 July 2021

Abstract

:
In the last decades, thermal infrared ground-based cameras have become effective tools to detect significant spatio-temporal anomalies in the hydrothermal/volcanic environment, possibly linked to impending eruptions. In this paper, we analyzed the temperature time-series recorded by the ground-based Thermal Infrared Radiometer permanent network of INGV-OV, installed inside the Solfatara-Pisciarelli area, the most active fluid emission zones of the Campi Flegrei caldera (Italy). We investigated the temperatures’ behavior in the interval 25 June 2016–29 May 2020, with the aim of tracking possible endogenous hydrothermal/volcanic sources. We performed the Independent Component Analysis, the time evolution estimation of the spectral power, the cross-correlation and the Changing Points’ detection. We compared the obtained patterns with the behavior of atmospheric temperature and pressure, of the time-series recorded by the thermal camera of Mt. Vesuvius, of the local seismicity moment rate and of the CO2 emission flux. We found an overall influence of exogenous, large scale atmospheric effect, which dominated in 2016–2017. Starting from 2018, a clear endogenous forcing overcame the atmospheric factor, and dominated strongly soil temperature variations until the end of the observations. This paper highlights the importance of monitoring and investigating the soil temperature in volcanic environments, as well as the atmospheric parameters.

1. Introduction

In the last decades, thermal remote sensing has been largely used in surveys and in the analysis of thermal behavior of active volcanic areas. Different specific devices, such as portable or ground/airborne sensors and satellites [1,2,3,4], can reveal thermal anomalies linked to volcanic activity, as well as mapping volcanic deposits [5]. Thermal remote explorations are largely used to monitor the state of volcanoes by detecting thermal surface variations likely linked to endogenous dynamics and possible eruption precursors. The thermal infrared ground camera is an effective tool to reveal such variations. Indeed, thermal ground monitoring allowed detection of the intensification of the thermal activity prior to the 18 May 1980 eruption at Mount St. Helen’s [6]. Some days before the Santa Ana volcano lake eruption, Hernández et al. [7] measured a significant increase in the surface lake temperature and an intensification of the fumarolic emissions, by using thermal infrared images acquired with a handheld camera. A handheld thermal camera was also used by Calvari et al. [8] to monitor the Mt. Etna and Stromboli volcanoes. When both the volcanoes erupted in 2002–2003, the acquired thermal images showed a failure on the volcanoes’ flanks before the eruptive fractures’ opening. Hilman et al. [9] used the thermal infrared radiometers (TIR) on board of an Advanced Spaceborne Thermal Emission and Reflection Radiometer (ASTER) to detect thermal surface anomalies related to the gas emissions around Papandayan and Domas craters (Indonesia). Their results suggested that SO2 emission measurements and land surface temperature corrections are highly correlated. Afterward, those authors [10] applied the satellite imaging to increase the effectiveness of upflow zone detection in those areas.
The surface thermal behavior of Campi Flegrei caldera (CFc; Southern Italy) has been monitored using different thermal infrared (TIR) devices: satellite thermal sensors [11], ground-based TIR permanent network (TIRnet) [12,13,14,15] and handheld TIR cameras [16]. The relative studies are mainly devoted to analyzing the thermal observables at a local scale, inside the caldera. Indeed, the interaction between some atmospheric parameters and TIRs, such as the rainfall episodes and variations in ground temperature in Solfatara, was already explored [17]. At even smaller scales, the heating due to anthropogenic noise is also known [18,19], as well as the effects due to the topography which are expected to cause local wind perturbation that increases the gas flux.
The present work mainly aims at the identification of possible sources at larger spatial scales (tens of kilometers) that might affect the CFc thermal behavior, in order to better characterize the local hydrothermal/volcanic dynamics. Besides the spatial investigation, the analysis was also focused on the variations in TIRs over large time scales (from weeks to years), as at small time scales (of the order of a few days).
Here, the behavior of a Solfatara–Pisciarelli shallow hydrothermal system is investigated in the time span of 25 June 2016–29 May 2020, by processing data acquired by TIR ground cameras belonging to the surveillance TIRnet of INGV in correspondence to selected active fumarole emission areas of CFc (Figure 1). A first comparison was carried out among all the TIRs of CFc, the atmospheric parameters (Tatm and Patm) and the TIR of Mt. Vesuvius (VES), to identify/discriminate possible exogenous sources at a large spatial scale. Then, the evidenced CFc ground thermal patterns were compared to the spatio-temporal behavior of the seismicity rate [20,21] and CO2 emission flux [22] in order to better characterize possible endogenous sources acting in the first 3 km of depth [23]. Such endogenous sources are linked to the hydrothermal/volcanic dynamics, such as magma movements, pressured gas injection at depth, regional or local stress field variations and so on.
This work evidenced how TIRs are able to track endogenous hydrothermal/volcanic effects, as well as to identify an overall general atmospheric trend.

2. Materials and Methods
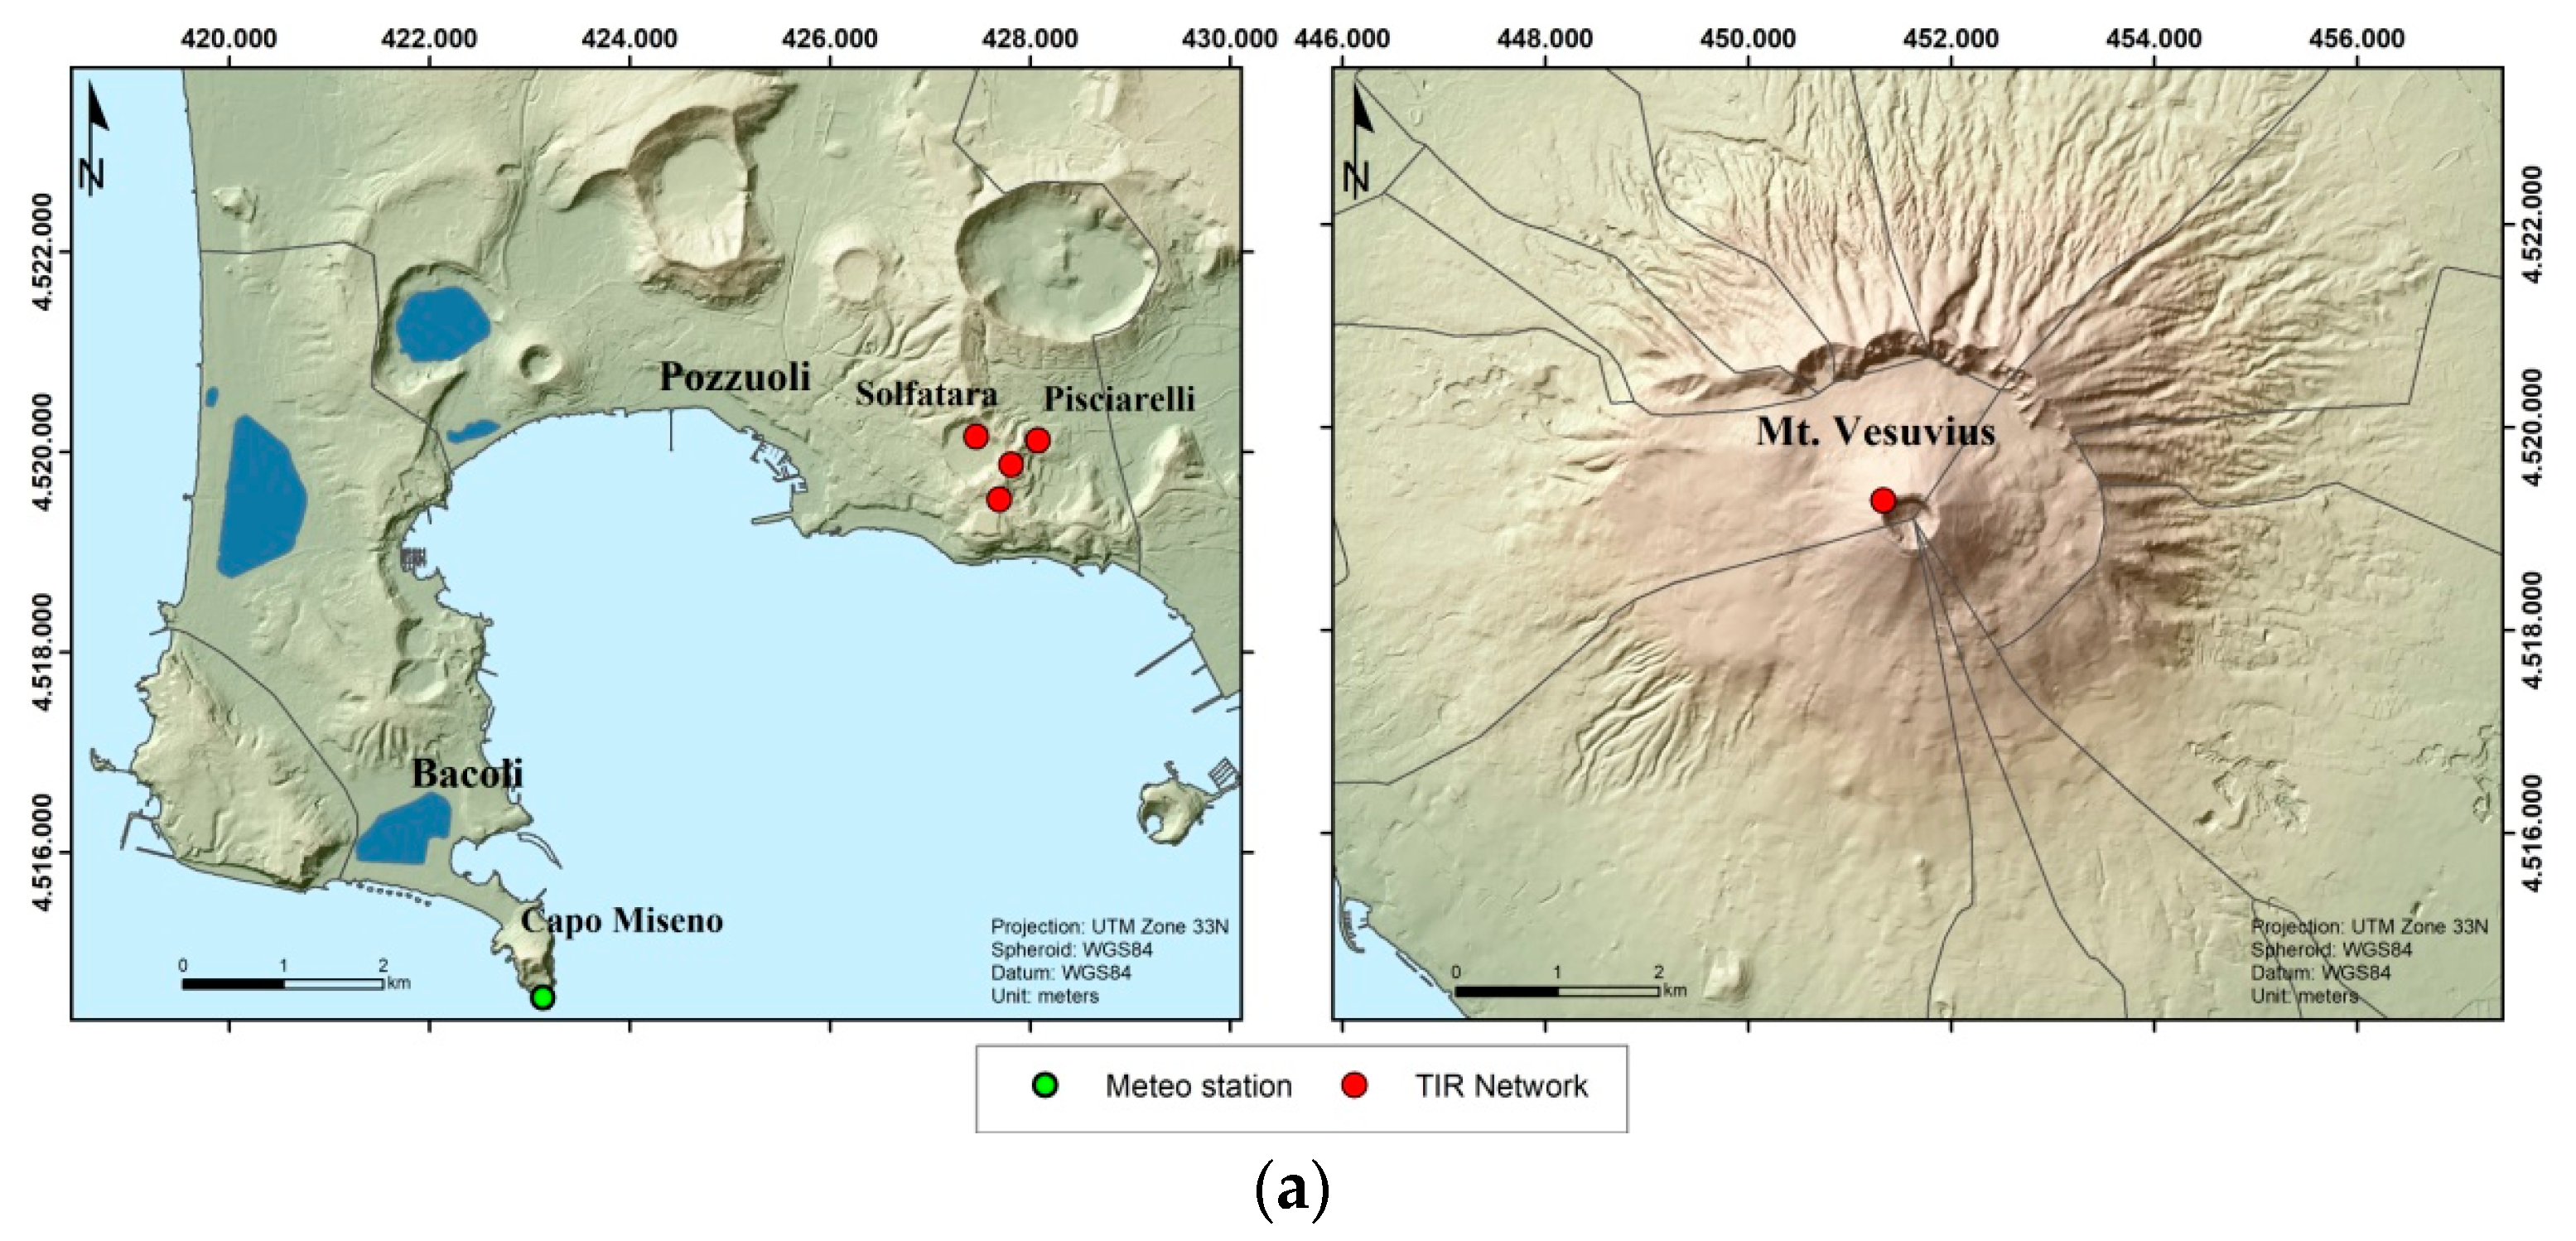
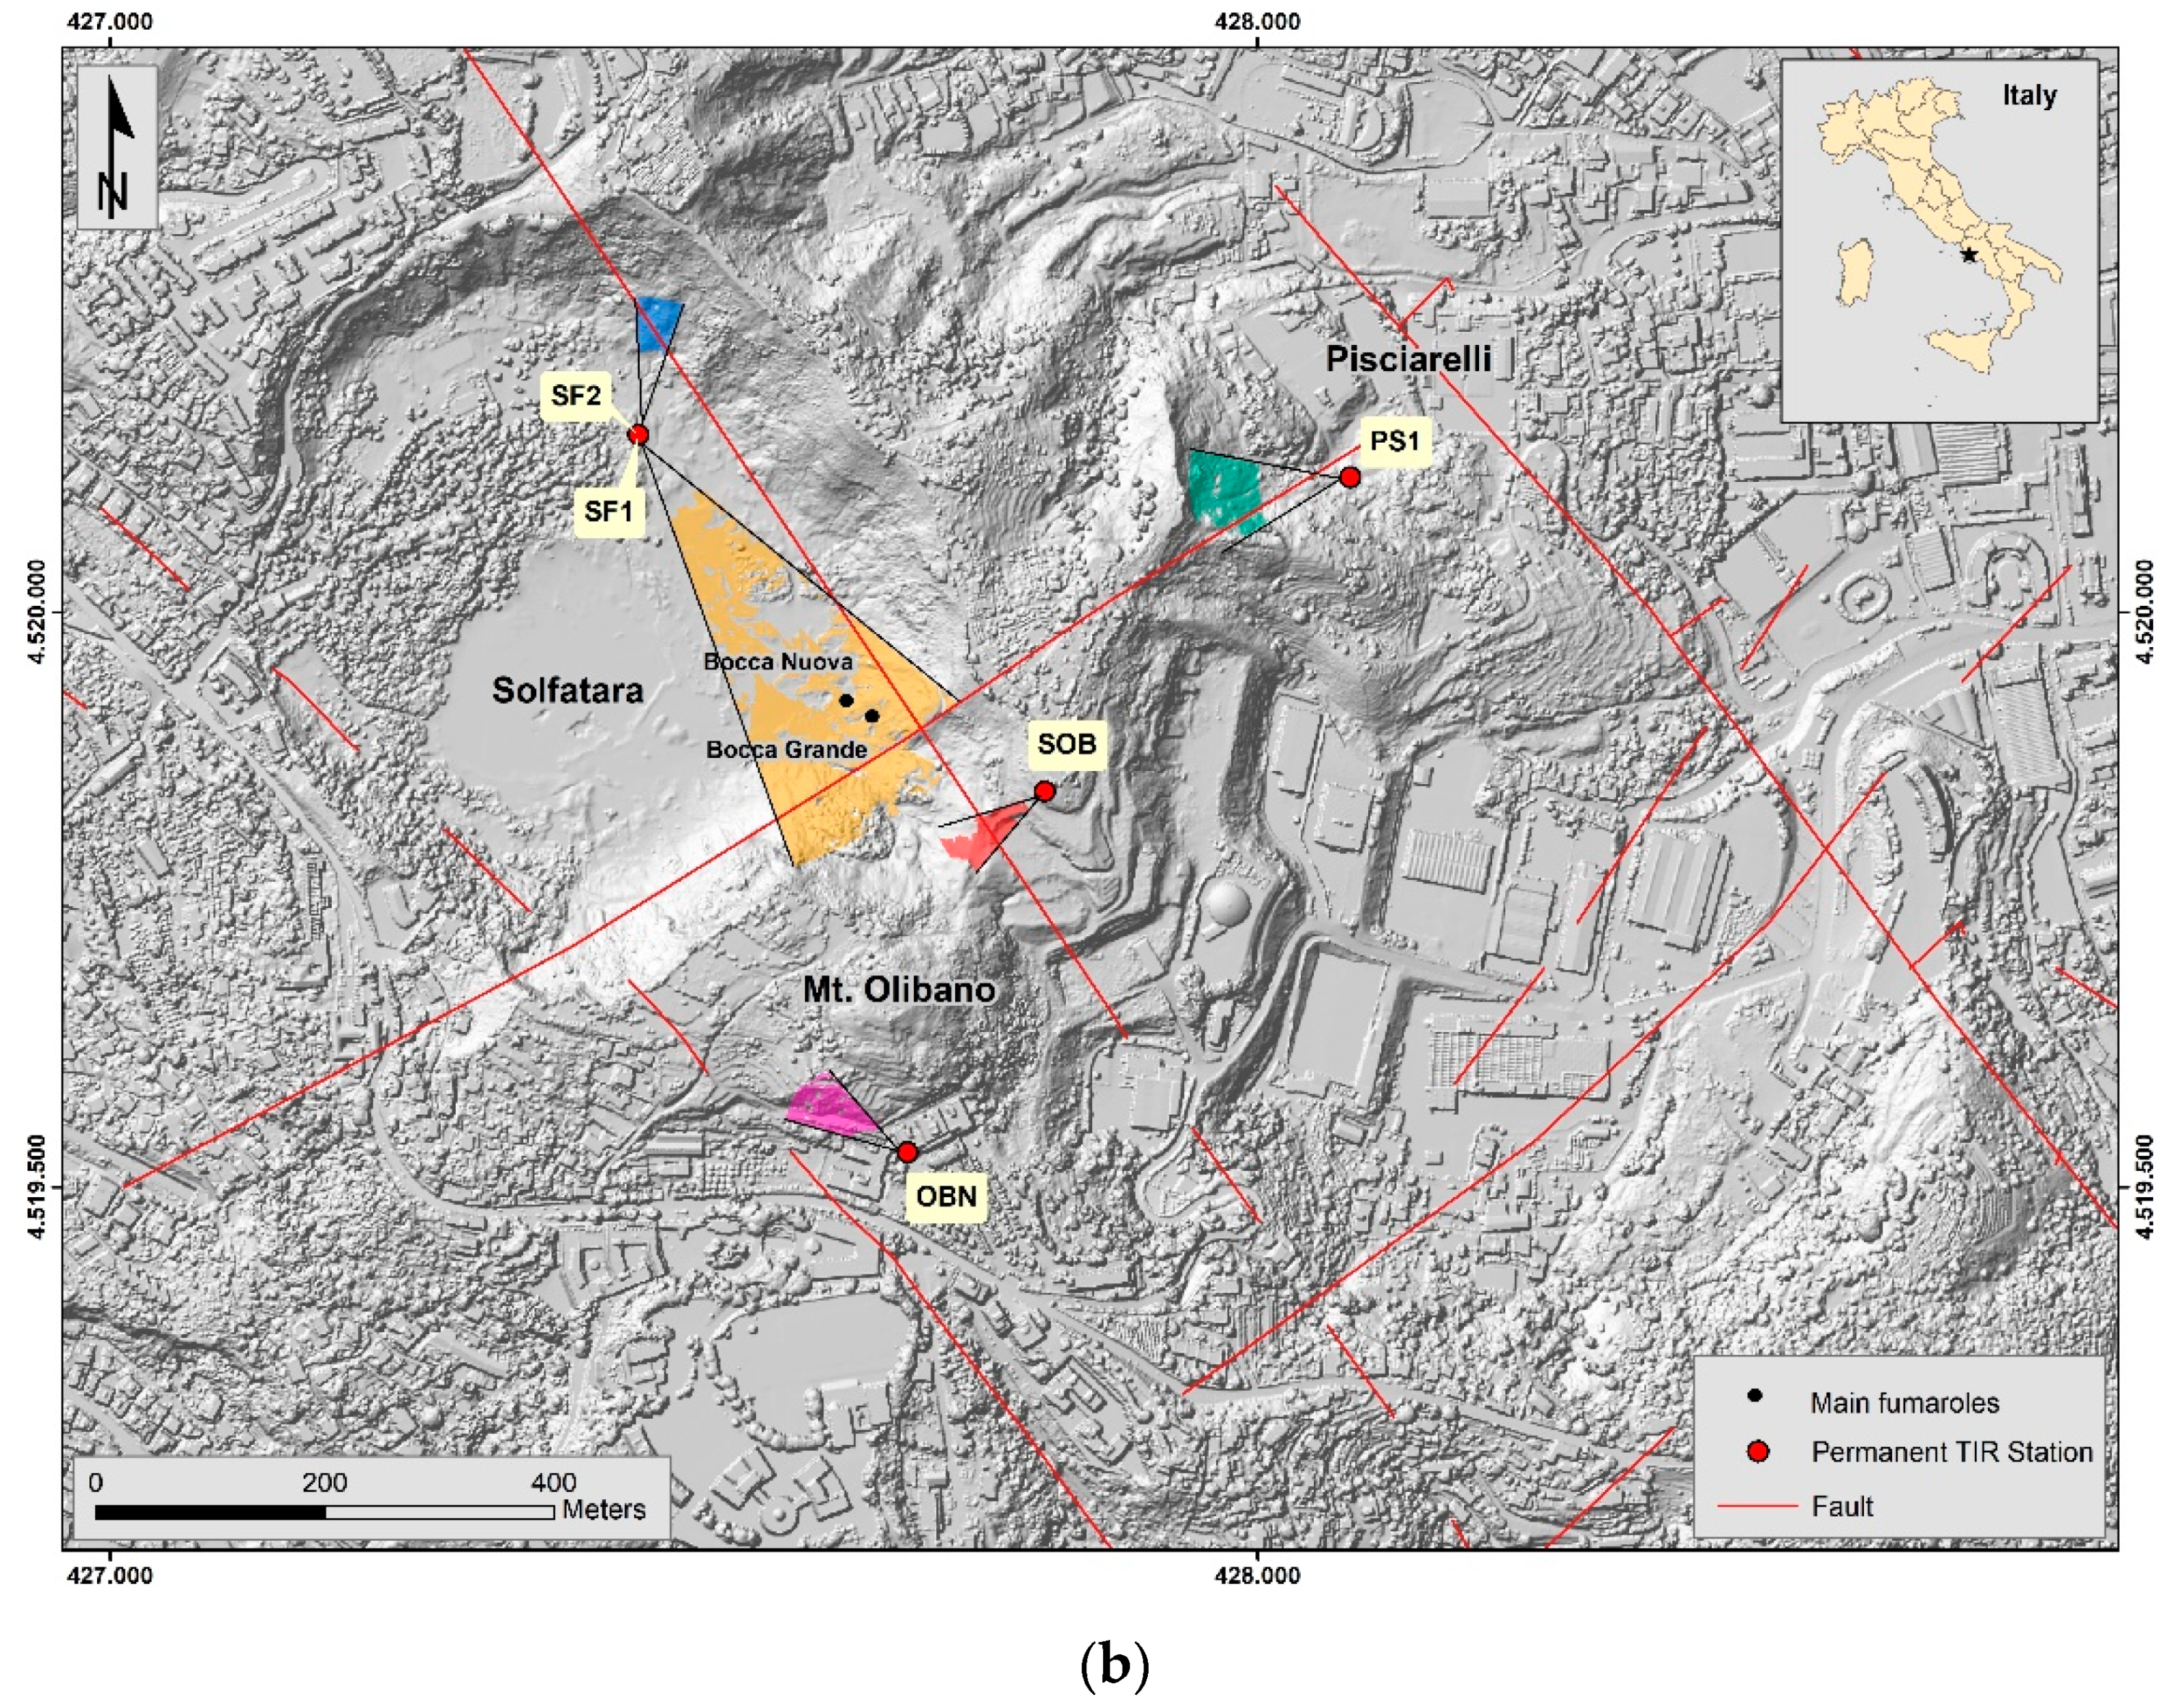
2.1. The Study Area

The Campi Flegrei volcanic area is a resurgent nested caldera about 65 km2 wide, located in Southern Italy (Figure 1) and generated by two high magnitude volcanic eruptions: the Campanian Ignimbrite (~40 ka) and the Neapolitan Yellow Tuff eruption (~15 ka) [25,26,27,28]. After the last eruption (Monte Nuovo, 1538 AD [29], CFc was affected by a diffuse subsidence until the second half of the 20th century. After this date, ground uplift started with alternating unrest episodes, characterized by an increase in uplift velocity and seismic crises, termed ‘bradyseism’ [30,31]. The most recent bradyseismic episodes occurred in 1968–1972 and 1982–1985.
In 2004, CFc started a new inflation phase, characterized by an increasing ground uplift [32,33,34,35,36] consisting in a total maximum vertical displacement of ~0.80 m [22] by frequent shallow seismicity [20,37,38,39,40] and by increasing degassing activity [23,41].
According to Chiodini et al. [23], the bradyseismic phenomena are due to the dynamics of the magmatic–hydrothermal system. The authors depict a deep gas accumulation zone located at about 4 km of depth, possibly related to small magma/fluid injection, and a hydrothermal reservoir at about 2 km of depth, where upwelling magmatic fluids mix with meteoric water.
Hydrothermal/volcanic fluid emission is mainly centered in the Solfatara–Pisciarelli area (Figure 1) characterized by the Solfatara ~3.8 ka old tuff-cone. The CO2 anomalies’ pattern follows the structural alignments, suggesting that the faults and the fractures mainly control the diffuse gas emission [42]. The main fault system is along the NW–SE direction, while the minor one follows the NE–SW trend (Figure 1b). Bocca Grande and Bocca Nuova are the main fumarole vents inside the Solfatara crater and are located at the intersection between the two main fault systems (Figure 1b). The Pisciarelli fumarole field, elongated toward the NW–SE faults system, has shown a significant growth in hydrothermal activity during the ongoing unrest phase, with a recent increase in shallow seismicity [22].

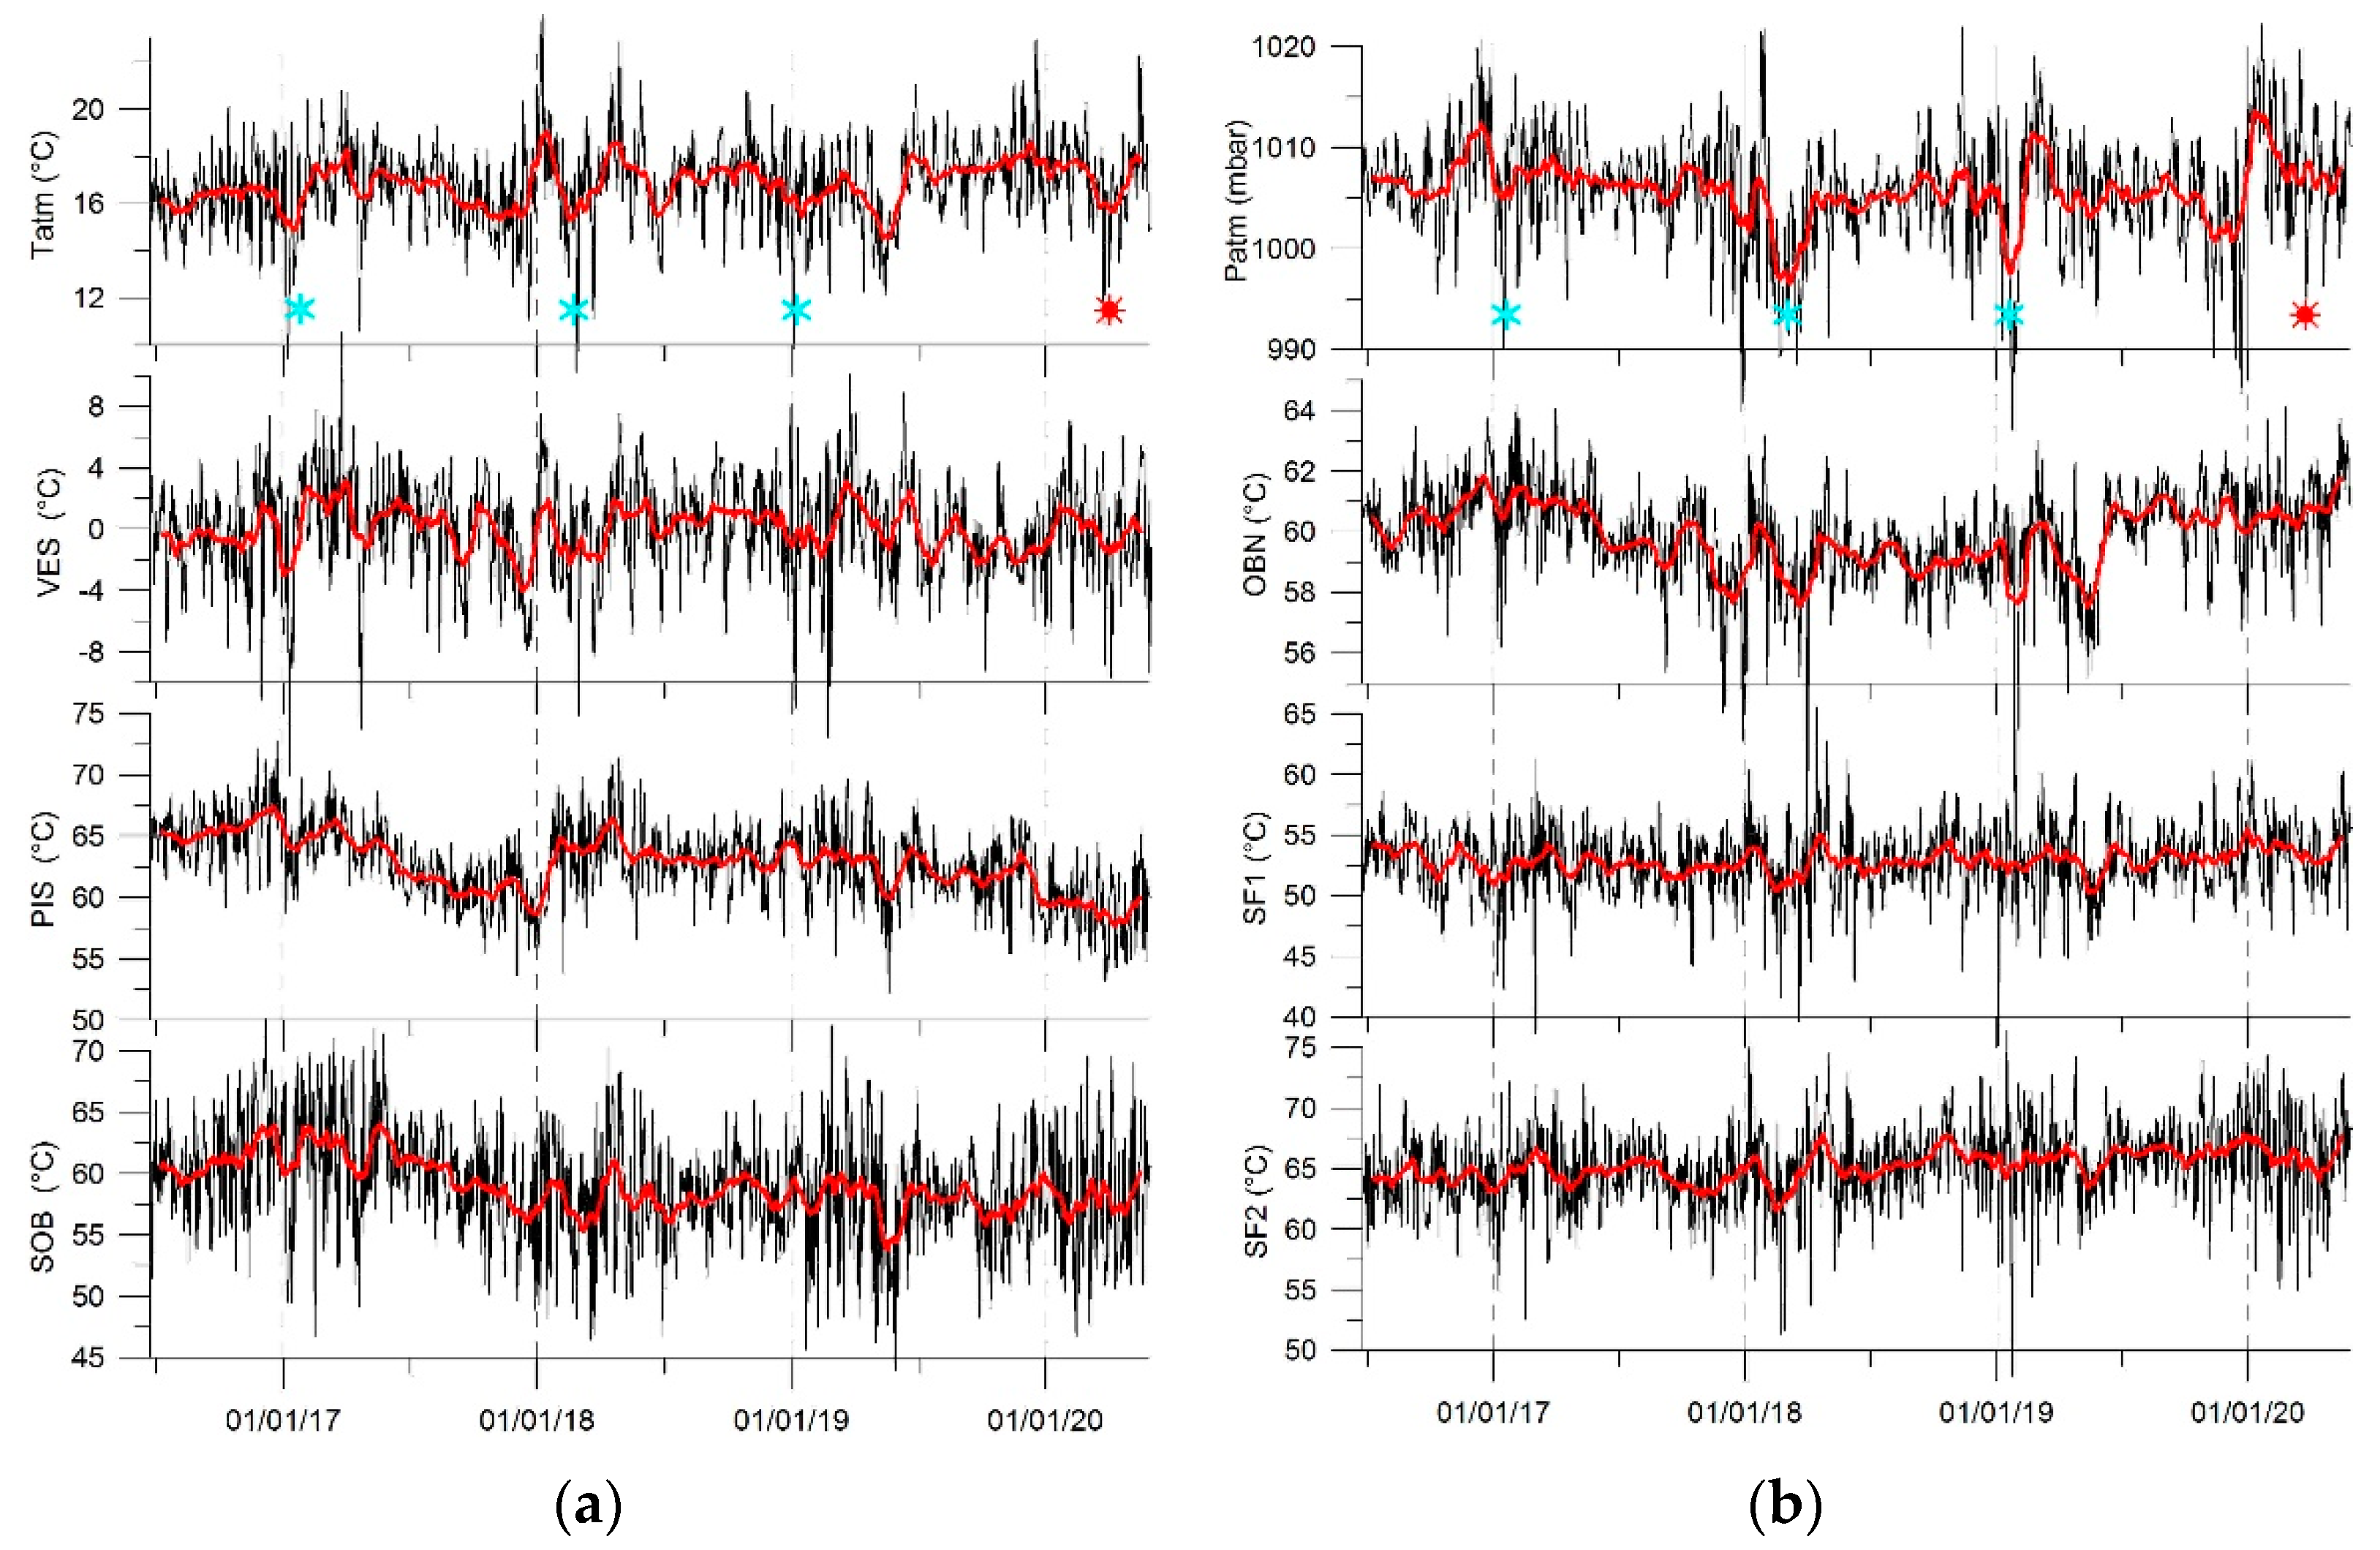
2.2. Thermal Infrared Surface Data and Atmospheric Temperature and Pressure Data
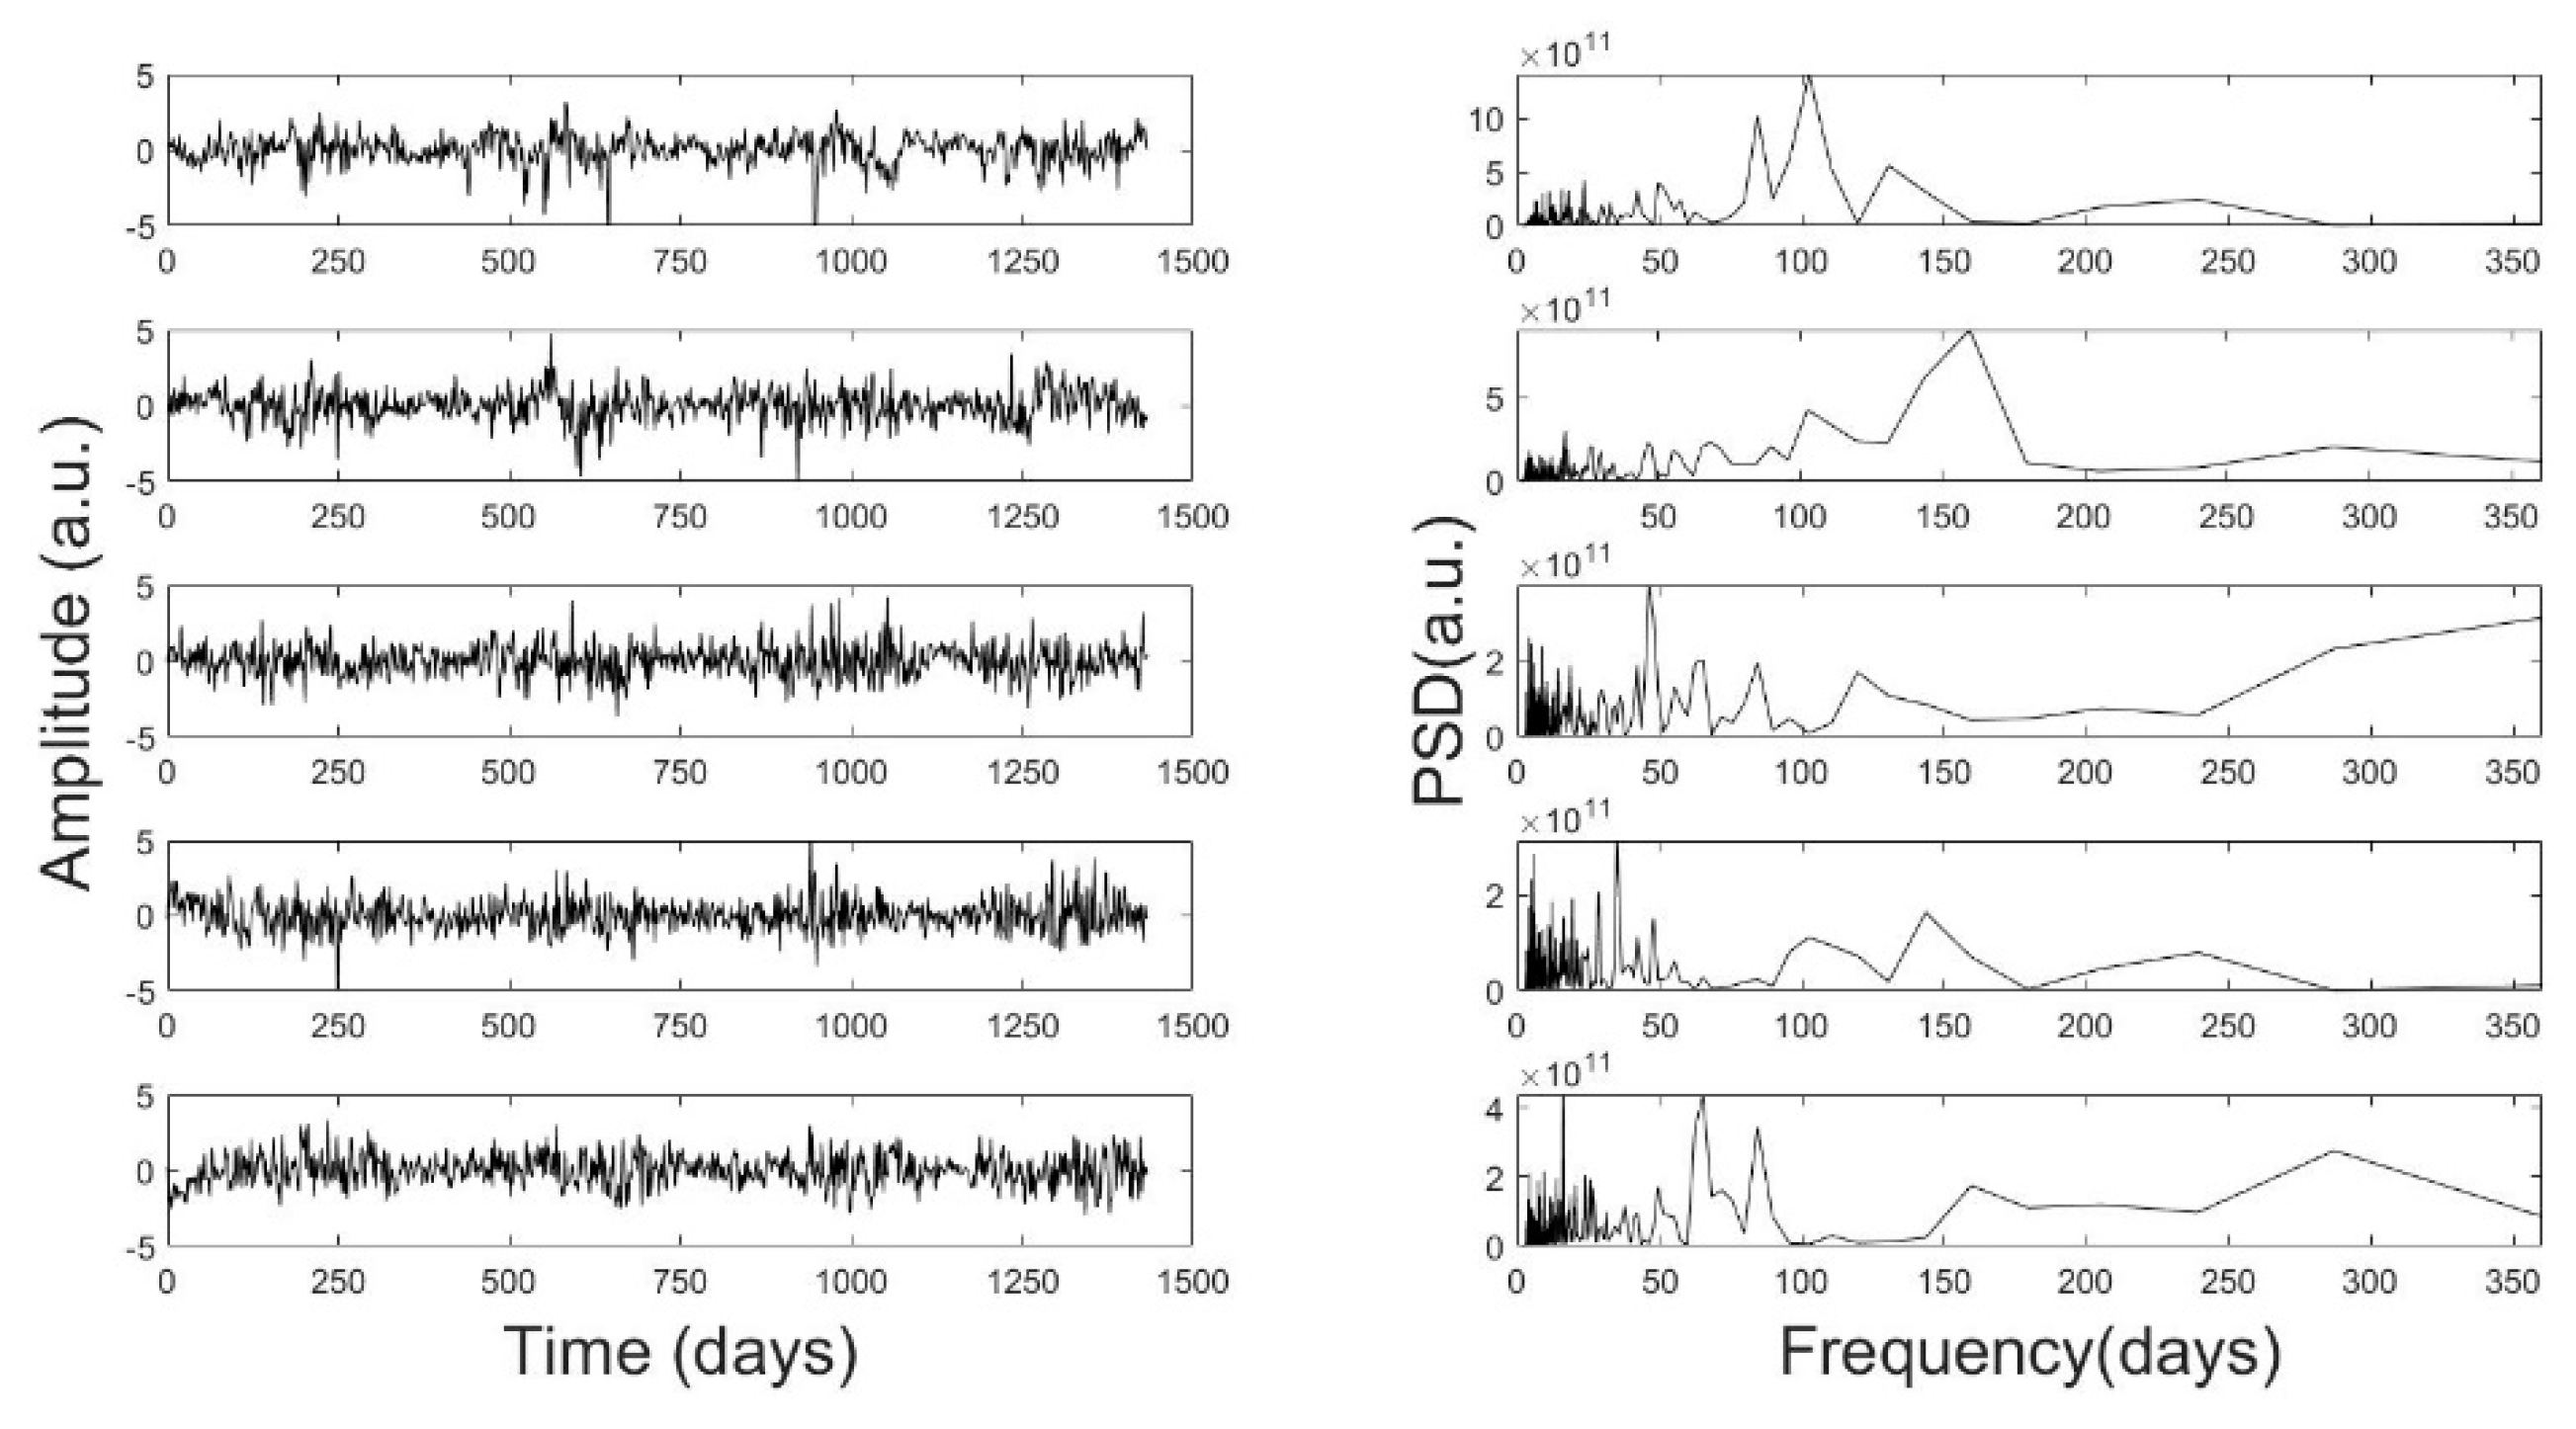
The Osservatorio Vesuviano (OV) is a Section of the Istituto Nazionale di Geofisica e Vulcanologia (INGV) mainly designated to the surveillance of the Neapolitan volcanic area by managing a large number of monitoring networks. Since 2006, the Thermal InfRared Permanent Network (TIRnet) has been monitoring the ground thermal anomalies due to diffuse degassing activity at CFc and the Vesuvio crater [12,13,43,44]. The network is overall composed of five stations at CFc and one at the Mt. Vesuvius crater (Figure 1). In the CFc area, three stations are installed inside the Solfatara cone (SF1, SF2 and SOB), one station in the Pisciarelli area (PIS), one station at the southern slope of Mt. Olibano (OBN). The SF1 station acquires frames of the SE inner slope of the Solfatara crater, including Bocca Grande and Bocca Nuova fumaroles. The SOB station acquires frames of a restricted diffuse degassing area on the top of the SE rim of the Solfatara edifice. The SF2 station targets the cryptodome beside the inner NW slope of Solfatara. The PIS station monitors the area close to the base of the NE Solfatara external slope (Figure 1b). The TIR camera installed at Mt. Vesuvius (VES) is located about 24 km away from the Solfatara–Pisciarelli area and it targets the fumaroles located inside the crater in the western inner slope. The distances between the sensors and the target areas range from 80 m to about 340 m. The TIR stations use FLIR infrared cameras A645SC/A655SC holding a Focal Plane Array (FPA) uncooled Microbolometer detector. The sensor thermal sensitivity is <0.03 °C ± 30 °C, the accuracy ± 2 °C, the spectral range 7.5–14 µm and the resolution 640 × 480 pixels. Every TIR station captures three frames of the target areas, at nighttime (00:00, 02:00, 04:00 a.m.) to avoid the effects of sun heat radiation accumulated by the soil.
UMTS and WiFi transmission systems are used to telemeter the acquired scenes to the INGV-OV monitoring center in order to be processed daily by the Matlab© application ASIRA (Automated System of InfraRed Analysis, Naples, Italy) [44]. Raw TIR images are processed to generate thermal infrared surface temperature time-series with daily maximum TIR temperature values (°C; Figure 2).
In this work, ground temperatures recorded in the time span 25 June 2016–29 May 2020 (Figure 2) were used.
Air temperature (Tatm, in °C) and atmospheric pressure (Patm, in mbar) time-series are recorded by a VAISALA WXT520 meteorological station, installed inside Capo Miseno lighthouse (Bacoli, Italy). The station is composed of an OTT data logger LogoSens2 which acquires a sample every ten minutes and then transmits the data to INGV-OV center by HIPERLAN (HIgh PErformance Radio LAN).
Tatm shows drastic minima and maxima that interrupt the overall trends. These anomalies correspond to the time range in which the air temperature is unusually cold or hot. For example, in January 2017, southern Italy was affected by an intense cold, with anomalous low altitude snowfalls, while January 2018 was unusually hot.
All the time-series are pre-processed, i.e., de-seasonalized (correction for annual periodicity, i.e., 365 d) and corrected for tidal constituents (Mf lunisolar fortnightly, 1366 days; Msf lunisolar synodic fortnightly, 1476 days; Mm lunar monthly, 2755 days; Msm solar monthly, 3181 days; Ssa solar semiannual, 18,263 days; Sa solar annual, 36,526 days) according to the procedure described in [14,15,44].
The temporal trends of the time-series are best highlighted by a moving average over 31-day-long time windows (about 1 month) shifted by 1 day (red line in the Figure 2).

2.3. ICA Method

In order to reveal which among the waveforms related to the frequencies involved in the TIR time-series can be considered independent, we adopted the Independent Component Analysis (ICA), that is, a decomposition method in the time domain [45].
This technique exploits the statistical independence of the sources, whose linear combination is supposed to form each experimental series (each TIR). At a first approximation, the kurtosis can be used for estimating the independence; a more general approach requires that the negentropy and/or the mutual information be evaluated [45].
The mathematical model can be formulated considering that each TIR is a mixture of some unknown sources, x = As, where x represents the five TIR series, the matrix A provides the coefficients of the linear superposition and basically takes into account the medium effects, and s is a vector of at most five unknown independent sources. The model requires that the number of the recordings, x, must be at least equal to the number of the unknown sources, s. Under these hypotheses, the ICA goal is to obtain a matrix of separation W ≈ A−1, such as the vector y = Wx being an estimate y∼s of the original independent signals. Several approaches are proposed in the literature, such as the Mutual Information, the maximum likelihood, etc., to retrieve the sources and W. To estimate them, we adopted the non-Gaussianity method, which uses as contrast function the negentropy. The latter was approximated by the fixed-point FastICA algorithm [45].
ICA has been successfully applied in the field of volcano seismology [33,46,47,48,49].

3. Results

3.1. ICA Results

The application of ICA was carried out on homogeneous variables, i.e., on the five available CFc TIRs. To get robust results, the series were band-pass filtered in the range (1 year 3 days). The results of the decomposition are reported in Figure 3, where both the separated waveforms and the related power spectral densities (PSD) are shown. As can be seen, some characteristic peaks appear in broader spectra corresponding to specific periodicities, in agreement with those evidenced by spectral analysis reported in Caputo et al. [15].
Consequently, five independent components (ICs) were identified in the following non-overlapped bands: IC1 at (85–115) days; IC2 at (150–160) days; IC3 at (40–50) days; IC4 at (30–40) days. The last extracted component (IC5) has a more complex spectral behavior with two relevant peaks in the following bands: (10–20) days and (55–65) days.

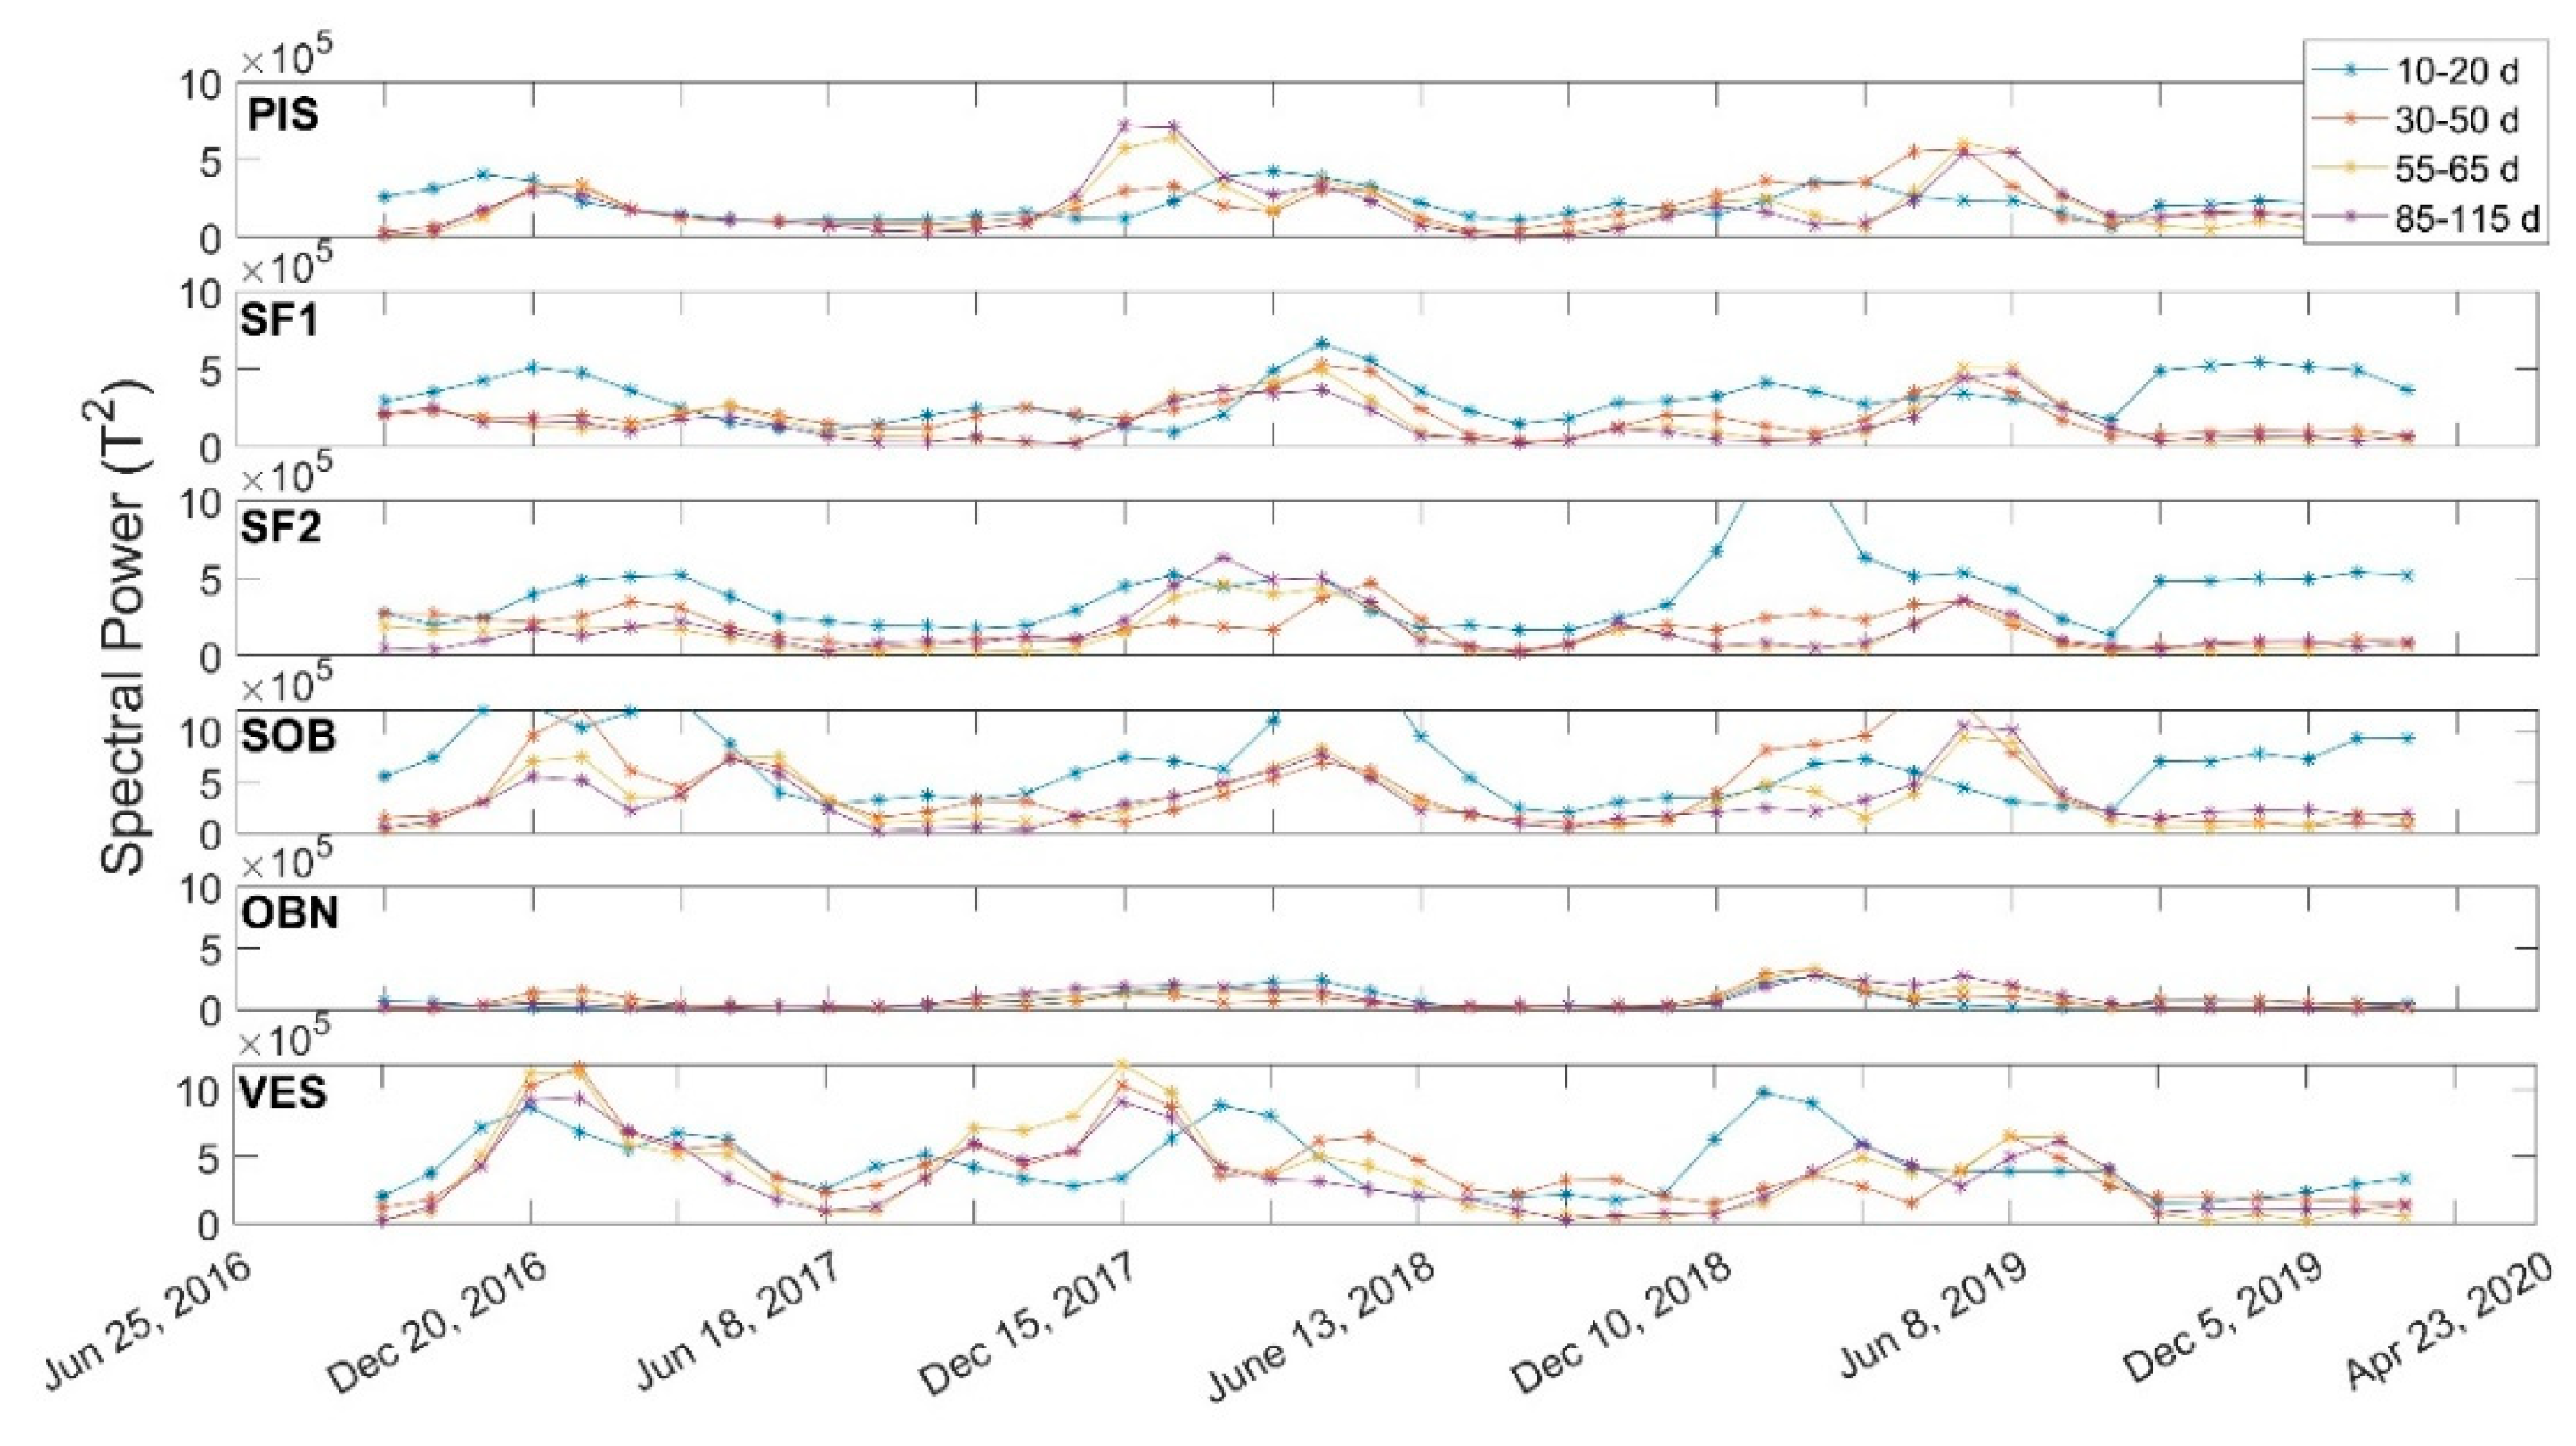
3.2. Time Evolution of the Spectral Power

Based on the information provided by ICA, we estimated the energy contained in the main spectral peaks over the time. The PSDs were evaluated on 180-days-long windows, shifting each 30 days, implying a superposition of 83.3%. The spectral power was, then, calculated by integrating the PSD of the TIR in the following bands: (10–20) days; (30–50) days; (55–65) days; (85–115) days for all the stations. Notice that the periodicity around 150 days was not included in the present analysis due to the shortness of the time-series. The results are reported in Figure 4: the y-axis is almost the same for allowing comparison among the traces.
The overall behavior of TIRs at CFc seems to be independent of the specific band for each station. From a comparison among the different stations, one observes a sort of amplitude attenuation moving away from SOB. Looking at Vesuvius, the behavior at all the time scales is similar to those at CFc in the first part, up to the end of the year 2017 (the day 540 in Figure 4 corresponds to 16 December 2017), implying a common exogenous origin, changing drastically after that.
It is noteworthy that the 10–20 d-band stronger deviates from the overall patterns. In particular, in the time-range late 2019–end of observations, this component shows a spectral power level inside the Solfatara crater (SF1, SF2 and SOB) significantly higher than the other bands/TIRs. We recall that the uncertainty on the date is of about ±90 days, since every spectral power value was estimated over a range of 180 days.

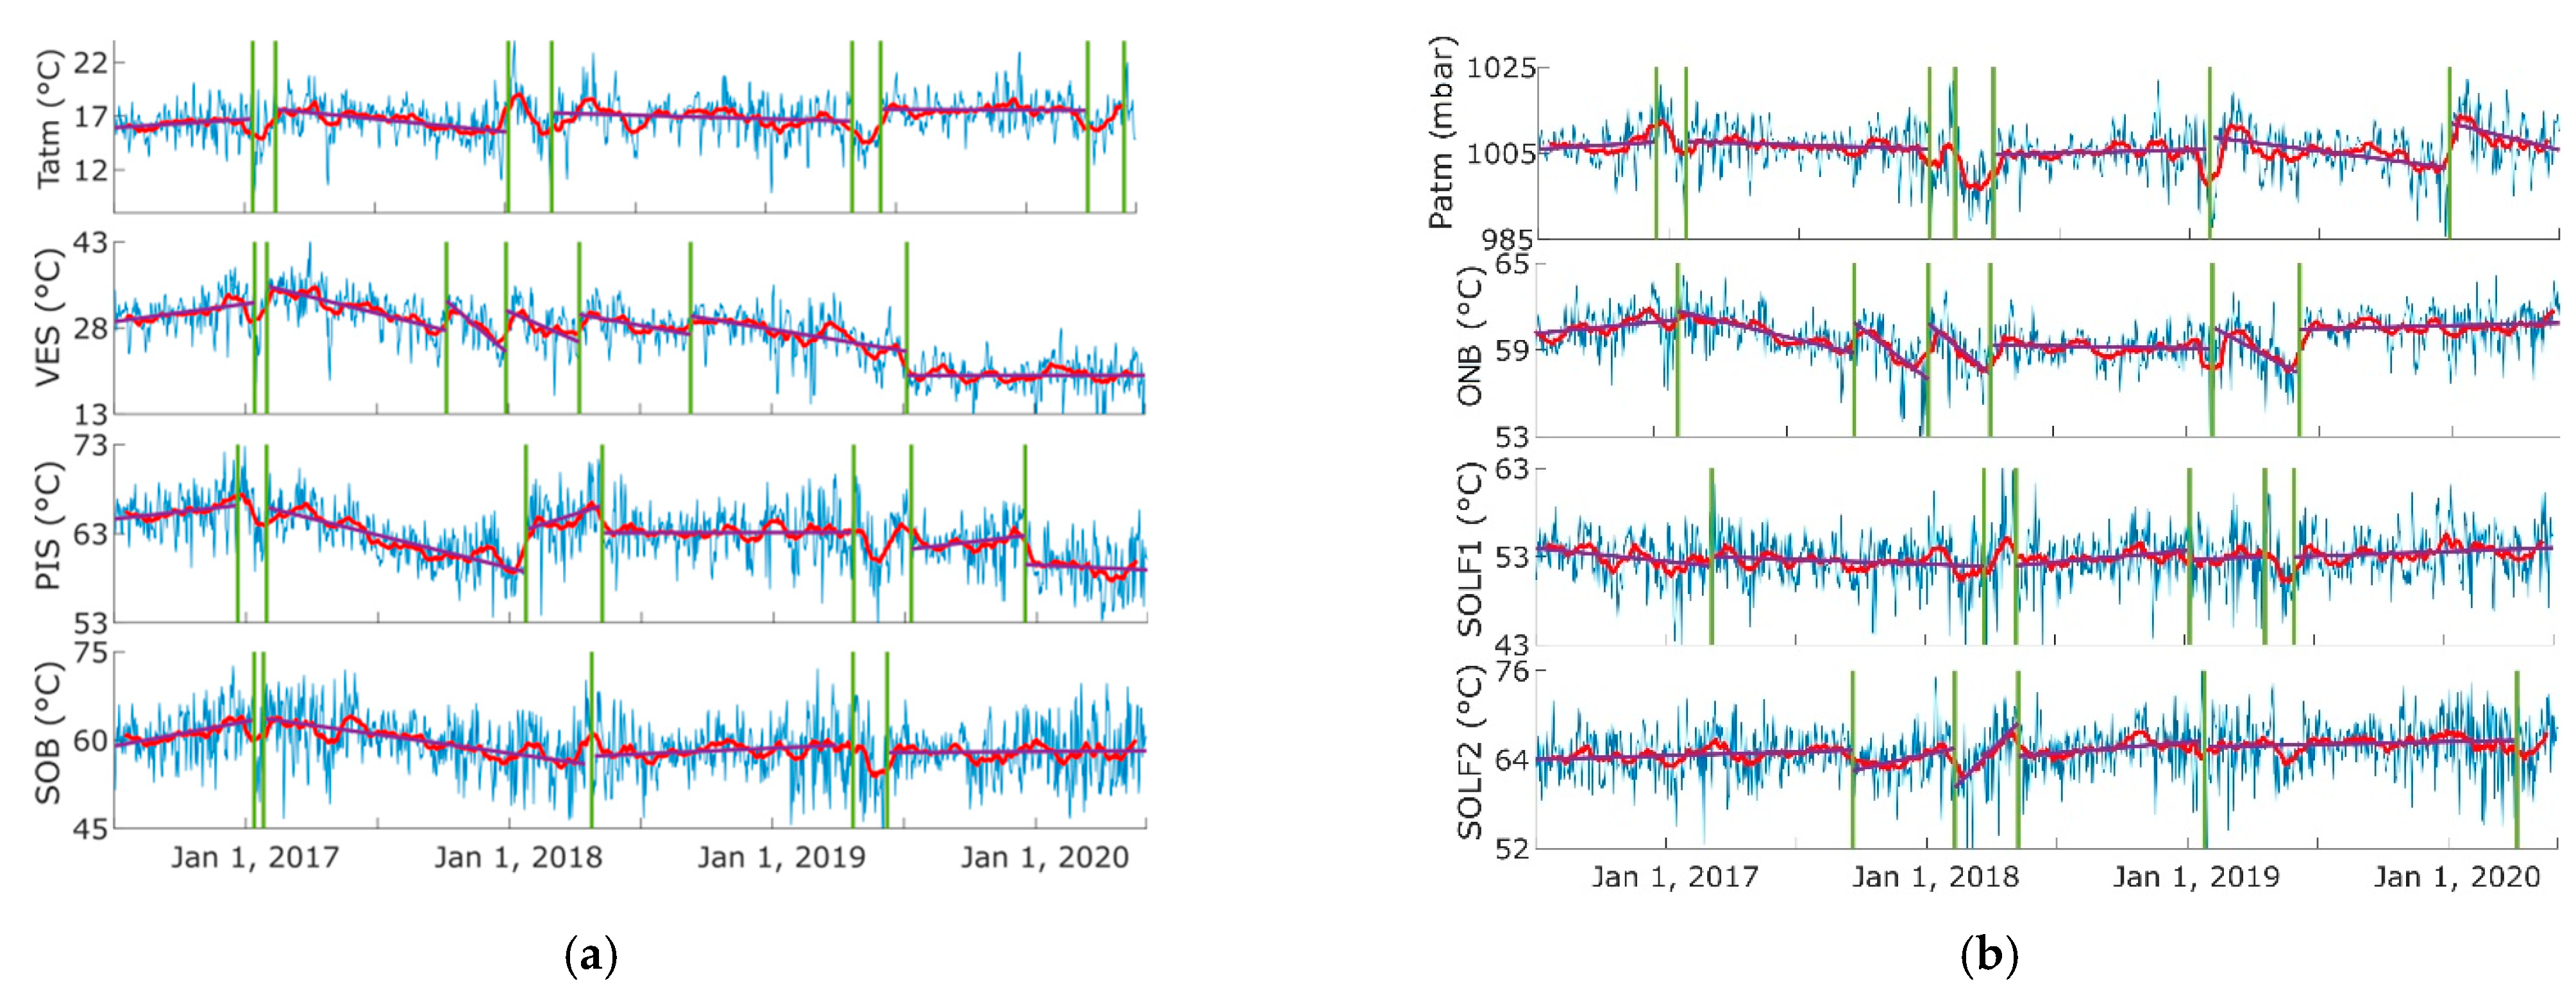
3.3. Changing Points Analysis

To quantify the similarities that emerged in the spectral and ICA analyses, we first compared the TIR time-series of CFc with VES, and all the TIRs with the air temperature by using the cross-correlation function for each of the identified frequency bands. The results are summarized in Table 1. In general, it emerges that the longer the period, the higher the correlation coefficient. The high correlation among the CFc TIRs, VES and the air temperature in correspondence in the longer periods could reflect the influence of large scale atmospheric factors on the ground temperature.
To deeper investigate the similarity among the time-series, we performed a Changing Points (CPs) analysis by using Matlab function findchangepts [50]. This function partitions the input time-series into adjacent segments that minimize the sum of the squared residual error of each segment from its local mean, and returns the changing points and, optionally, the trend inside each segment. The algorithm requires one to specify the maximum number of CPs to retrieve, as input parameter. To fix the maximum number of CPs, we let it vary over a wide range of values (from 1 to 20) and then evaluated how many output CPs are estimated. For each series, we found at most 8 CPs and, hence, we set the maximum number of CPs parameter to this value. We checked also the rms option, which evaluates the root-mean-square level of the most significant signal changes, and obtained the same results. The results are shown in Figure 5.
Tatm has 8 CPs, whereas for VES and PIS, we found 7 CPs, as reported in Table 2 and represented in Figure 5 (green lines). The linear trends variation in °C between the consecutive CPs is indicated in Table 2 as well. Almost all the time-series show one or two CPs in correspondence with the main air temperature minima: 5 February 2017; 5 June 2019; 12 May 2020. This behavior common to all could be ascribed to the sensibility of soil temperature to strong air temperature anomalies. For all the time-series, further support for that hypothesis comes from the stability of the first 3 CPs’ position as varying the CPs’ number parameter in the Matlab function.
Figure 5 highlights a common pattern of Tatm, VES, PIS, SOB and OBN from the beginning of the observations to the end of year 2017: (1) increasing until the first CP; (2) a minimum between the first and the second CPs; (3) decreasing. The slight differences among homologous CPs throughout the various time-series could be attributed to a different site response to a specific solicitation, due to local rheology and/or topography which modulates the geophysical and geochemical signals [33,34,35,42]. Taking into account the differences and distances among the instruments, the common pattern can be ascribed to an exogenous, large spatial scale effect.
The similarities among Tatm and Patm and VES and OBN likely indicate a significant influence of external meteorological conditions on these TIRs. VES shows also an overall decreasing trend, in agreement with other observations [22].
Hereinafter, we indicate the CPs of Tatm, VES and PIS as CPT, CPV and CPP following the scheme of Table 2.
Interesting patterns are visible for SOB and, mainly, for PIS (Figure 5). Starting from the end of 2017, Tatm presents a maximum (29 December 2017, CPT-3) that ends in correspondence with CPT-4 (28 February 2018). Otherwise, in the same time range, PIS continued to increase, until CPP-4 (2 May 2018). From this CP, PIS continues to follow a different behavior. In particular, this TIR has a CP on 10 December 2019 (CPP-7) not present in Tatm nor in Patm. Concerning SOB, even if the CPs of this TIR have the correspondent ones in Tatm, from the beginning of 2018, the time-series amplitude pattern is more like PIS. The difference between PIS and SOB on December 2019 (CPP-7) seems not driven by external factors.
A correlation analysis [51,52] of PIS and SOB TIR data acquired during 2016–2017 and 2018–2020 shows that at zero lag, the time-series are correlated well above the 95% confidence level (blue lines in Figure 6); in addition, the periodicity observed in 2016–2017 (Figure 6, top), and likely related to Tatm, strongly reduces in 2018–2020.
For SF1 and SF2 (Figure 5), we found overall flat trends, both interrupted by 8 and 7 CPs respectively, marking the minima and maxima that exactly correspond to the main minima and maxima of atmospheric temperature (Table 2). SF1 has an overall constant trend in correspondence of about 53 °C. SF2 has a linear slight increasing pattern, starting from about 64 °C to 66.4 °C. These trends are possibly attributable to the presence of several continuous heat sources inside the Solfatara crater, acting as a mechanical system in thermal equilibrium with a heat bath at a fixed temperature.
The described results are compatible with the existence of an overall exogenous large scale effect that significantly influences the ground temperatures. This effect dominates over the trends until the end of 2017. At the beginning of 2018, the CFc TIRs start to significantly deviate by this exogenous pattern (though still present), above all, in correspondence with exceptional long-lasting (several weeks) meteorological phenomena (main, minima and maxima).

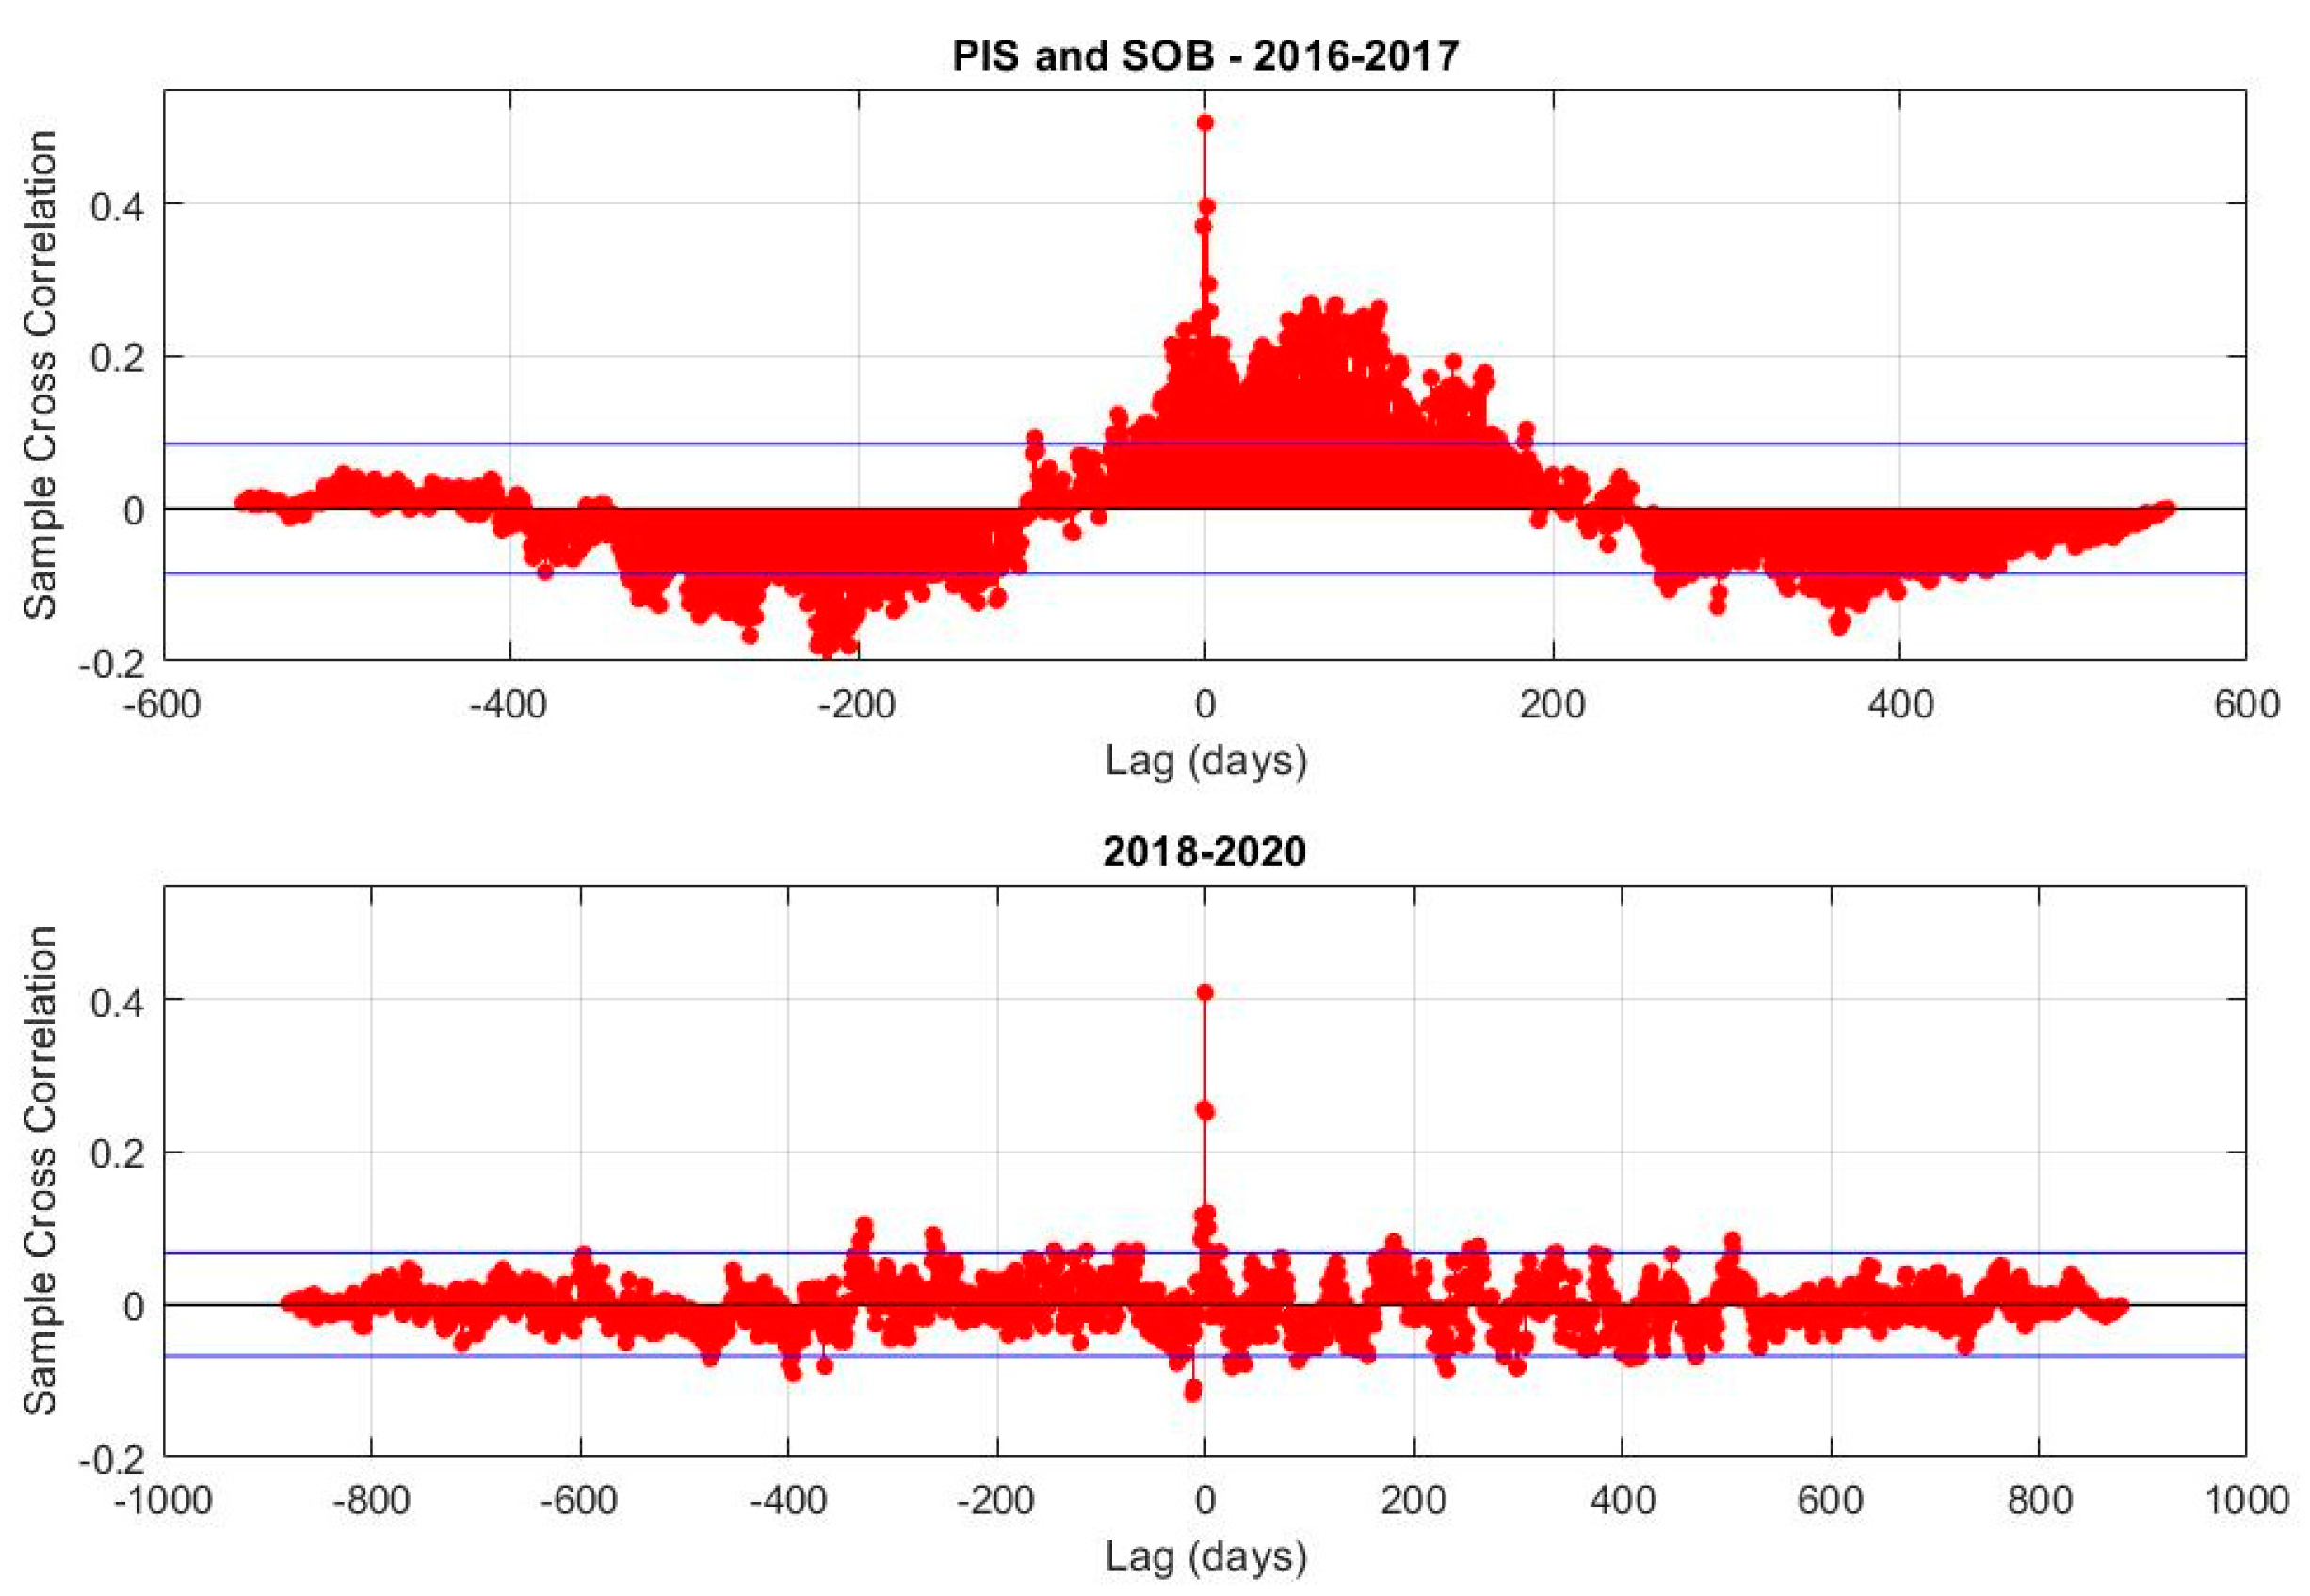
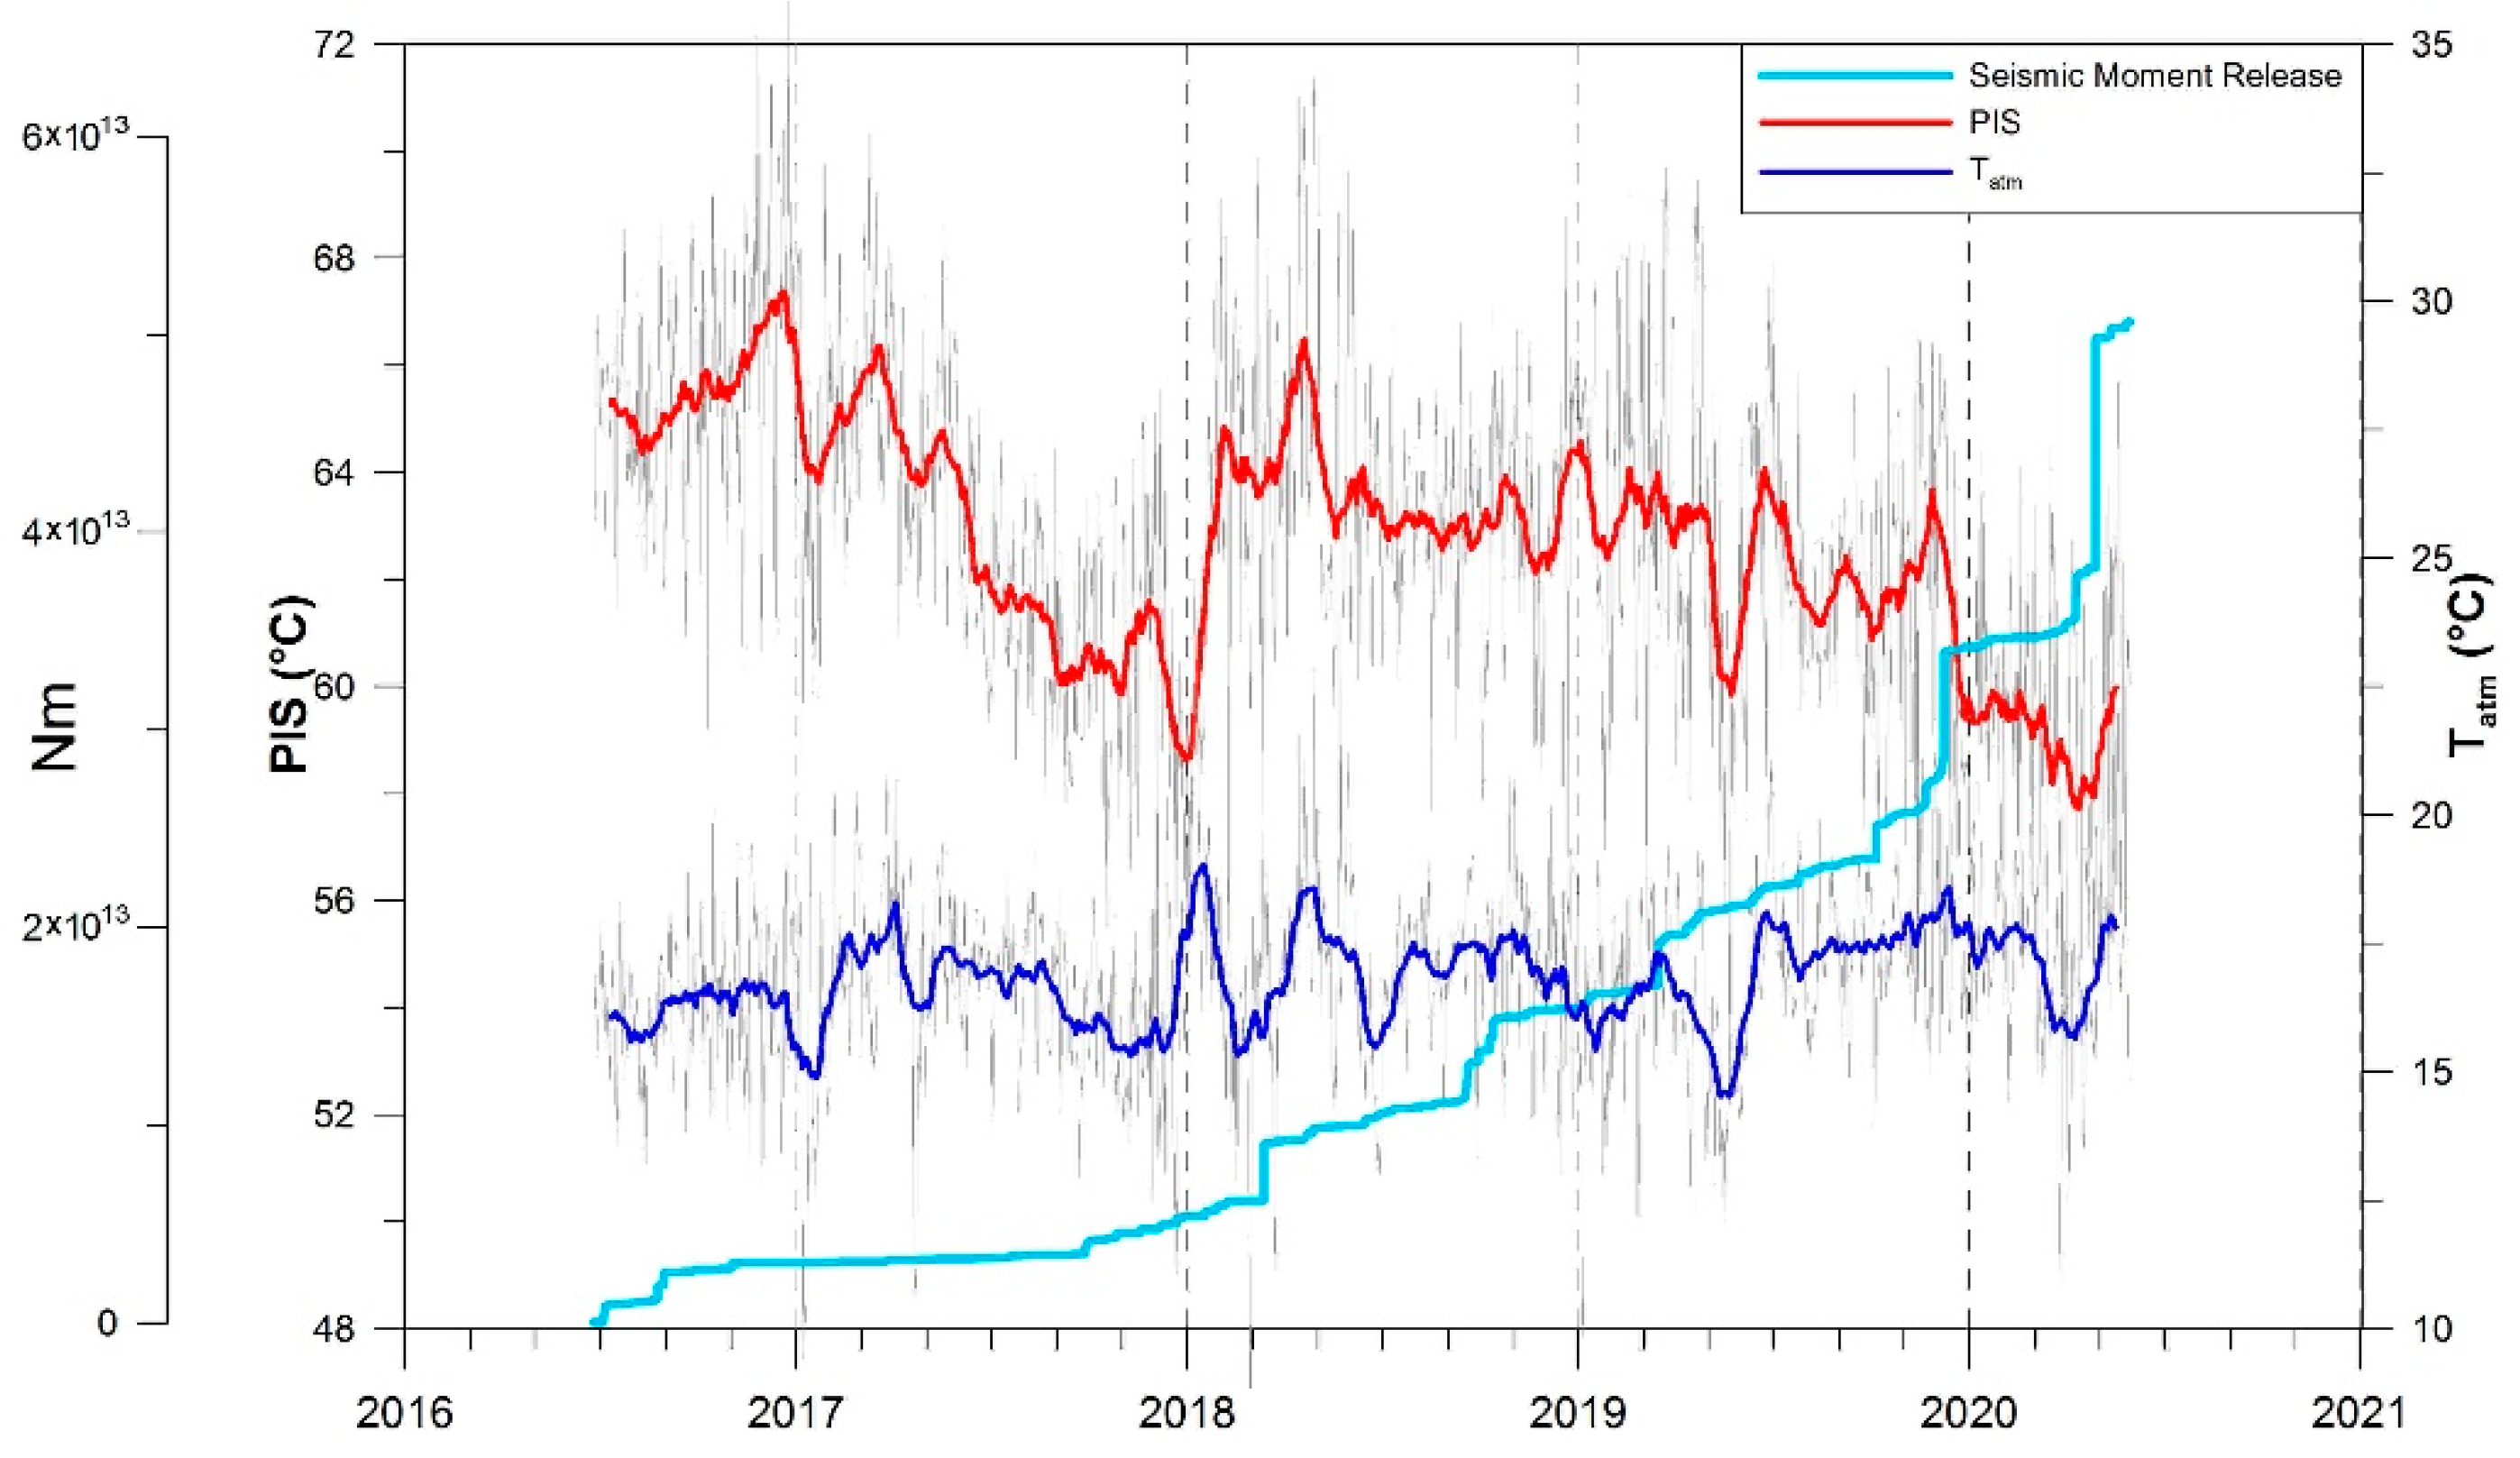
CFc TIR Time-Series, Seismicity and CO2 Flux

We compared the temporal pattern of the TIR PIS with the cumulative seismic moment, which is proportional to the seismic energy [53], and CO2 flux [22], to check a possible link with endogenous sources.
The seismic moment was obtained by applying the relationship [54] for the CFc area:
LogM0 = 9.9 + 0.9·Md
where M0 is the seismic moment expressed in Nm and Md is the duration magnitude.
As shown in Figure 7, the seismic energy/moment increased starting from 2018. The most significant changes in the rate of energy release occurred in December 2019 and April 2020 in concomitance with Md 3.1 and 3.3 earthquakes. The interval of increasing seismic energy corresponds to the TIRs’ deviation from the atmospheric trend, suggesting that since 2018, TIR patterns could be more affected by endogenous dynamics. Indeed, since 2018, signs of variations were also detected in earthquake number and location. Bellucci Sessa et al. [20] observed an increase of both seismic swarms and background seismicity, particularly marked in 2019. In this last year, the location became shallower, with hypocenters in the first 2 km of depth. Moreover, the authors evidenced a progressive spatial clustering of the seismicity, started in 2016 (and even more evident in 2019), inside the area of Solfatara–Pisciarelli.
In a similar manner, the temporal pattern of PIS temperature is correlated with the CO2 flux released at Pisciarelli, measured using the accumulation chamber method [42]. The flux is continuously acquired by a multiparametric station, employed 20 m downwind of Pisciarelli main boiling pool. Starting from the beginning of 2018, the CO2 flux showed a growing oscillating trend, and presented a marked peak in early 2020 [22].

4. Discussion and Conclusions

In this study, we have analyzed time-series over about four years (25 June 2016–29 May 2020) of the surface temperatures extracted from thermal infrared images acquired by the TIR stations operative in the SolfataraPisciarelli volcanic complex. Investigations regarding the thermal behavior of this area, characterized by the main hydrothermal/volcanic emission of CFc, are aimed to contribute to the identification of possible endogenous and/or exogenous sources. The analyses were carried out by comparing the patterns of CFc thermal infrared surface temperatures, with the air temperature and atmospheric pressure measured at Capo Miseno meteo-station. In order to find eventual large-scale influence on TIR trends, a comparison was also carried out with the TIR station at Mt. Vesuvius. CFc TIR time-series are also compared with the cumulative seismic moment release of the CFc seismicity and the CO2 flux at the Pisciarelli site.
Although seasonal periodicity was removed from all the time series, atmospheric factors clearly still influenced the surface temperatures. Both the spectral-ICA and CP analyses have demonstrated the existence of a non-negligible impact of atmospheric effects. The spectral content of the estimated ICs, which is common to the CFc TIRs, matches the main spectral content of the atmospheric time-series and of VES TIR, in agreement with Caputo et al. [15]. For all the TIRs, we followed the time-evolution of the spectral bands identified by the application of ICA. For all the bands, we found a common pattern for both CFc and Mt. Vesuvius, until late 2017. Then, the CFc TIRs started to differentiate from the VES series’ trend, although some common features were still present. The cross-correlation analysis has shown similarities among the TIRs: the longer the period, the higher the correlation level, in agreement with the influence of a large scale factor.
The common patterns observed in 2016–2017 were confirmed by the CPs analysis, in which we found compatible CPs’ positions and trends among all the TIRs, except for SF1 and SF2. The latter TIRs had, indeed, almost flat trends all over the observation time, suggesting a surface temperatures field inside the Solfatara crater due to a system in thermal equilibrium.
The footprints of a background exogenous large scale influence were mainly testified by the coincidence of the CPs of most series, with the maxima and minima of Tatm, which in turn corresponded to exceptional long-lasting (several weeks) meteorological phenomena.
The interplay between the atmosphere parameters and the ground temperatures is nontrivial. Behind the seasonal periodicity (that we have corrected), the influence of the atmospheric factors on the surface temperatures could be twofold: a direct effect, linked to ground heating and/or the atmospheric loading; and an indirect effect on the flux of hydrothermal fluids, such as CO2 flux, which in turn affects the surface temperatures [42]. Indeed, the link between atmospheric exogenous effects and gas emissions has been also noticed for CFc and Mt. Vesuvius [42,55,56], as well as in other worldwide cases [57,58].
At the beginning of 2018, while Tatm values decreased after reaching a maximum, PIS temperature continued to increase. Since then, PIS has deviated from the atmospheric trend. The different behavior of PIS could not be simply attributed to a local site effect, since SOB, which points towards the top of the SE slope of the Solfatara crater, shows a pattern similar to PIS. The year 2018 was also peculiar for seismic activity, since an increase of both seismic swarms and background seismicity were observed [20]. According to Bellucci Sessa et al. [20], in this period, seismicity began also to cluster in the study area. Moreover, a consistent fluid transfer was detected starting from 2018 by using polarization analysis of seismic noise [59]. In addition, CO2 flux measured at the Pisciarelli site showed some anomalies in the flow rate [22]. These evidences strongly support the hypothesis of a common endogenous source to explain the patterns observed in the time span between 2018–2020.
Another strong indication of an endogenous driving of the ground temperatures in the Solfatara–Pisciarelli area appeared in December 2019, when we recorded a significant temperature decrease at PIS (about −4 °C in 20 days). At the same time, the spectral power time-evolution of Solfatara TIRs (SF1, SF2 and SOB) showed an increase of soil temperature in the 10–20 d band. Simultaneously (6 December 2019), a remarkable seismic swarm occurred beneath the Pisciarelli area, causing one of the most significant increases of seismic energy rate of the last years. From this time, the earthquake locations became shallower, with hypocenters in the first 2 km of depth [20]. A significant rising of CO2 concentration was also recorded after the December 6 swarm, superimposing to an already growing trend, suggesting a consistent increase of the emitted fluid flux at Pisciarelli boiling pool. No evident variation of CO2 flux was evidenced inside the Solfatara crater [22].
The impact of the hydrothermal/volcanic source over the surface temperatures is also evidenced by the correlation analysis performed for PIS and SOB in 2018–2020. The correlation analysis results are also in agreement with the geophysical/geological models of the shallow hydrothermal system of the Solfatara–Pisciarelli complex reported in recent studies [60,61,62,63]. These studies evidence the presence of a resistive clay-rich cap rock extending underneath the study area, at depths from 0 to 50 m b.s.l. This cap rock is interrupted by conductive gaps, due to fracture zones (where subvertical faults exist). The fractures allow the pressured fluids to up-flow from a deep hydrothermal system to reach the surface, where the highest values of gas flux are recorded, in particular, at Solfatara SE rim fumaroles and Pisciarelli boiling pool. On the other hand, underneath the Pisciarelli area, a shallow moderate resistive zone is observed, interpreted as a zone where the outflow occurs, deepening toward the region where most of the recent seismicity is located.
In conclusion, the results of the analysis performed in the study area allowed one to identify the time periods in which endogenous hydrothermal/volcanic sources strongly influenced TIR surface temperatures from those periods in which exogenous factors prevail. Concerning the endogenous driving, the most interesting patterns occurred at the end of 2019 at the Pisciarelli area. We hypothesize a simple conceptual model to explain the evidenced patterns. The seismic swarm that occurred in December fractured the medium, increasing the permeability and, likely, opening a preferential uprising path for the pressurized fluids towards the boiling pool at the Pisciarelli emission area, where the CO2 flux is routinely measured. The ejection of the gases could have caused a depressurization of the hydrothermal/volcanic system, which in turn caused the lowering of the ground temperatures.
On the other hand, in the Solfatara crater, the fluid circulation remained almost unchanged after the swarm; thus, a possible moderate fluid injection caused the growth of the ground thermal energy rate.
The present study has confirmed the important contribution of TIR observations in monitoring hydrothermal/volcanic system. TIR datasets are, indeed, useful to detect the effect of the endogenous source when the hydrothermal/volcanic forcing becomes strong enough to overcome the atmospheric effects. Moreover, the use of a network of TIR stations is fundamental to exclude local site effects.
Nevertheless, we stress the importance of monitoring the atmospheric parameters in hydrothermal/volcanic environments, since the ground temperatures, the gas flux and the seismicity patterns have been demonstrated to share evident correspondences with atmospheric behaviors (especially wet–dry seasons’ periodicity) [40,42,56].

Author Contributions

Conceptualization, P.C. and T.C.; methodology, P.C., T.C., E.D.L., M.F. and S.P.; validation, all; formal analysis, P.C., T.C., E.D.L., M.F. and S.P.; investigation, P.C., T.C., E.D.L., M.F. and S.P.; data curation, G.V., F.S. and T.C.; writing—original draft preparation, all; writing—review and editing, all; funding acquisition, G.V. and F.S. All authors have read and agreed to the published version of the manuscript.

Funding

This research received no external funding.

Institutional Review Board Statement

Not applicable.

Informed Consent Statement

Not applicable.

Data Availability Statement

Data are available at doi:10.5281/zenodo.5109809.

Acknowledgments

The data used in this paper have been acquired with the INGV-OV monitoring systems, in the framework of the Agreement (Annex A) between the Italian Civil Protection Department (DPC) and INGV. We wish to thank Adriano La Rocca (INGV-OV) for having made available the meteorological dataset, and Eliana Bellucci Sessa (INGV-OV) for the thematic map. Paolo Madonia is acknowledged for the useful discussions. The two anonymous referees are thanked for the useful comments and suggestions.

Conflicts of Interest

The authors declare no conflict of interest.

References

  1. Spampinato, L.; Calvari, S.; Oppenheimer, C.; Boschi, E. Volcano surveillance using infrared cameras. Earth Sci. Rev. 2011, 106, 63–91. [Google Scholar] [CrossRef]
  2. Harris, A. Thermal Remote Sensing of Active Volcanoes: A User’s Manual; Cambridge University Press: Cambridge, UK, 2013; ISBN 052185945X. [Google Scholar]
  3. Blackett, M. An overview of infrared remote sensing of volcanic activity. J. Imaging 2017, 3, 13. [Google Scholar] [CrossRef]
  4. Silvestri, M.; Marotta, E.; Buongiorno, M.F.; Avvisati, G.; Belviso, P.; Bellucci Sessa, E.; Caputo, T.; Longo, V.; De Leo, V.; Teggi, S. Monitoring of surface temperature on Parco delle Biancane (Italian geothermal area) using optical satellite data, UAV and field campaigns. Remote Sens. 2020, 12, 2018. [Google Scholar] [CrossRef]
  5. Kervyn, M.; Kervyn, F.; Goossens, R.; Rowland, S.K.; Ernst, G.G.J. Mapping Volcanic Terrain Using High-Resolution and 3D Satellite Remote Sensing. Available online: sp.lyellcollection.org (accessed on 7 May 2021).
  6. Kieffer, H.H.; Frank, D.; Friedman, J.D. The 1980 Eruptions of Mount St. Helens, Washington. Thermal Infrared Surveys at Mount St. Helens—Observations Prior to the Eruption of May 18; Geological Survey Professional Paper; Federal Center: Denver, CO, USA, 1981. [Google Scholar]
  7. Hernández, P.A.; Pérez, N.M.; Varekamp, J.C.; Henriquez, B.; Hernández, A.; Barrancos, J.; Padrón, E.; Calvo, D.; Melián, G. Crater lake temperature changes of the 2005 eruption of Santa Ana volcano, El Salvador, Central America. Pure Appl. Geophys. 2007, 164, 2507–2522. [Google Scholar] [CrossRef]
  8. Calvari, S.; Lodato, L.; Spampinato, L. Monitoring active volcanoes using a handheld thermal camera. In Proceedings of the Thermosense XXVI, Orlando, FL, USA, 13–15 April 2004; Burleigh, D.D., Cramer, K.E., Peacock, G.R., Eds.; SPIE: Bellingham, WA, USA, 2004; Volume 5405, p. 199. [Google Scholar]
  9. Hilman, Z.; Saepuloh, A.; Susanto, V. Application of land surface temperature derived from ASTER TIR to identify volcanic gas emission around bandung basin. Int. J. Remote Sens. Earth Sci. 2020, 16, 179. [Google Scholar] [CrossRef]
  10. Hilman, Z.; Saepuloh, A.; Chalik, C.A.; Heriawan, M.N. Identifying upflow zone based on thermal infrared (TIR) sensor and field. In IOP Conference Series: Earth and Environmental Science; Institute of Physics Publishing: Bristol, UK, 2020; Volume 417, p. 012011. [Google Scholar]
  11. Silvestri, M.; Cardellini, C.; Chiodini, G.; Buongiorno, M.F. Satellite-derived surface temperature and in situ measurement at Solfatara of Pozzuoli (Naples, Italy). Geochem. Geophys. Geosyst. 2016, 17, 2095–2109. [Google Scholar] [CrossRef] [Green Version]
  12. Vilardo, G.; Chiodini, G.; Augusti, V.; Granieri, D.; Caliro, S.; Minopoli, C.; Terranova, C. The Permanent Thermal Infrared Network for the Monitoring of Hydrothermal Activity at the Solfatara and Vesuvius Volcanoes. In Conception, Verification and Application of Innovative Techniques to Study Active Volcanoes; Marzocchi, W., Zollo, A., Eds.; DoppiaVoce: Naples, Italy, 2008; pp. 481–495. [Google Scholar]
  13. Vilardo, G.; Sansivero, F.; Chiodini, G. Long-term TIR imagery processing for spatiotemporal monitoring of surface thermal features in volcanic environment: A case study in the Campi Flegrei (Southern Italy). J. Geophys. Res. Solid Earth 2015, 120, 812–826. [Google Scholar] [CrossRef]
  14. Caputo, T.; Sessa, E.B.; Silvestri, M.; Buongiorno, M.F.; Musacchio, M.; Sansivero, F.; Vilardo, G. Surface temperature multiscale monitoring by thermal infrared satellite and ground images at Campi Flegrei volcanic area (Italy). Remote Sens. 2019, 11, 1007. [Google Scholar] [CrossRef] [Green Version]
  15. Caputo, T.; Cusano, P.; Petrosino, S.; Sansivero, F.; Vilardo, G. Spectral analysis of ground thermal image temperatures: What we are learning at Solfatara volcano (Italy). Adv. Geosci. 2020, 52, 55–65. [Google Scholar] [CrossRef]
  16. Marotta, E.; Peluso, R.; Avino, R.; Belviso, P.; Caliro, S.; Carandente, A.; Chiodini, G.; Macedonio, G.; Avvisati, G.; Marfè, B. Thermal energy release measurement with thermal camera: The case of La Solfatara volcano (Italy). Remote Sens. 2019, 11, 167. [Google Scholar] [CrossRef] [Green Version]
  17. Chiodini, G.; Granieri, D.; Avino, R.; Caliro, S.; Costa, A.; Werner, C. Carbon dioxide diffuse degassing and estimation of heat release from volcanic and hydrothermal systems. J. Geophys. Res. Solid Earth 2005, 110, 1–17. [Google Scholar] [CrossRef]
  18. Petrosino, S.; Damiano, N.; Cusano, P.; Di Vito, M.A.; de Vita, S.; Del Pezzo, E. Subsurface structure of the Solfatara volcano (Campi Flegrei caldera, Italy) as deduced from joint seismic-noise array, volcanological and morphostructural analysis. Geochem. Geophys. Geosyst. 2012, 13. [Google Scholar] [CrossRef] [Green Version]
  19. Bianco, F.; Castellano, M.; Cogliano, R.; Cusano, P.; Del Pezzo, E.; Antonio Di Vito, M.; Fodarella, A.; Galluzzo, D.; La Rocca, M.; Milana, G.; et al. Caratterizzazione del noise sismico nell’area vulcanica dei Campi Flegrei (Napoli): L’esperimento “uNREST”. Quad. Geofis. 2010, 86, 1–19. [Google Scholar]
  20. Bellucci Sessa, E.; Castellano, M.; Ricciolino, P. GIS applications in volcano monitoring: The study of seismic swarms at the Campi Flegrei volcanic complex, Italy. Adv. Geosci. 2021, 52, 131–144. [Google Scholar] [CrossRef]
  21. Cataloghi Sismici Vulcani Campani. Available online: http://www.ov.ingv.it/ov/it/banche-dati/186-catalogo-sismico-del-vesuvio.html (accessed on 14 June 2021).
  22. Bollettini di Monitoraggio Vulcanico. Available online: https://www.ov.ingv.it/ov/it/bollettini.html (accessed on 17 April 2021).
  23. Chiodini, G.; Paonita, A.; Aiuppa, A.; Costa, A.; Caliro, S.; De Martino, P.; Acocella, V.; Vandemeulebrouck, J. Magmas near the critical degassing pressure drive volcanic unrest towards a critical state. Nat. Commun. 2016, 7, 1–9. [Google Scholar] [CrossRef] [PubMed] [Green Version]
  24. Vilardo, G.; Ventura, G.; Bellucci Sessa, E.; Terranova, C. Morphometry of the Campi Flegrei caldera (Southern Italy). J. Maps 2013, 9, 635–640. [Google Scholar] [CrossRef]
  25. Orsi, G.; De Vita, S.; Di Vito, M. The restless, resurgent Campi Flegrei nested caldera (Italy): Constraints on its evolution and configuration. J. Volcanol. Geotherm. Res. 1996, 74, 179–214. [Google Scholar] [CrossRef]
  26. Acocella, V. Activating and reactivating pairs of nested collapses during calderaforming eruptions: Campi Flegrei (Italy). Geophys. Res. Lett. 2008, 35, L17304. [Google Scholar] [CrossRef]
  27. Fedele, L.; Scarpati, C.; Lanphere, M.; Melluso, L.; Morra, V.; Perrotta, A.; Ricci, G. The Breccia Museo formation, Campi Flegrei, southern Italy: Geochronology, chemostratigraphy and relationship with the Campanian Ignimbrite eruption. Bull. Volcanol. 2008, 70, 1189–1219. [Google Scholar] [CrossRef]
  28. Scarpati, C.; Perrotta, A.; Lepore, S.; Calvert, A. Eruptive history of Neapolitan volcanoes: Constraints from 40Ar-39Ar dating. Geol. Mag. 2013, 150, 412–425. [Google Scholar] [CrossRef] [Green Version]
  29. Di Vito, M.A.; Acocella, V.; Aiello, G.; Barra, D.; Battaglia, M.; Carandente, A.; Del Gaudio, C.; de Vita, S.; Ricciardi, G.P.; Ricco, C.; et al. Magma transfer at Campi Flegrei caldera (Italy) before the 1538 AD eruption. Sci. Rep. 2016, 6, 32245. [Google Scholar] [CrossRef]
  30. Orsi, G.; Civetta, L.; Del Gaudio, C.; De Vita, S.; Di Vito, M.A.; Isaia, R.; Petrazzuoli, S.M.; Ricciardi, G.P.; Ricco, C. Short-term ground deformations and seismicity in the resurgent Campi Flegrei caldera (Italy): An example of active block-resurgence in a densely populated area. J. Volcanol. Geotherm. Res. 1999, 91, 415–451. [Google Scholar] [CrossRef]
  31. Del Gaudio, C.; Aquino, I.; Ricciardi, G.P.; Ricco, C.; Scandone, R. Unrest episodes at Campi Flegrei: A reconstruction of vertical ground movements during 1905–2009. J. Volcanol. Geotherm. Res. 2010, 195, 48–56. [Google Scholar] [CrossRef]
  32. De Martino, P.; Tammaro, U.; Obrizzo, F. GPS time series at Campi Flegrei caldera (2000–2013). Ann. Geophys. 2014, 57, 213. [Google Scholar]
  33. De Lauro, E.; Petrosino, S.; Ricco, C.; Aquino, I.; Falanga, M. Medium and long period ground oscillatory pattern inferred by borehole tiltmetric data: New perspectives for the Campi Flegrei caldera crustal dynamics. Earth Planet Sci. Lett. 2018, 504, 21–29. [Google Scholar] [CrossRef]
  34. Ricco, C.; Petrosino, S.; Aquino, I.; Del Gaudio, C.; Falanga, M. Some investigations on a possible relationship between ground deformation and seismic activity at Campi Flegrei and Ischia volcanic areas (Southern Italy). Geosciences 2019, 9, 222. [Google Scholar] [CrossRef] [Green Version]
  35. Petrosino, S.; Ricco, C.; De Lauro, E.; Aquino, I.; Falanga, M. Time evolution of medium and long-period ground tilting at Campi Flegrei caldera. Adv. Geosci. 2020, 52, 9–17. [Google Scholar] [CrossRef] [Green Version]
  36. Giudicepietro, F.; Chiodini, G.; Avino, R.; Brandi, G.; Caliro, S.; De Cesare, W.; Galluzzo, D.; Esposito, A.; La Rocca, A.; Lo Bascio, D.; et al. Tracking episodes of seismicity and gas transport in Campi Flegrei caldera through seismic, geophysical, and geochemical measurements. Seismol. Res. Lett. 2021, 92, 965–975. [Google Scholar] [CrossRef]
  37. Saccorotti, G.; Petrosino, S.; Bianco, F.; Castellano, M.; Galluzzo, D.; La Rocca, M.; Del Pezzo, E.; Zaccarelli, L.; Cusano, P. Seismicity associated with the 2004–2006 renewed ground uplift at Campi Flegrei Caldera, Italy. Phys. Earth Planet. Inter. 2007, 165, 14–24. [Google Scholar] [CrossRef] [Green Version]
  38. Cusano, P.; Petrosino, S.; Saccorotti, G. Hydrothermal origin for sustained Long-Period (LP) activity at Campi Flegrei Volcanic Complex, Italy. J. Volcanol. Geotherm. Res. 2008, 177, 1035–1044. [Google Scholar] [CrossRef]
  39. D’Auria, L.; Giudicepietro, F.; Aquino, I.; Borriello, G.; Del Gaudio, C.; Lo Bascio, D.; Martini, M.; Ricciardi, G.P.; Ricciolino, P.; Ricco, C. Repeated fluid-transfer episodes as a mechanism for the recent dynamics of Campi Flegrei caldera (1989–2010). J. Geophys. Res. Solid Earth 2011, 116, B04313. [Google Scholar] [CrossRef]
  40. Petrosino, S.; Cusano, P.; Madonia, P. Tidal and hydrological periodicities of seismicity reveal new risk scenarios at Campi Flegrei caldera. Sci. Rep. 2018, 8, 13808. [Google Scholar] [CrossRef] [Green Version]
  41. Cardellini, C.; Chiodini, G.; Frondini, F.; Avino, R.; Bagnato, E.; Caliro, S.; Lelli, M.; Rosiello, A. Monitoring diffuse volcanic degassing during volcanic unrests: The case of Campi Flegrei (Italy). Sci. Rep. 2017, 7, 1–15. [Google Scholar] [CrossRef] [Green Version]
  42. Granieri, D.; Avino, R.; Chiodini, G. Carbon dioxide diffuse emission from the soil: Ten years of observations at Vesuvio and Campi Flegrei (Pozzuoli), and linkages with volcanic activity. Bull. Volcanol. 2010, 72, 103–118. [Google Scholar] [CrossRef]
  43. Sansivero, F.; Scarpato, G.; Vilardo, G. The automated infrared thermal imaging system for the continuous long-term monitoring of the surface temperature of the Vesuvius crater. Ann. Geophys. 2013, 56, S0454. [Google Scholar]
  44. Sansivero, F.; Vilardo, G. Processing thermal infrared imagery time-series from volcano permanent ground-based monitoring network. Latest methodological improvements to characterize surface temperatures behavior of thermal anomaly areas. Remote Sens. 2019, 11, 553. [Google Scholar] [CrossRef] [Green Version]
  45. Hyvarinen, A.; Karhunen, J.; Oja, E. Independent Component Analysis; John Wiley & Sons Inc.: New York, NY, USA, 2001. [Google Scholar]
  46. De Lauro, E.; De Martino, S.; Falanga, M.; Palo, M. Statistical analysis of Stromboli VLP tremor in the band [0.1–0.5] Hz: Some consequences for vibrating structures. Nonlinear Process. Geophys. 2006, 13, 393–400. [Google Scholar] [CrossRef] [Green Version]
  47. De Martino, S.; Falanga, M.; Palo, M.; Montalto, P.; Patanè, D. Statistical analysis of the volcano seismicity during the 2007 crisis of Stromboli, Italy. J. Geophys. Res. 2011, 116, B09312. [Google Scholar] [CrossRef]
  48. De Lauro, E.; De Martino, S.; Falanga, M.; Petrosino, S. Fast wavefield decomposition of volcano-tectonic earthquakes into polarized P and S waves by Independent Component Analysis. Tectonophysics 2016, 690, 355–361. [Google Scholar] [CrossRef]
  49. Capuano, P.; De Lauro, E.; De Martino, S.; Falanga, M. Detailed investigation of long-period activity at Campi Flegrei by convolutive independent component analysis. Phys. Earth Planet. Inter. 2016, 253, 48–57. [Google Scholar] [CrossRef]
  50. MathWorks Find Abrupt Changes in Signal—MATLAB Findchangepts. Available online: https://it.mathworks.com/help/signal/ref/findchangepts.html (accessed on 23 April 2021).
  51. Shumway, R.H.; Stoffer, D.S. Characteristics of Time Series. In Time Series Analysis and Its Applications; Springer Texts in Statistics; Springer: New York, NY USA, 2000; pp. 1–88. [Google Scholar]
  52. Chatfield, C. The Analysis of Time Series: An Introduction; CRC, Chapman and Hall: London, UK, 2003; ISBN 0429208707. [Google Scholar]
  53. Petrosino, S.; de Siena, L.; del Pezzo, E. Recalibration of the magnitude scales at Campi Flegrei Italy, on the basis of measured path and site and transfer functions. Bull. Seismol. Soc. Am. 2008, 98, 1964–1974. [Google Scholar] [CrossRef] [Green Version]
  54. Galluzzo, D.; Del Pezzo, E.; La Rocca, M.; Petrosino, S. Peak ground acceleration produced by local earthquakes in volcanic areas of Campi Flegrei and Mt. Vesuvius. Ann. Geophys. 2004, 47, 1377–1389. [Google Scholar]
  55. Madonia, P. Variations of low temperature fumaroles as a tool for detecting changes in volcanic activity state: A brief overview. Adv. Geosci. 2020, 52, 97–103. [Google Scholar] [CrossRef]
  56. Tripaldi, S.; Telesca, L.; Lovallo, M. Spectral and informational analysis of temperature and chemical composition of Solfatara Fumaroles (Campi Flegrei, Italy). Entropy 2021, 23, 593. [Google Scholar] [CrossRef] [PubMed]
  57. Kim, C.Y.; Yu, S.; Oh, Y.Y.; Chae, G.; Yun, S.T.; Shinn, Y.J. Short-term monitoring of geogenic soil CO2 flux in a non-volcanic and seismically inactive emission site, South Korea. Front. Earth Sci. 2021, 8, 599388. [Google Scholar] [CrossRef]
  58. Inguaggiato, S.; Vita, F.; Cangemi, M.; Inguaggiato, C.; Calderone, L. The monitoring of CO2 soil degassing as indicator of increasing volcanic activity: The paroxysmal activity at stromboli volcano in 2019–2021. Geosciences 2021, 11, 169. [Google Scholar] [CrossRef]
  59. Petrosino, S.; De Siena, L. Fluid migrations and volcanic earthquakes from depolarized ambient noise. Preprint Res. Square 2021. [Google Scholar] [CrossRef]
  60. Isaia, R.; Vitale, S.; Di Giuseppe, M.G.; Iannuzzi, E.; Tramparulo, F.D.A.; Troiano, A. Stratigraphy, structure, and volcano-tectonic evolution of Solfatara maar-diatreme (Campi Flegrei, Italy). Bull. Geol. Soc. Am. 2015, 127, 1485–1504. [Google Scholar] [CrossRef] [Green Version]
  61. Gresse, M.; Vandemeulebrouck, J.; Byrdina, S.; Chiodini, G.; Revil, A.; Johnson, T.C.; Ricci, T.; Vilardo, G.; Mangiacapra, A.; Lebourg, T.; et al. Three-dimensional electrical resistivity tomography of the Solfatara Crater (Italy): Implication for the multiphase flow structure of the shallow hydrothermal system. J. Geophys. Res. Solid Earth 2017, 122, 8749–8768. [Google Scholar] [CrossRef]
  62. Siniscalchi, A.; Tripaldi, S.; Romano, G.; Chiodini, G.; Improta, L.; Petrillo, Z.; D’Auria, L.; Caliro, S.; Avino, R. Reservoir structure and hydraulic properties of the Campi Flegrei geothermal system inferred by audiomagnetotelluric, geochemical, and seismicity study. J. Geophys. Res. Solid Earth 2019, 124, 5336–5356. [Google Scholar] [CrossRef]
  63. Isaia, R.; Di Giuseppe, M.G.; Natale, J.; Tramparulo, F.D.; Troiano, A.; Vitale, S. Volcano-tectonic setting of the Pisciarelli Fumarole field, Campi Flegrei Caldera, Southern Italy: Insights into fluid circulation patterns and hazard scenarios. Tectonics 2021, 40, e2020TC006227. [Google Scholar] [CrossRef]
Figure 1. TIR network. (a) On the left, CFc TIR cameras (red dots) and Capo Miseno meteo station (green dot). On the right, Vesuvius TIR camera (red dot); (b) Digital Terrain Model (DTM) of Solfatara crater [24] with locations of TIR stations (red dots) and studied framed areas (orange, blue and green areas) mapped in GIS environment using Field of View (FoV) values of infrared sensors (After Caputo et al. [15], Figure 1a).
Atmosphere 12 00940 g001aAtmosphere 12 00940 g001b
Figure 2. Analyzed time-series of ground temperatures: (a) from top to bottom, Tatm, VES, PIS and SOB (black lines); (b) from top to bottom, Patm, OBN, SF1 and SF2 (black lines), as indicated by the vertical axis labels. The red curves are the moving averages, estimated over 31-day-long time windows shifted by 1 day. In the plot of Tatm and Patm, we added cyan stars in correspondence to exceptional snowfalls. A red star marks the 2020 lockdown due to the COVID-19 pandemic.
Atmosphere 12 00940 g002
Figure 3. ICA results providing the decomposed independent signals (left) with periodicities on the annual scale (right).
Atmosphere 12 00940 g003
Figure 4. Spectral Power evaluated in the frequency bands (the relative characteristic periods are in the legend). Each point is associated with a half window. Notice how the behavior at all the time scales at Vesuvius is similar to those at CFc in the first part, implying a common exogenous origin.
Atmosphere 12 00940 g004
Figure 5. CPs analysis of TIR time-series and atmospheric temperature (a) and pressure (b) (blue lines). The red lines are the moving average (31 days). The vertical green lines mark the CPs. The trends between two consecutive CPs are represented by purple lines.
Atmosphere 12 00940 g005
Figure 6. Correlation analysis between PIS and SOB for the time-range 2016–2017 (top) and 2018–2020 (bottom). The blue lines mark the confidence limits (95%), above which the correlation among the time-series is considered significant.
Atmosphere 12 00940 g006
Figure 7. Seismicity. Comparison among the TIR time-series at Pisciarelli (red line marks 31, moving average), the atmospheric temperature (blue line marks 31, moving average) and the seismic moment release (cyan).
Atmosphere 12 00940 g007
Table 1. Cross-correlation values of time-series.
XCorr10–20 Days30–50 Days55–65 Days85–115 Days
Ves vs. PIS0.240.330.700.70
PIS vs. Tatm0.230.490.490.70
Ves vs. Tatm0.430.770.720.90
SF1 vs. Tatm0.470.530.570.81
SF2 vs. Tatm0.390.540.620.89
SOB vs. Tatm0.280.450.390.73
OBN vs. Tatm0.330.450.630.84
Table 2. Changing Points of Tatm (CPTs), VES (CPVs) and PIS (CPP) time-series. The minus/plus signs indicate decreasing/increasing trends. The trend is referred to the linear trend between CPs, in °C.
Tatm
CPTs Date
Trend 1
(°C)
Ves
CPVs Date
Trend 1
(°C)
PIS
CPPs Date
Trend 1
(°C)
14 January 2017+0.815 January 2017+3.3012 December 2016+1.52
25 February 2017min, 14.9322 January 2017+17.4921 January 2017max, 67.38
329 December 2017−2.1229 September 2017−7.6816 January 2018−7.27
428 February 2018max, 19.0321 December 2017−8.882 May 2018+2.70
526 April 2019−0.772 April 2018−5.5116 April 2019stable, 0.00
65 June 2019min, 14.524 September 2018−3.5020 May 2019min, 59.84
722 March 2020−0.112 July 2019−6.1610 December 2019+1.55
812 May 2020min 15.66 +0.68 −0.62
−6.77
1 starting from the beginning or the preceding CP.
Publisher’s Note: MDPI stays neutral with regard to jurisdictional claims in published maps and institutional affiliations.

