
A New Approach for the Analysis of Deep Convective Events: Thunderstorm Intensity Index

 , , , and
Abstract
:1. Introduction
2. Data and Methods
2.1. Lightning Data
2.2. Precipitation
2.3. Wind
2.4. Hail
2.5. Waterspouts
2.6. ERA5 Reanalysis
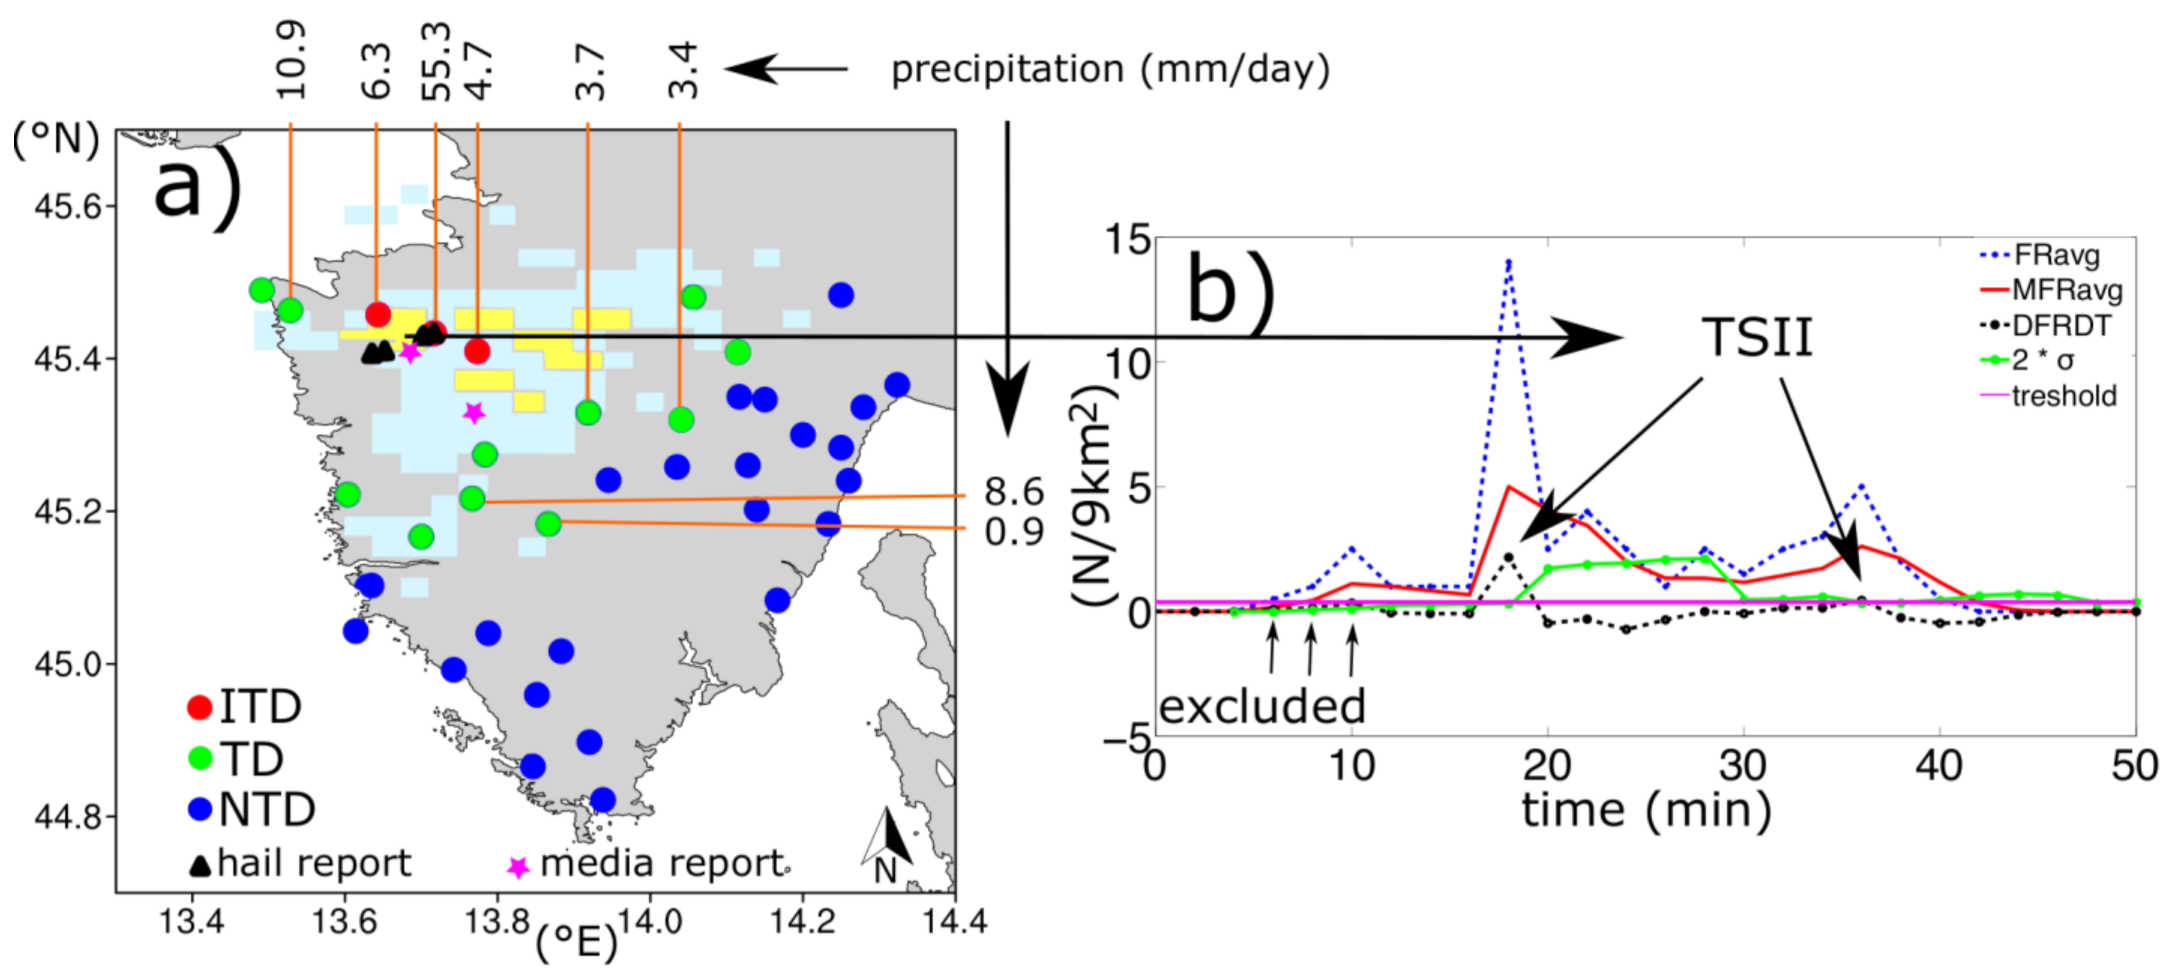
2.7. Thunderstorm Intensity Index (TSII)
2.8. Verification Approach
- (1)
- Non-thunderstorm environment (NTD): if no lightning or TSII footprint was detected within a predefined area of influence;
- (2)
- Thunderstorm only environment (TD): if only the lightning footprint was detected within a predefined area of influence;
- (3)
- Intense thunderstorm environment (ITD): if the TSII footprint is detected within a predefined area of influence.
3. Results and Discussion
3.1. Verification of the TSII
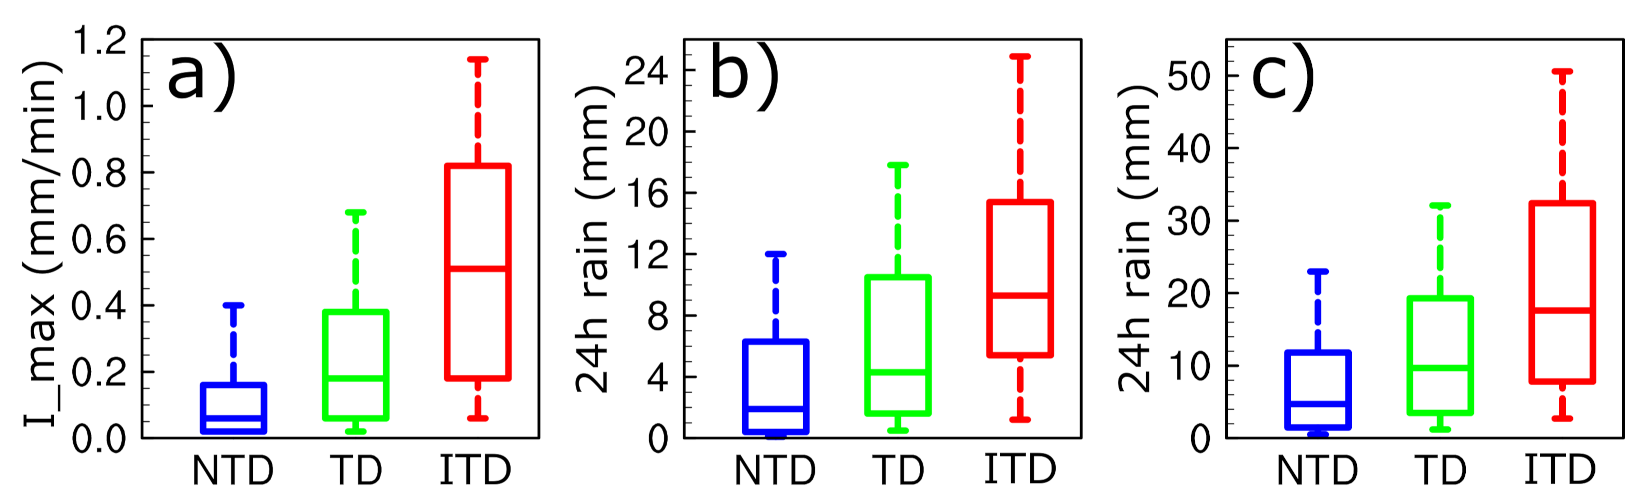
3.1.1. Precipitation
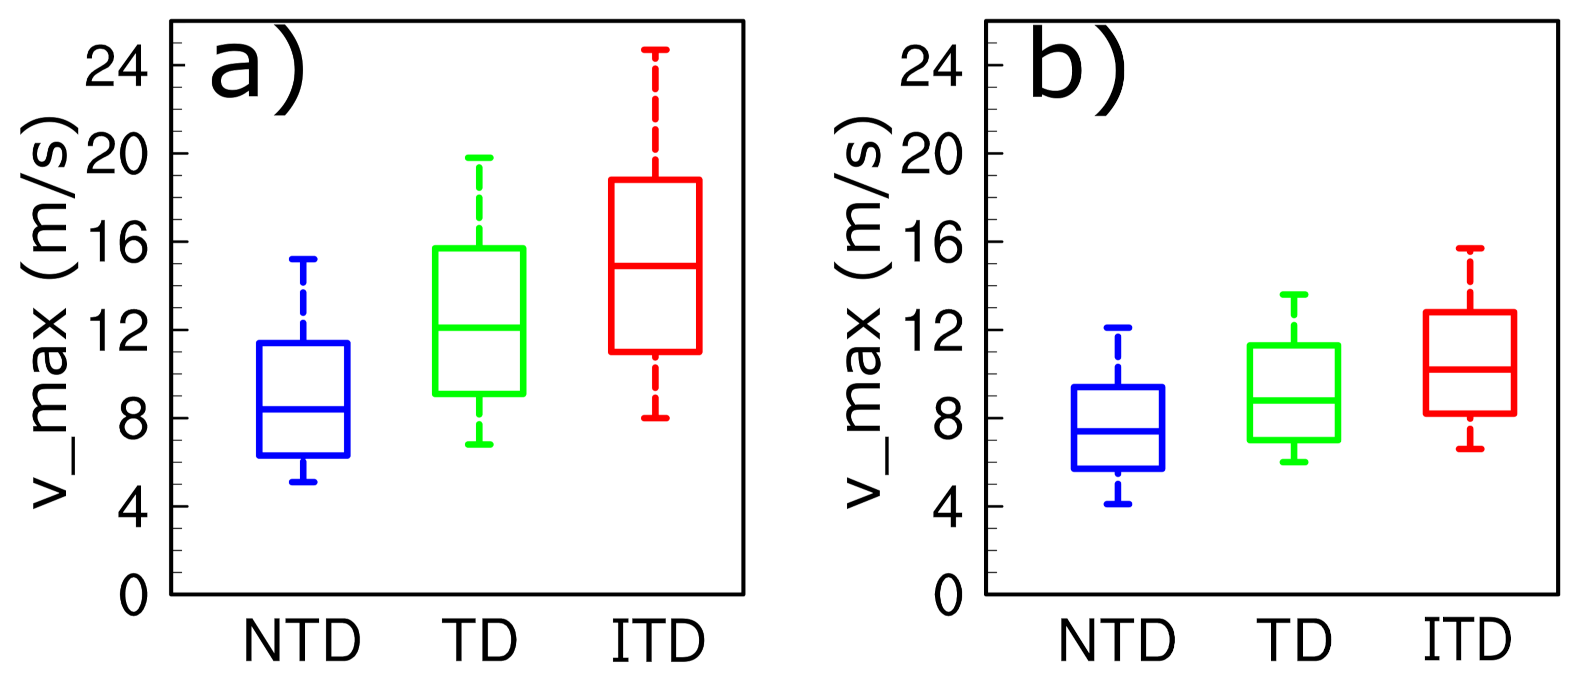
3.1.2. 10-m Wind
3.1.3. Hail
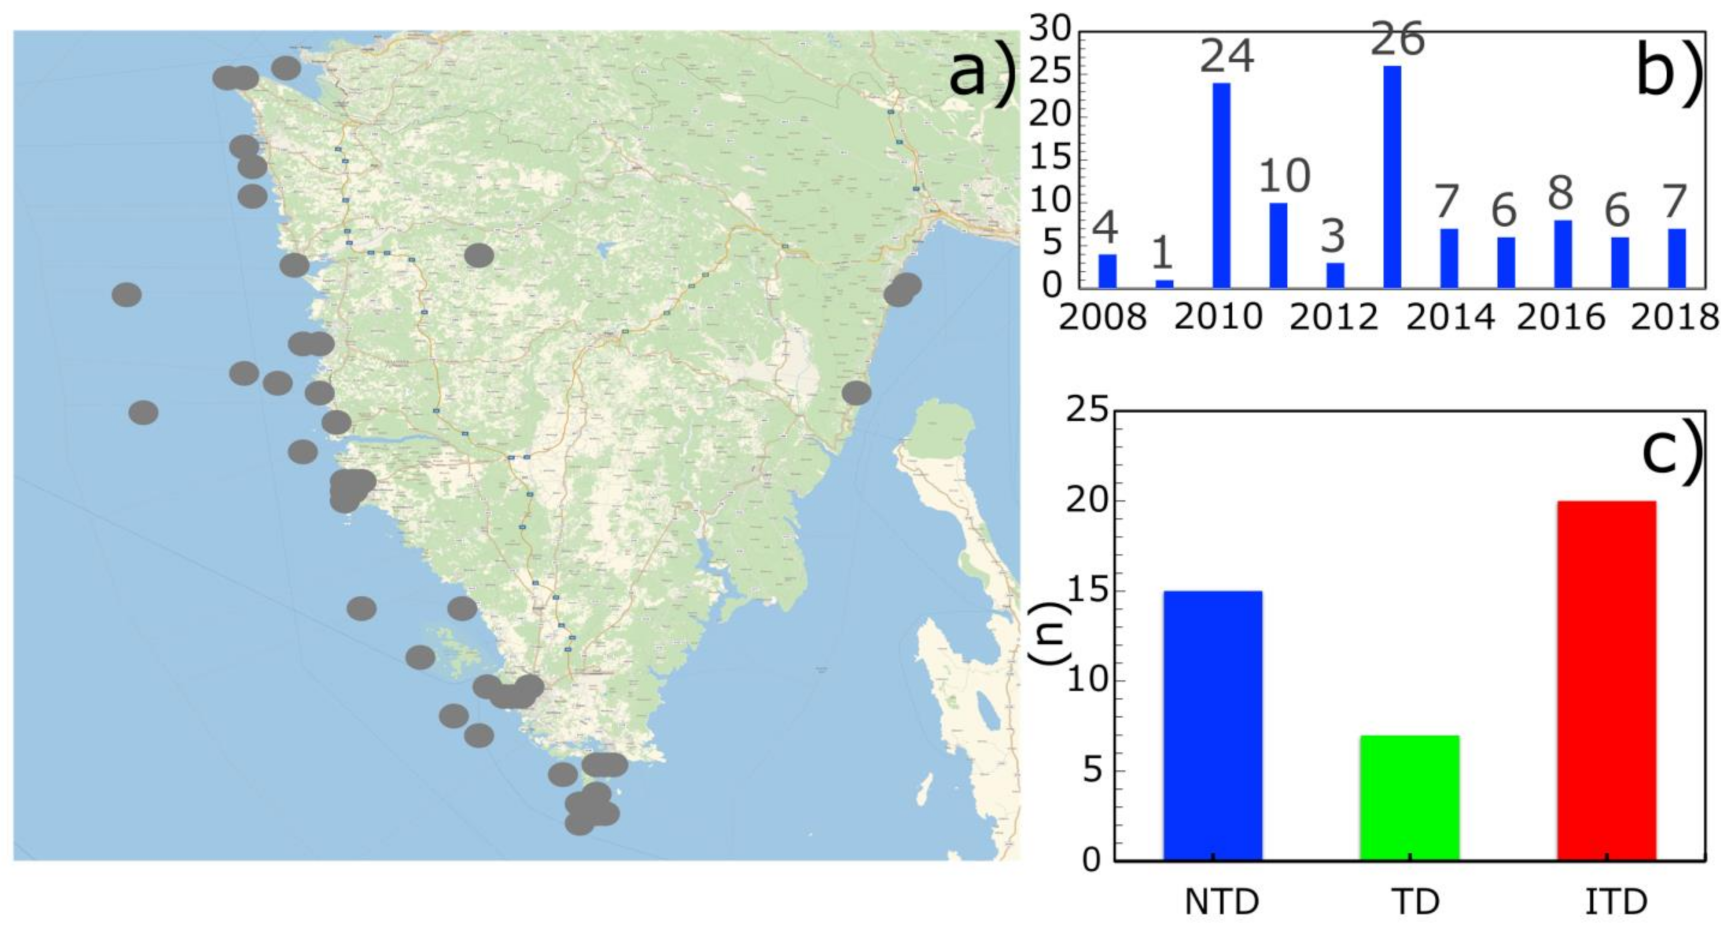
3.1.4. Waterspouts
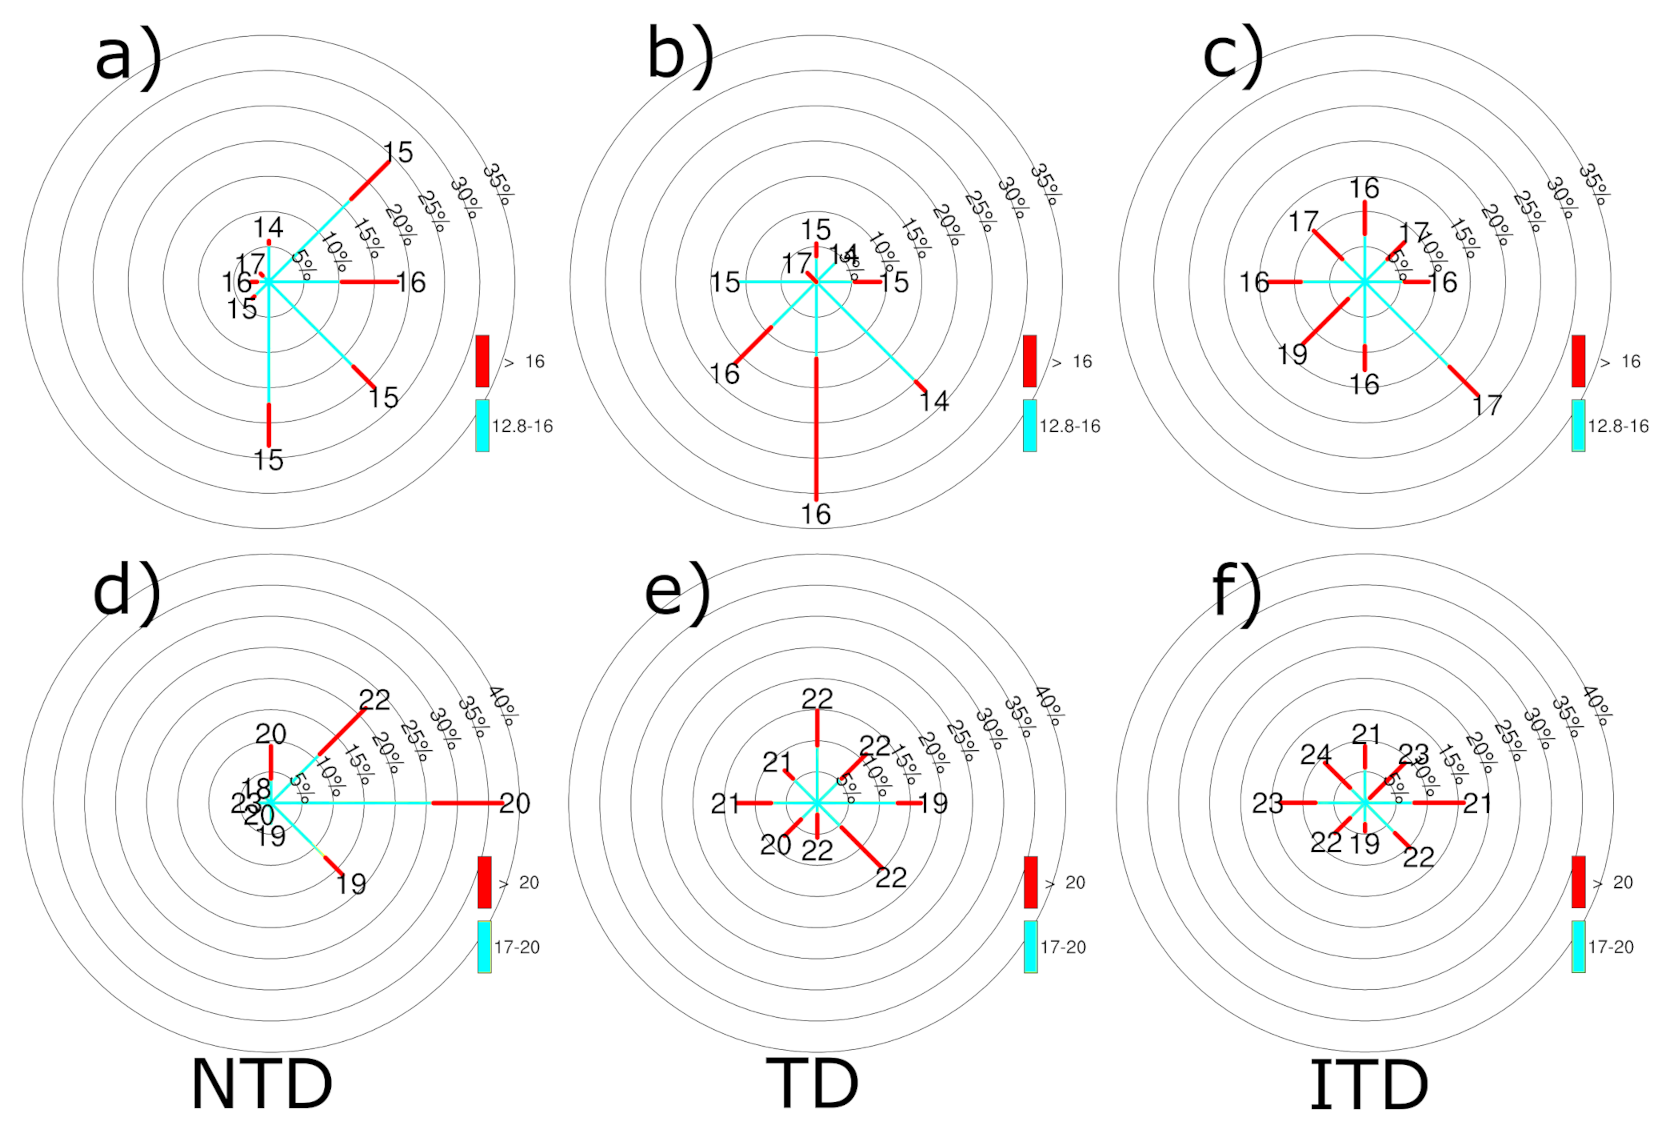
3.1.5. Instability Indices
3.1.6. Local Thunderstorms
3.1.7. Summary of the Verification
3.2. Climatology
3.2.1. Spatial Characteristics
3.2.2. Temporal Characteristics
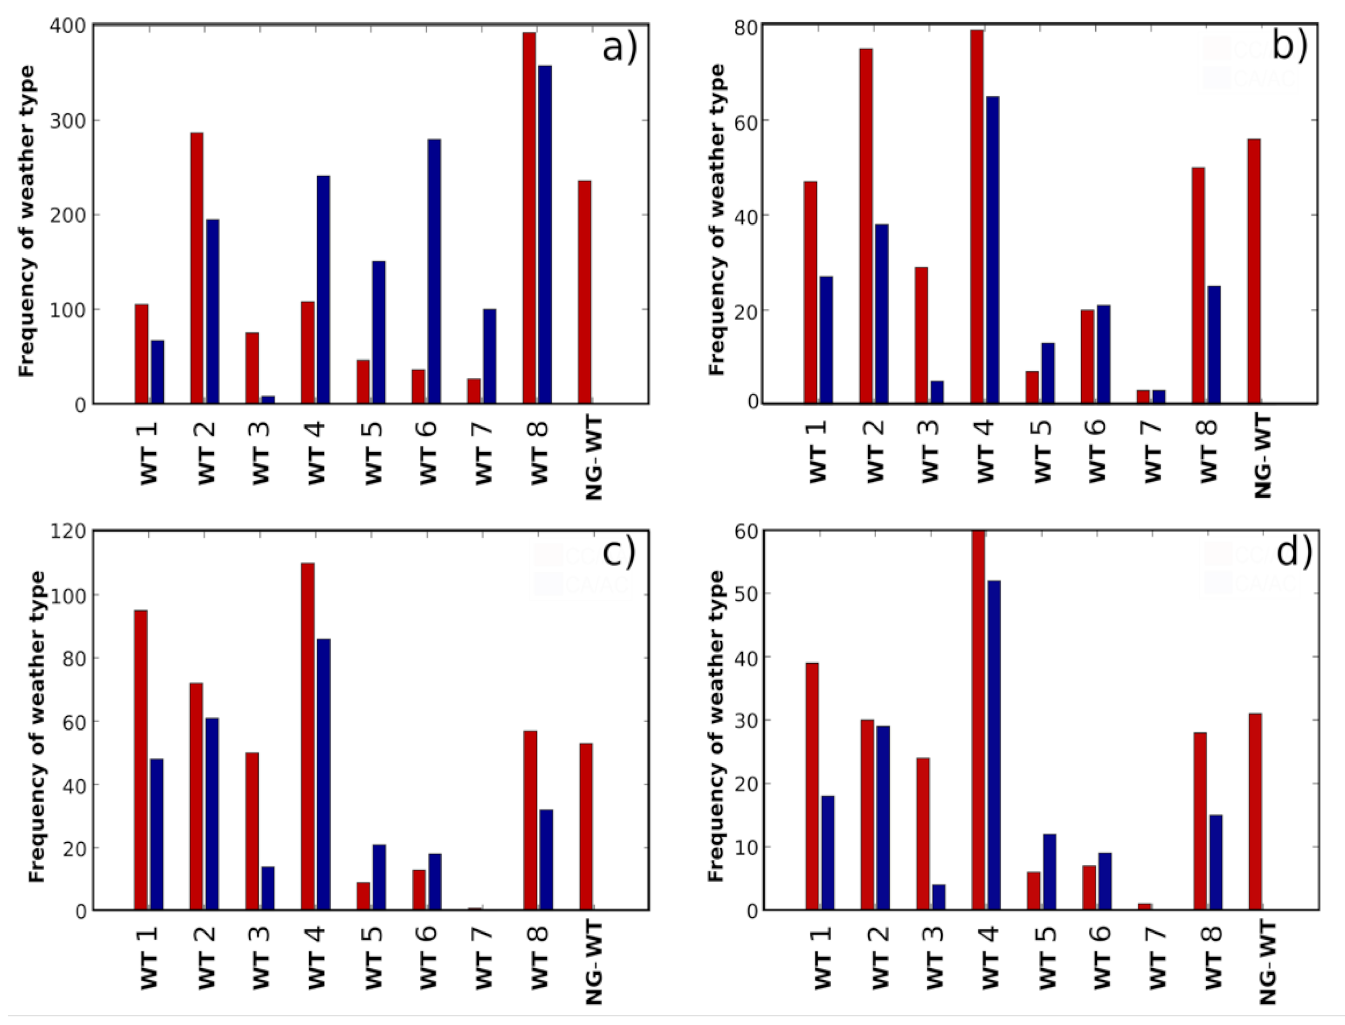
3.2.3. Weather Types
3.3. Future Development and Potential of the TSII
4. Conclusions
- The newly developed TSII represents a tool for thunderstorm monitoring from the Eulerian standpoint, allowing the detection of areas over which thunderstorms experience rapid increases in lightning activity. Since lightning data currently provide several times higher spatial and temporal resolution (compared with radar and satellite imaging) with large spatial coverage, calculation of the TSII allows a new perspective for thunderstorm investigations on larger scales.
- Through our verification process (Table 1), we showed that regions of thunderstorms exhibiting positive TSII values reported considerably greater precipitation maximum intensities and significantly higher accumulated 24 h values. In addition, thunderstorms exhibiting a TSII footprint tend to produce stronger wind gusts while, over the coast, larger thunderstorms have the potential to generate waterspouts. Hail is shown to be closely related to thunderstorms with over 90% coincidence, and 77% of that hail is related to thunderstorms exhibiting a TSII footprint.
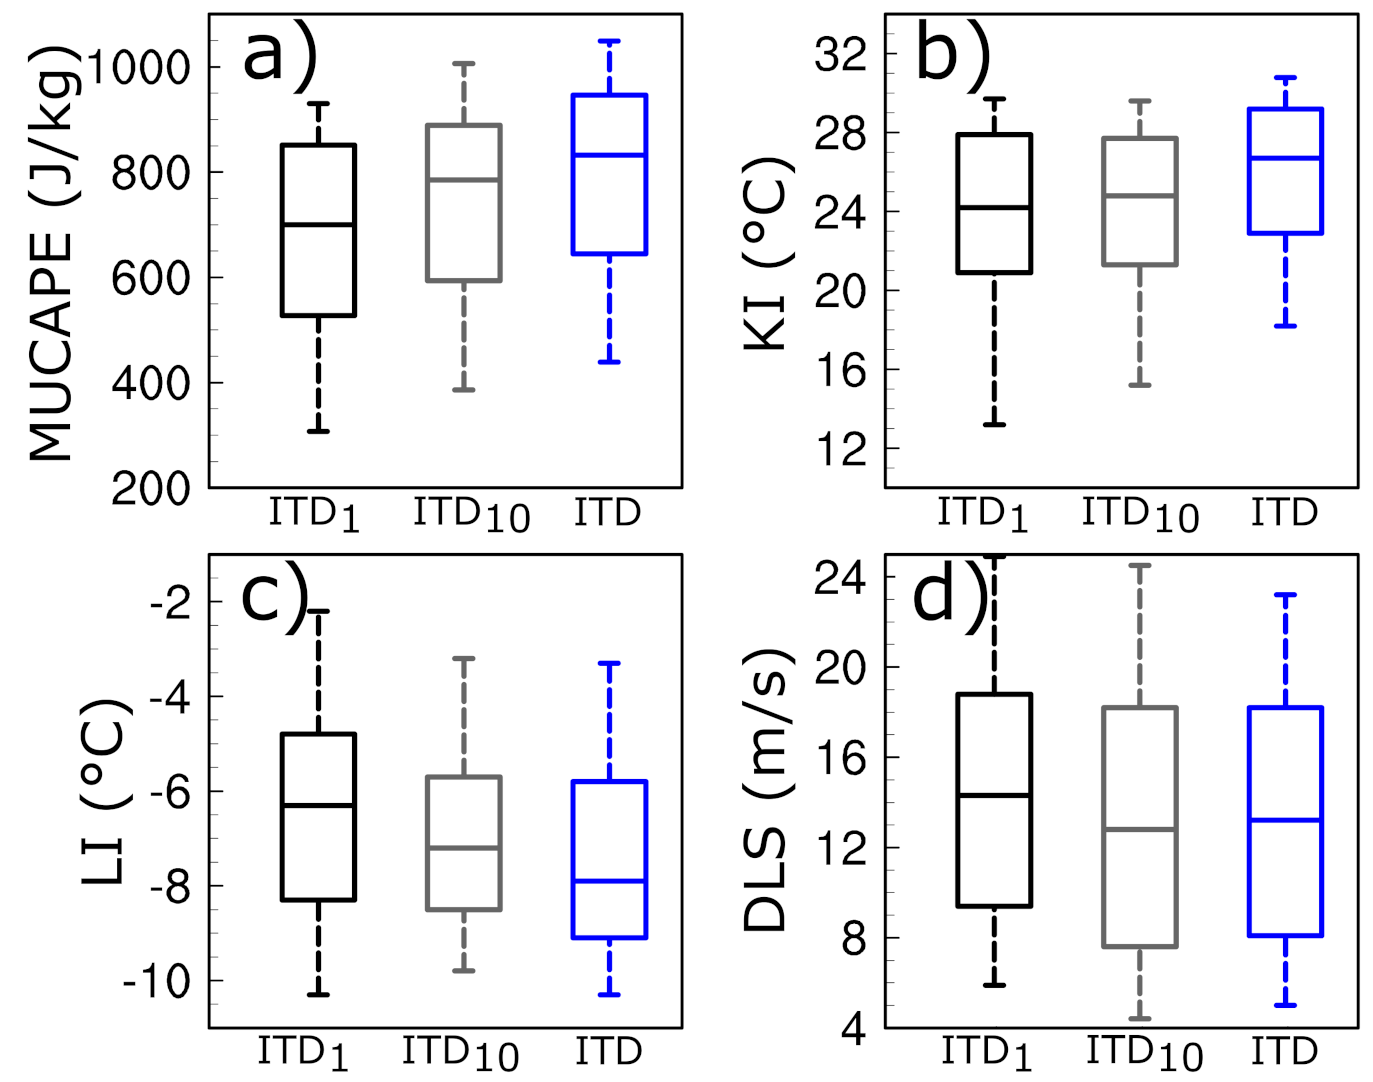
- The method for TSII derivation is independent of storm size, allowing for the identification of even the smallest intense thunderstorms. These storms also reported equivalently large precipitation values at points where the TSII was positive. Additionally, these thunderstorms were related to strong gusts and hail occurrence. Thus, intense local thunderstorms should be taken into consideration in future research as potentially hazardous. In contrast, only one waterspout event was associated with an intense local thunderstorm.
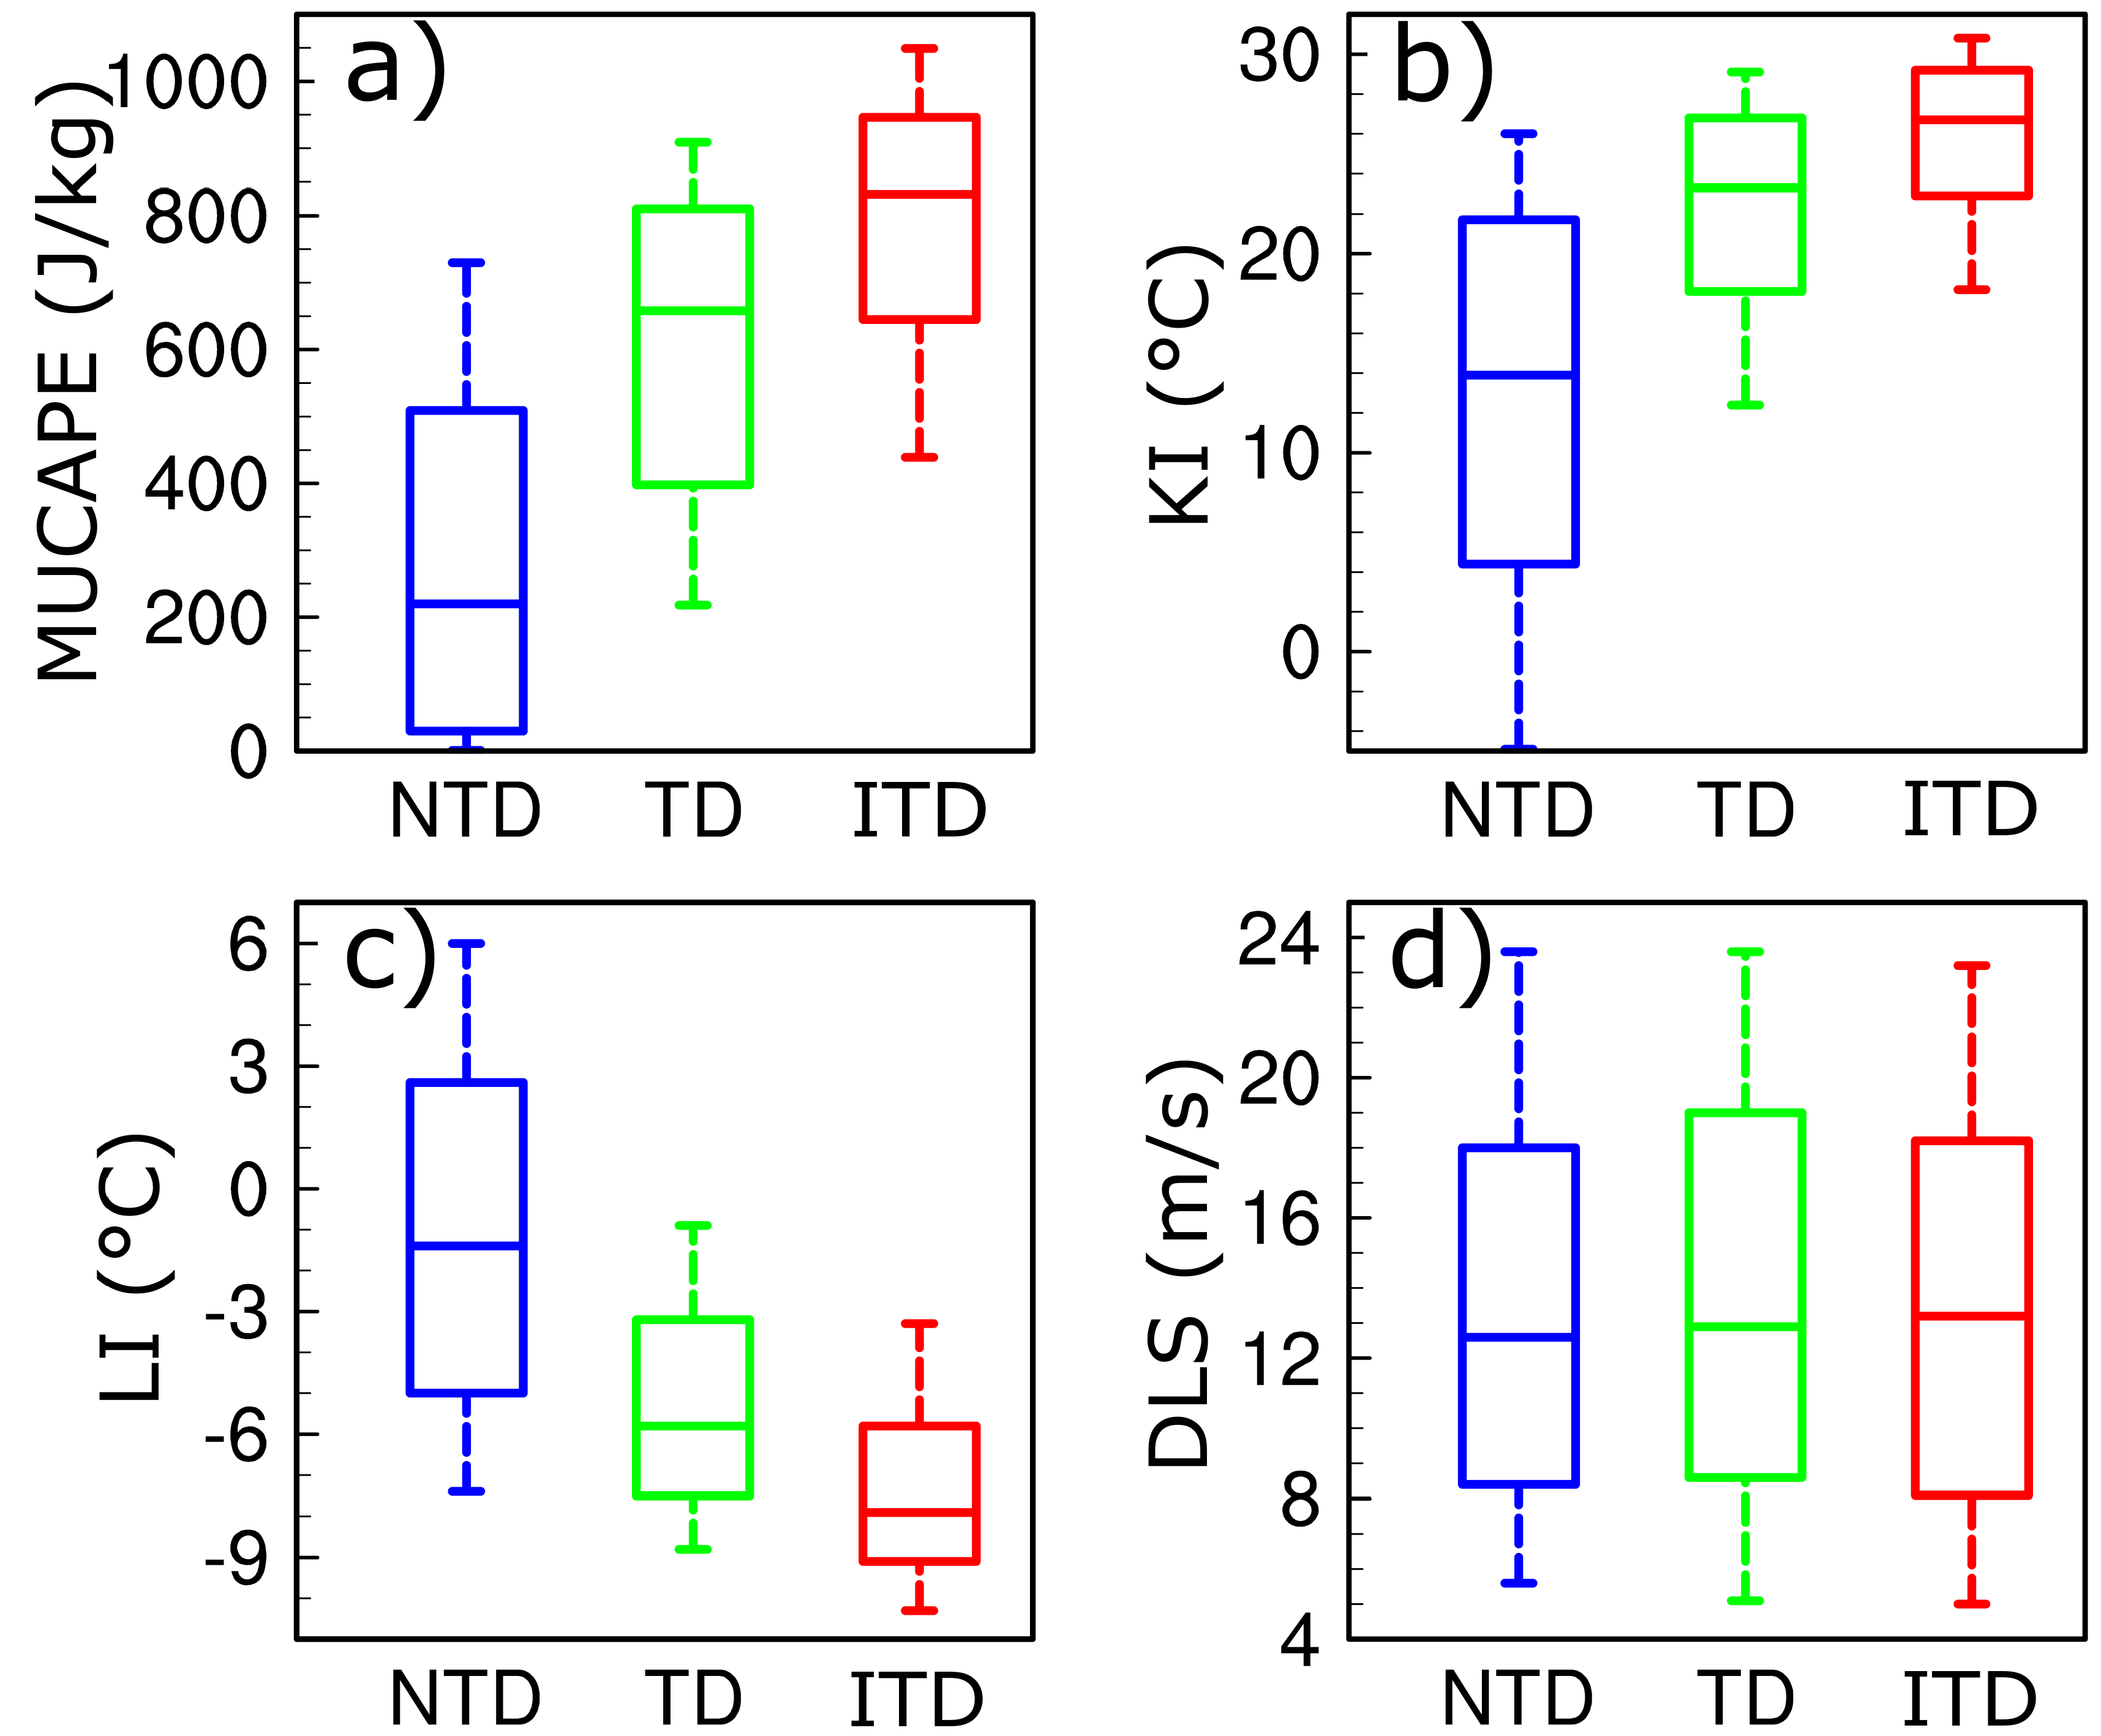
- Inspection of instability indices (Table 1) on thunderstorm days revealed that the days with a TSII clearly have the most unstable environments, reporting a median MUCAPE of 832 J/kg. Although MUCAPE is considerably high on TD days (652 [J/kg]), days containing one pixel with a positive TSII still have higher median values, as shown in Figure 8a. Similar results were obtained for the KI and LI.
- Spatial analysis revealed a clear difference between thunderstorm days and areas affected by intense thunderstorm activity. This suggests that thunderstorm days, as a variable, should only be used as a first guess for determining regions with hazardous weather, while the TSII footprint will reveal those areas with considerably higher confidence. Temporal analysis revealed that intense thunderstorms tend to initiate later in the warm season (May), peak in June and decline toward December, while intense local thunderstorms mostly prefer the period from May to July. Nevertheless, both types are detectable throughout the year, which is in agreement with previous studies on lightning [50], hail [27], and waterspouts [10].
- Synoptic drivers responsible for the formation of thunderstorm environments revealed no apparent difference between TD, ITD and ITD10 days. Combining these results with instability indices, it was shown by reanalysis proxy data that the likelihood of intense and potentially hazardous environments is the same for both local and large-scale thunderstorms.
- The TSII can be used as a diagnostic variable for climatological studies to ascertain exposure to intense thunderstorm environments, which is useful for risk-assessment maps for insurance companies or policy makers, general estimation of areas not covered with more established meteorological data sources, or to obtain local temporal dynamics. Additionally, it can be used operationally to identify areas currently experiencing severe weather, especially local thunderstorms. Moreover, it can be used as a tool for validation and partial verification of modeled information regarding lightning (i.e., lightning potential index) and hail. The calculation of the TSII for severe storms tends to produce multiple positive values, providing continuous insight into storm activity and representing a basis for further research.
Supplementary Materials
Author Contributions
Funding
Institutional Review Board Statement
Informed Consent Statement
Data Availability Statement
Acknowledgments
Conflicts of Interest
References
- Hoeppe, P. Trends in Weather Related Disasters—Consequences for Insurers and Society. Weather Clim. Extrem. 2016, 11, 70–79. [Google Scholar] [CrossRef] [Green Version]
- Púčik, T.; Groenemeijer, P.; Rýva, D.; Kolář, M. Proximity Soundings of Severe and Nonsevere Thunderstorms in Central Europe. Mon. Weather Rev. 2015, 143, 4805–4821. [Google Scholar] [CrossRef]
- Púčik, T.; Castellano, C.; Groenemeijer, P.; Kühne, T.; Rädler, A.T.; Antonescu, B.; Faust, E. Large Hail Incidence and Its Economic and Societal Impacts across Europe. Mon. Weather Rev. 2019, 147, 3901–3916. [Google Scholar] [CrossRef]
- Changnon, S.; Changnon, D.; Hilberg, S. Hailstorms Across the Nation: An Atlas about Hail and Its Damages; Contract Reports; Illinois State Water Survey: Champaign, IL, USA, 2009; Volume 101. [Google Scholar]
- Gaál, L.; Molnar, P.; Szolgay, J. Selection of Intense Rainfall Events Based on Intensity Thresholds and Lightning Data in Switzerland. Hydrol. Earth Syst. Sci. 2014, 18, 1561–1573. [Google Scholar] [CrossRef] [Green Version]
- Cipolla, G.; Francipane, A.; Noto, L.V. Classification of Extreme Rainfall for a Mediterranean Region by Means of Atmospheric Circulation Patterns and Reanalysis Data. Water Resour Manag. 2020, 34, 3219–3235. [Google Scholar] [CrossRef]
- Klingle, D.L.; Smith, D.R.; Wolfson, M.M. Gust Front Characteristics as Detected by Doppler Radar. Mon. Weather Rev. 1987, 115, 905–918. [Google Scholar] [CrossRef] [Green Version]
- Mohr, S.; Kunz, M.; Richter, A.; Ruck, B. Statistical Characteristics of Convective Wind Gusts in Germany. Nat. Hazards Earth Syst. Sci. 2017, 17, 957–969. [Google Scholar] [CrossRef] [Green Version]
- Edwards, R.; LaDue, J.G.; Ferree, J.T.; Scharfenberg, K.; Maier, C.; Coulbourne, W.L. Tornado Intensity Estimation: Past, Present, and Future. Bull. Am. Meteorol. Soc. 2013, 94, 641–653. [Google Scholar] [CrossRef]
- Renko, T.; Kuzmić, J.; Šoljan, V.; Mahović, N.S. Waterspouts in the Eastern Adriatic from 2001 to 2013. Nat. Hazards 2016, 82, 441–470. [Google Scholar] [CrossRef]
- Punge, H.J.; Kunz, M. Hail Observations and Hailstorm Characteristics in Europe: A Review. Atmos. Res. 2016, 176–177, 159–184. [Google Scholar] [CrossRef]
- Punge, H.J.; Bedka, K.M.; Kunz, M.; Werner, A. A New Physically Based Stochastic Event Catalog for Hail in Europe. Nat. Hazards 2014, 73, 1625–1645. [Google Scholar] [CrossRef]
- Ávila, E.E.; Bürgesser, R.E.; Castellano, N.E.; Collier, A.B.; Compagnucci, R.H.; Hughes, A.R.W. Correlations between Deep Convection and Lightning Activity on a Global Scale. J. Atmos. Sol. Terr. Phys. 2010, 72, 1114–1121. [Google Scholar] [CrossRef]
- Takahashi, T. Riming Electrification as a Charge Generation Mechanism in Thunderstorms. J. Atmos. Sci. 1978, 35, 1536–1548. [Google Scholar] [CrossRef]
- Betz, H.D.; Schumann, U.; Laroche, P. (Eds.) Lightning: Principles, Instruments and Applications: Review of Modern Lightning Research; Springer: Dortrecht, The Netherlands, 2009; ISBN 978-1-4020-9078-3. [Google Scholar]
- Mazzetti, T.O.; Fuelberg, H.E. An Analysis of Total Lightning Flash Rates Over Florida. J. Geophys. Res. Atmos. 2017, 122. [Google Scholar] [CrossRef]
- Hayward, L.; Whitworth, M.; Pepin, N.; Dorling, S. Review Article: A Comprehensive Review of Datasets and Methodologies Employed to Produce Thunderstorm Climatologies. Nat. Hazards Earth Syst. Sci. 2020, 20, 2463–2482. [Google Scholar] [CrossRef]
- Schultz, C.J.; Petersen, W.A.; Carey, L.D. Preliminary Development and Evaluation of Lightning Jump Algorithms for the Real-Time Detection of Severe Weather. J. Appl. Meteorol. Climatol. 2009, 48, 2543–2563. [Google Scholar] [CrossRef] [Green Version]
- Gatlin, P.N.; Goodman, S.J. A Total Lightning Trending Algorithm to Identify Severe Thunderstorms. J. Atmos. Ocean. Technol. 2010, 27, 3–22. [Google Scholar] [CrossRef]
- Chronis, T.; Carey, L.D.; Schultz, C.J.; Schultz, E.V.; Calhoun, K.M.; Goodman, S.J. Exploring Lightning Jump Characteristics. Weather Forecast. 2015, 30, 23–37. [Google Scholar] [CrossRef] [Green Version]
- Schultz, C.J.; Petersen, W.A.; Carey, L.D. Lightning and Severe Weather: A Comparison between Total and Cloud-to-Ground Lightning Trends. Weather Forecast. 2011, 26, 12. [Google Scholar] [CrossRef]
- Pineda, N.; Bech, J.; Rigo, T.; Montanyà, J. A Mediterranean Nocturnal Heavy Rainfall and Tornadic Event. Part II: Total Lightning Analysis. Atmos. Res. 2011, 100, 638–648. [Google Scholar] [CrossRef]
- Wapler, K. The Life-Cycle of Hailstorms: Lightning, Radar Reflectivity and Rotation Characteristics. Atmos. Res. 2017, 193, 60–72. [Google Scholar] [CrossRef]
- Farnell, C.; Rigo, T.; Pineda, N. Lightning Jump as a Nowcast Predictor: Application to Severe Weather Events in Catalonia. Atmos. Res. 2017, 183, 130–141. [Google Scholar] [CrossRef]
- Farnell, C.; Rigo, T.; Pineda, N. Exploring Radar and Lightning Variables Associated with the Lightning Jump. Can We Predict the Size of the Hail? Atmos. Res. 2018, 202, 175–186. [Google Scholar] [CrossRef]
- Mikuš, P.; Telišman Prtenjak, M.; Strelec Mahović, N. Analysis of the Convective Activity and Its Synoptic Background over Croatia. Atmos. Res. 2012, 104–105, 139–153. [Google Scholar] [CrossRef]
- Jelić, D.; Megyeri, O.A.; Malečić, B.; Belušić Vozila, A.; Strelec Mahović, N.; Telišman Prtenjak, M. Hail Climatology Along the Northeastern Adriatic. J. Geophys. Res. Atmos. 2020, 125. [Google Scholar] [CrossRef]
- Betz, H.D.; Schmidt, K.; Laroche, P.; Blanchet, P.; Oettinger, W.P.; Defer, E.; Dziewit, Z.; Konarski, J. LINET—An International Lightning Detection Network in Europe. Atmos. Res. 2009, 91, 564–573. [Google Scholar] [CrossRef]
- Hersbach, H.; Bell, B.; Berrisford, P.; Hirahara, S.; Horányi, A.; Muñoz-Sabater, J.; Nicolas, J.; Peubey, C.; Radu, R.; Schepers, D.; et al. The ERA5 Global Reanalysis. Q. J. R. Meteorol. Soc. 2020, 146, 1999–2049. [Google Scholar] [CrossRef]
- Mikuš Jurković, P.; Mahović, N.S.; Počakal, D. Lightning, Overshooting Top and Hail Characteristics for Strong Convective Storms in Central Europe. Atmos. Res. 2015, 161–162, 153–168. [Google Scholar] [CrossRef]
- Franc, B.; Uglešić, I.; Piliškić, S. Lightning Data Utilization in Power System Control. J. Energy 2015, 64, 62–77. [Google Scholar]
- Stipetić, N.; Franc, B.; Uglešić, I.; Mesić, M.; Ivanković, I. Improving Lightning Location System and Advance Control, Maintenance and Planning of Transmission Power System Using Lightning Location System Data. In Proceedings of the International Colloquium on Lightning and Power Systems, Ljubljana, Slovenia, 18 September 2017. [Google Scholar]
- Uglešić, I.; Franc, B.; Stipetić, N. Lightning Stroke Measurements, Data Verification and Application in Power Systems. In Proceedings of the VI Russian Conference on Lightning Protection (RCLP), Saint Petersburg, Russia, 17 April 2018. [Google Scholar]
- Blumberg, W.G.; Halbert, K.T.; Supinie, T.A.; Marsh, P.T.; Thompson, R.L.; Hart, J.A. SHARPpy: An Open-Source Sounding Analysis Toolkit for the Atmospheric Sciences. Bull. Am. Meteorol. Soc. 2017, 98, 1625–1636. [Google Scholar] [CrossRef]
- Belušić Vozila, A. Wind Characteristics in the Present and Future Climate Obtained from Regional Climate Models’ Simulations over Broader Adriatic Region. Ph.D. Thesis, University of Zagreb Faculty of Science (Department of Geophysics), Zagreb, Croatia, 2018. [Google Scholar]
- Grisogono, B.; Belušić, D. A Review of Recent Advances in Understanding the Meso- and Microscale Properties of the Severe Bora Wind. Tellus A 2009, 61, 1–16. [Google Scholar] [CrossRef]
- Belušić, A.; Prtenjak, M.T.; Güttler, I.; Ban, N.; Leutwyler, D.; Schär, C. Near-Surface Wind Variability over the Broader Adriatic Region: Insights from an Ensemble of Regional Climate Models. Clim. Dyn. 2018, 50, 4455–4480. [Google Scholar] [CrossRef]
- Horvath, K.; Lin, Y.-L.; Ivančan-Picek, B. Classification of Cyclone Tracks over the Apennines and the Adriatic Sea. Mon. Weather Rev. 2008, 136, 2210–2227. [Google Scholar] [CrossRef] [Green Version]
- Ivančan-Picek, B.; Glasnović, D.; Jurčec, V. Analysis and Aladin Prediction of a Heavy Precipitation Event on the Eastern Side of the Alps during Map IOP 5. metz 2003, 12, 103–112. [Google Scholar] [CrossRef]
- Toreti, A.; Giannakaki, P.; Martius, O. Precipitation Extremes in the Mediterranean Region and Associated Upper-Level Synoptic-Scale Flow Structures. Clim. Dyn. 2016, 47, 1925–1941. [Google Scholar] [CrossRef] [Green Version]
- Changnon, S.A. Temporal and Spatial Relations between Hail and Lightning. J. Appl. Meteorol. Climatol. 1992, 31, 587–604. [Google Scholar] [CrossRef] [Green Version]
- Sioutas, M.V.; Renko, T.; Szilagyi, W.; Keul, A.G. Waterspout Climatology over the Central-Eastern Mediterranean. In Proceedings of the COMECAP 2014; 12 International Conference of Meteorology, Climatology and Atmospheric Physics, Heraklion, Crete, Greece, 28–31 May 2014; Volume 3, pp. 154–158. [Google Scholar]
- Renko, T.; Ivušić, S.; Telišman Prtenjak, M.; Šoljan, V.; Horvat, I. Waterspout Forecasting Method Over the Eastern Adriatic Using a High-Resolution Numerical Weather Model. Pure Appl. Geophys. 2018, 175, 3759–3778. [Google Scholar] [CrossRef]
- Projekt Modernizacije Meteorološke Motriteljske Mreže u RH. Available online: https://meteo.hr/istrazivanje/METMONICbrosura.pdf (accessed on 11 June 2021).
- Browning, K.A.; Blyth, A.M.; Clark, P.A.; Corsmeier, U.; Morcrette, C.J.; Agnew, J.L.; Ballard, S.P.; Bamber, D.; Barthlott, C.; Bennett, L.J.; et al. The Convective Storm Initiation Project. Bull. Am. Meteorol. Soc. 2007, 88, 1939–1956. [Google Scholar] [CrossRef]
- Poljak, G.; Prtenjak, M.T.; Kvakić, M.; Strelec Mahović, N.; Babić, K. Wind Patterns Associated with the Development of Daytime Thunderstorms over Istria. Ann. Geophys. 2014, 32, 401–420. [Google Scholar] [CrossRef] [Green Version]
- Mecikalski, J.R.; Rosenfeld, D.; Manzato, A. Evaluation of Geostationary Satellite Observations and the Development of a 1-2 h Prediction Model for Future Storm Intensity: Forecasting Storm Intensity. J. Geophys. Res. Atmos. 2016, 121, 6374–6392. [Google Scholar] [CrossRef]
- Kehler-Poljak, G.; Telišman Prtenjak, M.; Kvakić, M.; Šariri, K.; Večenaj, Ž. Interaction of Sea Breeze and Deep Convection over the Northeastern Adriatic Coast: An Analysis of Sensitivity Experiments Using a High-Resolution Mesoscale Model. Pure Appl. Geophys. 2017, 174, 4197–4224. [Google Scholar] [CrossRef]
- Li, H.; Cui, X.; Zhang, D.-L. On the Initiation of an Isolated Heavy-Rain-Producing Storm near the Central Urban Area of Beijing Metropolitan Region. Mon. Weather Rev. 2017, 145, 181–197. [Google Scholar] [CrossRef]
- Galanaki, E.; Lagouvardos, K.; Kotroni, V.; Flaounas, E.; Argiriou, A. Thunderstorm Climatology in the Mediterranean Using Cloud-to-Ground Lightning Observations. Atmos. Res. 2018, 207, 136–144. [Google Scholar] [CrossRef]
- Stržinar, G.; Skok, G. Comparison and Optimization of Radar-Based Hail Detection Algorithms in Slovenia. Atmos. Res. 2018, 203, 275–285. [Google Scholar] [CrossRef]
- Manzato, A.; Cicogna, A.; Pucillo, A. 6-Hour Maximum Rain in Friuli Venezia Giulia: Climatology and ECMWF-Based Forecasts. Atmos. Res. 2016, 169, 465–484. [Google Scholar] [CrossRef]
- Púčik, T.; Groenemeijer, P.; Rädler, A.T.; Tijssen, L.; Nikulin, G.; Prein, A.F.; van Meijgaard, E.; Fealy, R.; Jacob, D.; Teichmann, C. Future Changes in European Severe Convection Environments in a Regional Climate Model Ensemble. J. Clim. 2017, 30, 6771–6794. [Google Scholar] [CrossRef] [Green Version]
- Rädler, A.T.; Groenemeijer, P.H.; Faust, E.; Sausen, R.; Púčik, T. Frequency of Severe Thunderstorms across Europe Expected to Increase in the 21st Century Due to Rising Instability. NPJ Clim. Atmos. Sci. 2019, 2, 30. [Google Scholar] [CrossRef]
- Taszarek, M.; Brooks, H.E.; Czernecki, B.; Szuster, P.; Fortuniak, K. Climatological Aspects of Convective Parameters over Europe: A Comparison of ERA-Interim and Sounding Data. J. Clim. 2018, 31, 4281–4308. [Google Scholar] [CrossRef]
- Yair, Y.; Lynn, B.; Price, C.; Kotroni, V.; Lagouvardos, K.; Morin, E.; Mugnai, A.; del Carmen Llasat, M. Predicting the Potential for Lightning Activity in Mediterranean Storms Based on the Weather Research and Forecasting (WRF) Model Dynamic and Microphysical Fields. J. Geophys. Res. 2010, 115, D04205. [Google Scholar] [CrossRef] [Green Version]
- Brimelow, J.C.; Reuter, G.W.; Poolman, E.R. Modeling Maximum Hail Size in Alberta Thunderstorms. Weather Forecast. 2002, 17, 15. [Google Scholar] [CrossRef]
- Adams-Selin, R.D.; Ziegler, C.L. Forecasting Hail Using a One-Dimensional Hail Growth Model within WRF. Mon. Weather Rev. 2016, 144, 4919–4939. [Google Scholar] [CrossRef]


| Rain Intensity (mm/min) | Daily Precipitation (mm/Day) | Wind (m/s) | Hail (Number) | Waterspouts (Number) | Instability Indices | ||||
|---|---|---|---|---|---|---|---|---|---|
| Coast | Inland | (CAPE J/kg) | KI (°C) | LI (°C) | |||||
| NTD | 0.06 | 4.7 | 9.1 | 7.4 | 28 | 15 | 220 | 13.9 | −1.4 |
| TD | 0.18 | 9.8 | 12.1 | 8.8 | 56 | 6 | 658 | 23.3 | −5.8 |
| ITD | 0.46 | 17.6 | 14.9 | 10.2 | 185 | 20 | 832 | 26.8 | −7.9 |
| ITD10 | X | 15.2 | X | X | X | X | 785 | 24.8 | −7.2 |
Publisher’s Note: MDPI stays neutral with regard to jurisdictional claims in published maps and institutional affiliations. |
© 2021 by the authors. Licensee MDPI, Basel, Switzerland. This article is an open access article distributed under the terms and conditions of the Creative Commons Attribution (CC BY) license (https://creativecommons.org/licenses/by/4.0/).
Share and Cite
Jelić, D.; Telišman Prtenjak, M.; Malečić, B.; Belušić Vozila, A.; Megyeri, O.A.; Renko, T. A New Approach for the Analysis of Deep Convective Events: Thunderstorm Intensity Index. Atmosphere 2021, 12, 908. https://doi.org/10.3390/atmos12070908
Jelić D, Telišman Prtenjak M, Malečić B, Belušić Vozila A, Megyeri OA, Renko T. A New Approach for the Analysis of Deep Convective Events: Thunderstorm Intensity Index. Atmosphere. 2021; 12(7):908. https://doi.org/10.3390/atmos12070908
Chicago/Turabian StyleJelić, Damjan, Maja Telišman Prtenjak, Barbara Malečić, Andreina Belušić Vozila, Otília Anna Megyeri, and Tanja Renko. 2021. "A New Approach for the Analysis of Deep Convective Events: Thunderstorm Intensity Index" Atmosphere 12, no. 7: 908. https://doi.org/10.3390/atmos12070908