Article

Advanced Global Model Ensemble Forecasts of Tropical Cyclone Formation, and Intensity Predictions along Medium-Range Tracks

by
Russell L. Elsberry
1,*,
Hsiao-Chung Tsai
2,*,
Wei-Chia Chin
2 and
Timothy P. Marchok
3
1
Trauma, Health and Hazards Center, University of Colorado, Colorado Springs, CO 80918, USA
2
Department of Water Resources and Environmental Engineering, Tamkang University, New Taipei City 251301, Taiwan
3
Geophysical Fluid Dynamics Laboratory, Princeton, NJ 08540, USA
*
Authors to whom correspondence should be addressed.
Atmosphere 2020, 11(9), 1002; https://doi.org/10.3390/atmos11091002
Submission received: 5 June 2020 / Revised: 15 September 2020 / Accepted: 15 September 2020 / Published: 18 September 2020
(This article belongs to the Special Issue Modeling and Data Assimilation for Tropical Cyclone Forecasts)

Abstract

:
Marchok vortex tracker outputs from the European Centre for Medium-Range Weather Forecasts ensemble (ECEPS) and National Centers for Environmental Prediction ensemble (GEFS) are utilized to provide the Time-to-Formation (T2F of 25 kt or 35 kt) timing and positions along the weighted-mean vector motion (WMVM) track forecasts, and our weighted analog intensity Pacific (WAIP) technique provides 7-day intensity forecasts after the T2F. Example T2F(35) forecasts up to 5 days in advance of two typhoons and one non-developer in the western North Pacific are described in detail. An example T2F forecast of pre-Hurricane Kiko in the eastern North Pacific indicated that Hawaii would be under threat by the end of the 15-day ECEPS WMVM track forecast. An example T2F forecast of pre-Hurricane Lorenzo in the eastern Atlantic demonstrates that both the ECEPS and GEFS predict up to 5 days in advance that the precursor African wave will become a Tropical Storm off the west coast and will likely become a hurricane. Validations of the T2F(25) and T2F(35) timing and position errors are provided for all ECEPS and GEFS forecasts of the two typhoons and Hurricanes Kiko and Lorenzo. If the T2F timing errors are small (<1 day), the T2F position errors along the WMVM track forecasts will be small (<300 km). Although the primary focus is on the western North Pacific, the examples from the Atlantic and eastern/central North Pacific indicate the potential for future application in other basins.

1. Introduction

Following Reference [1], the term “ensemble” will here be defined as a dynamically based ensemble with multiple members that uses a combination of initial conditions and model physics perturbations to represent the uncertainty, which then excludes consensus of multiple deterministic models and statistical and multiple analog averages and spread techniques. The use of ensemble forecasts in operational tropical cyclone (TC) forecasting has been recently summarized from a survey of 60 forecasters from 25 different centers around the globe [1]. Nearly all respondents mentioned their use of ensembles for their track and genesis forecasts (Reference [1], Figure 3). Rather than relying on a single deterministic model forecast of the TC track, the ensemble can be used to predict the most likely track scenario as well as provide a probability of occurrence. According to the survey respondents, their most regularly used ensemble product was the simple ensemble mean of all of the member tracks, which assumes that all ensemble member tracks are equally likely.
Dynamic ensembles are often utilized in calculating the uncertainty in the operational forecasts of TC genesis [1], which in combination with the subsequent TC track is defined as “TC activity” [2]. One of the original definitions of TC strike probability [3] was in terms of whether a TC would pass within a 120 km radius of a certain location during the next 5 days. A recent study [2] evaluating the skill of four operational deterministic global models in forecasting TC activity over the short- to medium-range expanded the allowable TC activity radius to 300 km and extended the range of timescales (0–14 days, rather than 0–5 days). In addition to evaluating the skill of the individual models (ECMWF, NCEP, Japan Meterorlogical Agency (JMA) and United Kindom Met Office (UKMO)), two Multi-Center Grand Ensembles (MCGEs) were also evaluated in seven TC basins. Their measure of skill was the Brier Skill score relative to a simple climatological TC activity. In general, the ECMWF ensemble was the most skillful model in providing TC activity forecasts that extend into week 2. However, the MCGEs tended to have better forecast skill than the best single-model ensemble, and this benefit was especially true in the North Indian Ocean and the TC basins in the Southern Hemisphere. It is noted that the reliability was sensitive to the threshold wind value used to define the model TCs. That is, using 35 (15–25) kt as the threshold value defining the TC in the ensemble models tends to under-estimate (over-estimate) the numbers and lifetimes of the verifying TCs (Reference [2], Table 4).
To improve a genesis probability technique being developed and tested at the National Hurricane Center (NHC), regression equations have been derived for bias corrections of the NCEP, UKMO, and the Environment Canada global deterministic models [4]. Environmental and storm-centered predictors were tested, with averaged predictors over a box area extending ±5 degrees from the model-indicated TC center, and perturbations defined as the maximum value of a predictor within 5 degrees minus that averaged value. A surprising result was that the vertical wind shear was not found to be a good discriminator between a “hit” (genesis correctly predicted within the 48 and 120 h forecast windows) and “False Alarms” (circulation did not lead to genesis). Independent verifications of these regression-based probabilistic genesis forecasts within 0–48 h and 0–120 h are displayed in reliability diagrams and with Brier scores for each of the three models, and for both the Atlantic and the eastern North Pacific basins. However, the consensus of the three models performed better than the individual models and was able to capture high genesis probability events. An experimental graphic (Reference [4], Figure A1) indicates which deterministic models or the consensus are predicting genesis, the genesis probability, and an approximate genesis location(s).
A summary of the operational genesis forecasts provided by 15 TC forecast centers (Reference [1], Table 3) indicates that the majority of these centers make 5-day forecasts of TC genesis. Although the Regional Specialized Meteorological Center (RSMC) Miami (New Delhi) provides probabilities in 10% (25%) intervals, nearly all of the rest of the centers just assign probability categories of Low, Moderate, or High. Most of the centers use some form of a multi-model consensus or an ensemble, but nearly all of the centers indicate that forecaster experience/judgment has a key role.
The objective of this study has been to produce ensemble-based guidance products for the pre-formation period, and “formation” will be the terminology used here rather than “genesis” since the focus is on the time that the pre-TC circulations become a Tropical Depression (25 kt) or a Tropical Storm (35 kt). Specifically, these guidance products are based on the NCEP Global Ensemble Forecast System (GEFS) and the European Center for Medium-Range Weather Forecasts ensemble prediction system (ECEPS), and will provide the Time-to-Formation (T2F) and the formation location along Weighted-Mean Vector Motion (WMVM) ensemble storm tracks [5,6,7]. Instead of a simple ensemble mean of all member tracks as in the studies described above, the WMVM does not assume that all ensemble member track forecasts are equally likely (see Section 2). Rather than a probability of a genesis occurring at any time during 0–48 h or 0–120 h, as in the TC activity studies described above, three T2Fs along the WMVM track forecast for both the GEFS and for the ECEPS will be provided. The first T2F (25 kt) is a weighted-mean (same weighting factors as for the WMVM) of the times the ensemble member forecasts first achieved an initial intensity of 25 kt, which is diagnosed directly from the Marchok vortex tracker [8]. Then, two T2F(35 kt) times along the WMVM track forecast will be diagnosed from the Marchok tracker “genesis parameters.” Given these T2F times along the WMVM track forecast, the T2F locations can then be provided for situation-specific guidance to the forecaster.
For the western North Pacific TCs, the combined three-stage Weighted Analog Intensity Pacific (WAIP) technique [9,10,11,12,13] will be applied that first provides the intensity changes from the time the pre-TC circulation begins in the GEFS or ECEPS until the T2F time. Then, the combined WAIP provides the 7-day intensity forecast following the T2F that is a weighted-mean of the intensity evolutions from historical analogs that have tracks that are within ±30 days and closely match the WMVM track forecast after the T2F. Although such a weighted-mean will be a conservative estimate of the peak intensity, the three WAIP intensity forecasts based on the three T2Fs will provide the forecaster some guidance as to the sensitivity of the peak intensity to the timing of the T2F.
The methodology for calculating the WMVM track forecasts, the three T2Fs, and the WAIP will be summarized in Section 2. Examples of ECEPS and GEFS forecasts of the T2F times and positions will be presented in Section 3 for two typhoons and one tropical storm in the western North Pacific, one hurricane in the eastern North Pacific, and one hurricane in the Atlantic. Validation of the sets of ECEPS forecasts and GEFS forecasts for the two typhoons and the two hurricanes are provided in Section 4. A summary and plans for future developments will be given in Section 5, since this technique could easily be extended to provide similar TC formation (aka genesis) guidance products for all TC basins in support of all of the forecasters who participated in the survey [1]. Whereas inclusion of examples from four basins has required a lengthy article, it is suggested that the readers should read the methodology in Section 2 that applies to all basins, the first application to Typhoon Lingling in Section 3, and then the other example(s) in the basin of most interest to them.

2. Methodology

As indicated above, the ensemble track forecasts utilized by most centers is a simple mean of all the ensemble member tracks, which assumes all member tracks are equally likely. The Marchok vortex tracker [8] utilized here first checks each 12 h along the ensemble member track forecasts for a cyclonic circulation and a Minimum Sea-Level Pressure contour using an interval of 1 mb, and also checks that the circulation exists for at least 24 h. In the WMVM track calculation originally developed for the 51 member ECEPS forecasts in the western North Pacific [5,6], individual ensemble member tracks starting within a 180 km radius and with similar 12 h vector motions were combined to initiate an ensemble storm. Once an ensemble member joined, it continued to be a member and its next 12 h motion vector would be given a weighting factor inversely proportional to the distance its origin point is from the WMVM position. That is, the 12 h motion vector of a nearby ensemble member is given a large weight and an ensemble member track that deviated widely from the WMVM track will be given a small weight. Consequently, the WMVM track forecast tends to “go down the middle” of a swarm of ensemble member tracks and have small along-track motion errors. By contrast, a simple ensemble mean track that gives equal weight to an ensemble member motion vector that significantly deviates from the mean track vector will tend to have a slow along-track bias.
The Marchok vortex tracker [8] also provides several “genesis parameters” along the ensemble member tracks that are determined from the Cyclone Phase Space (CPS) parameters [14]. Two genesis parameters were utilized in this procedure to calculate the weighted-mean (same weighting factors as for the track forecast) Warm Core Magnitude (WCM) along the WMVM track forecast: (i) CPS Lower-layer warm core and (ii) Upper-layer warm core, which are positive (negative) for a warm-core TC (cold-core extratropical cyclone or tropical upper-tropospheric trough). Because the Lower- (Upper)-layer is 900–600 mb (600–300 mb), the Upper-layer warm core is weighted two times the Lower-layer warm core in the WCM to reflect the (1/p) factor in the hypsometric equation.
To provide more guidance as to the intensity changes starting from the first detection of the pre-TC circulation in the ECEPS and GEFS forecasts, the combined WAIP prediction technique for the western North Pacific [13] is applied. During the pre-formation stage (either for the T2F(25) or the T2F(35) time), and assigning an initial intensity of 15 kt if a Working Best Track (WBT) intensity is not available, the intensity evolution is represented by a square function between that initial intensity and either 25 or 35 kt, as applicable. The second stage of the combined WAIP is the intensification stage starting from the T2F, and the intensity evolution is the weighted-mean of 16 historical analog-intensity evolutions. These analogs are required to be within ±30 days, have tracks that closely match the 7-day WMVM track forecast after the T2F, and have initial intensities that closely match either 25 or 35 kt. The third stage of the combined WAIP is the ending-storm stage due to landfall, extratropical transition, or to non-development within the 7-day forecast interval [13]. Ending stage time associated with landfall is defined as 24 h after crossing the coast, and the extratropical transition time is defined as when the WCM of the TC has become negative. The WAIP Ending Time will be provided (if applicable) for each of the three WAIP intensity forecasts associated with T2F(25) and with the two T2F(35) values derived from the WCM evolution or will be 7 days after the corresponding T2F if no landfall or extratropical transition is involved.

3. Examples of ECEPS and GEFS Forecasts of T2F

Because forecasters do not have time to study each ensemble model output looking for all pre-TC circulation that might have a formation during the next five days, the T2F timing and position had to be objectively provided. Thus, key information about the storm and the three T2Fs is listed at the bottom of each forecast, and tables are provided that allow the forecaster to easily adjust the timing and position. The primary focus (Section 3.1) will be on the western North Pacific TCs since the 7-day combined WAIP intensity forecasts [13] have also become available for that basin after the 2019 season. For readers with interest in the eastern North Pacific or the Atlantic, one example will be presented in Section 3.2 and Section 3.3, respectively.

3.1. Western North Pacific Examples

The first example (Section 3.1.1) will be the T2F and combined WAIP intensity along the WMVM track of Typhoon (TY) Lingling (15W). Since both the T2F and the intensity depend strongly on the track forecast accuracy, Lingling was selected as it had a poleward track that is typically more difficult to predict than a westward mover at low latitudes or a recurver storm. The second example (Section 3.1.2) will be Tropical Storm (TS) Peipah (17W) that had a recurvature-type track that would, from climatology, have been expected to develop into a typhoon, but its maximum intensity was 35 kt. TY Bualoi (22W), to be described in Section 3.1.3, developed at low latitude (5° N) near the Dateline, and this will be a challenging example of T2F forecasting.

3.1.1. ECEPS and GEFS Forecasts of T2F and Intensity of TY Lingling (15W)

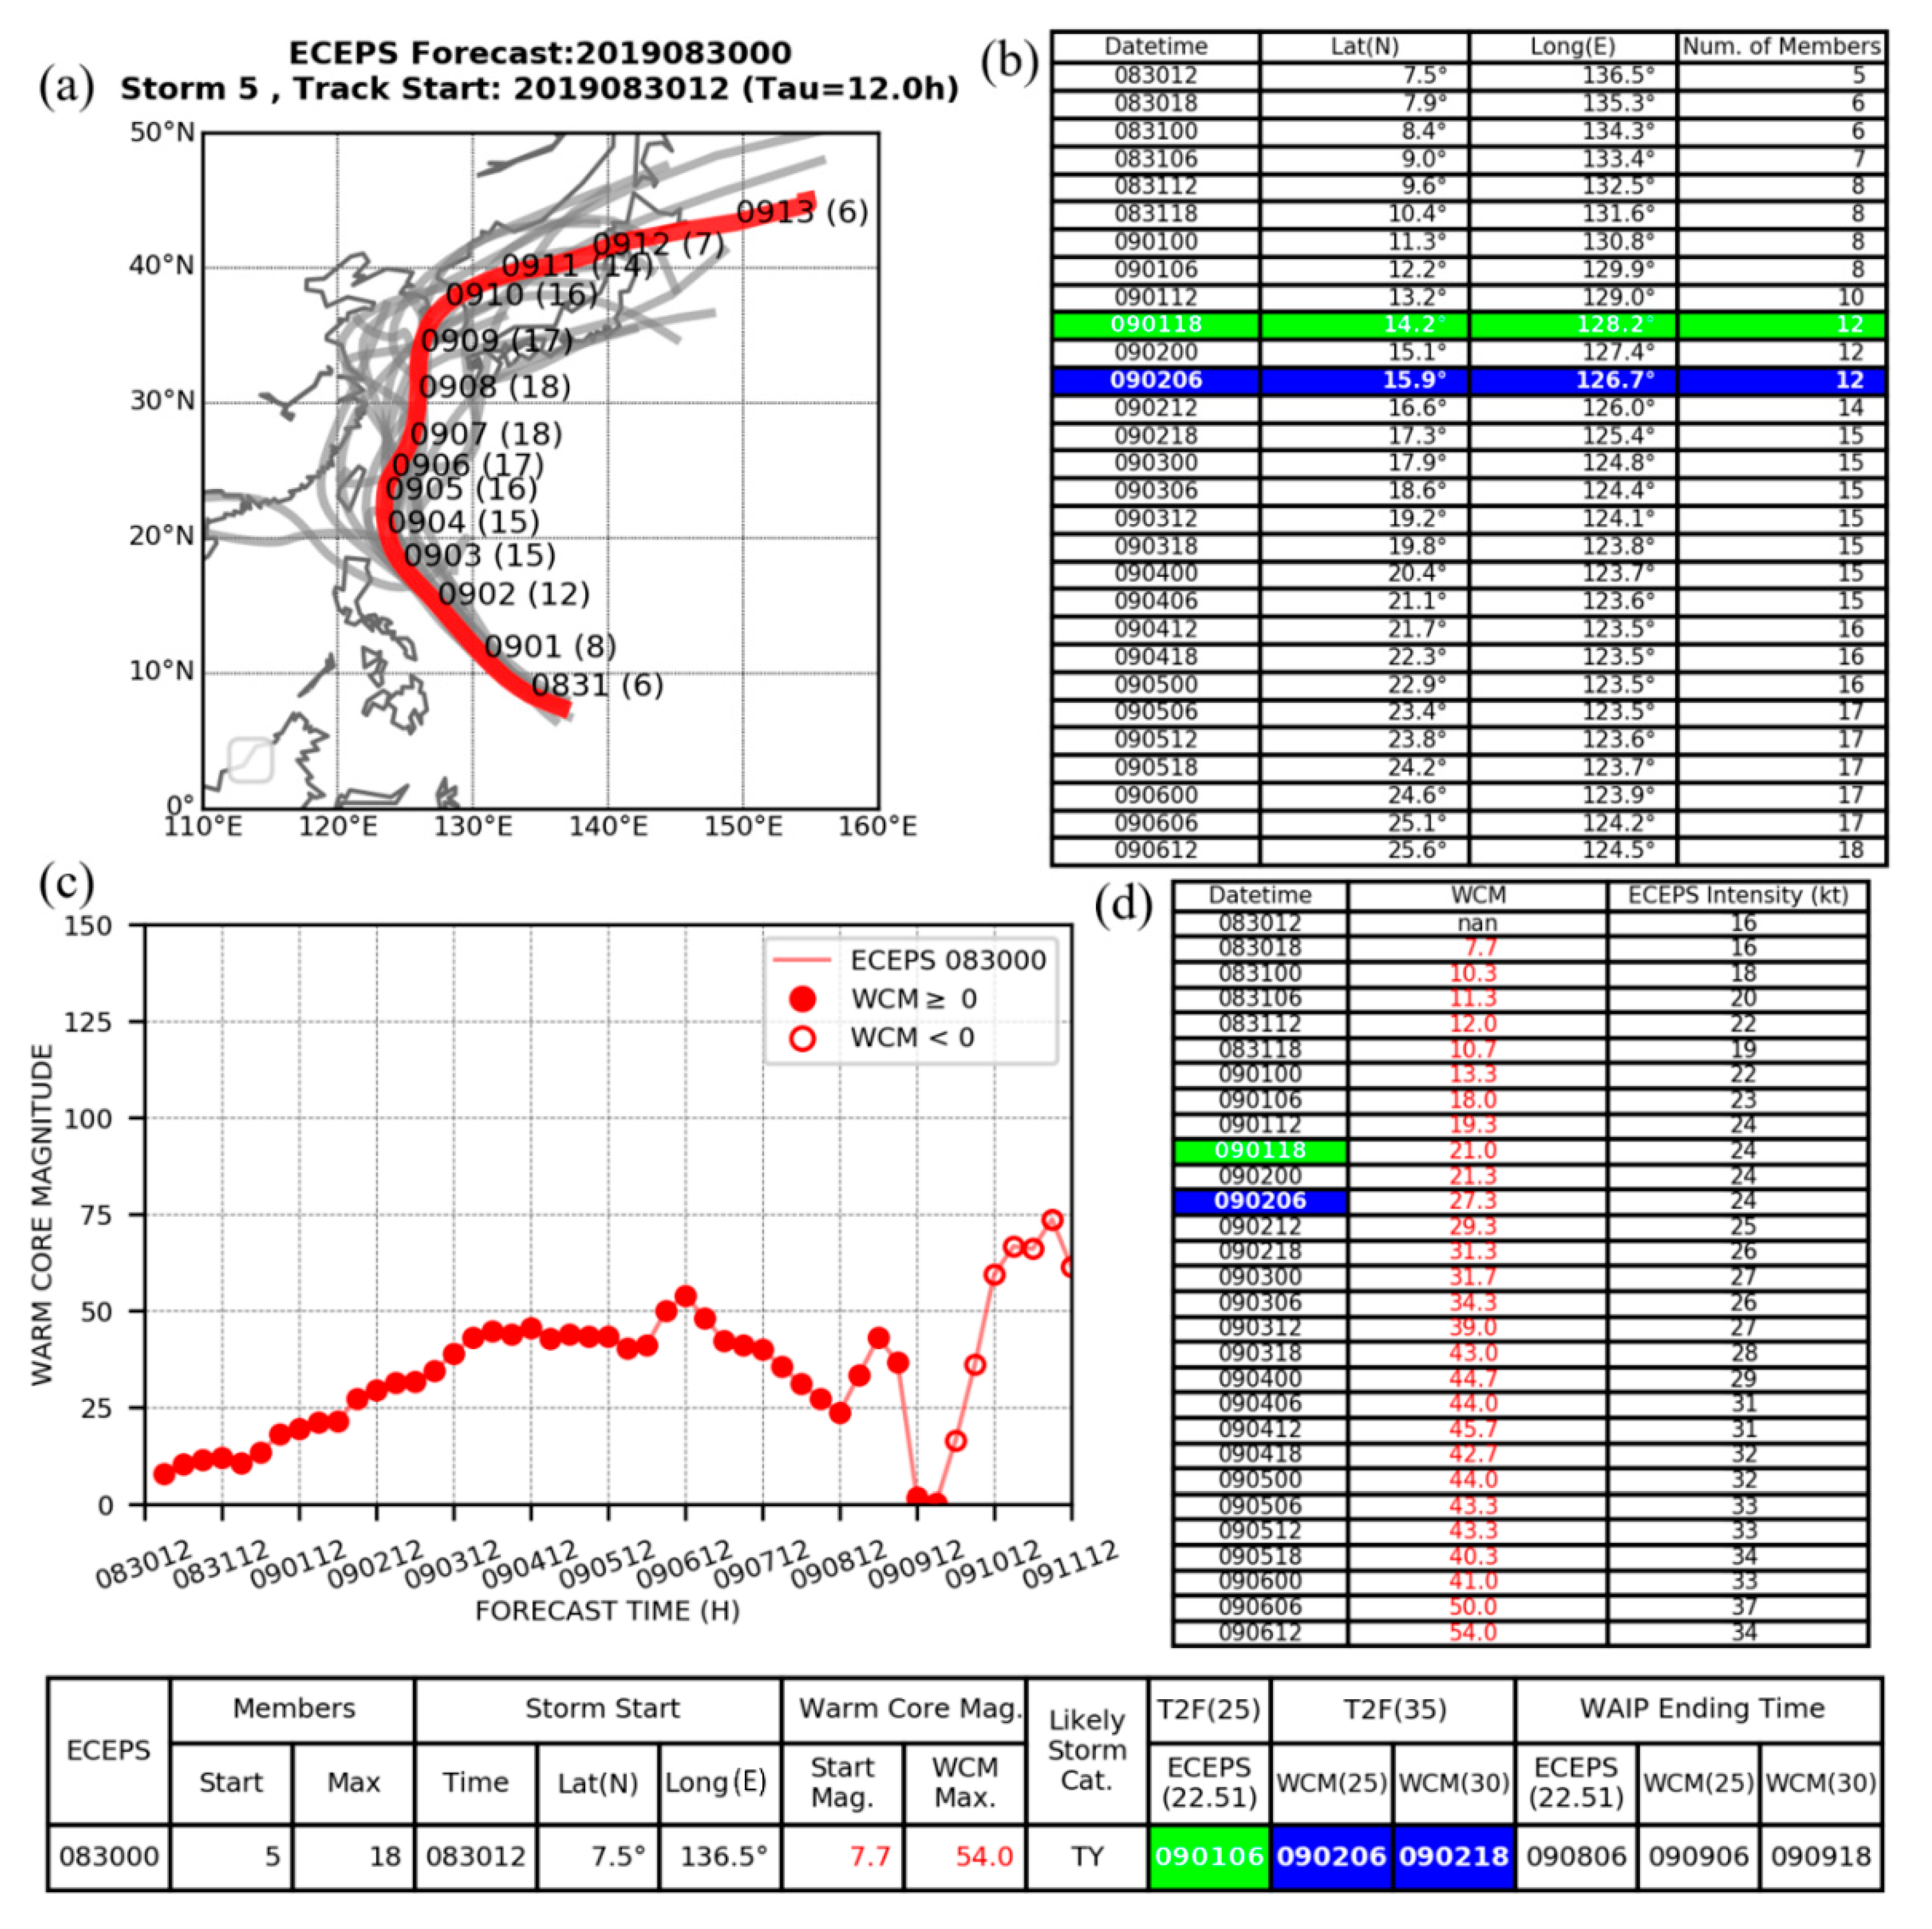
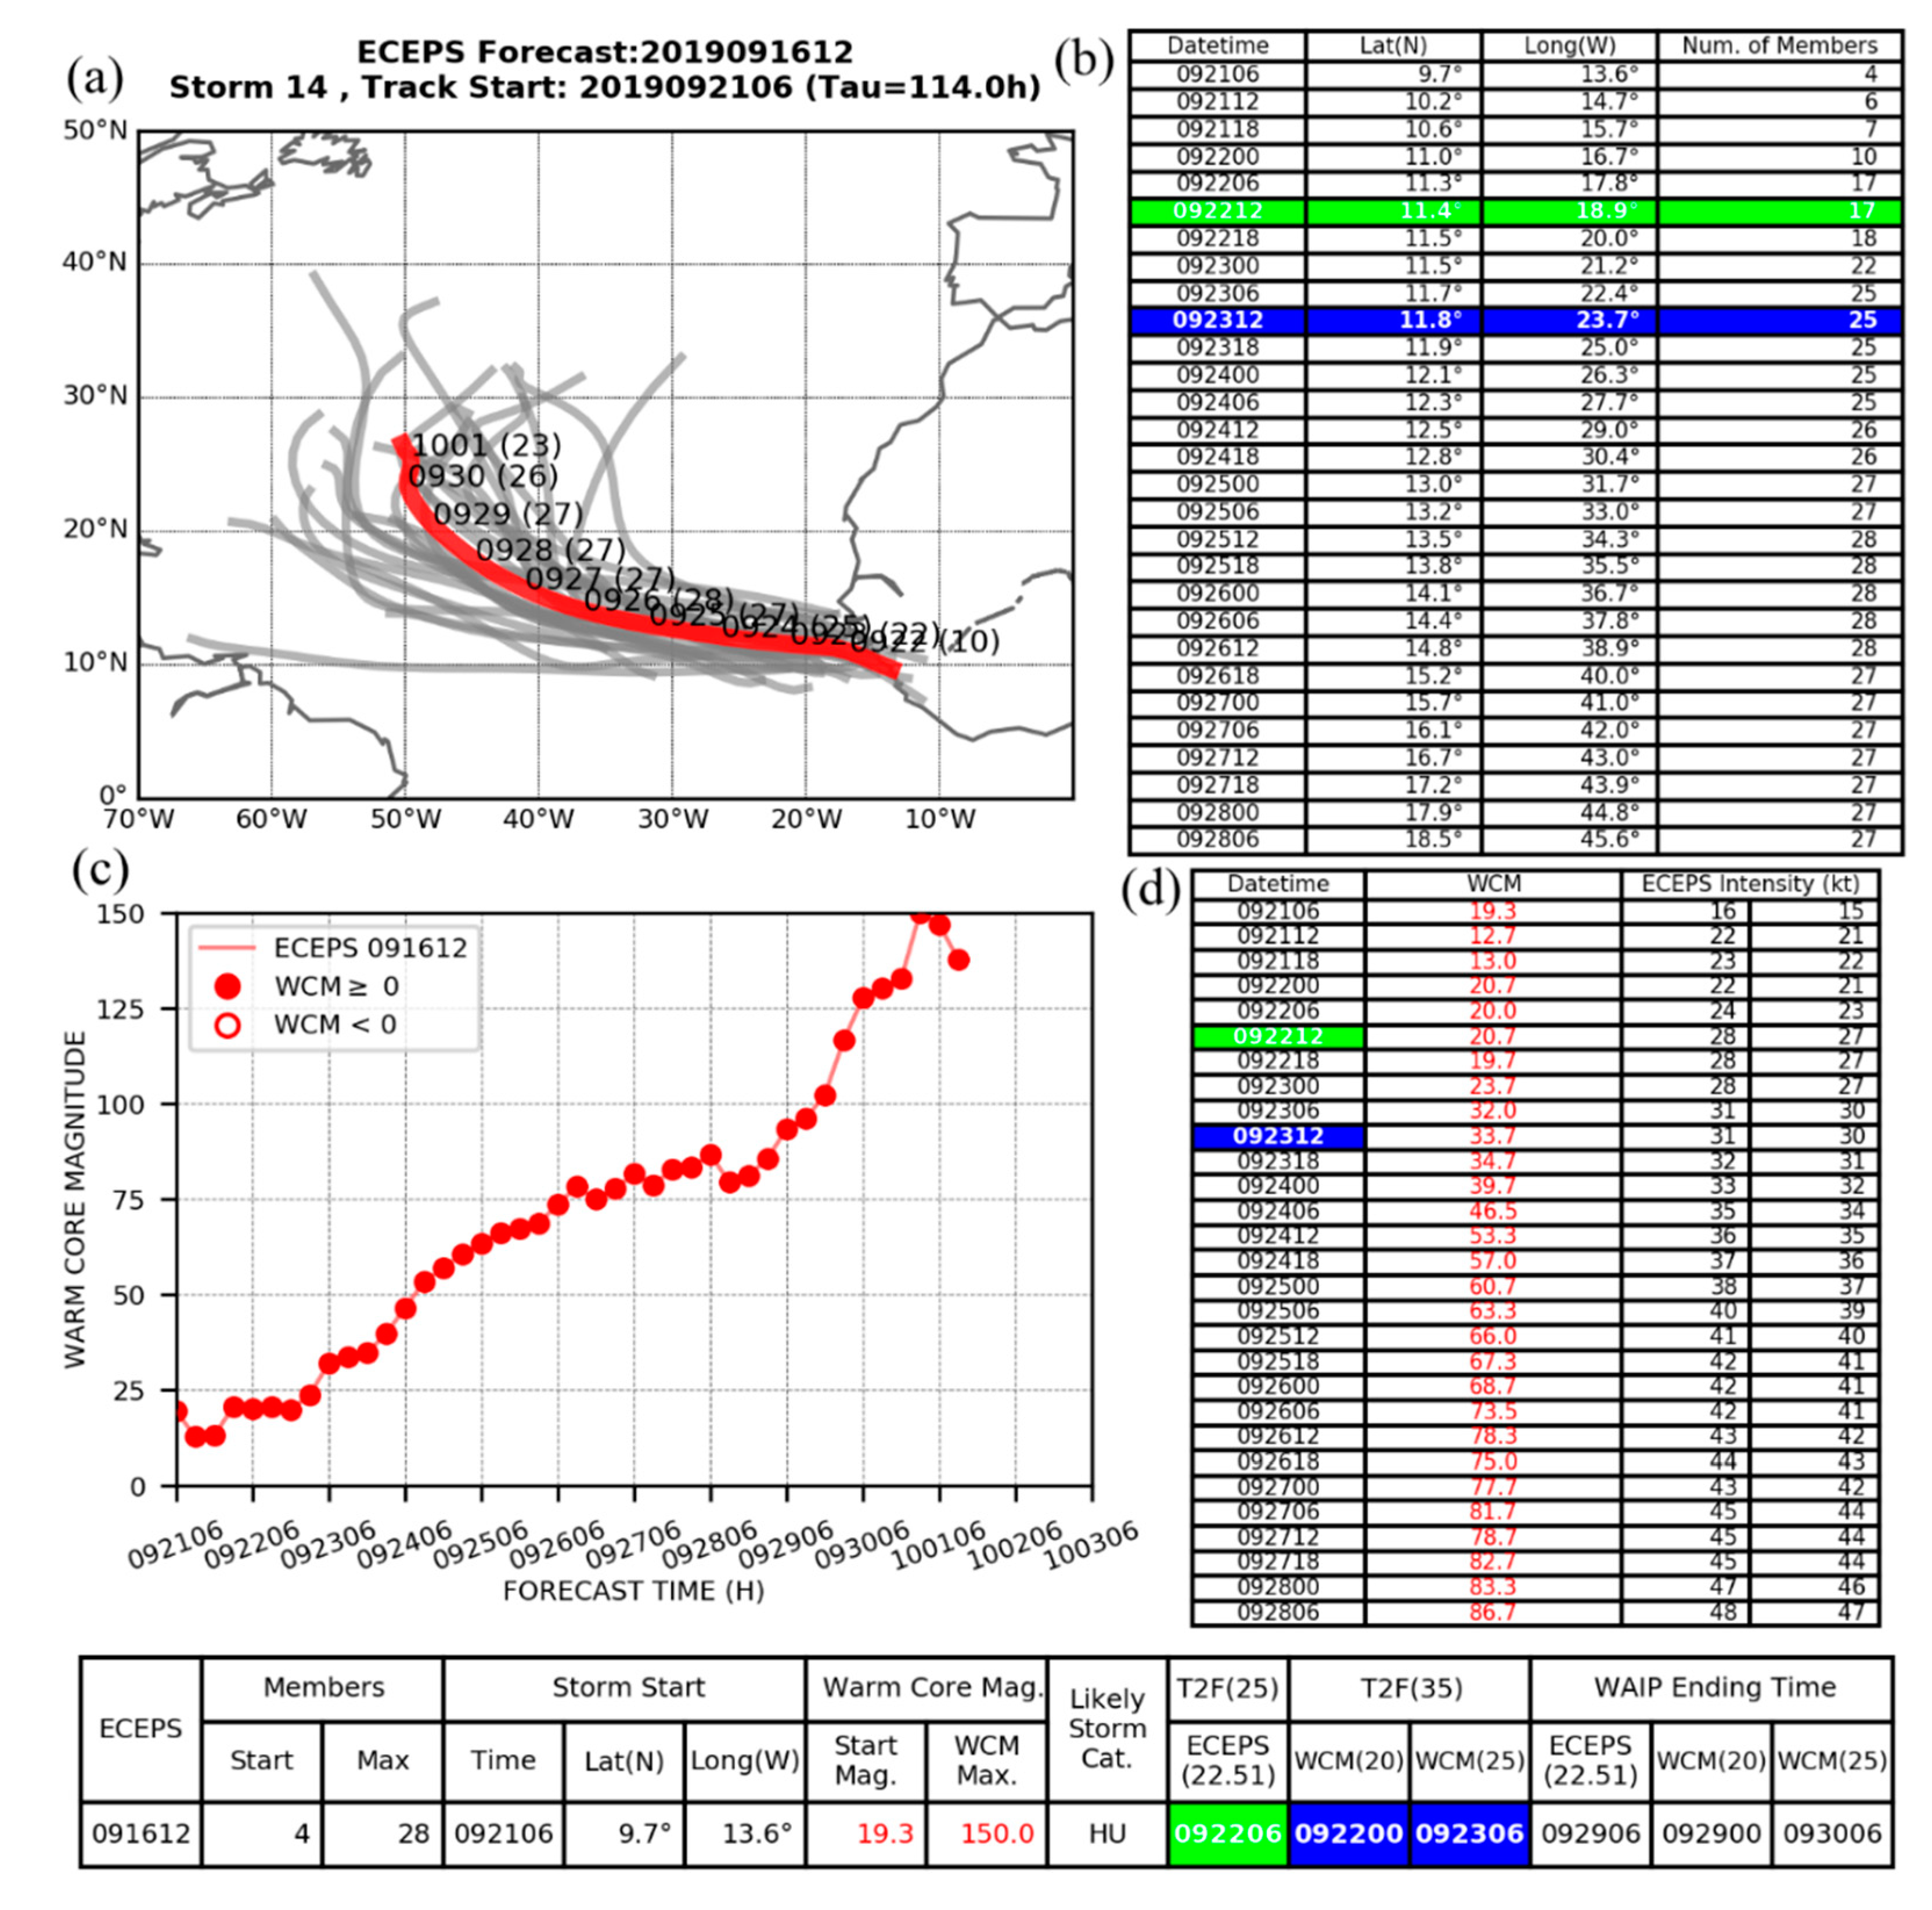
In the ECEPS forecast from 083000 (00 UTC 30 August 2019), the WMVM forecast track (Figure 1a, red line) for pre-TY Lingling (2019) starts at 083012 (Tau = 12 h) at 7.5° N, 136.5° E with 5 members (Figure 1b, first line). Whereas the labels in Figure 1a are the Month–Date at 00 UTC, the table in Figure 1b provides the forecaster for the digital positions each 6 h during the first 7 days of the WMVM track forecast. For the convenience of the reader, the verifying WBT positions at the T2F(25) and at the T2F(35) are indicated by the green and the blue colors in Figure 1b. Note that the pre-Lingling circulation in this ECEPS forecast began 2.25 (2.75) days prior to the time Lingling became a Tropical Depression (Tropical Storm) according to the JTWC. This capability of the ECEPS to predict the pre-TC circulation track will allow earlier guidance as to the formation time than the 24–36 h that JTWC has typically provided [13].
There is typically some uncertainty in the initial positions as the pre-TY Lingling circulation track here begins with only five members in the ECEPS. When just one more ensemble member track is added at 6 h (083018), there is a large WMVM position adjustment of 0.4° latitude and 1.2° longitude. But when one more member joins at 18 h (083106), the WMVM track becomes more stable (Figure 1b), and the pre-Lingling circulation is predicted to move rapidly to the northwest within a compact track spread (Figure 1a). The advantage of the WMVM calculation with weighting factors for each member becomes more important as the track spread increases, and at the end of the 15-day ECEPS forecast, the WMVM track comes smoothly to an end even though the ensemble member tracks have a wide variety of translation speeds and directions generally toward the northeast.
As indicated in the Introduction Section, the T2F(25) estimate is defined as the time the weighted-mean (same weighting factors as for the WMVM calculation) of the intensities of the ensemble members included in the pre-TC circulation first exceed 25 kt. For the ECEPS forecasts that tend to have weaker intensities than for the GEFS, the ECEPS intensity (column 3 in Figure 1d) threshold is actually defined as 22.51 kt, which would be considered to be an intensity of 25 kt if digitized to the nearest 5 kt value. For this ECEPS intensity forecast (column 3, Figure 1d), the T2F(25) is therefore 090106, and this T2F(25) is entered in green box in the summary table at the bottom of Figure 1. Note that this T2F(25) forecast is 12 h early compared to the verifying T2F(25) time of 090118 in green box in column 1 of Figure 1d.
The ECEPS-predicted WCM evolution along the WMVM track forecast is plotted in Figure 1c and the digital values are in the table in Figure 1d (column 2), where the WCMs in red indicate positive values. Note that the initial WCM is 7.7 and then the WCMs increase steadily as the ECEPS intensity (Figure 1d, column 3) increases. After examining many ECEPS forecasts, the WCM threshold for an early (later) T2F(35) time was set at 25 (30). In this ECEPS forecast of pre-TY Lingling, the WCM > 25 threshold (WCM > 30 threshold) was achieved at 090206 (at 090218), and these key results from the ECEPS are highlighted in the blue T2F(35) boxes in the summary table at the bottom of Figure 1. Compared to the verifying T2F(35) time of 090206 (blue box in column 1 of Figure 1d), the T2F(35) prediction with WCM > 25 is perfect and the T2F(35) with WCM > 30 is only 12 h late. Note that these are times along the WMVM track forecast and thus the positions of these two ECEPS-predicted T2F(35) times can be found in Figure 1b. It is emphasized that the weighted-mean WCM values have the same weighting factors for each ensemble member as for the WMVM track forecast, so that a WCM for an ensemble member track that greatly deviates from the WMVM track would be given a very small weight.
Whereas the WCM continues to steadily increase beyond these WCM threshold values for T2F(35), the weighted-mean ECEPS intensity (Figure 1d, column 3) only slowly increases beyond 25 kt. Therefore, the ECEPS intensity is utilized for detecting the Tropical Depression (TD) stage, but not for the TS stage. It was discovered that the maximum positive WCM for ECEPS forecasts could also be used to distinguish the Likely Storm Category (Figure 1, summary table at bottom): Maximum WCM < 25.0 for TD, 25.0 ≤ WCM < 46.0 for TS, and WCM ≥ 46.0 for TY. For this ECEPS forecast of the pre-Lingling circulation, the maximum WCM = 54.0 implies that this circulation will likely become at least a weak TY. Another future application of the maximum WCM value will be to detect False Alarms (FAs) in the ECEPS (and GEFS) predictions (e.g., four FA types in the Atlantic [7]). Other predictors of FAs might be maximum number of ensemble members (column 3 in the summary table at bottom), length of track, and storm start positions (columns 4–6 in the summary table at bottom) that might indicate an equatorial wave rather than a TC.
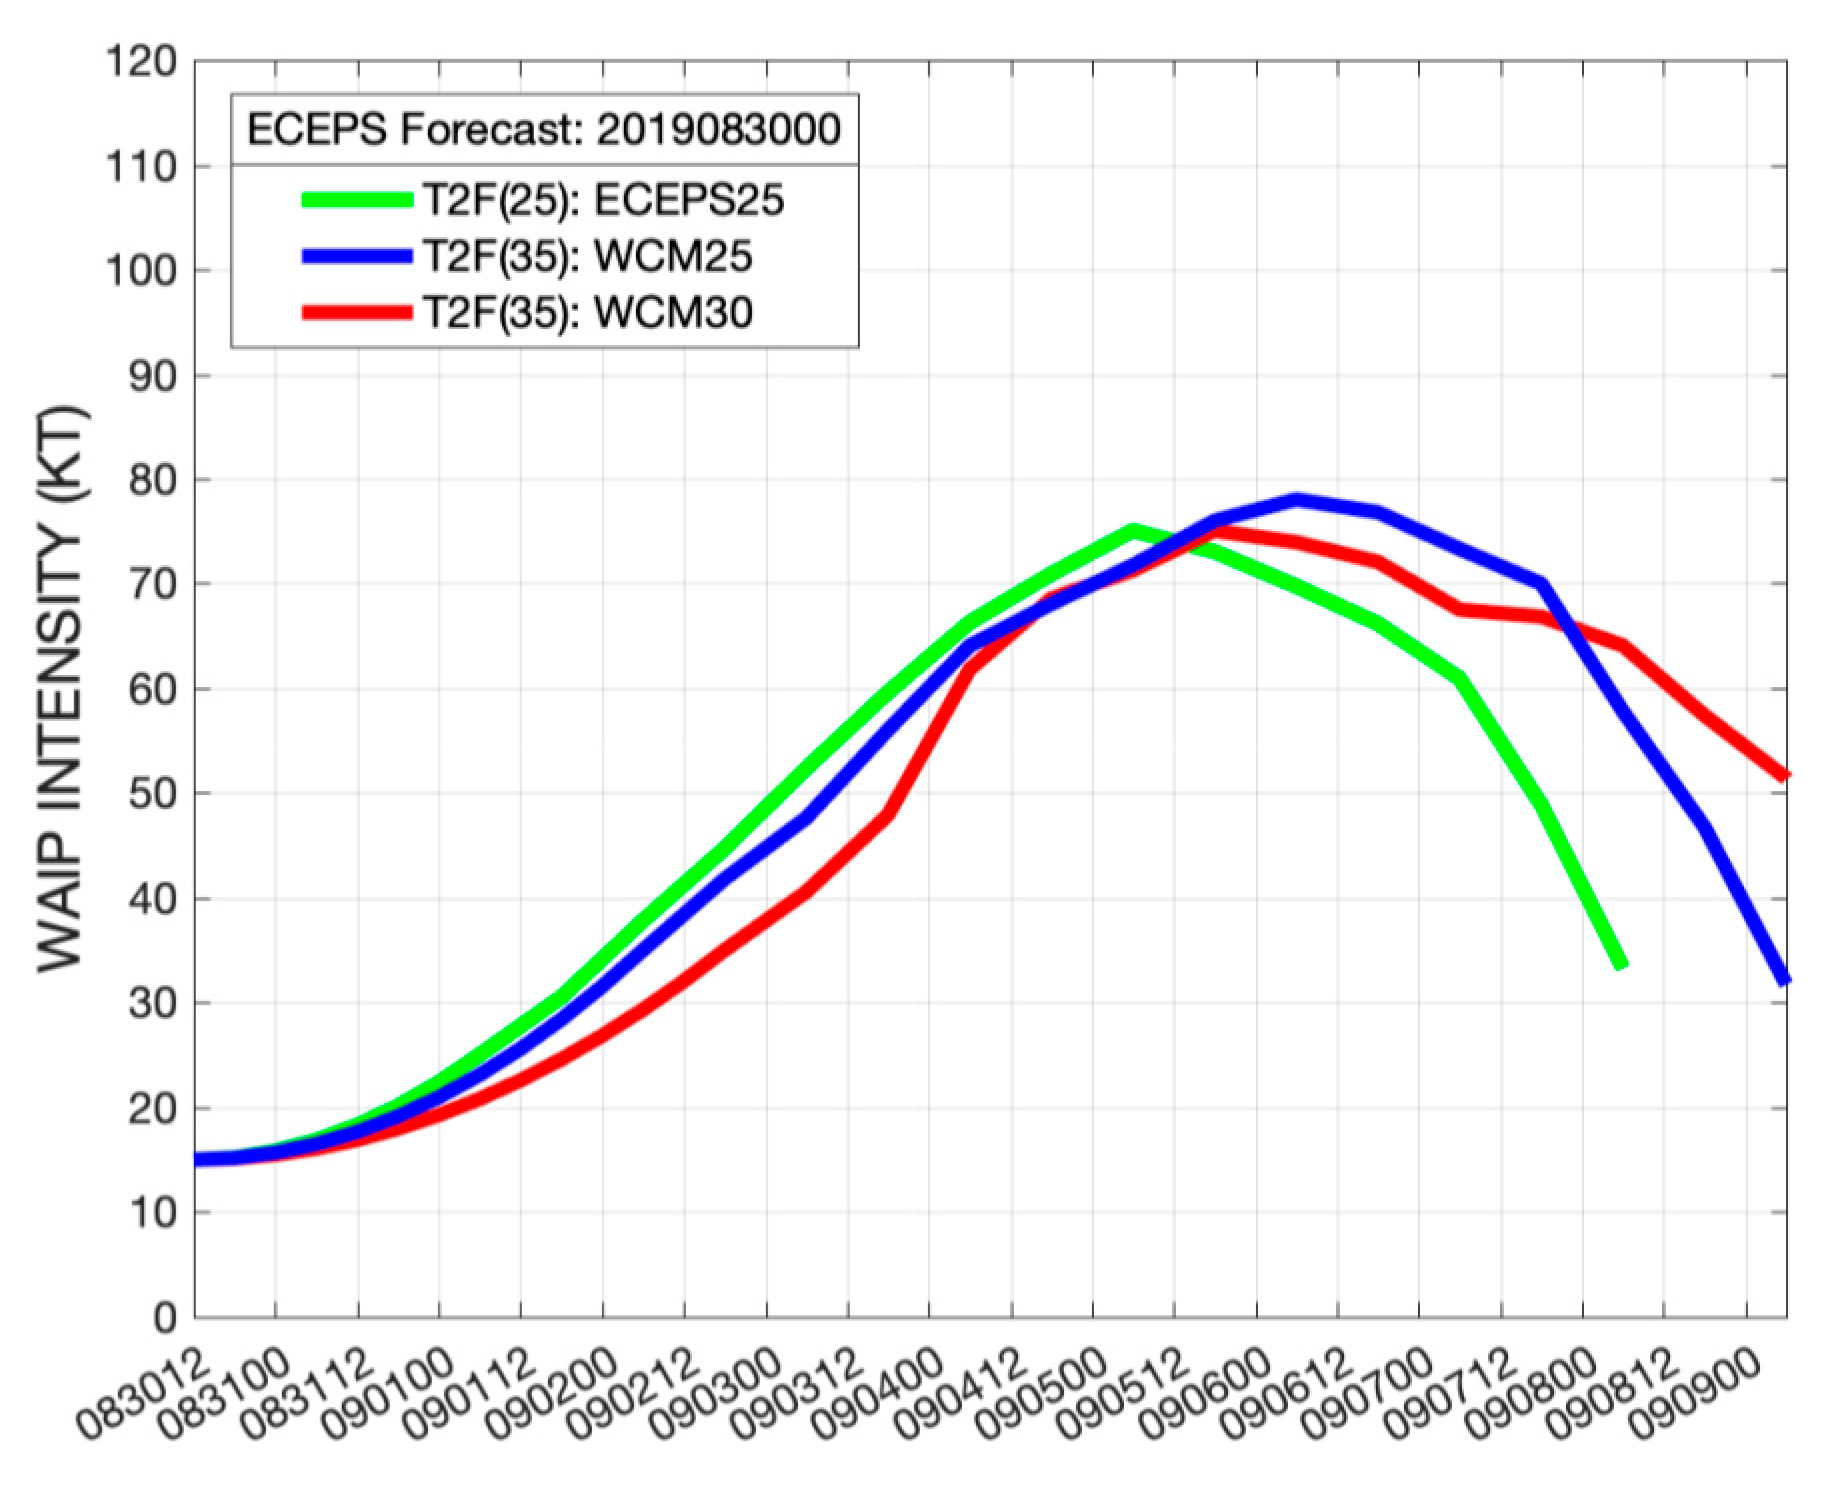
The three combined WAIP intensity forecasts based on the three ECEPS-predicted T2Fs, the WMVM track forecast in Figure 1a, and the three WAIP Ending Times at bottom of Figure 1, are displayed in Figure 2. Each intensity forecast begins at 15 kt since a WBT intensity is not yet available, and is a square function to the corresponding T2F at which the intensity is either 25 or 35 kt. After the T2F, the combined 7-day WAIP intensity forecasts are based on the intensity evolutions of 16 analogs that have tracks that closely match the WMVM track and have initial intensities close to either 25 or 35 kt, as appropriate. With these constraints on analog selection, most of the same analogs will be selected, and thus the WAIP intensity forecasts after the T2F have a similar variation with slightly different peak intensities (±5 kt in this case). Note that the decay stages of these intensity forecasts are constrained by the different WAIP Ending Times. As expected for an analog statistical TC intensity prediction technique, these peak intensities will be much smaller than the verifying 130 kt peak intensity of TY Lingling. It is noteworthy that each of these peak intensities are of Typhoon strength, which confirms/supports the Likely Storm Category of Typhoon based on the maximum WCM value (see the summary table at bottom of Figure 1).
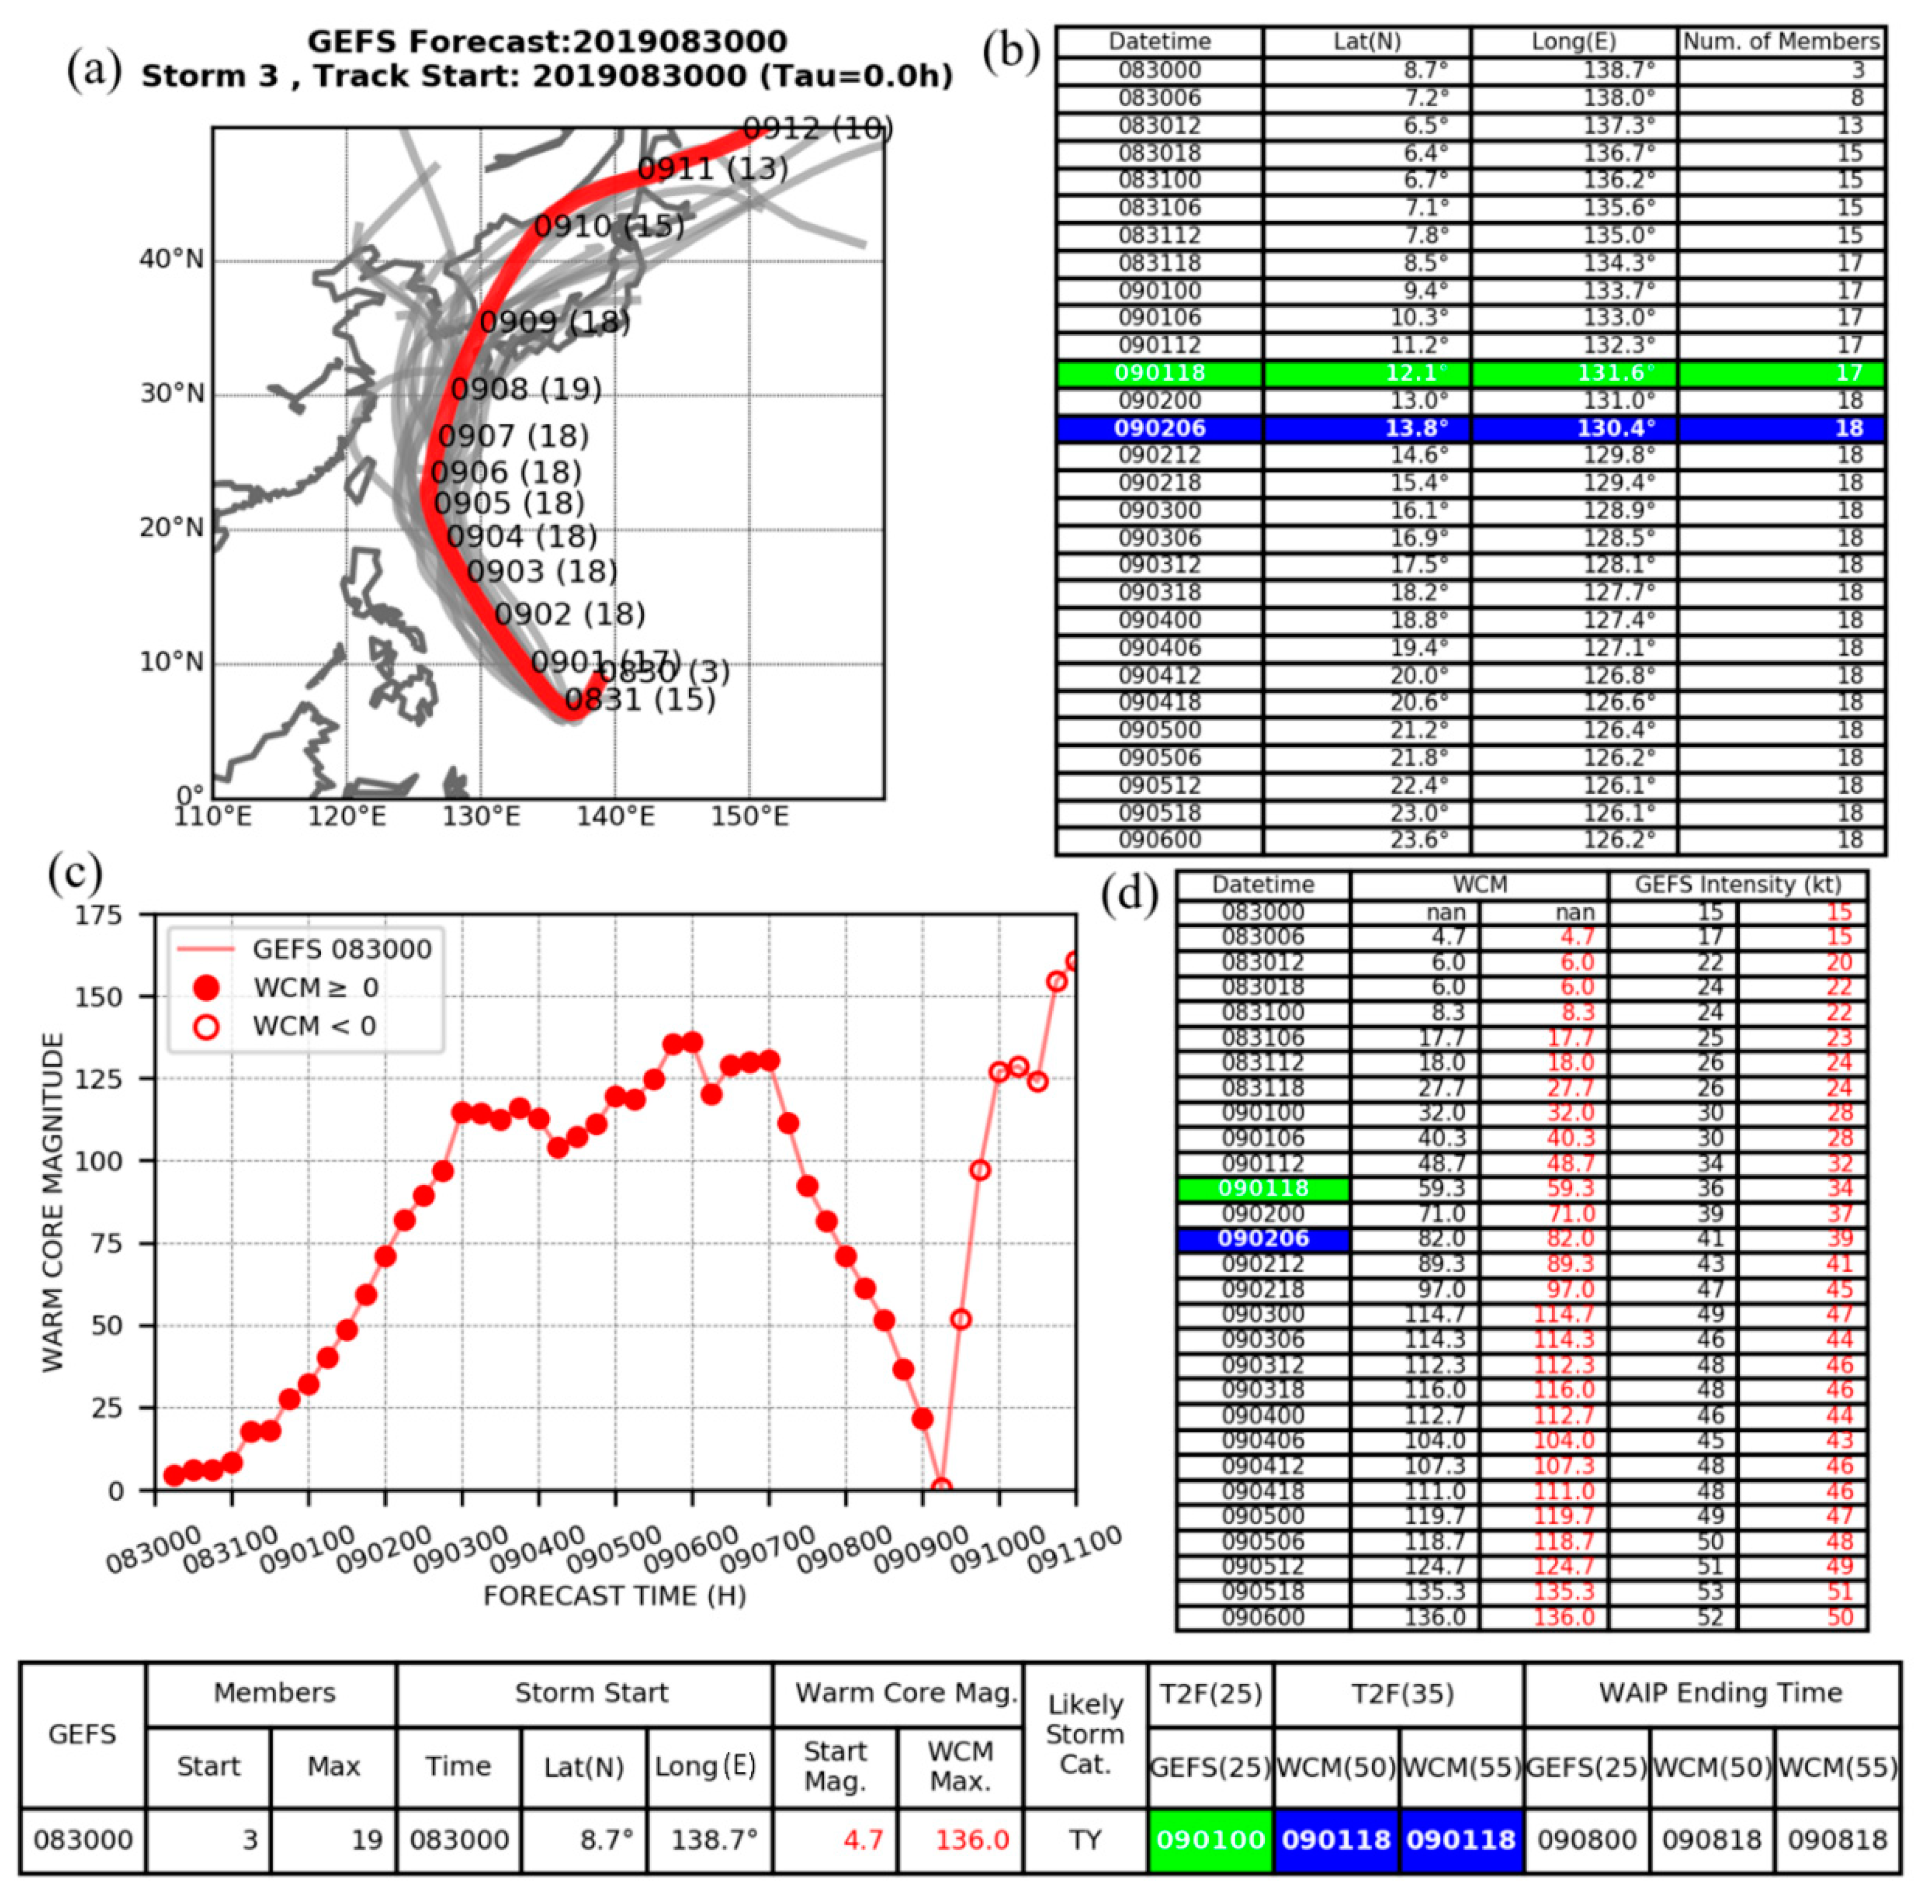
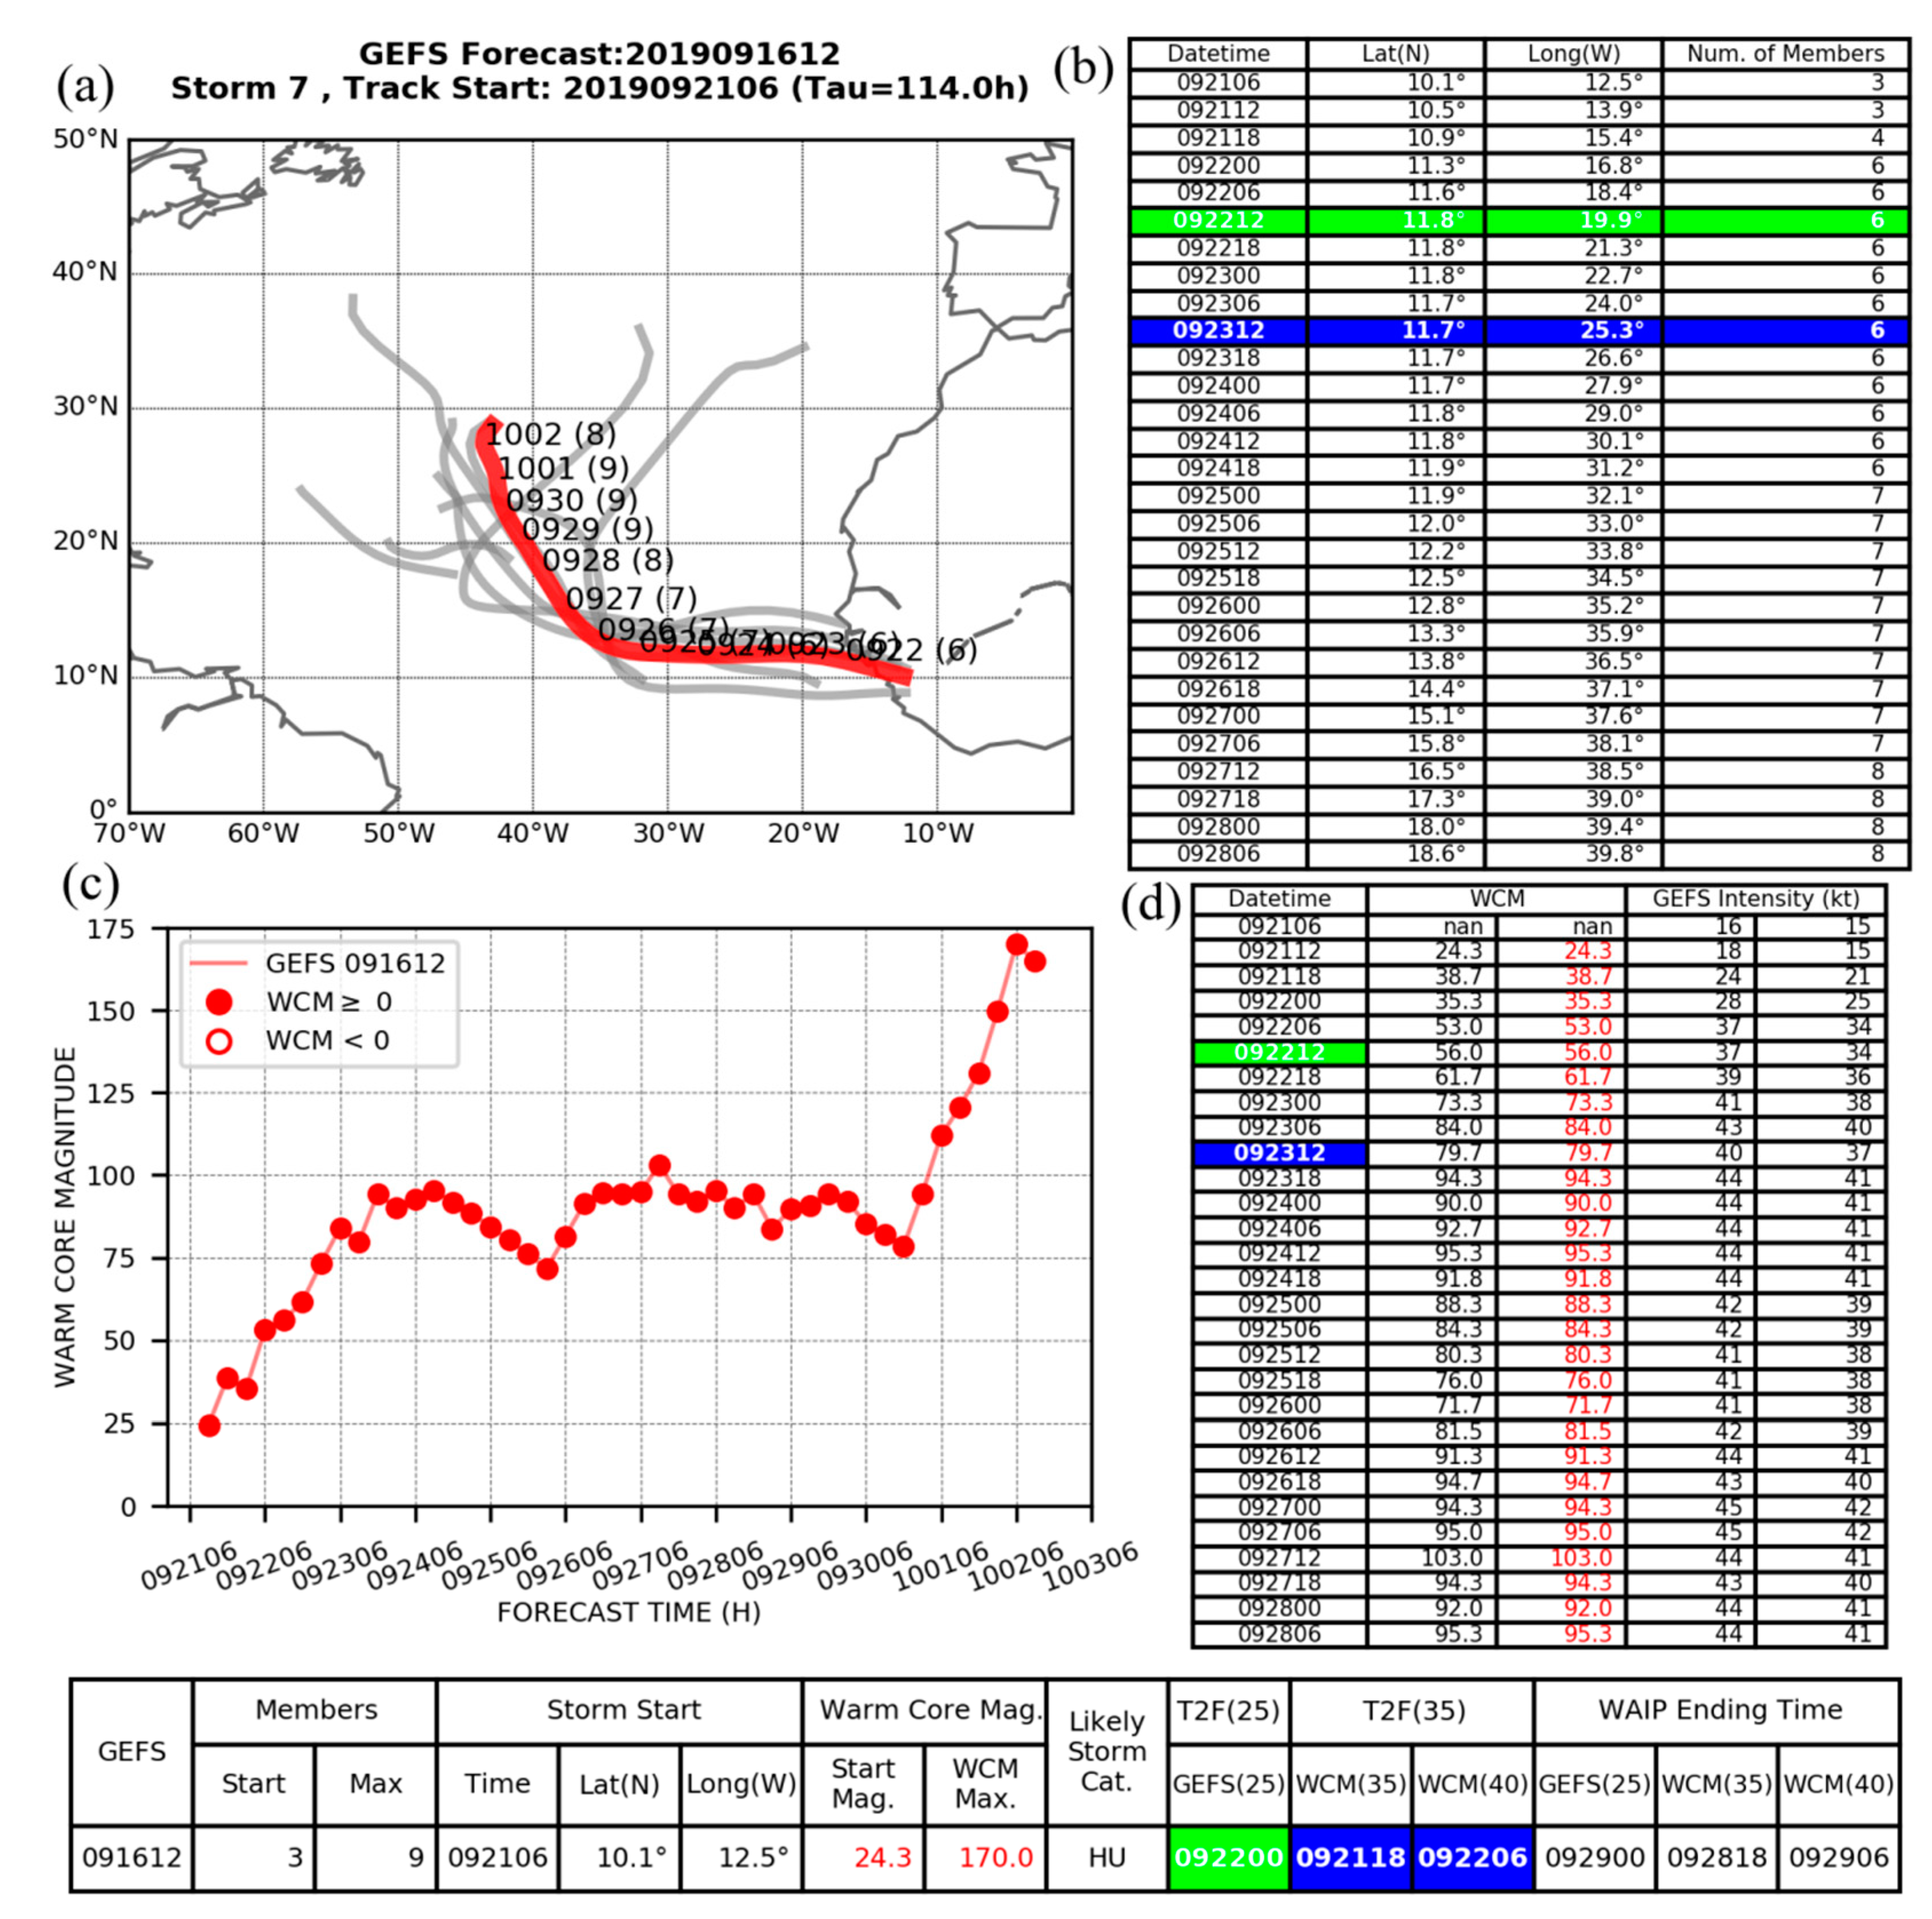
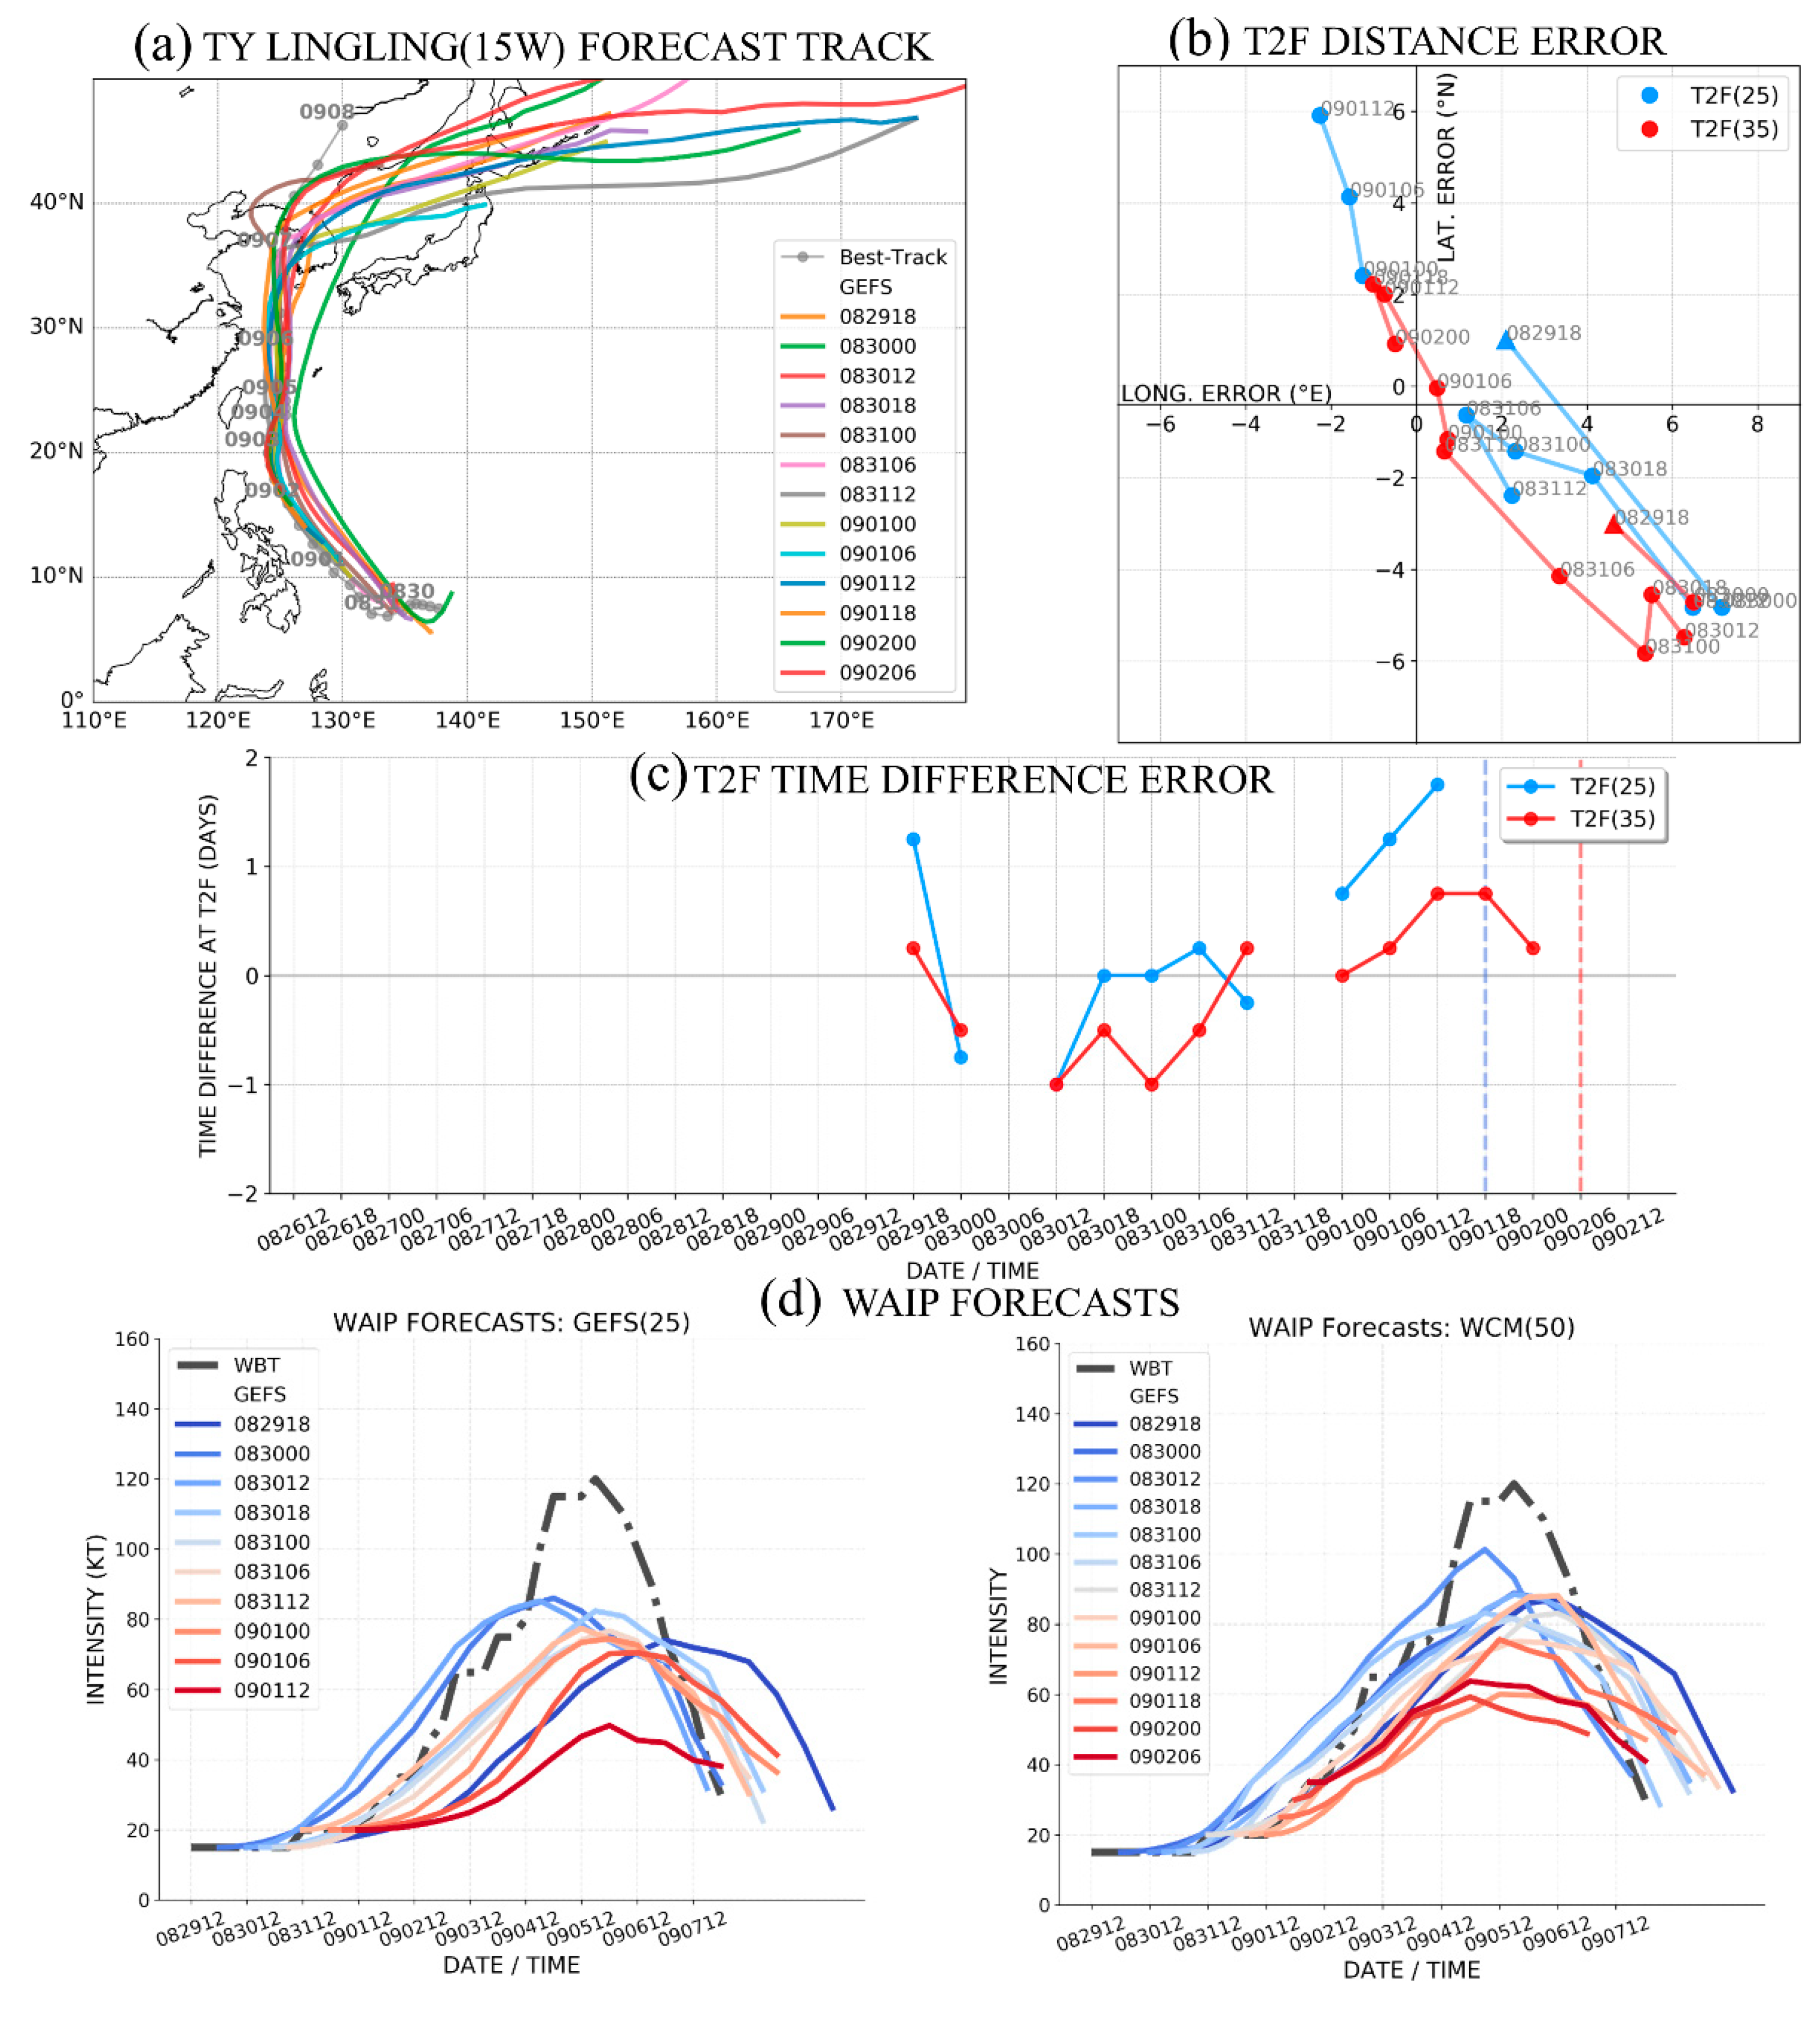
The WCM-T2F prediction from the GEFS forecast from 00 UTC 30 August is provided in Figure 3. The track forecast has the pre-Lingling circulation in the initial conditions at 8.7° N, 138.7° E with 3 members, but after 12 h, another 10 members have joined and the position has been re-located to 6.5° N, 137.3° E (Figure 3b). The subsequent track is to the northwest with quite small track spread among the 18 members (of a possible 21), and by 00 UTC 9 September (Day 10), the Lingling position in the GEFS (Figure 3a) is far to the south of the ECEPS track forecast (Figure 1a).
A general feature of the GEFS forecasts in the western North Pacific is that the initial GEFS intensity (Figure 3d, column 4) is too high (at least compared to the initial WCM in column 2), and the intensity changes are larger than for the ECEPS (Figure 1d). In this example, the GEFS intensity is 17 kt at 083006 when the initial WCM is only 4.7. Furthermore, the intensity change in the next six hours is +5 kt. Consequently, an adjustment is made to the GEFS intensity at the initial WCM time that the initial GEFS intensity of a pre-TC circulation will not be larger than 15 kt, or the Working Best Track (WBT) intensity, if available. These adjusted GEFS intensities are shown in red in column 5 of Figure 3d, and for this pre-TY Lingling forecast, the T2F(25) is then delayed to 090100 (green box in the summary table at the bottom of Figure 3), rather than 083106 in the original GEFS intensity prediction (column 4). However, that adjusted T2F(25) time is still 18 h prior to the verifying T2F(25) time of 090118 (green box in column 1 of Figure 3d).
Another general feature of the GEFS forecasts of the WCM evolution (Figure 3c,d) is more rapid increases, and therefore a larger WCM threshold must be used to estimate the T2F(35) than in the ECEPS forecast (Figure 1c). Thus, the two T2F(35) times based on the WCM thresholds are adjusted to be 50 and 55 rather than 25 and 30 for the ECEPS. Although not applicable in this case, the initial GEFS WCM values are occasionally large negative (cold core) values, and therefore, in these cases, an adjustment is made to begin the WCM values at 0.0. If an adjustment had been made, the negative value would have been in blue in column 3 of Figure 3d to go with the positive WCM values in red. For this GEFS forecast, the two T2F(35) times based on WCMs exceeding 50 and 55 are both 090118 (blue boxes in the summary table at the bottom of Figure 3) because of the rapidly increasing WCM values (see Figure 3c). Thus, the T2F(35) errors relative to the verifying time of 090206 (blue box in column 1 of Figure 3d) are both 12 h early. The larger WCM thresholds for a T2F(35) in the GEFS also then required a larger WCM threshold (83.0) for the Likely Storm Category of Typhoon, which is surpassed in this GEFS forecast with a maximum WCM of 136.0 (summary table at the bottom of Figure 3).
The WAIP Ending Times (last three entries in the summary table at the bottom of Figure 3) for the T2F(25) is +7 days (090800) since that is the time along the WMVM track forecast for matching the historical analog tracks. However, for the T2F(35)-related WAIP intensity forecasts, the WAIP Ending Time is determined by the extratropical transition time, which is diagnosed as the time of the last positive WCM value in Figure 3c. Since both T2F Ending Times are the same, the WAIP Ending Times of 090818 are the same.
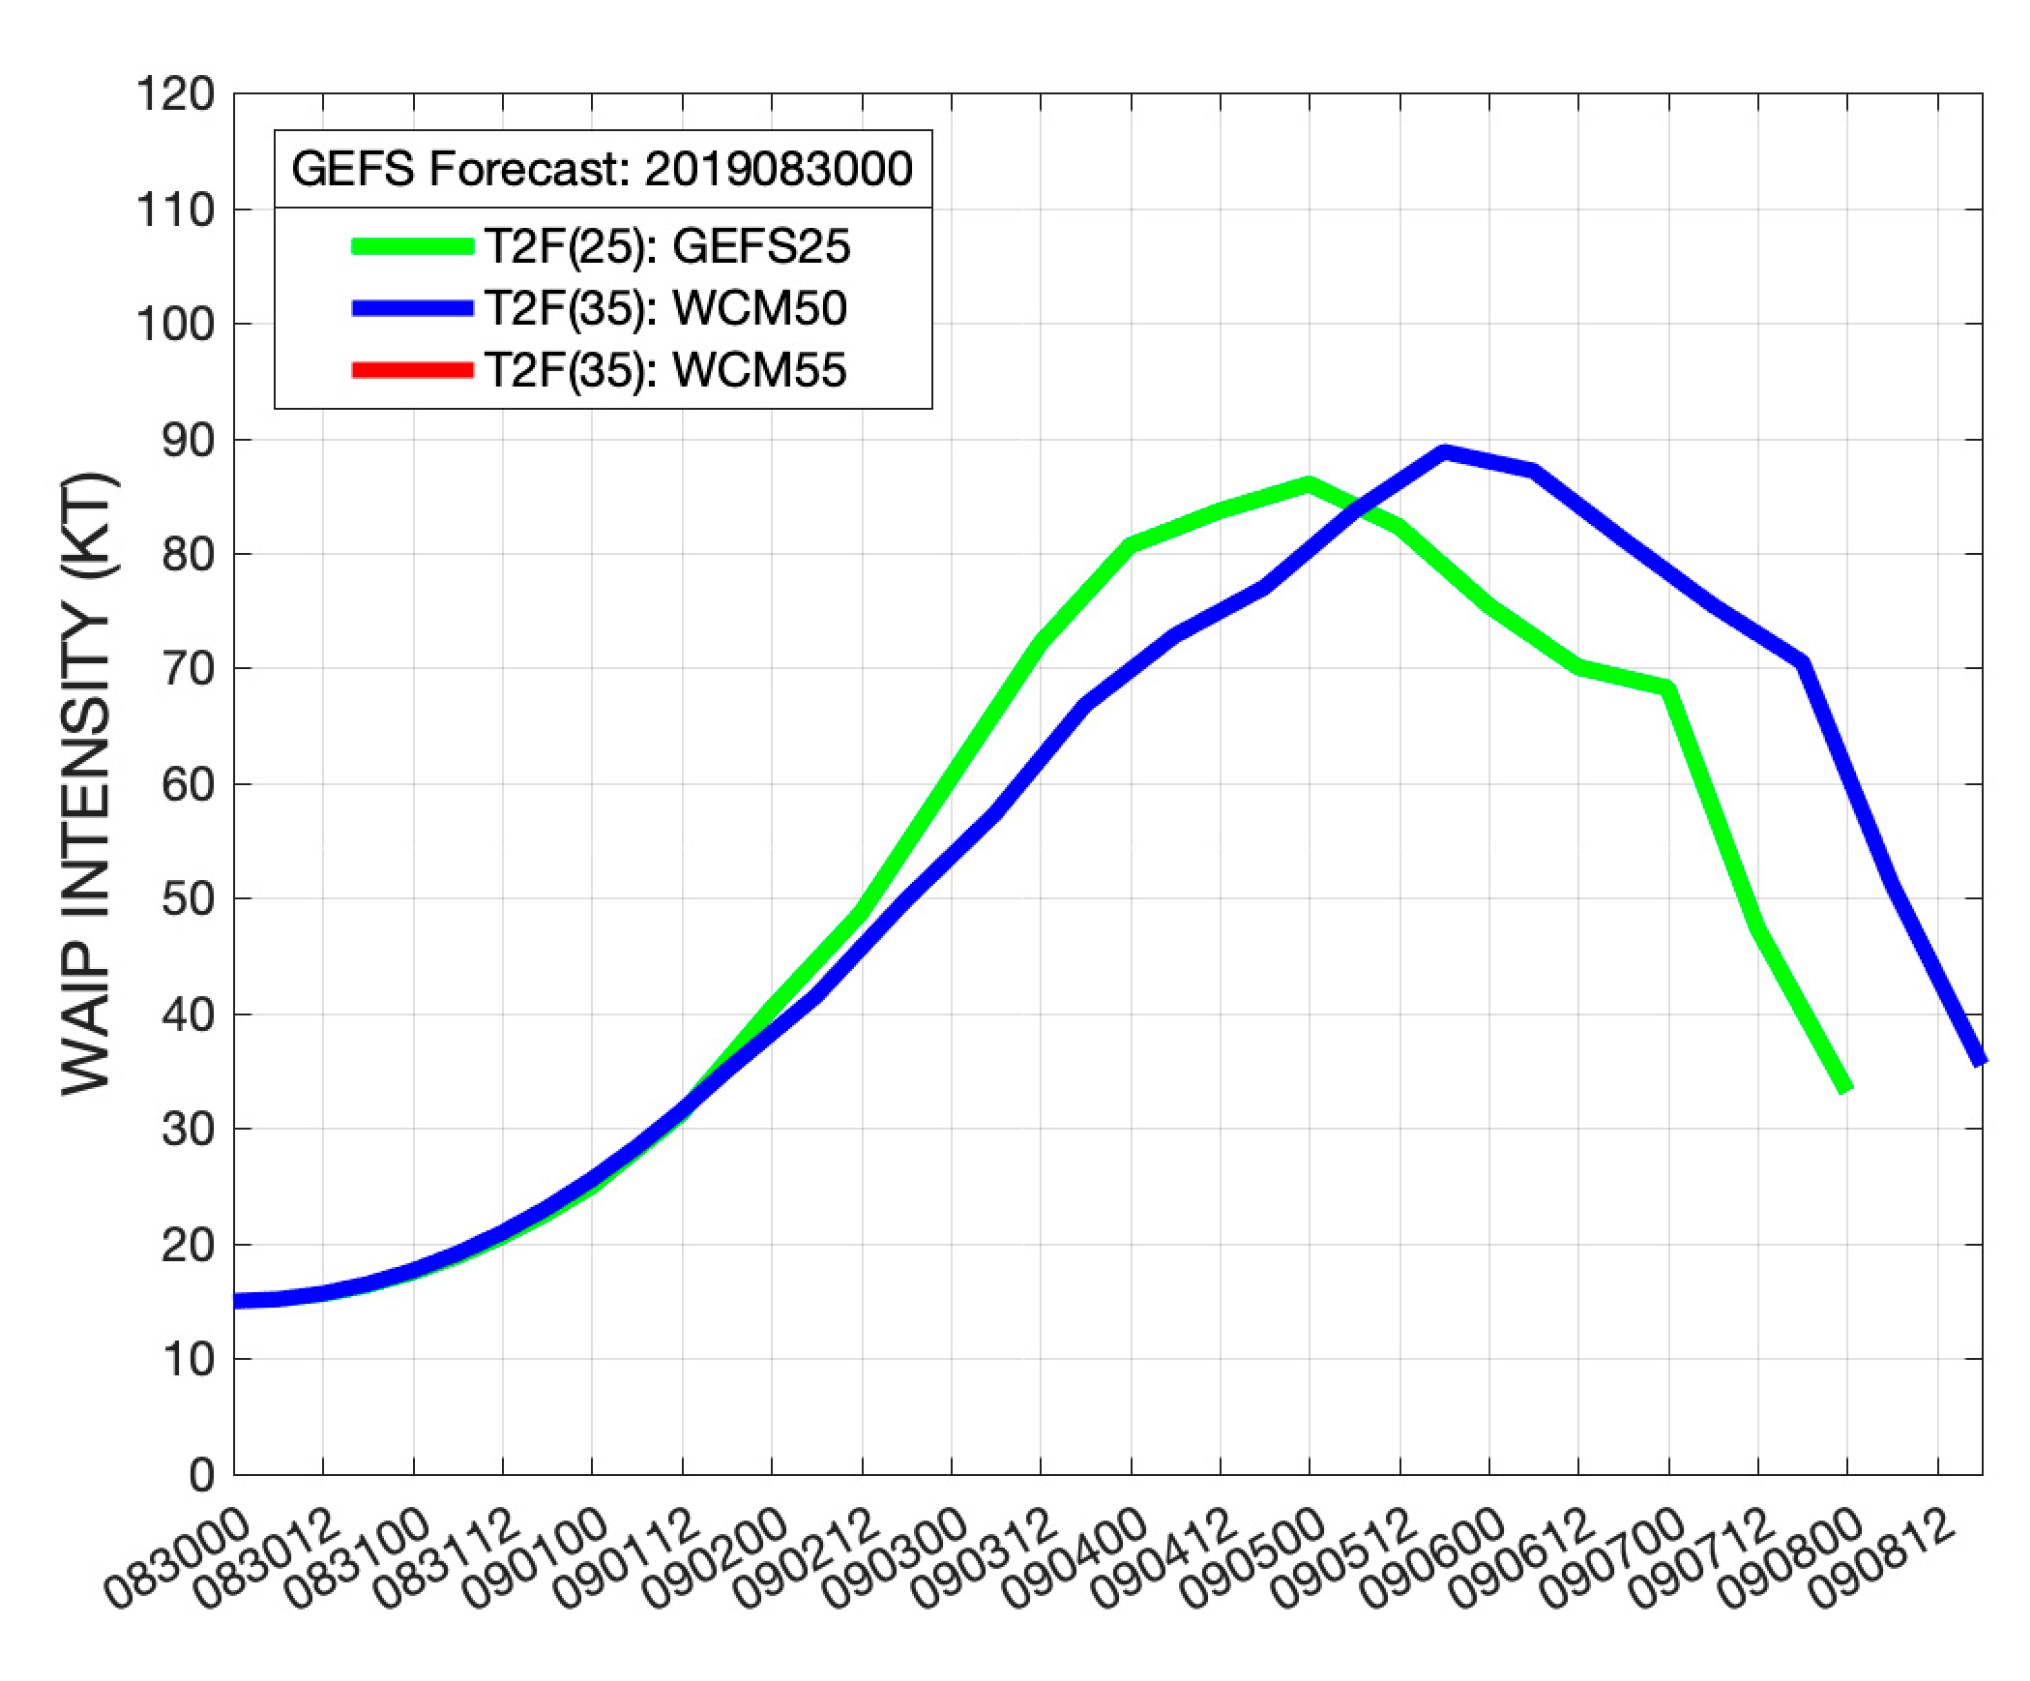
The three combined WAIP intensity forecasts based on the three GEFS-predicted T2Fs and the WMVM track forecast in Figure 3a are shown in Figure 4, except that the normally later T2F(35) based on the WCM > 55 is not shown as it is identical to the T2F(35) based on the WCM > 50. Both of these intensity forecasts begin at 15 kt since a WBT intensity is not available. Because the WAIP analogs selected for the T2F(25) have intensity changes from 25 to 35 kt that are similar to the square function between the initial 15 and 35 kt, these two intensity forecasts are identical between 15 and 35 kt. Even though the T2F(25) intensity forecast then has an earlier peak intensity than the T2F(35) intensity forecast, the peak intensities are within 5 at 85 kt, and 90 kt. As for the ECEPS-based WAIP peak intensities in Figure 2, it is noteworthy that these GEFS-based WAIP peak intensities are clearly of typhoon strength, which confirms/supports the Likely Storm Category of Typhoon (see the summary table at the bottom of Figure 3).

3.1.2. ECEPS and GEFS Forecasts of T2F and Intensity of TS Peipah (17W)

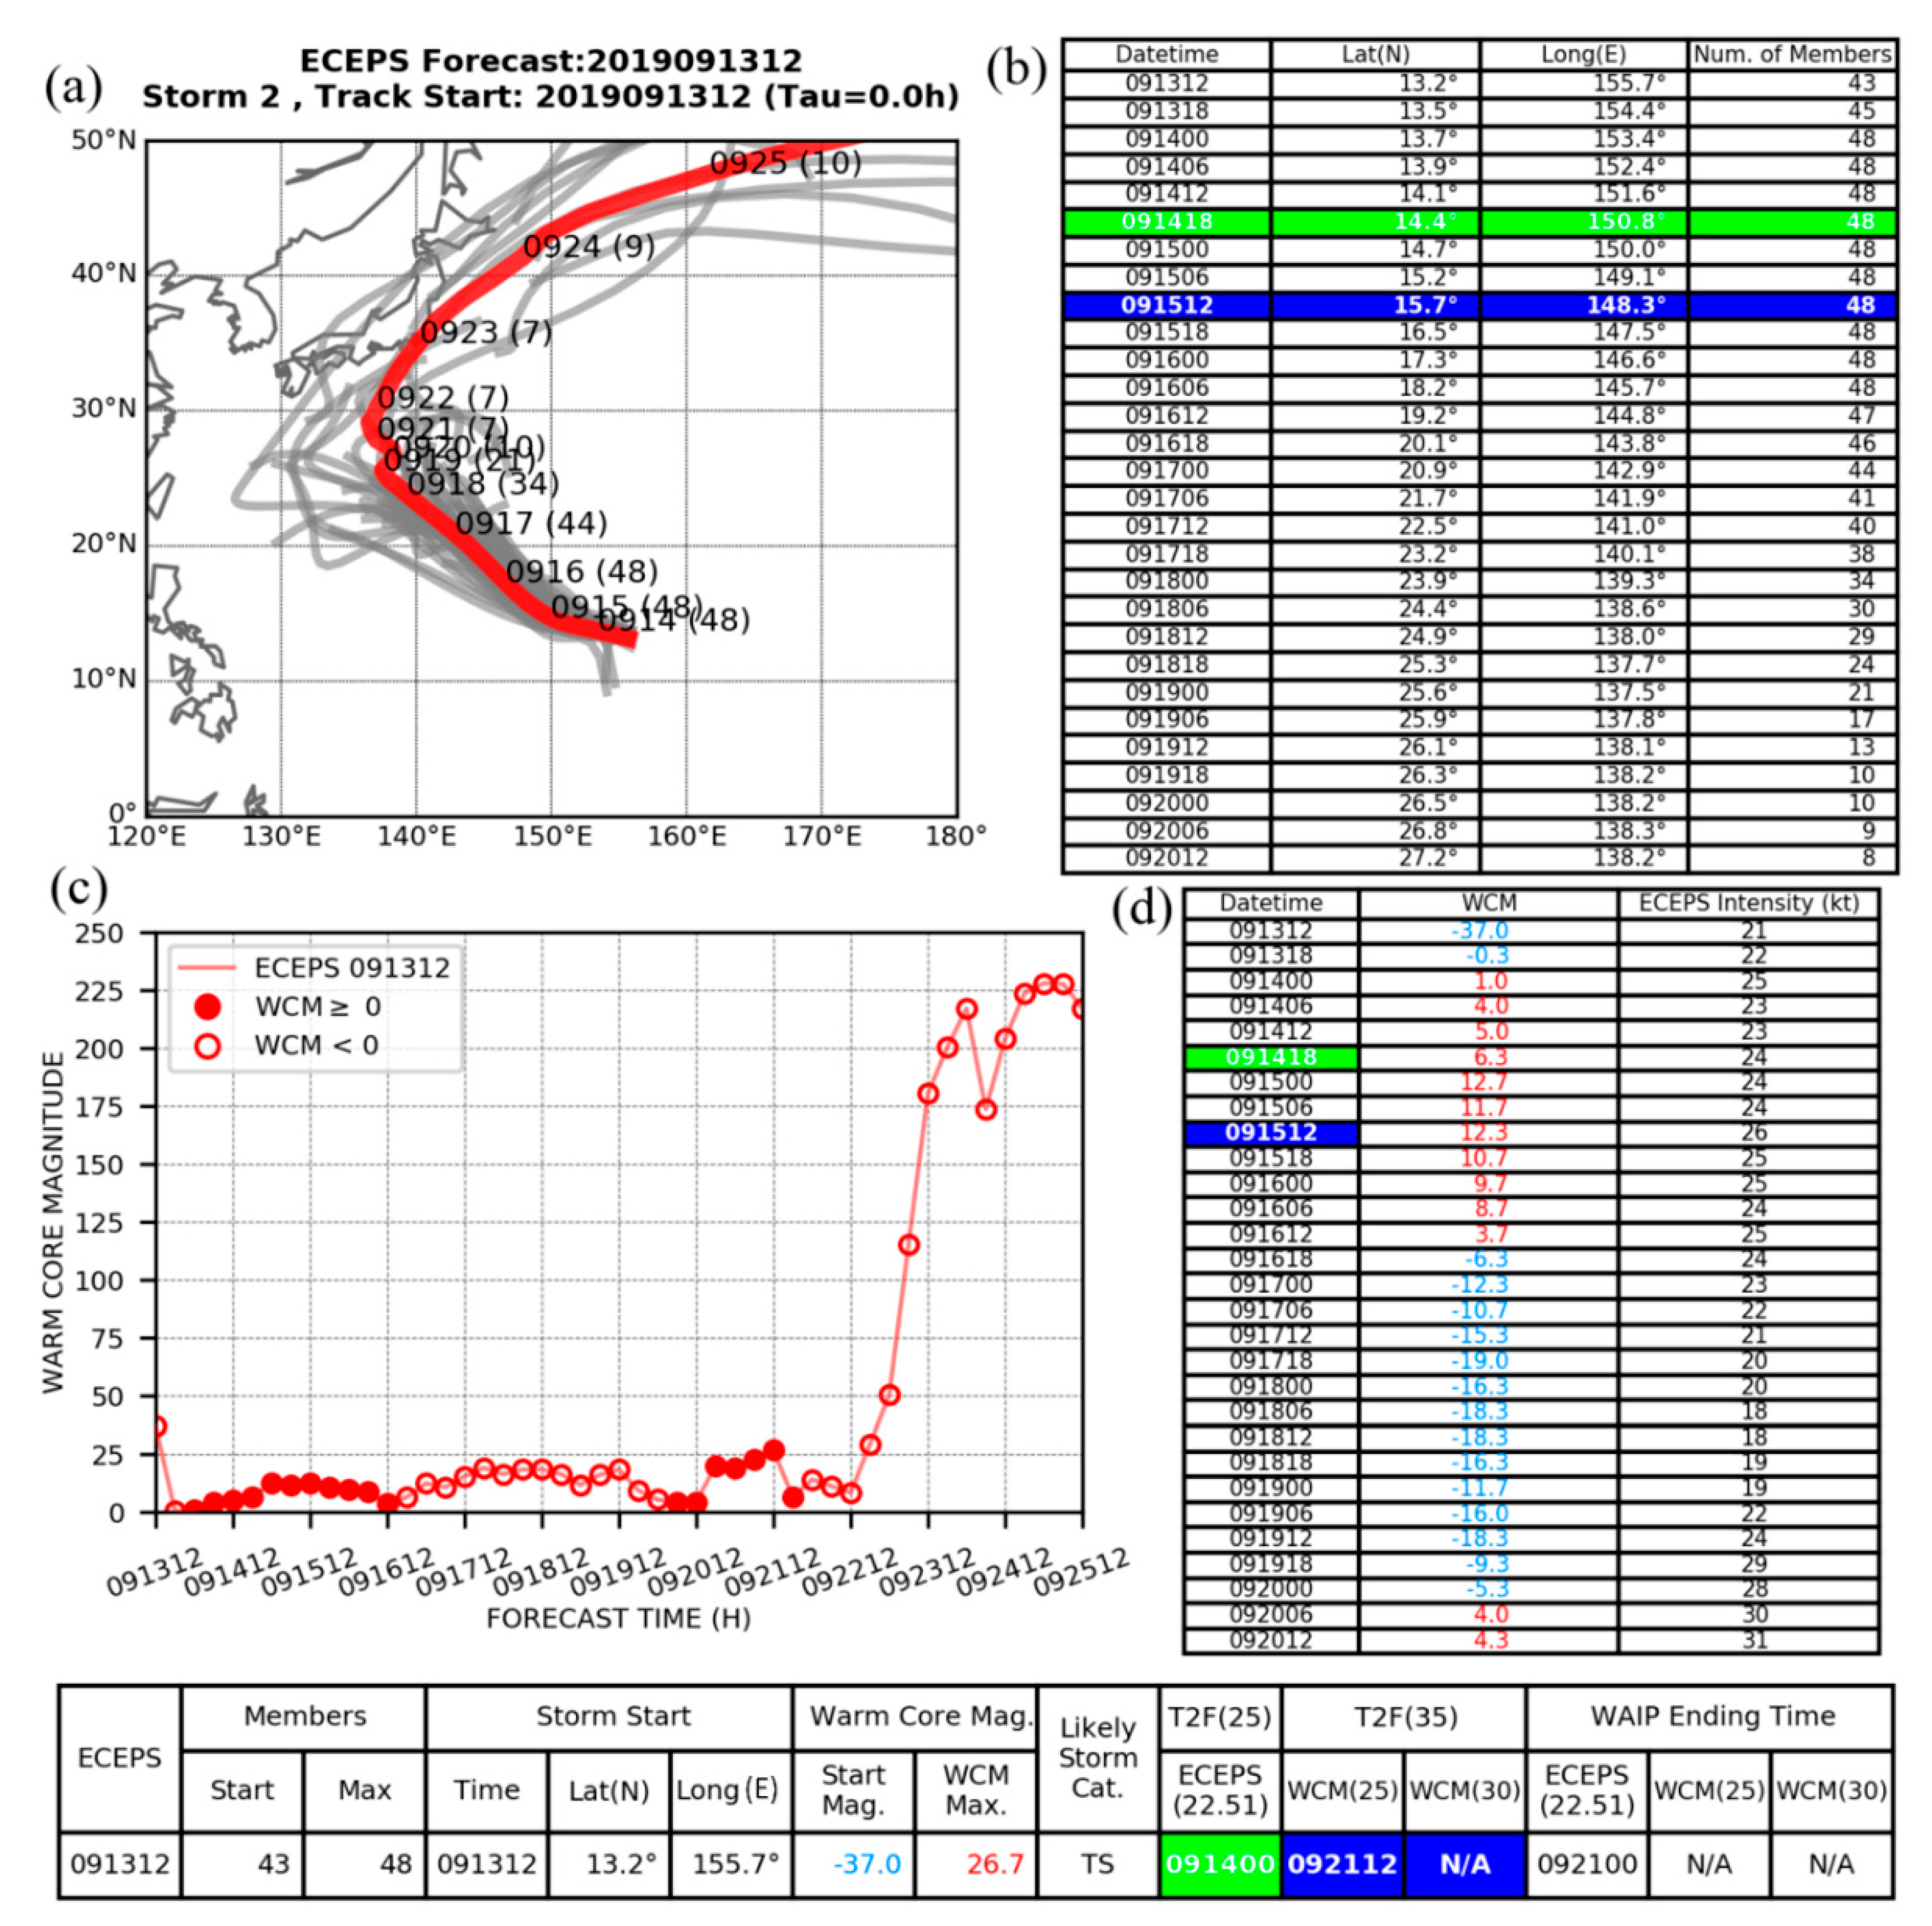
In the ECEPS forecast from 12 UTC 13 September 2015, the WMVM track forecast (Figure 5a, red line) has the pre-TS Peipah (note that the peak intensity was 35 kt) circulation in its initial conditions at 13.2° N,155.7° E, and 45 of a possible 51 members are initially included in the WMVM track (Figure 5b, line 1). The number of members increases to 48 by the verifying T2F (25) time of 091418 (Figure 5b, green boxes) and verifying T2F(35) time of 091512 (blue boxes). However, the number of members subsequently decrease rapidly such that by 092012, there are only 8 members included in the WMVM track forecast (Figure 5b, last line). While this ECEPS track forecast in the middle of September might, from climatology, seem to represent a potential typhoon, the rapid loss of members should alert the forecaster to examine inhibiting physical processes.
Note that the initial ECEPS intensity was 21 kt (Figure 5d, column 3), and the T2F(25) was achieved in 12 h (green box in summary table at bottom), which is actually early by 18 h. Although the weighted-mean intensity did increase to 26 kt at 091512, the ECEPS intensity then decreased to 18 kt at 091806, which again should alert the forecaster to examine inhibiting physical processes.
However, the weighted-mean WCM evolution in Figure 5c, and the digital values in column 2 of Figure 5d, indicate that the initial circulation in this ECEPS forecast has a cold core (negative WCM). Even though the circulation becomes a warm core within 12 h and has a maximum positive WCM value of 12.7 at 091500 (12 h before the verifying T2F(35), blue box), this magnitude does not meet even the smaller WCM = 25 threshold for a T2F(35). Although a maximum positive WCM = 26.7, which corresponds to a Likely Storm Category of TS (see columns 8 and 9 in the summary table at the bottom of Figure 5), is predicted much later (092112, blue box at bottom), this is not within the 7-day window to make a WAIP intensity forecast.
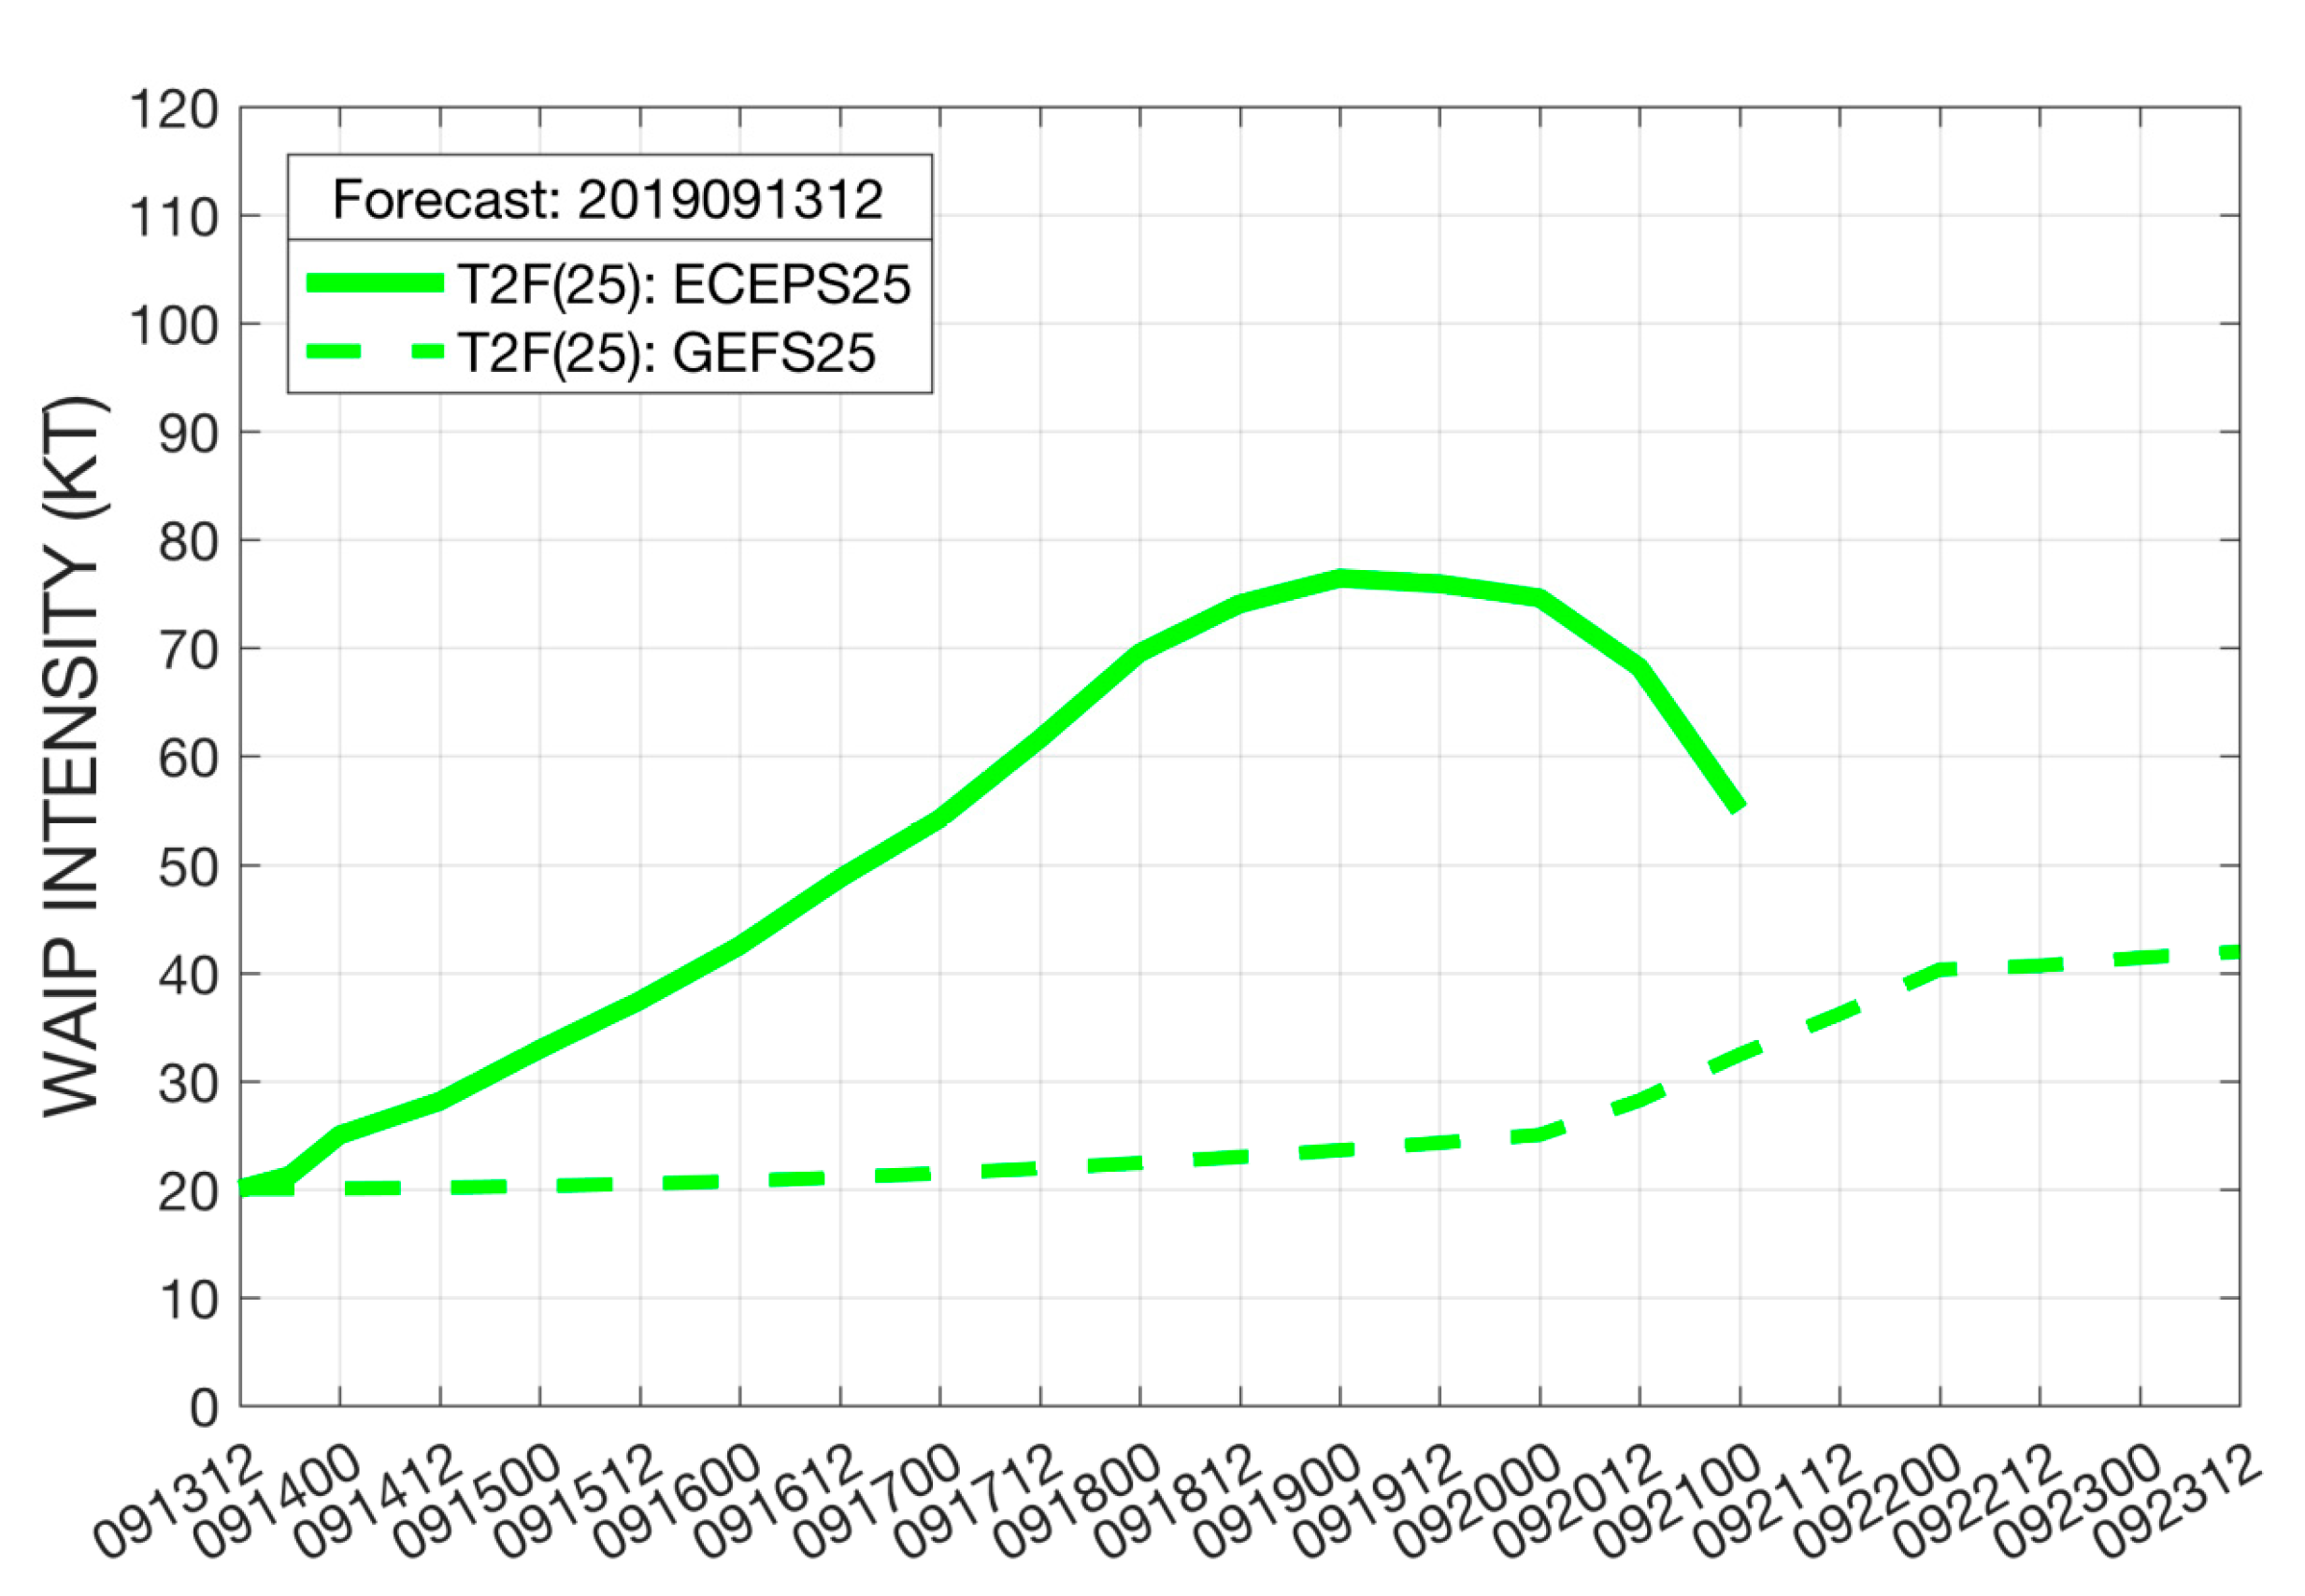
Consequently, the only WAIP intensity forecast is for the T2F(25) time, and then the WAIP Ending Time is 092100, which is 7 days after the T2F(25) time. The initial intensity of 20 kt is from the WBT, and the 16 analogs are selected to match that initial intensity and match the WMVM track in Figure 5a between 00 UTC 14 September and 00 UTC 21 September (at which time the circulation would be near the Kuroshio ocean current). Since all storms in the JTWC historical files from which the WAIP analogs are drawn have an intensity of at least 34 kt, the WAIP intensity prediction for this ECEPS forecast increases to a maximum of 75 kt (Figure 6, solid green line). In this case, it would be advisable that the forecaster disregard this WAIP prediction in view of more reliable guidance of a maximum intensity of TD based on the WCM evolution in Figure 5c.
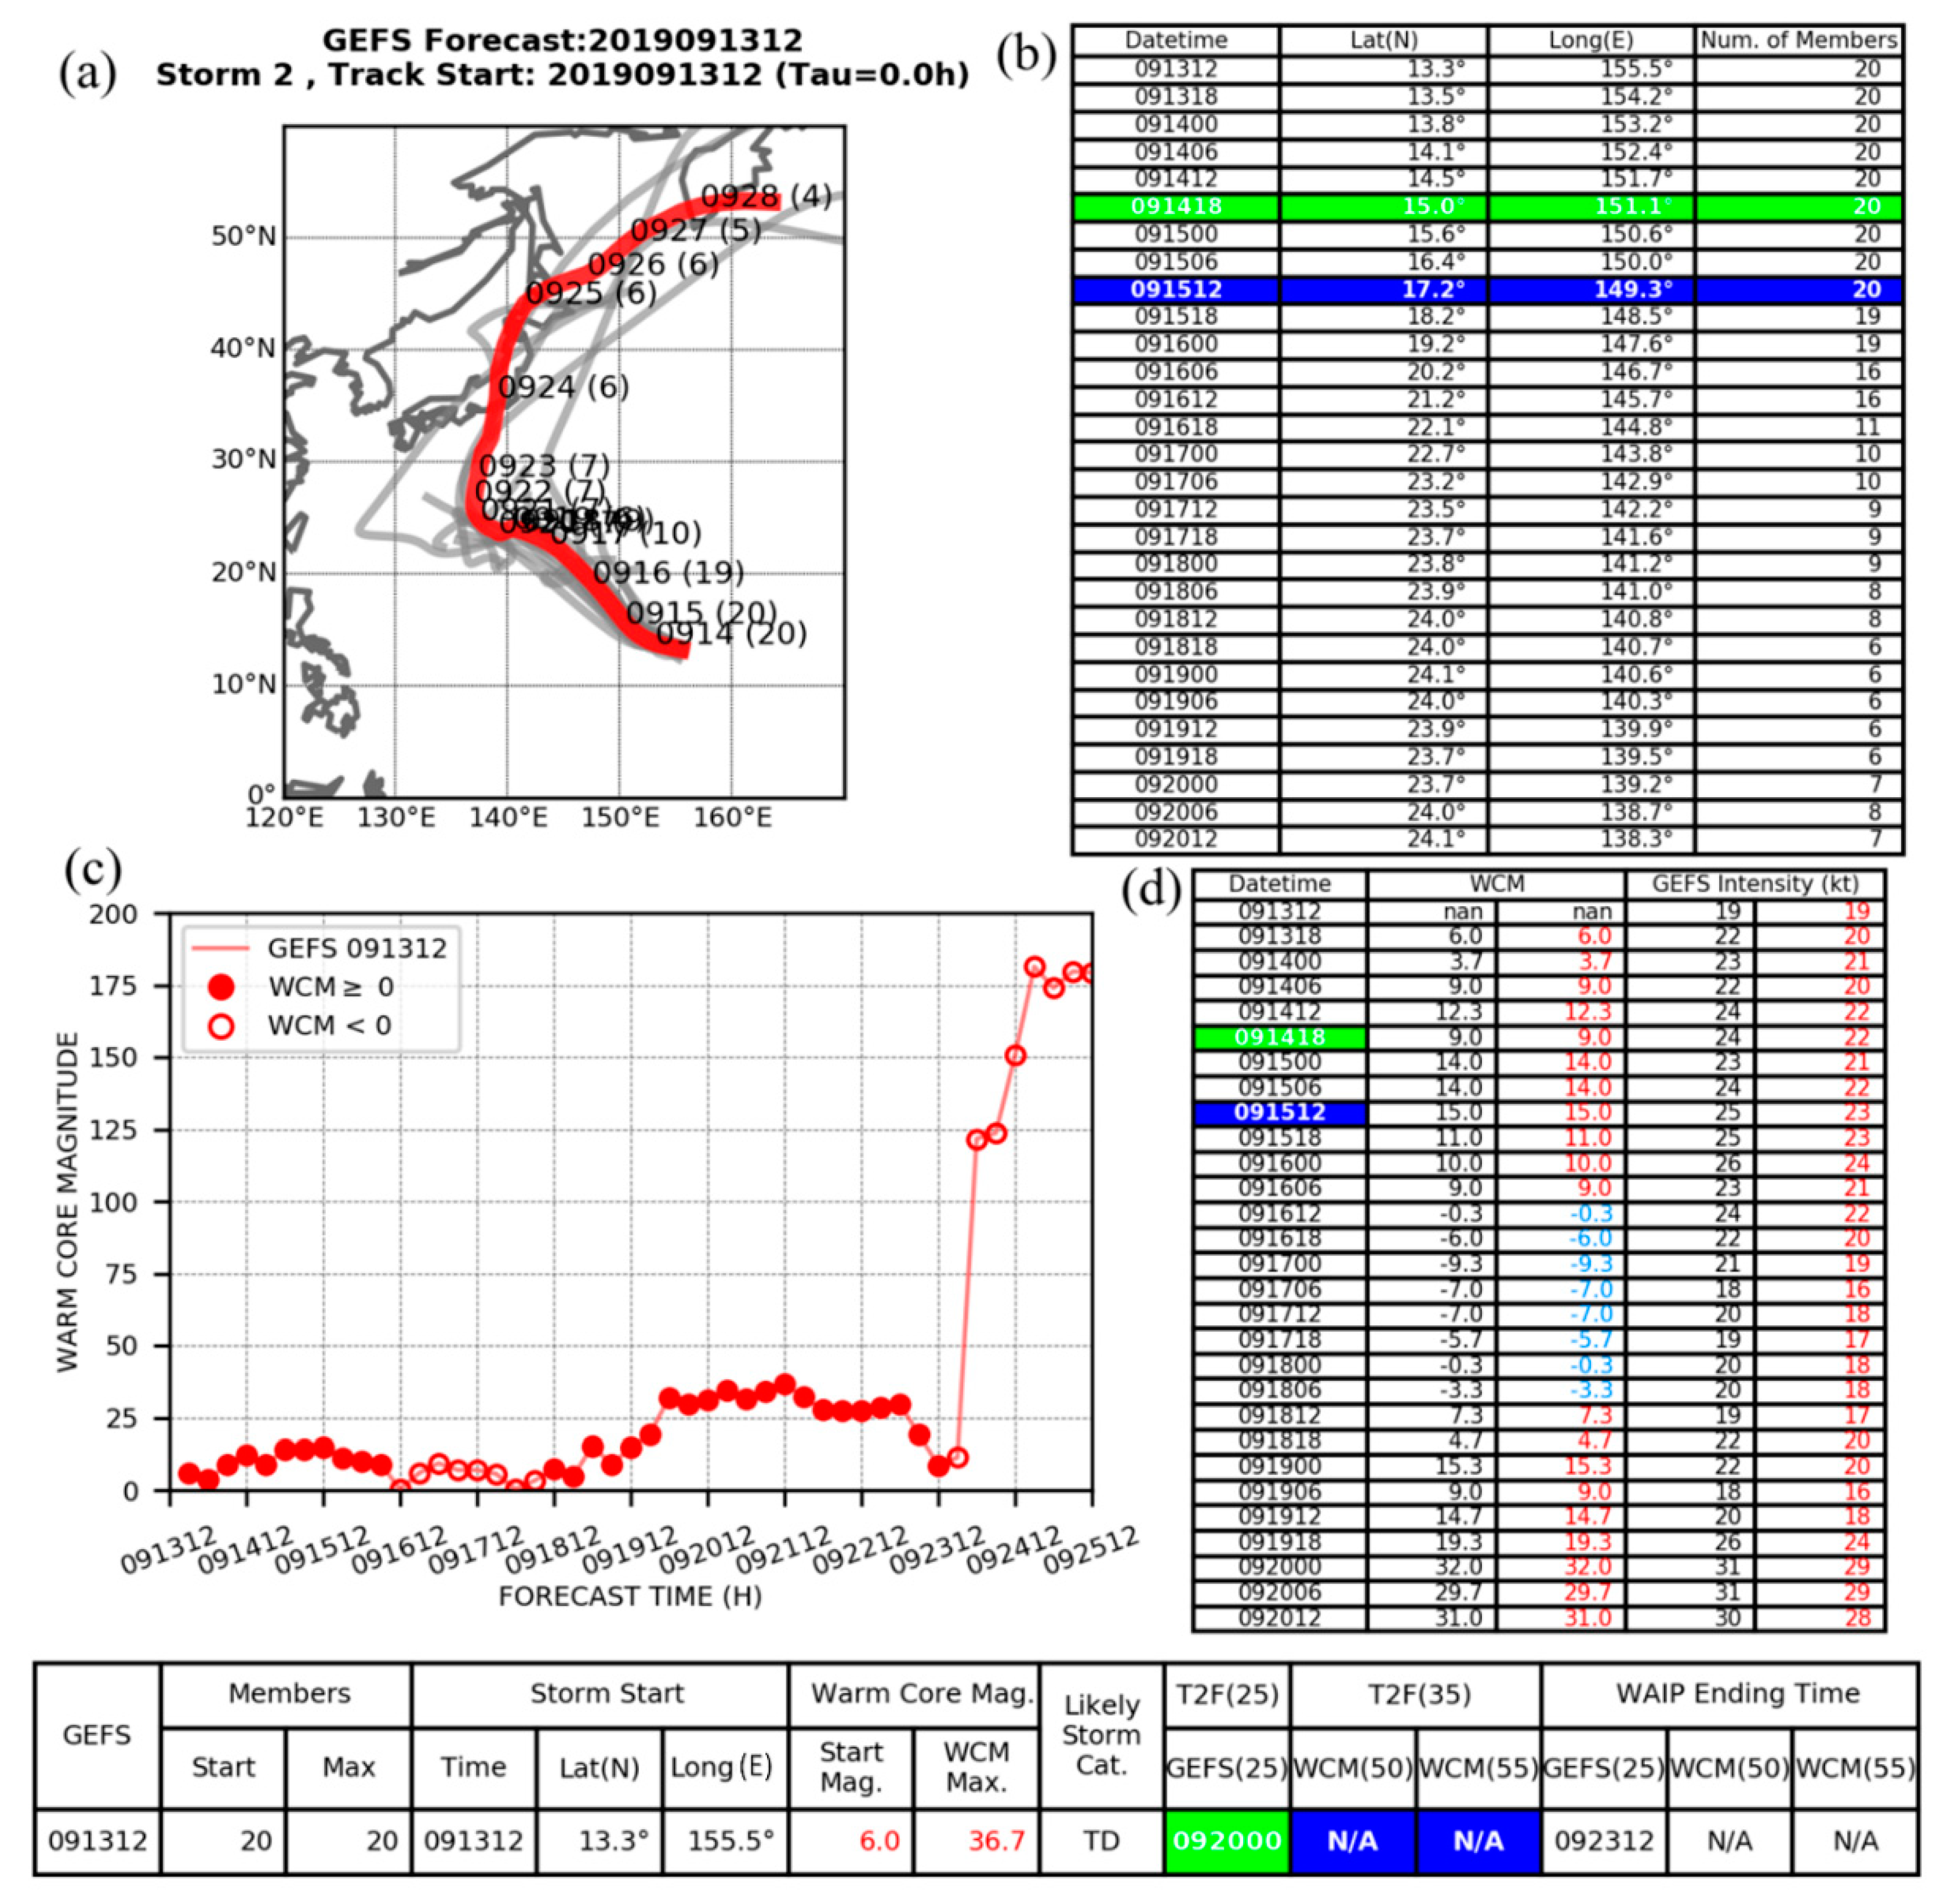
The GEFS WMVM track forecast (Figure 7a) from the same time with 20 of a possible 21 ensemble members and starts at 13.3° N, 155.5° E (Figure 7b, first line). As was the case with the ECEPS forecast, the number of ensemble members decreases, and by Day 4 (091712), is down to nine members, and the post-recurvature stage has only six widely dispersed member tracks.
The GEFS intensity at 091318 is already 22 kt (column 4, Figure 7d), which exceeds the WBT intensity of 20 kt. As explained in Section 3.1.1, the GEFS intensity evolution is then adjusted to begin with that WBT intensity (Figure 7d, column 5 in red). With that adjustment, the GEFS intensity does not meet the 25 kt threshold until 092000 (green box in the summary table at the bottom of Figure 7). This GEFS (25 kt) time coincidentally is similar to the ECEPS Ending Time, but the location is not near the Kuroshio. Rather, the GEFS achieved the 25 kt intensity at 23.7° N, 139.2° E (Line 3 from the bottom in Figure 7b), which is shortly before the pre-TS Peipah circulation track turned poleward (Figure 7a).
As explained in Section 2, the combined WAIP Ending Time for a recurving TC is the time of the last positive WCM, which is at 092312 (Figure 7c). With an initial time and position determined from the T2F(25) and an initial intensity of 25 kt, the WAIP intensity technique searches for analogs that have tracks that match the WMVM track forecast from the T2F(25) position to the last positive WCM position (a total of 3.5 days), and also have initial intensities that closely match the initial intensity (25 kt). This combined WAIP intensity prediction for this GEFS forecast of pre-TS Peipah from 12 UTC 13 September is given in Figure 6 (dashed line). The WAIP intensity begins at the WBT intensity of 20 kt and is equal to 25 kt at the T2F(25) time, and then the TS intensity of 35 kt is predicted to be at 092112. This GEFS-based WAIP intensity evolution is very different from the ECEPS-based intensities because the WAIP analog selection depends so strongly on the track forecast following the T2F.
Even the early T2F(35) based on the WCM 50 threshold is not achieved for this GEFS forecast (see Figure 7c). The initial WCM at 091318 is +6.0 and the maximum positive WCM is only 15.0 at the verifying T2F(35) time of 091512 (Figure 7d, column 3, red values). The pre-TS Peipah circulation in this GEFS forecast actually becomes cold core (blue values) before becoming warm core again. A later maximum WCM value of 36.7 still corresponds to a Likely Storm Category of TD.
In summary, the WCM evolutions predicted by the ECEPS and the GEFS both indicate that the pre-TS Peipah circulation would likely not become a Tropical Storm, and there were actually only two times in the JTWC WBT that the intensity reached 35 kt (not shown). Given the track forecasts, and that Peipah occurred in the middle of September, it is a noteworthy achievement that the WCM-T2F technique can predict the limited development of this pre-TC circulation.

3.1.3. ECEPS and GEFS Forecasts of T2F and Intensity of Typhoon Bualoi (22W)

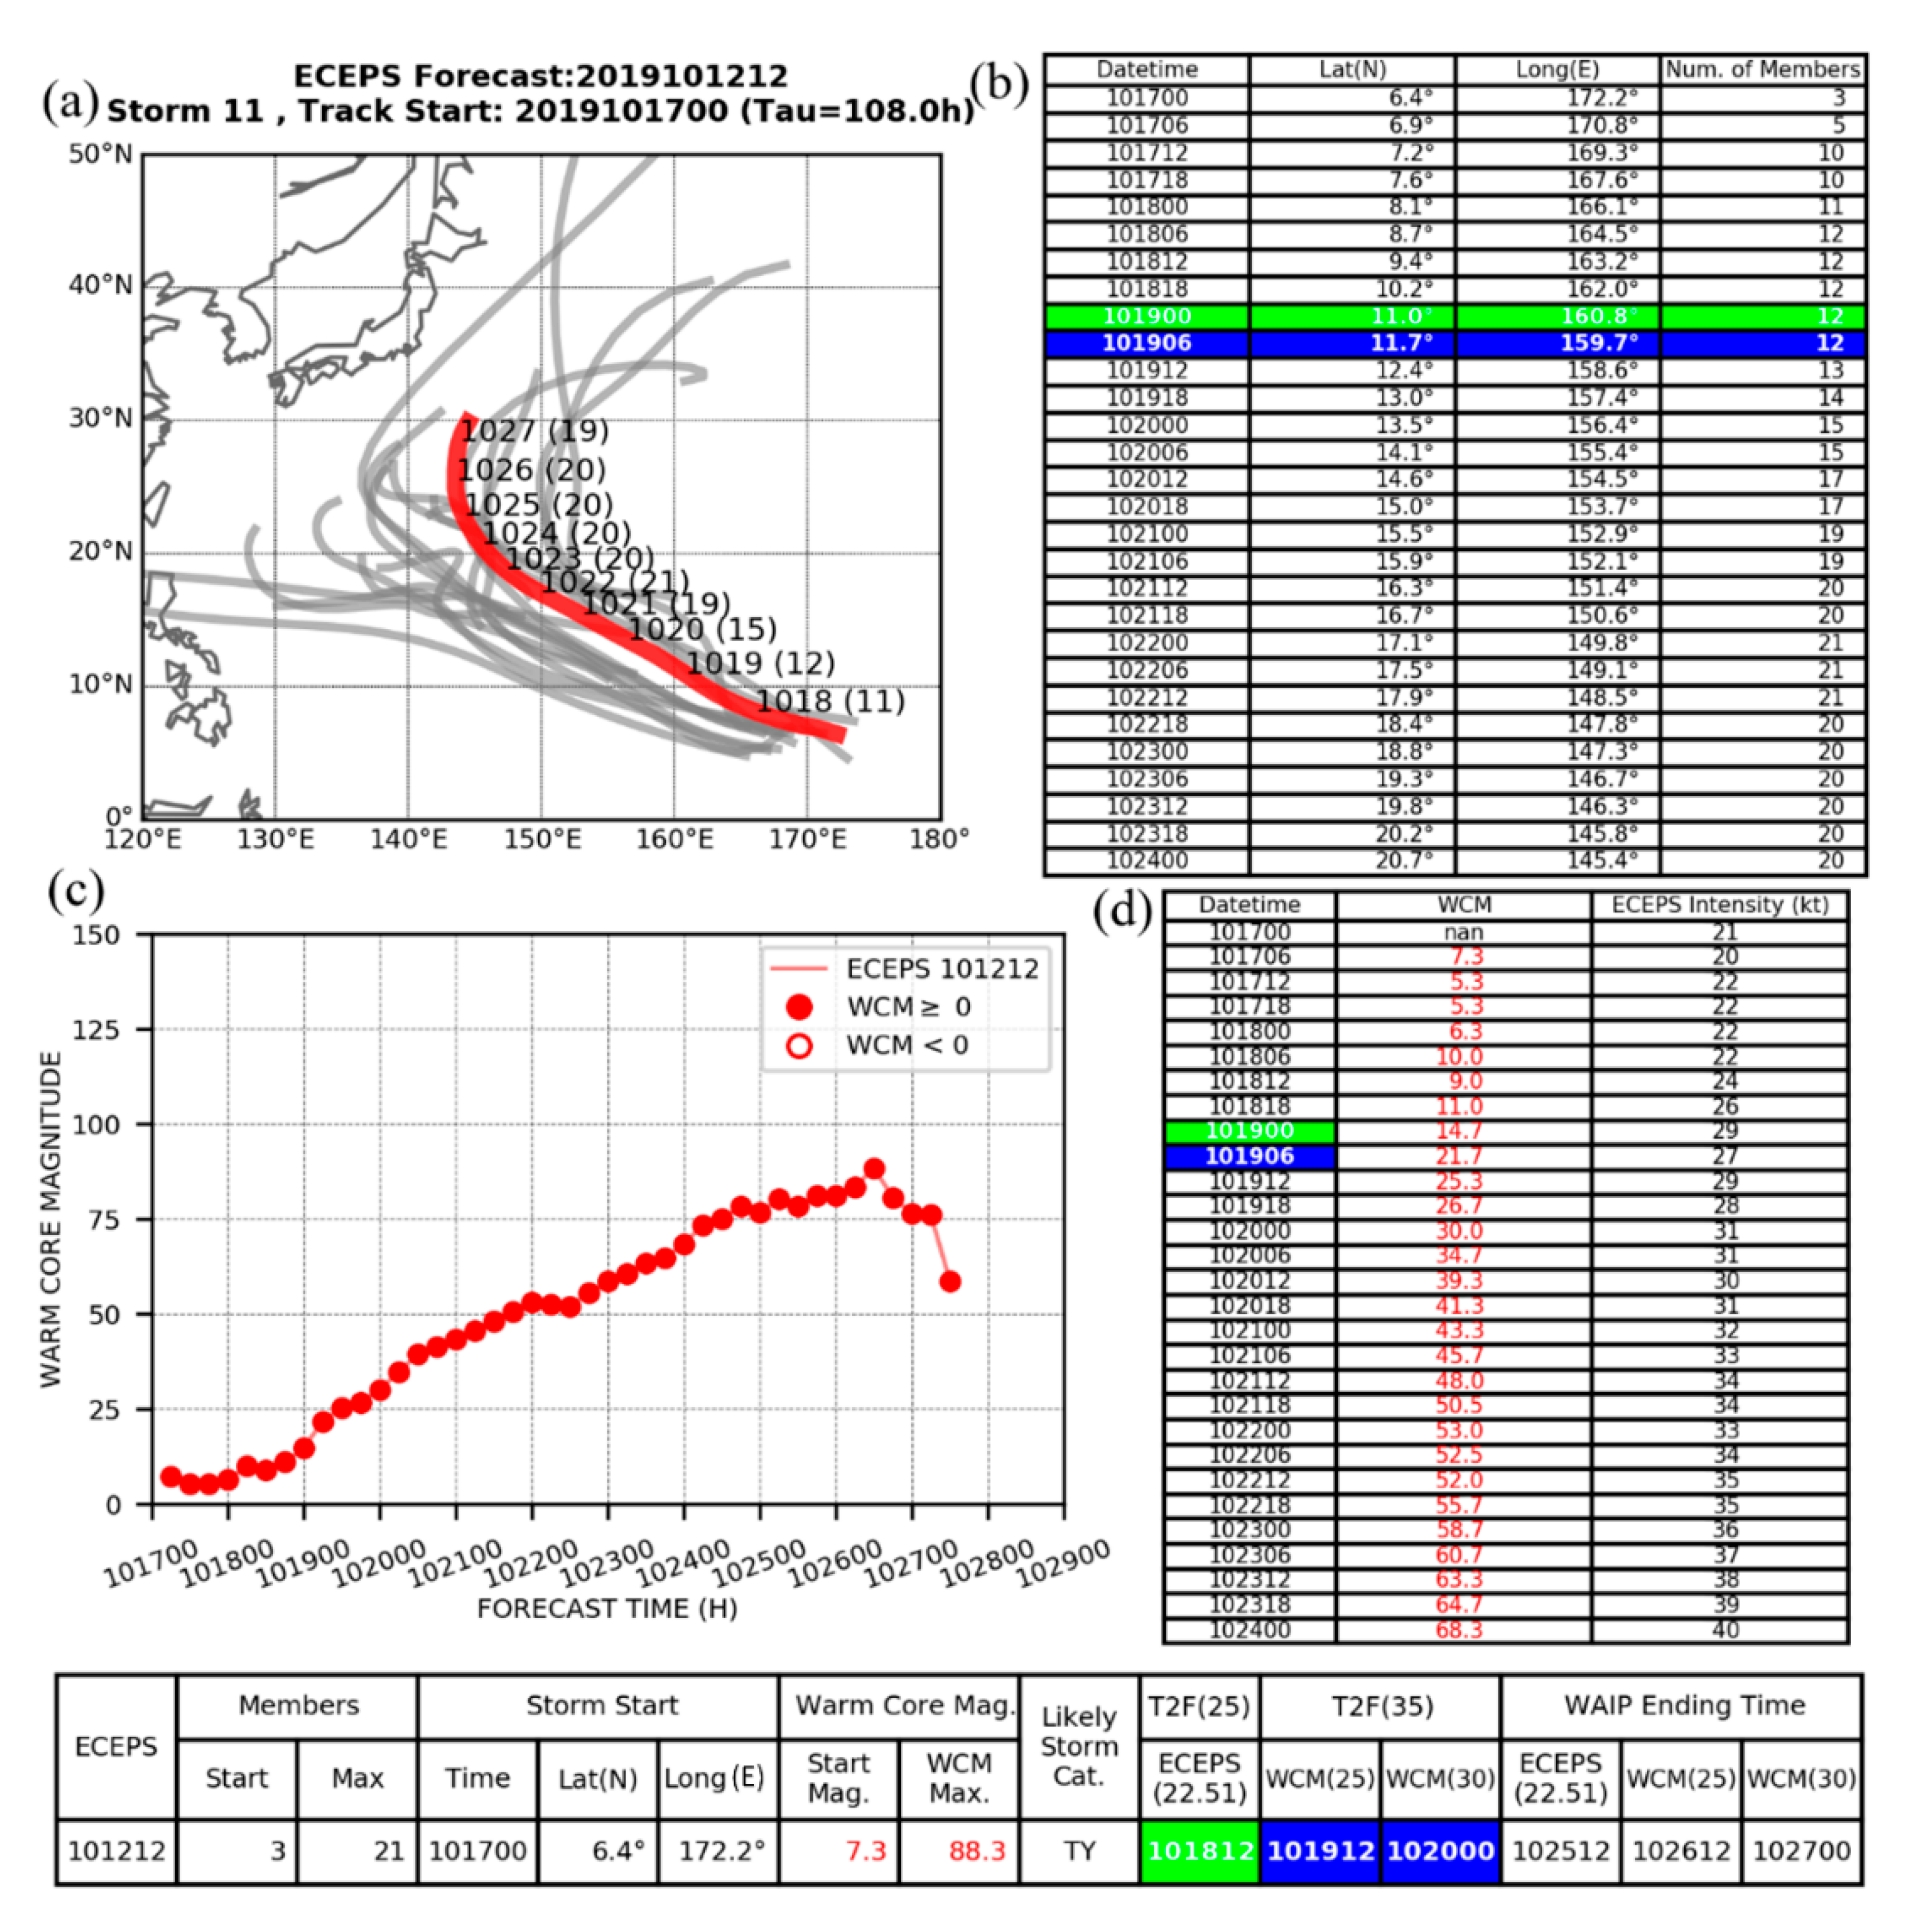
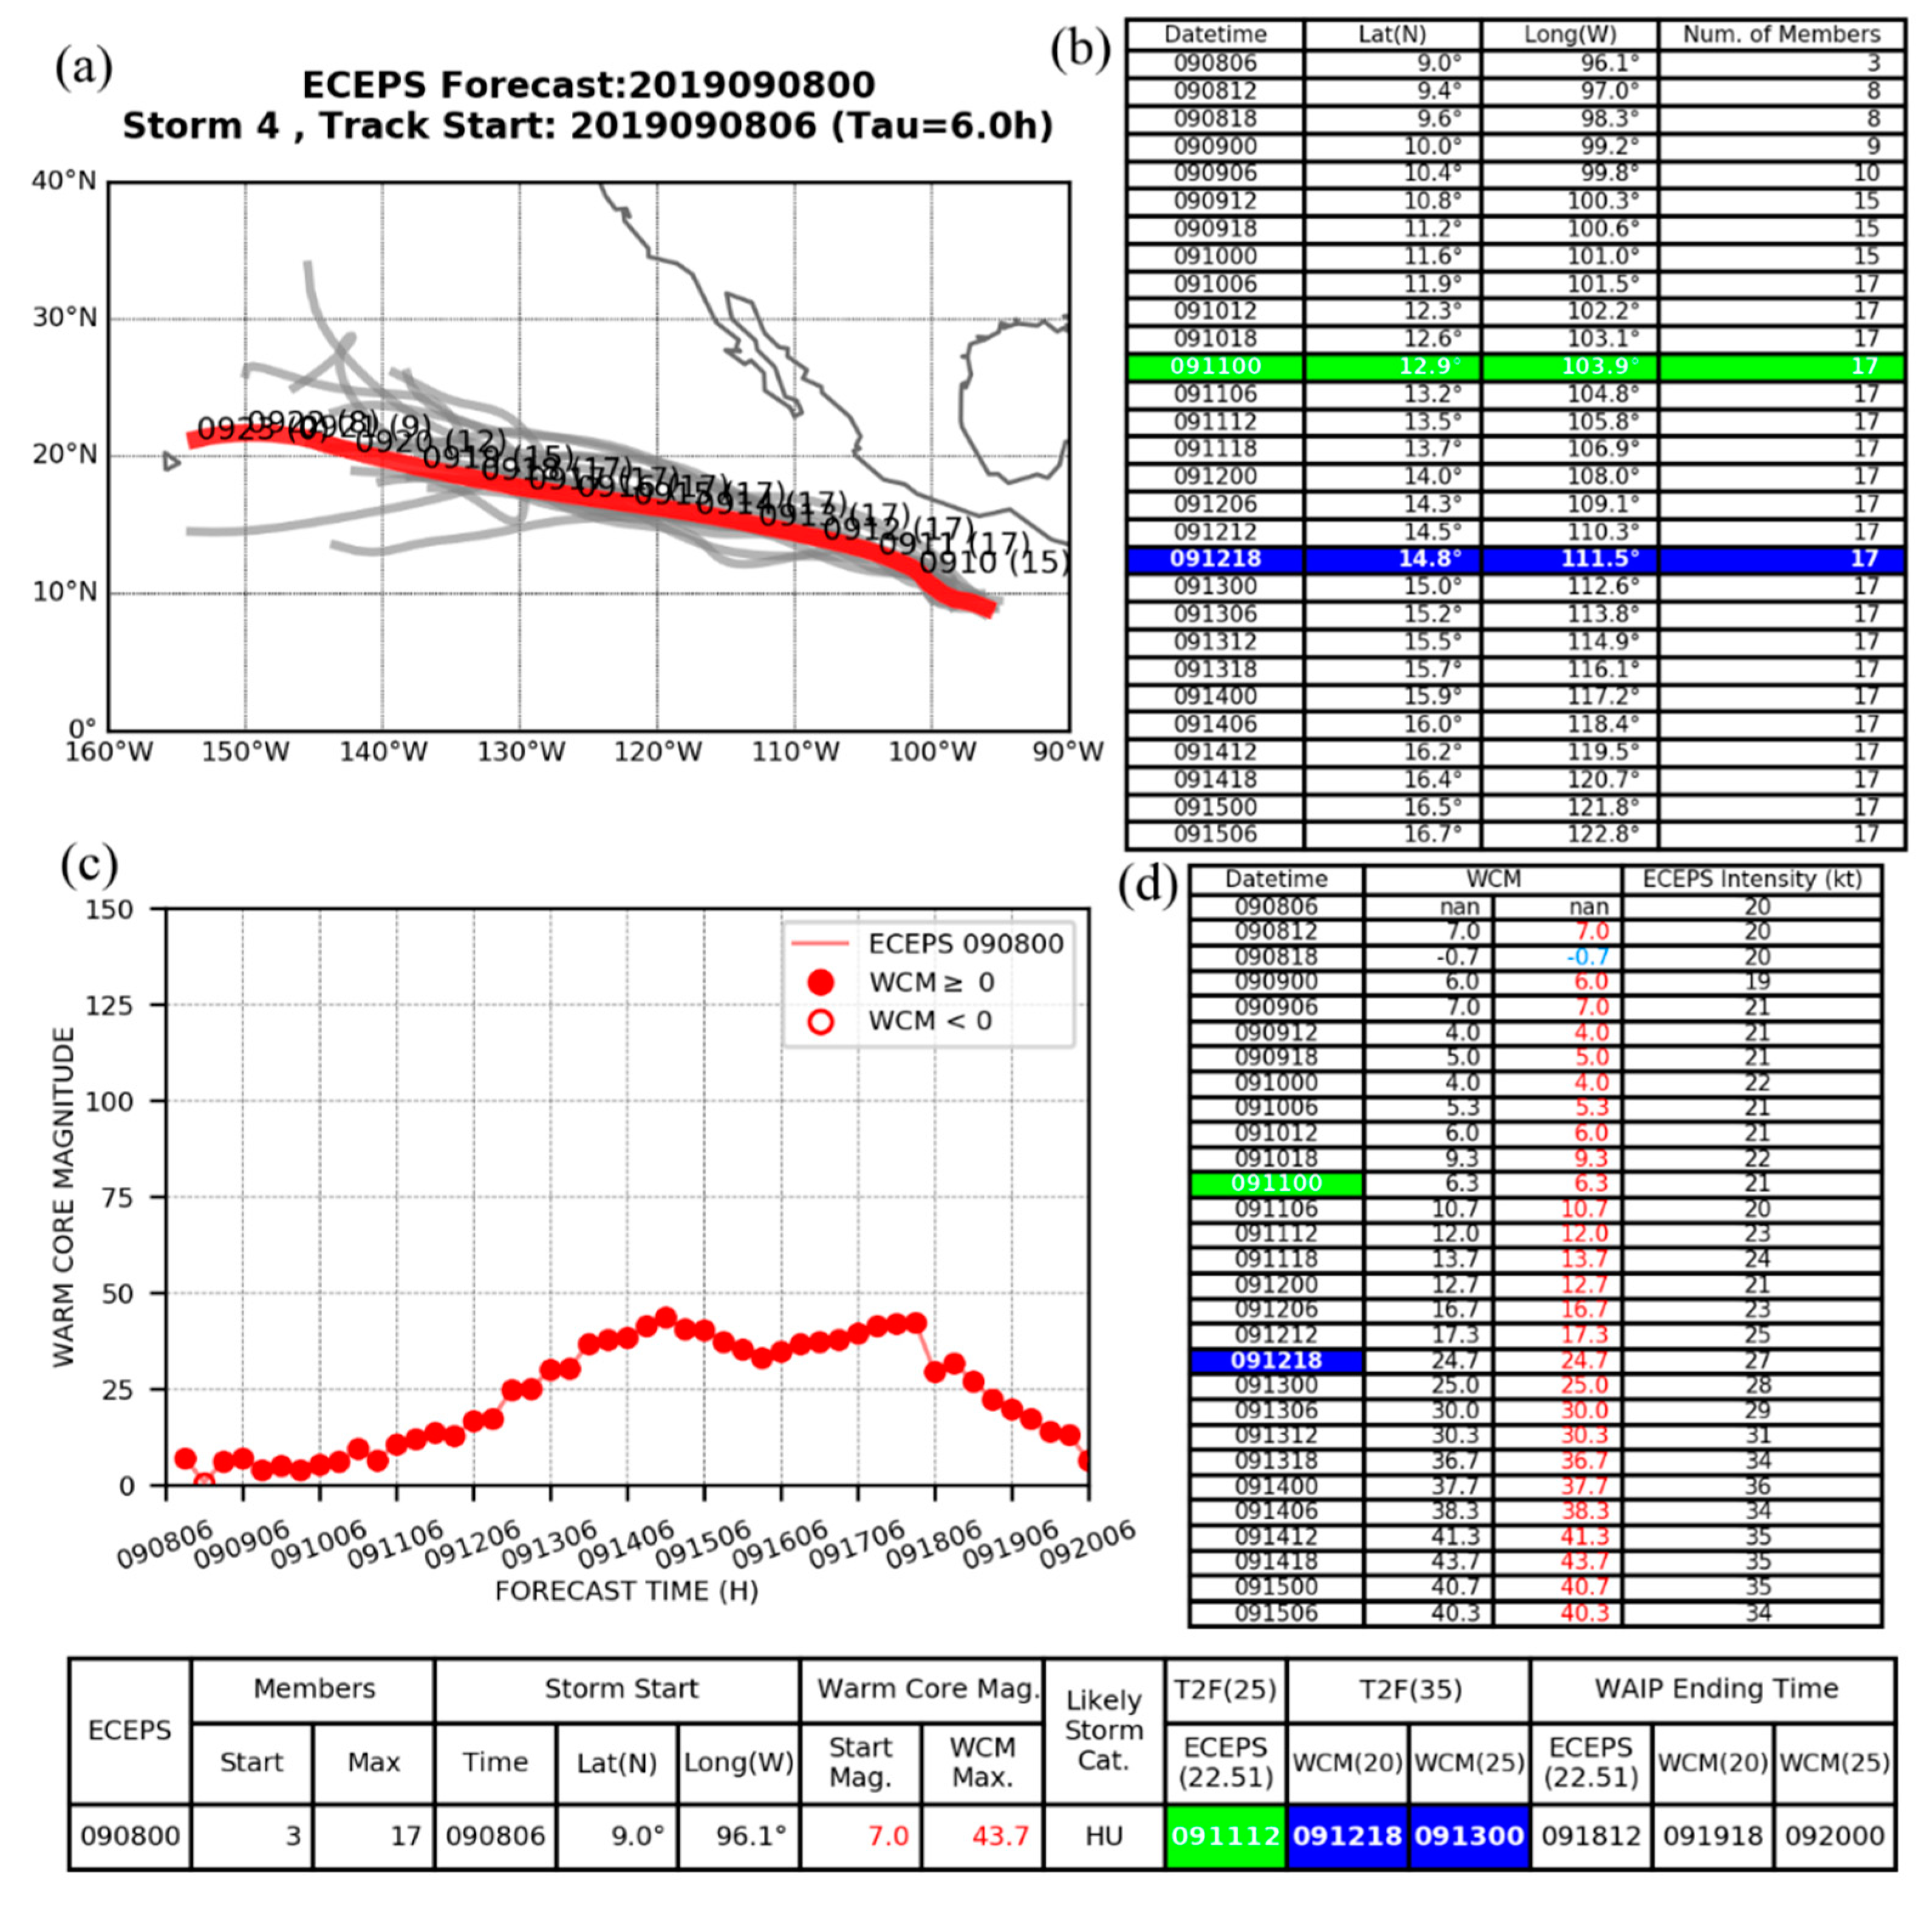
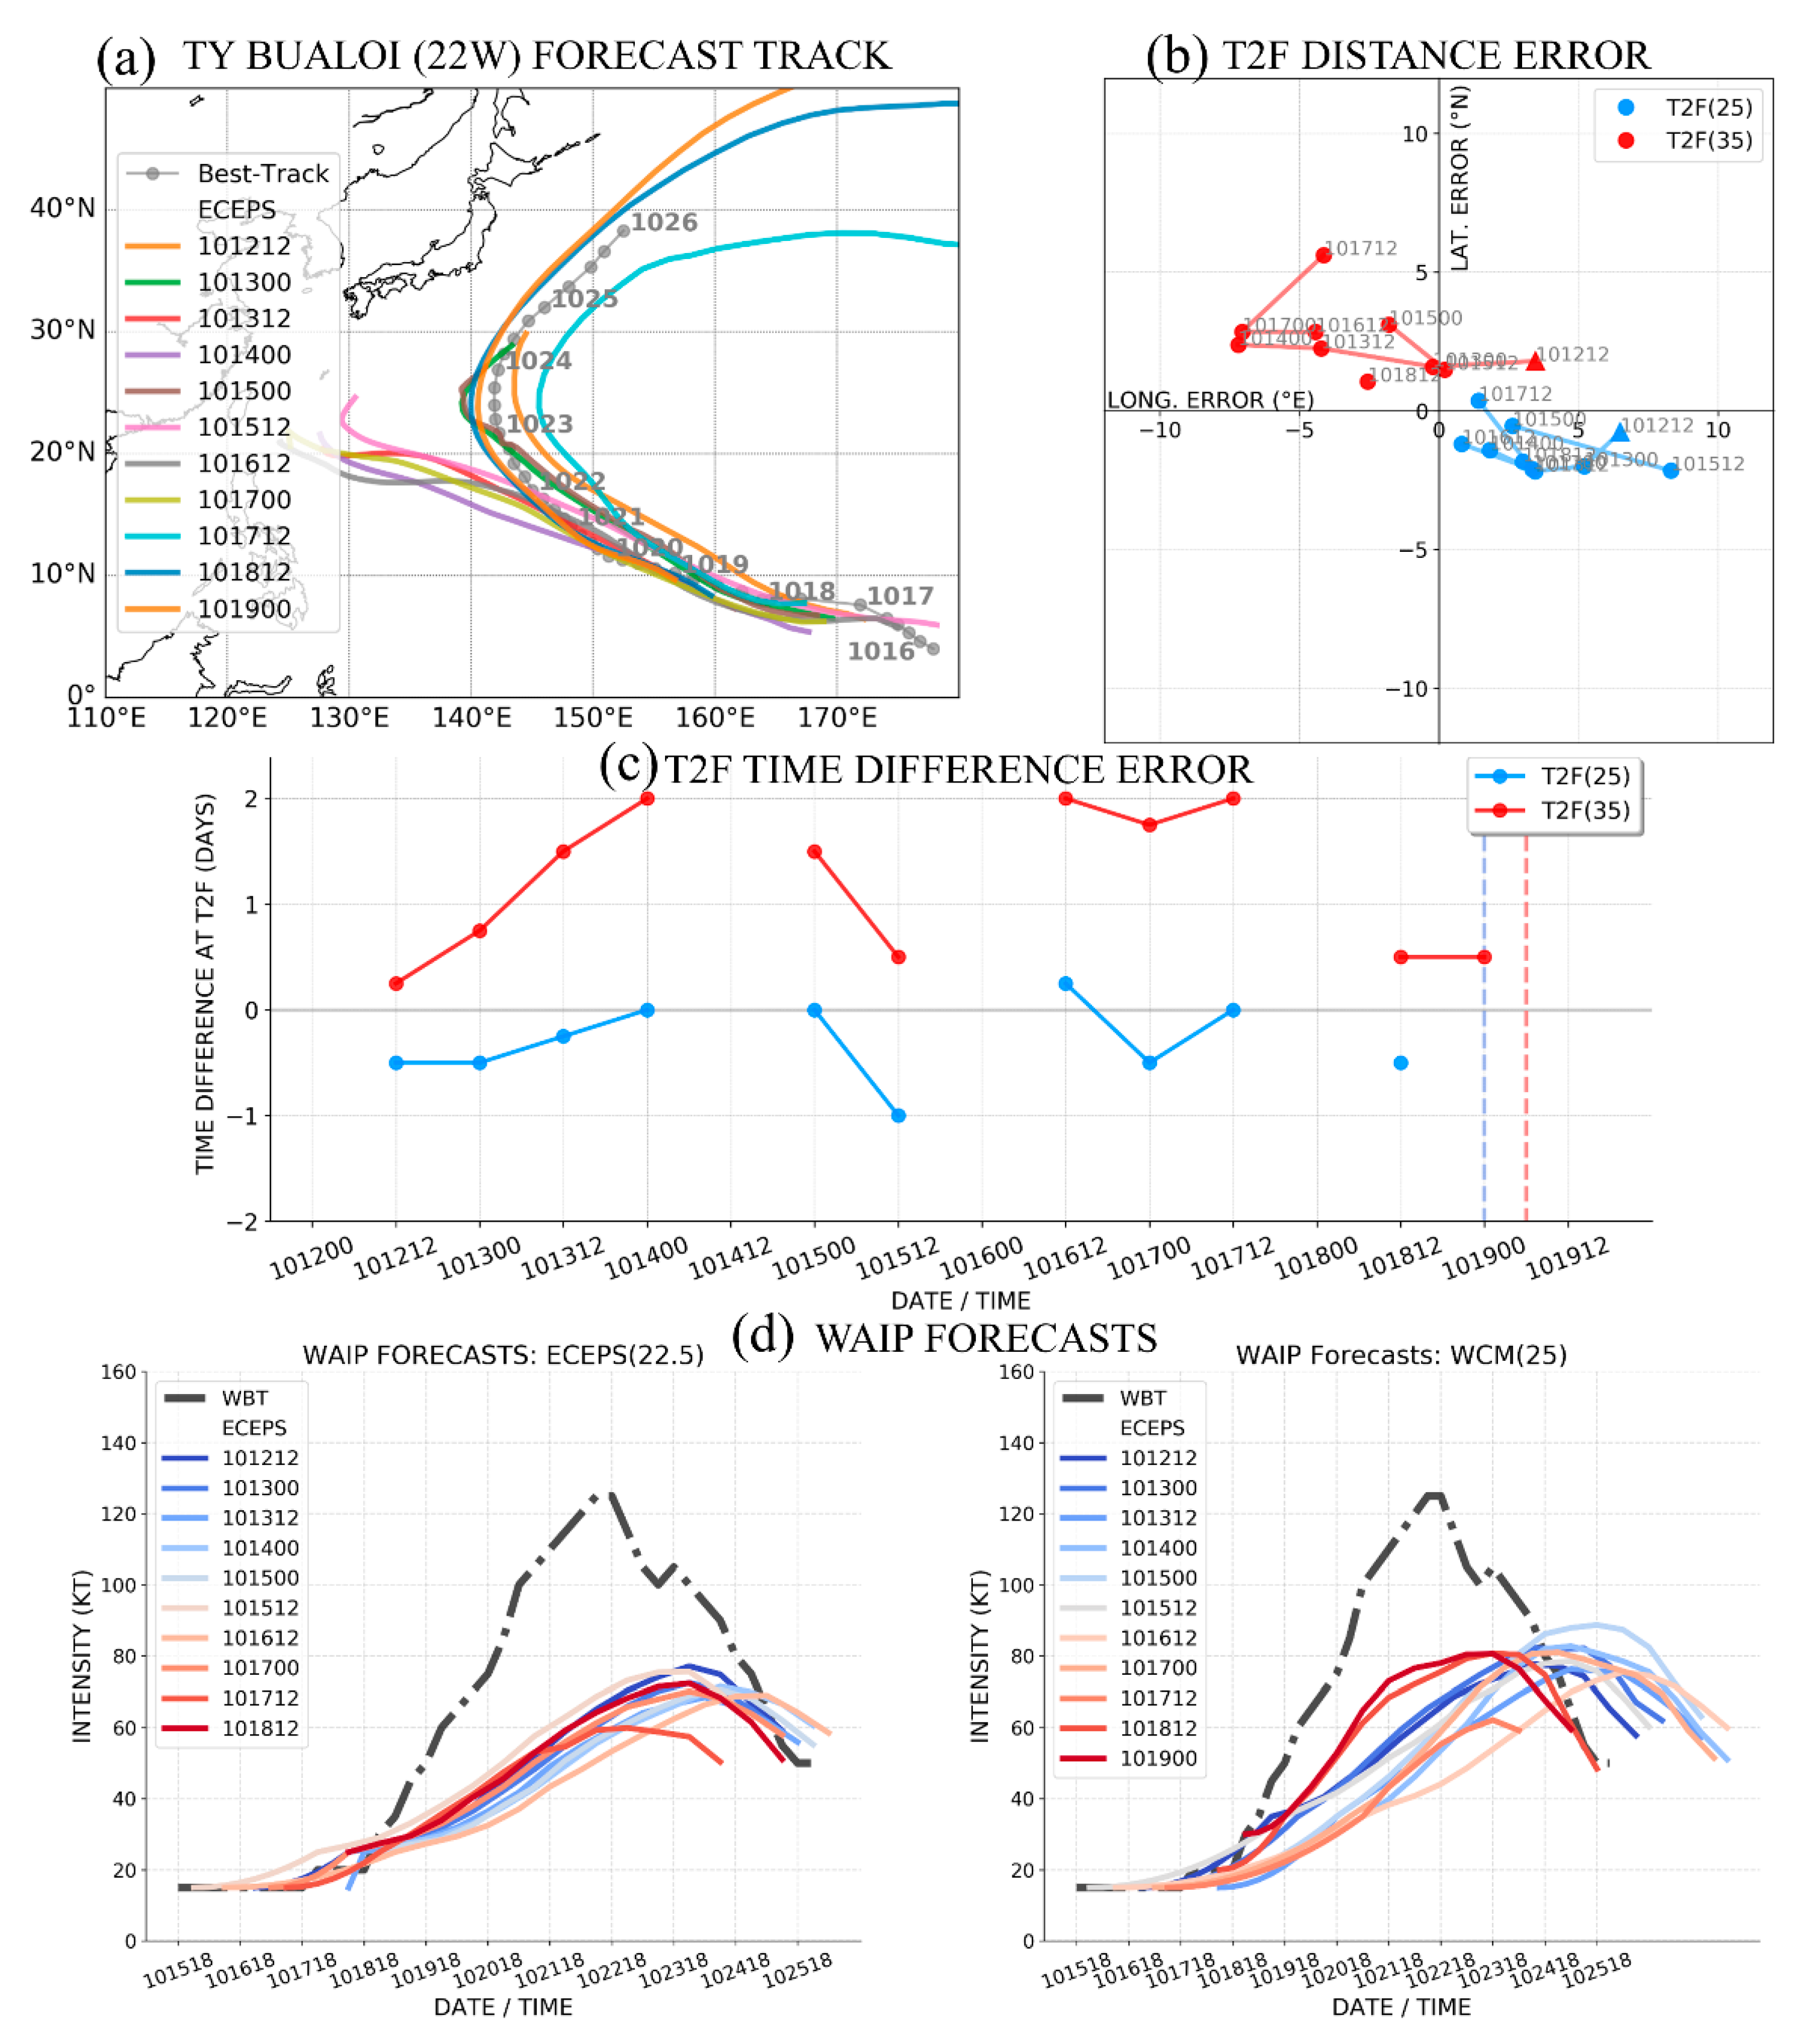
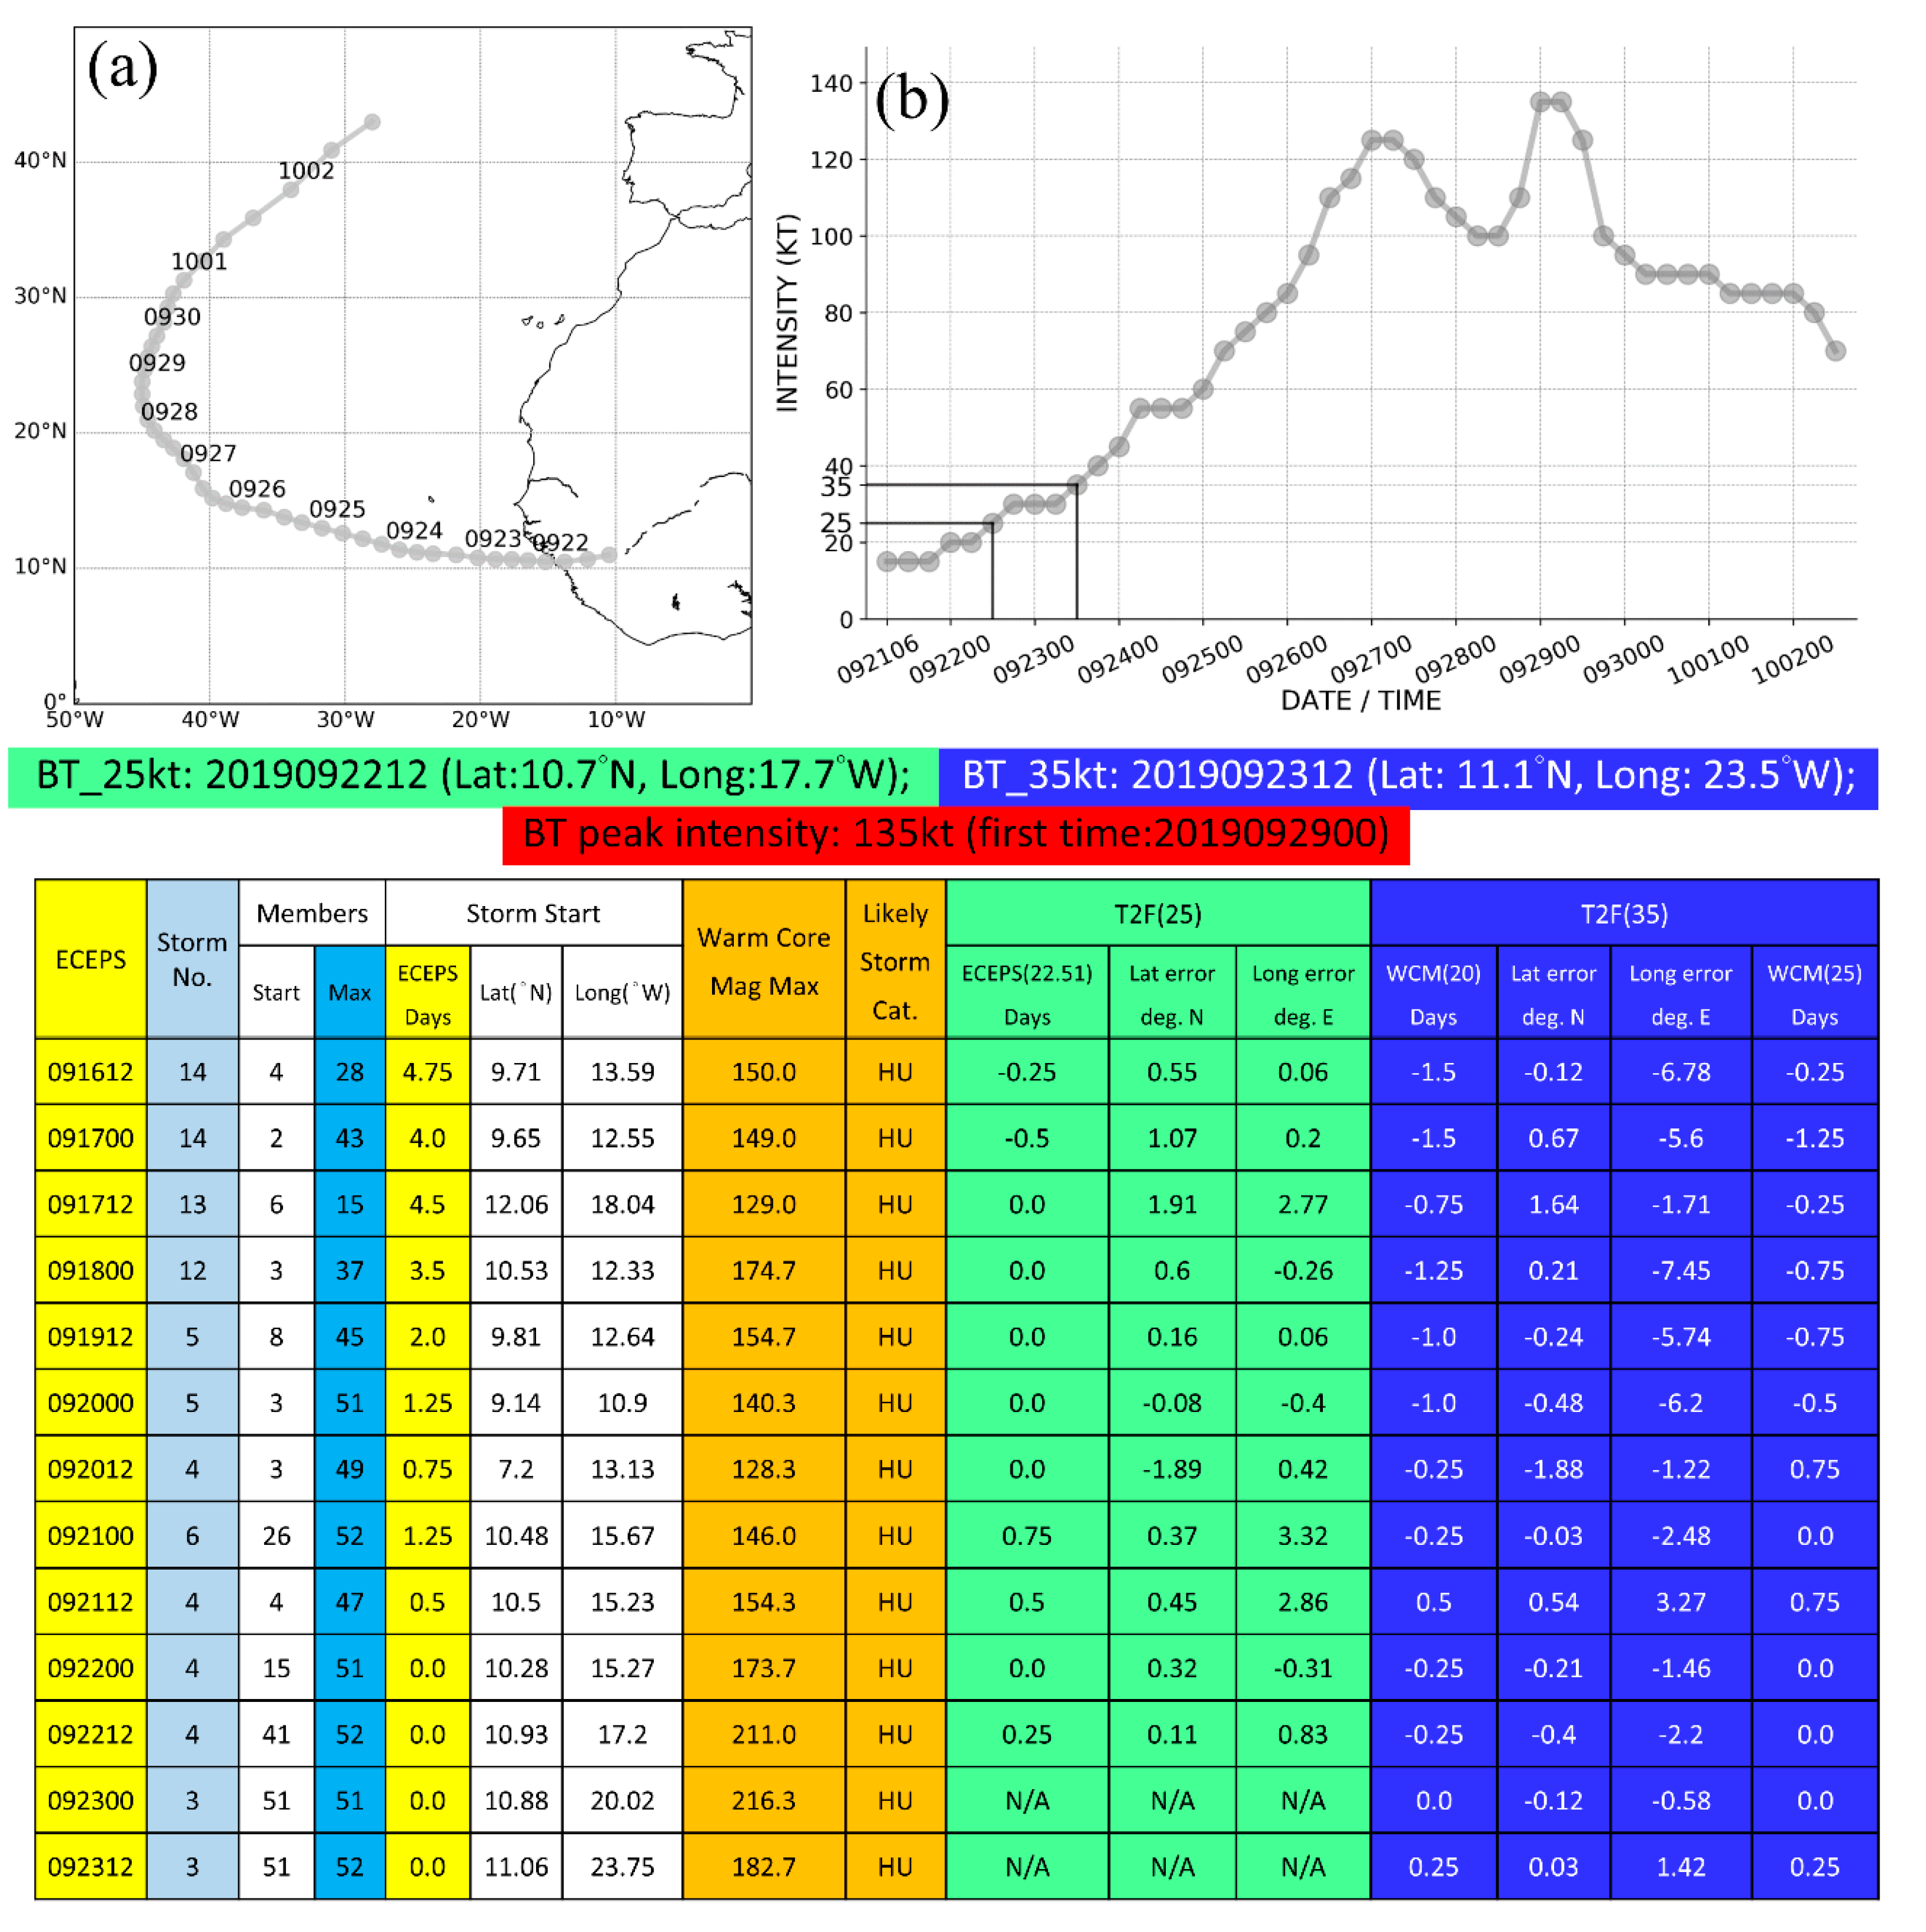
The pre-Bualoi circulation in the ECEPS forecast from 12 UTC 12 October starts at 00 UTC 17 October (Day 4.5) at 6.4° N, 172.2° E, with only 3 ensemble members (Figure 8b, first line). Just 12 h later, 7 more members have joined, and the position is about 3° latitude to the west. Because this cluster of new members begins even farther to the west between 165° E and 168° E (Figure 8a), this is a track bifurcation situation with a large track spread about the WMVM solution (red line), which is predicting a recurvature near 26° N, 144° E on 27 October (Day 15 of the ECEPS) (as described in Section 4.2, TY Bualoi did recurve near 25° N, 142° E, but ~2.5 days earlier). Note that the cluster of tracks farther to the south would later have tracks ranging from a westward passage over the Philippines to a recurvature well to the southwest of the actual recurvature location. Thus, the T2F time and position along the WMVM is a challenge with a large impact. The verifying T2F(25) and T2F(35) times are 101900 (Day 6.5) and 101906 (Day 6.75), as indicated by the green box and the blue box in column 1 of Figure 8b, and the associated WMVM positions are 11.0° N, 160.8° E and 11.7° N, 159.7° E.
Even though the initial WCM at 101706 was only 7.3, the ECEPS weighted-mean intensity of 5 ensemble members was already 20 kt (column 3, Figure 8d). Nevertheless, it was another 30 h (101812) before the T2F(25) threshold intensity was achieved (green box in the summary table at the bottom of Figure 8), which was just 12 h early. The ECEPS-predicted WCM evolution in Figure 8c also indicates an early amplification of the warm core in this pre-Bualoi circulation that is starting at a low latitude. The two WCM thresholds of 25 and 30 for the T2F(35) are surpassed at 101912 and 102000, respectively (blue boxes in the summary table at the bottom of Figure 8). The continued WCM increase to a maximum WCM of 88.3 indicates that the Likely Storm Category will be a typhoon (bottom table). Thus, the ECEPS forecast is predicting that a TS will exist on Day 7–Day 7.5 near 13° N, 157° E and become a typhoon that will recurve near 26° N, 144° E on Day 14, which was a very accurate track prediction.
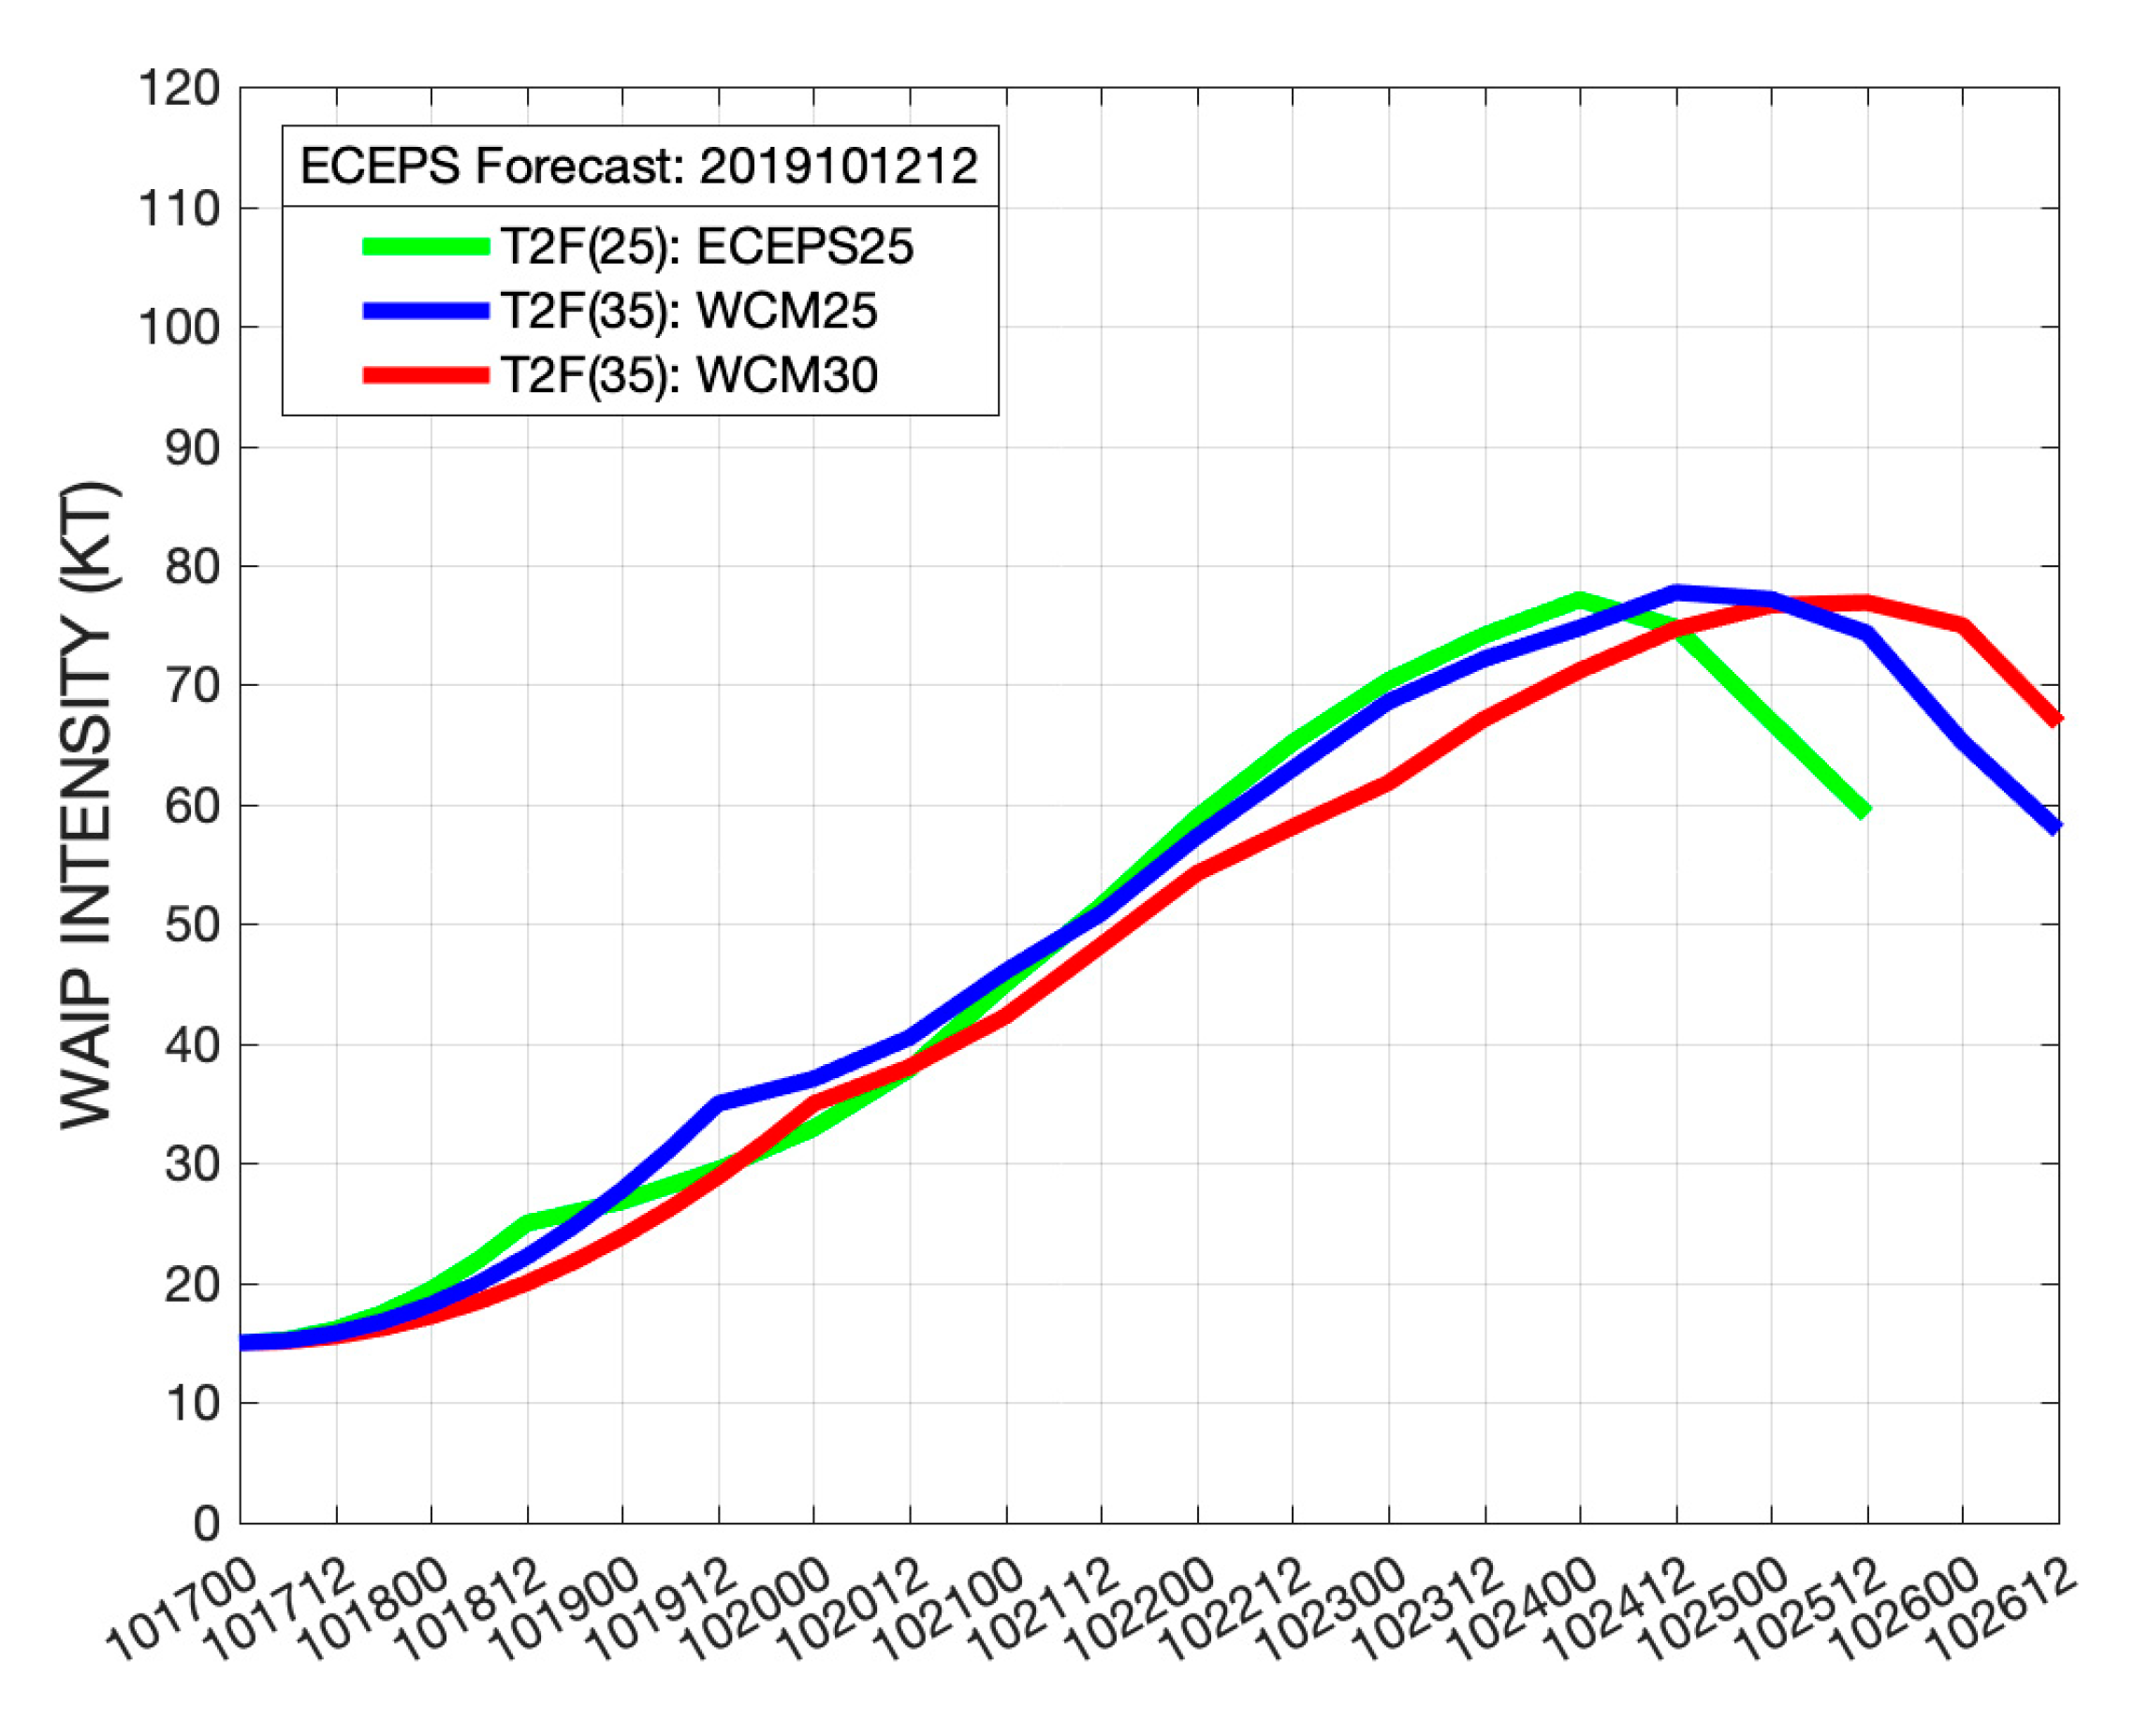
With no Ending Storm constraint within the 7 days after the three T2Fs, the WMVM track forecast for 7 days after each T2F, and assuming an initial intensity of 15 kt, the WAIP intensity forecasts are shown in Figure 9. Because the WAIP forecast based on T2F(25, green curve) reaches 35 kt at the same time as the later T2F(35, red curve), which is only 12 h after the early T2F(35, blue curve), these three WAIP intensity forecasts are almost identical between 35 kt and the peak intensities of 75–78 kt. Because the WBT peak intensity of TY Bualoi actually was 130 kt (not shown), it is not expected that the weighted average of 16 analog intensities as in the WAIP would be able to predict such an intense typhoon. Rather, the objective of the WAIP is to confirm/support the WCM-based Likely Storm Category of typhoon (bottom, Figure 8), which in this ECEPS forecast is occurring on ~Day 12 (recall that the pre-Bualoi circulation started on Day 4.5).
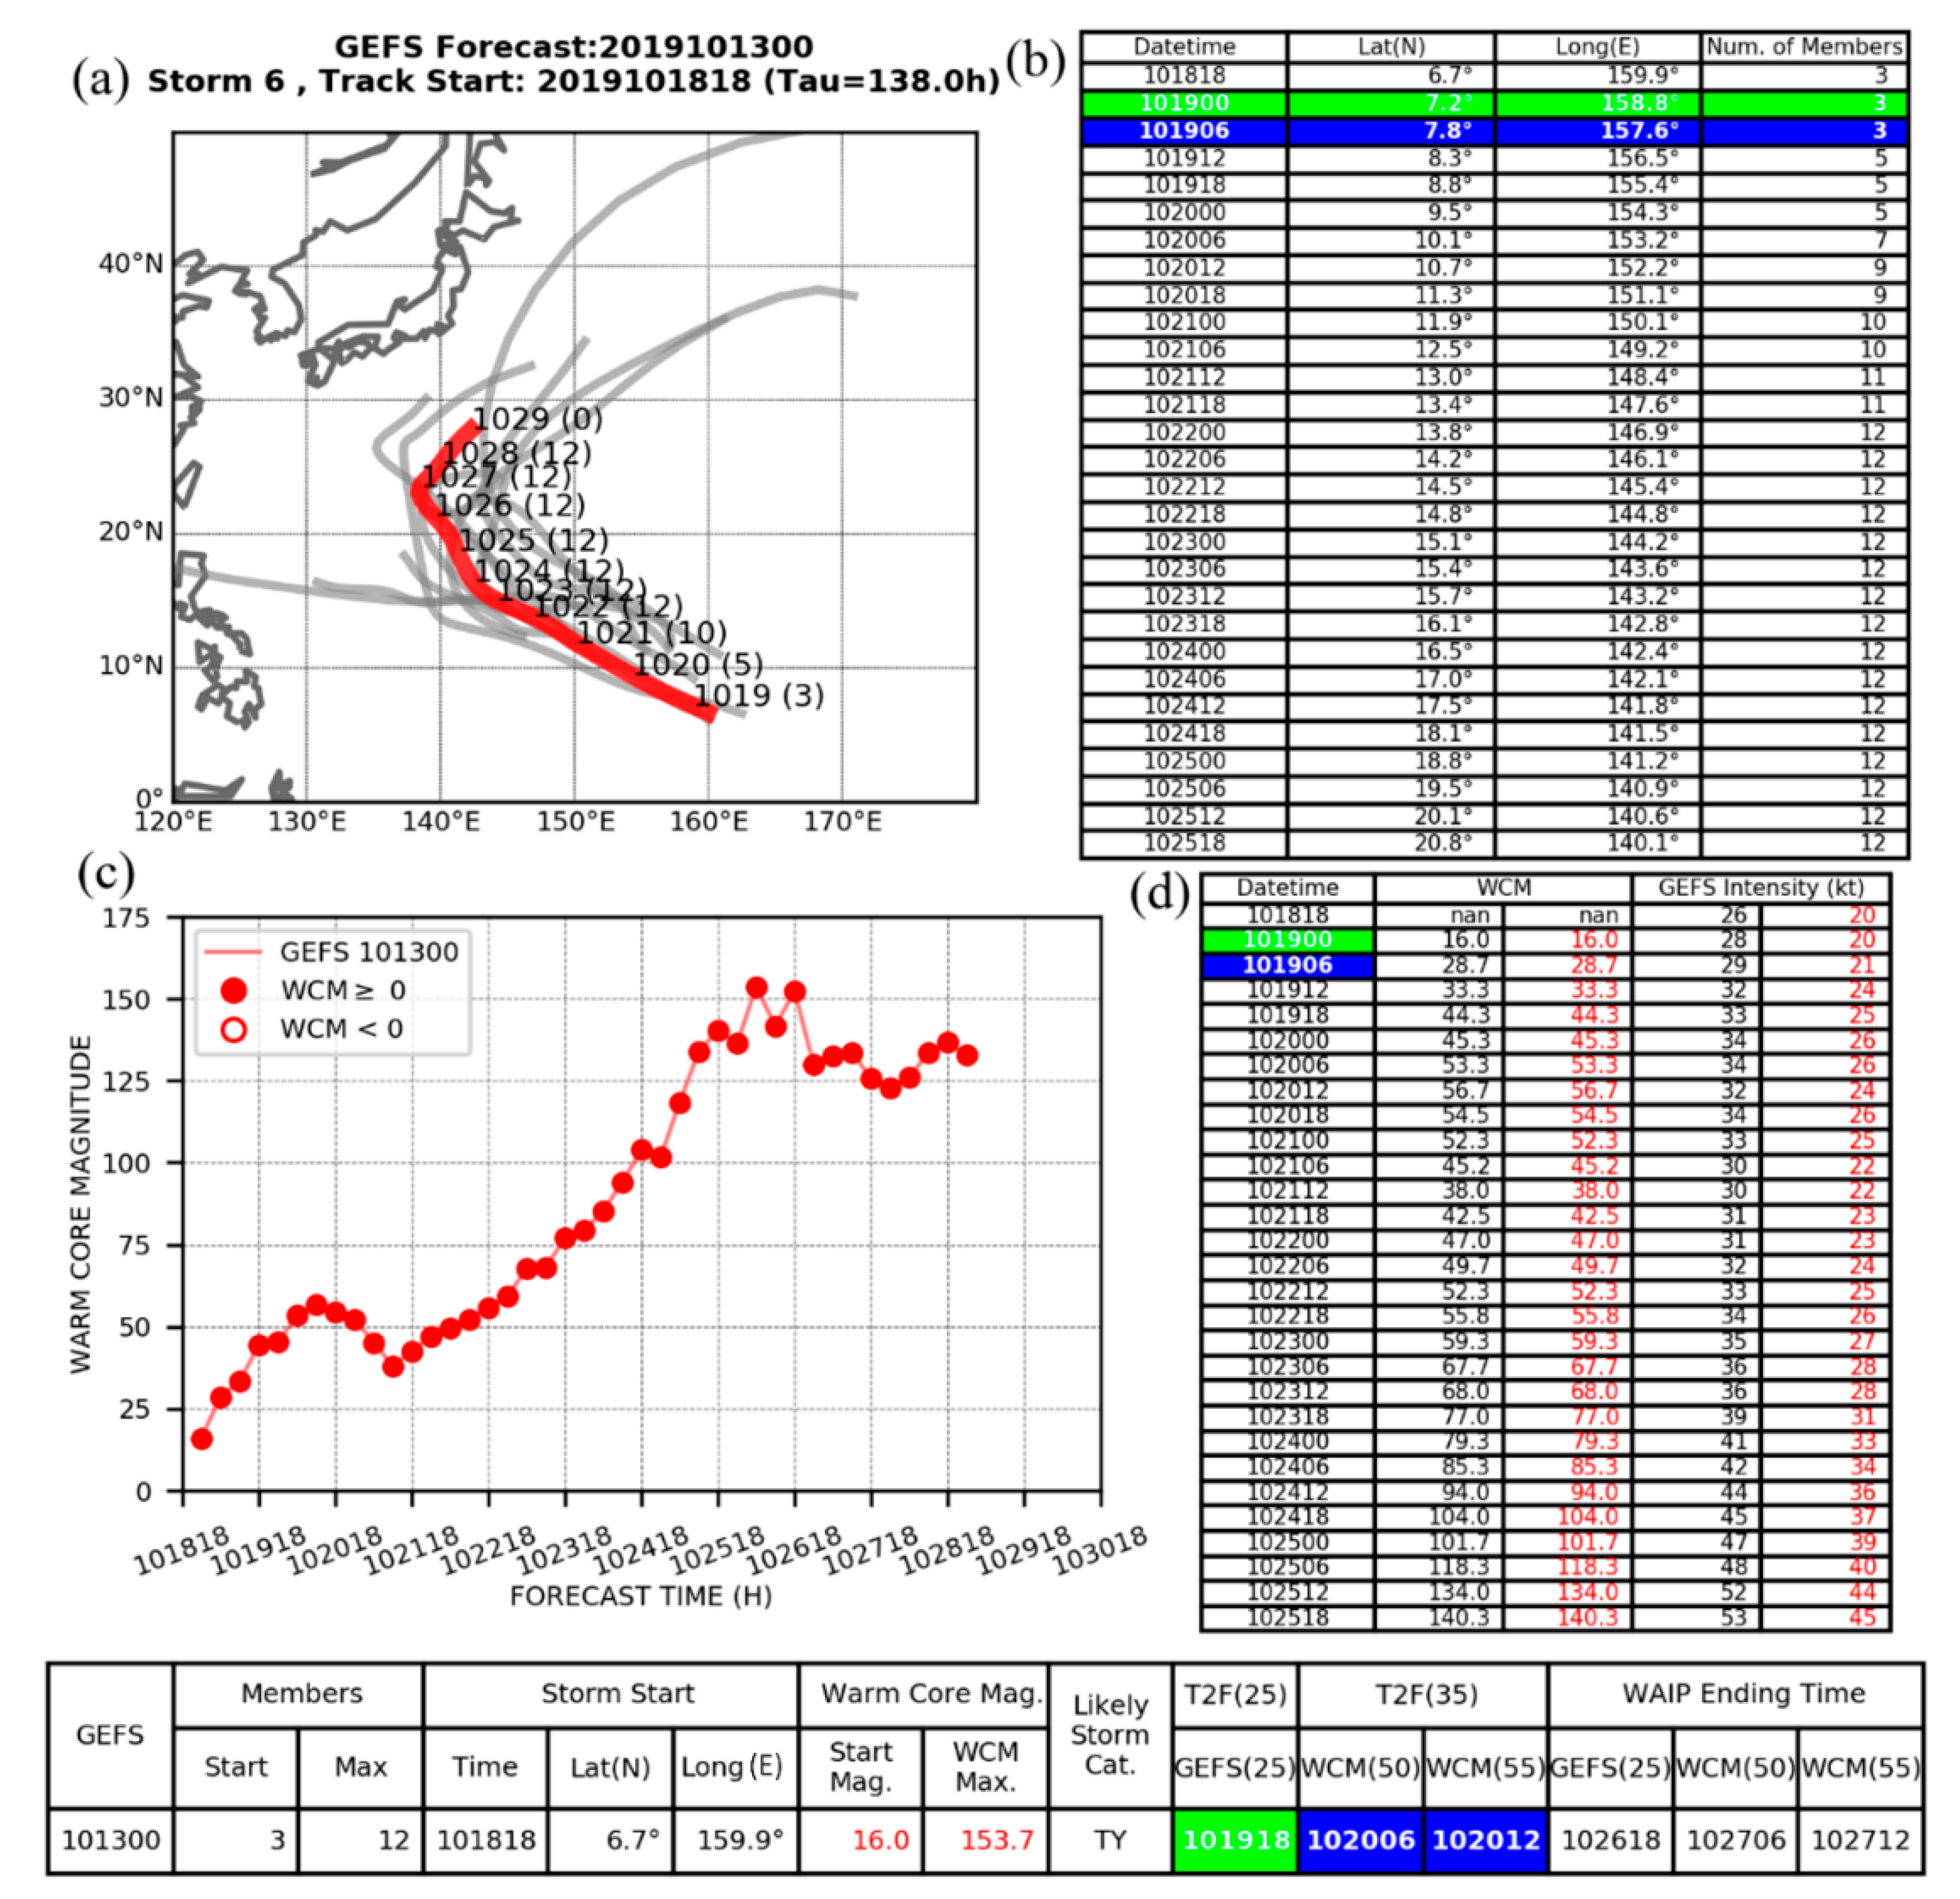
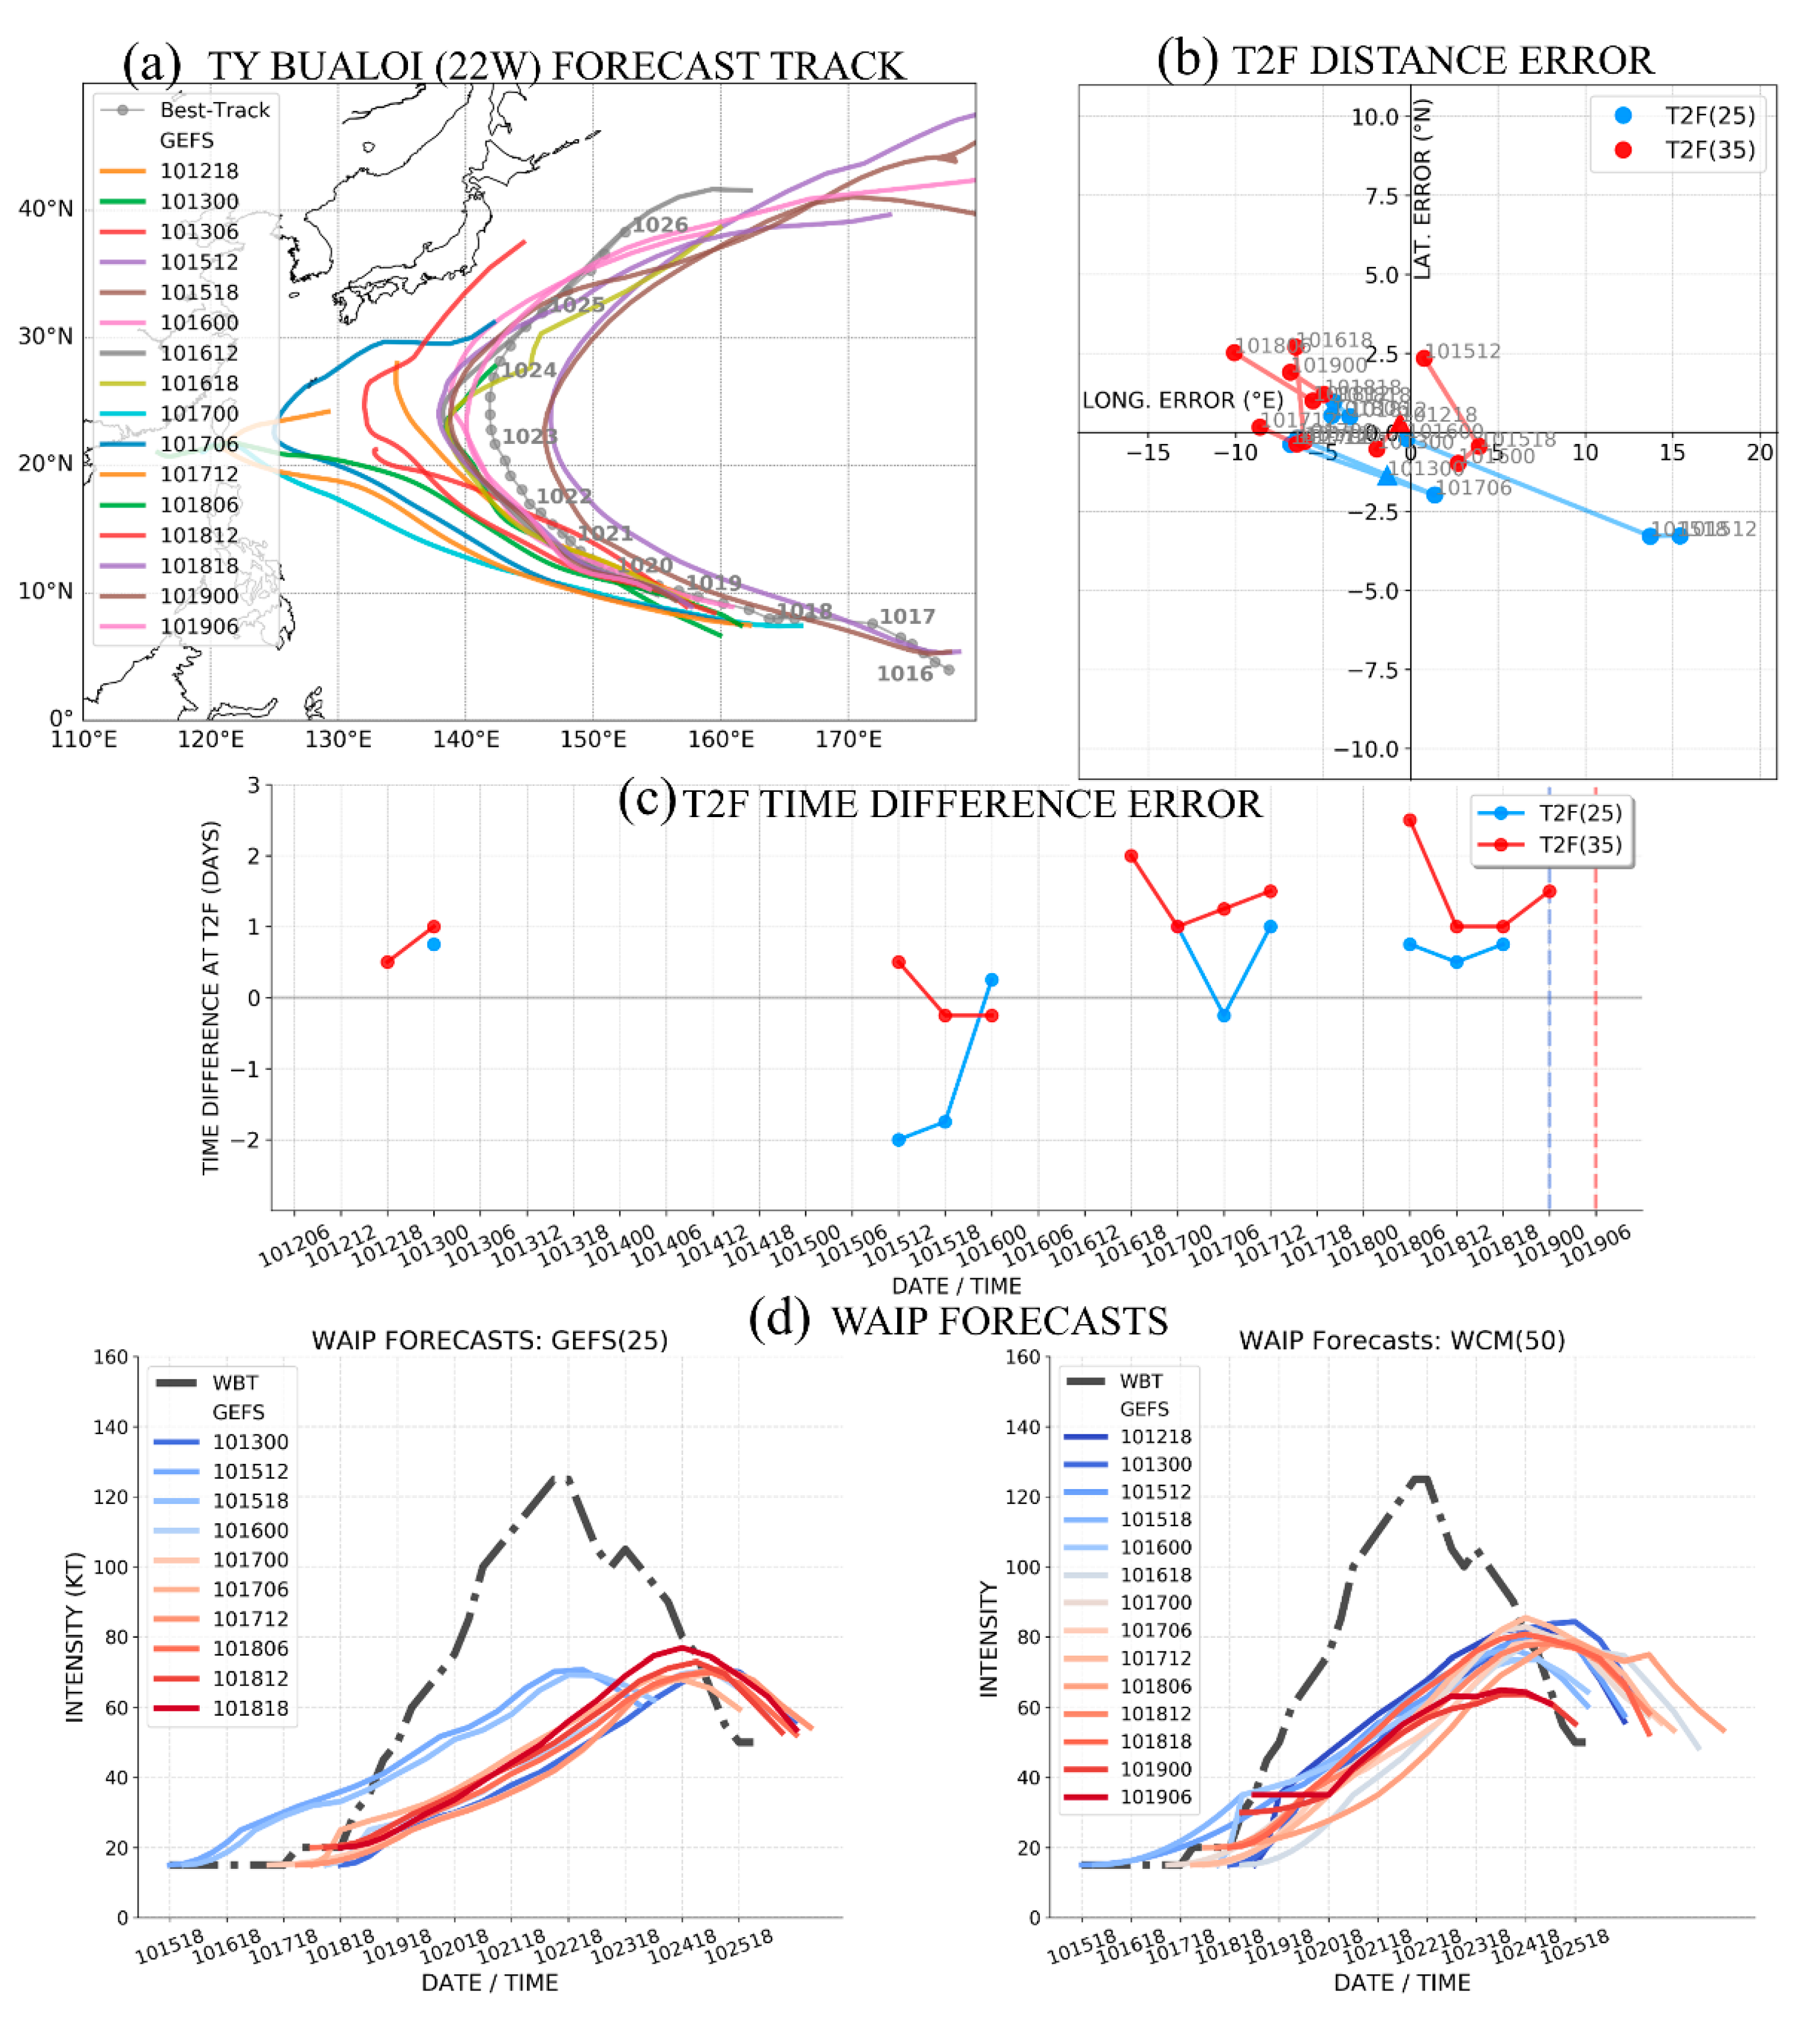
A GEFS forecast from 00 UTC 13 October (12 h after the ECEPS forecast discussed above) has the pre-Bualoi circulation starting at 18 UTC 18 October (Figure 10b), which is just 6 h (12 h) prior to the verifying T2F(25) (T2F(35)). Whereas the GEFS forecast has the circulation starting at 6.7° N, 159.9° E, the ECEPS forecast position at the same time has the circulation at 10.2° N, 162.0° E, which is about 390 km to the north and 200 km to the east of the GEFS forecast position. Essentially, the GEFS track solution in Figure 10a corresponds to the southern track cluster in the ECEPS bifurcation track in Figure 8a, with a rapid west–northwest track to a recurvature near 25° N, 138° E. Even though the GEFS track spread is huge, this WMVM track forecast (Figure 10a, red line) comes to a smooth ending at Day 16 of this GEFS forecast.
The GEFS intensity at 101900, which is the verifying T2F(25), is already 28 kt (column 4, Figure 10d). Since the JTWC WBT intensity is 20 kt, the GEFS intensity evolution is adjusted to start at that 20 kt intensity (column 5, in red, Figure 10d). Consequently, the T2F(25) becomes 101918 (green box in the summary table at the bottom of Figure 10), which is 18 h late.
No adjustment is necessary for the initial WCM, which is a positive 16.0. As indicated in Figure 10c and the digital values in columns 2 and 3 in Figure 10d, the two T2F(35) times tied to the WCM > 50 and WCM > 55 are 102006 and 102012 respectively, and it is noted that they are 1.0 and 1.25 days late relative to the verifying T2F(35) time in the blue box in column 1 of Figure 10d. These T2F(35) times are entered in the blue boxes at the bottom, where it is also recorded that the maximum WCM of 153.7 corresponds to a Likely Storm Category of typhoon. Coincidentally, the GEFS-predicted time of maximum WCM (102606, in Figure 10c) is within 6 h of the ECEPS-predicted time (Figure 8c), but the GEFS has a much larger maximum WCM with a more rapid WCM increase that might be related to a Rapid Intensification (RI).
Note also from Figure 10b the GEFS-predicted average WMVM track position for these T2F(35)s is about 10.5° N, 152.7° E, versus the average ECEPS position that is ~13.0° N, 157.4° E, which is of course related to the different GEFS WMVM track in Figure 10a versus the ECEPS WMVM track in Figure 8a. Because of the delay in the GEFS picking up the pre-Bualoi circulation until just before the T2F(35), the predicted latitude is quite good, but the longitudinal position is too far to the west.
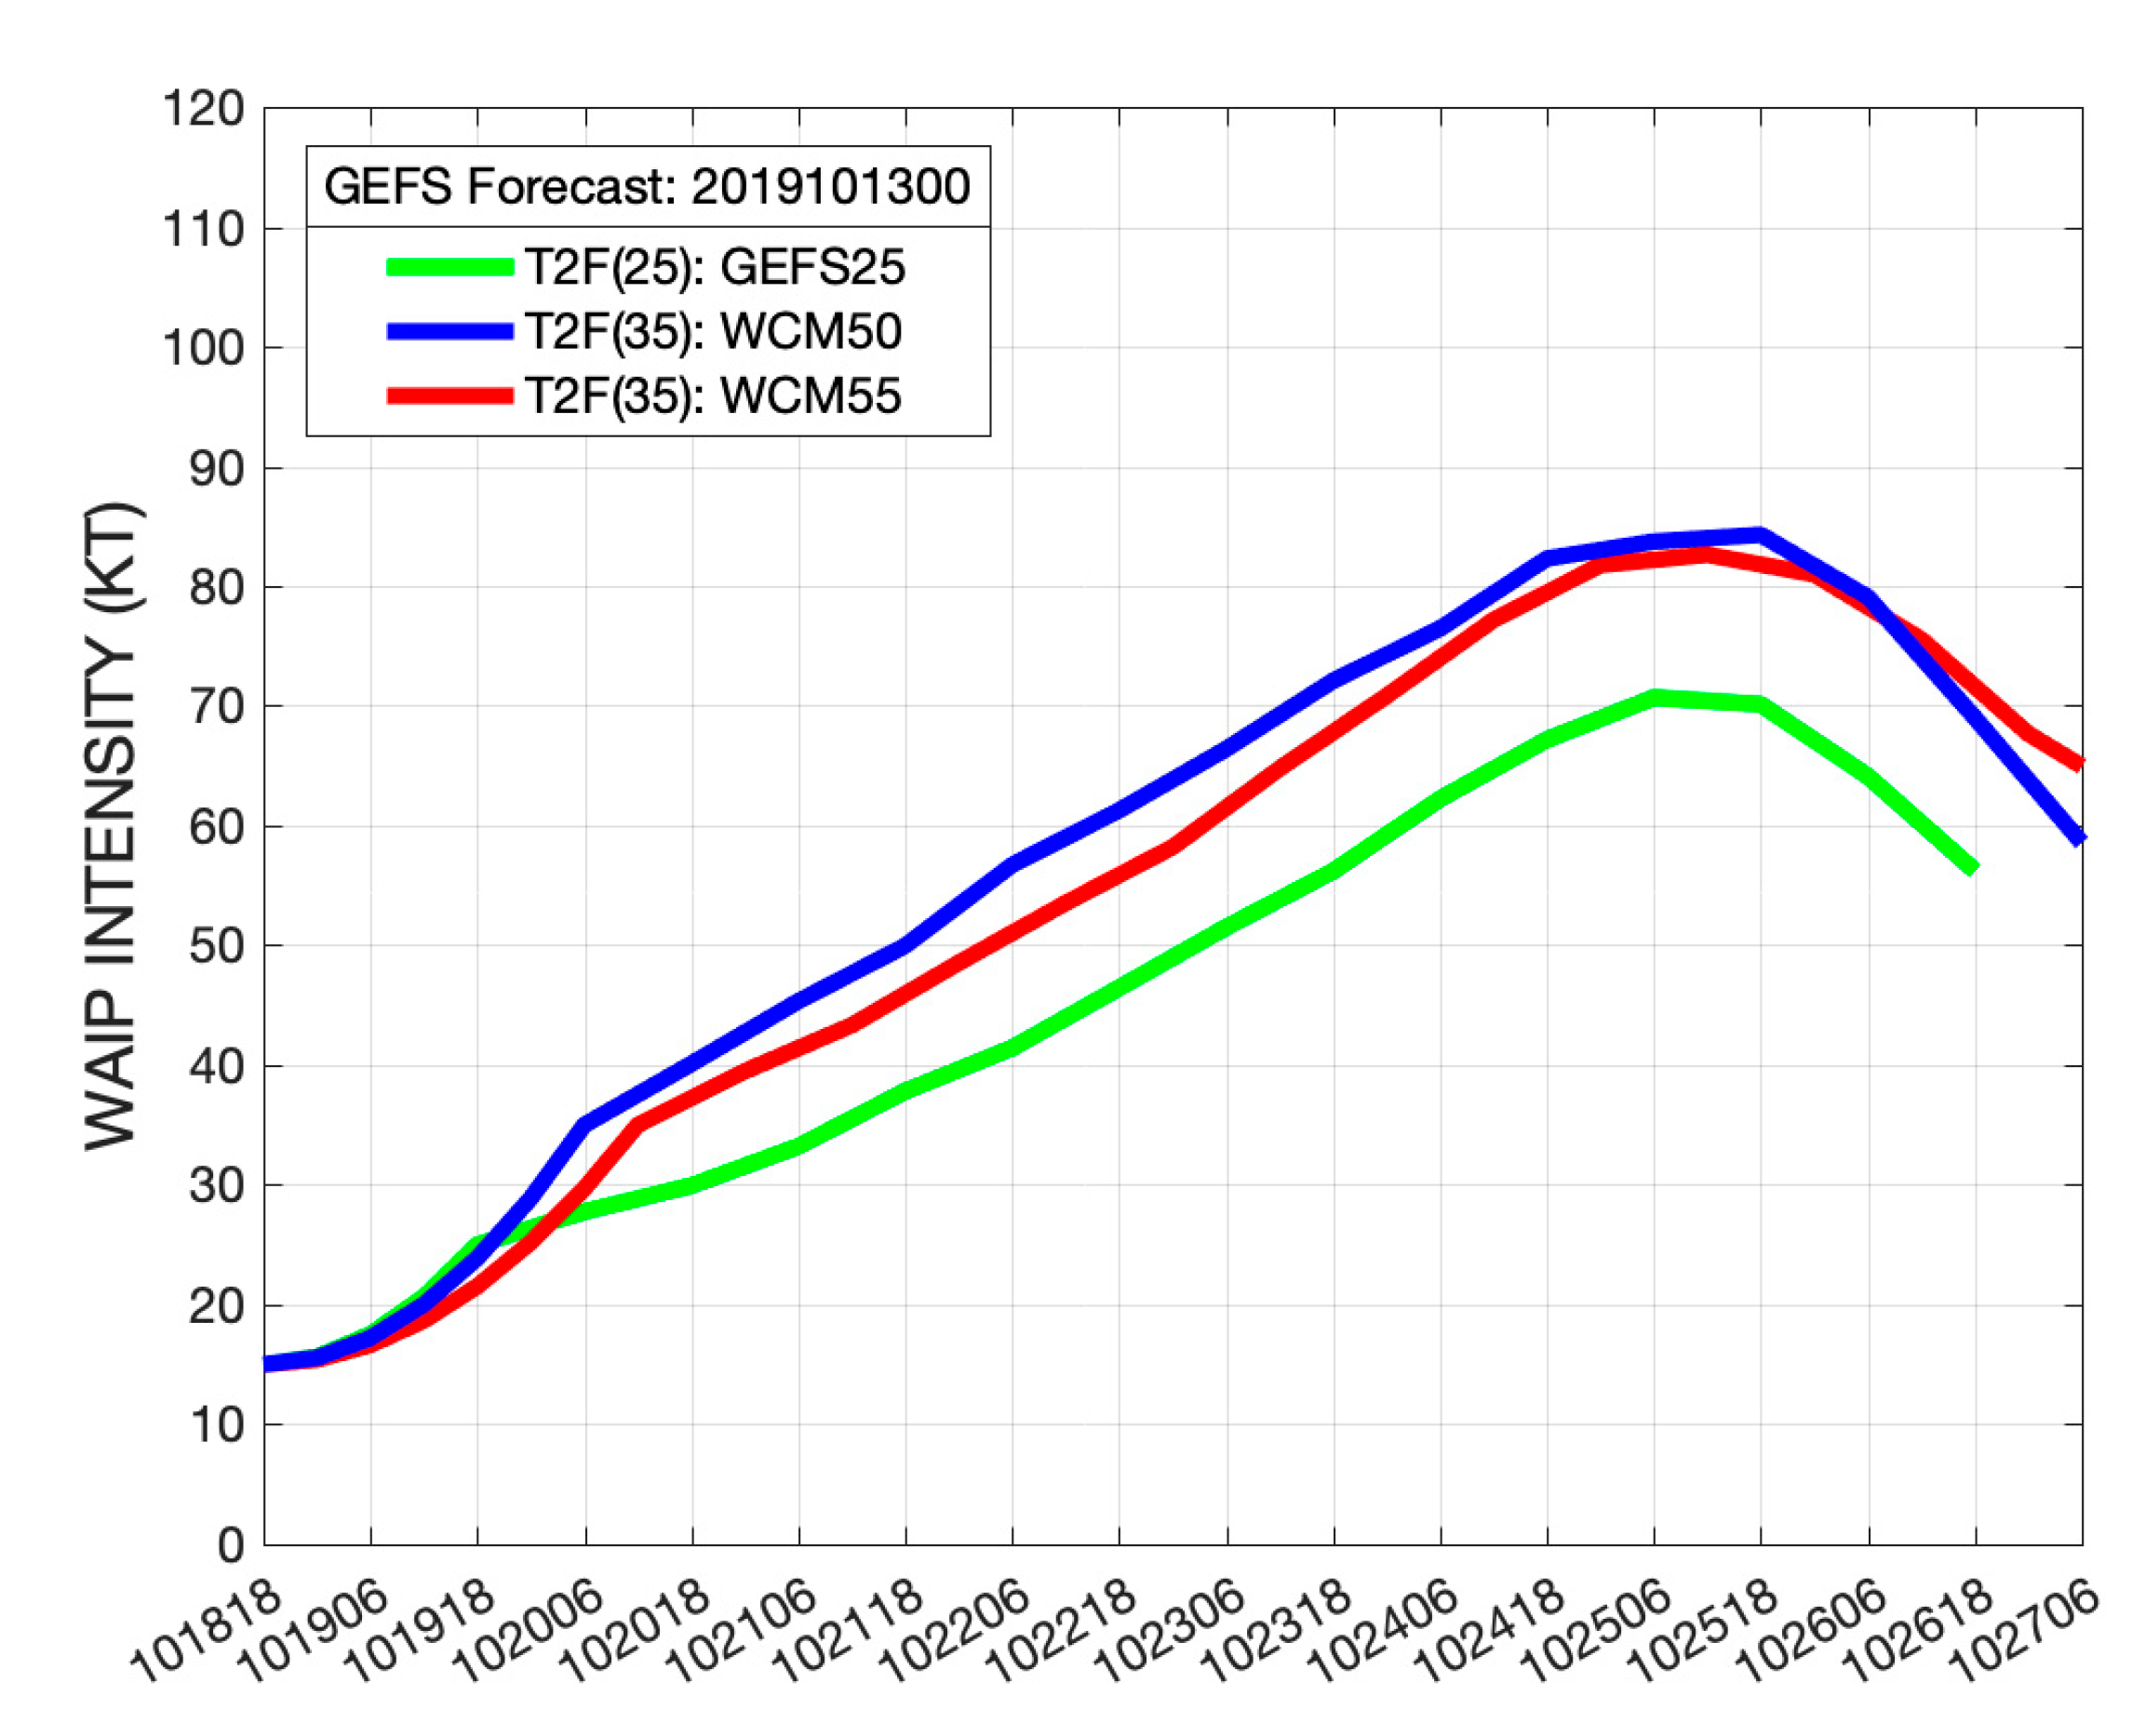
With no WAIP Ending Storm constraint within 7 days after the three T2Fs, given the WMVM track forecast for 7 days after each T2F, and assuming an initial intensity of 15 kt, the WAIP intensity forecasts are given in Figure 11. Note that the WAIP intensity forecasts based on the two T2F(35) times (only 6 h apart) are very similar and reach the same maximum (82 kt). By contrast, the WAIP intensity forecast for the T2F(25) time (12–18 h earlier) has a slower intensification rate and achieves only a 70 kt maximum intensity. Since almost the same segment of the WMVM track forecast is being utilized for the analog selection, it must be that the initial intensity matching of the 25 kt (instead of 35 kt) in the analog selection has resulted in more lower-intensity analogs. Again, it is not expected that an analog method could predict the peak 130 kt intensity of Bualoi, but it is noteworthy that a typhoon-intensity storm is to be anticipated around Day 12 in this GEFS forecast.
In summary, forecasting the T2F of the pre-Bualoi circulation in the ECEPS and the GEFS is difficult because the initial disturbance is at a low latitude, and the ECEPS WMVM track forecast indicates a track bifurcation situation. The ECEPS track forecast picks up the disturbance earlier than does the GEFS and provides a quite accurate track. By contrast, the GEFS misses the early track and instead focuses on the southern track cluster in this bifurcation situation, which is a much less accurate track forecast at later times than the ECEPS track forecast. Although the latitude of the verifying T2F(35) position is better predicted by the GEFS, the longitude is better predicted by the ECEPS. While both ensemble peak WCMs correspond to a likely typhoon, in general, the GEFS has more rapid WCM increases that seem to be related to more rapid intensification periods, and this tendency will be examined in future studies.

3.1.4. Summary of the Western North Pacific Examples

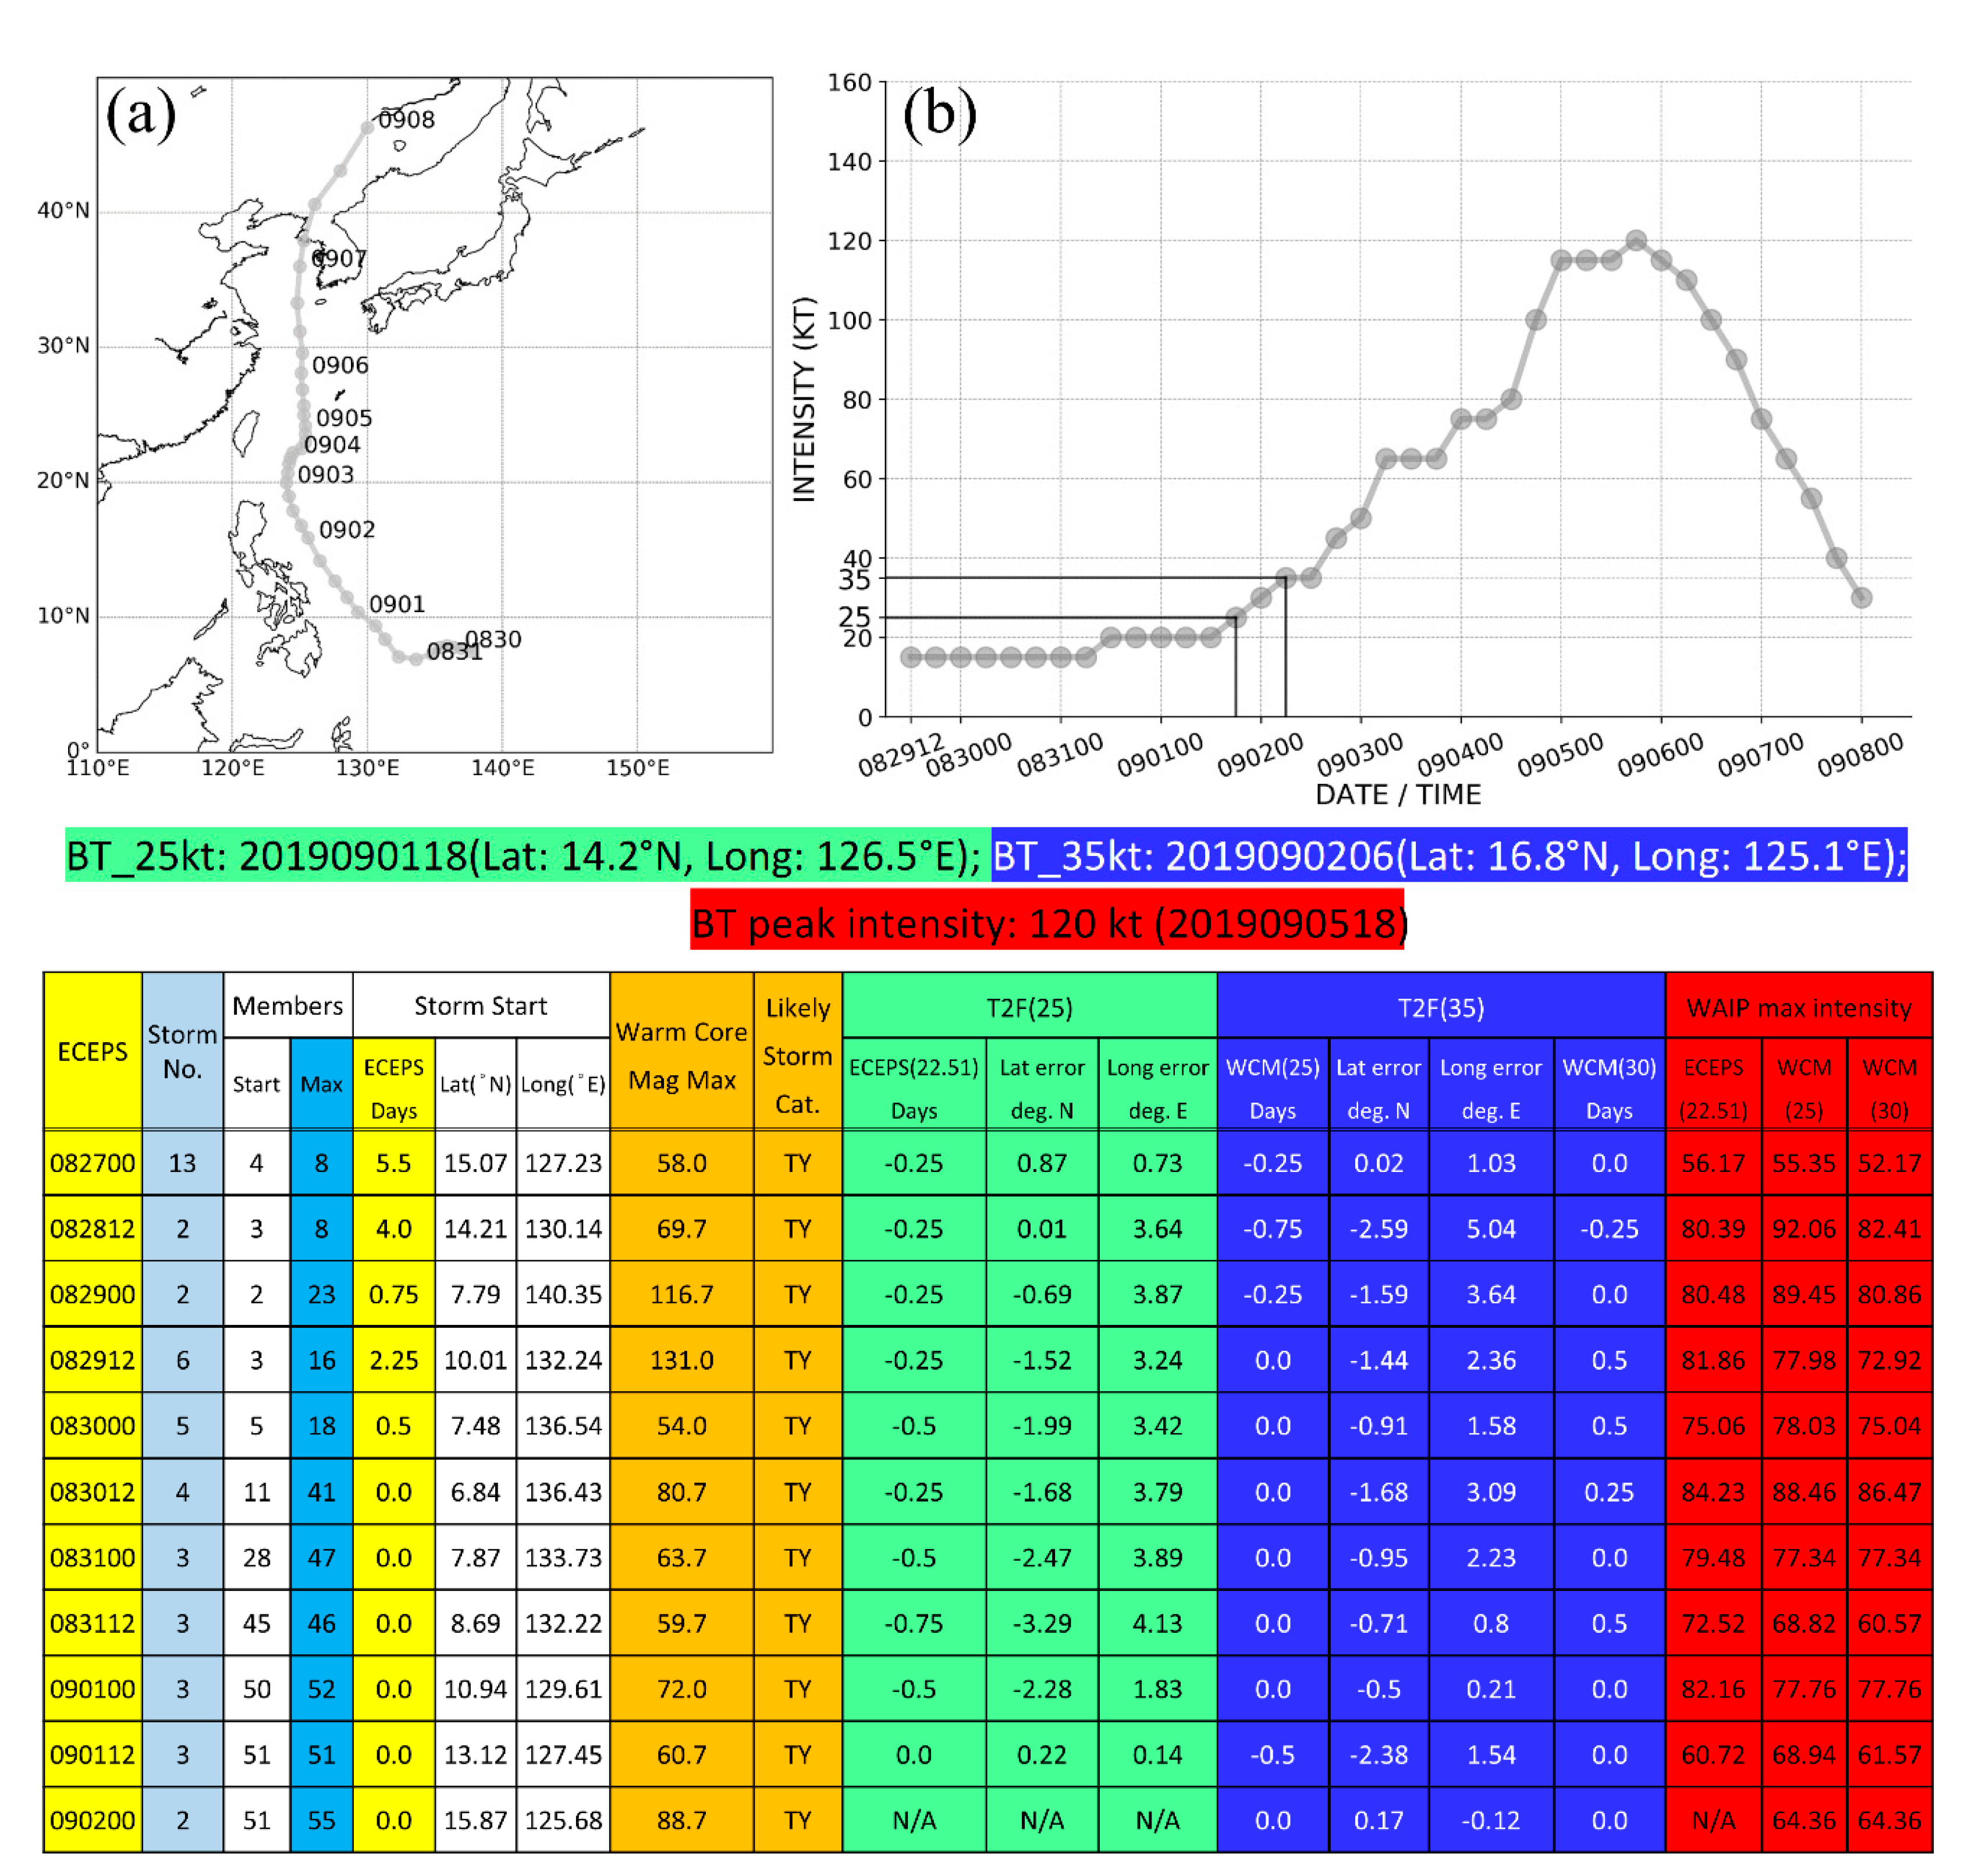
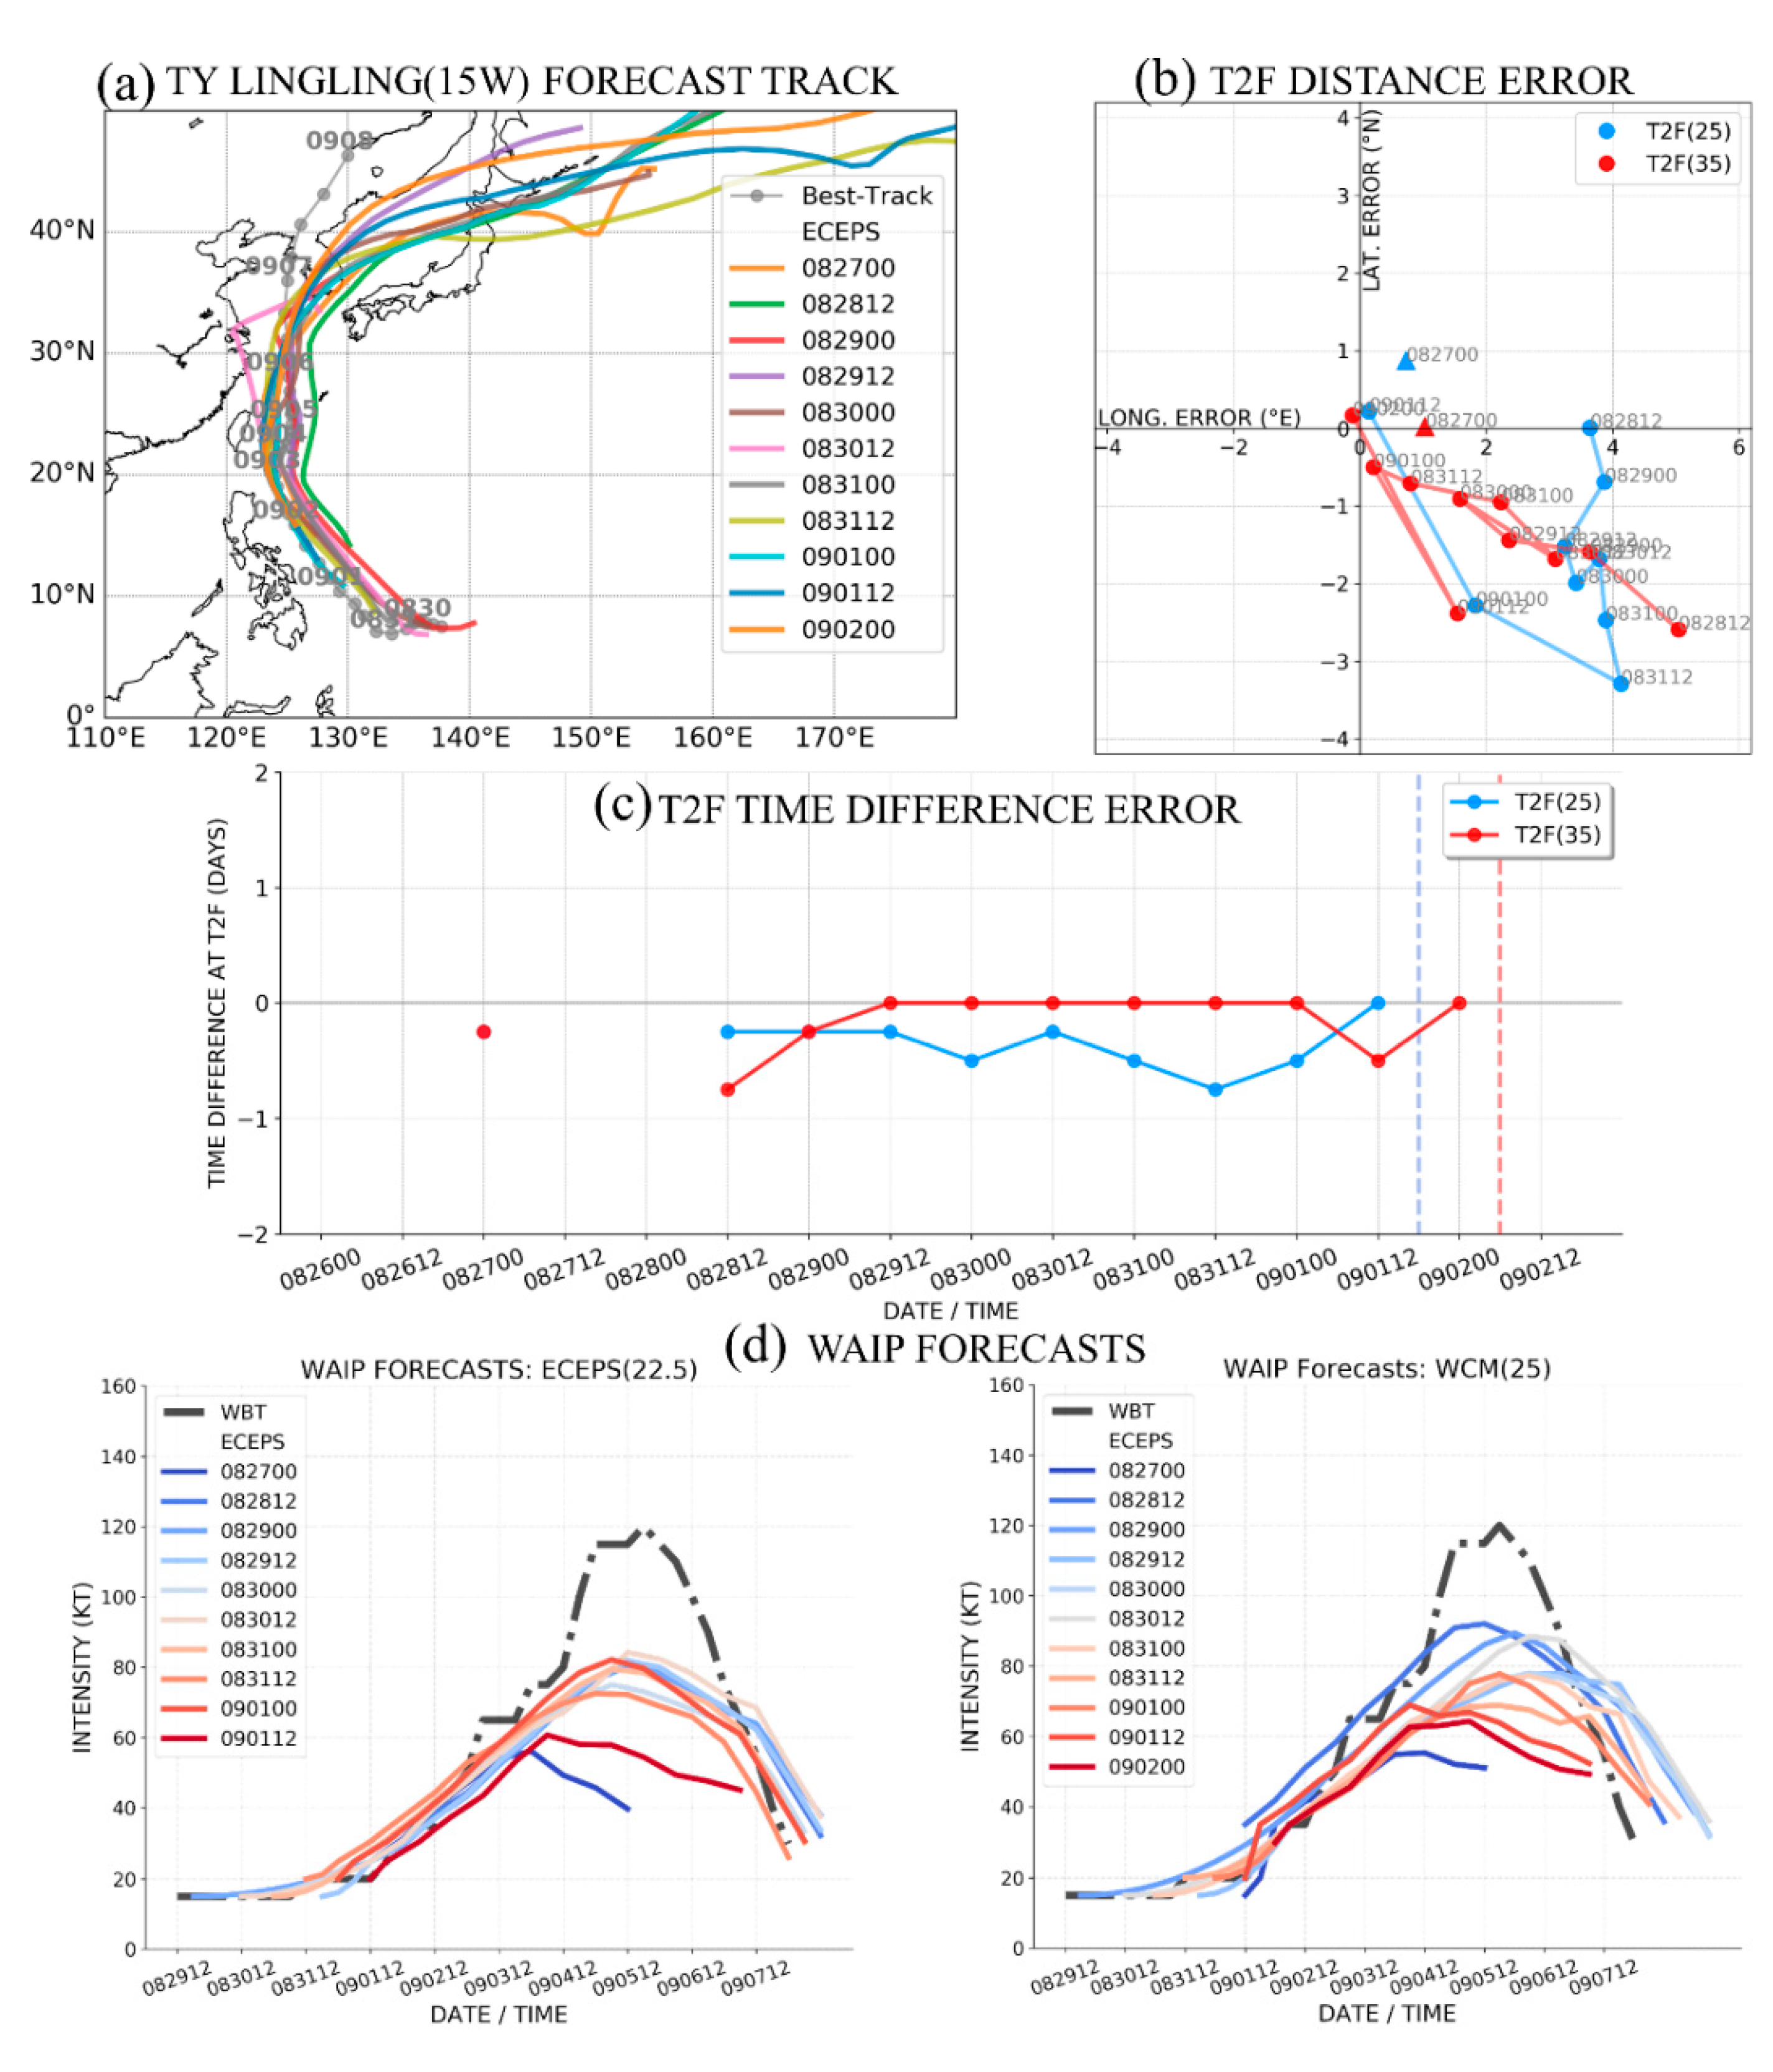
Only one ECEPS and one GEFS forecast for each of the three TCs have been described because of space limitations. In Section 4.1 and Section 4.2, validation summary tables will be presented that include the other forecasts for the pre-Lingling and the pre-Bualoi cases with a focus on the T2F timing and position errors and the corresponding WAIP forecasts versus the WBT intensities during Lingling and Bualoi from the ECEPS and the GEFS.
One issue with these ensemble models during the TC pre-formation stage is the uncertainty in the initial and the subsequent early storm positions that are based on only a few ensemble member track positions. In the WMVM procedure, the minimum number of ensemble members to form an ensemble storm track is normally set at three, but even a weighted-mean of this small number of member track positions can lead to erratic ensemble storm positions and storm motion vectors. Furthermore, the weighted-mean storm intensities and weighted-mean Warm Core Magnitudes (WCMs) calculated from the Marchok vortex tracker at scattered initial ensemble member positions can lead to large variability. Especially for the GEFS, adjustments in the initial too-large ensemble storm intensities were necessary to agree with the JTWC WBT intensities (when available), and adjustments in some large, negative WCM values were necessary to start from 0.0 when the initial intensities were small.
In this small sample of GEFS forecasts during the last half of the 2019 western North Pacific season, JTWC WBT intensities were available for about 60% of the Storm Start times. The JTWC WBT file also contains storm position estimates (based almost exclusively on satellite imagery) that in principle can be compared with the Storm Start positions from the ensemble models. Note that these satellite position estimates during the pre-formation stage have much larger uncertainty than during the mature stage when an eye is available. As mentioned in Section 2, one future approach will be to translate the ensemble storm WMVM track forecasts to be consistent with the initial positions according to the satellite imagery, which is expected to lead to improved positions of the T2F(25) and T2F(35) along those WMVM tracks.
In these three examples for the western North Pacific, the Likely Storm Category based on the maximum positive WCM correctly indicated a typhoon for Lingling and Bualoi, and either a weak tropical storm (ECEPS) or a tropical depression (GEFS) for TS Peipah. For disaster preparedness activities, it is more important to correctly indicate whether a typhoon should be expected. However, a correct prediction that an approaching pre-TC circulation will not become a damaging tropical storm, or a typhoon, will avoid the need to begin such disaster preparedness activities.
The combined WAIP intensity prediction technique [13] provides guidance that is expected to be highly accurate (<5 kt) if the T2F forecast is accurate, which will be the focus of the validation summary tables to be presented in Section 4. As mentioned above, verification intensity estimates are not available when the pre-TC circulation starts in the ensemble models before a JTWC WBT file has been initiated. In the examples in Figure 2, Figure 4, Figure 9 and Figure 11, when the T2F was accurate, the intensification stage of the combined WAIP technique performed rather well during the period immediately after the T2F(35). However, the peak intensities based on a weighted-mean of 16 analog intensities were too small when Lingling and Bualoi had an extended period of rapid intensification (defined here as 30 kt/24 h). A common too-early T2F(25) error in these examples leads to a too-early start of the intensification stage of the combined WAIP, and then the WAIP-predicted peak intensity was too early as well as being too small. Whereas the GEFS-predicted T2F(25) and WMVM track forecast inputs to the combined WAIP technique for the pre-Peipah case correctly indicated a likely TD stage, the ECEPS inputs led to a large WAIP over-prediction of the weak TS Peipah that may be attributed to selection of analogs that were already intensifying tropical storms at the initial time.
One shortcoming of this post-season validation of the ECEPS and GEFS performance in providing the WCM-based estimates of the T2F(35) is that the benefits of JTWC forecaster-satellite analyst collaboration cannot be reproduced. As described above, there are uncertainties in the track forecasts, uncertainties in the Storm Start times and positions, and uncertainties in the satellite and other observations in assessing the pre-TC circulation position, intensity, and structure. Furthermore, there are uncertainties in the capability of the ensemble model physics to predict the environmental versus the internal factors during the TC pre-formation stage. One of the factors in the decision to first focus the JHT project on the western North Pacific TCs in cooperation with the JTWC is that they have a forecaster/analyst dedicated to analyzing the TC formations each 12 h in their Area of Responsibility over the next 14 days. Using the case of pre-TY Bualoi as an example, the first WBT file entry was at 18 UTC 15 October, which is 30 h (84 h) before the Storm Start time for the ECEPS (GEFS). The means the JTWC satellite analysts and forecasters over the previous three (seven) 12 h shifts had been following the feature(s) in the satellite imagery that became the pre-Bualoi circulation in the ECEPS (GEFS). The benefits of this human forecaster-satellite analyst collaboration in assessing the ensemble model outputs cannot be measured in this study, but the expectation is that the earlier a satellite feature of a pre-TC circulation has been consistently monitored, the more accurate the current analysis of that feature will be.

3.2. Eastern-Central North Pacific Example of T2F Forecasts

As in the western North Pacific examples in Section 3.1, ECEPS and GEFS ensemble storm WMVM track forecasts were examined that have a <300 km track difference with the NHC WBT track of pre-Hurricane Kiko (2019) during the seven days prior to the verifying T2F(35) of 18 UTC 12 September. The ECEPS example of a T2F forecast is for 00 UTC 8 September when the WMVM track forecast (Figure 12a) indicated that the pre-Kiko circulation would subsequently pass into the Central Pacific Hurricane Center (CPHC) Area of Responsibility (west of 140° W) and approach the Hawaiian Islands on Day 15. The pre-Kiko Storm Start was at 090806 at 9.0° N, 96.1° W, with only three ensemble members, but 24 h later, seven other members had joined and the WMVM position was 10.4° N, 99.8° W (Figure 12b, lines 1 and 5). The track spread about the WMVM track forecast was quite small until Kiko passed 130° W. Nevertheless, such a track forecast approaching Hawaii would be closely monitored—not just by the CPHC for the public sector, but also the Commander, Pacific Fleet who is responsible for warning the numerous Department of Defense facilities on Hawaii.
The ECEP initial intensity was 20 kt (Figure 12d, column 4) and only a slow intensification was predicted until after the T2F(25) threshold of 22.51 kt was achieved at 091112 (green box in the summary table at the bottom of Figure 12), which is only 12 h after the verifying T2F(25) of 091100 (green box in column 1 of Figure 12d). The WCM evolution (Figure 12c) utilized to detect the two T2F(35) estimates starts at 7.0 (Figure 12d, columns 2 and 3) and is essentially constant for 3 days before only slowly increasing to the WCM threshold of 20 (25) precisely at the verifying T2F(35) time of 091218 (at 091300), as recorded in the blue boxes at the bottom of Figure 12. The maximum positive WCM is predicted to be 43.7, which corresponds to a Likely Storm Category of Hurricane (bottom summary table in Figure 12). Since WCMs of this magnitude in Figure 12c tend to persist for about four days, this ECEPS forecast suggests that hurricane intensity might be sustained until 2 days before the end of the 15-day forecast.
Even though a weighted analog intensity prediction technique similar to the WAIP in the western North Pacific has not yet been developed, the Ending Times that would apply are listed as T2F +7 days in the summary table at the bottom-right of Figure 12, since neither landfall nor extratropical transition is predicted.
The corresponding GEFS forecast from 00 UTC 8 September is presented in Figure 13. The pre-Kiko circulation starts quite near the ECEPS starting position with 7 of a possible 21 GEFS ensemble members (Figure 13b, line 1). While the track spread is initially small, the spread increases and the WMVM track forecast (red line, Figure 13a) is along the northern track cluster. Rather than a track forecast toward Hawaii as in the ECEPS (Figure 12a), the GEFS track forecast has a more poleward track that ends near 25° N, 130° W, on Day 13.5 (Figure 13a). Nevertheless, the CPHC and the Commander, Pacific Fleet would be advised to continue to monitor the pre-Kiko circulations in both ensemble models.
The GEFS intensity at 090818 was already 20 kt, but the intensity only slowly increased to 25 kt at 091112 (green box in the summary table at the bottom of Figure 13), which is 12 h late compared to the verifying T2F(25) in the green box in column 1 of Figure 13d. The GEFS-predicted WCM evolution starts at 1.3 and steadily increases to the early (late) T2F(35) threshold of WCM = 45 (WCM = 50) at 091300 (091306), which is recorded in the blue boxes in the bottom table of Figure 13. It is noteworthy that these T2F(35) times are only 6 and 12 h late respectively, as they are 4.5 days and 4.75 days after the start of the pre-Kiko circulation in this GEFS forecast. Note that in the bottom table of Figure 13, the WCM continues to increase to a maximum of 85.3, which is a strong indication that the pre-Kiko circulation will likely become a hurricane. The final information that can be drawn from the WCM evolution is that the Ending Time for a future WAIP-type intensity prediction based on the T2F(35) would be 091818, because that time has the last positive WCM value in Figure 13c and this represents the extratropical transition time.
In summary, both the ECEPS and GEFS have very acceptable forecasts of the T2F(35) even when these formation times are more than 4 days after the start of the pre-Kiko circulation in these ensemble models. Both models provide an indication from the maximum WCM that this circulation is likely to become a hurricane. Although the pre-Kiko circulation in the models started near the same location, the T2F(35) position error for the ECEPS (GEFS) was 1.0 degree (1.7 degree) latitude to the south and 0.5 degrees (1.0 degree) longitude to the west, which are quite acceptable errors again considering that they are predicted more than 4 days in advance. However, there are large differences in the track forecasts after the T2F(35) that could have large consequences, and thus continuous monitoring of both ensemble models is advised.

3.3. Atlantic Example of T2F Forecasts

As in the western North Pacific examples in Section 3.1 and the eastern/central North Pacific example in Section 3.2, ECEPS and GEFS ensemble storm WMVM track forecasts were examined that have a <300 km track difference with the NHC WBT track of Hurricane Lorenzo (13L) during the seven days prior to the verifying T2F(35) of 12 UTC 23 September. The ECEPS example of a T2F forecast is from 12 UTC 16 September and the pre-Lorenzo circulation is predicted to start at 092106 (Day 4.75) near 9.7° N, 13.6° W (Figure 14b, line 1) as the circulation moves off the west coast of Africa (Figure 14a). While the circulation starts with only four ensemble member tracks, by 092200, six more members have joined and pre-Lorenzo is predicted to have moved rapidly west-northwestward to 11.0° N, 16.7° W. The ECEPS also predicted that by Day 15, Lorenzo would be recurving near 25° N, 50° W (Figure 14a).
The ECEPS initial intensity that is the weighted-mean of the four ensemble member intensities from the Marchok vortex tracker is 16 kt (Figure 14d, column 3) and increases to 22 kt within 6 h. In other ECEPS forecasts of African Easterly Wave-related circulations, the initial intensities were also higher than would be expected based on a WBT intensity of 15 kt. Thus, the ECEPS intensities were adjusted to begin at the WBT intensities when available (Figure 14d, column 4). In this case, the initial intensity adjustment did not change the T2F(25) time of 092206 (green box in the summary table at the bottom of Figure 14) when the 22.51 kt threshold value was first exceeded. Note that this forecast time was just 6 h before the verifying T2F(25) time of 092212 (green box in column 1 of Figure 14d), which is noteworthy as the T2F(25) is at Day 5.75 in the ECEPS forecast.
The weighted-mean Warm Core Magnitude (WCM) evolution (Figure 14c) utilized to estimate the early and late T2F(35) times starts at 19.3 (column 2, Figure 14d), but six hours later, decreases to 12.7 as two more ensemble members have joined (column 4, Figure 14b). Nevertheless, the WCM threshold of 20.0 for the early T2F(35) is already surpassed 12 h later at 092200 (first blue box in summary table at bottom), which is 36 h early compared to the verifying T2F(35) time in the blue box in column 1 in Figure 14d. By contrast, the late T2F(35) estimate for when the WCM threshold of 25.0 is surpassed is 092306 (second blue box at the bottom), which is just six hours early. Note also in Figure 14c that the WCM rapidly increases beyond these T2F(35) estimates and is predicted to have a maximum WCM = 150.0, which corresponds to a Likely Storm Category of Hurricane (bottom table of Figure 14).
Even though a weighted analog intensity prediction technique similar to the WAIP in the western North Pacific has not yet been developed, the Ending Times that would apply are listed as T2F + 7 days in the summary table at the bottom-right of Figure 14 since neither landfall nor extratropical transition is predicted.
The corresponding GEFS forecast from 12 UTC 16 September is presented in Figure 15. The pre-Lorenzo circulation starts quite near the ECEPS starting position with only 3 ensemble members of a possible 21 members (Figure 15b, line 1). Even by the verifying T2F(25) time at 12 UTC 22 September (Day 6), there were still only 6 members and there was a relatively large spread about the WMVM track forecast (red line, Figure 15a). After the circulation turned to the northwest, the spread became very large, but the WMVM track indicated that a recurvature was beginning by Day 16 near 28° N, 44° W.
The initial weighted-mean GEFS intensity was already 16 and increasing rapidly (column 4, Figure 15d). Even with an adjustment to begin at 15 kt (column 5, Figure 15d), as discussed above for the initial ECEPS intensity, the T2F(25) is 092200 (green box in the summary table at the bottom of Figure 15), which while it is 12 h early is noteworthy as that is at Day 5.5 in this GEFS forecast. The weighted-mean WCM begins at 24.3 (columns 2 and 3, Figure 15d) and increases to the early T2F(35) time threshold WCM = 35 in six hours at 092118 (first blue box in the summary table at the bottom of Figure 15). After the late threshold WCM = 40 was surpassed 12 h later at 092206 (second blue box at the bottom of Figure 15), the WCM increased to 73.3 at 092300, which already satisfies the GEFS WCM threshold for a Likely Storm Category of Hurricane. The predicted WCM values remained within the range of 75–100 until 093018 and then rapidly increased to ~170 in only 36 h before this 16-day GEFS forecast ended. Although not so evident in this case, the ECEPS did not generally predict as rapid WCM increases and as large peak values of the WCM in the other two basins discussed in Section 3.1 and Section 3.2. Since the magnitude of the warm core of a TC is related to the minimum sea-level pressure, a future task will be to examine whether the rapid WCM increases may be related to the likelihood of a Rapid Intensification (RI) event.
In summary, both the ECEPS and GEFS have very acceptable forecasts of the T2F(35) time even when these formation times are being predicted around Day 5 in the ensemble model forecast. Although both ensemble models started the pre-Lorenzo circulation near the same location off the west coast of Africa, and had acceptable T2F(35) times, some of the T2F(35) longitudinal position errors were large for this rapidly westward propagating circulation. For example, the early T2F(35) longitude errors were −6.8 degrees (−8.1 degrees) for the ECEPS (GEFS). While the late T2F(35) longitudinal error for the GEFS was −5.1 degrees, the corresponding longitudinal error for the ECEPS was only −1.1 degree, which in combination with a latitudinal error of only 0.6 degrees to the south is quite noteworthy.

3.4. Concluding Comments on ECEPS and GEFS Forecasts of T2F

As indicated in Section 3.1.4, there may be some variability in the starting locations, the initial intensities, and the associated WCM(s) along that WMVM track forecast when these ensemble models begin with only a small number of ensemble members. Thus, some adjustments in the initial intensities and in the initial WCMs have been applied when WBT intensities are available, and these adjustments vary in the two ensemble models and in the three TC basins considered in this Section. Especially in the eastern/central North Pacific and in the Atlantic basins, many more TC formation cases must be examined before finalizing these initial adjustment procedures.
Even with an adjustment for the initial intensity, the forecast T2F(25) times, which are the weighted-mean intensities of the ensemble members, tend to be early. One can argue that it is better to be early rather than late in issuing a warning about an approaching TC, but too early of a warning may cause the public to not prepare in a timely manner the next time. The T2F(35) times appear to be more accurately forecasted, with the ECEPS (GEFS) formation times tending to be late (early). Similarly, the maximum positive WCM utilized to estimate the Likely Storm Category tends to be low (high) for the ECEPS (GEFS). Again, some further “tuning” of the WCM thresholds that indicate the T2F(35)s may be required, especially in the eastern/central North Pacific and in the Atlantic, where fewer TCs occurred during the near-real-time predictions of WCM-T2F (late August to early November 2019). Nevertheless, it was certainly encouraging that the WCM thresholds for the three Storm Categories were successful in forecasting a weak pre-TS Peipah as well as TYs Lingling and Bualoi.
There were several examples in which the T2F was relatively accurately forecasted, but the inferred formation location along the WMVM track was not as accurate as might be desired. For the rapidly propagating pre-Lorenzo circulation described in Section 3.3, the slow bias may be due to the WMVM calculation of the along-track component from too widely spread member tracks. These T2F timing and position errors will be described more fully in Section 4.

4. Validation Summaries for the T2F Forecasts and WAIP Intensities

Only a few of the near-real time ECEPs and GEFS forecasts of the T2F(25) and T2F(35) for a few pre-TC circulations in the three basins could be presented in Section 3. In the post-season validation, summaries of the forecasts were prepared for TCs from 14W to 24W in the western North Pacific. In Section 4.1 and Section 4.2, the validation summary tables for the ECEPS and GEFS forecasts for TY Lingling and TY Bualoi will be presented, which will include a preliminary verification of the WAIP intensity predictions as well as the T2F forecasts. The table for TS Peipah is not presented because the T2F(25) had already occurred for many of the forecasts and no T2F(35)s were predicted. In Section 4.3, the validation summary tables for the ECEPS and GEFS forecasts of pre-Hurricane Kiko will be shown, and in Section 4.4, the validation for pre-Hurricane Lorenzo will be summarized.

4.1. Validation Summary for Pre-TY Lingling

The ECEPS forecast validation for pre-Typhoon Lingling is presented in Figure 16. The JTWC WBT for Lingling in Figure 16a was utilized for finding all of the ECEPS-WMVM track forecasts that had track differences < 300 km during the seven days prior to the T2F(35). For example, the ECEPS forecast from 00 UTC 30 August in Figure 1 was described in detail in Section 3.1.1, and key information from Figure 1 is now summarized here on Line 5 of the table in Figure 16. Note that the WMVM track in Figure 1a is a close match with the first 7 days of the WBT in Figure 16a, and the same key features (e.g., number of members and storm start position) of that ECEPS track from the bottom of Figure 1 are repeated here on Line 5. Similarly, the maximum WCM and the Likely Storm Category from Figure 1 are also listed on Line 5.
Three key validations of the ECEPS forecast in Figure 1 are then summarized on the last 10 columns on Line 5 of Figure 16. (i) The T2F(25) forecast timing error in terms of days (early relative to the verifying time in green above the table will be negative), and position errors in terms of Latitude and Longitude are listed in green in columns 10–12 on Line 5 of the table in Figure 16. In addition to being 0.50 days early, the ECEPS forecast T2F(25) position was 1.99 degrees to the south and 3.42 degrees to the east of the verifying T2F(25) position in green above the table in Figure 16. (ii) Similarly, the early (based on WCM > 25) T2F(35) timing error, Latitude error, and Longitude error are listed in blue in columns 13–15 on Line 5, and just the late (based on WCM > 30) T2F(35) timing error is given in column 16 on Line 5. Specifically, the early T2F(35) timing error for the ECEPS forecast in Figure 1 was 0.00 days and was 0.91 degrees to the south and 1.58 degrees to the east of the verifying T2F(35) position information in blue above the table in Figure 1, and the late T2F(35) timing error was 0.5 Days late (column 16). (iii) The last three columns in the summary table at the bottom of Figure 1 were the WAIP Ending Times for each of the T2Fs, and these three times along with the WMVM track forecast in Figure 1a were used to calculate the three WAIP intensity predictions in Figure 2. The maximum intensity for each of these three WAIP predictions is now provided in the last three columns in red on Line 5 of Figure 16. For this ECEPS forecast, the maximum WCM was 54.0 and that corresponds to a Likely Storm Category of (weak) Typhoon (columns 8–9 on Line 5 in Figure 16), and the three maximum WAIP intensities of 75, 78, and 75 kt support/confirm that this pre-Lingling circulation will at least become a typhoon rather than only a tropical storm or a tropical depression. Recall the discussion of Figure 2 in Section 3.1.1 that an analog-statistical intensity prediction technique such as WAIP is not expected to be able to predict the 120 kt maximum intensity in Figure 16b.
The T2F(25) and the T2F(35) latitude and longitude errors are listed for each ECEPS forecast in columns 11–12 (green) and 14–15 (blue) in Figure 16 and are plotted in Figure 17b. For example, these T2F(25) and T2F(35) position errors for the first ECEPS forecast initiated at 082700 (Line 1 in Figure 16) are 0.87 degrees to the north and 0.73 degrees to the east, and 0.02 degrees to the north and 1.03 degrees to the east respectively, and these very small position errors are indicated by triangle symbols in Figure 17b. Subsequent T2F position errors are larger and are to the south and the east of the verifying T2F positions (provided in green and blue above the validation summary table in Figure 16). As described in Section 3.1.2 and Section 3.1.3, some of the T2F position errors may be attributed to the WMVM initial position errors due to only a small number of ensemble members. So even though an accurate T2F(35) time can be inferred from the WCM evolution along a WMVM track forecast that does not begin at the correct initial position, the T2F(35) position error will be affected by that incorrect initial WMVM position.
Recall that the three combined WAIP intensity forecasts for the three T2F times for the ECEPS forecast of pre-TY Lingling from 00 UTC 30 August were presented in Figure 2. Here, the maximum WAIP intensity for the T2F(25) and the early T2F(35) based on the ECEPS forecasts are provided for each ECEPS forecast in the last three columns in the validation table in Figure 16. These combined WAIP intensity forecasts are compared with the verifying JTWC WBT intensity (Figure 17d). Because the T2F(25) and the T2F(35) timing errors (Figure 17c) are small, the pre-formation stage of the combined WAIP intensity forecasts are quite accurate compared to the JTWC WBT intensities (when available). Even the intensification stage of the WAIP intensity forecasts are accurate up to about 60 kt because Lingling intensified first at a climatological rate. However, the rapid intensification from 75 to 115 kt was not predicted by the combined WAIP, although two ECEPS forecasts with accurate T2F(35) times did predict peak intensities of ~90 kt. Thus, the combined WAIP can provide 7-day intensity forecast guidance based on the ECEPS beginning the pre-Typhoon Lingling circulation even before the JTWC began a WBT file.
The corresponding validation summary table for the GEFS forecasts for the pre-TY Lingling circulation T2F(25) and T2F(35) timing and position errors and the WAIP intensity forecasts is provided in Supplementary Figure S1. The key characteristics of the circulation in the 00 UTC 30 August GEFS forecast in line 2 are from Figure 3. These characteristics include that the ensemble storm had a maximum of 19 of a possible 21 ensemble members, the pre-Lingling circulation was in the initial conditions at a relatively good position and had a maximum WCM of 136.0 that corresponds to a Likely Storm Category of Typhoon. The maximum WAIP intensities from the three T2Fs ranged from 86 to 89 kt (see Figure 4), which confirms/supports the likely typhoon intensity based on the maximum WCM value.
The WMVM tracks from all of the 12 h GEFS forecasts with track differences < 300 km from the Lingling track in Figure 16a during the seven days prior to the T2F(35) are provided in Figure 18a. As in the ECEPS tracks in Figure 17a, a variety of Storm Start positions leads to moderate track spread during the first 7 days, and then (except for one member track) the track spread is relatively small until Lingling is predicted to make landfall (Figure 18a). The T2F(25) and T2F(35) timing errors from the GEFS (Figure 18c) begin closer to the verifying times (vertical dashed lines), are more irregular, and are generally less accurate than the timing errors from the ECEPS (Figure 17c). The trend toward larger, late T2F(25) timing errors as the verifying T2F(25) time (blue dashed line) is approaching was unexpected and has been traced to progressively larger GEFS initial intensity adjustments to match the JTWC WBT intensities of 20 kt (Supplementary Figure S1b). With the larger T2F(35) timing errors, the corresponding T2F(35) position errors are much larger to the south and to the east (Figure 18b, red line). Except for the four times that the T2F(25) timing errors were near zero, a similar position error trend toward south and east was evident. However, the GEFS late T2F(25) timing errors as the verifying T2F(25) was approaching then led to large position errors to the north and west.
Because the GEFS only started the pre-Lingling circulations close to the verifying T2F(25) time, and then predicted some late T2F(25) times, the pre-formation stage of the WAIP intensity predictions based on those T2F(25) times led to large errors because the subsequent intensification phase of the combined WAIP started so late, and the selected analogs had small intensification rates (Figure 18d, left panel). While those WAIP predictions that had accurate T2F(25) times had accurate intensities during the pre-formation stage, the analogs selected for the intensification stage also had small intensification rates. Thus, it was only the two GEFS forecasts that predicted an early T2F(25) that had WAIP predictions with peak intensities of around 85 kt that would have verified well. By contrast, the overall performance was much better for combined WAIP intensity predictions with the T2F(35)s in Figure 18d (right panel). With early or on-time T2F(35) times, the pre-formation stage WAIP intensities are still accurate. Because the combined WAIP intensification stage starts early or on time, and all of the selected analogs have initial intensities of 35 ± 5 kt, the intensification rates for the T2F(35) forecasts (Figure 18d, right panel) better matched the Lingling intensification to at least the typhoon stage.

4.2. Validation Summary for Pre-TY Bualoi

The validation summary table for the ECEPS forecasts of pre-TY Bualoi (22W) T2F(25) and T2F(35) timing and position errors and the WAIP intensity forecasts is provided in Supplementary Figure S2. Recall that the ECEPS forecast of the pre-Bualoi circulation from 12 UTC 12 October was provided in Figure 8 and was discussed in detail in Section 3.1.3. That forecast was the first of 11 ECEPS forecasts of the T2F(35) of Bualoi, which was at 06 UTC 19 October when pre-Bualoi was near 10.6° N, 155.1° E, and all of those 11 forecasts are summarized in Supplementary Figure S2. The unique feature of Bualoi is that it began as a disturbance at a very low latitude (5° N) near the Dateline and took 3.5 days to become a Tropical Storm according to JTWC. In the first six ECEPS forecasts, the pre-Bualoi circulation was not in the initial conditions of the forecast, so the ECEPS was picking up the very early stages of the disturbance. Nevertheless, the predicted WCM maximum along all 11 of the WMVM track forecasts was consistently indicating that the Likely Storm Category was Typhoon (see Supplementary Figure S2, column 9.)
The WMVM tracks from all of the 12 h ECEPS forecasts with track differences < 300 km from the Bualoi track during the seven days prior to the T2F(35) are provided in Figure 19a. As described in Section 3.1.3, the first ECEPS track forecast from 12 UTC 12 October started the pre-Bualoi circulation with only 3 members at 00 UTC 17 October and an initial position at 6.4° N, 172.2° E (Figure 8b). Already from that first ECEPS forecast it was clear that this was a track bifurcation situation, and the WMVM track was in the southern track cluster with a west-northwestward path (Figure 8a). The next two ECEPS forecasts at 00 UTC and 12 UTC 13 October started the pre-Bualoi circulation farther to the west (169.6° E and 161.6° E; see Supplementary Figure S2, column 7) and were also members of the southern track cluster in Figure 19a. It was only the last three ECEPS forecasts (101712, 101812, and 101900) that predicted a well-defined recurvature-type WMVM track. These last two ECEPS forecasts not only had good initial positions, they also had accurately predicted the Bualoi path, but with excessive along-track speeds at the end (Figure 19a) since their tracks extend far beyond the ending of the WMVM track.
The time series plot of the T2F(25) and T2F(35) timing errors for these ECEPS forecasts of pre-Bualoi is provided in Figure 19c. The most important result was the highly accurate T2F(25) forecasts with only one of the 10 forecasts having an error as large as one day (early). This may be attributed to the initial intensities being surprisingly large (20, 19, 23, and 20 kt for the first four forecasts) for such low-latitude disturbances and the ECEPS model physics leading to the intensities quickly surpassing the threshold. By contrast, seven of the 11 forecasts of the T2F(35) had comparatively large, late forecasts by up to 2 days (Figure 19c). This may be attributed to the initial WCMs having reasonably small values, especially compared to what might be expected for the large initial intensities, but the rate of increase in WCM was slower for these low-latitude systems near the Dateline than the WCM increases for pre-TY Lingling (e.g., Figure 1c).
The T2F(25) and T2F(35) latitude and longitude errors in the ECEPS forecasts are plotted in Figure 19b. Even though the T2F(25) timing errors for the first four forecasts were small (Figure 19c), the T2F(25) longitudinal errors were to the east due to the initial positions of the WMVM track forecasts. By contrast, the T2F(35) late timing errors (Figure 19c) led to mainly westward longitudinal errors as the pre-Bualoi circulation had moved too far to the west along the WMVM track before the WCM values surpassed the threshold for T2F(35).
The poor performance of the combined WAIP intensity predictions based on the ECEPS forecasts of the pre-Bualoi T2F(25) can be explained from two factors (Figure 19d, left panel). First, the large initial ECEPS intensities that were followed by quick achievements of the T2F(25) threshold means the pre-formation stage of the combined WAIP, which has small errors [13], was not long enough to contribute to accurate intensity predictions. Second, recall that the intensification stage of the combined WAIP that begins at the T2F(25) is based on selection of 16 analog intensity evolutions for historical storms with similar tracks as the WMVM track forecast. As might be expected for analog storms with an initial intensity of 25 kt and originating at low latitudes near the Dateline in mid-October, they had slow intensification rates that led to the poor WAIP intensity predictions for all of the ECEPS forecasts of the pre-Bualoi T2F(25) in Figure 19d (left panel). By contrast, Bualoi intensified from 25 to 125 kt in around 4 days (dash-dot line in Figure 19d).
For most of the ECEPS pre-Bualoi T2F(35) forecasts used as input to the combined WAIP intensity predictions in Figure 19d (right), the performance was only slightly improved due to the late T2F(35) timing errors (Figure 19c) leading to a longer, more accurate pre-formation stage. Recall that it was only the last two ECEPS forecasts from 101812 and 101900 that had quite accurate T2F(35) timing (Figure 19c). Thus, the intensification stage of the combined WAIP started at almost the correct time, and the analog selection was for an initial intensity of 35 kt, which is satisfied by nearly all of the storms in the JTWC historical best-track file. Consequently, those two ECEPS forecasts led to WAIP intensity predictions of ~80 kt (Figure 19d, right panel), albeit being late and far smaller than the 125 kt peak intensity of TY Bualoi.
The validation summary table for the GEFS forecasts of pre-TY Bualoi T2F(25) and T2F(35) timing and position errors and the WAIP intensity forecasts is provided in Supplementary Figure S3. Recall that the GEFS forecast of the pre-Bualoi circulation from 00 UTC 13 October (12 h after the first ECEPS forecast discussed above) was provided in Figure 10 and discussed in detail in Section 3.1.3. Although the six-hourly GEFS had provided a total of 16 forecasts during the pre-formation (35 kt) period of Bualoi, only the seven forecasts originating at 00 UTC or 12 UTC are included in Supplementary Figure S3 to be consistent with the ECEPS forecast availability. That example of the GEFS 00 UTC 13 October forecast is the only one of these seven forecasts that did not have the pre-Bualoi circulation in its initial conditions. Indeed, the circulation did not start until Day 5.75, the initial longitudinal position was at 160° E rather than near the Dateline and was detected only 6 h (12 h) prior to the T2F(25) (T2F(35)). Thus, that early GEFS forecast of pre-Bualoi is expected to have some of the same inaccuracies as did the ECEPS forecasts discussed above, which will illustrate again the difficulties of predicting the formation of a low-latitude TC circulation near the Dateline.
The WMVM tracks from all of the 6 h GEFS forecasts during the seven days prior to the T2F(35) are provided in Figure 20a. As in the ECEPS track in Figure 19a, these GEFS track forecasts represent a bifurcation situation with a southern cluster of west-northwestward tracks and many more recurvature-type tracks. The time series plot of the T2F(25) and T2F(35) timing errors for these GEFS forecasts of pre-Bualoi is provided in Figure 20c. Note that the T2F(25, blue dot) and T2F(35, red dot) timing errors for the early 101300 GEFS forecast discussed above are quite small because the pre-Bualoi circulation was detected just 6 h (12 h) prior to these formation times. There is then a 2-day gap before the next sequence of these GEFS forecasts, for which the T2F(35) is based on the WCM evolutions have small timing errors, but the T2F(25) forecasts are erratic. In the next sequence of GEFS forecasts about 30 h later, it is the T2F(35) timing errors that are larger (and late) compared to the T2F(25) timing errors. In the final sequence of timing errors as the T2F are being approached, the T2F(25) timing errors are small (<1 day) and the T2F(35) timing errors are somewhat erratic and generally not as small as the T2F(25) errors.
Both the forecast time gaps and the lack of consistency in formation timing of the GEFS forecasts of T2F would be disconcerting to forecasters. These erratic T2F estimates then lead to erratic T2F position errors (Figure 20b). For example, the two GEFS forecasts from 101512 and 101518 with ~2-day early T2F(25) timing errors (Figure 20c) have eastward position errors of ~15 degrees longitude. Although both the T2F(25) and T2F(35) position errors are much smaller when the timing errors are smaller, the T2F(35) position errors tend to be to the west in association with the predominantly late timing errors.
The combined WAIP intensity performance for the pre-Bualoi circulations in the GEFS (Figure 20d) is similar to that from the ECEPS (Figure 19d). The exceptions are the 101512 and 101518 GEFS forecasts with the 2-day early T2F(25) timing errors described above, which start the intensification 2 days early but also have slow intensification rates as the selected analogs must have initial intensities of 15 ± 5 kt (Figure 20d, left panel). The other T2F(25) WAIP forecasts start later, have only short pre-formation periods of accurate intensities, and then also have slow intensification rates because of the starting positions of the WMVM forecasts at low latitudes near the Dateline. Due to the number of late T2F(35) timing errors, the pre-formation stage of the combined WAIP with small intensity errors was extended (Figure 20d, right panel) compared to the WAIP intensities for the T2F(25). However, these late T2F(35) times meant the combined WAIP intensification stage started late, which then contributed to subsequent under-forecasts of the intensity. The optimum combined WAIP intensity forecasts actually resulted from the two GEFS forecasts with very early T2F(25) times and a correct T2F(35). With that combination, the pre-formation stage of the combined WAIP had accurate intensity values and the intensification stage started at correct T2F(35) and the analog selections started at 35 ± 5 kt, and thus, the WAIP intensification rates were larger. However, analog storms that start at low latitudes near the Dateline take longer to reach maximum intensities, so some of the peak WAIP intensities in Figure 20d (right panel) do reach 80 kt, but this is long after TY Bualoi reached a peak intensity of 125 kt.

4.3. Validation Summary for Pre-Hurricane Kiko in Eastern Pacific

A validation summary similar to the TY Lingling summary in Figure 16 is shown for pre-Hurricane Kiko in the eastern North Pacific in Figure 21, except that no analog intensity forecasts are available in this basin. The National Hurricane Center (NHC) WBT track and intensity are provided in Figure 21a,b, respectively. Note that according to this WBT, Kiko had only briefly passed 140° W into the Area of Responsibility for the Central Pacific Hurricane Center. Recall from Section 3.2 that the 00 UTC 8 September ECEPS WMVM track forecast for pre-Kiko (Figure 12a) indicated that Kiko would approach the Hawaiian Islands on Day 15. The summary of that ECEPS forecast is on Line 4 of the validation summary table in Figure 21, in which the first nine columns are repeated from the summary table at the bottom of Figure 12. Columns 10–12 in green and columns 13–15 in blue on Line 4 of Figure 21 summarize the T2F(25) and T2F(35) timing and position errors respectively, which were very small errors considering the T2F(25) (T2F(35)) was on Day 3.0 (Day 4.75) of the 00 UTC 8 September ECEPS forecast.
All seven of the ECEPS WMVM track forecasts for Hurricane Kiko are displayed in Figure 22a. Note that these track forecasts had very small spread and three of the seven had predicted that Hawaii would be under threat by Day 15. The T2F(25) timing errors (Figure 22c, blue) are erratic, except for two forecasts that include the example 00 UTC 8 September ECEPS forecast in Figure 12. Except for the 090700 forecast, the T2F(35) timing errors include three zero errors, two six-hour early errors, and one 0.75-day late error. Considering that these T2F(35) predictions are valid 3–6 days in advance of the verifying T2F(35), this is a noteworthy achievement. As has been the case in the two western North Pacific cases in Section 4.1 and Section 4.2, large timing errors as for the T2F(25) forecasts in Figure 22c are accompanied by very large position errors (Figure 22b, blue). Although biased toward westward errors, the T2F(35) position errors are much smaller (Figure 22b, red) except for the 090700 forecast that had the large timing error in Figure 22c. With the accurate T2F(35) timing forecasts, and the long pre-formation (35 kt) period from 090906 until 091218 (Figure 21b), an analog technique similar to the WAIP in the western North Pacific would provide very accurate (<5 kt) intensity forecasts for pre-Hurricane Kiko. However, such an analog technique would not be expected to predict the rapid intensification of Kiko from 35 to 115 kt that occurred two days later (Figure 21b).
The corresponding validation summary for the GEFS forecasts of pre-Kiko is provided in Supplementary Figure S4. The GEFS forecast from 00 UTC 8 September (same time as for ECEPS described above) was presented in Figure 13 and described in Section 3.2. The storm characteristics and the T2F(25) and T2F(35) timing and position errors for that GEFS forecast are summarized in Line 2 of Supplementary Figure S4. The WMVM tracks for seven GEFS forecasts are plotted in Figure 23a. Note that these track forecasts are quite accurate, and the track spread during the first 7 days is quite small. However, these GEFS track forecasts then continue on the west-northwest path until dissipation, rather than turning to the west as Kiko did, and as in the ECEPS forecast in Figure 22a. In a three-forecast sequence from 090712 to 090800, the GEFS forecasts of the T2F(25, blue) and T2F(35, red) are only slightly late. In the later sequence from 090818 to 090906, the forecasts are early, and especially the T2F(25) is 1.5 days early. Unfortunately, the replacement of the NCEP computer on which the Marchok vortex tracker is executed resulted in a large number of missing GEFS forecasts prior to the verifying T2F times. While the T2F(25) and T2F(35) position errors in Figure 23b were small when the timing errors were small, some large eastward position errors were associated with early timing errors (e.g., the three T2F(25) errors for the 090818 to 090906 forecasts).

4.4. Validation Summary For Pre-Hurricane Lorenzo in Eastern Atlantic

A validation summary similar to the TY Lingling summary in Figure 16 is provided for pre-Hurricane Lorenzo in the eastern Atlantic in Figure 24. Because the analog intensity forecasts that are available in the Atlantic [10] do not include the pre-formation stage, which is of primary interest in this study, no peak intensities can be included here. The 12 UTC 16 September ECEPS example of a T2F forecast for pre-Lorenzo that was shown in Figure 14 is of interest because the pre-Lorenzo circulation moves off the west coast of Africa (Figure 24a) and becomes a Tropical Storm (Figure 24b). The storm characteristics and the T2F(25) and T2F(35) timing and position errors for that 12 UTC 16 September ECEPS forecast are summarized in Line 1 of Figure 24. Note that the circulation was predicted to have TC characteristics as defined in the Marchok vortex tracker on Day 4.75 (column 5, Line 1) at 9.71° N, 13.59° W (columns 6–7), and later have a maximum Warm Core Magnitude of 150.0 (column 8) that corresponds to a Likely Storm Category of Hurricane (column 9). It was not until the 092200 ECEPS forecast that the pre-Lorenzo circulation was in the initial conditions (column 5, Line 10). For the nine prior forecasts in Figure 24, the ECEPS model had been predicting an African wave that was going to become a TC after it crossed the west coast.
Among the 23 ECEPS WMVM track forecasts (Figure 25a), the first forecast from 12 UTC 16 September discussed above is one of two forecasts that ended near 30° N, 55° W after 15 days. The other track forecasts form a rather compact cluster that definitely indicates that this pre-Lorenzo circulation will recurve and continue northeastward toward northern Europe. The ECEPS-predicted T2F(25) times for pre-Lorenzo are very accurate (Figure 25c, blue), which is noteworthy as these times are being predicted as far in advance as 5 days. Recall that these T2F(25) forecasts are simply the weighted-mean of the intensities of the ensemble members as predicted by the ECEPS model. By contrast, the T2F(35) times are inferred from the weighted-mean of the upper- and lower-layer warm cores predicted by the ECEPS model. Thus, the early timing errors for the T2F(35) in Figure 25c (red) are associated with times that the pre-Lorenzo circulation was still over Africa, which likely indicates that the warm core of the African wave was misrepresented as an early TC warm core. After the circulation moved off the coast, the T2F(35) times predicted by the ECEPS are quite accurate. While the accurate T2F(25) times lead to small position errors (Figure 25b, blue), the early T2F(35) times are associated with large position errors to the east over Africa (Figure 25b, red).
The corresponding validation summary for the GEFS forecasts of pre-Lorenzo is provided in Supplementary Figure S5. The example GEFS forecast for Lorenzo displayed in Figure 14 and described in detail in Section 3.3 was for the same time (12 UTC 16 September) as the ECEPS forecast described above. The predicted storm characteristics and the T2F(25) and T2F(35) timing and position errors for that GEFS forecast are presented in Line 1 of Supplementary Figure S5. Even presenting only the 00 UTC and 12 UTC forecasts to be consistent with the ECEPS, there were 14 GEFS forecasts prior to the T2F(35). As was the case for the ECEPS forecasts of pre-Lorenzo, the GEFS model was also predicting the African wave that would become a Tropical Storm when it moved offshore.
The 27 GEFS WMVM track forecasts are plotted in Figure 26a. The track spread was already large during the first 7 days and became very large at recurvature and beyond. Whereas the ECEPS had very accurate T2F(25) times with errors less than a day (Figure 25c, blue), and while the GEFS T2F(25) timing errors are relatively small, they are quite erratic. These timing errors tend to be early while the pre-Lorenzo circulation is over Africa and tend to be late over the Atlantic. The T2F(35) timing errors are larger, also somewhat erratic, and tend to be early until 2 days prior to the verifying T2F(35) time when the timing errors become very small (Figure 25b, red). The reason for the early T2F(35) times over Africa is the same as described above for the ECEPS—the African wave warm core is misrepresented as a TC warm core. It is unclear why three forecast T2F(35) times are early after the pre-Lorenzo circulation is over the Atlantic. Since the T2F(25) timing errors are mostly small, the corresponding T2F(25) position errors are mostly small, but somewhat erratic (Figure 26b, blue). By contrast, the more erratic T2F(35) times also lead to highly erratic position errors (Figure 26b, red). The predominance of too-early timing errors leads to a predominance of eastward T2F(35) position errors with magnitudes of 5–10 degrees longitude (Figure 26b, red).

4.5. Summary of the Validations

For most of the example forecasts in Section 3.1, Section 3.2 and Section 3.3, the preference was given to the earliest forecast that had a WMVM track that was within <300 km of the WBT, because such examples would demonstrate the potential for earlier guidance to begin disaster preparedness activities. The objective of this section has been to document the T2F timing and position errors for all of the ECEPS and GEFS forecasts in advance of the verifying T2F to illustrate the consistency in time of the T2F forecasts. In the case of pre-Lingling (Figure 17), the ECEPSs first forecast of T2F(35) was six days in advance and a majority of the timing errors were 0.0. The first T2F(25) forecast of Lingling was four days in advance and all of the timing errors were ≤0.75 days. In the case of pre-Bualoi, the first ECEPS forecast was six days in advance and the T2F(25) forecasts were especially good, as almost all timing errors were ≤0.5 days (Figure 19). However, 50% of the T2F(35) timing errors were approximately 2 days late, which was attributed to large variability in the initial positions. Although the first Bualoi T2F forecasts by the GEFS were seven days in advance, there were then major gaps and the timing errors were erratic, but the T2F(25) timing errors were larger than 1.0 days on only two occasions (Figure 20). The first ECEPS forecast of T2F(35) for Hurricane Kiko was six days in advance, and except for one forecast, the timing errors were ≤0.75 days (Figure 21). However, the T2F(25) timing errors were erratic and ranged from 2.75 days late to 2.5 days early. The first GEFS forecast for Kiko was 3 days (5 days) in advance of T2F(25) (T2F(35)) (Figure 23), but then there was an immediate gap and a 2 day (4 day) missing data period before the verifying T2F(25) (T2F(35)) time. Finally, there were a lot of ECEPS forecasts for pre-Lorenzo starting from six (seven) days in advance of the T2F(25) (T2F(35)). The T2F(25) timing errors were very small with only one forecast timing error as large as 0.75 days (Figure 25). As noted above, large early T2F(35) timing errors for pre-Lorenzo may be attributed to the African wave warm core being misinterpreted as a pre-TC warm core. A similar starting time and a similar T2F(35) timing errors were documented for the GEFS forecasts of Lorenzo (Figure 26). While almost all of the T2F(25) timing errors were <1 day, these timing errors had considerable temporal variability.
In summary, the objective of providing T2F guidance five days in advance has been achieved. In most of these pre-typhoon or pre-hurricane forecasts by either the ECEPS or the GEFS, the T2F(35) was the more consistent and had the smallest timing errors. However, the T2F(25) timing was more reliable for pre-Lorenzo, and the T2F(35) and T2F(25) were not always consistent. Thus, this guidance as to two formation times/intensities from two ensemble models must be interpreted by the human forecaster, who will have knowledge of synoptic situations and satellite imagery of the disturbance.

5. Conclusions

As noted in the Introduction, a recent survey [1] of forecasters at the global TC warning centers found that most centers issue probability guidance of the likelihood that a TC will form during 0–48 h or 0–120 h. In some centers, the probability may only be expressed as High, Medium, or Low. Another finding from the survey was that dynamic ensemble models were not widely used in the preparation of that probability guidance, even though recent studies [2,4] have documented skill in TC activity forecasts with deterministic global models and their consensus. Where an ensemble (or a consensus) has been utilized, these studies have typically calculated simple ensemble means, which assumes all ensemble members are equally likely, and in an ensemble track forecast that will result in a slow along-track bias as the track spread increases.
This study has used the Marchok vortex tracker outputs from the ECMWF ensemble and the NCEP ensemble to provide precise Time-to-Formation (T2F) timings and positions along Weighted-Mean Vector Motion (WMVM) track forecasts. In the WMVM calculation, the largest (smallest) weight is given to the ensemble member motion vector that is closest (farthest) from the most recent 12 h WMVM vector. One issue with these ensemble models during the TC pre-formation stage is the uncertainty in the initial and the subsequent early storm positions that are based on only a few ensemble member track positions. In the WMVM procedure, the minimum number of ensemble members to form an ensemble storm track is normally set at three, but even a weighted-mean of this small number of member track positions can lead to initial ensemble storm positions and storm motion vectors that are erratic.
The T2F(25) timing is defined to be when the weighted-mean intensities of the various ensemble members exceed the 25 kt threshold (22.51 kt for the ECEPS). In this calculation, the weighting factors for the members are the same as for the WMVM calculation, so that the largest (smallest) weight is given to the intensity of the ensemble member motion vector that is closest (farthest) from the most recent 12 h WMVM vector. This use of a weighted-mean intensity is very important in this study as the TC intensity changes after 72 h are highly impacted by the TC track, and the objective in this study has been to also specify as precisely as possible the position along the WMVM track at that time the T2F(25) threshold has been achieved. Since the ensemble member intensity is provided from the Marchok vortex tracker, the calculation of the weighted-mean intensity is straight-forward, and the 6 h time that that intensity exceeds the 25 kt threshold is the T2F(25). As described in Section 4.5, for some TCs, the T2F(25) forecasts can be very accurate, but for other TCs, the T2F(25) times are not consistent between forecasts. Especially in the case of the GEFS, the initial intensities are often too high, and an adjustment has been applied to make the initial intensity equal to the WBT intensity if available.
Because the intensities do not continue to increase steadily after 25 kt (especially for the ECEPS), a similar calculation is not used to estimate the T2F(35). Instead, two Marchok vortex tracker [8] genesis parameters along the ensemble member tracks are utilized to calculate the weighted-mean (same weighting factors as for the WMVM track forecast) Warm Core Magnitude (WCM) along the WMVM track forecast. Because the Lower- (Upper)-layer is 900−600 mb (600−300 mb), the Upper-layer warm core is weighted two times the Lower-layer warm core in the WCM to reflect the (1/p) factor in the hypsometric equation. The original two WCM thresholds that correspond to an early versus a later achievement of the T2F(35) have been re-calibrated after the 2019 season for both ensemble models and for the three TC basins. As indicated in the example forecasts in the three basins described in Section 3, and the validations of the two typhoons and two hurricanes in Section 4, the early T2F(35) timing and position errors were often smaller and more consistent than the T2F(25) errors. Another noteworthy achievement from this relating the intensity to the weighted-mean WCM evolution was predictions by both the ECEPS and the GEFs that TS Peipah would not intensify to a typhoon even though it occurred in mid-September and had a long classic recurvature track.
To provide more guidance as to the intensity changes starting from the first detection of the pre-TC circulation in the ECEPS and GEFS forecasts, the combined three-stage, 7-day Weighted Analog Intensity Pacific (WAIP) prediction technique for the western North Pacific [13] has been provided in that basin only. During the pre-formation stage, the intensity evolution represented by a square function between an initial intensity and either 25 or 35 kt is highly accurate when the T2F is accurate. During the second intensification stage of the combined WAIP starting from the T2F, the intensity evolution is the weighted-mean intensities of 16 analogs that have tracks that closely match the 7-day WMVM track forecast after the T2F, and have initial intensities that closely match either 25 or 35 kt. Although the combined WAIP provided some useful predictions of the intensification to early typhoon stage when the T2F(35) was accurate and the initial intensity of 35 resulted in representative analog selections, it did not predict the continued rapid intensification of the two typhoons and two hurricanes in this study. A future task is to improve the performance of the combined 7-day WAIP intensity predictions in rapid intensification situations (as determined from the rates of WCM increases) by selecting the Cluster 1 analogs that have the larger maximum intensities [13], and test a new technique that is being developed to predict rapid intensification events based on the size of the TC.
One shortcoming of this post-season validation of the ECEPS and GEFS performance in providing the WCM-based estimates of the T2F(35) is that the benefits of JTWC forecaster-satellite analyst collaboration cannot be reproduced. As described above, there are uncertainties in the track forecasts, uncertainties in the Storm Start times and positions, and uncertainties in the satellite and other observations in assessing the pre-TC circulation position, intensity, and structure. Furthermore, there are uncertainties in the capability of the ensemble model physics to predict the environmental versus the internal factors during the TC pre-formation stage. One of the factors in the decision to first focus this study on the western North Pacific TCs in cooperation with the JTWC is that they have a forecaster/analyst dedicated to analyzing the TC formations each 12 h in their Area of Responsibility over the next 14 days. For example, if the first WBT file entry is 30 h (84 h) before the Storm Start time for the ECEPS (GEFS), this means the JTWC satellite analysts and forecasters over the previous three (seven) 12 h shifts would have been following the feature(s) in the satellite imagery that became the pre-TC circulation in the ECEPS (GEFS). The benefits of this human forecaster-satellite analyst collaboration in assessing the ensemble model outputs cannot be measured in this study, but the expectation is that the earlier a satellite feature of a pre-TC circulation has been consistently monitored, the more accurate the current analysis of that feature will be.
Although it did not affect the primary conclusions of this study, gaps or missing datasets in the sequences of GEFS forecasts and ECEPS forecasts, as occurred for some of the TCs examined, would be very disconcerting for forecasters. As indicated in the text, most of the missing datasets during the late-August to mid-October 2019 period have been attributed to the NCEP replacement of the computers used for the off-line post-processing of the numerical model outputs, such as the Marchok TC vortex tracker. If such an off-line product fails to process at night or on weekends when the person responsible for that product is not on duty, that person must regenerate the model outputs necessary for the post-processing. When the NCEP computers were being replaced as well, some vortex tracker datasets were missed. After the season, co-author Tim Marchok received permission to load his TC vortex tracker program on the online NCEP computers that always have backup so that no gaps or missing datasets should now occur. Just as importantly, Tim Marchok extended his TC vortex tracker to the Southern Hemisphere and also to the North Indian Ocean and Arabian Sea. Thus, our technique for earlier TC formation forecasts and 7-day intensity predictions after the T2F along the WMVM track forecasts of the 15-day ECEPS and 16-day GEFS could now be extended to all TC basins in the world.

Supplementary Materials

The following are available online at https://www.mdpi.com/2073-4433/11/9/1002/s1, Figure S1. Validation summary table for the GEFS forecasts for pre-TY Lingling with (a) Joint Typhoon Warning Center (JTWC) Working Best Track (WBT) positions shown at 00 UTC on the MODA; (b) JTWC WBT intensities (kt) at MODAHR with the times of T2F(25) and T2F(35) as indicated in green and blue boxes below the plots in panels (a) and (b), along with the peak intensity in the red box. The first nine columns are storm characteristics that are repeated from the bottom of each forecast summary (e.g., Line 2 of the table is from the bottom of Figure 3). Columns 10-12 in green are the T2F(25) timing (days) and position errors in latitude and longitude, Columns 13-15 in blue are the T2F(35) timing and position errors for the early T2F(35), Column 16 in blue is the late T2F(35) timing error, and Columns 17-19 are the peak combined WAIP intensity forecasts for each of the three T2Fs. Figure S2. Validation summary table for the ECEPS forecasts for pre-TY Bualoi with (a) Joint Typhoon Warning Center (JTWC) Working Best Track (WBT) positions shown at 00 UTC on the MODA; (b) JTWC WBT intensities (kt) at MODAHR with the times of T2F(25) and T2F(35) as indicated in green and blue boxes below the plots in panels (a) and (b), along with the peak intensity in the red box. The first nine columns are storm characteristics that are repeated from the bottom of each forecast summary (e.g., Line 1 of the table is from the bottom of Figure 8). Columns 10-12 in green are the T2F(25) timing (days) and position errors in latitude and longitude, Columns 13-15 in blue are the T2F(35) timing and position errors for the early T2F(35), Column 16 in blue is the late T2F(35) timing error, and Columns 17-19 are the peak combined WAIP intensity forecasts for each of the three T2Fs. Figure S3. Validation summary table for the GEFS forecasts for pre-TY Bualoi with (a) Joint Typhoon Warning Center (JTWC) Working Best Track (WBT) positions shown at 00 UTC on the MODA; (b) JTWC WBT intensities (kt) at MODAHR with the times of T2F(25) and T2F(35) as indicated in green and blue boxes below the plots in panels (a) and (b), along with the peak intensity in the red box. The first nine columns are storm characteristics that are repeated from the bottom of each forecast summary (e.g., Line 1 of the table is from the bottom of Figure 10). Columns 10-12 in green are the T2F(25) timing (days) and position errors in latitude and longitude, Columns 13-15 in blue are the T2F(35) timing and position errors for the early T2F(35), Column 16 in blue is the late T2F(35) timing error, and Columns 17-19 are the peak combined WAIP intensity forecasts for each of the three T2Fs. Figure S4. Validation summary table for the GEFS forecasts for pre-HU Kiko with (a) National Hurricane Center (NHC) Working Best Track (WBT) positions shown at 00 UTC on the MODA; (b) NHC WBT intensities (kt) at MODAHR with the times of T2F(25) and T2F(35) as indicated in green and blue boxes below the plots in panels (a) and (b), along with the peak intensity in the red box. The first nine columns are storm characteristics that are repeated from the bottom of each forecast summary (e.g., Line 2 of the table is from the bottom of Figure 13). Columns 10-12 in green are the T2F(25) timing (days) and position errors in latitude and longitude, Columns 13-15 in blue are the T2F(35) timing and position errors for the early T2F(35), and Column 16 in blue is the late T2F(35) timing error. Figure S5. Validation summary table for the GEFS forecasts for pre-TY Lorenzo with (a) National Hurricane Center (NHC) Working Best Track (WBT) positions shown at 00 UTC on the MODA; (b) NHC WBT intensities (kt) at MODAHR with the times of T2F(25) and T2F(35) as indicated in green and blue boxes below the plots in panels (a) and (b), along with the peak intensity in the red box. The first nine columns are storm characteristics that are repeated from the bottom of each forecast summary (e.g., Line 1 of the table is from the bottom of Figure 15). Columns 10-12 in green are the T2F(25) timing (days) and position errors in latitude and longitude, Columns 13-15 in blue are the T2F(35) timing and position errors for the early T2F(35), and Column 16 in blue is the late T2F(35) timing error.

Author Contributions

Conceptualization, R.L.E. and H.-C.T. have together published journal articles since 2014 on the ensemble storm Weighted-Mean Vector Motion (WMVM) track forecasts, and H.-C.T. and R.L.E. have jointly over five years developed the combined Weighted Analog Intensity Prediction (Pacific), and T.P.M. conceived and developed the tropical cyclone vortex tracker. Methodology, H.-C.T. and R.L.E. have jointly conceived the methodology of the Warm Core Magnitude (WCM) with the assistance of T.P.M. Software coding for the Warm Core Magnitude has been done by H.-C.T., W.-C.C., and T.P.M. has continued to upgrade the vortex tracker code. Validation, R.L.E. and H.-C.T. have jointly conceived the validation technique. Writing, R.L.E. has been responsible for the text, and H.-C.T. and W.-C.C. have been responsible for creating the figures. All authors have read and agreed to the published version of the manuscript.

Funding

R.L.E. and H.C.T. had a two-year Joint Hurricane Testbed grant from the NOAA OAR Office of Weather and Air Quality (OWAQ); R.L.E. is also funded by the Office of Naval Research Grant N00014-19-1-2465. H.C.T. and W.C.C. are supported by the Taiwan Ministry of Science and Technology (MOST 108-2111-M-032-002-MY3) and Central Weather Bureau (1092110B). T.P.M.’s participation was internally funded at the Geophysical Fluid Dynamics Laboratory.

Acknowledgments

Penny Jones is thanked for her excellent contributions to the preparation of the manuscript.

Conflicts of Interest

The authors declare no conflict of interest. The funders had no role in the design of the study, the analyses or interpretation of the data, in the writing of the manuscript, or in the decision to publish the results.

References

  1. Titley, H.A.; Yamaguchi, M.; Magnusson, L. Current and potential use of ensemble forecasts in operational TC forecasting: Results from a global forecaster survey. Trop. Cyclone Res. Rev. 2019, 8, 166–180. [Google Scholar] [CrossRef]
  2. Yamaguchi, M.; Vitart, F.; Lang, S.; Magnusson, L.; Elsberry, R.L.; Elliott, G.; Kyouda, M.; Nakazawa, T. Global distribution of the skill of the tropical cyclone activity forecasts in short- to medium-range time-scales. Weather Forecast. 2015, 30, 1695–1709. [Google Scholar] [CrossRef]
  3. Grijin, V.D.; Paulsen, J.E.; Lalaurette, F.; Leutbecher, M. Early medium-range forecasts of tropical cyclones. ECMWF Newsl. 2009, 102, 7–14. [Google Scholar]
  4. Halperin, D.J.; Hart, R.E.; Fuelberg, H.E.; Cassuth, J.H. The development and evaluation of a statistical-dynamic tropical cyclone genesis guidance tool. Weather Forecast. 2017, 32, 27–46. [Google Scholar] [CrossRef]
  5. Elsberry, R.L.; Jordan, M.S.; Vitart, F. Predictability of tropical cyclone events on intraseasonal timescales with ECMWF monthly forecast model. Asia-Pac. J. Atmos. Sci. 2010, 46, 135–153. [Google Scholar] [CrossRef] [Green Version]
  6. Elsberry, R.L.; Jordan, M.S.; Vitart, F. Evaluation of the ECMWF 32-day ensemble predictions during 2005 season of western North Pacific tropical cyclone events on intraseasonal timescales. Asia-Pac. J. Atmos. Sci. 2011, 47, 305–318. [Google Scholar] [CrossRef]
  7. Elsberry, R.L.; Tsai, H.-C.; Jordan, M.S. Extended-range forecasts of Atlantic tropical cyclone events during 2012 using the ECMWF 32-day ensemble predictions. Weather Forecast. 2014, 29, 271–288. [Google Scholar] [CrossRef]
  8. Marchok, T.P. How the NCEP tropical cyclone tracker works. In Preprints, 25th Conf. on Hurricanes and Tropical Meteorology; Amer. Meteor. Soc.: San Diego, CA, USA, 2002; pp. 21–22. [Google Scholar]
  9. Tsai, H.-C.; Elsberry, R.L. Seven-day intensity and intensity spread predictions for western North Pacific tropical cyclones. Asia-Pac. J. Atmos. Sci. 2015, 51, 331–342. [Google Scholar] [CrossRef]
  10. Tsai, H.-C.; Elsberry, R.L. Seven-day intensity and intensity spread predictions for Atlantic tropical cyclones. Weather Forecast. 2017, 32, 141–147. [Google Scholar] [CrossRef]
  11. Tsai, H.-C.; Elsberry, R.L. Ending storm version of the 7-day weighted analog intensity prediction technique for western North Pacific tropical cyclones. Weather Forecast. 2017, 32, 2229–2235. [Google Scholar] [CrossRef]
  12. Tsai, H.-C.; Elsberry, R.L. Seven-day intensity and intensity spread predictions in bifurcation situations with guidance-on-guidance for western North Pacific tropical cyclones. Asia-Pac. J. Atmos. Sci. 2018, 54, 421–430. [Google Scholar] [CrossRef]
  13. Tsai, H.-C.; Elsberry, R.L. Combined three-stage 7-day weighted analog intensity prediction technique for western North Pacific tropical cyclones: Demonstration of optimum performance. Weather Forecast. 2019, 34, 1979–1998. [Google Scholar] [CrossRef]
  14. Hart, R.E. A cyclone phase space derived from thermal wind and thermal asymmetry. Mon. Weather Rev. 2003, 131, 585–598. [Google Scholar] [CrossRef]
Figure 1. Summary of the ECEPS forecast from 00 UTC 30 August 2019 for the pre-TY Lingling (15W) circulation: (a) WMVM track (red line) and ensemble member tracks (grey lines), (b) table of Latitude and Longitude WMVM positions and number of ensemble members as a function of MODAHR, (c) Warm Core Magnitudes (WCM) along the WMVM track each 6 h, and (d) table of the WCM values and the intensity along the WMVM track each 6 h. A summary table is provided at the bottom of the key features of the forecast (see text), the T2F(25) time in green, two T2F(35) times in blue, and the three WAIP Ending Times corresponding to the three T2Fs.
Atmosphere 11 01002 g001
Figure 2. WAIP intensity forecasts (kt) as a function of Month/Day/Hours based on the T2F(25, green), early T2F(35, blue), and late T2F(35, red) for the ECEPS forecast in Figure 1.
Atmosphere 11 01002 g002
Figure 3. Summary as in Figure 1, except for the GEFS forecast from 00 UTC 30 August 2019. (a) WMVM track (red line) and ensemble member tracks (grey lines), (b) table of Latitude and Longitude WMVM positions and number of ensemble members as a function of MODAHR, (c) Warm Core Magnitudes (WCM) along the WMVM track each 6 h, and (d) table of the WCM values and the intensity along the WMVM track each 6 h. A summary table is provided at the bottom of the key features of the forecast (see text), the T2F(25) time in green, two T2F(35) times in blue, and the three WAIP Ending Times corresponding to the three T2Fs.
Atmosphere 11 01002 g003
Figure 4. WAIP intensity forecasts as in Figure 2, except for the GEFS forecast in Figure 3.
Atmosphere 11 01002 g004
Figure 5. Summary as in Figure 1, except for the ECEPS forecast from 12 UTC 13 September 2019 for the pre-TS Peipah (17W) circulation. (a) WMVM track (red line) and ensemble member tracks (grey lines), (b) table of Latitude and Longitude WMVM positions and number of ensemble members as a function of MODAHR, (c) Warm Core Magnitudes (WCM) along the WMVM track each 6 h, and (d) table of the WCM values and the intensity along the WMVM track each 6 h. A summary table is provided at the bottom of the key features of the forecast (see text), the T2F(25) time in green, two T2F(35) times in blue, and the three WAIP Ending Times corresponding to the three T2Fs.
Atmosphere 11 01002 g005
Figure 6. WAIP intensity forecasts as in Figure 2, except for the ECEPS forecast (solid line) in Figure 5 and for the GEFS forecast (dashed line) in Figure 7.
Atmosphere 11 01002 g006
Figure 7. Summary as in Figure 1, except for the GEFS forecast from 12 UTC 13 September for the pre-TS Peipah (17W) circulation. (a) WMVM track (red line) and ensemble member tracks (grey lines), (b) table of Latitude and Longitude WMVM positions and number of ensemble members as a function of MODAHR, (c) Warm Core Magnitudes (WCM) along the WMVM track each 6 h, and (d) table of the WCM values and the intensity along the WMVM track each 6 h. A summary table is provided at the bottom of the key features of the forecast (see text), the T2F(25) time in green, two T2F(35) times in blue, and the three WAIP Ending Times corresponding to the three T2Fs.
Atmosphere 11 01002 g007
Figure 8. Summary as in Figure 1, except for the ECEPS forecast from 12 UTC 12 October for the pre-TY Bualoi (22W) circulation. (a) WMVM track (red line) and ensemble member tracks (grey lines), (b) table of Latitude and Longitude WMVM positions and number of ensemble members as a function of MODAHR, (c) Warm Core Magnitudes (WCM) along the WMVM track each 6 h, and (d) table of the WCM values and the intensity along the WMVM track each 6 h. A summary table is provided at the bottom of the key features of the forecast (see text), the T2F(25) time in green, two T2F(35) times in blue, and the three WAIP Ending Times corresponding to the three T2Fs.
Atmosphere 11 01002 g008
Figure 9. WAIP intensity forecasts as in Figure 2, except for the ECEPS forecast in Figure 8.
Atmosphere 11 01002 g009
Figure 10. Summary as in Figure 1, except for the GEFS forecast from 00 UTC 13 October for the pre-TY Bualoi (22W) circulation. (a) WMVM track (red line) and ensemble member tracks (grey lines), (b) table of Latitude and Longitude WMVM positions and number of ensemble members as a function of MODAHR, (c) Warm Core Magnitudes (WCM) along the WMVM track each 6 h, and (d) table of the WCM values and the intensity along the WMVM track each 6 h. A summary table is provided at the bottom of the key features of the forecast (see text), the T2F(25) time in green, two T2F(35) times in blue, and the three WAIP Ending Times corresponding to the three T2Fs.
Atmosphere 11 01002 g010
Figure 11. WAIP intensity forecasts as in Figure 2 except for the GEFS forecast in Figure 10.
Atmosphere 11 01002 g011
Figure 12. Summary as in Figure 1, except for the ECEPS forecast from 00 UTC 8 September 2019 for the pre-Hurricane Kiko (15E) in the eastern North Pacific. (a) WMVM track (red line) and ensemble member tracks (grey lines), (b) table of Latitude and Longitude WMVM positions and number of ensemble members as a function of MODAHR, (c) Warm Core Magnitudes (WCM) along the WMVM track each 6 h, and (d) table of the WCM values and the intensity along the WMVM track each 6 h. A summary table is provided at the bottom of the key features of the forecast (see text), the T2F(25) time in green, two T2F(35) times in blue, and the three WAIP Ending Times corresponding to the three T2Fs.
Atmosphere 11 01002 g012
Figure 13. Same as in Figure 12, except GEFS instead of ECEPS. (a) WMVM track (red line) and ensemble member tracks (grey lines), (b) table of Latitude and Longitude WMVM positions and number of ensemble members as a function of MODAHR, (c) Warm Core Magnitudes (WCM) along the WMVM track each 6 h, and (d) table of the WCM values and the intensity along the WMVM track each 6 h. A summary table is provided at the bottom of the key features of the forecast (see text), the T2F(25) time in green, two T2F(35) times in blue, and the three WAIP Ending Times corresponding to the three T2Fs.
Atmosphere 11 01002 g013
Figure 14. Summary as in Figure 1, except for the ECEPS forecast from 12 UTC 16 September 2019 for the pre-Hurricane Lorenzo (13L) in the Atlantic. (a) WMVM track (red line) and ensemble member tracks (grey lines), (b) table of Latitude and Longitude WMVM positions and number of ensemble members as a function of MODAHR, (c) Warm Core Magnitudes (WCM) along the WMVM track each 6 h, and (d) table of the WCM values and the intensity along the WMVM track each 6 h. A summary table is provided at the bottom of the key features of the forecast (see text), the T2F(25) time in green, two T2F(35) times in blue, and the three WAIP Ending Times corresponding to the three T2Fs.
Atmosphere 11 01002 g014
Figure 15. Same as Figure 14, except GEFS instead of ECEPS. (a) WMVM track (red line) and ensemble member tracks (grey lines), (b) table of Latitude and Longitude WMVM positions and number of ensemble members as a function of MODAHR, (c) Warm Core Magnitudes (WCM) along the WMVM track each 6 h, and (d) table of the WCM values and the intensity along the WMVM track each 6 h. A summary table is provided at the bottom of the key features of the forecast (see text), the T2F(25) time in green, two T2F(35) times in blue, and the three WAIP Ending Times corresponding to the three T2Fs.
Atmosphere 11 01002 g015
Figure 16. Validation summary table for the ECEPS forecasts for pre-TY Lingling with (a) Joint Typhoon Warning Center (JTWC) Working Best Track (WBT) positions shown at 00 UTC on the MODA, and (b) JTWC WBT intensities (kt) at MODAHR with the times of T2F(25) and T2F(35) as indicated in green and blue boxes below the plots in panels (a) and (b), along with the peak intensity in the red box. The first nine columns are storm characteristics that are repeated from the bottom of each forecast summary (e.g., Line 5 of the table is from the bottom of Figure 1). Columns 10–12 in green are the T2F(25) timing (days) and position errors in latitude and longitude, Columns 13–15 in blue are the T2F(35) timing and position errors for the early T2F(35), Column 16 in blue is the late T2F(35) timing error, and Columns 17–19 are the peak combined WAIP intensity forecasts for each of the three T2Fs.
Atmosphere 11 01002 g016
Figure 17. (a) Weighted-Mean Vector Motion (WMVM) track forecasts by the ECEPS for the times in the inset, (b) T2F(25, blue) and T2F(35, red) position errors relative to verifying T2F positions, (c) T2F(25, blue) and T2F(35, red) timing errors (Days) relative to verifying T2F times, and (d) combined WAIP intensity forecasts based on the T2F(25) in left panel and T2F(35) in right panel for the ECEPS forecasts of pre-TY Lingling (see inset) versus the JTWC WBT intensity (dash-dot line).
Atmosphere 11 01002 g017
Figure 18. Same as Figure 17, except GEFS instead of ECEPS. (a) Weighted-Mean Vector Motion (WMVM) track forecasts by the GEFS for the times in the inset, (b) T2F(25, blue) and T2F(35, red) position errors relative to verifying T2F positions, (c) T2F(25, blue) and T2F(35, red) timing errors (Days) relative to verifying T2F times, and (d) combined WAIP intensity forecasts based on the T2F(25) in left panel and T2F(35) in right panel for the GEFS forecasts of pre-TY Lingling (see inset) versus the JTWC WBT intensity (dash-dot line).
Atmosphere 11 01002 g018
Figure 19. Same as Figure 17, except for ECEPS forecasts instead of pre-TY Bualoi. (a) Weighted-Mean Vector Motion (WMVM) track forecasts by the ECEPS for the times in the inset, (b) T2F(25, blue) and T2F(35, red) position errors relative to verifying T2F positions, (c) T2F(25, blue) and T2F(35, red) timing errors (Days) relative to verifying T2F times, and (d) combined WAIP intensity forecasts based on the T2F(25) in left panel and T2F(35) in right panel for the ECEPS forecasts of pre-TY Lingling (see inset) versus the JTWC WBT intensity (dash-dot line).
Atmosphere 11 01002 g019
Figure 20. Same as Figure 19, except for GEFS instead of ECEPS. (a) Weighted-Mean Vector Motion (WMVM) track forecasts by the GEFS for the times in the inset, (b) T2F(25, blue) and T2F(35, red) position errors relative to verifying T2F positions, (c) T2F(25, blue) and T2F(35, red) timing errors (Days) relative to verifying T2F times, and (d) combined WAIP intensity forecasts based on the T2F(25) in left panel and T2F(35) in right panel for the GEFS forecasts of pre-TY Lingling (see inset) versus the JTWC WBT intensity (dash-dot line).
Atmosphere 11 01002 g020
Figure 21. Same as Figure 16, except for pre-Hurricane Kiko with National Hurricane Center WBT, and omitting WAIP maximum intensities. (a) Joint Typhoon Warning Center (JTWC) Working Best Track (WBT) positions shown at 00 UTC on the MODA, and (b) JTWC WBT intensities (kt) at MODAHR with the times of T2F(25) and T2F(35) as indicated in green and blue boxes below the plots in panels (a) and (b), along with the peak intensity in the red box. The first nine columns are storm characteristics that are repeated from the bottom of each forecast summary (e.g., Line 5 of the table is from the bottom of Figure 1). Columns 10–12 in green are the T2F(25) timing (days) and position errors in latitude and longitude, Columns 13–15 in blue are the T2F(35) timing and position errors for the early T2F(35), Column 16 in blue is the late T2F(35) timing error, and Columns 17–19 are the peak combined WAIP intensity forecasts for each of the three T2Fs.
Atmosphere 11 01002 g021
Figure 22. Same as for Figure 17, except for pre-Hurricane Kiko and omitting panel. (a) Weighted-Mean Vector Motion (WMVM) track forecasts by the ECEPS for the times in the inset, (b) T2F(25, blue) and T2F(35, red) position errors relative to verifying T2F positions, (c) T2F(25, blue) and T2F(35, red) timing errors (Days) relative to verifying T2F times.
Atmosphere 11 01002 g022
Figure 23. Same as Figure 22, except for GEFS versus ECEPS. (a) Weighted-Mean Vector Motion (WMVM) track forecasts by the ECEPS for the times in the inset, (b) T2F(25, blue) and T2F(35, red) position errors relative to verifying T2F positions, (c) T2F(25, blue) and T2F(35, red) timing errors (Days) relative to verifying T2F times.
Atmosphere 11 01002 g023
Figure 24. Same as Figure 16, except for pre-Hurricane Lorenzo with National Hurricane Center WBT, and omitting WAIP maximum intensities. Validation summary table for the ECEPS forecasts for pre-TY Lingling with (a) Joint Typhoon Warning Center (JTWC) Working Best Track (WBT) positions shown at 00 UTC on the MODA, and (b) JTWC WBT intensities (kt) at MODAHR with the times of T2F(25) and T2F(35) as indicated in green and blue boxes below the plots in panels (a) and (b), along with the peak intensity in the red box. The first nine columns are storm characteristics that are repeated from the bottom of each forecast summary (e.g., Line 5 of the table is from the bottom of Figure 1). Columns 10–12 in green are the T2F(25) timing (days) and position errors in latitude and longitude, Columns 13–15 in blue are the T2F(35) timing and position errors for the early T2F(35), Column 16 in blue is the late T2F(35) timing error, and Columns 17–19 are the peak combined WAIP intensity forecasts for each of the three T2Fs.
Atmosphere 11 01002 g024
Figure 25. Same as Figure 17, except for pre-Hurricane Lorenzo and omitting panel. (a) Weighted-Mean Vector Motion (WMVM) track forecasts by the ECEPS for the times in the inset, (b) T2F(25, blue) and T2F(35, red) position errors relative to verifying T2F positions, (c) T2F(25, blue) and T2F(35, red) timing errors (Days) relative to verifying T2F times.
Atmosphere 11 01002 g025
Figure 26. Same as Figure 25, except for GEFS versus ECEPS. (a) Weighted-Mean Vector Motion (WMVM) track forecasts by the ECEPS for the times in the inset, (b) T2F(25, blue) and T2F(35, red) position errors relative to verifying T2F positions, (c) T2F(25, blue) and T2F(35, red) timing errors (Days) relative to verifying T2F times.
Atmosphere 11 01002 g026

