Article

Analysis of Lightning and Precipitation Activities in Three Severe Convective Events Based on Doppler Radar and Microwave Radiometer over the Central China Region

1
Hubei Key Laboratory for Heavy Rain Monitoring and Warning Research, Institute of Heavy Rain, China Meteorological Administration, Wuhan 430205, China
2
Hubei Lightning Protecting Center, Wuhan 430074, China
*
Author to whom correspondence should be addressed.
Atmosphere 2019, 10(6), 298; https://doi.org/10.3390/atmos10060298
Submission received: 27 March 2019 / Revised: 22 May 2019 / Accepted: 23 May 2019 / Published: 1 June 2019
(This article belongs to the Special Issue Severe Storm)

Abstract

:
Hubei Province Region (HPR), located in Central China, is a concentrated area of severe convective weather. Three severe convective processes occurred in HPR were selected, namely 14–15 May 2015 (Case 1), 6–7 July 2013 (Case 2), and 11–12 September 2014 (Case 3). In order to investigate the differences between the three cases, the temporal and spatial distribution characteristics of cloud–ground lightning (CG) flashes and precipitation, the distribution of radar parameters, and the evolution of cloud environment characteristics (including water vapor (VD), liquid water content (LWC), relative humidity (RH), and temperature) were compared and analyzed by using the data of lightning locator, S-band Doppler radar, ground-based microwave radiometer (MWR), and automatic weather stations (AWS) in this study. The results showed that 80% of the CG flashes had an inverse correlation with the spatial distribution of heavy rainfall, 28.6% of positive CG (+CG) flashes occurred at the center of precipitation (>30 mm), and the percentage was higher than that of negative CG (−CG) flashes (13%). Moreover, the quantity of thunderstorm cells in Case 1 was more than other cases, the peak time of +CG flashes was prior to that of total CG flashes in Case 2 and Case 3, and the time of +CG flashes’ peak in Case 2 was prior to that of precipitation at about 2 h. Based on the analysis of the cloud environment, there are three main reasons for the differences of CG flashes and precipitation. Firstly, the structure of the LWC vertical profile and the height of the LWC peak are different, and high LWC makes it difficult for the collision of ice particles to generate electricity. Secondly, the differences between convective available potential energy (CAPE), precipitation, and CG flashes is caused by the sudden increase of VD from 1.5 km to 3 km, and thirdly, the production of CG flashes is very sensitive to RH at the surface layer and the total CG flashes increase as the RH increasing.

1. Introduction

Severe convection is the variety of hazardous events produced by deep and moist convection, and hazardous weather events include hail, damaging wind gusts, tornadoes, and heavy rainfall. The convection frequently associated with thunderstorms and hazardous weather can be produced by thundering convection and non-thundering convection [1]. However, the occurrence of lightning activity in convection clouds is common enough that most hazardous weather is associated with thunderstorms.
A growing number of studies have shown much interest the formation and development of convection hazards in the United States [2,3,4], Europe [5,6,7], Japan [8], and China [9,10,11,12,13,14]. Severe convection usually refers to hail falling on the ground with a diameter greater than 2 cm, damaging thunderstorm winds with speeds greater than 17 m s−1, and heavy rainfall causing floods in China. Located in the middle latitudes of Central China, Hubei Province Region (HPR) is a favorable place for severe convective weather (Available online: Rainstorm Yearbook, http://www.whihr.com.cn/), and the cause of frequency occurrence is closely related to specific topographic conditions (see Section 3.1). According to recent statistics, 5.4 million people were affected by torrential rain, waterlogging, and local strong convection in HPR from 2004 to 2013, of which the direct economic loss caused by local strong convection reached 1.4 billion US dollars [15]. The convection hazards were accompanied by lightning flashes (the total cloud–ground lightning (CG) lightning flashes) and precipitation. However, lightning and precipitation are the major products of severe convection, so it is necessary to study the distribution, development, and environmental characteristics of lightning and precipitation in different atmosphere environmental characteristics.
Lightning and precipitation are two different phenomena that frequently co-occur in thunderstorms, and the relationship between lightning and precipitation has been investigated for a long time. Some studies indicate that the peak of lightning-flash frequency occurs before the peak of rainfall [16,17,18], while some others suggest that there is no fixed temporal correlation between the peak of CG lightning frequency and precipitation [19]. As for the spatial distribution between lightning and precipitation, it was shown that regions of strong lightning activity correspond with those of heavy rainfall [20,21,22]. Moreover, the spatial distribution of lightning and precipitation has a similar trend during the extinction stage of thunderstorms [23,24]. In addition, there are two types of heavy rainfall: one with frequent lightning and the other with little or no lightning [8]. Severe convection usually produces a high proportion of +CG flashes [25], and accompanied bywith large ascending velocity and heavy rainfall or hailstorm [2,26,27,28]. Some observations showed that there was a significant difference of spatial distribution between +CG flashes, −CG flashes and precipitation. Rutledge and MacGorman noted that −CG flashes mainly concentrated in regions of convective precipitation, and +CG flashes were distributed in regions of stratus cloud [29]. It was found that +CG flashes tended to appear in the center of heavy rainfall, and–CG flashes occurred at the edge of the precipitation center [30].
There is a certain relationship between radar reflectivity and lightning activity in Mesoscale Convective Systems (MCS), such as multi-cell storms, supercell storms, squall lines, and hailstorms [26,31] and the relationship between radar parameters and CG lightning flashes can be used to predict the dynamic, microphysical, and electrical characteristics of thunderstorms [32]. Some radar parameters are applied in the study of CG flashes, such as radar echo, radar reflectivity, echo top height, vertical integrated liquid, and radar composite reflectivity factor (30 dBZ). Numerous studies have been performed to on application of radar on the relationship between radar parameters and CG flashes. Knupp et al. found that CG flash frequency has a negative correlation with the reflectivity area when the radar echo is over 65 dBZ in a thunderstorm [33]. In Southern China and Taiwan, lightning activities in the ocean and land precipitation systems were compared and analyzed by Xu et al. [17]. It was noted that the correlation between the radar echo area above 35 dBZ at −5 °C to −15 °C and the lightning flash frequency was stronger than other radar parameters. Some other studies found that the reflectivity volume over 40 dBZ is well correlated with the CG flashes [16,34]. Cetrone et al. analyzed many squall line processes in the West African region and found that lightning activities corresponded well with the radar echo intensity [35]. Lund et al. focused on the relationship between the flash frequency of a small MCS and the radar echo height, and found that most flashes occurred at the height of 3–6 km or 7–10 km [36].
The atmospheric water vapor condition is the most important factor in the formation and development of severe convection, and a few sophisticated techniques have been developed to measure the vapor density (VD), relative humidity (RH), liquid water content (LWC), and temperature (T) from ground-based observation, such as microwave radiometer (MWR). MWR retrieves the vertical profiles of T, RH, LWC, and VD up to 10 km by measuring the radiation intensity at a number of frequency channels (21 K-band (22–30 GHz) and 14 V-band (51–59 GHz)) in the microwave spectrum [37,38]. The high resolution is helpful for resolving detailed mesoscale thermodynamic and microphysical characteristics of various changing mesoscale weather phenomena [39]. In recent years, the MWR has become an efficient instrument for remotely sensing the atmospheric temperature and humidity profiles as well as path-integrated cloud liquid water content in last few decades, and the productions of MWR are applied in nowcasting precipitation, monitoring fog and hail, data assimilation, and climate statistics [40,41,42,43]. However, little is known about the associated water vapor conditions of CG lightning flashes and precipitation in different severe convection based on the MWR.
Thus, it is highly desirable to explore some characteristics of the atmospheric environment between rainfall and CG flashes, the evolution of radar reflectivity in different severe convection, and to understand the differences of atmospheric temperature and humidity profiles in which they develop, in order to help improve the regional weather forecasts of the associated precipitation and CG flashes events over HPR. In this paper, the temporal and spatial distributions of lightning, precipitation, and environment characteristics during three severe convective processes in HPR are studied comparatively, and the distribution characteristics of LWC, VD, RH, and T during the peak of lightning and precipitation are analyzed based on MWR. The primary purpose of this study is to investigate the evolution characteristics of cloud environmental physical quantities (VD, LWC, RH, and T) in different convective cases, and reveal the reasons for the differences between CG lightning flashes and precipitation caused by different convective cases.

2. Data and Method

The instruments used in this paper contain eight S-bands Doppler weather radars in HPR (Figure 1). Precipitation information derives from local automatic weather stations (AWS), and the quality control of data consists of internal consistency test, climatological extreme value test and time consistency test [44].
The radar used in this study is one of the S-band radars operated in China’s new-generation weather radar network, whose characteristics are similar to those of the Weather Surveillance Radar-1988 Doppler (WSR-88D) radars [45,46,47]. The radar is located at Wuhan, Hubei Province, and routinely scans regions out to a ~400 km range roughly every 6 min. The operational mode is called volume scanning mode (VCP21), which has 9 sweeping elevation angles (0.5, 1.5, 2.4, 3.4, 4.3, 6.0, 9.9, 14.6, and 19.5 degrees) and provides observations of reflectivity, radial velocity, and velocity spectrum width. Based on the observations of radar, thunderstorm cells are identified by Thunderstorm Identification, Tracking, Analysis, and Nowcasting (TITAN) [48,49]. TITAN defines a thunderstorm cell as a contiguous region that exhibits reflectivity above a given threshold, and the volume of which exceeds a volume threshold. In this study, TITAN is applied to each volume scan radar data to calculate storm cell parameters, such as storm location and orientation, maximum radar reflectivity, vertical integrated liquid water (VIL), and echo top (ET). TITAN uses an ellipse to represent the projection of storm cell on the ground, and the location and orientation of the ellipse stands for that of each storm cell. The maximum radar reflectivity is the maximum value of reflectivity within the storm cell.
The lightning location data is from the Advanced Time of arrival and Direction system (ADTD) lightning positioning system in HPR, which was developed by the Center for Space Science and Applied Research, Chinese Academy of Sciences. The ADTD is an observational net comprised of 31 three-dimensional VLF/ LF lightning detectors, which apply technologies of MDF (magnetic direction finder) and TOA (time-of-arrival). A network of VLF/LF three-dimensional lightning detector was developed, in which the horizontal position error was ≤500 m, the height error ≤1000 m, the detection efficiency ≥90%, the time accuracy ≤10−1 ms, the resolution of time event of the resolution ≤2 ms, and the error of return strength error ≤10%. In addition, each CG lightning record comprises such information as lightning types (+CG and −CG), location, occurrence time, lightning current, and gradient, but cannot obtain the information of the in-cloud flashes.
This particular MWR observes atmospheric brightness temperatures with a total of 21 K-band (22–30 GHz) and 14 V-band (51–59 GHz) microwave channels at multiple elevation angles, atmospheric background or cloud base temperatures at one zenith infrared (9.6–10.5 μm) channel every 3 min, and vertical retrieval intervals from 50 m from the surface to 500 m, 100 m, to 2 km, and 250 m to 10 km [38].

3. Case Study

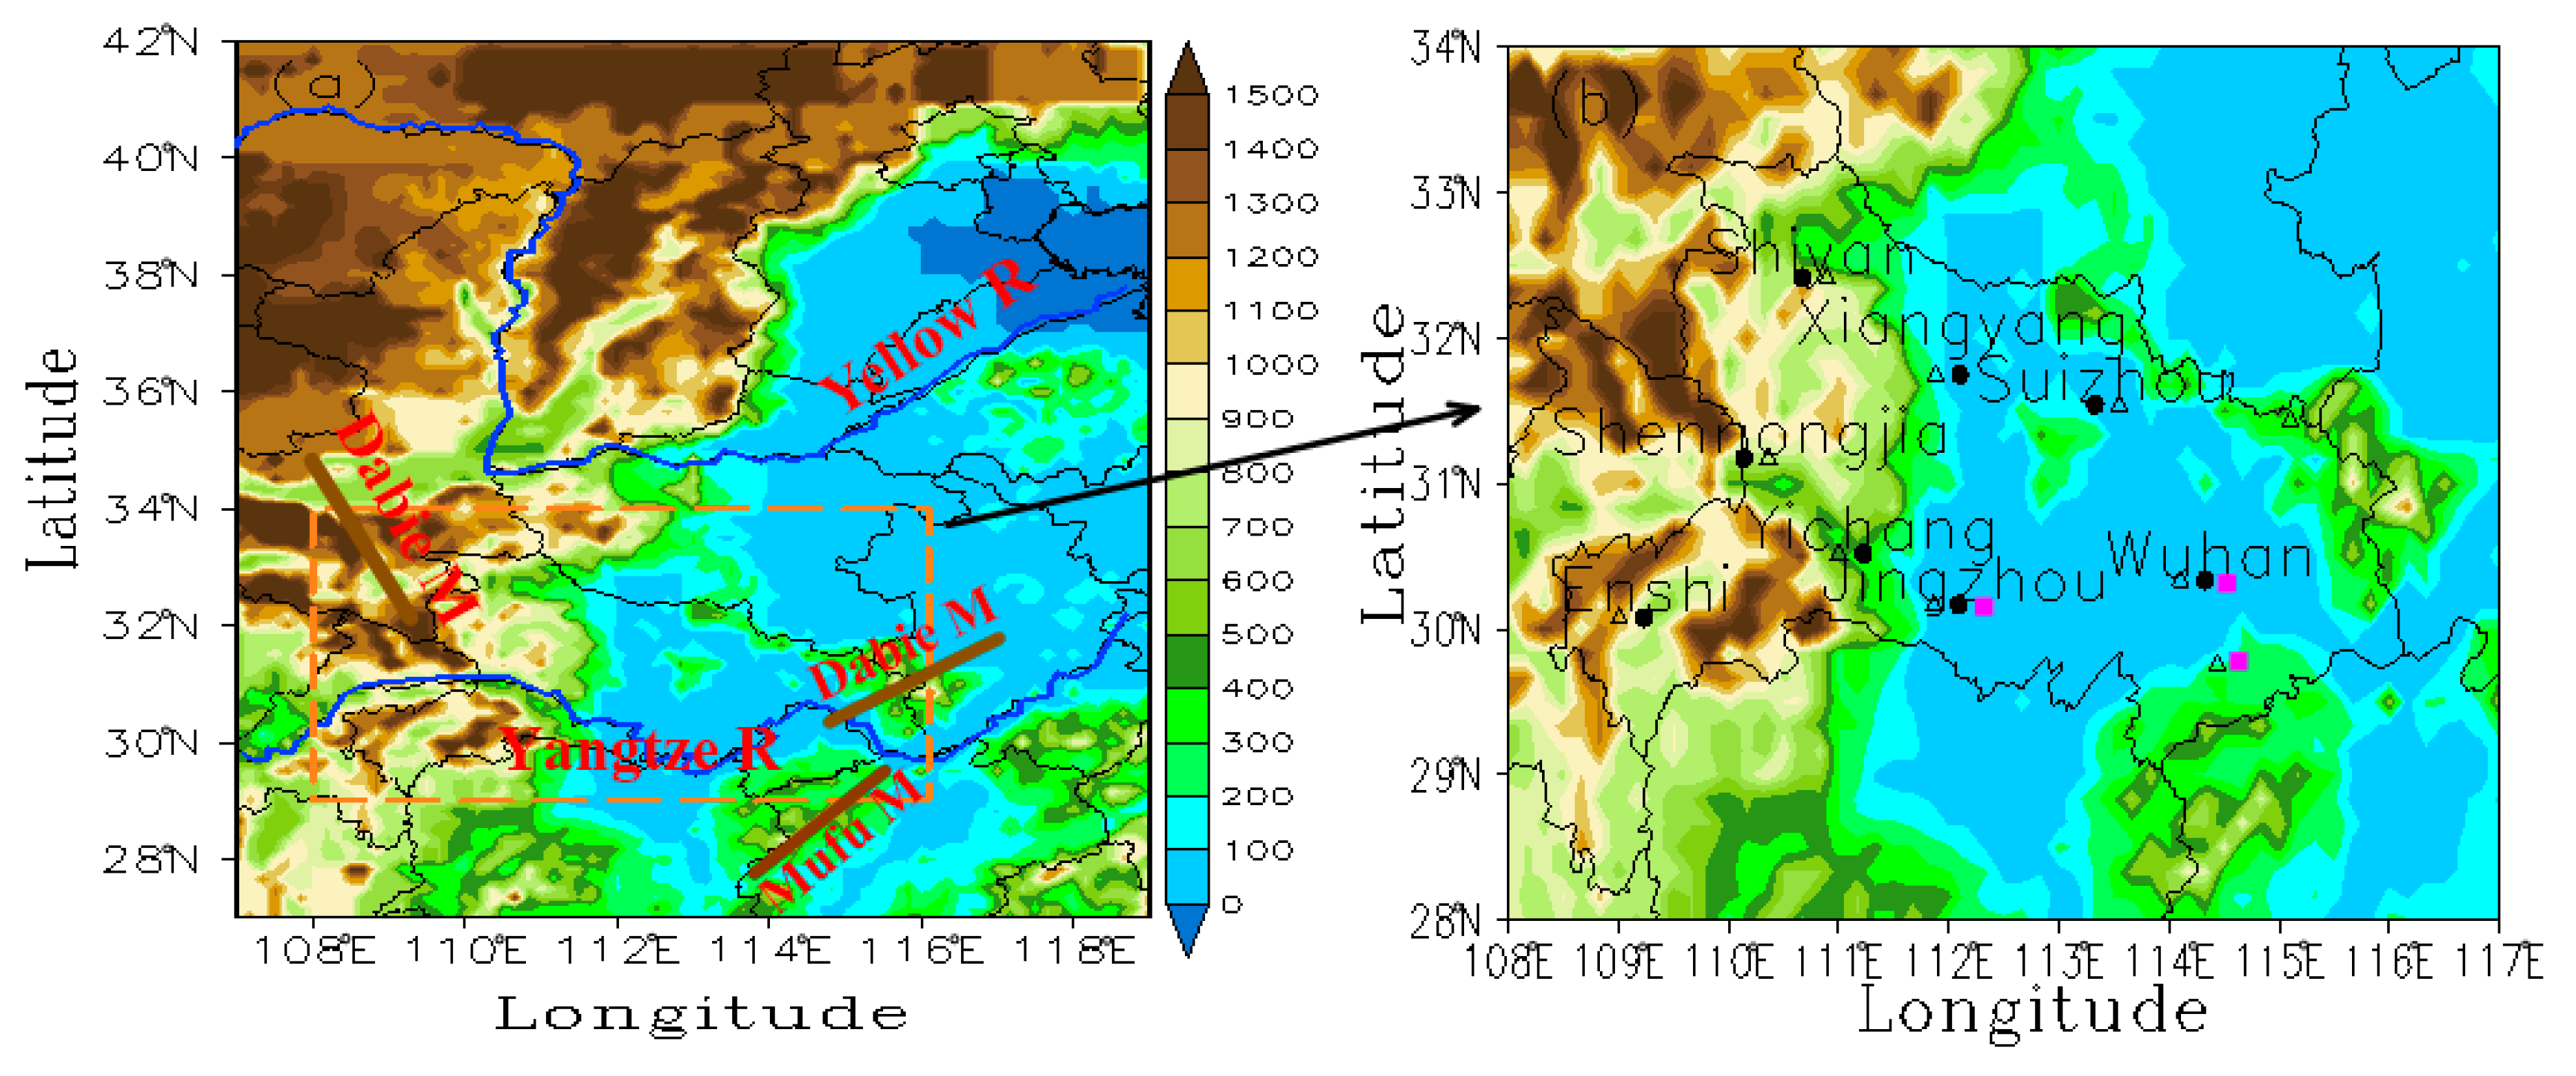
3.1. Introduction of Cases

The severe convective weather in HPR mainly occurs during the period from March to September, especially from April to June, which is closely associated with the specific terrain conditions (Figure 1). The frequency of severe convection in HPR is closely related to the characteristic topographic conditions. The Dabie Mountains are located in the northeast of HPR and showing a southeast–northwest trend. The Mufu Mountains are located in the southeast of HPR, and the two mountains constitute a trumpet type in the eastern part of HPR. In the process of southwest airflow with strong convection, the distribution and trend of mountains and rivers are exactly consistent with the prevailing southerly wind in the lower layer. A mesoscale convergence line can often be analyzed near the west of HPR. The mesoscale convergence line moves northward with the enhancement of the southerly wind at the afternoon, which is easy to lead to the occurrence of tornadoes and other severe convection in this area. Therefore, the Xiaogan, Huangpi, and Wuhan areas have become the frequent centers of severe convection. In addition, the orographic lift blocked by the mountainous areas of Western HPR is conducive to the occurrence of severe convection in the Yichang area [50].
In this paper, the criteria of cases are a 24-h cumulative precipitation greater than 50 mm as heavy precipitation, because there is currently no uniform standard for defining strong thunderstorms and weak thunderstorms. So, if the accumulation CG flashes was more than 10,000 flashes in 24 h, we considered it a strong lightning process. The severe convective events were chosen because all cases caused certain economic losses and casualties, and Wuhan and Yichang is a region of frequent severe convection in HPR (Table 1). Convective available potential energy (CAPE) is a maximum buoyancy of an undiluted air parcel, related to the potential updraft strength of thunderstorms, and the larger CAPE represents the greater energy provided by convective development [51]. Although the value of CAPE in Case 2 was lower than that of Case 1 and Case 3, the 24-h accumulative precipitation (193 mm) was higher than Case 1 and Case 3, and the number of total CG flashes in Case 2 was less than other cases. Moreover, we believe that the differences are related to the precipitation system and the characteristics of cloud water environment. For the analysis of the evolution of the characteristics of atmospheric cloud environment in all three cases, see Section 3.4.

3.2. Relationship of Lightning and Precipitation

3.2.1. Temporal Distribution

Many previous results have been obtained from the correlation between CG lightning flashes and the precipitation, indicating a strong relationship between CG flash-frequency and the precipitation intensity [18]. Thunderstorms mainly produce −CG flashes (about 90%) in Central China and more observations have reported that in some thunderstorms, there are a large number of +CG flashes produced. Moreover, lightning and heavy rainfall is two different weather phenomena of severe convection, and then a certain connection between CG lightning and precipitation is studied. Thus, the temporal distribution of total CG flashes, +CG flashes, and precipitation are plotted in Figure 2. The time evolution of precipitation and lightning activity were roughly different in Case 1, there was weak precipitation and a little of CG flashes before 2000 LT (Local Time is Beijing standard time used in the paper, i.e., LT = UTC + 8 h), and the maximum hourly precipitation was less than 20 mm. Combine with radar echo (Figure 3), the echo intensity was enhanced and the main precipitation areas were concentrated in the east and south of HPR at 20:30 LT on 14 May 2015. Moreover, the lightning activities also began to increase and there were a number of −CG flashes produced in the strong echo zone of the Southern HPR; a strong +CG flash occurred at the edge of the eastern strong echo zone (Figure 3a). With the development of convective cloud, the precipitation intensity reached its peak at 2100 LT and the strong echo zone of the Southern HPR extended eastward, accompanied with a large number of −CG flashes and a few +CG flashes (Figure 3b). In a comparison of the distribution of precipitation and CG flashes, total CG flashes (sum of +CG and −CG) with a maximum number of 11,500, and the peak percentage occurred at 2030 LT and 2300 LT, respectively, the corresponding intensity of precipitation then began to decrease (Figure 2a), and there was a secondary peak in Case 1 at 0500 on 15 May 2015. This may have been caused by the production of ice particles after the vigorous lightning activity. Figure 2b shows the time evolution of precipitation and CG flashes in Case 2. The activity of lightning and precipitation mainly occurred on 6 July 2013 and the maximum of precipitation and CG flashes were 60 mm h−1 and 725 flashes per hour, respectively. There was a secondary peak of precipitation (50 mm h−1) which appeared at 0100 LT on 7 July 2013, accompanied by a small amount of lightning activity. Moreover, a comparison of the peak +CG flashes between Case 1 and Case 2 is shown in Figure 2a,b. In Case 1, the maximum values of +CG flashes and total CG flashes occurred at the same time, and the peak of +CG flashes was two hours behind the precipitation peak. Whereas in Case 2, the time of +CG flashes peak occurred at 0800 LT earlier than the time of precipitation peak (1000 LT). It is evident from Figure 2c that the heavy rainfall occurs mainly on 11 September 2014 and the precipitation reached its peak at 14:00 LT in Case 3, with a secondary peak of precipitation in Case 3 at 09:00 LT. Combined with Figure 3e,f, a small amount of CG flashes began to appear before the peak of heavy rainfall. The CG flashes mainly occurred on 12 September 2014 with a maximum of 1900 flashes per hour at 0100 LT, while +CG flashes peak occurred at the earlier time of 1 h.
In addition, Case 2 had the shortest duration compared with Case 1 and Case 3. Combined with Table 1, the CAPE and the number of CG flashes in Case 2 were less than Case 1 and Case 3, but the 24 h accumulated precipitation and the percentage of +CG flashes were greater than Case 1 and Case 3, which illustrates less CG lightning activity occurring in some nocturnal short duration heavy rainfall events due to the absence of large CAPE.

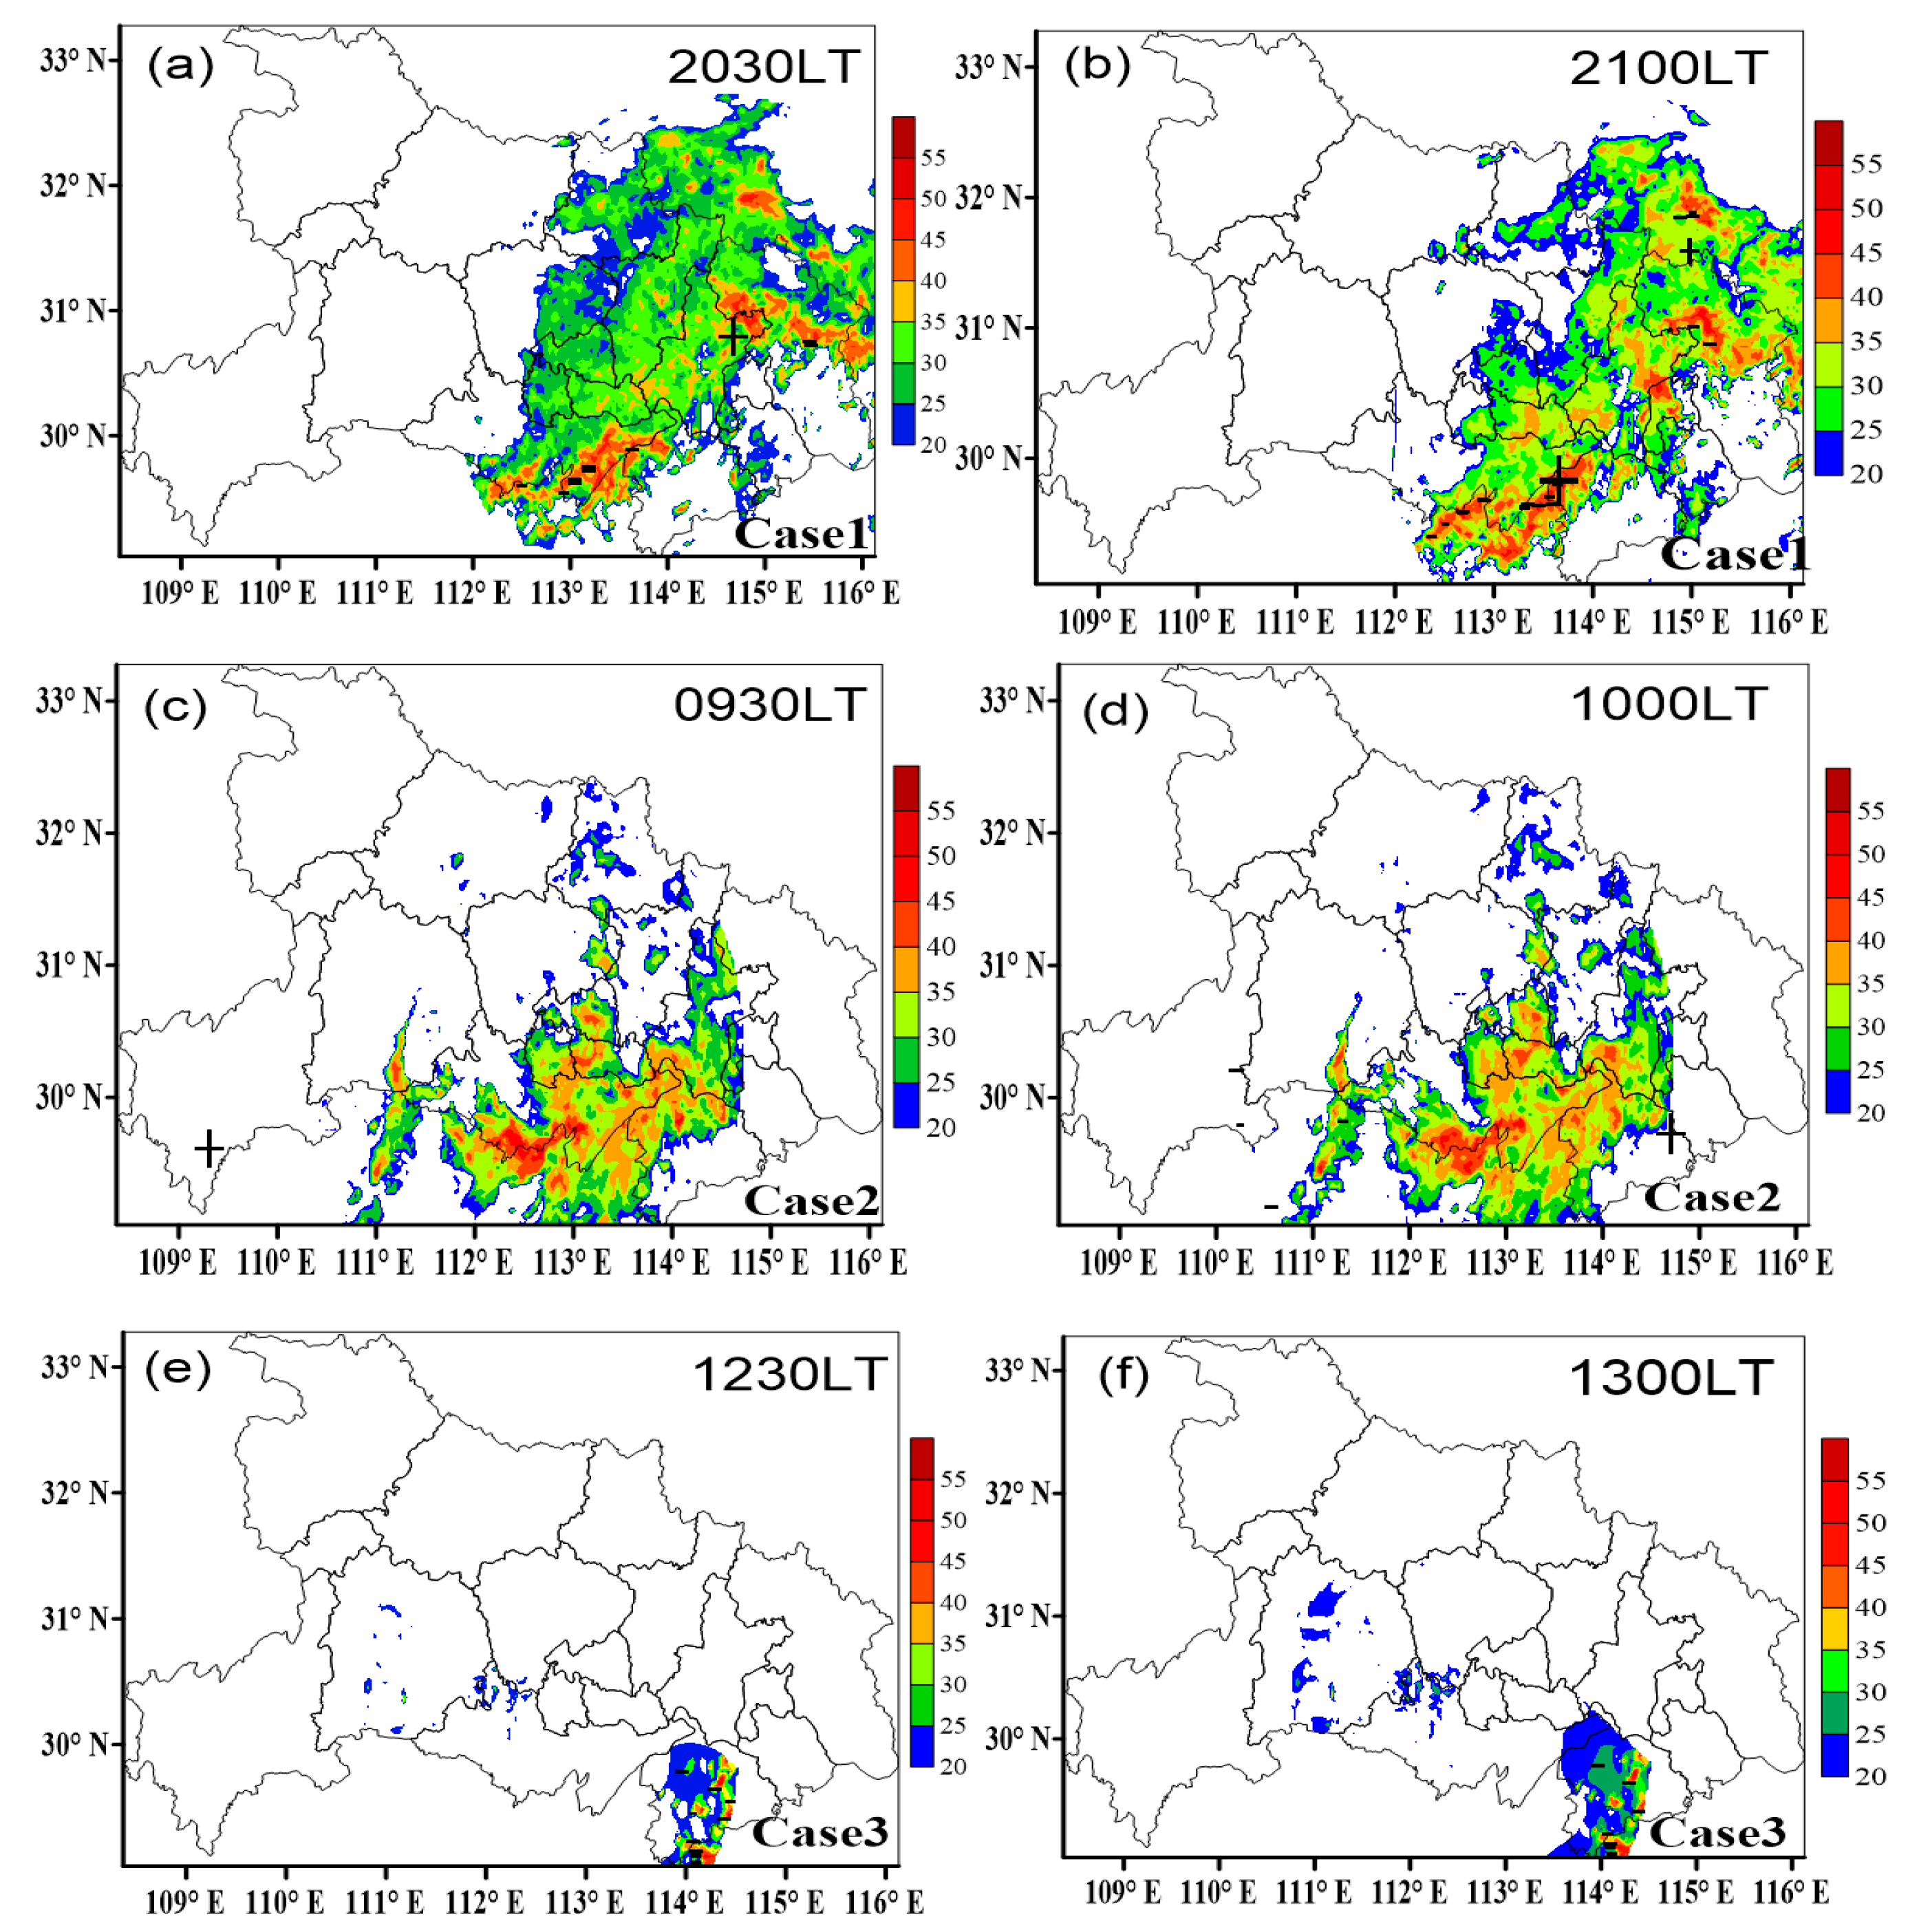
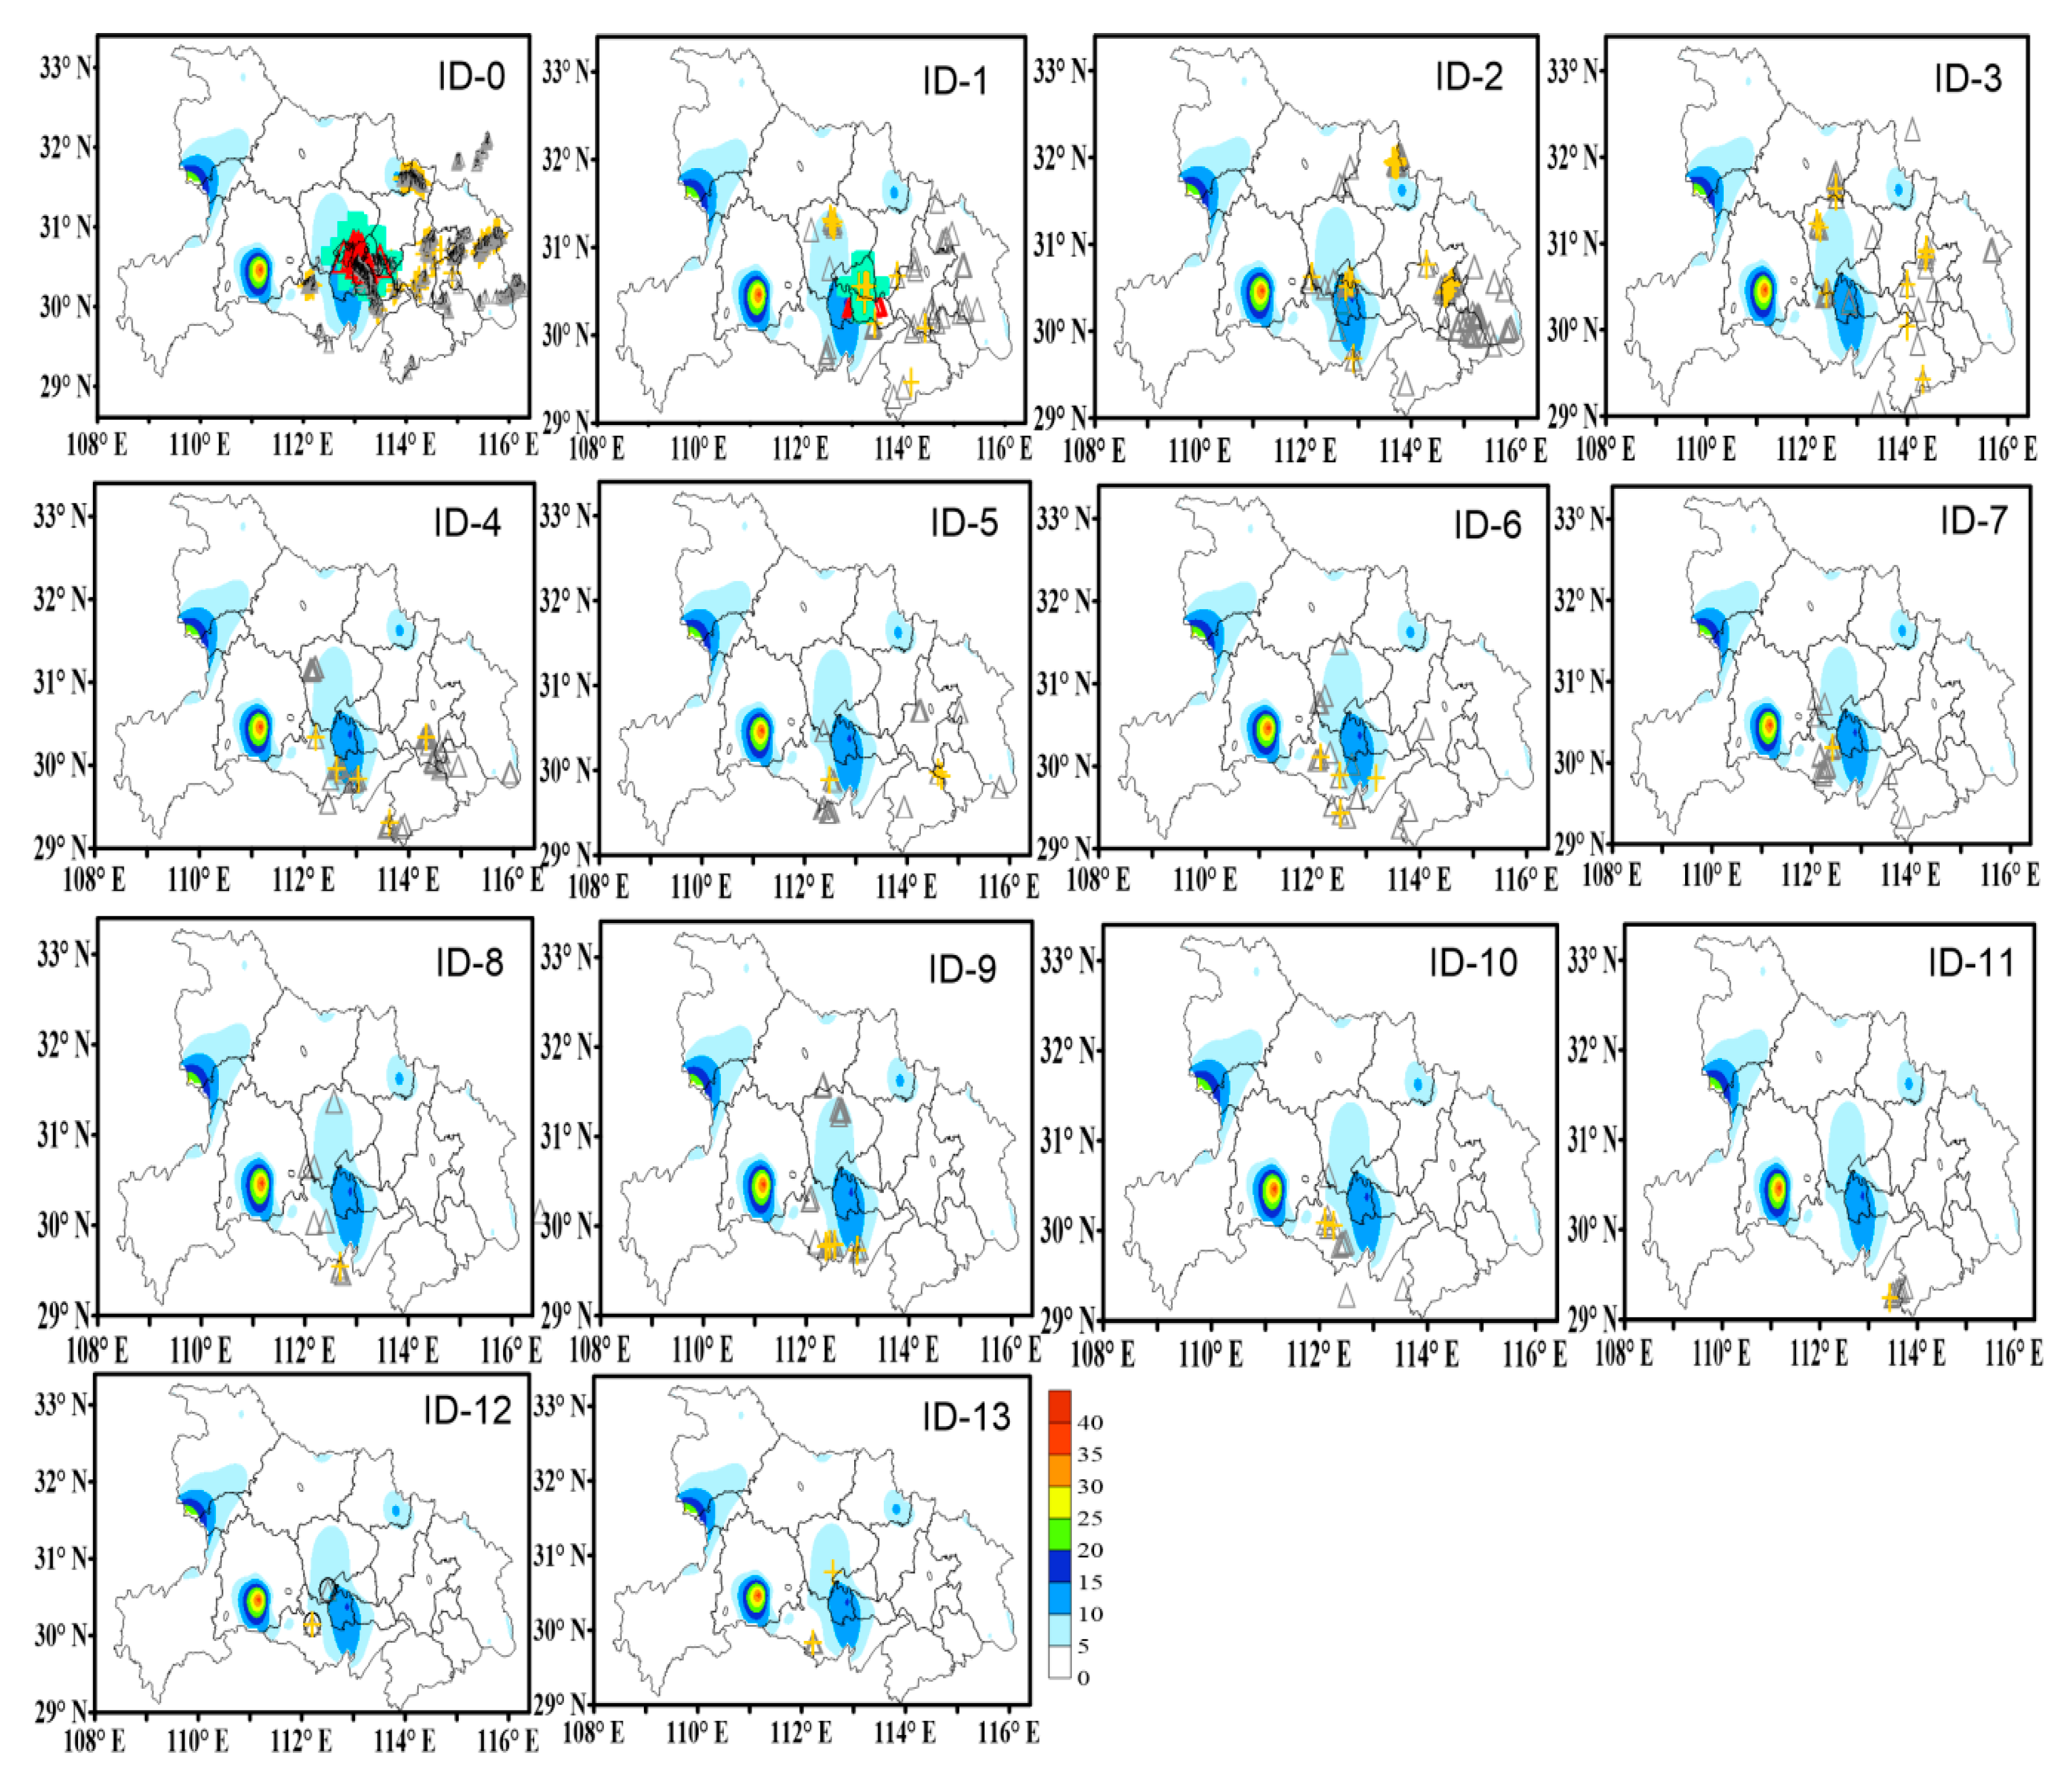
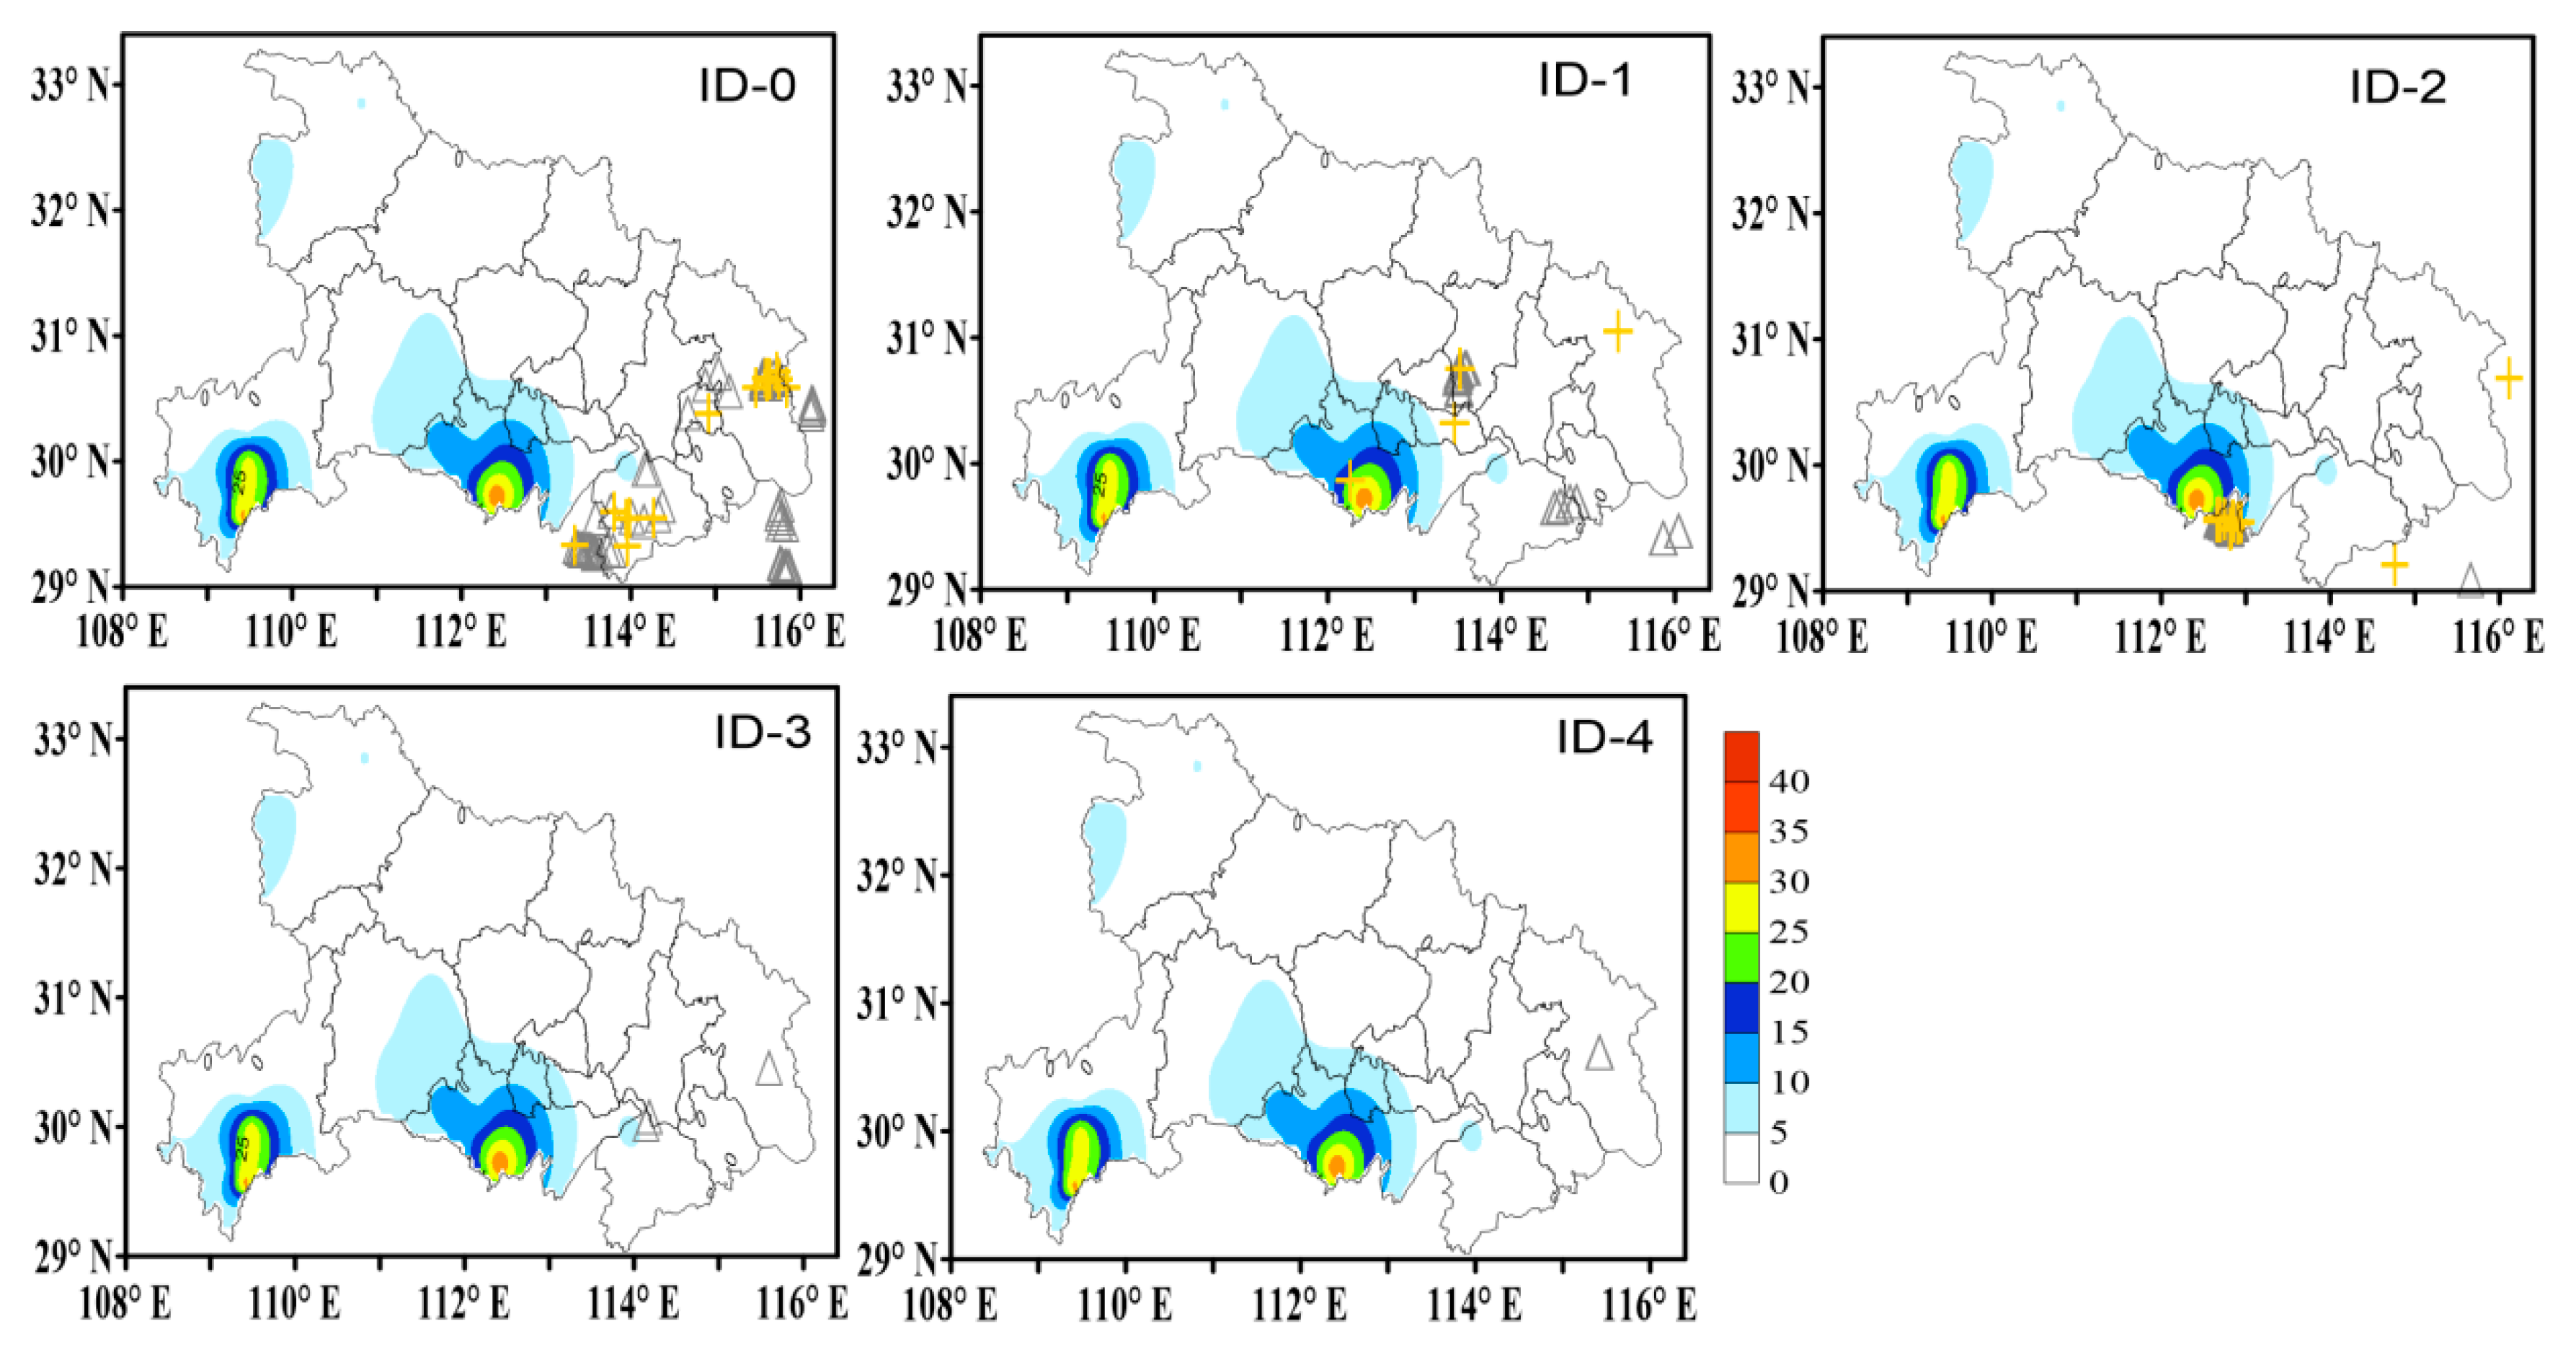
3.2.2. Spatial Distribution

In order to analyze the spatial distribution of lightning and the precipitation peak of each convective case, we chose the exuberant stage of lightning and precipitation in three cases. The time range is shown in the red dotted box in Figure 2. The TITAN method was used to identify and track the thunderstorm cells in three cases, and then the spatial distribution of lightning and precipitation in each thunderstorm cell were analyzed. Because the spatial scale of a thunderstorm is about 10 km, the precipitation and lightning data were transformed into gridded data with 0.05° × 0.05° (longitude × latitude) resolution. Table 2 shows the number of thunderstorm cells and CG flashes during the period of heavy rainfall with strong lightning activity, as well as the time of CG flashes occurs. In Table 2, there are 610 CG flashes produced by identified thunderstorm cells (14 cells) from 2000 LT to 0400 LT in Case 1, and the maximum number of CG flashes produced by a single thunderstorm cell at 0108LT (199 flashes per 6 min). In Case 2, there are five thunderstorms are identified from 0900 LT to 2100 LT, and the maximum number of CG flashes is 55 flashes per minute. However, only four thunderstorm cells were produced by Case 3, and the number of thunderstorm cells was less than Case 2, but the number of CG flashes in Case 3 was more than that in Case 2. The maximum of CG flashes is 245 flashes per 6 min at 0146 LT, more than in Case 1 and Case 2.
In Figure 4, Figure 5 and Figure 6, the distribution of rainfall amounts, −CG flashes, and +CG flashes are plotted. Based on the method of TITAN, the number of thunderstorm cells in Case 3 is the least, there are 4 thunderstorm cells identified, the CG flashes concentrated in the center of heavy rainfall in the ID-0, ID-1, and ID-3 of Case 3, and +CG flashes tended to occur in the center of heavy rainfall, while −CG flashes occurred at the edge of precipitation center (Figure 6), which is consistent with some observations in a study by Carey et al. [30]. Although the numbers of −CG and +CG flashes in Case 2 are less than the Case 3, the number of thunderstorm cells and the ratio of +CG flashes to total CG flashes are more than in Case 3. Especially, 80% of +CG occurred at the region of light precipitation and only +CG flashes of ID-2 were at the center of precipitation in Case 2 (Figure 5). The quantity of thunderstorm cells in Case 1 is more than other cases, the lightning activity produced by the fourteen thunderstorm cells was inversely correlated with the spatial distribution of precipitation centers in Case 1 (Figure 4), and similar characteristics are also found in comparing CG flashes and precipitation spatial distribution in Case 1 to Case 2.
In addition, some previous studies demonstrated that the lightning–rainfall relationship could provide valuable information about the improvements in heavy-rain nowcasts, severe weather warnings, and estimations of rainfall amount [9,38,52]. Combined with Figure 2, the peak time of +CG flashes was prior to that of the total CG flashes in Case 2 and Case 3 and the peak time of +CG flashes in Case 2 was prior to that of precipitation at about 2 h. Then, 28.6% of the +CG flashes produced by thunderstorm cells occurred at the center of precipitation (>30 mm), and the percentage was better than −CG flashes (13%). Whether was the spatial or temporal distribution between CG flashes and precipitation, the correlations between +CG flashes and precipitation was better than −CG flashes. Moreover, Soula and Chauzy [25] also noted that spatial correlations between rainfall and lightning were consistent for all lightning types, and +CG flashes were better associated with rainfall amounts than negative flashes.

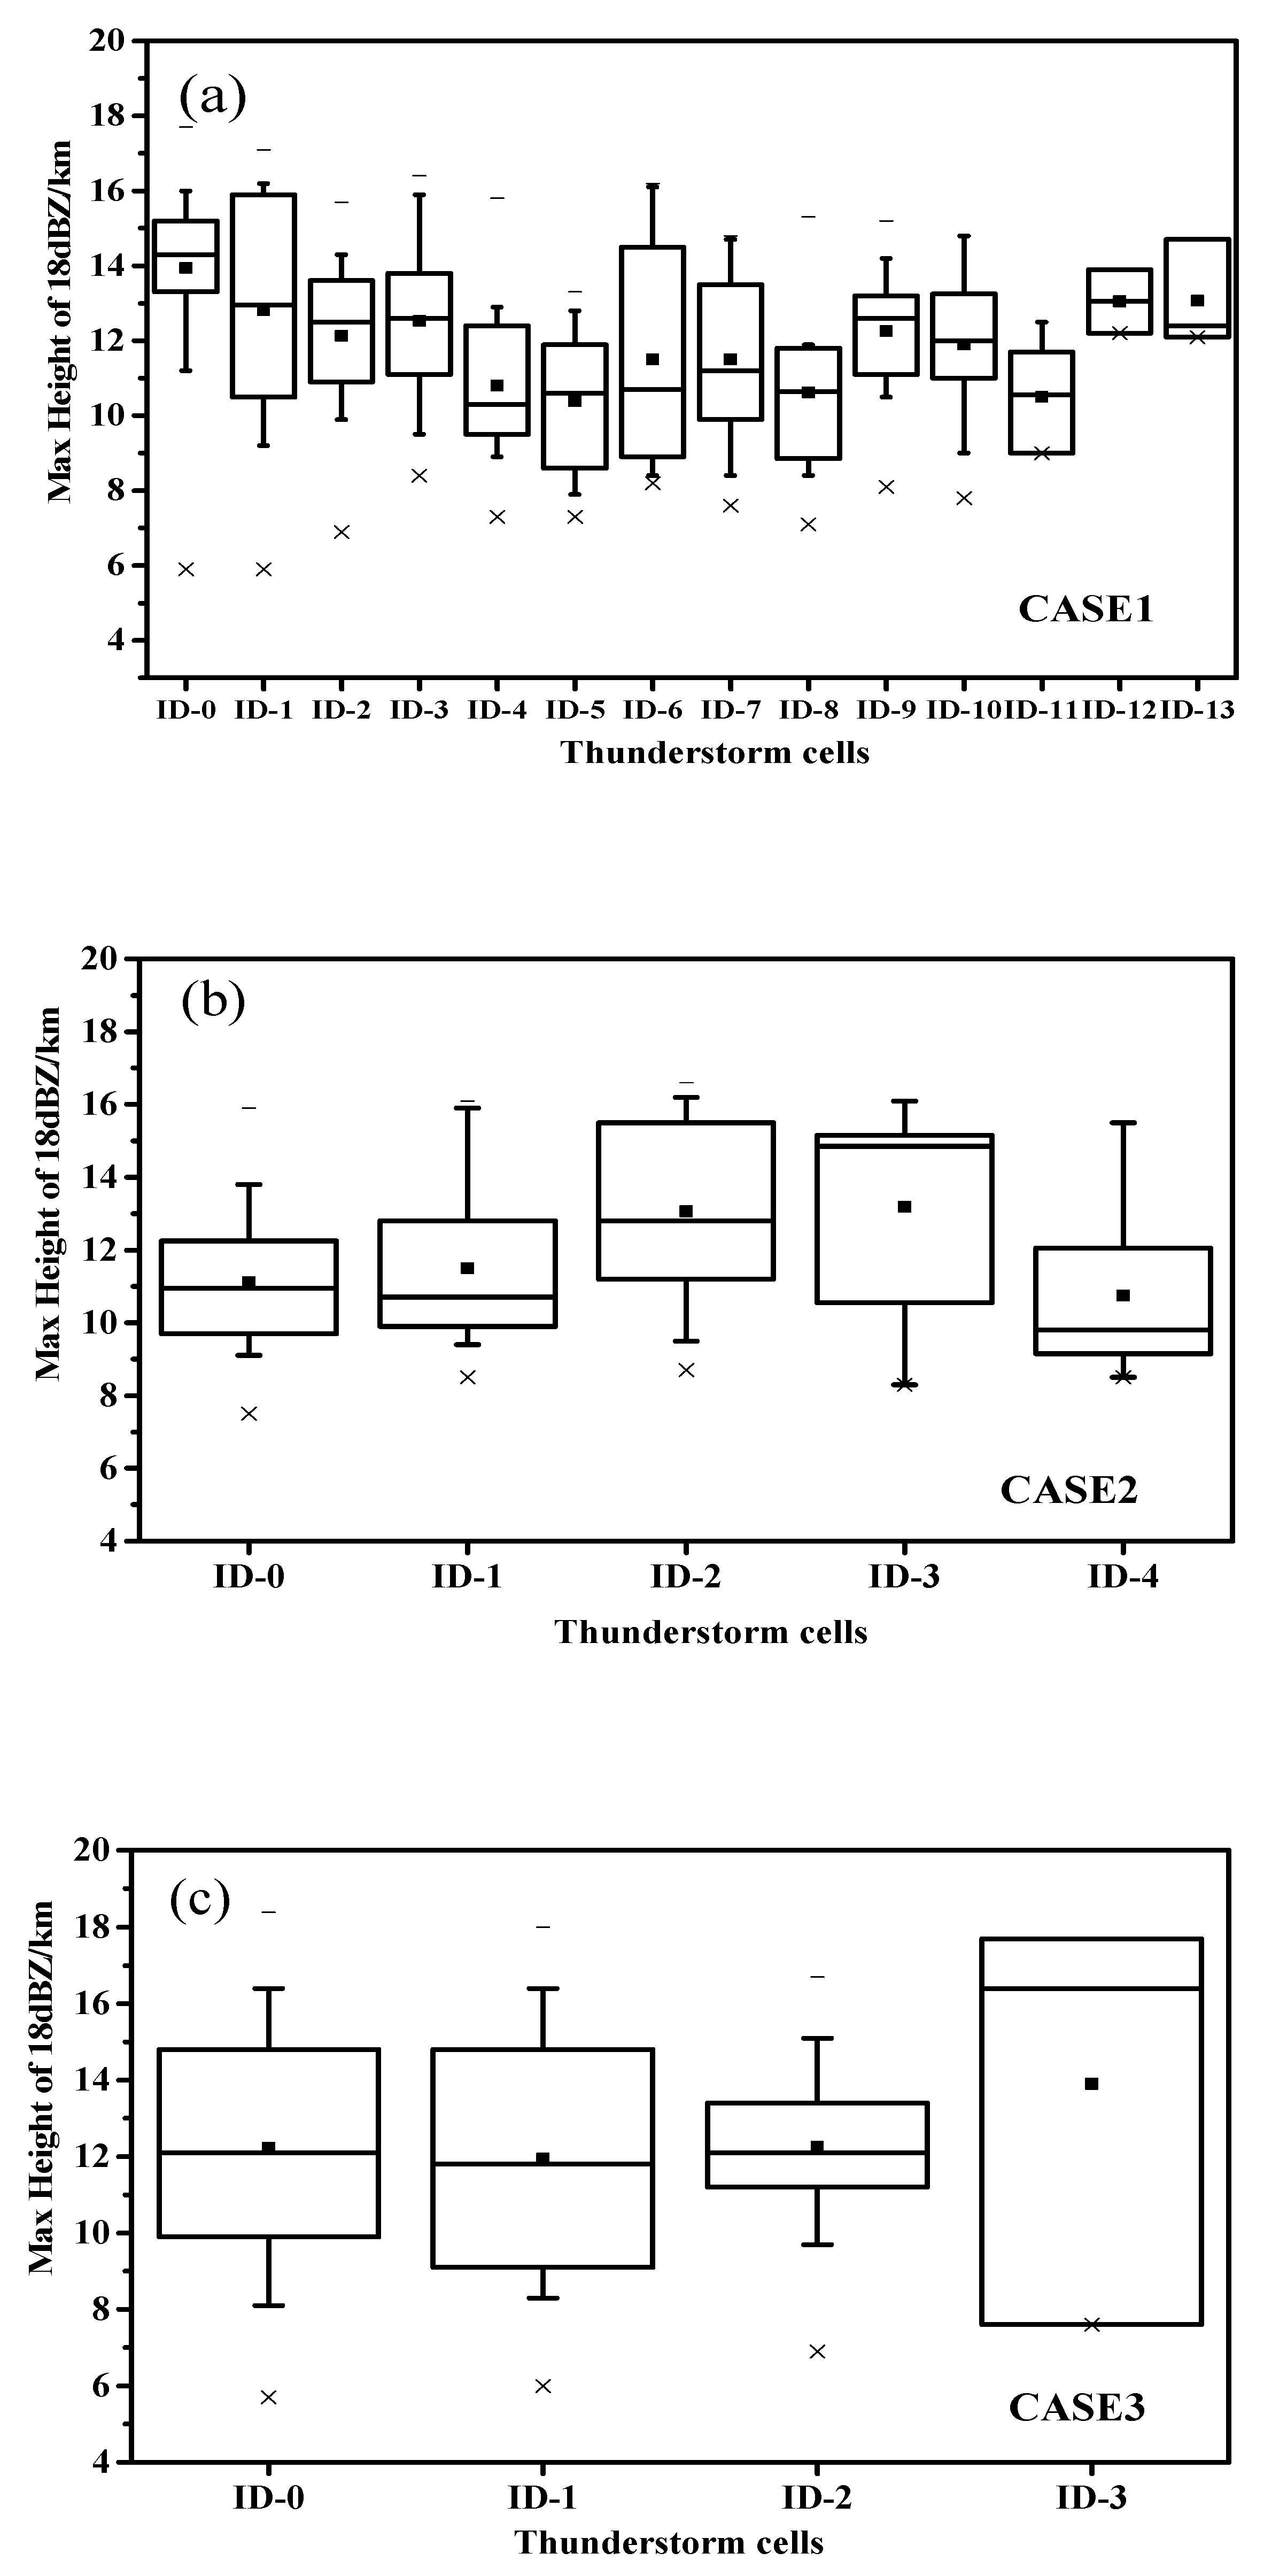
3.3. Correlations between Lightning Flashes and Radar Echo Intensity

According to the spatial relationship between the radar echo and the lightning, it can be seen that the lightning did not necessarily occur in the strong echo region, and strong lightning may also occur in some weaker echo regions. Based on the TITAN identification of 23 thunderstorm cells: 14 in Case 1, 5 in Case 2, and 4 in Case 3 (as seen in Table 2) and the radar echo intensity at different temperature levels (0 °C, −10 °C, −15 °C, −20 °C, and −25 °C), the maximum radar echo intensity above 0 °C, and the maximum height of the 18 dBZ (Table 3) were used to study the correlation between lightning and radar echoes.
In addition, the algorithm of radar echo tops was derived by Xiao et al. [53], and the saw tooth artifact of the original echo tops product was successfully mitigated in the enhanced algorithm.
Through the statistical analysis of the three cases, the results show that the correlation between the maximum echo intensity at 0 °C layer and the CG flash number was the lowest, and the correlation between the maximum echo height at 18 dBZ and CG flash number was the highest. Figure 7 shows the mean heights of the three cases of MH18dBZ spanned in the ranges of 10.8–14.2, 10.8–13.2, and 12–14.6 for Case 1, Case 2, and Case 3, respectively, with the maximum height equaling 16.6 km, 16 km and 18 km.

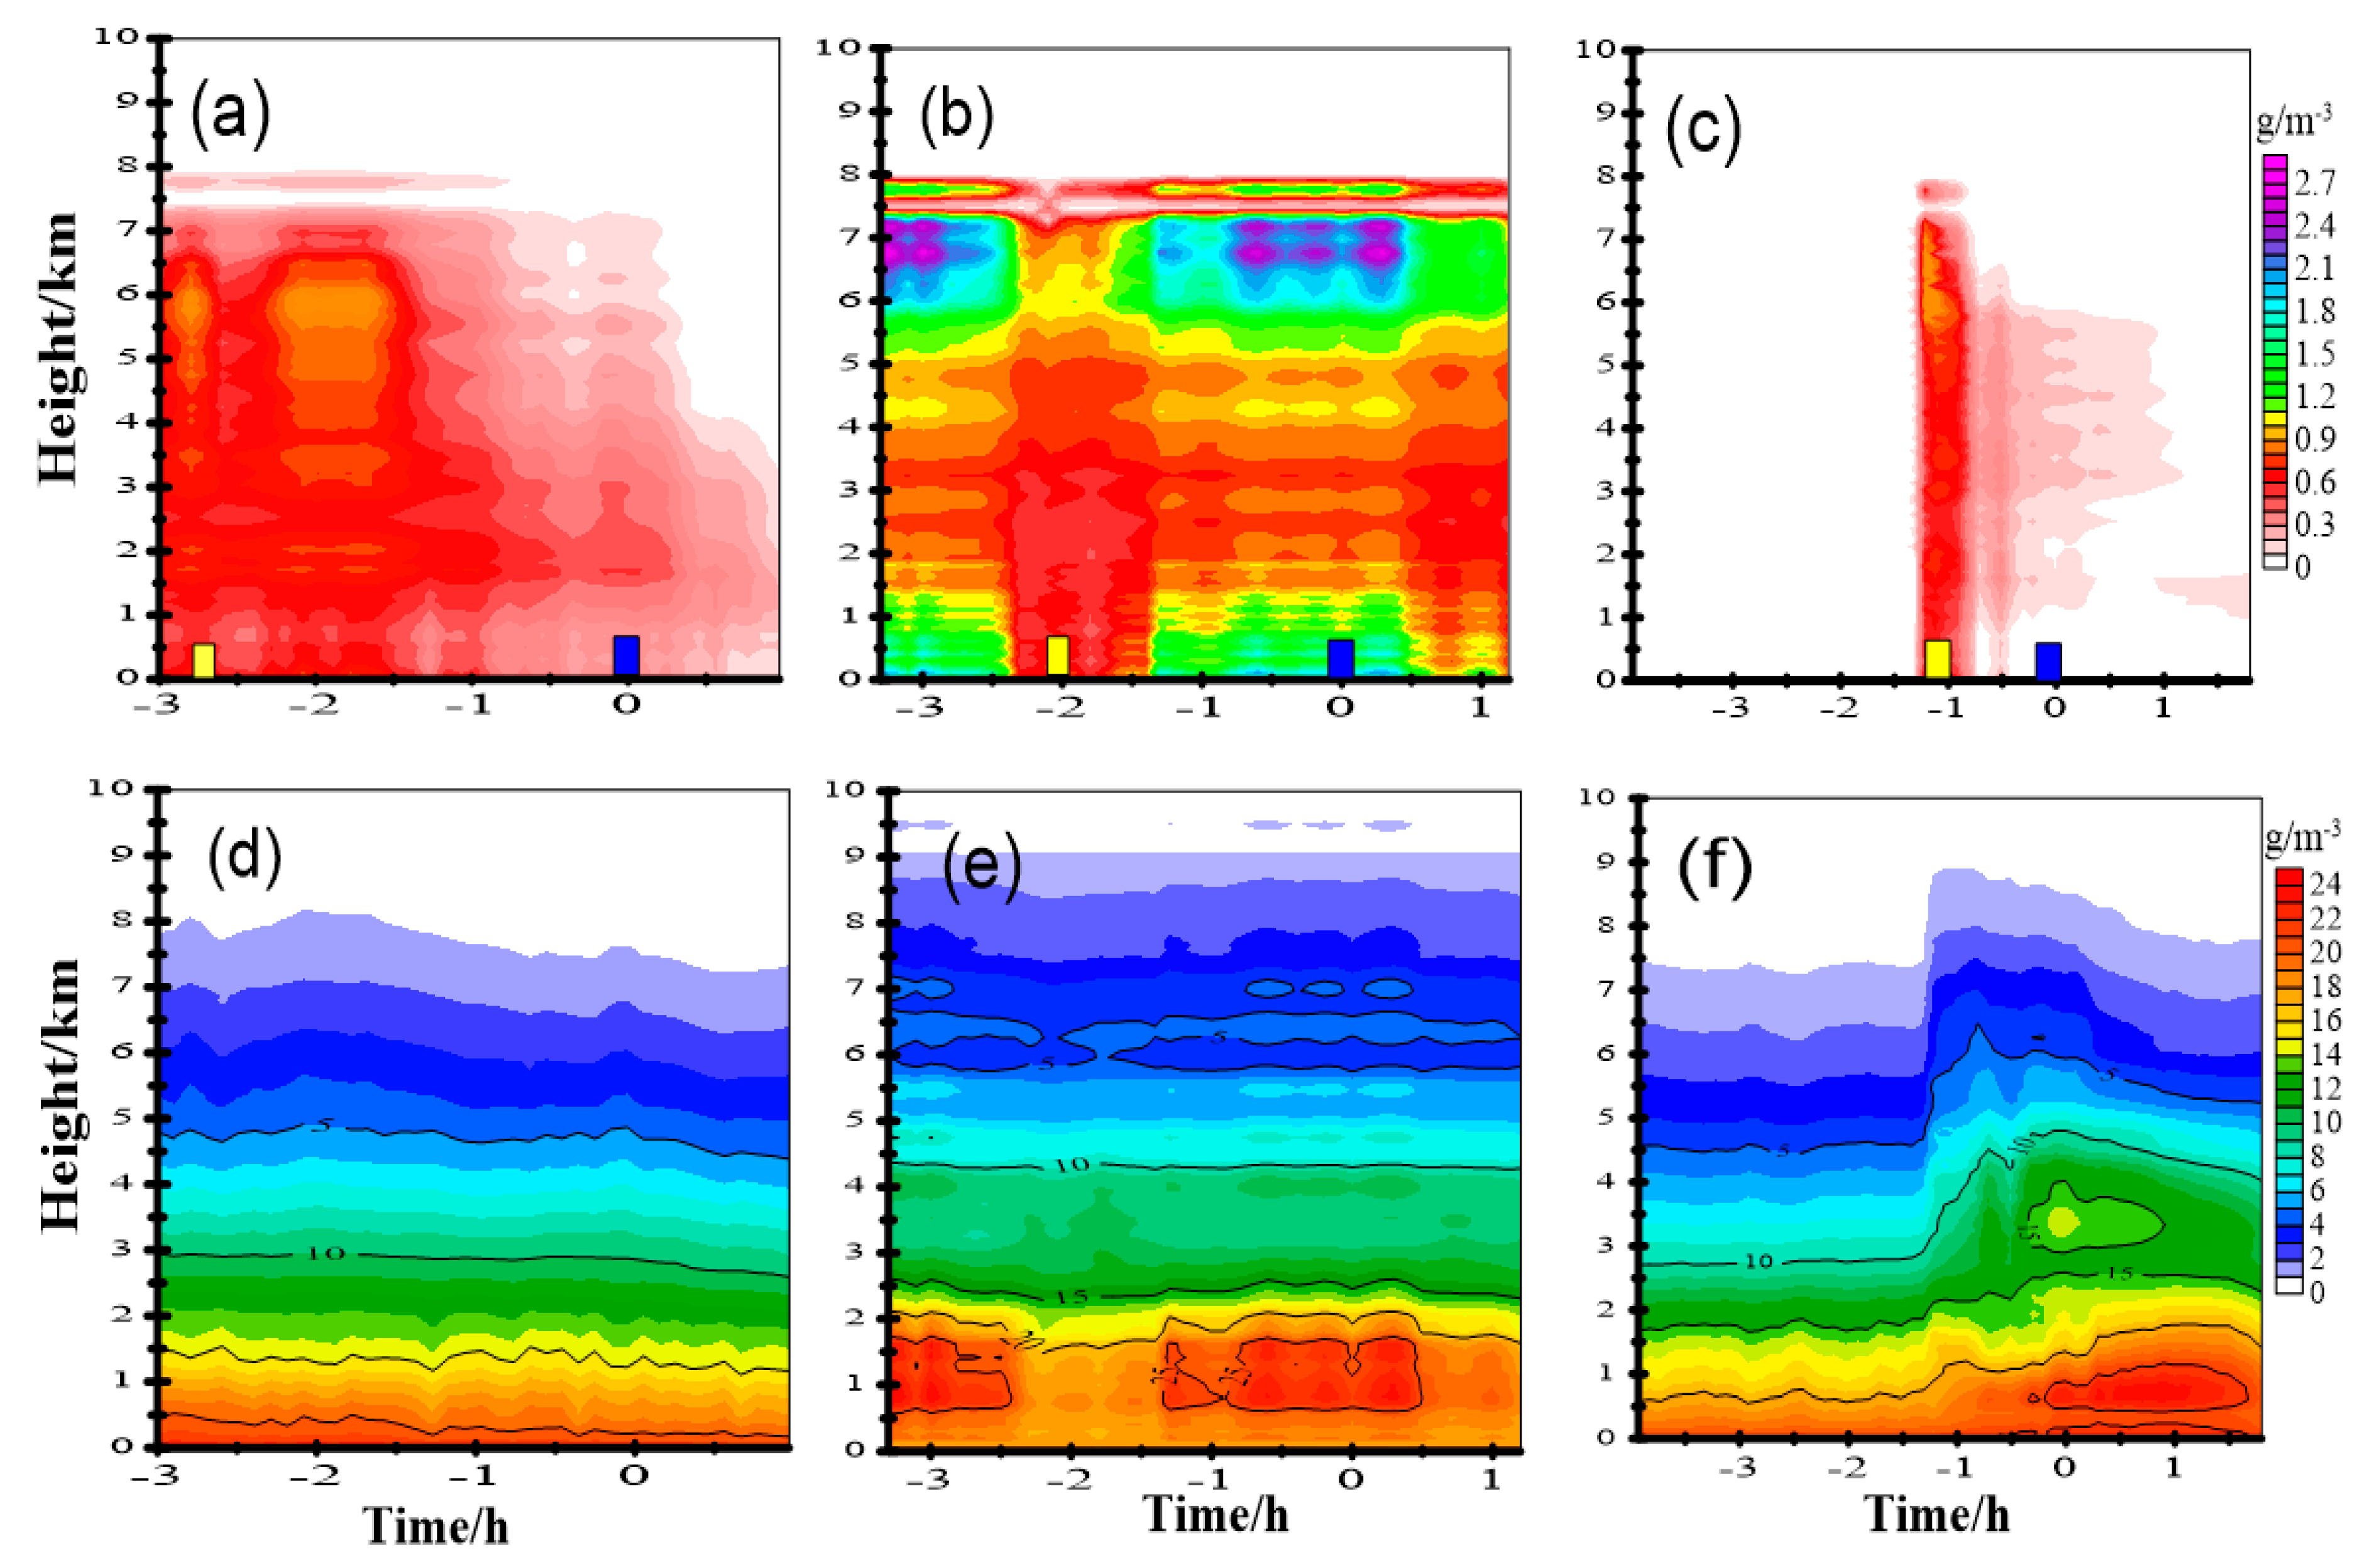
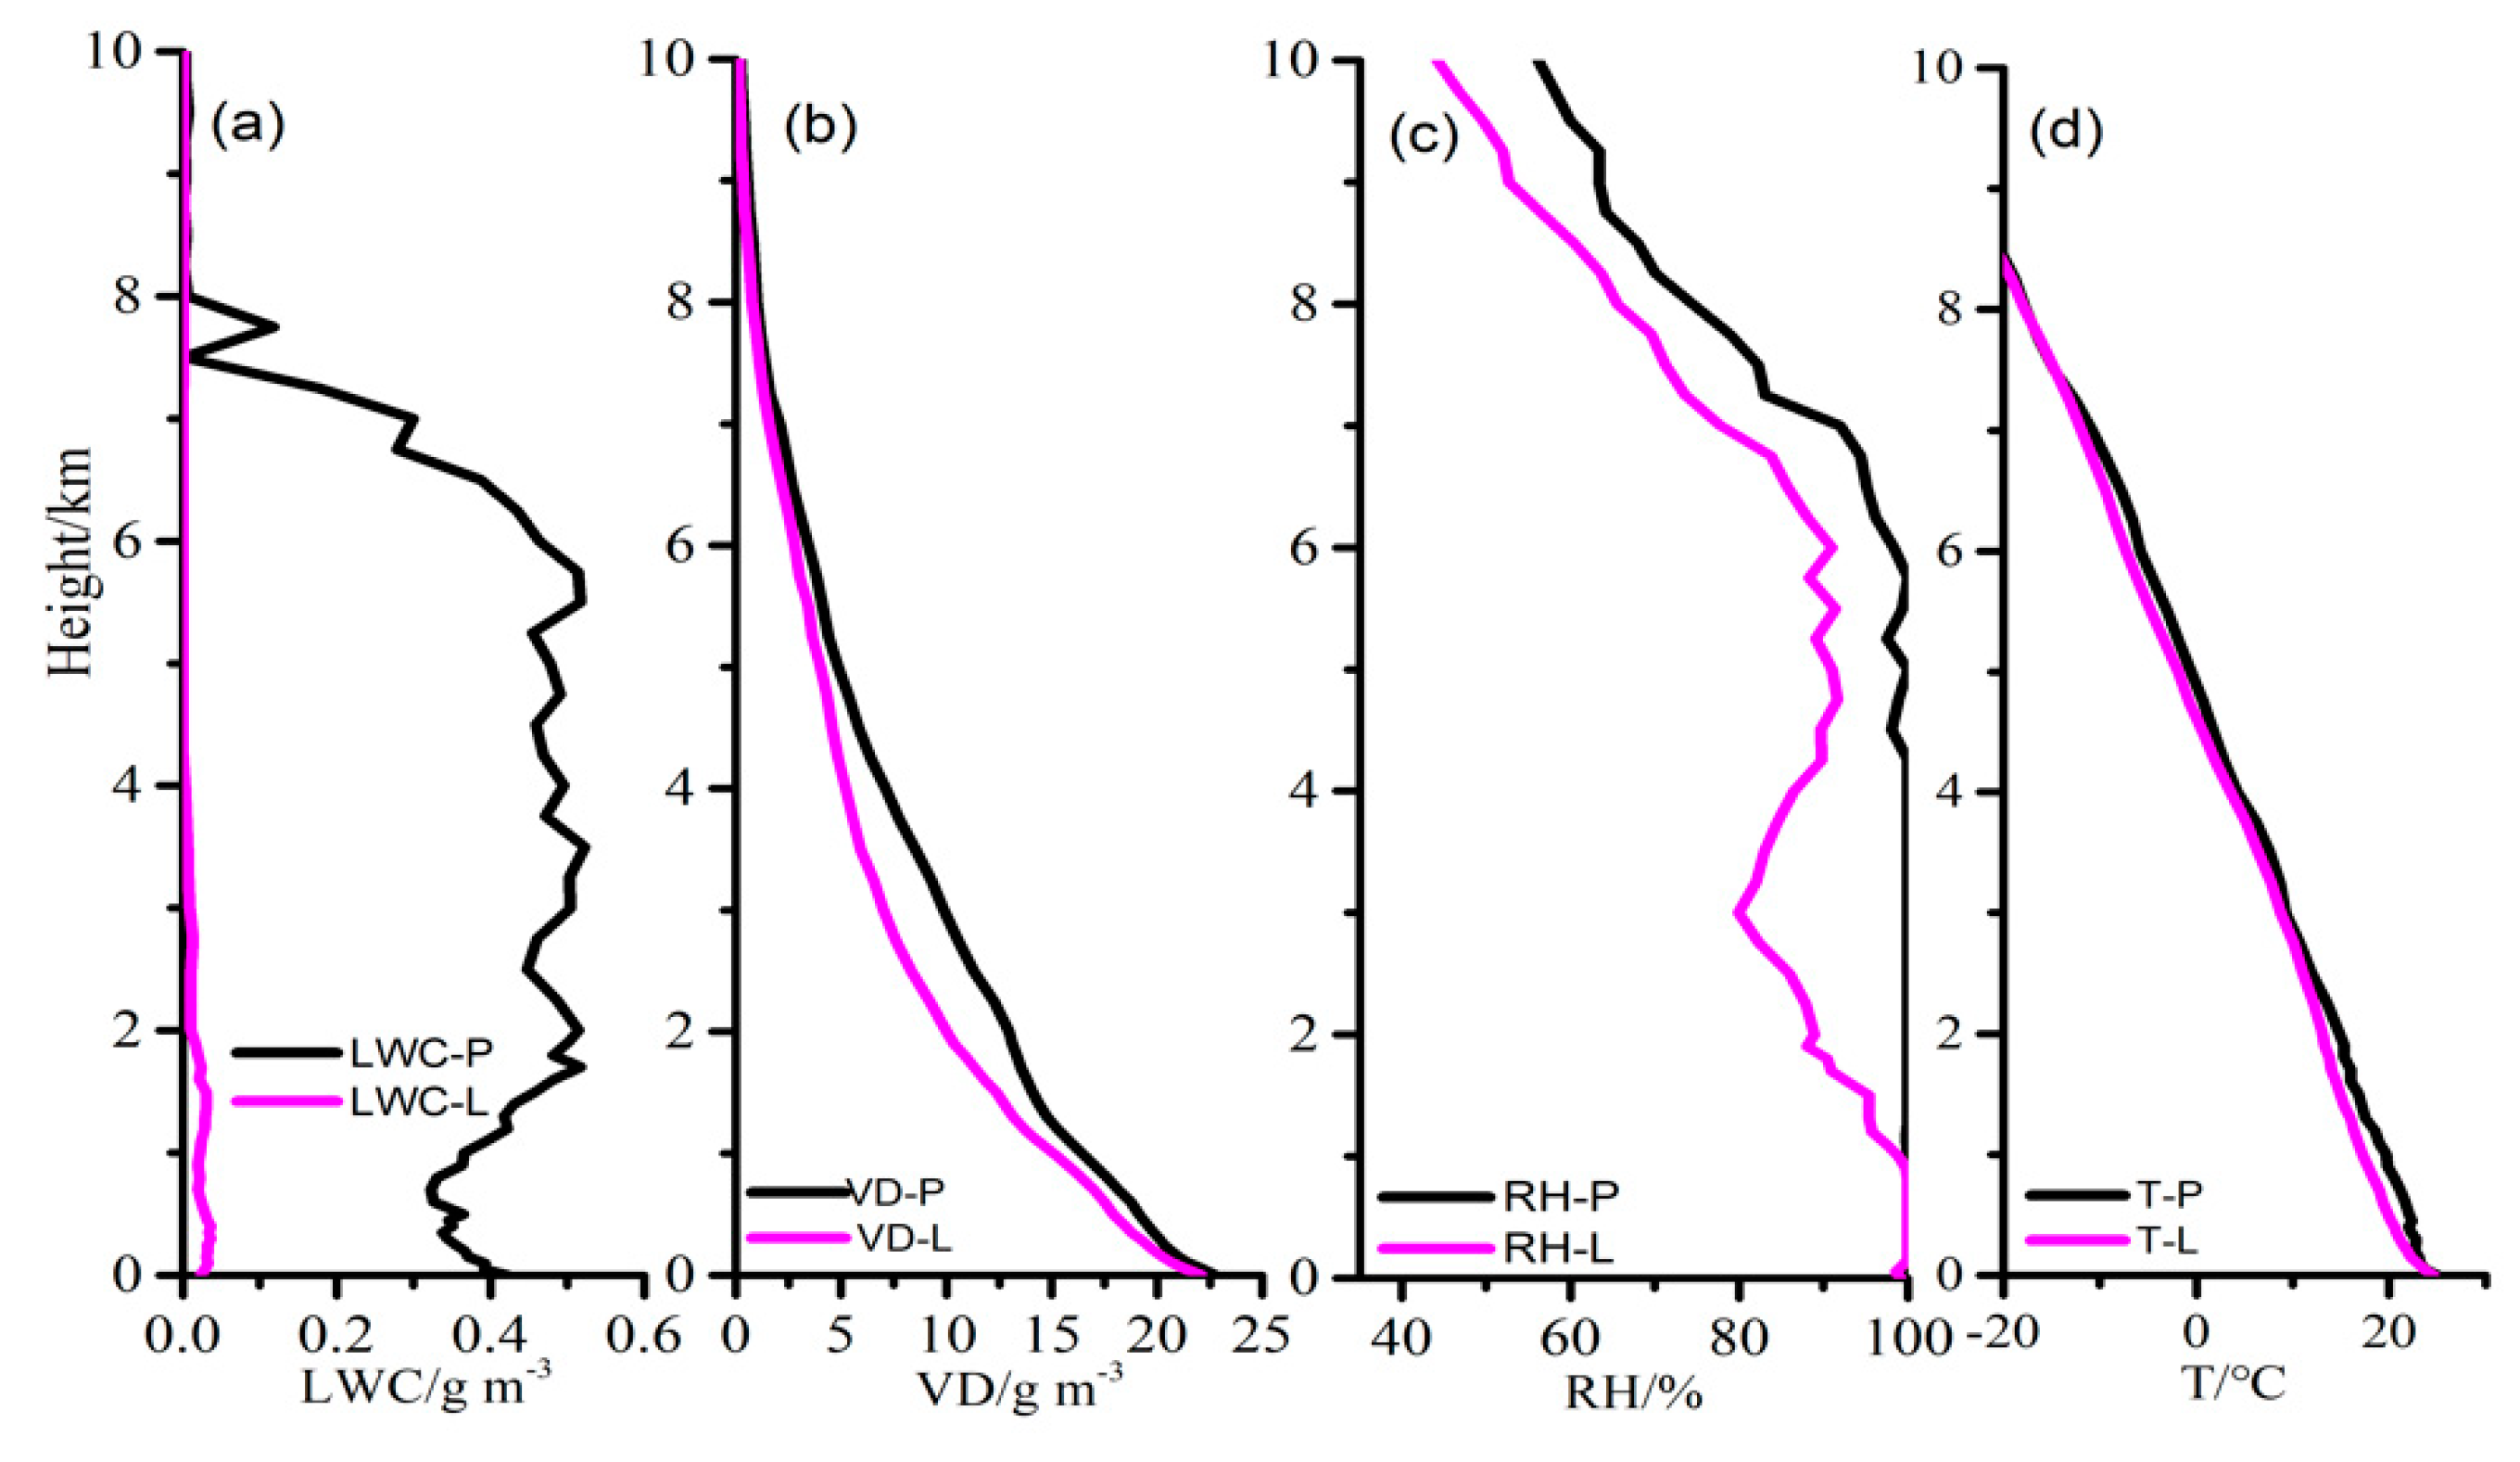
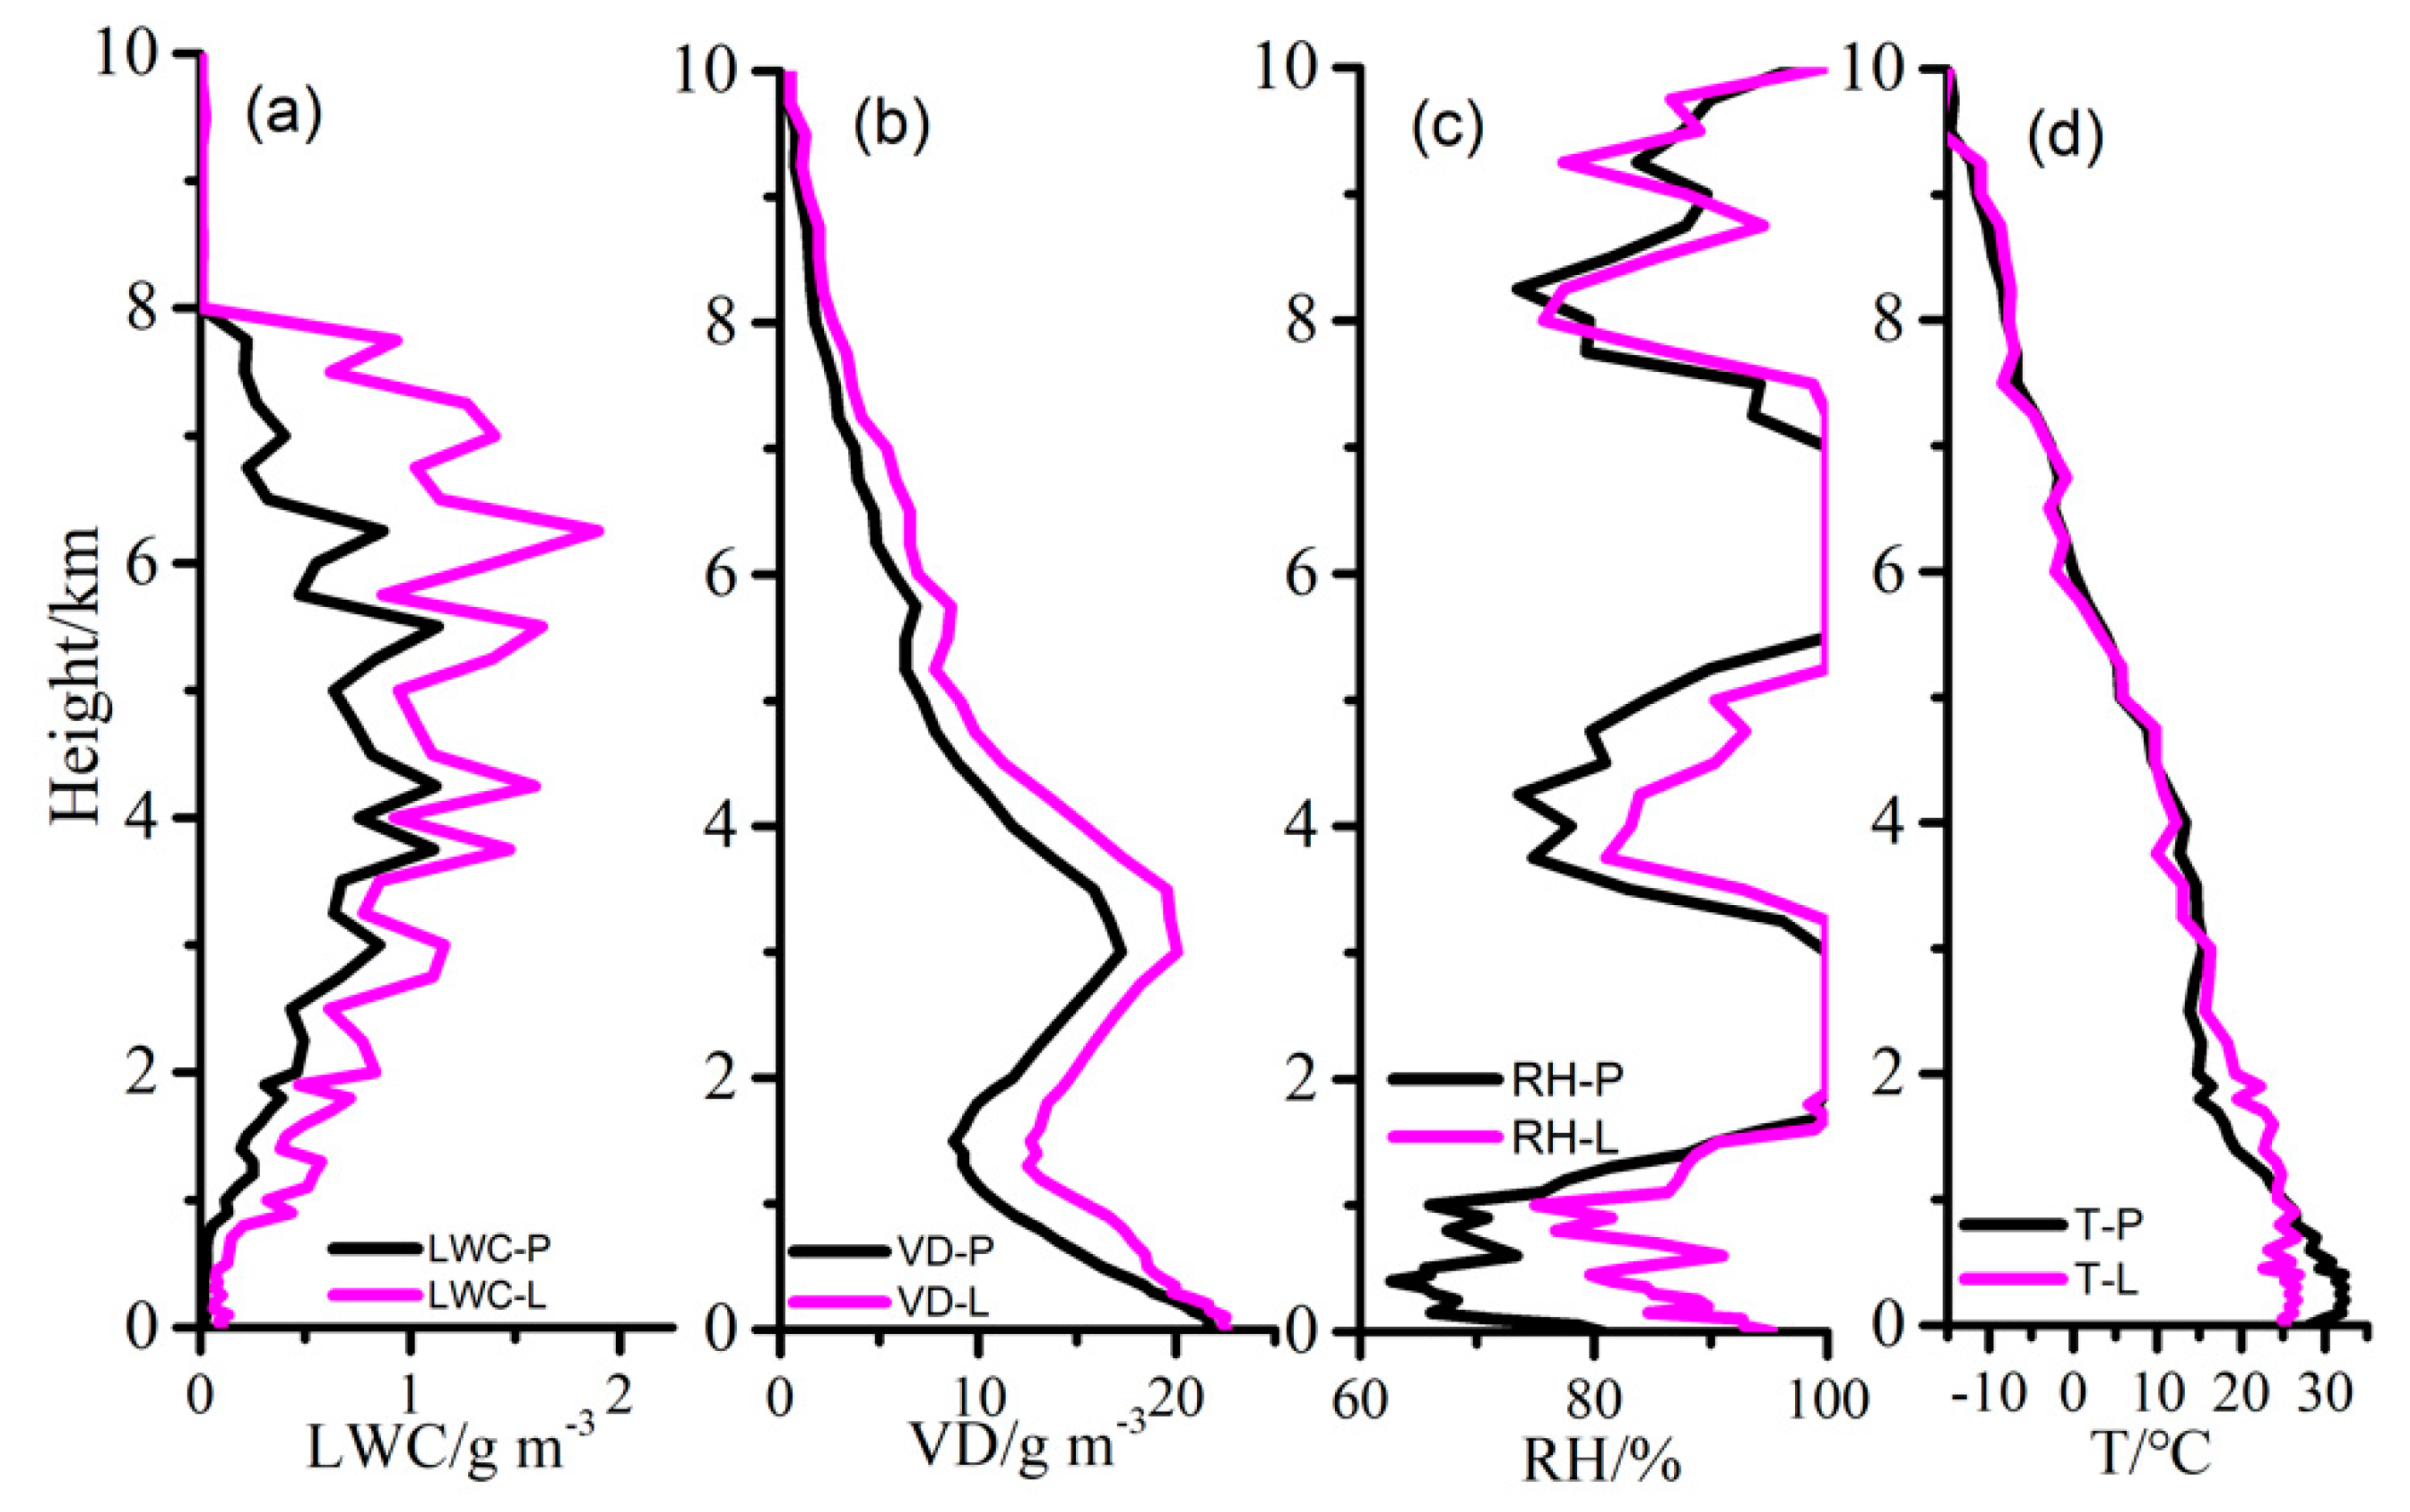
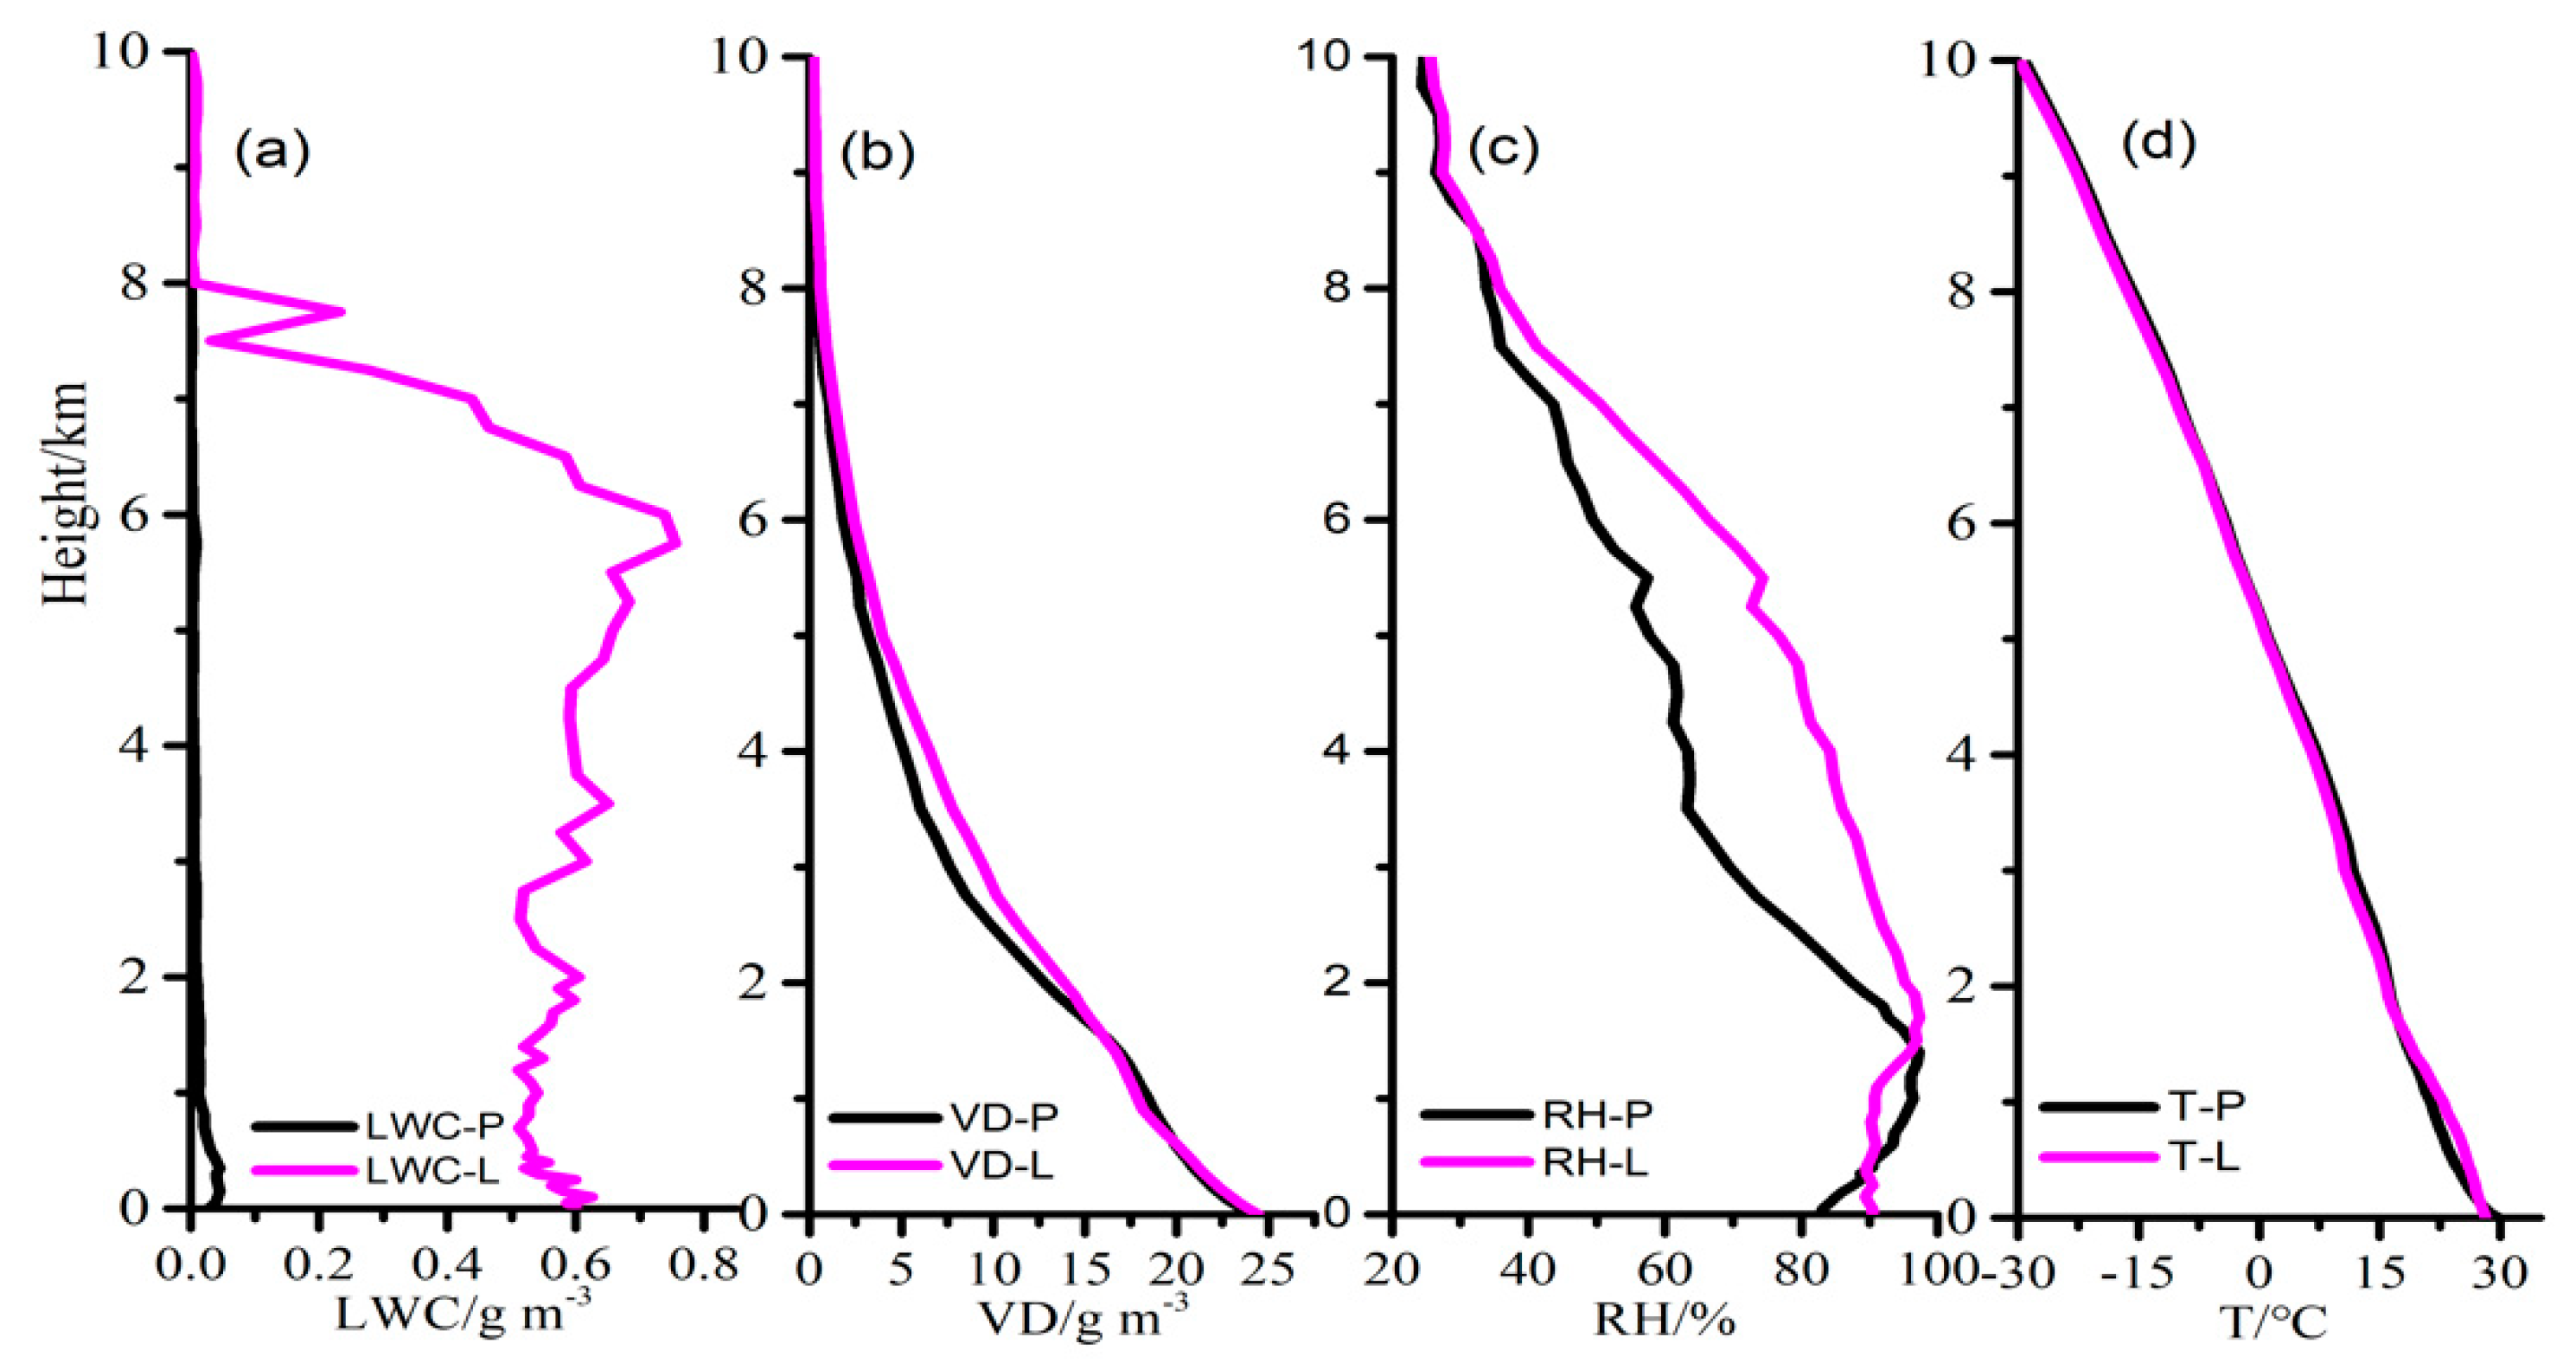
3.4. Environmental Characteristics

The formation of lightning flashes is closely related to the heat and humidity of air, which can be lifted by an updraft in unstable atmospheric environments. The rising vapor mainly contributes to the production of hydrometer particles. Therefore, VD and LWC may be the key factors affecting the formation of lightning flashes and thunderstorm microphysics, and these factors perhaps play a crucial role in the formation of lightning flashes and precipitation [54,55].
To investigate the characteristics of the cloud environment’s effect on lightning and precipitation, the temporal evolutions of VD and LWC during the peaks of CG flashes and precipitation in three cases are plotted (Figure 8). From the evolution of the observed LWC and VD in the period of the precipitation peak and CG flashes peak, there are two obvious variations of LWC before the CG flashes and precipitation reach the peak at about 2300 LT and 2030 LT in Case 1 (Table 4). The first one occurred 30 min before the precipitation peak (yellow box in Figure 8) with the LWC increasing to 1.0 g m−3 at the vertical height of 6 km, and the other one appeared 1.5 h after the precipitation peak. Besides, the thick layer of LWC at the 6 km decreased rapidly one hour before the lightning peak (blue box in Figure 8), and the corresponding LWC was reduced to 0.2 g m−3 at the same height. For the distribution of LWC and VD at the surface layer, the maximum LWC reached 0.5 g m−3 at the height of 1.5 km when the lightning peak appears (blue box in Figure 8a), then the content of LWC below 1.5 km decreased gradually, and the high value of VD was mainly below the height of 1 km (Figure 8d). In Case 2, the maximum of LWC was more than 2.7 g m−3 from 6.5 ~ 7 km at 1.5 h before the peak of precipitation (yellow box in Figure 8b), and the LWC of surface layer was more than 1.2 g m−3. Then, the LWC begins to decrease to less than 1.0 g m−3 when the precipitation peak appeared, and the LWC of the whole layer from 0 to 8 km was lower than before, which illustrates a large of LWC was consumed for the formation of raindrops and provided a favorable cloud-water environment for the formation of heavy rainfall. With the development of the convective cloud, the high LWC at 6.5–7.5 km appeared again within 1 h before the peak of CG flashes, the zone of high LWC sustained for about 1 h, and the vapor density in the middle and upper layers showed a tendency of increasing (Figure 8e). In Case 3, the vapor density increased obviously from the lower to the upper layer when the precipitation peak occurred, and the vapor density in the middle layer reached 14.0 g m−3 before the lightning peak (Figure 8f). Moreover, the total precipitation of Case 3 was less than that of other cases: the variations at the height of 6 km is similar to Case 1, and both of the LWC peaks in Case 1 and Case 3 corresponded to the maximum value of precipitation. After that, the LWC began to decrease with the increase of lightning activity (Figure 8c).
Figure 9, Figure 10 and Figure 11 show the vertical profile of LWC, VD, RH, and T in three cases at the peak of precipitation and lightning flashes, and there is a significant difference between the three cases in terms of their LWC profile. In Case 1, the structure of LWC profile is “upper layer smaller—middle layer larger—lower layer larger” at the peak of precipitation, and then the vertical profile of LWC is very low when the CG flashes reach the peak at about 2300 LT (Figure 9a). Compared to the structure of LWC profile in Case 1, the characteristic of LWC profile is “upper layer smaller—middle layer larger—lower layer smaller” at the peak of precipitation. The vertical structure of LWC at the peak of CG lightning flashes was the same as precipitation in Case 2, and the maximum of LWC was higher than Case 1 and Case 3 (Figure 10a). However, the profile feature of LWC in Case 3 at the lightning peak (Figure 11a: LWC-L) exhibited a similar variation characteristic with Case 1 at the precipitation peak (Figure 9a: LWC-P), but the maximum of LWC in Case 3 (0.75 g m−3) was higher than that of Case 1 (0.52 g m−3). Comparing the difference of VD between the three cases, there is a parallel between the distribution of VD profile in Case 1 and Case 3, and the curve of VD at the precipitation peak above the vertical height of 6 km in Case 1 and Case 3 coincides with that of the lightning peak. However, the main differences are as follow: (1) the maximum VD in Case 3 was higher than Case 1 at the peak of lightning and precipitation (Figure 9b and Figure 11b); (2) the value of VD at the precipitation peak was higher than that of lightning peak below 6 km in Case 1 (Figure 9b), but for the Case 3, the VD value at the lightning peak was higher than that of precipitation peak from 2 km to 6 km; (3) the curve of VD at the precipitation peak below the vertical height of 2 km in Case 3 coincided with that of the lightning peak (Figure 11b). Despite that the maximum VD in Case 2 was lower than in other cases, but the structure of the VD profile was different with Case 1 and Case 3. There were two inflection points at the height of 1.5 km and 3 km, respectively. The value of VD significantly decreased with the vertical height increasing from 0 to 1.5 km, and then the VD increased sharply from 1.5 to 3.0 km. When the height above 3 km, the VD value decreased with the vertical height increasing (Figure 10b). In addition, the sudden increase of VD from 1.5 km to 3 km in Case 2 indicated that a large amount of VD was accumulated in the middle layer of cloud, which provided sufficient water vapor conditions for the formation of the main precipitation particles (raindrop and graupel particle), so the total precipitation produced by Case 2 (193 mm) was higher than Case 1 (180 mm) and Case 3 (100.6 mm). Thus, we infer that the sudden increase of VD from 1.5 km to 3 km may be the difference of CAPE, precipitation and CG flashes in the three cases.
Because of the relative humidity (RH) is the key surface thermodynamic variable, precipitation and CG lightning activity in thunderstorms are related to several environmental features which include the humidity condition and temperature [8,56,57]. We also studied the variations of relative humidity and temperature at the peak of precipitation and lightning. Three pictures of the RH profile in Case 1, Case 2, and Case 3 are listed by the RH value-height in Figure 9c, Figure 10c, and Figure 11c. The RH profile structure from the Case 2 showed a vertical structure of “multi-layer dry and wet” from 0 to 10 km, and the curve of RH profile shows an alternative distribution of unsaturated and saturation (Figure 10c). The maximum of RH was lower than 80% in the surface layer (<1 km), and the value of RH decreased with the vertical height increasing below 1 km in Case 2. Then, the RH reached 100% from 2 km to 3 km at the peak of precipitation and lightning, RH began to decrease from 3 km to 4 km, the increasing trend of RH occurred at the height of 4~5.5 km, and the RH reaches 100% from 5.5 km to 7.5 km. Whereas in Case 1 and Case 3, the vertical structure of the RH profile was “upper layer dry and lower layer wet”, but the curve of RH profile at the surface layer was very different. In Case 1, the value of RH at the precipitation peak was higher than that of lightning peak above 1 km, and the RH is 100% below 1km at the peak of lightning and precipitation (Figure 9c). For Case 3, the curve of RH at the precipitation peak above the height of 8 km coincided with that of the lightning peak, and the value of RH at the lightning peak was more than the precipitation peak. In addition, there was an interesting difference at the surface layer in Case 3. The RH increased with height at the precipitation peak, but the RH value was always 90% at the lightning peak (Figure 11c). This may be the one of main reason for the difference in the number of CG flashes in three cases, the higher relative humidity condition at the surface leads to the enhancement of the liquid phase hydrometeors formation, and Shi et al. [58] also noted that lightning production is very sensitive to RH at the surface. Additionally, from Figure 9d, Figure 10d, and Figure 11d it can be seen that the height of the 20 °C layer was higher than Case 1 and Case 3 at the peak of lightning and precipitation. Combine with the variation of LWC, the value of LWC in Case 2 was 2.1 gm−3 higher than other cases. The higher LWC and temperature were more likely to restrain the generation of CG lightning flashes. This result is consistent with experimental evidences that higher LWC may hinder the charge of graupel particles, and then affect the production of lightning activity [54,59].
As noted, the information of VD, LWC, and RH can be utilized in investigation of the formation and development of precipitation and lightning activity. Before this study, we employed the data of VD and CG flashes based on the MWR and ADTD to estimate the precipitation, and found that the estimation results were consistent with observation [60]. Therefore, further aspects of MRW’s application will be addressed in forthcoming studies.

4. Conclusions

HPR, located in Central China, is a concentrated area of severe convective weather. Three severe convective processes occurred in HPR are selected, namely 14–15 May 2015 (Case 1), 6–7 July 2013 (Case 2), and 11–12 September 2014 (Case 3). In order to study the differences between the processes, the temporal and spatial distribution characteristics of CG lightning and precipitation, the distribution of radar parameters, and the evolution of cloud environment characteristics (including water vapor, liquid water content, relative humidity, and temperature) were compared and analyzed by using the lightning locator, radar, ground-based microwave radiometer (MWR), and automatic weather stations (AWS) data in this study. The analyses of results can be concluded the following:
(1) Combined with the evolution characteristics of radar echo before precipitation peak, it was found that with the increase of precipitation, the lightning activity of three cases also increased gradually, and when the precipitation reaches the peak, there were different intensities of +CG flashes in the strong echo zone. It showed that there was a certain physical relationship between +CG flashes and the occurrence of heavy precipitation, which needs further research and discussion.
(2) Based on TITAN algorithm, it can be seen that the spatial relationship between lightning flashes and precipitation is very complex, even if the thunderstorm cell produced by the same weather system, the relationship between lightning and precipitation is also different. The quantity of thunderstorm cells in Case 1 was more than other cases; the lightning activity produced by the fourteen thunderstorm cells was inversely correlated with the spatial distribution of precipitation centers in Case 1, and similar characteristics are also found in comparing CG flashes and precipitation spatial distribution in Case 1 to Case 2. In addition, the peak time of +CG flashes is prior to that of total CG flashes in Case 2 and Case 3 and the peak time of +CG flashes in Case 2 is prior to that of precipitation about 2 h. Moreover, 28.6% of +CG flashes produced by thunderstorm cells occurred at the center of precipitation (>30 mm), and the percentage was better than −CG flashes (13%). Whether it was the spatial or temporal distribution between CG flashes and precipitation, the correlations between +CG flashes and precipitation was better than −CG flashes.
(3) Compared to the structure of LWC profiles and VD profiles at the peak of precipitation and CG lightning, the structure of LWC profile was “upper layer smaller—middle layer larger—lower layer larger” at the peak of precipitation in Case 1. The characteristic of LWC profile was “upper layer smaller—middle layer larger—lower layer smaller” at the peak of precipitation and CG lightning flashes in Case 2, and the profile feature of LWC in Case 3 at the lightning peak exhibited a similar variation characteristic with Case 1 at the precipitation peak. The high LWC made it difficult for the collision with ice particles to generate electricity. This may be the one of main reason for the difference in the number of CG flashes in three cases.
(4) The sudden increase of VD from 1.5 km to 3 km in Case 2 indicates that abundant VD is accumulated in the middle layer of cloud, which provided sufficient water vapor conditions for the formation of the main precipitation particles (raindrop and graupel particle), so the total precipitation produced by Case 2 (193 mm) was higher than Case 1 and Case 3. Thus, we infer that the sudden increase of VD from 1.5 km to 3 km may be the difference of CAPE, precipitation and CG flashes in the three cases.
(5) Three cases were carried out driven by different rates of relative humidity at the surface. The structure of the RH profile was an alternative distribution of unsaturated space and saturation from 0 to 10 km in Case 2. Then, the vertical structure of RH profile in Case 1 was the same as Case 3: the structure was an “upper layer dry and lower layer wet”, the RH of surface layer reached 100% in Case 1, and that of Case 3 was higher than 90%. The higher relative humidity condition generally lead to a stronger convection and enhanced the production of CG flashes. So, this may be the other main reason for the difference in the number of CG flashes in the cases.

Author Contributions

Writing—review and editing, J.S., Investigation, Data curation, L.L.; Methodology, J.C.; Resources, G.X.

Funding

The work was supported by the Key projects of intergovernmental International Cooperation in Science, Technology and Innovation (No.2016YFE0109400) and the National Key Research and Development Plan (2017YFC1502502-01) and the National Natural Science Foundation of China (Grant No. 41275008, 41875170) and the Science and Technology Project of Guangdong Province (No. GRMC2017M28).

Acknowledgments

The authors are grateful to Hubei Meteorological Bureau for providing ADTD lightning data, AWS rainfall data and radar data.

Conflicts of Interest

The authors declare no conflict of interest.

References

  1. Doswell, C.A., III. Severe convective storms—An overview. In Meteorological Monograph; Springer Nature Switzerland AG: Basel, Switzerland, 2001; p. 3. [Google Scholar]
  2. Lang, T.J.; Rutledge, S.A. Relationships between Convective Storm Kinematics, Precipitation, and Lightning. Mon. Weather Rev. 2002, 130, 2492–2506. [Google Scholar] [CrossRef]
  3. MacGorman, D.R.; Rust, W.D.; Schuur, T.J.; Biggerstff, M.I.; Straka, J.M.; Ziegler, C.L.; Mansell, E.R.; Bruning, E.C.; Kuhlman, K.M.; Lund, N.R.; et al. TELEX the thunderstorm electrification and lightning experiment. Bull. Amer. Meteor. Soc. 2008, 89, 997–1013. [Google Scholar] [CrossRef]
  4. Orville, R.E.; Silver, A.C. Lightning ground flash density in the contiguous United States: 1992–1995. Mon. Weather Rev. 1997, 125, 631–638. [Google Scholar] [CrossRef]
  5. Brooks, H.E. Severe thunderstorms and climate change. Atmos. Res. 2013, 123, 129–138. [Google Scholar] [CrossRef]
  6. Reale, M.; Lionello, P. Synoptic climatology of winter intense precipitation events along the Mediterranean coasts. Nat. Hazards Earth Syst. Sci. 2013, 13, 1707–1722. [Google Scholar] [CrossRef]
  7. Púčik, T.; Groenemeijer, P.; Rýva, D.; Kolář, M. Proximity soundings of severe and nonsevere thunderstorms in central Europe. Mon. Weather Rev. 2015, 143, 4805–4821. [Google Scholar] [CrossRef]
  8. Takahashi, T.; Tetsuya, K. Different precipitation mechanisms produce heavy rain with and without lightning in Japan. J. Meteor. Soc. Jpn. 2015, 93, 245–263. [Google Scholar] [CrossRef]
  9. Wu, F.; Cui, X.P.; Zhang, D.L.; Qiao, L. The relationship of lightning activity and short-duration rainfall events during warm seasons over the Beijing metropolitan region. Atmos. Res. 2017, 195, 31–43. [Google Scholar] [CrossRef]
  10. Xia, R.; Zhang, D.L.; Wang, B. A 6-yr cloud-to-ground lightning climatology and its relationship to rainfall over central and eastern China. J. Appl. Meteor. Climatol. 2015, 54, 2443–2460. (In Chinese) [Google Scholar] [CrossRef]
  11. Xie, Y.R.; Wu, J.; Liu, X.T.; Zhang, T.F.; Xie, Y.J.; Xu, Y.J.; Zhao, D.M. Characteristics of cloud-to-ground lightning activity in hailstorms over Yunnan Province. J. Atmos. Sol.-Terr. Phy. 2015, 136, 2–7. [Google Scholar] [CrossRef]
  12. Qie, X.; Yu, Y.; Wang, H.B.; Zhang, C.H. Analyses on some features of ground flashes in Chinese inland Plateau. Plateau Meteorol. 2001, 20, 395–401. (In Chinese) [Google Scholar]
  13. Xu, W.; Adler, R.F.; Wang, N.Y. Combining satellite infrared and lightning information to estimate warm-season convective and stratiform rainfall. J. Appl. Meteorol. Climatol. 2014, 53, 180–199. [Google Scholar] [CrossRef]
  14. Xu, S.Z.; Wei, H.H. Some thoughts on the weather forecast of severe convective storms. Torrential Rain Disasters 2016, 35, 197–202. (In Chinese) [Google Scholar]
  15. Zhao, S.; Gao, G.; Huang, D.P. Characteristics of meteorological disaster losses in China from 2004 to 2013. J. Meteorol. Environ. 2017, 33, 101–107. [Google Scholar]
  16. Williams, E.R.; Boldi, B.; Matlin, A.; Weber, M.; Hodanish, S.; Sharp, D.; Goodman, S.; Raghavan, R.; Buechler, D. The behavior of total lightning activity in severe Florida thunderstorms. Atmos. Res. 1999, 51, 245–265. [Google Scholar] [CrossRef] [Green Version]
  17. Xu, W.; Zipser, E.J.; Liu, C.; Jiang, H. On the relationships between lightning frequency and thundercloud parameters of regional precipitation systems. J. Geophys. Res. 2010, 115, D12203. [Google Scholar] [CrossRef]
  18. Zhou, Y.J.; Qie, X.S.; Soula, S.A. Study of the relationship between cloud-to-ground lightning and precipitation in the convective weather system in China. Ann. Geophys. 2002, 20, 107–113. [Google Scholar] [CrossRef]
  19. Gungle, B.; Krider, E.P. Cloud-to-ground lightning and surface rainfall in warm-season Florida thunderstorms. J. Geophys. Res. 2006, 111. [Google Scholar] [CrossRef]
  20. Holle, R.L.; Watson, A.I.; López, R.E.; MacGorman, D.R.; Ortiz, R.; Otto, W.D. The life cycle of lightning and severe weather in a 3–4 June 1985 PRE-STORM mesoscale convective system. Mon. Weather Rev. 1994, 122, 1798–1808. [Google Scholar] [CrossRef]
  21. Makowski, J.A.; MacGorman, D.R.; Biggerstaff, M.I.; Beasley, W.H. Total lightning characteristics relative to radar and satellite observations of Oklahoma mesoscale convective systems. Mon. Weather Rev. 2013, 141, 1593–1611. [Google Scholar] [CrossRef]
  22. Rivas, S.L.; Pablo, F.D.; Diez, E.G. Relationship between convective precipitation and cloud-to-ground lightning in the Iberian Peninsula. Mon. Weather Rev. 2001, 129, 2998–3003. [Google Scholar]
  23. Piepgrass, M.V.; Krider, E.P.; Moore, C.B. Lightning and surface rainfall during Florida thunderstorms. J. Geophys. Res. 1982, 87, 11193–11201. [Google Scholar] [CrossRef]
  24. Wang, K.Y.; Liao, S.A. Lightning, radar reflectivity, infrared brightness temperature, and surface rainfall during the 2–4 July 2004 severe convective system over Taiwan area. J. Geophys. Res. 2006, 111, D05206. [Google Scholar] [CrossRef]
  25. Soula, S.; Chauzy, S. Some aspects of the correlation between lightning and rain activities in thunderstorms. Atmos. Res. 2000, 56, 355–373. [Google Scholar] [CrossRef]
  26. Carey, L.D.; Murphy, M.J.; McCormick, T.L.; Demetriades, N. Lightning location relative to storm structure in a leading-line, trailing-stratiform mesoscale convective system. J. Geophys. Res. 2005, 110, 1–23. [Google Scholar] [CrossRef]
  27. Carey, L.D.; Buffalo, K.M. Environmental control of cloud-to-ground lightning polarity in severe storms. Mon. Weather. Rev. 2007, 135, 1327–1353. [Google Scholar] [CrossRef]
  28. MacGorman, D.R.; Burgess, D.W. Positive cloud-to-ground lightning in tornadic storms and hailstorms. Mon. Weather Rev. 1994, 122, 1671–1697. [Google Scholar] [CrossRef]
  29. Rutledge, S.A.; MacGorman, D.R. Cloud-to-ground lightning activity in the 10–11 June 1985 Mesoscale convective system observed during the Oklahoma-Kansas Pre-storm project. Mon. Weather Rev. 1988, 116, 1393–1408. [Google Scholar] [CrossRef]
  30. Carey, L.D.; Petersen, W.A.; Rutledge, S.A. Evolution of cloud-to-ground lightning and storm structure in the Spencer, South Dakota, tornadic supercell of 30 May 1998. Mon. Weather Rev. 2003, 131, 1811–1831. [Google Scholar] [CrossRef]
  31. Ding, Z.Y.; Wang, N. Analyses on intensity difference and its causes of short-term heavy rainfall and hail in two squall line process. J. Meteorol. Sci. 2015, 35, 83–92. (In Chinese) [Google Scholar] [CrossRef]
  32. Steiger, S.M.; Orville, R.E.; Carey, L.D. Total lightning signatures of thunderstorm intensity over North Texas, PartⅡ: Mesoscale convective systems. Mon. Weather Rev. 2007, 135, 3303–3324. [Google Scholar] [CrossRef]
  33. Knupp, K.R.; Peach, S.; Goodman, S. Variations in cloud-to-ground lightning characteristics among three adjacent tornadic supercell storms over the Tennesee valley region. Mon. Weather Rev. 2003, 131, 172–188. [Google Scholar] [CrossRef]
  34. Gilmore, M.S.; Wicker, L.J. Influences of the local environment on supercell cloud-to-ground lightning, radar characteristics, and severe weather on 2 June 1995. Mon. Weather Rev. 2002, 130, 2349–2472. [Google Scholar] [CrossRef]
  35. Cetrone, J.; Houze, R.A. Leading and trailing anvil clouds of West African squall lines. J. Atmos. Sci. 2011, 68, 1114–1123. [Google Scholar] [CrossRef]
  36. Lund, N.R.; MacGorman, D.R.; Schuur, T.J.; Krehbiel, W.R.; Hamlin, T.; Straka, J.M.; Biggerstaff, M.I. Relationships between lightning location and polarimetric radar signatures in a small mesoscale convective system. Mon. Weather Rev. 2009, 137, 4151–4170. [Google Scholar] [CrossRef]
  37. Chan, P.W. Performance and application of a multi-wavelength, ground-based microwave radiometer in intense convective weather. Meteorol. Z. 2009, 18, 253–265. [Google Scholar] [CrossRef]
  38. Xu, G.; Ware, R.; Zhang, W.; Feng, G.; Liao, K.; Liu, Y. Effect of off-zenith observations on reducing the impact of precipitation on ground-based microwave radiometer measurement accuracy. Atmos. Res. 2014, 140, 85–94. [Google Scholar] [CrossRef]
  39. Knupp, K.; Ware, R.; Cimini, D.; Vandenberghe, F.; Vivekanandan, J.; Westwater, E.; Coleman, T. Ground-based passive microwave profiling during dynamic weather conditions. J. Atmos. Oceanic Technol. 2009, 26, 1057–1073. [Google Scholar] [CrossRef]
  40. Gultepe, I.; Zhou, B.; Milbrandt, J. A review on ice fog measurements and monitoring. Atmos. Res. 2015, 151, 2–19. [Google Scholar]
  41. Madhulatha, A.; Rajeevan, M.; Ratnam, M.V.; Bhate, J.; Naidu, C.V. Nowcasting severe convective activity over southeast India using ground-based microwave radiometer observations. J. Geophys. Res. 2013, 118, 1–13. [Google Scholar] [CrossRef] [Green Version]
  42. Serke, D.; Hall, E.; Bognar, J.; Jordan, A.; Abdo, S.; Baker, K.; Seite, T.; Nelson, M.; Ware, R.; McDonough, F.; et al. Supercooled liquid water content profiling case studies with a new vibrating wire sonde compared to a ground-based microwave radiometer. Atmos. Res. 2014, 149, 77–87. [Google Scholar] [CrossRef] [Green Version]
  43. Xie, X.L.; Liu, L.P. Retrieval of liquid water content profiles in mixed and rainy stratus clouds by combing cloud radar and microwave radiometer. Torrential Rain Disasters 2016, 35, 1–9. (In Chinese) [Google Scholar]
  44. Wang, G.; Wang, L. Temporal and spatial distribution of short-time heavy rain of Beijing in summer. Torrential Rain Disasters 2013, 32, 276–279. (In Chinese) [Google Scholar]
  45. Crum, T.D.; Alberty, R.L.; Burgess, D.W. Recoding, Archiving, and Using WSR-88D Data. Bull. Am. Meteor. Soc. 1993, 74, 645–653. [Google Scholar] [CrossRef]
  46. Zhu, X.Y.; Zhu, J.J. New Generation Weather Radar Network in China. Meteor. Sci. Tech. 2004, 32, 255–257. (In Chinese) [Google Scholar]
  47. Schultz, C.J.; Petersen, W.A.; Carey, L.D. Preliminary development and evaluation of lightning jump algorithms for the real-time detection of severe weather. J. Appl. Meteor. Climatol. 2009, 48, 2543–2563. [Google Scholar] [CrossRef]
  48. Crane, R.K. Automatic cell detection and tracking. IEEE Trans. Geosci. Eletron. 1979, 17, 250–262. [Google Scholar] [CrossRef]
  49. Dixon, M.; Wiener, G. TITAN: Thunderstorm Identification, Tracking, Analysis, and Nowcasting—A Radar-based Methodology. J. Atmos. Ocean. Technol. 1993, 10, 785–797. [Google Scholar] [CrossRef]
  50. Xu, S.Z.; Liu, L.C.; Jiang, H.R. Analysis on characteristics on the calamity of severe convective storm in Hubei Province. J. Catastr. 2004, 19, 1–5. (In Chinese) [Google Scholar]
  51. Meteorology Glossary, American Meteorological Society Home Page. Available online: http://glossary.ametsoc.org/wiki/Convective_available_potential_energy (accessed on 2 September 2018).
  52. Koutroulis, A.G.; Grillakis, M.G.; Tsanis, I.K.; Kotroni, V.; Lagouvardos, K. Lightning activity, rainfall and flash flooding-occasional or interrelated events? A case study in the island of Crete. Nat. Hazards Earth Syst. Sci. 2012, 12, 881–891. [Google Scholar] [CrossRef]
  53. Xiao, Y.J.; Ma, Z.Y.; Li, Z.H. Advanced algorithms of ET, VIL and VIL density for the CINRAD. Torrential Rain Disasters 2009, 28, 210–214. (In Chinese) [Google Scholar]
  54. Saunders, C.P.R.; Keith, W.D.; Mitzeva, R.P. The effect of liquid on thunderstorm charging. J. Geophys. Res. 1991, 96, 11007–11017. [Google Scholar] [CrossRef]
  55. Sun, J.; Shi, Z.; Chai, J.; Xu, G.R.; Niu, B. Effects of Mixed Phase Microphysical Process on Precipitation in a Simulated Convective Cloud. Atmosphere 2016, 7, 97. [Google Scholar] [CrossRef]
  56. Baker, M.B.; Dash, J.G. Mechanism of charge transfer between colliding ice particles in thunderstorms. J. Geophys. Res. 1994, 99, 10621–10626. [Google Scholar] [CrossRef] [Green Version]
  57. Petersen, W.A.; Rutledge, S.A. Regional variability in tropical convection: Observations from TRMM. J. Clim. 2001, 14, 3566–3586. [Google Scholar] [CrossRef]
  58. Shi, Z.; Tan, Y.; Liu, Y.; Liu, J.; Lin, X.T.; Wang, M.Y.; Luan, J. Effects of relative humidity on electrification and lightning discharges in thunderstorms. Terr. Atmos. Ocean. Sci. 2018, 29, 695–708. [Google Scholar] [CrossRef] [Green Version]
  59. Xie, Y.R.; Qie, X.S.; Guo, F.X.; Marcia, B. Numerical simulation of the effect of liquid water content and ice crystal concentration on lightning flash frequency. Plateau Meteorol. 2005, 24, 588–603. (In Chinese) [Google Scholar]
  60. Sun, J.; Cai, R.; Chai, J.; Xu, G.R.; Gou, A.N. A preliminary study on estimation of rainfall in convective weather system by using lightning location system and ground microwave radiometers retrivals. J. Arid Meteorol. 2018, 36, 438–446. (In Chinese) [Google Scholar]
Figure 1. (a) Locations of the Hubei Province Region (HPR) (orange rectangle) and topography (shaded, m) over the HPR and its adjacent areas. Panel (b) is a zoomed-in area of the orange rectangle in (a) which shows the spatial distribution of the Doppler radar (black solid circle), Advanced Time of arrival and Direction systems (ADTDs) (black triangles) and microwave radiometer (MWR) (rose box) used in this study.
Atmosphere 10 00298 g001
Figure 2. Temporal distribution of lightning and precipitation. (a) Case 1; (b) Case 2; (c) Case 3; red dotted box represents the region of precipitation peak and CG (Cloud to ground) lightning peak, in which the starting point and end point of red dotted box are 1 h before the peak of precipitation and 2 h after the peak of CG flashes, respectively.
Atmosphere 10 00298 g002
Figure 3. Cloud-to-ground (CG) lightning distribution superposed on the plan position indicator (PPI) of radar reflectivity at an elevation angle of 0.5° before the precipitation peak in Case 1 (a,b), Case 2 (c,d), and Case 3 (e,f). The symbols “+” and “−“ represent positive and negative CG lightning within 6 min of the radar scan time, respectively.
Atmosphere 10 00298 g003
Figure 4. The spatial distribution of CG flashes produced by 14 thunderstorm cells and hourly precipitation (color contours, unit: mm) in Case 1 (grey triangle: 1 ≤ N−CG ≤ 100; red triangle: 100 < N−CG; yellow plus: 1 ≤ N+CG ≤ 10; green plus: N+CG > 10, unit: flashes per 6 min).
Atmosphere 10 00298 g004
Figure 5. Same as Figure 4 but for Case 2.
Atmosphere 10 00298 g005
Figure 6. Same as Figure 4 but for Case 3.
Atmosphere 10 00298 g006
Figure 7. Box-and-whisker plots of the maximum height of 18 dBZ radar echo (a) Case 1, (b) Case 2, and (c) Case 3 in the thunderstorm cells. Box, whiskers, and the black squares show the individual interquartile ranges, 90th and 10th percentile, and the mean value, respectively. The symbol of “−“ and “×” respresent the maximum and minimum.
Atmosphere 10 00298 g007
Figure 8. Evolution of liquid cloud content (a,b,c) and vapor density (d,e,f)for Case 1, Case 2, and Case 3 (shade, unit: g⋅m−3, yellow box: the time of precipitation peak; blue box: the time of lightning peak).
Atmosphere 10 00298 g008
Figure 9. The vertical profiles of liquid water content (LWC) (a), vapor density (VD) (b), relative humidity (RH) (c), and temperature (T) (d) in the precipitation peak and CG flashes peak of Case 1. (p represents the peak pf precipitation at the time of 2030 LT; -L represents the maximum number of CG flashes at the 2300 LT on 14 May 2015).
Atmosphere 10 00298 g009
Figure 10. Same as Figure 9 but for Case 2 (Precipitation peak at 1000 LT and the maximum number of CG flashes at 1930 LT on 6 July 2013). The vertical profiles of liquid water content (LWC) (a), vapor density (VD) (b), relative humidity (RH) (c), and temperature (T) (d).
Atmosphere 10 00298 g010
Figure 11. Same as Figure 9 but for Case 3 (Precipitation peak at 1400 LT and the maximum number of CG flashes at 0100 LT on 12 September 2014). The vertical profiles of liquid water content (LWC) (a), vapor density (VD) (b), relative humidity (RH) (c), and temperature (T) (d).
Atmosphere 10 00298 g011
Table 1. Descriptive table of 2013–2015 strong convective events in Hubei Province, China selected for comparative analysis. CAPE (convective available potential energy) was derived from nearby sounding sites. Lightning amount: total quantity of +CG and −CG flashes. Ratio of +CG flashes: +CG percentage of +CG flashes to total CG.
Observation Date24 h Accumulative PrecipitationCG Flash AmountRatio of +CG FlashesCAPESounding Site
Case 114−15 May 2015180 mm6133011.8%2499.7Yichang
Case 206–07 July 2013193 mm344414.9%210.2Wuhan
Case 311–12 Sep 2014100.6 mm118504.3%2565.8Wuhan
Table 2. Identification of thunderstorm cells in three strong convection period based on Thunderstorm Identification, Tracking, Analysis, and Nowcasting (TITAN). The time window includes the peaks of lightning and precipitation (red box in Figure 2). Max-Ncg is the maximum number of CG flashes produced by a thunderstorm cell per minute. Tmax-Ncg is the time of Max-Ncg.
Radar SiteTime Window *Thunderstorm CellsCG Flash NumbersMax-NcgTMax-Ncg
Case 1Wuhan1930 LT–0300 LT146101990108 LT
Case 2Yichang0900 LT–2130 LT5167552022 LT
Case 3Jingzhou1300 LT–0300 LT42972450146 LT
* Time window is taken from the red dotted box section of Figure 2.
Table 3. The Correlation between lightning and radar echo intensity at different temperature levels in the Case 1, Case 2, and Case 3 (MR0 °C, MR−15 °C, MR−20 °C, MR−25 °C, and MR0 °C↑ are the Maximum echo intensities at temperature layers of 0 °C, −15 °C, −20 °C, −25 °C, and above 0 °C, respectively; H18DBZ is the maximum height of 18 dBZ).
MR0 °CMR−10 °CMR−15 °CMR−20 °CMR−25 °CMR0 °C↑MH18 dBZ
Case 10.070.350.340.330.320.350.48
Case 20.050.190.2770.270.30.060.44
Case 30.110.220.270.290.310.110.53
Table 4. Time of precipitation and CG flashes peak in three cases.
DateTime of Precipitation Peak/LTTime of CG Flashes Peak/LT
Case 114 May 201520302300
Case 26 July 201310001930
Case 311–12 September 201414000100

