Article

A Motion Control of Soft Gait Assistive Suit by Gait Phase Detection Using Pressure Information

1
Institute of Biomaterials and Bioengineering, Tokyo Medical and Dental University, Tokyo 101-0062, Japan
2
Graduate School of Medical and Dental Sciences, Tokyo Medical and Dental University, Tokyo 101-0062, Japan
3
Institute of Innovative Research, Tokyo Institute of Technology, Kanagawa 226-8503, Japan
*
Author to whom correspondence should be addressed.
Appl. Sci. 2019, 9(14), 2869; https://doi.org/10.3390/app9142869
Submission received: 11 June 2019 / Revised: 10 July 2019 / Accepted: 15 July 2019 / Published: 18 July 2019
(This article belongs to the Section Mechanical Engineering)

Abstract

:
Power assistive devices have been developed in recent years. To detect the wearer’s motion, conventional devices require users to wear sensors. However, wearing many sensors increases the wearing time, and usability of the device will become worse. We developed a soft gait assistive suit actuated by pneumatic artificial rubber muscles (PARMs) and proposed its control method. The proposed suit is easy to wear because the attachment unit does not have any electrical sensors that need to be attached to the trainee’s body. A target application is forward walking exercise on a treadmill. The control unit detects the pre-swing phase in the gait cycle using the pressure information in the calf back PARMs. After the detection, the suit assists the trainee’s leg motion. The assist force is generated by the controlled PARM pressure, and the pressure input time is changed appropriately considering the gait cycle time. We conducted walking experiments; (1) verifies the proposed control method works correctly, and (2) verifies whether the gait assistive suit is effective for decreasing muscular activity. Finally, we confirmed that the accurate phase detection can be achieved by using the proposed control method, and the suit can reduce muscular activity of the trainee’s leg.

1. Introduction

1.1. Background

Power assistive devices have been developed in recent years [1,2,3] for various purposes: in the welfare field for nursing [4,5], rehabilitation [6,7,8,9,10], and gait assistance [11,12,13,14,15,16,17,18,19]; in the industrial field for assembling and load-carrying [20,21,22,23,24]; and in the military field [25]. For example, Sankai [4] developed a robot suit HAL (Hybrid Assistive Limb) driven by electric motors, and it detects the walking intention by bioelectrical sensors attached to the users. Chen et al. [6] proposed an upper limb rehabilitation robot embedded with force/torque sensors. Asbeck et al. [11,12,13] developed a soft exosuit which is light weight system driven by Bowden cables, and Lee et al. [26] proposed the online control parameter tuning method of the soft exosuit. Kobayashi et al. [23] developed a muscle suit driven by a pneumatic artificial rubber muscle (PARM), and measured muscle fatigue by oxygen concentration in the blood in order to evaluate the assist effect [24]. BLEEX (Berkeley Lower Extremity Exoskeleton) [25] was developed for enhancing carrying capacity and is driven by hydraulic actuators. These devices have different mechanisms, and appropriate sensors and actuators are utilized in each situation. One of the technical challenges for realizing a practical assistive device is to synchronize the assistive force to the wearer’s motion. To detect the wearer’s intention of motion, most conventional devices require users to wear electric sensors, such as bioelectrical sensors [4,5], joint-angle sensors [10,14,20,22], inertial measurement unit (IMU) [11,12,13], force/torque sensors [6,15,17,22], and undersole pressure sensors [11,12,13,20,25]. The reliability of the intention detection can be increased by fusing multi-modal information from different type sensors. However, wearing many sensors increases the time required to start up the device because of its calibration process, and usability of the device will become worse. Therefore, from an easy wearing point of view, it is desirable for the assistive devices to reduce wearable sensors.
On the other hand, several assistive devices using the PARMs have been developed [27]. The PARM has high power-to-weight ratio and is lightweight and soft, making it suitable for exoskeleton type power assistive device. Wehner et al. [28] developed a pneumatic gait assistive suit helps the ankle motion. This suit uses electric foot switches for the motion detection. Sridar et al. [29] developed a soft-inflatable exosuit for knee rehabilitation. This device uses IMUs and shoe insole sensors. Park et al. [30] developed a wearable device for ankle-foot rehabilitation. Sasaki et al. [31] developed a pneumatic assistive device with a wearable air supply system. The targets of these researches [30,31] are the novel device design, and motion detection method is not their subjects. Kanno et al. [18] proposed a pneumatically-driven walking assistive device and its control method using the backdrivability of the PARMs. In this control method, the gait phase of the wearer is detected by using air pressure sensors isolated from the device itself, without attaching electric sensors to the wearer’s body.
The several gait phase detection methods have been developed. For example, Huang et al. [32] developed an algorithm to continuously recognize a variety of locomotion modes performed by patients with transfemoral amputations. Electromyogram (EMG) signals and ground reaction forces/moments were measured and used for the algorithm. Lim et al. [33] developed an insole sensor system that can determine various dynamic models of a lower extremity exoskeleton. Altilio et al. [34] proposed a feature selection method to evaluate all the possible combinations of the gait parameters, in order to find the best subset able to classify among diseased and healthy subjects. In this method, medical data is retrieved from a stereophotogrammetric system. Wang et al. [35] proposed a gait recognition system based on support vector machine which uses plantar pressure sensors and acceleration sensors of the human legs. Lee et al. [36] proposed a gait type classification method based on deep learning using a smart insole with various sensor arrays. These methods require many electric sensors since their main target is to realize high precision detection. Compared with them, the gait phase detection method in [18] has a unique feature as that the PARM is used as the actuator and the non-electric sensor. Only the small number of the PARMs are used for the gait phase detection since the target of the device [18] is to realize high usability. Thanks to this configuration, this device realizes the short wearing time. However, the device [18] still has several issues to be solved as follows:
  • The walking assistive device has a rigid link system. However, its heavy weight will decrease the safeness and usability, especially for elder persons.
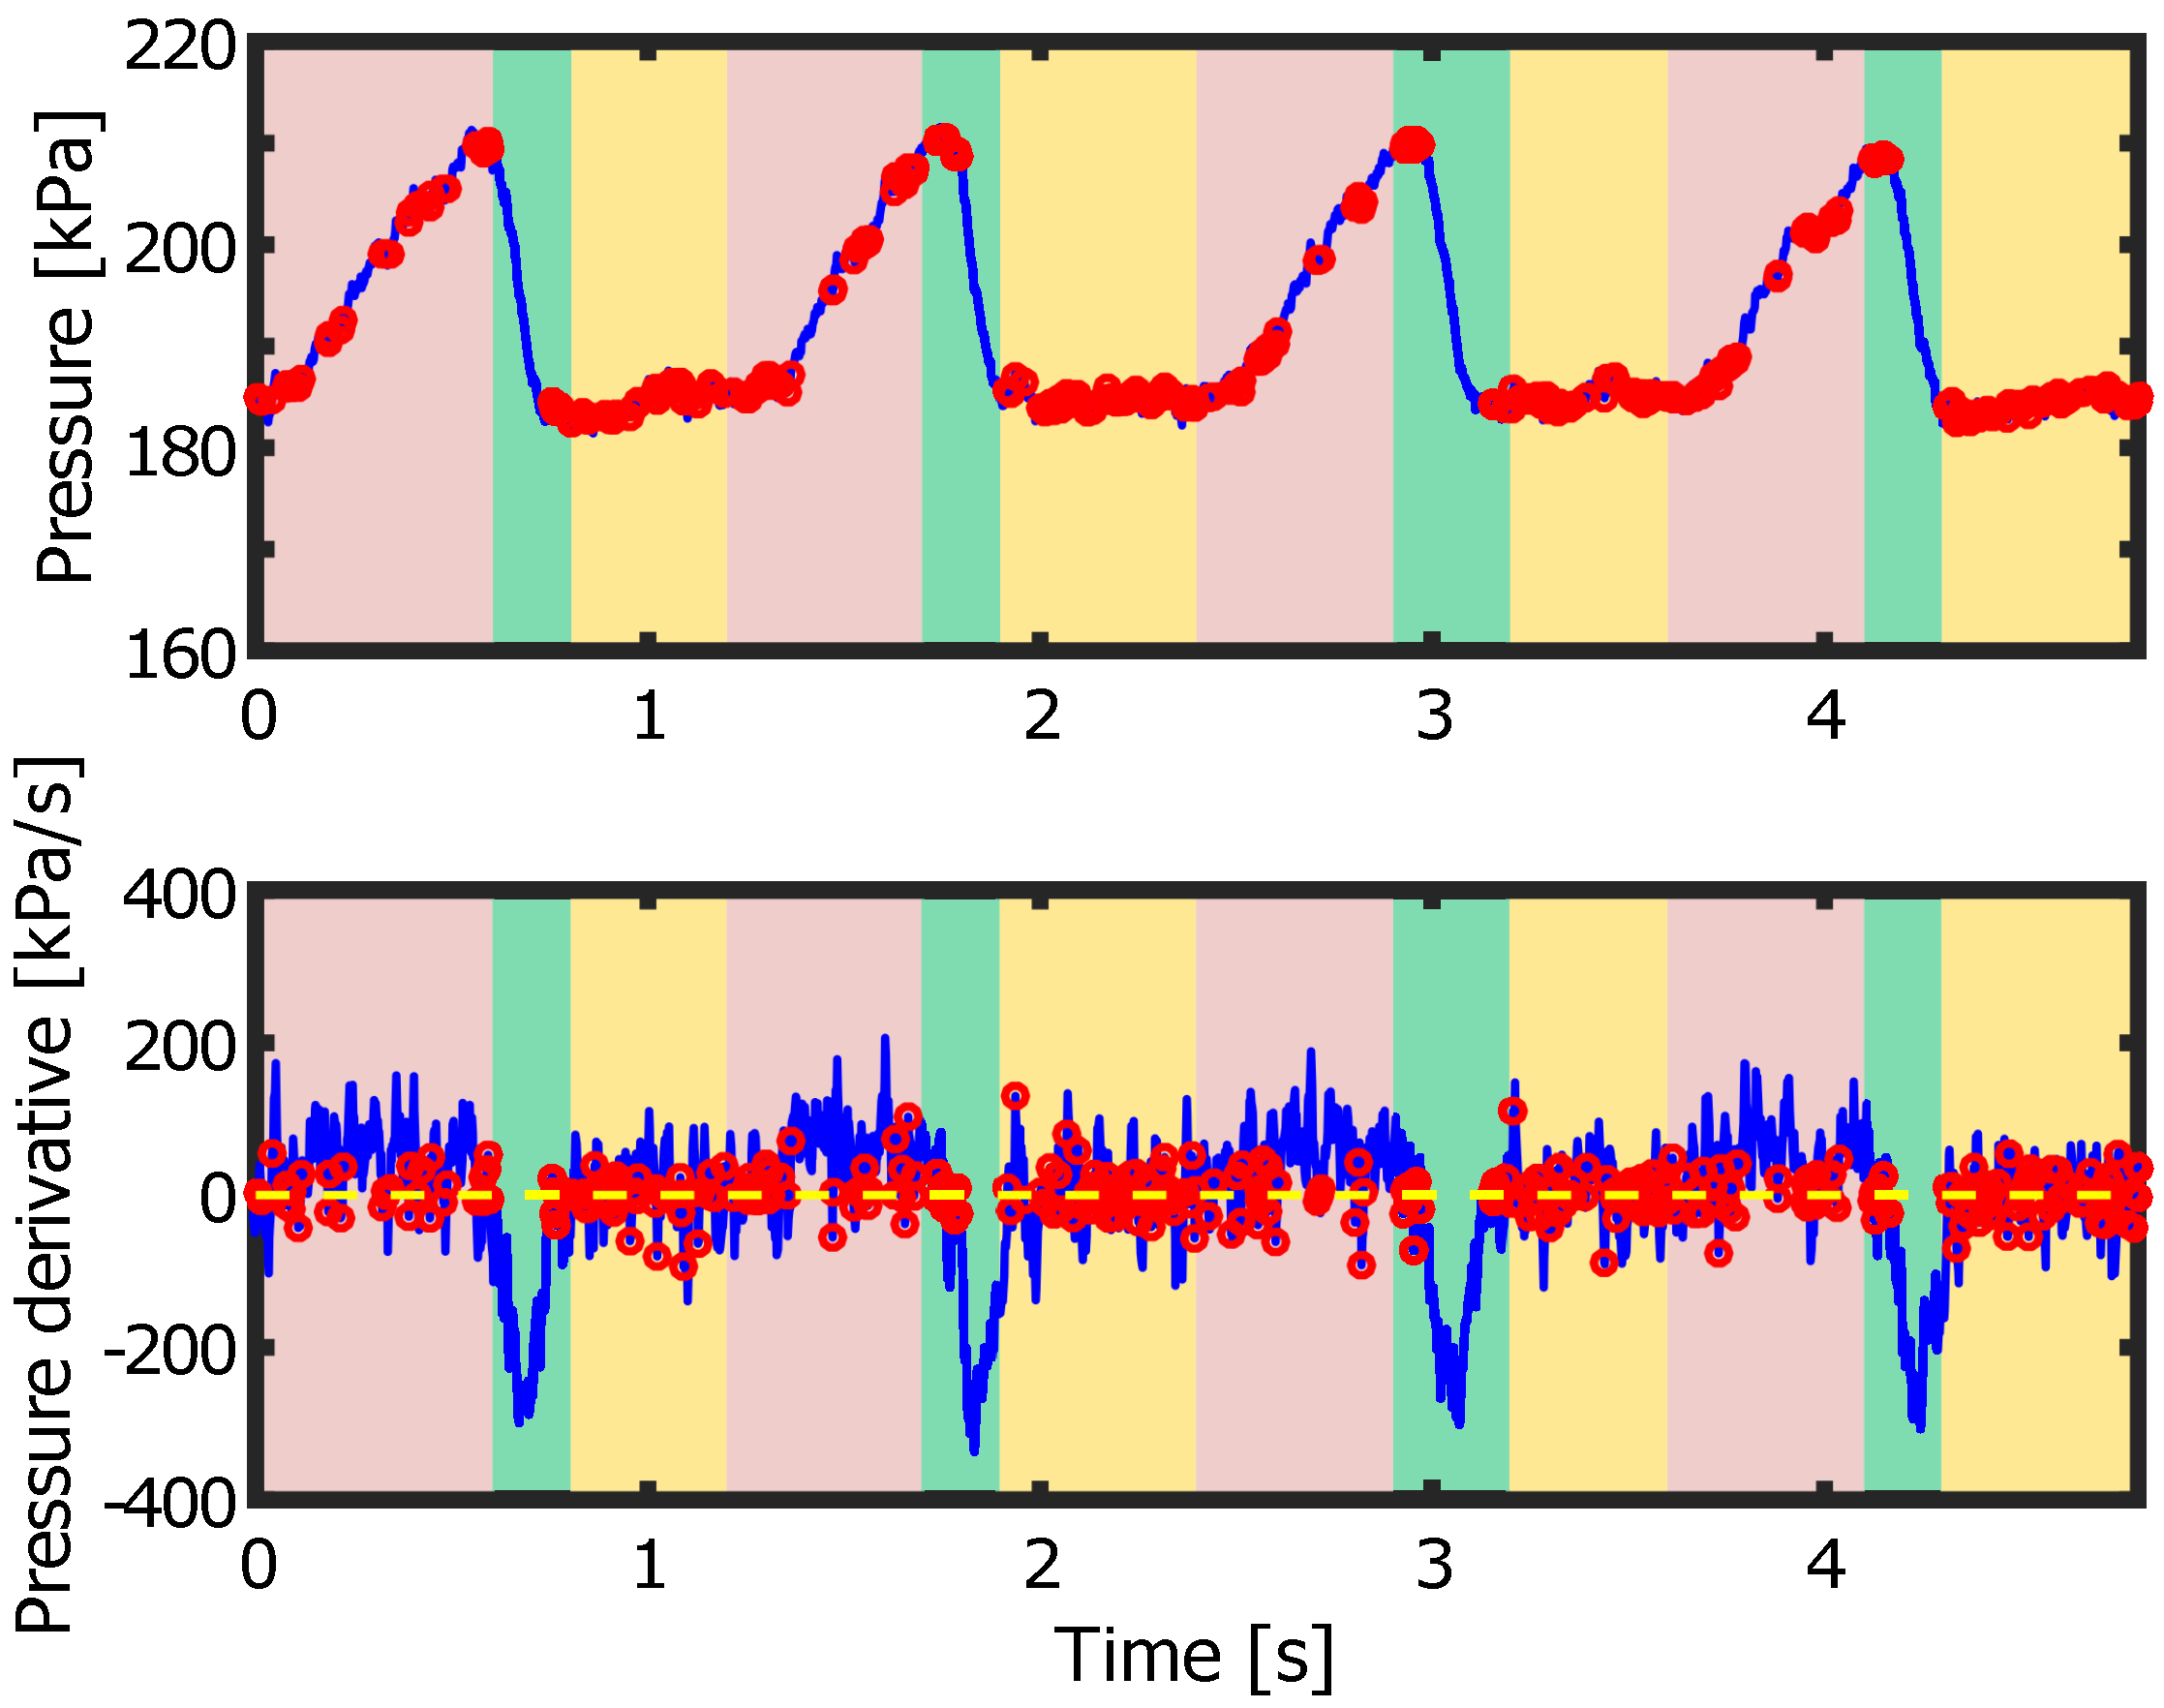
  • The gait phase detection method uses the time derivative of the pressure. However, it is not sufficient for the accurate detection since there are several timings which satisfy the detection condition in one gait cycle.
  • Pressure input time of the PARMs is given as constant. However, when the walking speed is changed, the input time should be also changed appropriately considering the walking cycle time.

1.2. Contribution of This Paper

Considering these issues, we aim to develop a novel assistive device using the PARMs and its control method. The concept of our proposed device is to reduce wearable sensors from an easy wearing point of view. Our proposed device does not require for the wearer to attach any electric sensors on their body as same as the device of [18]. In addition, we solve the issues of the conventional device [18] mentioned above.
We develop a hardware of a soft gait assistive suit actuated by the PARMs and propose its motion control method by a modified detection method using pressure and pressure derivative. The target task is to assist the wearer’s forward walking, and the PARMs are placed on the anterior and posterior surfaces of the wearer’s thigh and calf. The developed gait assistive suit consists of an attachment unit and a control unit, and these units are separated physically and only connected by air tubes. The control unit supplies compressed air and detects the assist timing using the measured pressure information. After the detection, the suit assists the wearer’s leg motion as raising up the toe and landing the foot. The assist force is generated by the controlled PARM pressure, and the pressure input time is changed appropriately considering the walking cycle time. The assist force will decrease the walking load of the leg muscles.
Considering the issue 1 in Section 1.1, the attachment unit has a lightweight soft structure, and it has no electrical devices. Because sensors are not needed to be attached to the wearer’s body, and the suit is soft and lightweight, therefore, it has the advantage of being easy and safe to use compared with the previous device in [18]. Considering the issue 2, the novel phase detection method is proposed which can detect only one desired timing in one gait cycle. The previous and novel phase detection methods are compared, and advantages of the novel phase detection method are described. Considering the issue 3, we propose a control method of the pressure input time considering the gait cycle time. Proper phase detection and gait assistance can be achieved in an arbitrary gait cycle time by using this method. The calculation method of the gait cycle time using the detection timing is proposed, and the proper pressure input times are obtained from the calculation result.
On the other hand, reducing sensors also have a disadvantage that will increase the responsibility of each sensor. Our developed suit is actuated by the PARM and it has backdrivability which will be an accident precaution of our suit. For example, when the pressure sensor is broken, the proposed suit will fail the proper detection or assist. When the PARM generates unpredictable force, the wearer will feel large leg load. However, a critical accident will be avoidable since the wearer can move against the PARM force thanks to the PARM’s backdrivability.
We focused on the usage of the proposed gait assistive suit as a training tool for health promotion, for example, a walking on a treadmill. The assistance of the suit will be useful especially for the elder persons who want to maintain their healthy locomotorium, and the suit provides the proper training menu in each trainee. By modulating the assistive force properly along with the training progress, the gait assistive suit will help to improve the trainee’s walking ability.
To confirm the performance of the proposed gait assistive suit, we conduct treadmill walking experiments of the trainees wearing the suit. In the experiments, we measured the pressure data and the trainees’ electromyogram (EMG) signals for the performance evaluation.
This paper is organized as follows. Section 2 describes the mechanism of the proposed suit. Section 3 describes the novel gait phase detection method. In Section 4, we describe the gait assistive control method. In Section 5, we describe the experiments conducted to confirm the effectiveness of the proposed suit and its control method. Concluding remarks are made in Section 6.

2. Soft Gait Assistive Suit

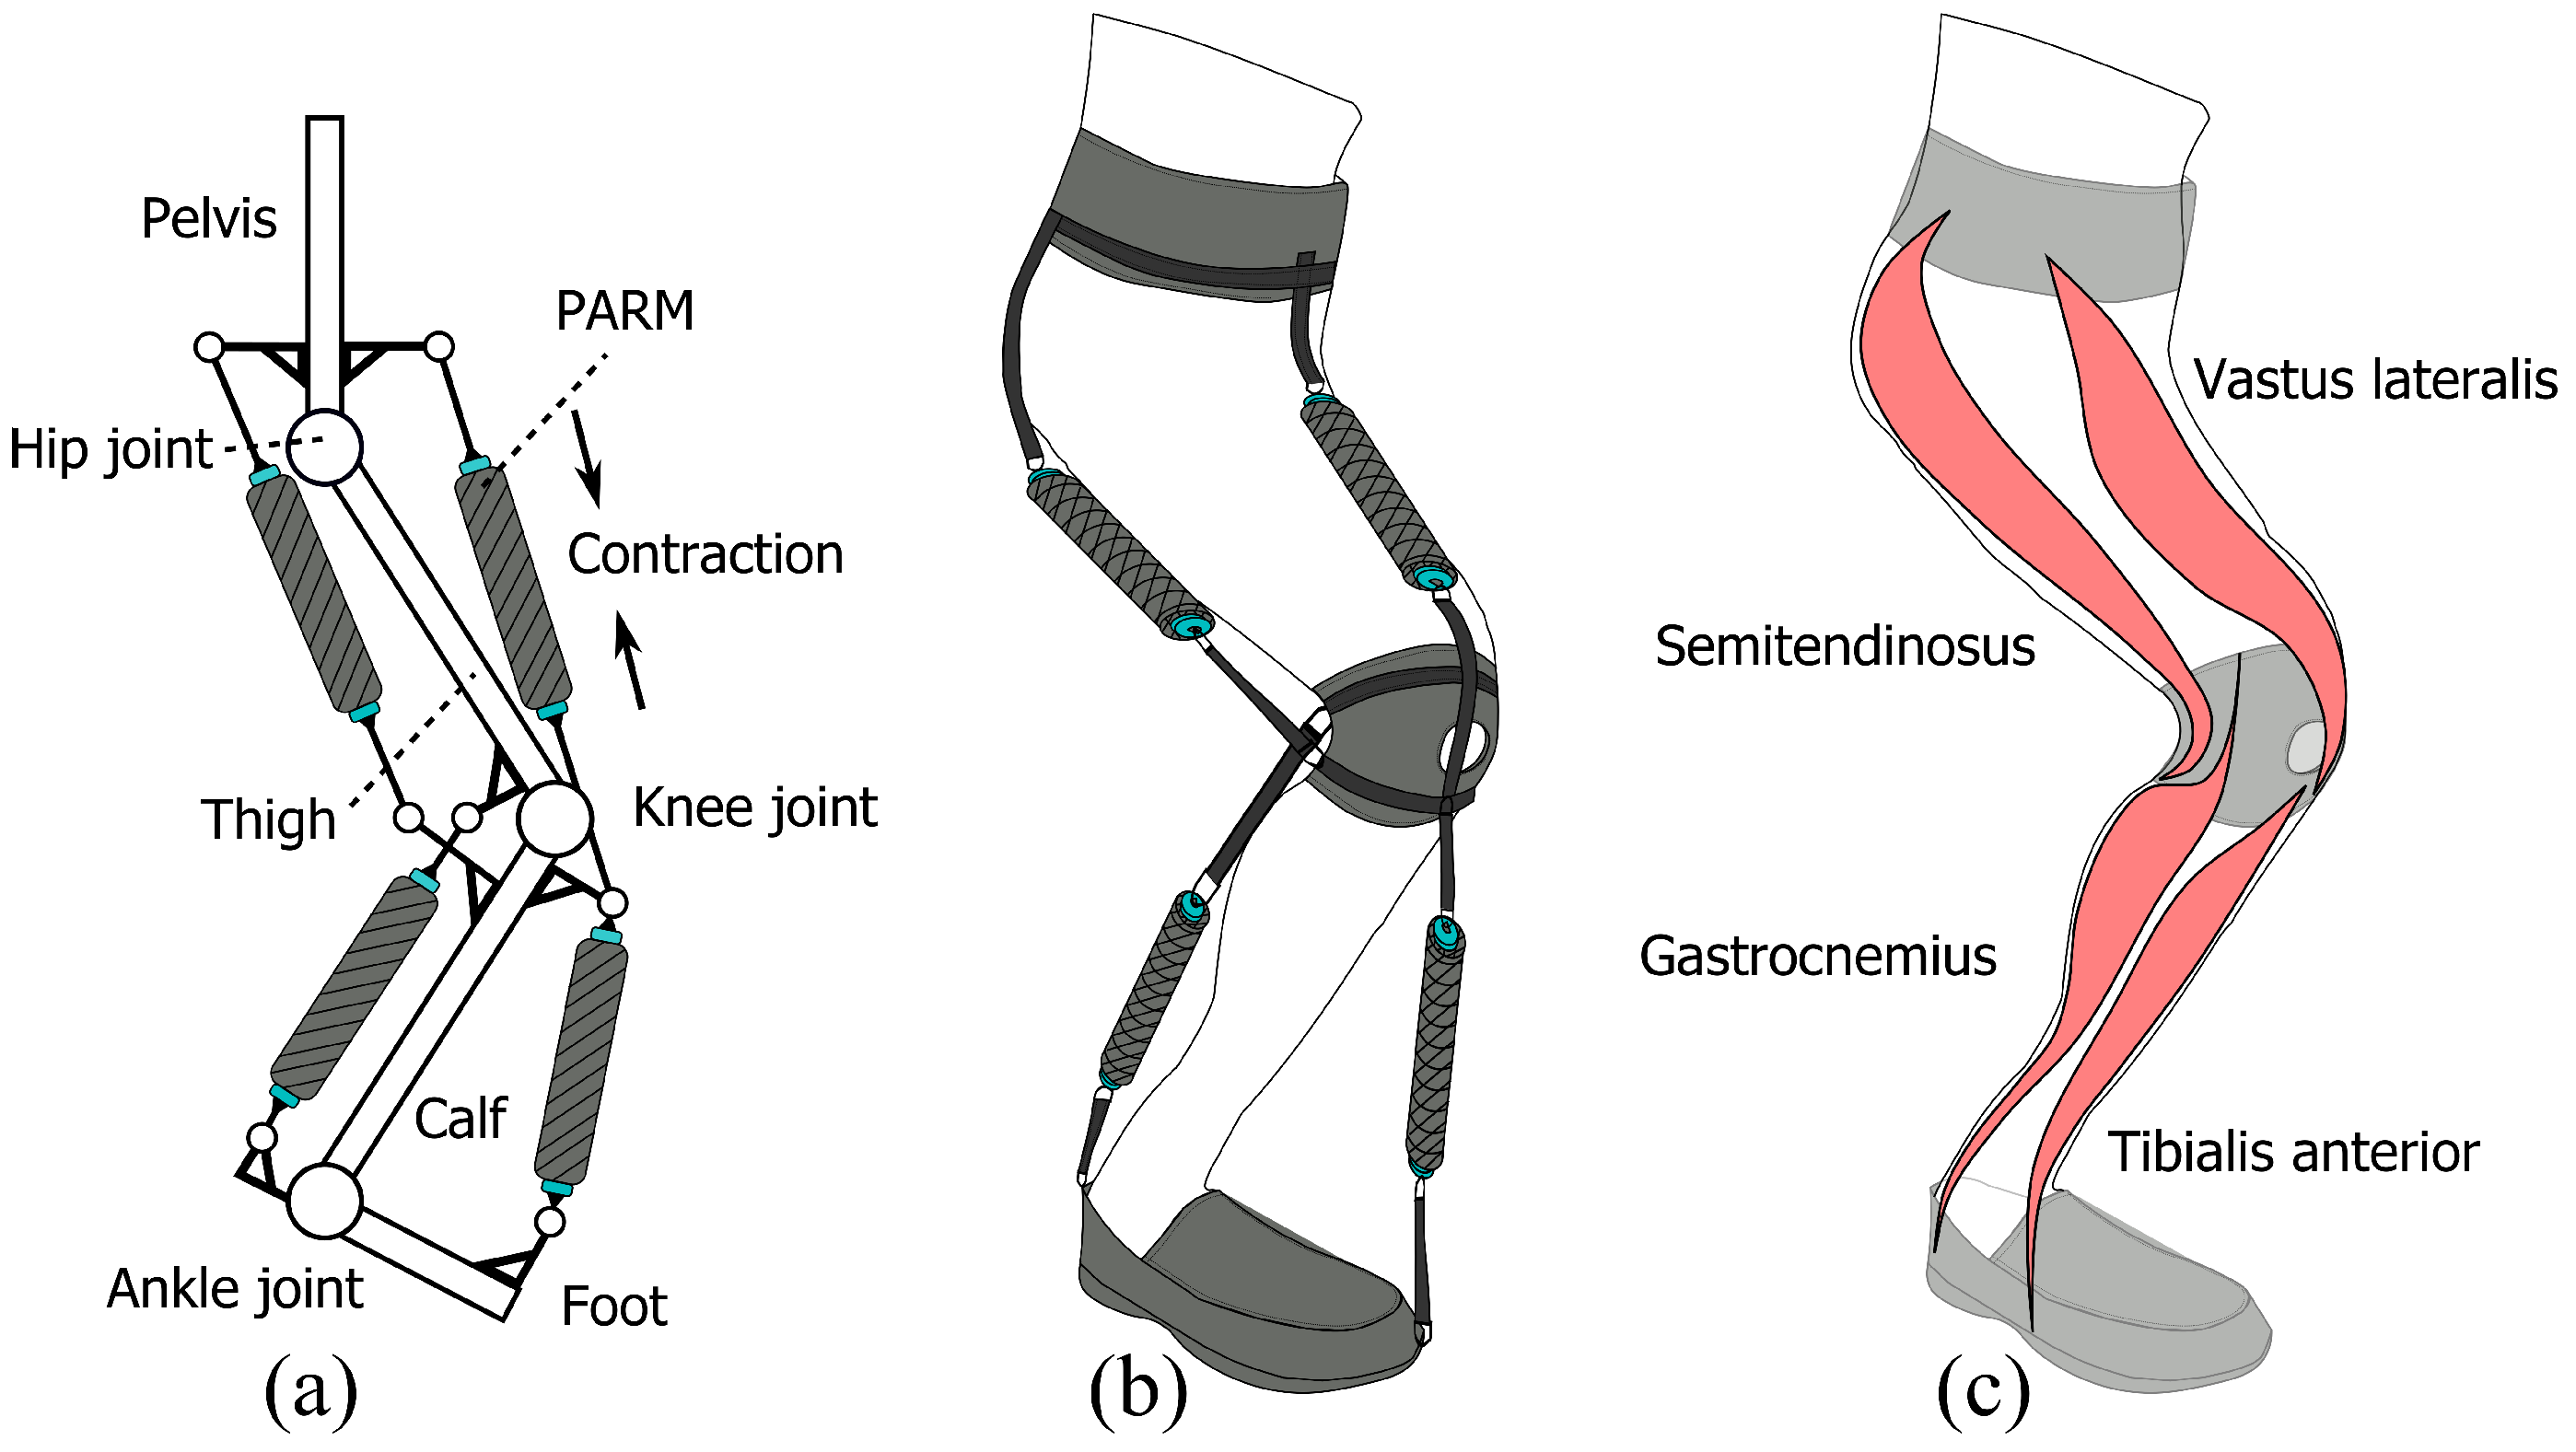
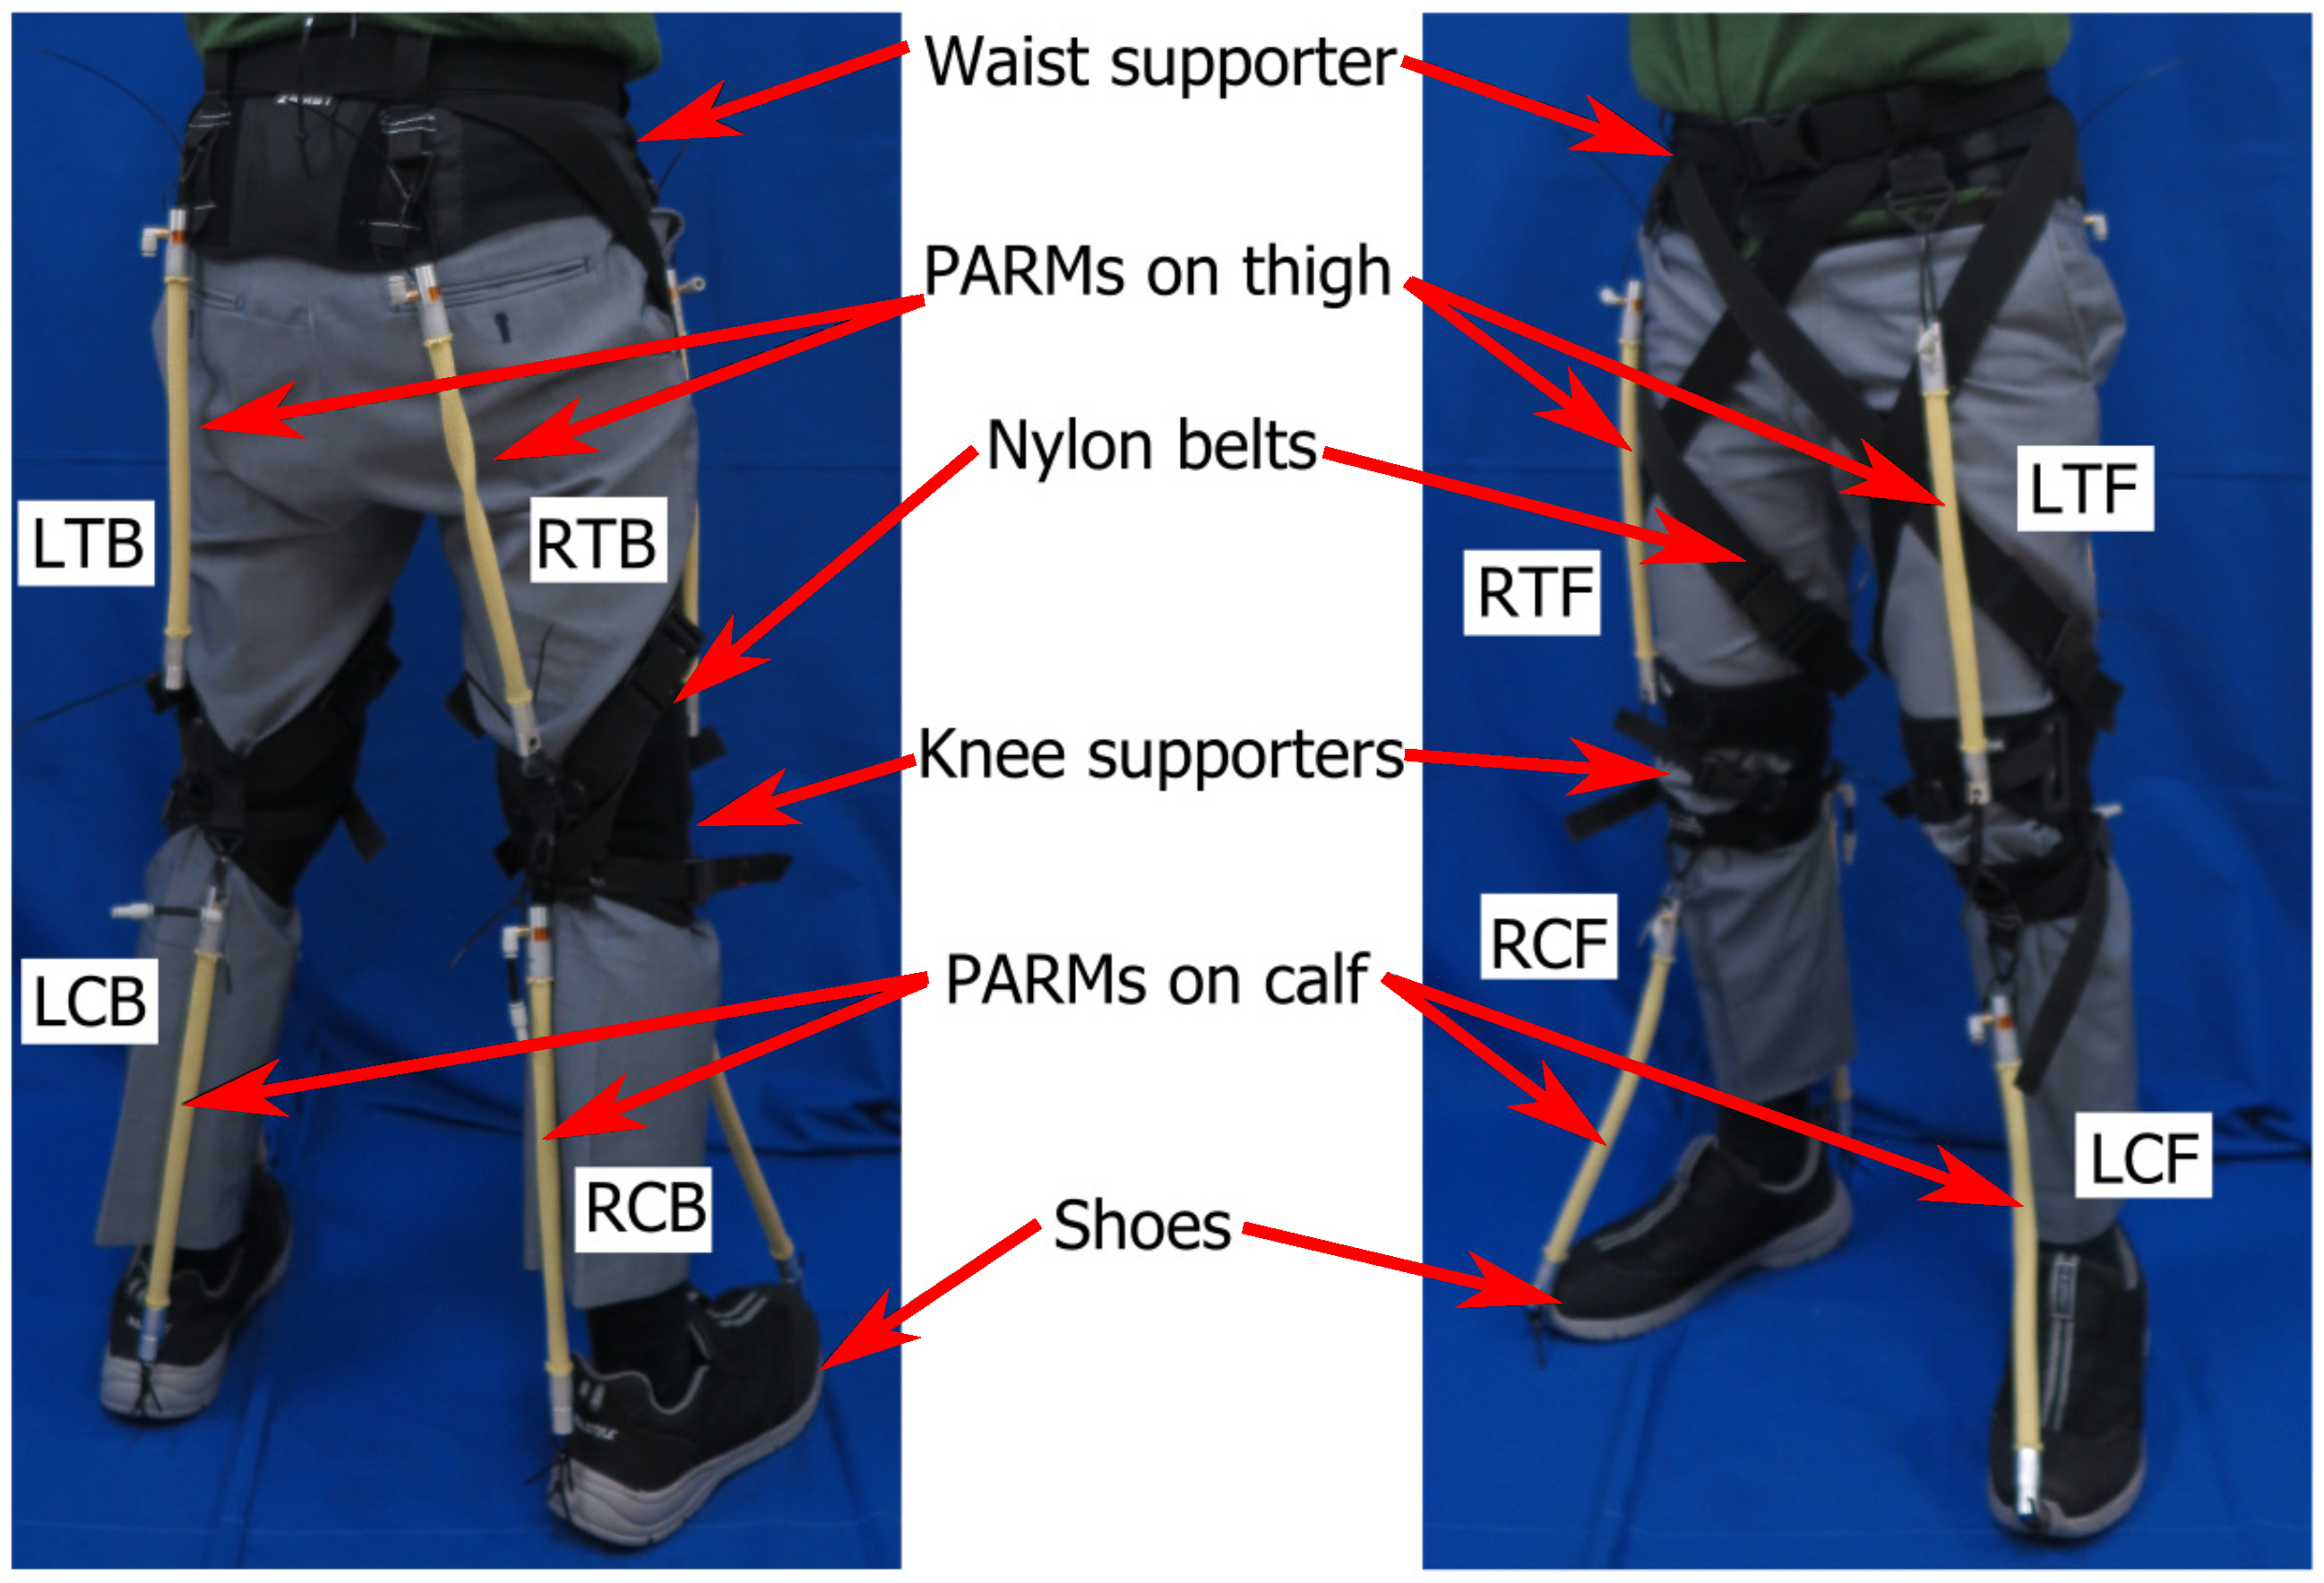
2.1. Mechanical Design of Soft Gait Assistive Suit

Figure 1 shows the PARMs attached on the trainee’s leg. The target muscles of the proposed suit are vastus lateralis, semitendinosus, gastrocnemius and tibialis anterior as shown in Figure 1c. By assisting these muscles, the suit can efficiently aid the motion of the hip, knee, and ankle joints. The PARMs are placed on the anterior and posterior surfaces of the trainee’s thigh and calf. Figure 1a shows a leg link system attached the PARMs, and Figure 1b shows an illustration of the trainee’s leg wearing the gait assistive suit. For attaching the PARMs to the legs, the trainee wears a waist supporter, knee supporters, and shoes. The foot, knee and pelvis are the key anchors for the PARMs, which can be seen in other exoskeletons as well (e.g., [11]).
Figure 2 shows the attachment unit of the novel gait assistive suits. The parameters of the novel gait assistive suit are shown in Table 1. Compared with the previous suit [18] which has a rigid link system, the novel suit consists of only lightweight and soft parts as PARMs, waist supporter, knee supporters, nylon belts and shoes, and the whole weight of the attachment unit is about 1 kg. The attachment unit has no electrical devices. The supporters are made of soft textiles contain polyester, nylon, polyurethane and natural rubber. They attach the PARMs to the trainee’s body securely and comfortably. The waist supporter is fixed on the pelvis by tightening force of the textile and the nylon belt. The knee supporters are fixed on the knee joints in the same manner. These supporters and shoes are connected to each other by the nylon belts and the PARMs not to slip on the body surface, and the PARM contraction force will be effectively transmitted to the leg motion. The time to take on the suit is a short time, about 5 min. Because electrical sensors are not needed to be attached to the trainee, and the suit is soft and lightweight, it has the advantage of being easy and safe to use compared with the previous suit. The 8 PARMs are placed on the surfaces of the legs. The PARMs on the right leg are named as the right thigh front (RTF), right thigh back (RTB), right calf front (RCF), and right calf back (RCB). The PARMs on the left leg are named in the same manner (LTF, LTB, LCF, LCB). The thigh front (TF) PARMs support vastus lateralis. The thigh back (TB) PARMs support semitendinosus. The calf back (CB) PARMs support gastrocnemius. These target muscles are the biarticular muscles, therefore these PARMs are also attached on the trainee’s body across the 2 rotational joints as shown in Figure 1a. When the TF PARMs contract, the contraction force flexes the hip joint and extends the knee joint. On the other hand, when the TB PARMs contract, the contraction force extends the hip joint and flexes the knee joint. In addition, when the CB PARMs contract, the contraction force flexes the knee joint and plantarflexes the ankle joint. The calf front (CF) PARMs support tibialis anterior. When the CF PARMs contract, the contraction force dorsiflexes the ankle joint.
Next, parameters of the attachment unit shown in Table 1 are discussed. The suit was designed for supporting an average Japanese adult male with a height of about 170 cm and a weight of about 65 kg. Since the average thigh length is about 400 mm and the lengths of the thigh surface change about 60 mm, the thigh PARM lengths were designed as 300 mm whose stroke length is 75 mm. The average calf length and its amount of change are almost same or small compared with the thigh, therefore the same PARMs are used on the thigh and calf to simplify the suit design. In addition, the normalized maximum output torque of the human leg joints during walking is about 1.40 Nm/(kg m) of the ankle joint torques [37]. In the case of the target trainee with 170 cm and 65 kg, the maximum output torque is about 155 Nm. In this paper, about 15 Nm which is 10% of the maximum output torque is defined as the target torque regardless of the joint. This target torque is just an example to design the suit and not optimized for maximizing the suit performance. The detailed target torque tuning in each joint is one of the interesting questions. Therefore, it will be considered in our future work. The minimum lever arm of the trainee’s leg, a distance between a joint center and a body surface, is approximated as 50 mm, which means that 300 N of force is needed for the PARMs to generate 15 Nm of torque. The PARM inner diameter was determined as 9.5 mm from the required force. When the compressed air is supplied at 400 kPa of gauge pressure, the selected PARMs can output the target force 300 N with its initial length. Pressure is represented as gauge pressure in this paper without Section 3.2. The designed PARMs were developed in the cooperative research project with Bridgestone Corporation. The PARM consists of a rubber tube, a cover sleeve, and metal fittings. The rubber tube is made of diene-based vulcanized rubber, and the cover sleeve is made of high strength synthetic fiber with its knitting angle of 25 degrees. The metal fittings are made of aluminum alloy.

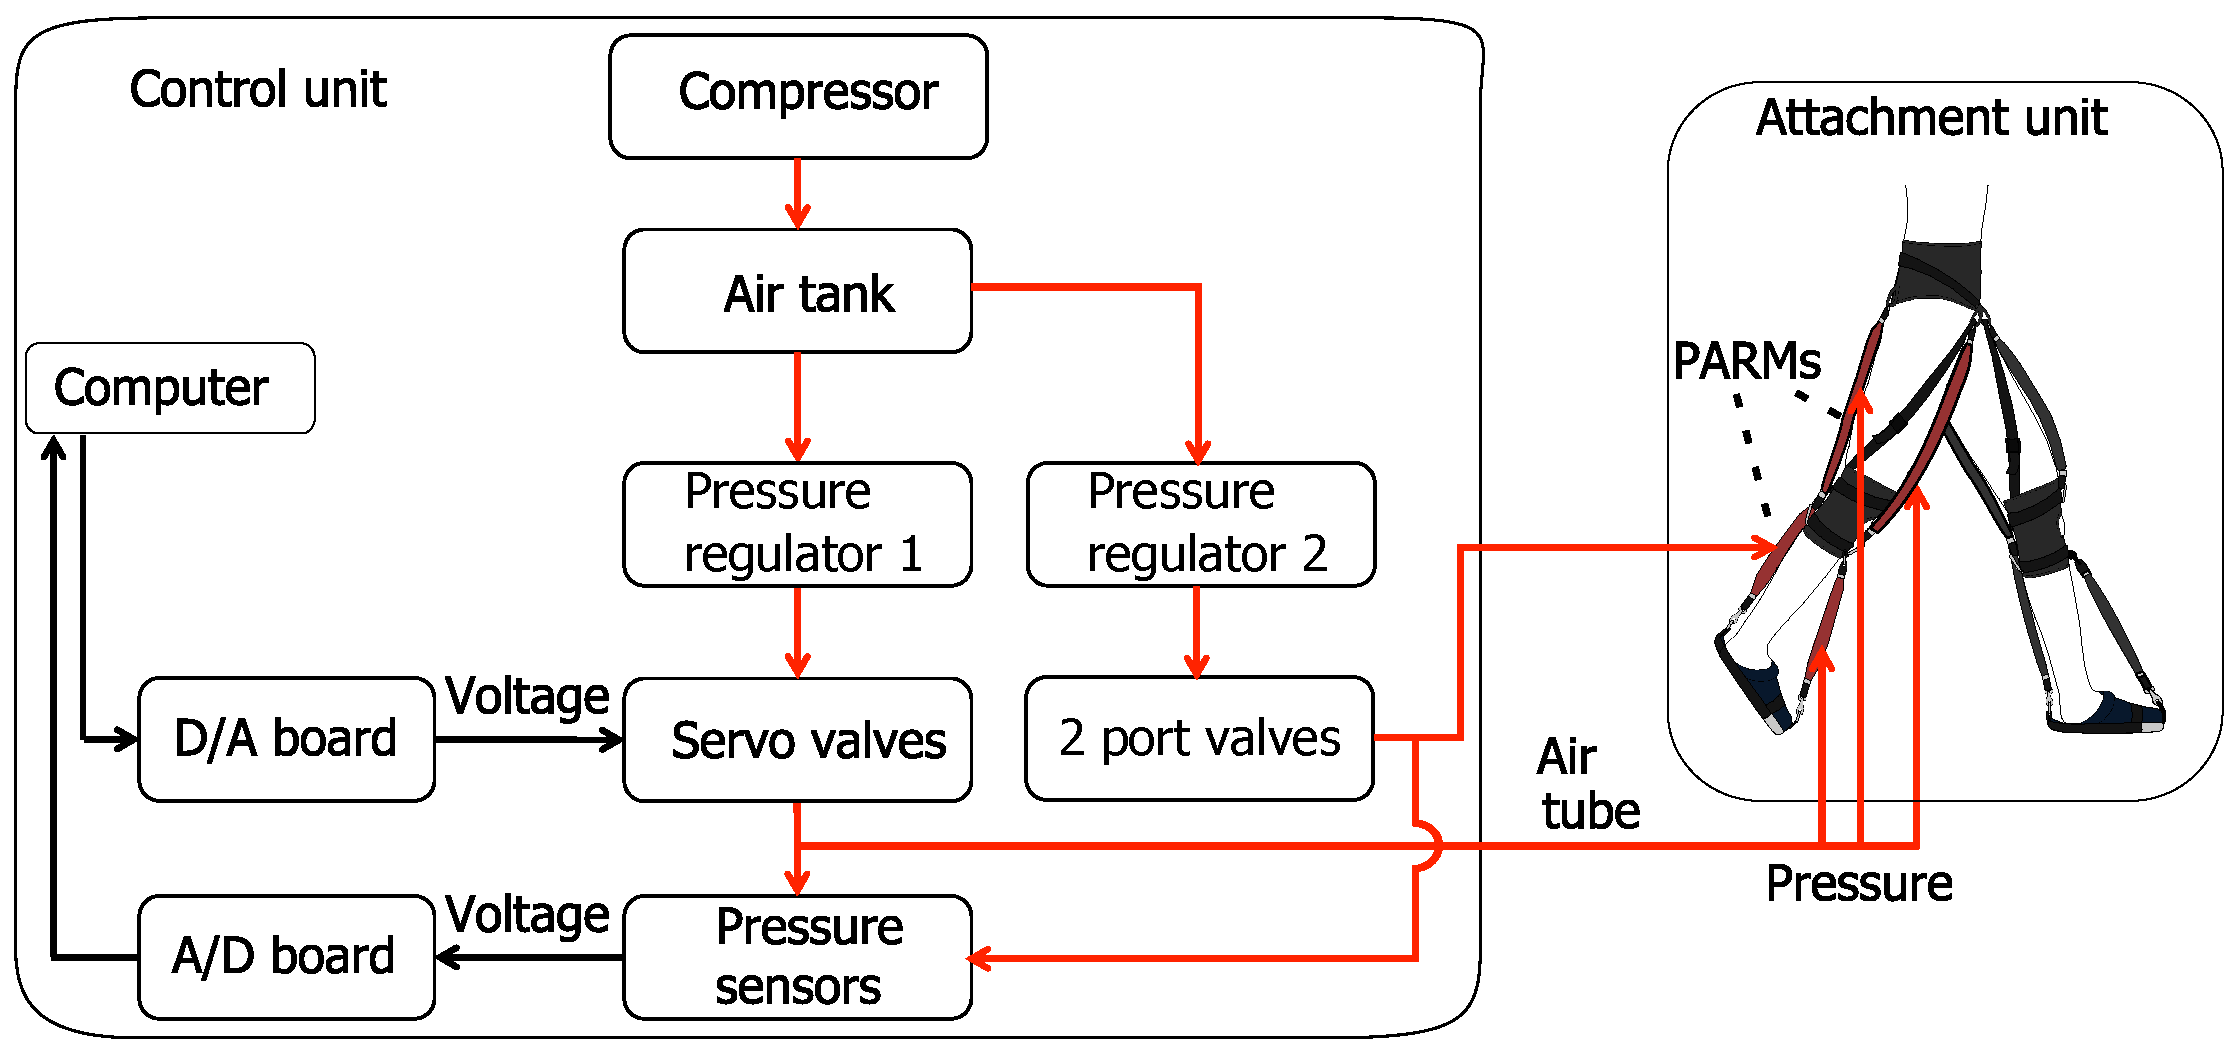
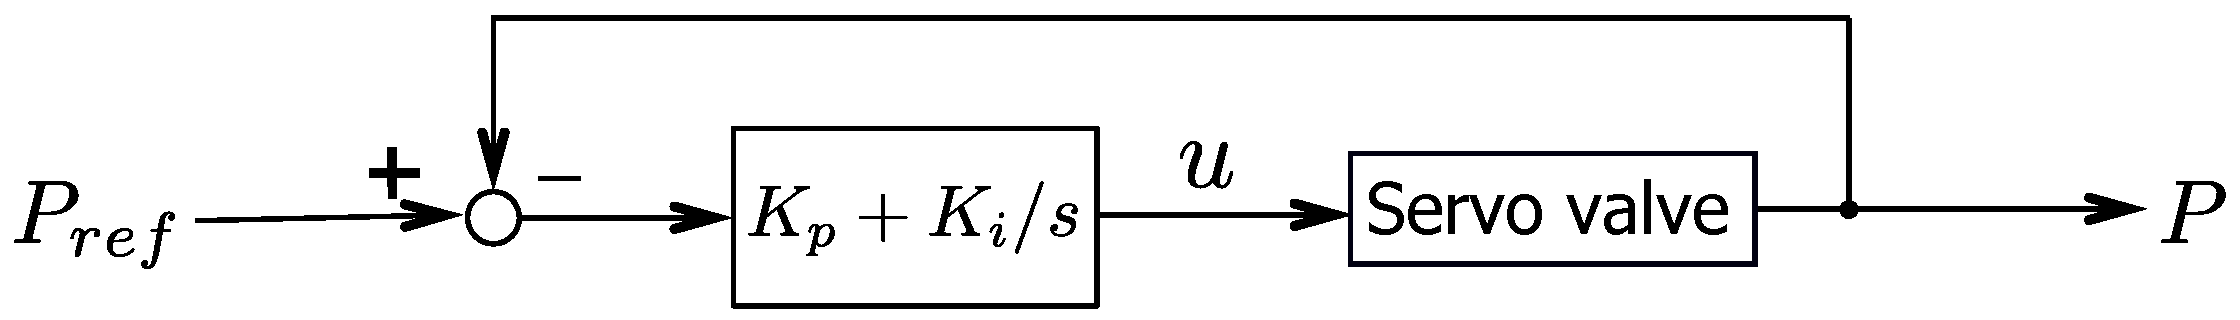
2.2. Pneumatic Control System

Figure 3 shows a schematic of the pneumatic control system. The control unit is connected to the attachment unit by the air tube. The control unit consists of a compressor, air tank, computer, servo valves, pressure sensors, A/D board, D/A board, and others. The pressure in the PARMs is measured by the pressure sensors (SMC Corp., PSE510), and the A/D board sends the pressure information to the computer. Command voltages for the servo valves (Festo, MPYE5-1/4-010-B) are calculated by the computer, and are send by the D/A board. The pressure in the PARMs except for the CB PARMs is controlled by the servo valves with a controller, as shown in Figure 4. P r e f and P (kPa) are a reference pressure and a current pressure respectively. K p (V/kPa) and K i (V/kPa s) are a proportional and an integral gains. u (V) is a control voltage, and s is a Laplace operator.
The assistive suit utilizes the backdrivability of the PARMs to detect the proper assist timing. The assist timing is detected by using the pressure and the pressure derivative of the CB PARMs. Therefore, the CB PARMs are pressurized and their air flows are closed by the 2 port valves as shown in Figure 3. The CB PARMs become deformable closed chambers, and its pressure change amount along with the deformation is utilized for the timing detection.

3. Gait Phase Detection Method

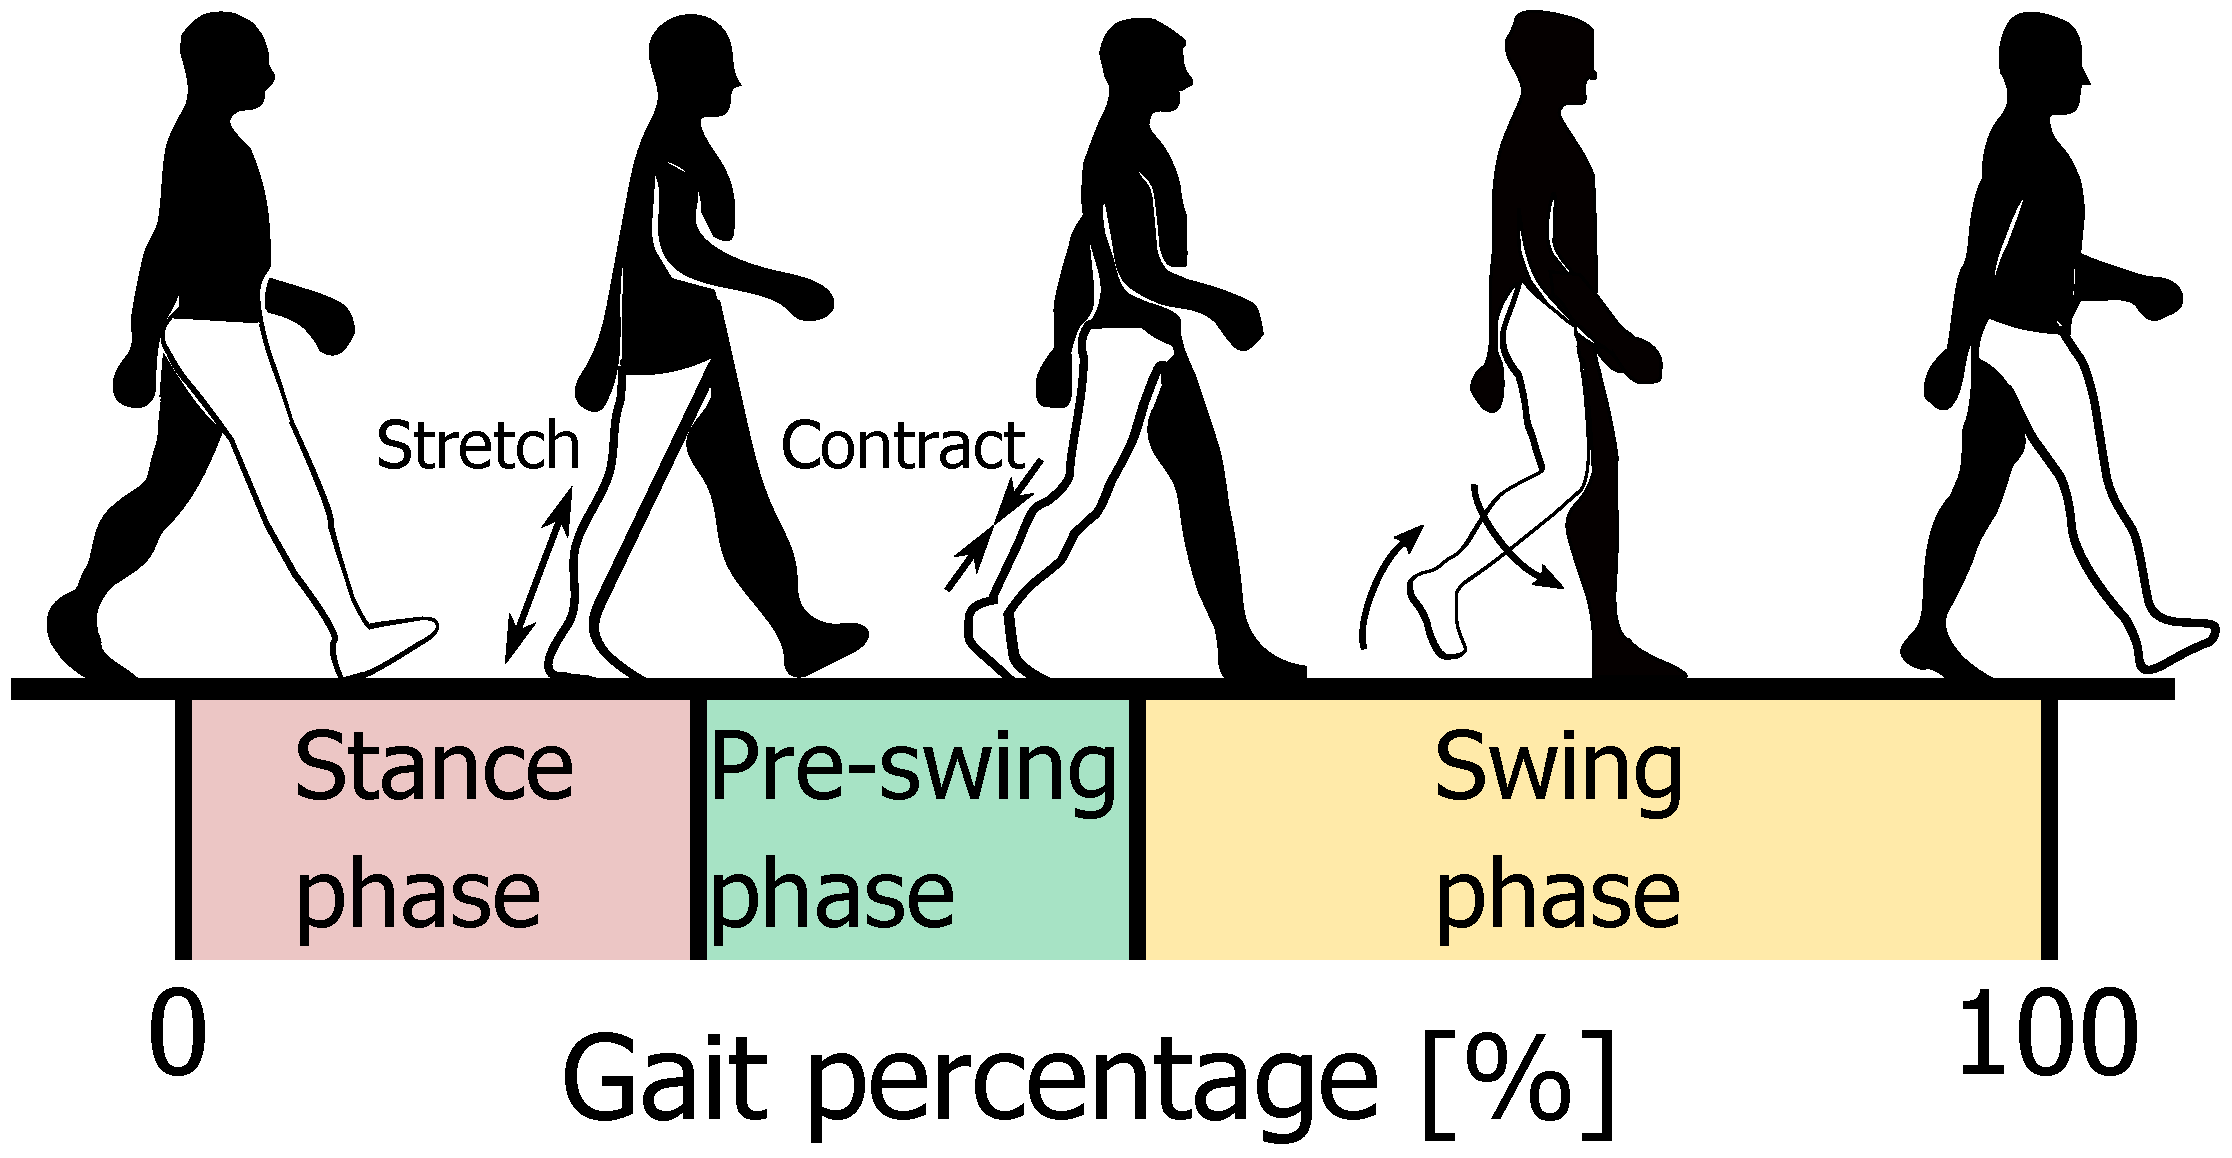
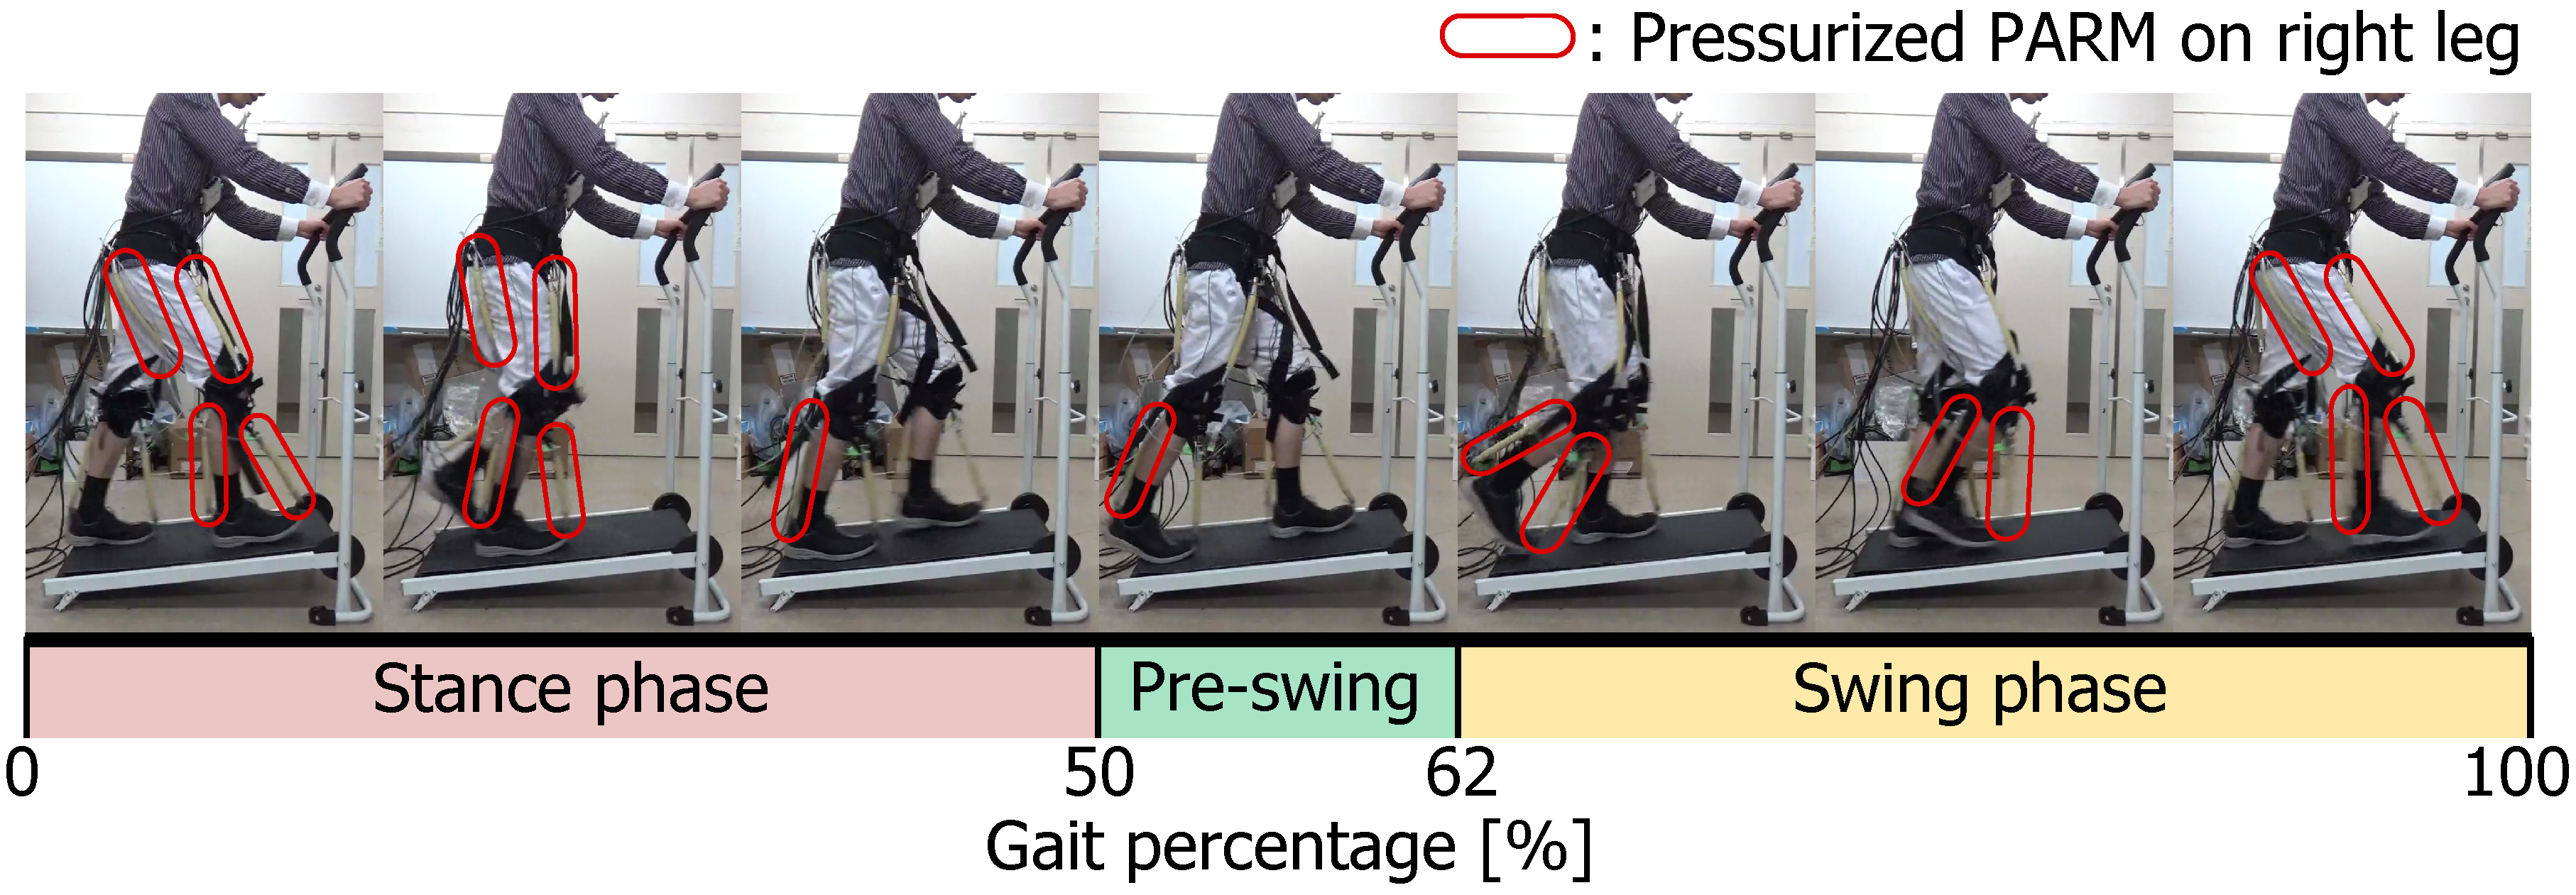
3.1. Forward Walking Sequence and Target Assist Timing

The leg motion is classified into several phases by using the method developed by the Rancho Los Amigos national rehabilitation center [37] as shown in Figure 5.
In Figure 5, a horizontal axis represents a gait percentage in the one cycle motion. The gait phases of a white color leg are classified in a stance phase, a pre-swing phase, and a swing phase, and an opposite side leg is also classified in the same manner.
In this paper, the pre-swing phase is set as a target detection phase. The pre-swing phase starts from the heel contact of the opposite side foot and ends at lifting off of the toe. By detecting the pre-swing phase of both legs, a walking cycle time can be obtained, and it is used to calculate proper assist timings and durations in each PARM from the gait analysis data [37]. The suit assists the trainee’s leg motion as raising up the toe in the swing phase and landing the foot in the stance phase. The assist force will decrease the walking load of the leg muscles and also helps to avoid stumble and fall of the trainee. When the pre-swing phase, the posterior surface of the calf is stretched and contracted along with the heel lifting as shown in Figure 5. The CB PARMs attached to the trainee will be deformed along with the leg motion. We focus to detect the pre-swing phase from the pressure information in the CB PARMs.
The pressure of the CB PARMs will be affected by the impact force of foot landing, and it will make worse the signal to noise ratio of the pressure information. Therefore, a low-pass filter is used for smoothing the pressure information.

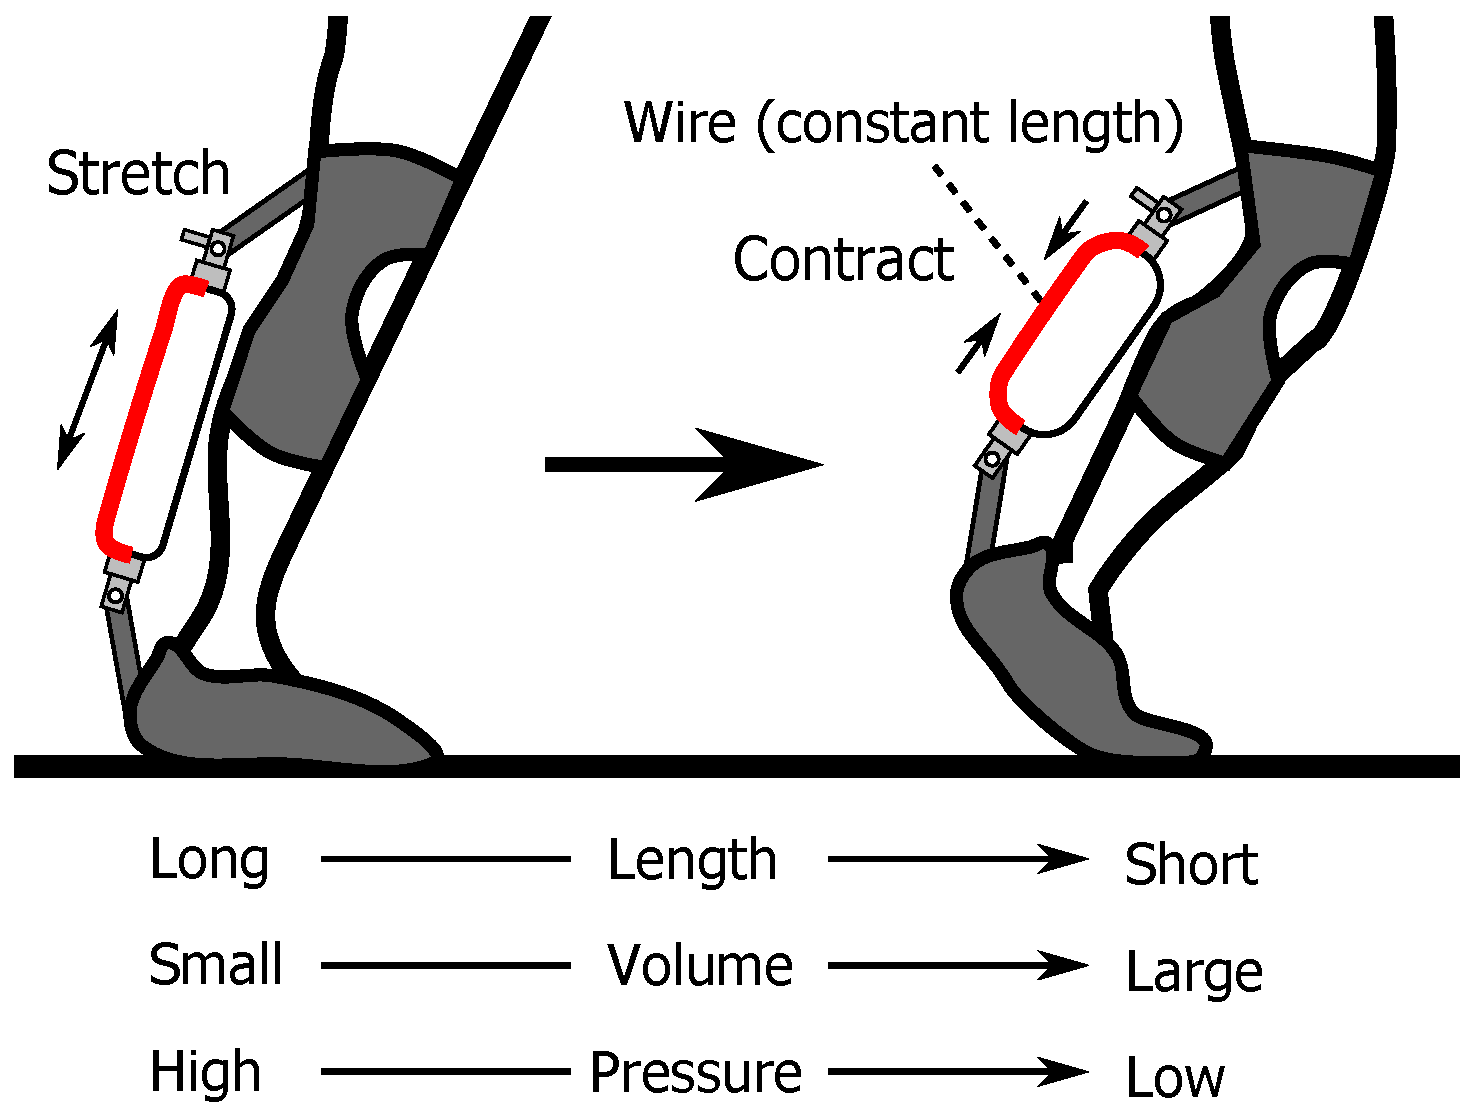
3.2. Relation between Calf Back PARM Variables

A relation between the CB PARM variables for the gait phase detection is derived as follows. First, the following equation is derived from the state equation of gas:
P ( d V / d t ) + ( d P / d t ) V = ( d W / d t ) R θ + W R ( d θ / d t )
where V (m 3 ) is the PARM volume, W (kg) is the mass of air, R (J/(kg K)) is the gas constant, θ (K) is the air temperature, and t (s) is the time. In Section 3.2, the pressure P is represented as absolute pressure. We consider Equation (1) during the pre-swing phase. We assumed that air charge to or discharge from the CB PARMs is zero, since the CB PARMs are the closed chambers. We also assumed that the air temperature in the CB PARM is constant since the pre-swing phase is generally short time under 1 s. These assumptions are represented as:
d W / d t 0 , d θ / d t 0 .
Then, Equation (1) could be written as follows:
d P / d t = ( P / V ) ( d V / d t ) .
Equation (3) shows that the relation between the pressure derivative and the volume derivative is negative proportional. In addition, we consider the deformations of the CB PARMs in the pre-swing phase as shown in Figure 6. The left figure is a stretched state, and the right figure is a contracted state of the PARM. The bold line on the PARM is a wire whose length is constant. The relation between the pressure derivative and the length derivative is as follows:
d P / d t = ( P / V ) ( d V / d ) ( d / d t )
where (m) is the length of the PARM. d V / d is a negative value since when the PARM length becomes long, the PARM volume becomes small.
Therefore, the relation between the pressure derivative d P / d t and the length derivative d / d t is proportional. Under the assumptions of Equation (2), at the start of the pre-swing phase, the CB PARM is stretched and its length is long. After that, the stretched PARM contracts in a short time, and its length becomes short. Therefore, a sign of the length derivative d / d t will become positive to negative in the pre-swing phase, and also a sign of the pressure derivative d P / d t will become positive to negative. As a result, the pre-swing phase will be be detectable from the pressure information of the CB PARMs.

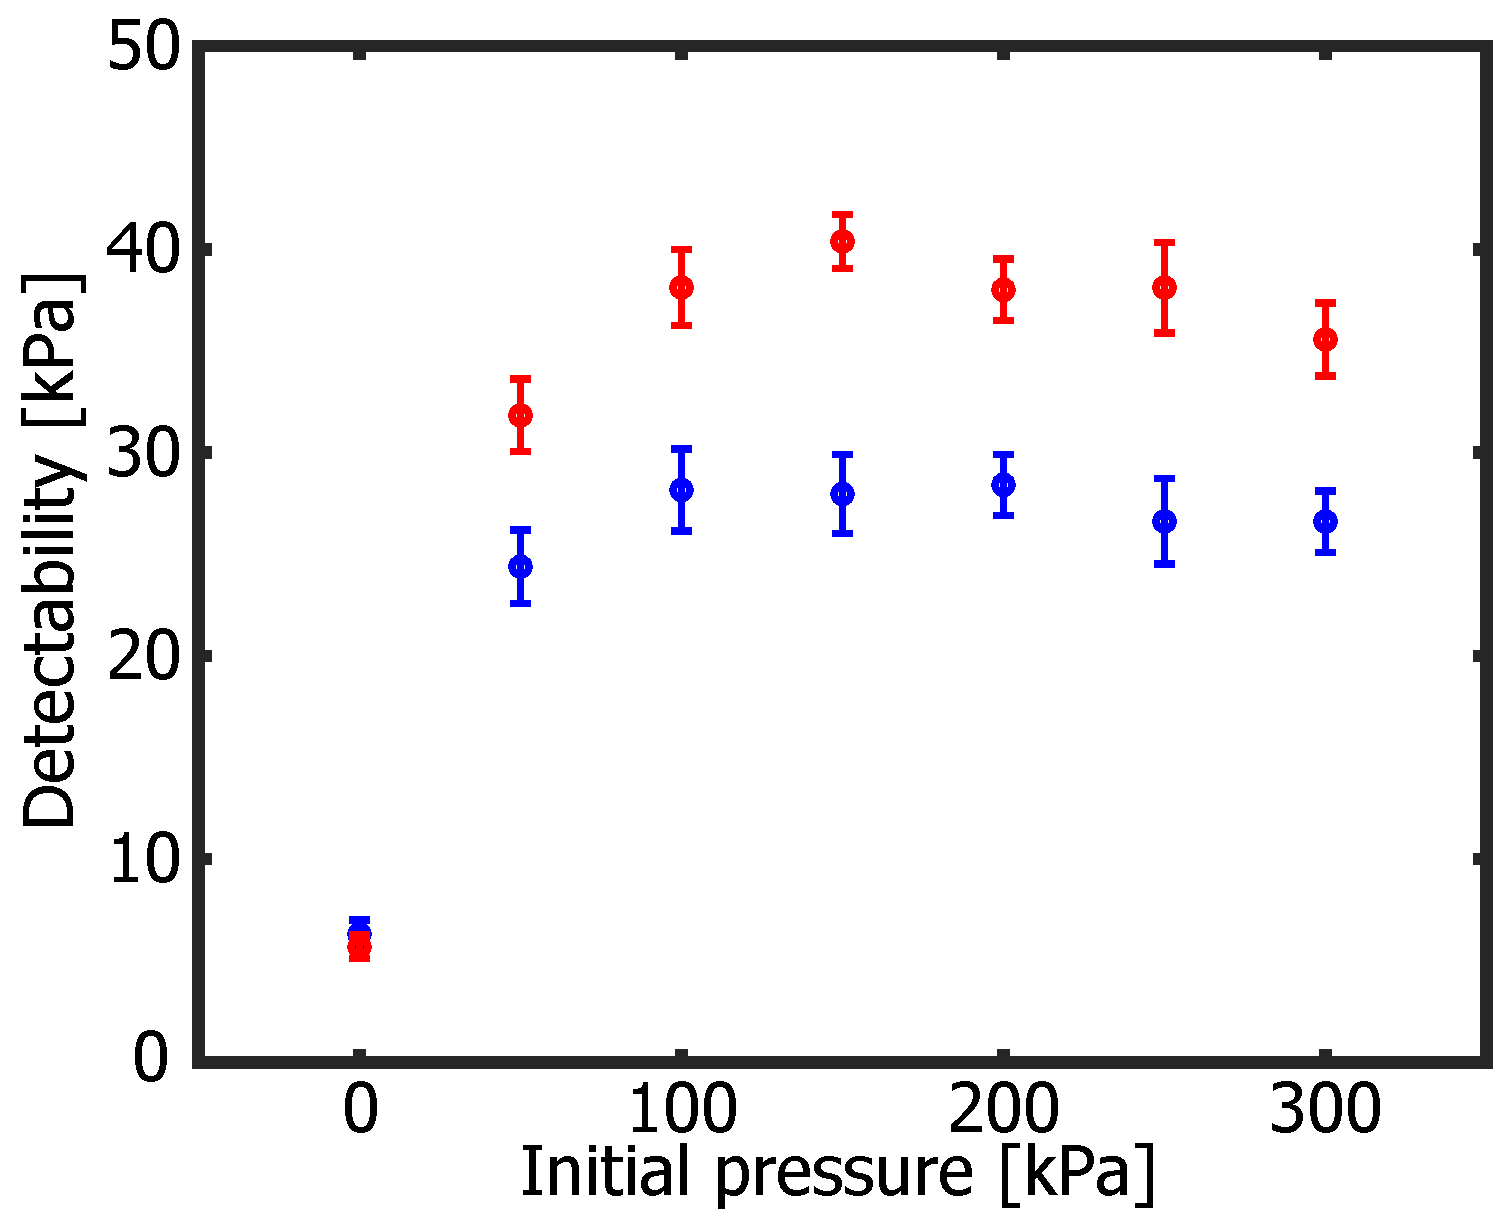
3.3. Pressure Configuration in Calf Back PARMs

The proper pressure in the CB PARMs is required for measuring the pressure change, and it is configured by the walking experiments on the treadmill as shown in Figure 7. The trainee wears the gait assistive suit, and the initial pressure in the CB PARMs is set as several values, when the trainee stand upright on the flat floor and the CB PARMs don’t slack. The initial pressure is adjusted by the pressure regulator 2 shown in Figure 3. While the trainee walks on the treadmill, the pressure in the CB PARMs is measured, and we will evaluate the pressure change amount.
In this paper, the detectability index is defined as follows:
J p = max P ( t ) min P ( t ) ( 0 t T c )
where T c (s) is a gait cycle time. Equation (5) calculates the maximum pressure change amount J p (kPa) in the one cycle motion. When J p is larger, the assist timing detection will become easier.
The experimental parameters are given as follows. The trainee walks on the treadmill 40 steps of 20 cycles with its speed of 4.0 km/h in each trial. In this paper, we used the manual treadmill (All market japan Inc., YT-RR). A metronome is used for equalizing the walking rate to make the data analysis easy, and its tempo is adjusted in each trainee. The initial pressure is given as 0, 50, 100, 150, 200, 250, 300 kPa. The walking data with the initial pressure of 0 to 300 kPa are measured in randomized order. Each pressure data is measured in one trial respectively. After each trial, the trainee rests for 5 min. Finally, 20 cycle data of J p in each leg is obtained, and the proper pressure will be determined.
For example, one healthy male trainee in his 30 s with the height of 171 cm and the weight of 72 kg wore the gait assistive suit and walked on the treadmill with its walking rate 100 beats per minute (BPM). The experimental result is shown in Figure 8, whose initial pressure in the CB PARMs is set as 200 kPa. The horizontal axis shows time (s), and walking phases are distinguished by color areas. The gait phases are classified by the synchronized recorded video data and the classification method of [37]. Red areas represent the stance phase, green areas represent the pre-swing phase, and yellow areas represent the swing phase. The upper figure shows the pressure in the RCB PARM. The cut-off frequency of the low-pass filter of the pressure was set as 10 Hz which assumes to be sufficiently high for measuring the human walking motion. The lower figure shows the pressure derivative. The cut-off frequency of the numerical differentiation of the pressure was also set as 10 Hz. As a result, the measured pressure was changed around the given initial pressure, and its change amount is calculated as J p in each cycle. The pressure derivative signal changes large in the pre-swing phase. The heel contact occurs between the swing phase and the stance phase, however, the pressure data seems to be smooth. Therefore, the effect of the impact force will be negligibly small for phase detection.
The calculated index J p of the CB PARMs is shown in Figure 9. The horizontal axis shows the given initial pressure. Blue and red colors mean values of the RCB and LCB PARMs. Markers are average values, and thin bars are standard deviations. The detectability J p became large when the pressure was over 100 kPa since the PARMs were sufficiently shrunk and not loose through whole walking cycle. In this case, we set the proper pressure for this trainee to 150 kPa since it showed the largest detectability of the LCB PARM. The pressure configuration of the CB PARMs is carried out in each trainee in the same manner.
We considered the reason why the detectability indexes of over 150 kPa pressure seem to be constant or small. When the initial pressure is too high, the CB PARM becomes hard to deform. In that case, the PARM deformation and the pressure change amount will become small.
In addition, the detectability difference between the RCB and LCB PARMs is discussed. There will be possible reasons as; (i) the fixing position and initial tension difference, and (ii) asymmetric walking of the trainee. About (i), when the fixing position and initial tension of the PARMs are different, their extension direction and stroke length along with the trainee’s walking vary, and the detectability will be changed. About (ii), when the trainee’s gait is an asymmetric motion, the detectability difference will occur since the strokes of the RCB and LCB PARMs will become different. The detectability difference will occur because of these reasons, therefore, the pressure threshold for the gait phase detection should be set appropriately considering both detectabilities of the RCB and LCB PARMs.
The different initial pressure setting of the RCB and LCB PARMs may be a good idea to equalize the detectabilities between the different PARMs. However, we have not tried that condition since the different pressure setting might become a cause of the asymmetric and unnatural walking. In addition, the detectability difference is not so serious problem and can be solved by setting the appropriate pressure threshold. From these reasons, we set the common initial pressure in the RCB and LCB PARMs.

3.4. Modification of Phase Detection Method

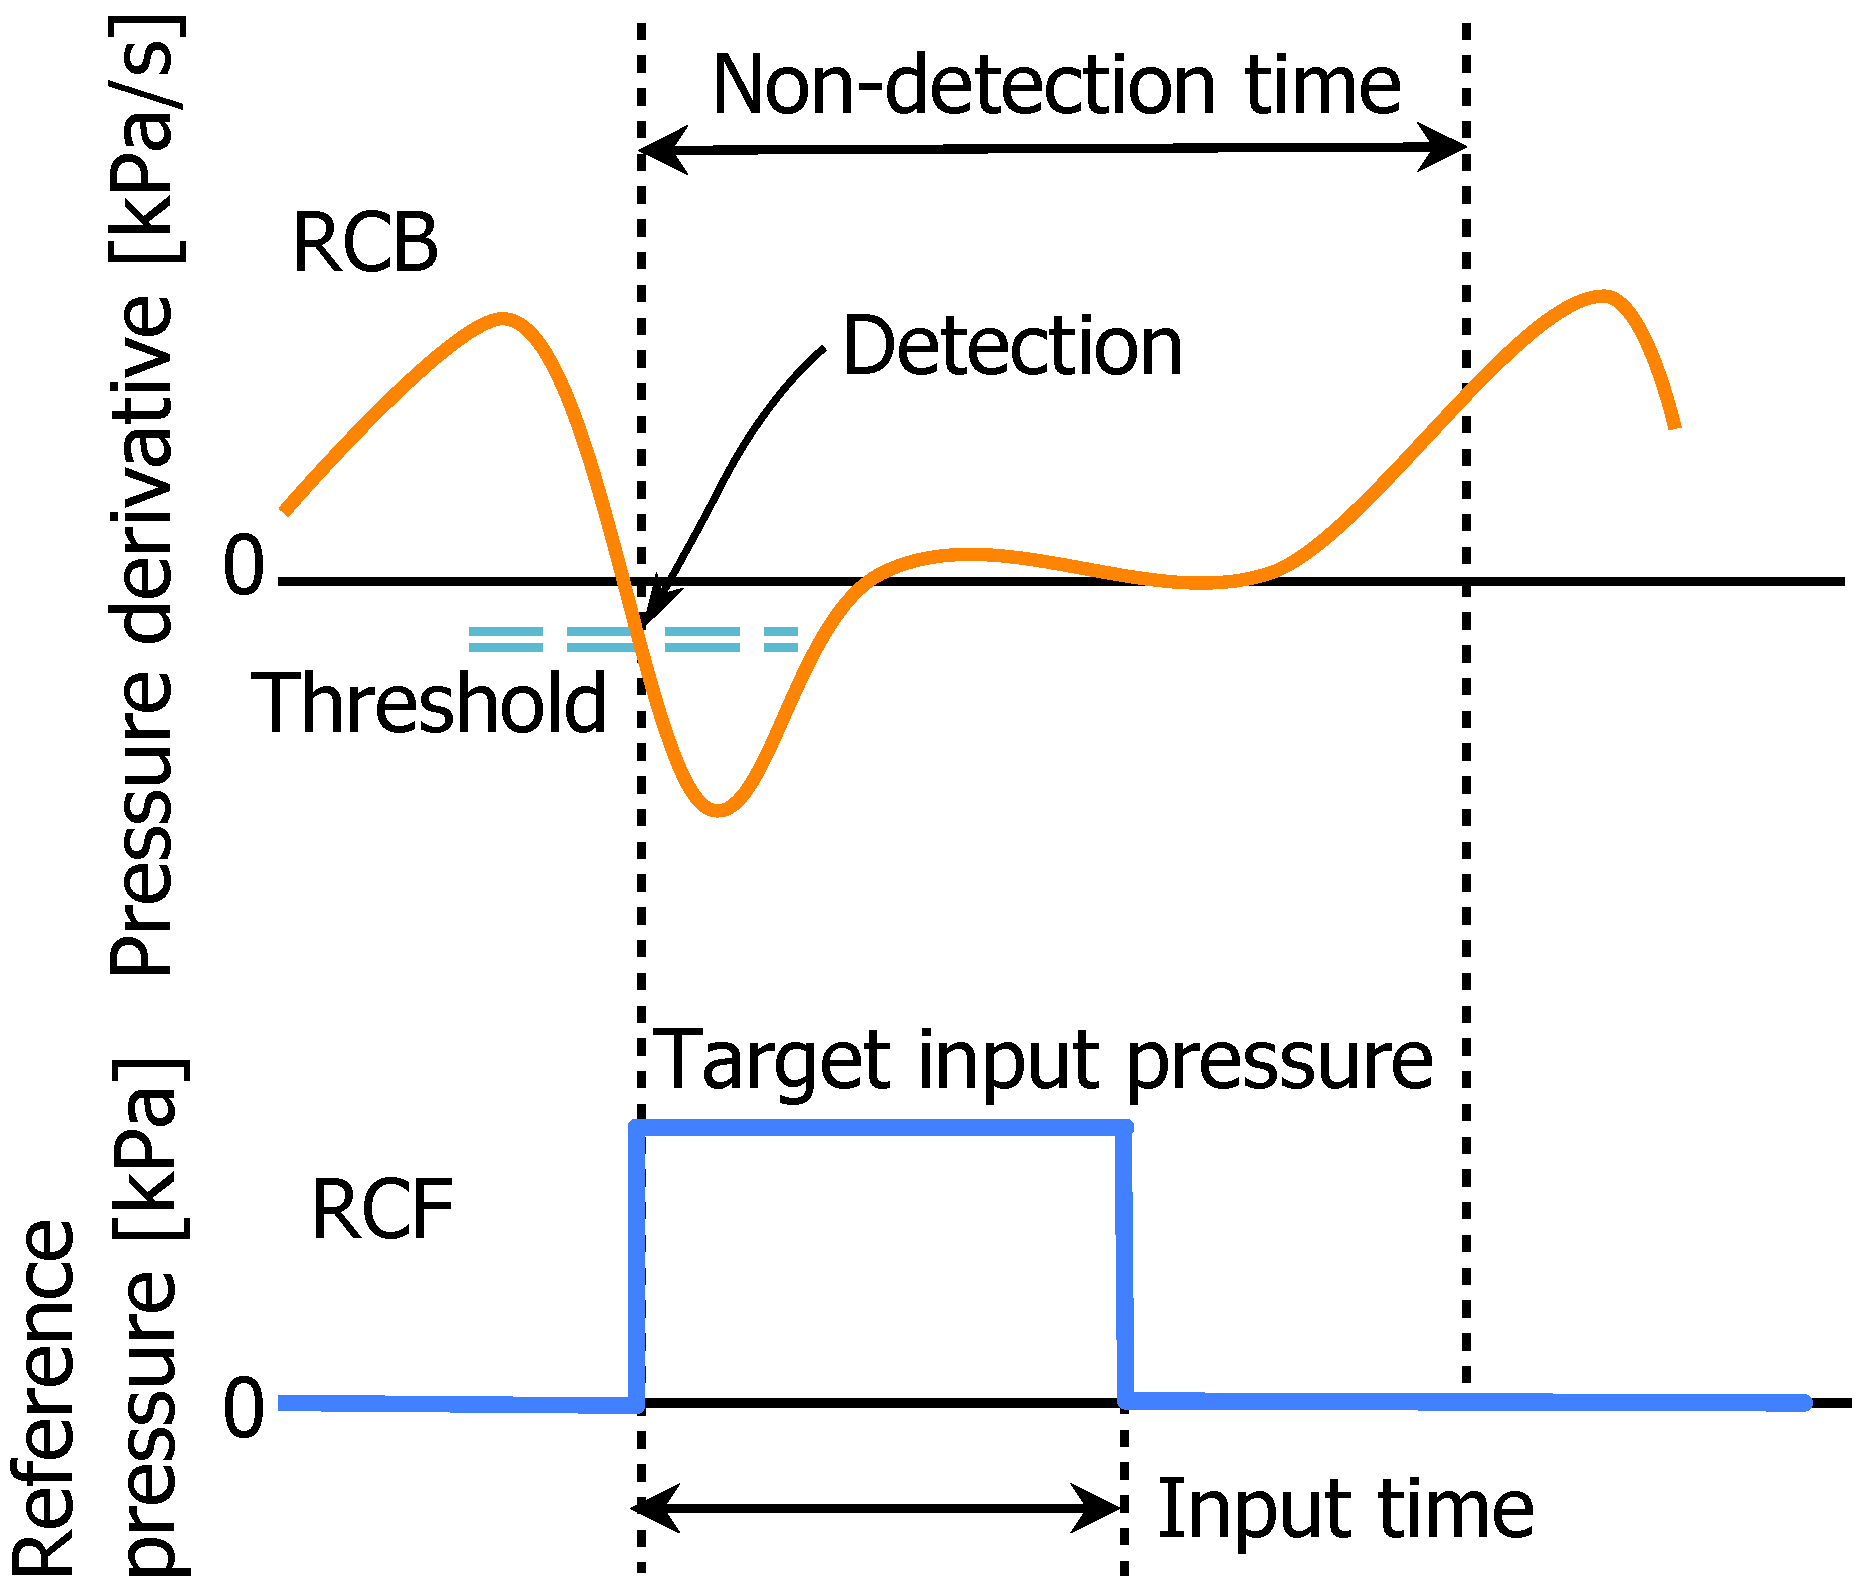
3.4.1. Conventional Detection Method

In [18], the phase detection algorithm using the pressure derivative as shown in Figure 10 was proposed. In the conventional detection algorithm, the assist timing is defined as the moment when the pressure derivative of the CB PARMs exceeds a given threshold as:
k a = k s . t . P ˙ c ( K ) P ˙ t h
where k is the time step, and k a is the time step of the assist timing. P ˙ c ( K ) (kPa/s) is the pressure derivative of the CB PARMs at the time step k, and P ˙ t h (kPa/s) is the given threshold. When the assist timing is detected, the PARMs are pressurized and the suit assists the trainee’s walking. The PARMs on the right leg and the left leg are controlled separately. During one walking cycle, the pressure derivative of the CB PARMs exceeds the threshold several time steps, so that a non-detection time is set in order to detect only the desired timing. However, the non-detection time constrains the maximum walking rate, because it will prevent the correct detection when the trainee walks with a high walking rate whose walking cycle time is smaller than the non–detection time. Therefore, we propose a novel phase detection method to solve the issue.

3.4.2. Novel Detection Method
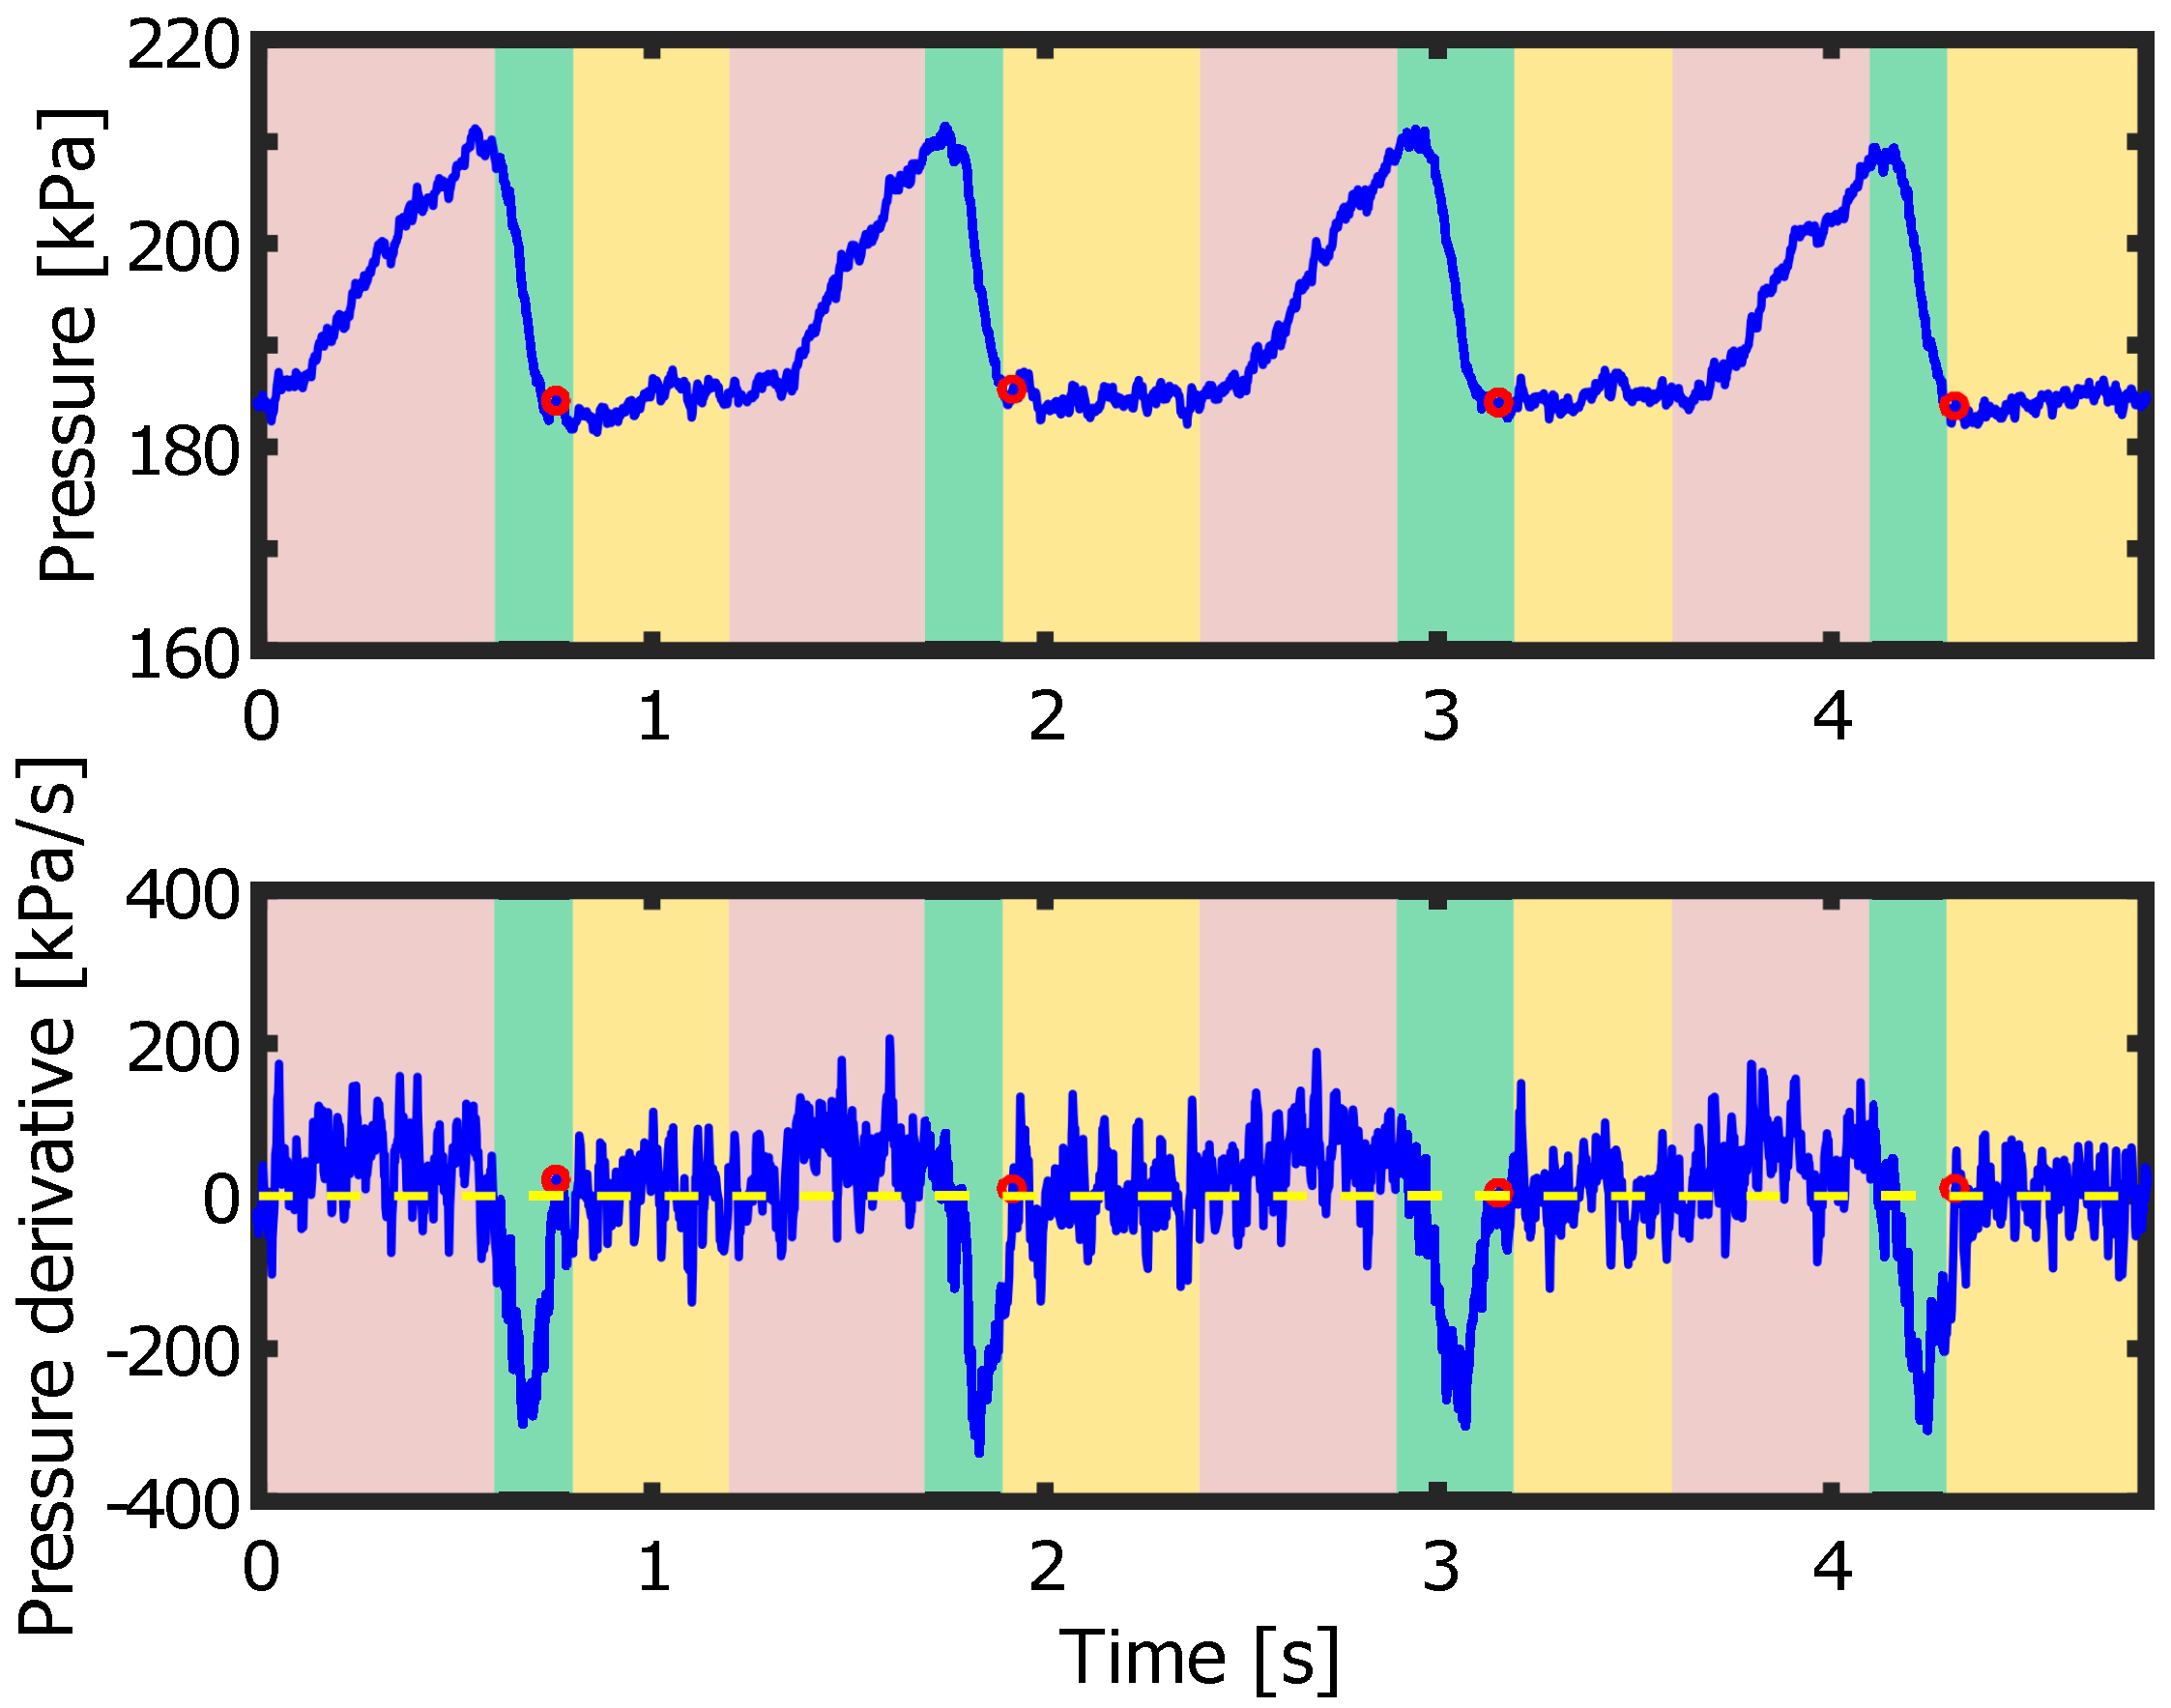
In the novel detection method, the pressure value is also used in addition to the pressure derivative value. The procedure of the novel detection method is shown as follows.
  • The time step k 1 is detected as the timing that the pressure derivative of the CB PARMs P ˙ c crosses the threshold P ˙ t h .
  • The measured pressure of the CB PARMs P c 1 (kPa) at the time step k 1 is recorded, and the previously detected k 1 and P c 1 are set as k 2 and P c 2 (kPa).
  • The difference of P c 1 and P c 2 are calculated as Δ P c = P c 1 P c 2 (kPa). When Δ P c is less than the threshold Δ P t h , k 1 is set as the assist timing k a .
  • Return to step 1 and repeat these steps.
First, the time step k 1 is detected in step i as:
k 1 = k s . t . ( P ˙ c ( K ) P ˙ t h ) ( P ˙ c [ k 1 ] P ˙ t h ) < 0
Equation (7) is the condition that the measured pressure of the CB PARMs crosses the threshold P ˙ t h at the time step k. Figure 11 shows the sample data of the pressure and the pressure derivative for checking Equation (7). These are the same data as shown in Figure 8. The threshold P ˙ t h was set as 0.0 kPa/s since this timing contains the phase changing timing between the pre-swing phase and the swing phase. In Figure 11, the horizontal axis shows time (s), and walking phases are distinguished by color areas. Red areas represent the stance phase, green areas represent the pre-swing phase, and yellow areas represent the swing phase. Red circle markers are all of the detected time step k 1 using Equation (7). There are still many candidates of k 1 in one walking cycle because of the signal noise. Therefore, additional conditions using the pressure value are given as follows. In step ii, neighboring two data satisfies Equation (7) are recorded. In step iii, by using the two data, these difference Δ P c is calculated. The assist timing k a is detected using Δ P c as:
k a = k 1 s . t . Δ P c < Δ P t h
Equation (8) is the condition that the measured pressure of the CB PARMs decreases more than the threshold Δ P t h at the time step k 1 . Finally, the assist timing k a is obtained as shown in Figure 12. Circle markers are all the assist timing k a , and there is only one marker in one walking cycle. The target of Equation (8) is the changing timing from the pre-swing phase to the swing phase. There is large pressure difference between the marker of the time step k a ( = k 1 ) and the previous marker of the time step k 2 . The condition Δ P c < Δ P t h means the feature mentioned above. The threshold Δ P t h was set as 5 kPa in Figure 12. Δ P t h is configured in each trainee appropriately by considering the detectability index J p . The large Δ P t h will be effective to avoid the wrong detection, however, Δ P t h should be lower than J p . Thanks to the novel detection method, the issue of the conventional detection method will be solved. Since the non-detection time is not required, the trainee can walk with a high walking rate.

4. Gait Assistive Control Method

4.1. Control Sequence

We set the target pressure as a step input to provide assistive force immediately after the phase detection. A design of the input pressure trajectory, which maximizes the assist performance, is one of the interesting questions. Therefore, input trajectory optimization will be considered in our future work. The assistive control method is applied to each leg separately. The control cycle consists of the following phases:
  • Walking start
  • Pre-swing phase detection
  • Walking assist (by applying the step input pressures to the PARMs controlled by the servo valves)
  • Return to step 2 and repeat these steps

4.2. Control of Pressure Input Time

In the conventional control method in [18], the pressure input time of the PARMs is given as a constant value. However, when the walking speed is changed, the input time should be also changed appropriately. In this paper, the gait cycle time is calculated from the assist timing, and the proper pressure input time is obtained from the calculation result. Since the assist timing in each gait cycle is detected as shown in Figure 12, the gait cycle time T c i (s) can be obtained as:
T c i = T c a l ( T c a l T c m a x ) T c m a x ( T c a l > T c m a x ) s . t . T c a l = ( k a i + 1 k a i ) Δ T
where the superscript i is the number of the gait cycle, and Δ T (s) is the sampling interval time. T c m a x (s) is the upper limit of T c i . The average gait cycle time T c a v e i (s) is calculated from the last n data of T c i as:
T c a v e i = 1 n k = i n + 1 i T c k
T c a v e i is updated in every gait cycle, and it is used for calculating the pressure input time of the PARMs. The pressure input time of the PARMs is given as shown in Figure 13. The horizontal axis shows gait percentage, and the vertical axis shows reference pressure in each PARM. ON (100%) and OFF (0%) mean the pressurized state and the depressurized state. Walking phases are distinguished by color areas. Red areas represent the stance phase, green areas represent the pre-swing phase, and yellow areas represent the swing phase. The pressurized timing and duration are given from the EMG activation time in each muscle near the PARM [37]. The pressurized timing and duration are represented as the percentage in one walking cycle, and these times are defined as the functions of the average gait cycle time T c a v e i which is assumed as the one walking cycle time. The pressurized time of the TF PARMs is 90–10% which is the activation time of vastus lateralis. The pressurized time of the TB PARMs is 80–10% which is the activation time of semitendinosus. The pressurized time of the CF PARMs is 55–13% which is the activation time of tibialis anterior. The detection timing is assumed as 55% in Figure 13. For example, the CF PARMs are pressurized immediately after the pre-swing phase detection.
The joint motion driven by the TF and TB PARMs is discussed as follows. In Figure 13, the TB PARM is pressurized slightly earlier compared with the TF PARM in the swing phase, and depressurizing timing of these PARMs is same in the stance phase. When only the TB PARM is pressurized, its contraction force flexes the knee joint and extends the hip joint. This motion assists the landing motion. After that, the TF PARM is also pressurized, and the leg link system is driven like an antagonistic driven system. When the same pressure is supplied in the TF and TB PARMs, these PARMs can be assumed as the air springs with the same characteristic. In this case, the stretched PARM outputs larger force than the shrunk PARM, therefore the TF and TB PARMs make the leg posture as upright standing. The PARM contraction force extends the knee and hip joints. These PARM motions are mimetic motions of each target muscle.

5. Evaluation Experiments

5.1. Control Parameter Settings

We confirm that the proposed gait assistive suit and its control method works correctly. The parameters for the proposed control methods are given as shown in Table 2. The gain parameters were tuned in frequency response experiments. The base pressure and the target pressure mean the lower and upper values of the rectangular reference pressure. The target pressure was set as 400 kPa as noted in Section 2.1. P ˙ t h was set as 0.0 kPa/s as described in Section 3.4.2. Δ P t h was set as −15 kPa. The control frequency of the servo valve and the measuring frequency of EMG were set as 500 Hz. About pressure measurement, the cut-off frequencies of numerical differentiation and low-pass filter were set as 10 Hz. The upper and lower limits of the control voltage were set as considering the available voltage range of the servo valve. We assumed that the suit would assist walking at speeds from 1.0 to 5.0 km/h at a stride length of 0.7 m in one step. The gait cycle time at the speed of 1.0 km/h is 5.0 s, therefore it was set as the upper limit of the gait cycle time T c m a x . The walking step number n for calculating the average gait cycle time was set as 4. The pressurized time was set as shown in Figure 13.

5.2. Verification of Proposed Control Method

5.2.1. Experimental Method

We performed the experiment to confirm whether the proposed control method works correctly. In this experiment, the phase detection accuracy and the change of the pressure input time are confirmed by comparing with the conventional control method [18]. One healthy male trainee in his 30 s with the height of 171 cm and the weight of 72 kg wears the gait assistive suit and walks 100 steps of 50 cycles on the treadmill with its speed of 3.0 km/h in each trial. We measure the two different gaits with their walking rate of 90 and 140 BPM by using a metronome. Each gait data is measured in one trial respectively. The 90 BPM case is a normal walking, and the 140 BPM case is walking with a short stride. The initial pressure in the CB PARMs was set as 150 kPa by using the procedure in Section 3.3. The control parameters for the conventional control method are shown in Table 3. These parameters were adjusted to assist the 90 BPM walking whose gait cycle time is 1.3 s. The pressure input time and the non-detection time are constant in the conventional control method. The threshold of the pressure derivative P ˙ t h was set as −100 kPa/s which is an offset value from 0 kPa/s to avoid the detection error by the signal noise of P ˙ . Other parameters for the conventional control method, for example, control gains etc., were set as common values shown in Table 2.

5.2.2. Experimental Result

Figure 14 shows the assisted walking sequence on the treadmill. The horizontal axis shows the gait percentage of the right leg. The red box marker means the pressurized PARM on the right leg. The TF and TB PARMs are pressurized before the initial contact (gait percentage 0%) between the foot and the ground to absorb impact force and stabilize the stance leg posture. The CF PARMs are pressurized from the initial swing phase to the middle stance phase for raising up the trainee’s toe. The CB PARMs are the pressurized closed chambers, and their shrinking force is given to the trainees’ leg through the whole gait cycle. The total 100 walking steps were measured, and the success rate of the phase detection was counted in each case. The RCF PARM pressure trajectories of the 90 and 140 BPM walking are shown in Figure 15. The horizontal axis is time (s), and the vertical axis is pressure (kPa). The solid and dashed lines are the measured pressure and the reference pressure. Both methods achieved 100% success rate in the case of 90 BPM. On the other hand, in the case of 140 BPM, the proposed control method achieved 100% detection, and the success rate of the conventional control method was 72%.

5.2.3. Discussion

When the trainee’s walking rate is higher than expected, the regular phase detection using the conventional method will be difficult as shown in Figure 15b. The primal reason is that the conventional control method uses the constant pressure input time and the non-detection time. The gait cycle time of the 140 BPM walking is 0.86 s, and it is shorter than the given non-detection time 0.9 s. In this case, the non-detection time will mask the correct detection timing and the success rate of the detection will become worse. By using the proposed control method, the pressure input time changes along with the walking rate, and the non-detection time is not used. Therefore, as shown in Figure 15c,d, the regular and accurate phase detection can be achieved in an arbitrary walking rate by using the proposed control method.

5.3. Electromyogram Measurement

5.3.1. Experimental Method

We verified whether the gait assistive suit is effective for decreasing activity in the trainee’s muscles. We measured and compared the muscular activities of the assisted walking and walking without the suit. Note that the measured data of the muscular activities is used for just evaluating and not for controlling the gait assistive suit.
In this experiment, the gait assistance only uses the novel control method, and the conventional control method [18] for comparison is not used, since the difference between the novel and conventional control methods is the detection algorithm. These precisions were confirmed by the result in Section 5.2. Therefore, the purpose of this experiment is to confirm the effectiveness of the proposed gait assistive suit which achieves regular phase detection.
Five healthy males in their 20 s and 30 s walked on the treadmill, and their parameters are shown in Table 4. EMG signals were recorded by EMG sensors (Delsys Inc., Bagnoli desktop EMG systems). We assumed that the walking of the trainee is bilateral symmetry. The electrodes are attached to the right leg, and these positions are on vastus lateralis (RTF), semitendinosus (RTB), gastrocnemius (RCB) and tibialis anterior (RCF). We recorded the EMG signals and calculated their RMS values J r (V) in one cycle motion as:
J r = 1 T c 0 T c E M G ( t ) 2 d t
where E M G (V) is a measured EMG signal. Frequency components of the EMG signal under 25 Hz are cut off by a high-pass filter to avoid a noise effect from cable swinging et al. The RMS value in maximum voluntary contraction (MVC) state is also measured in each muscle for normalization. The normalized RMS value is % M V C (%), and is calculated as:
% M V C = J r / J r M V C × 100
where J r M V C is the RMS value in MVC state, and % M V C is calculated in each electrode channel. The sensor positions and the clinical test method of measuring MVC state are determined based on the SENIAM project [38]. The metronome is used for equalizing the walking rate, and its tempo is adjusted in each trainee. The trainee walks on the treadmill 40 steps of 20 cycles with its speed of 5.0 km/h in each trial. The pressure in the CB PARMs is determined by using the procedure in Section 3.3. The experimental procedure is as follows;
  • Measuring the RMS value in MVC state J r M V C .
  • Resting 5 min.
  • EMG measurement of the walking without the suit.
  • Wearing the suit.
  • Practicing of the assisted walking.
  • Resting 10 min.
  • EMG measurement of the asssited walking.
5 to 10 min resting time is set between the measuring steps to avoid muscle fatigue of the trainee. In the practicing step, the trainee is required to learn how to walk with the assist force provided from the suit. The targets of the practicing step are 100 % success rate of the phase detection and learning of the relaxed walking using the assist force. Each EMG data is measured in one trial respectively in procedure 1, 3 and 7.

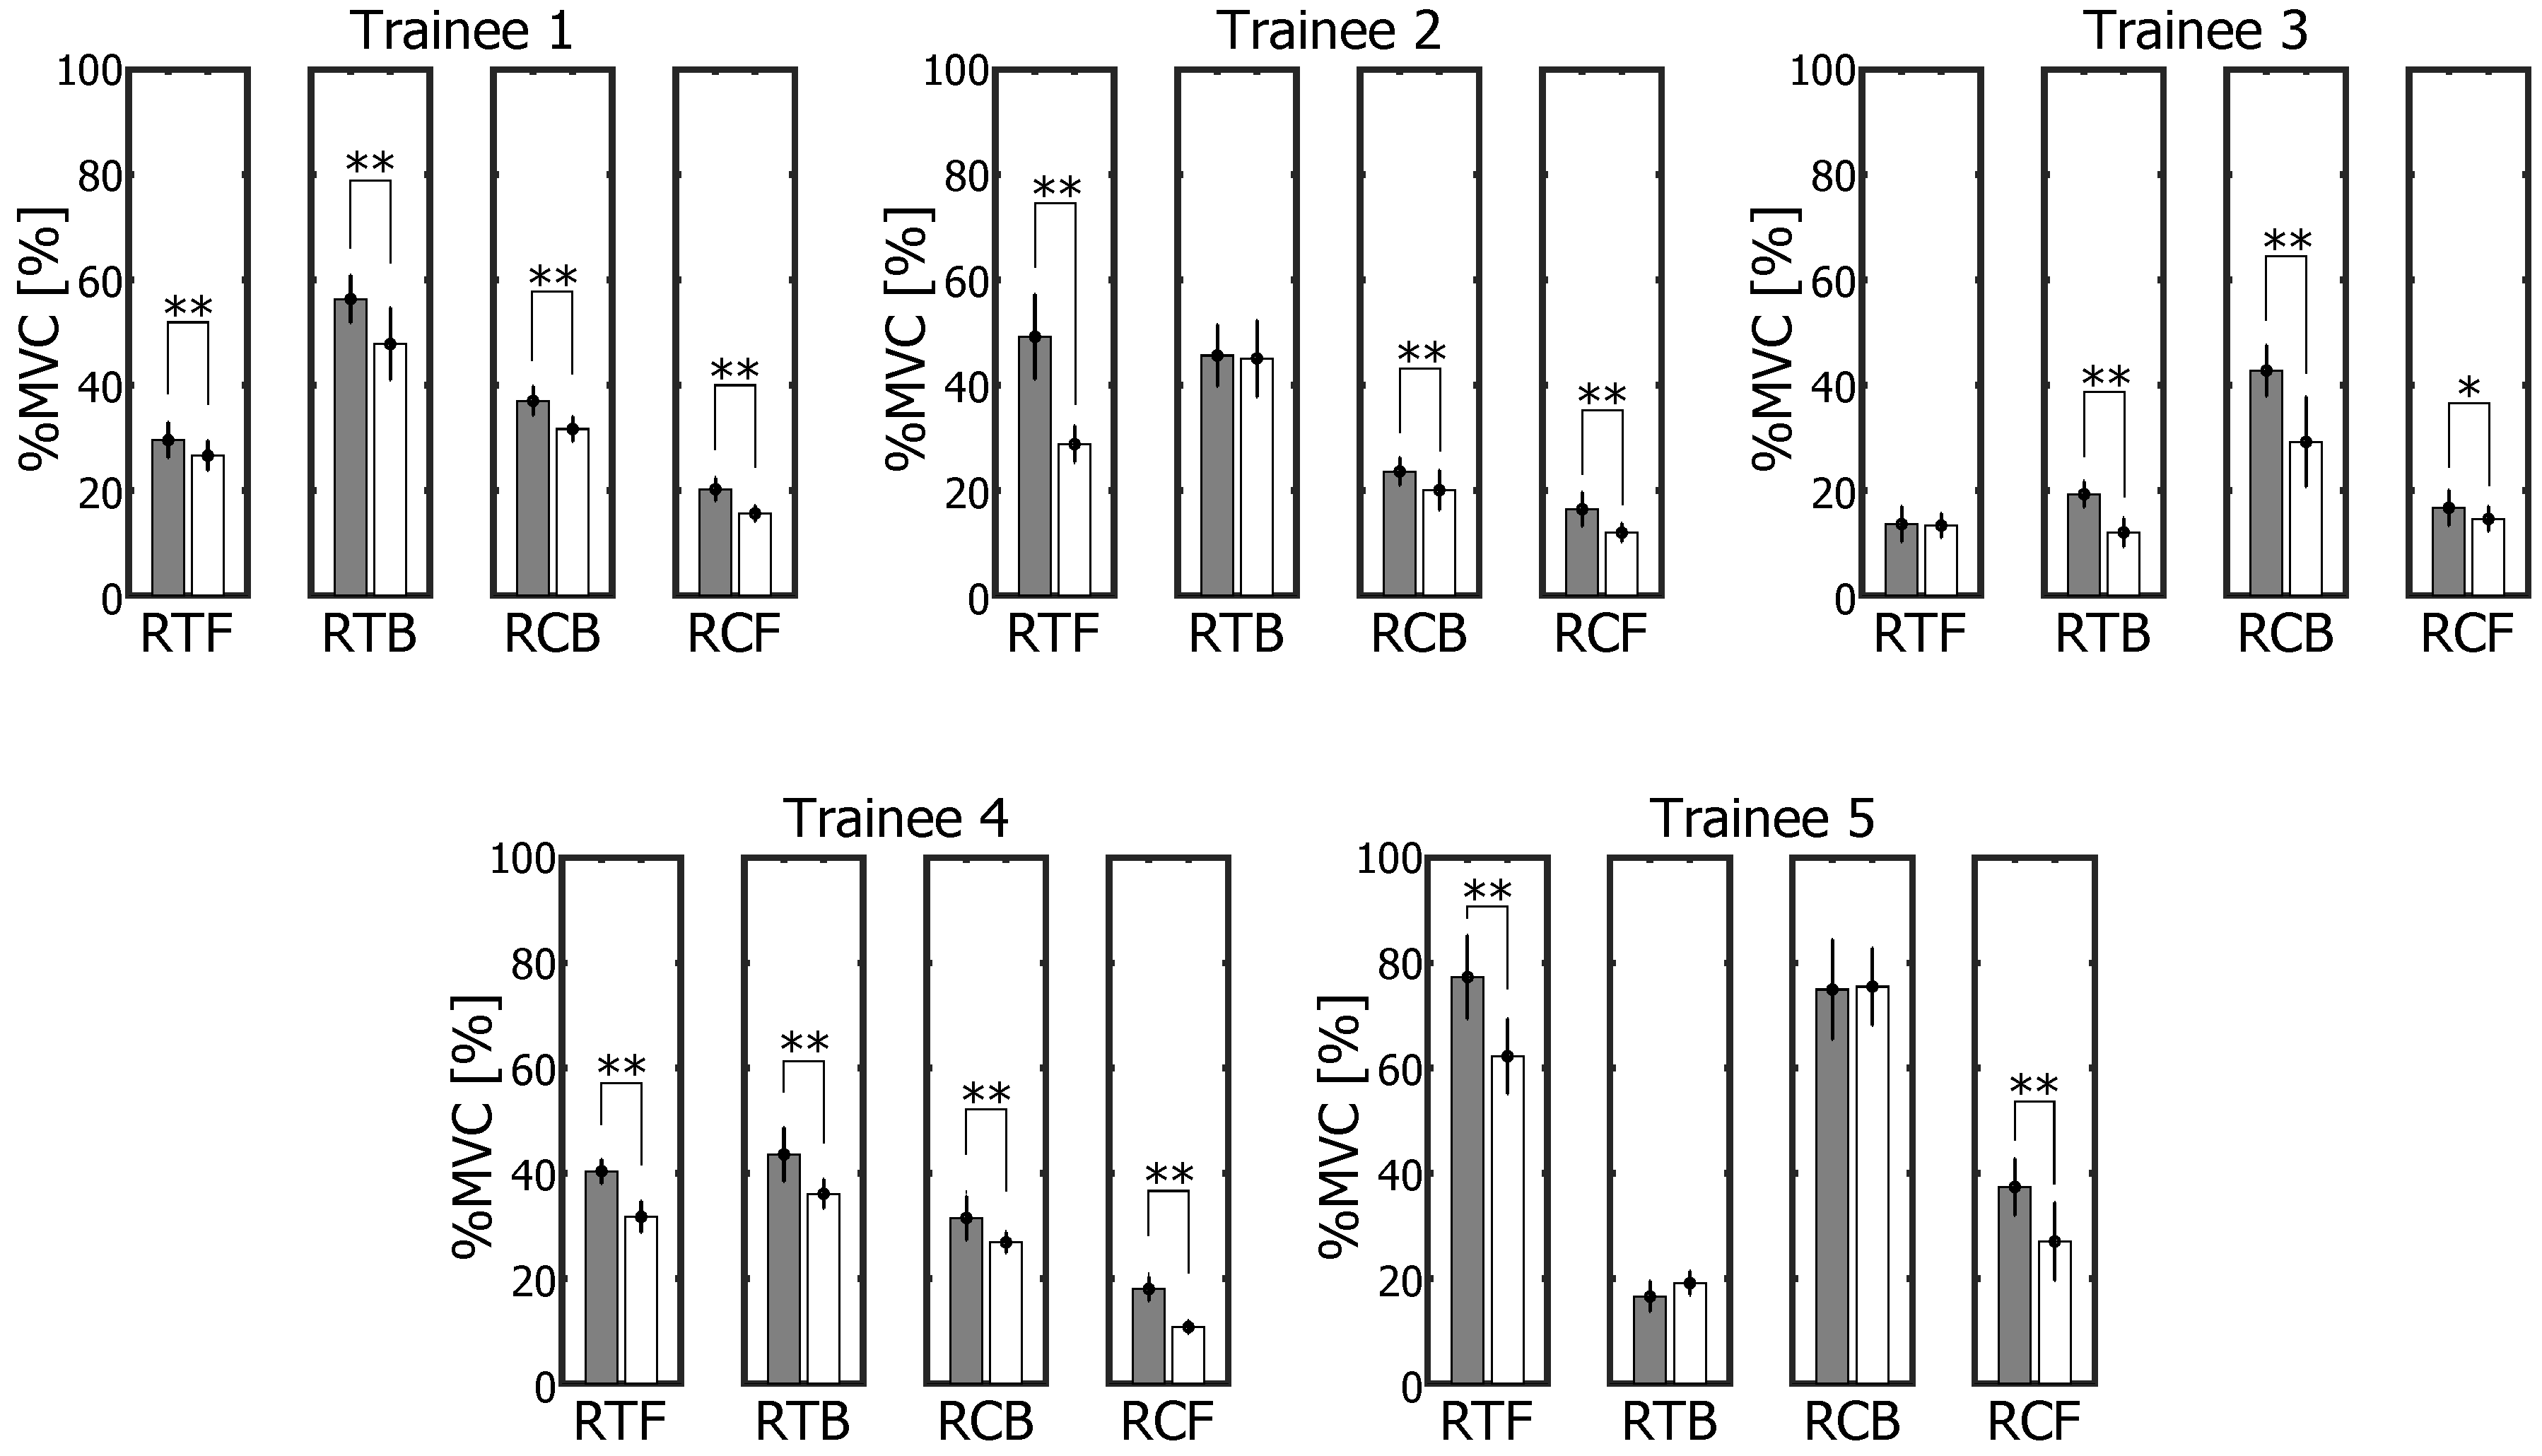
5.3.2. Experimental Result

The experimental results are shown in Figure 16. The vertical axis represents % M V C value in each electrode. The white and gray bars are the average % M V C values with assist and without assist which are calculated from 20 cycle data. The black thin bars are the standard deviations. We calculated the significant difference in the measured data using Welch’s t-test. The symbols * and * * indicate that the values are statistically different at the significance level of 5% and 1% of the two-sided test.

5.3.3. Discussion

The average % M V C values with assist were less than the values without assist in 16 of 20 channels as shown in Figure 16. This result quantitatively confirmed that the suit can reduce muscular activity. We also confirmed that the novel control method is applicable to the different trainees shown in Table 4 since all trainees achieved 100 % success rate of the phase detection in this experiment.
The CB PARMs are not controlled by the servo valves, however, these also contributes for the assistance since % M V C value on the RCB sensors decrease as shown in Figure 16. When the CF PARMs are pressurized, since these target pressure is larger than the CB PARM pressure, the assist torque rotates the trainee’s ankle in dorsiflexion and raises up the toe. After that, the CF PARMs are depressurized and the CB PARM will assist the plantar flexion torque on the ankle which is used in the terminal stance phase.
In addition, there are differences in the assist force effectiveness between the trainees’ data. Part of the measured data, for example, the trainee 2’s % M V C value on the RTB sensor etc., could not observe the effectiveness of the assistance. There will be possible reasons as; (i) the physical difference, and (ii) the skill level difference. About (i), the physical difference will affect the gait motion, and the force valance in the leg muscles will be different between the trainees. Therefore, the proper assist force will be different by the trainee. In this paper, the assist force trajectory is designed as a simple step function and its amplitude is given as the constant value of 400 kPa regardless of the trainee. In our future work, the proper assist force will be designed in each trainee. About (ii), there is the skill level difference about the assisted walking between the trainees. Some trainees could master the assisted walking in a short time, however, some trainees said that they feel difficult to execute the assisted walking with the fixed BPM tempo. Therefore, some trainees’ result shown in Figure 16 might not be skilled sufficiently. In our future work, the practicing protocol of the assisted walking will be improved for measuring the skilled walking data.
About the repeatability, in all experiments in this paper, we confirmed the repeatability of the experiments with the same subject in one trainee in different days. From this result, we expect that all experiments have repeatability since gait motion is one of fundamental motion for healthy trainees. Only the experiments in this section will be affected by the trainee’s skill level. The result of the skilled trainee will have repeatability.

6. Conclusions

The conclusions are as follows:
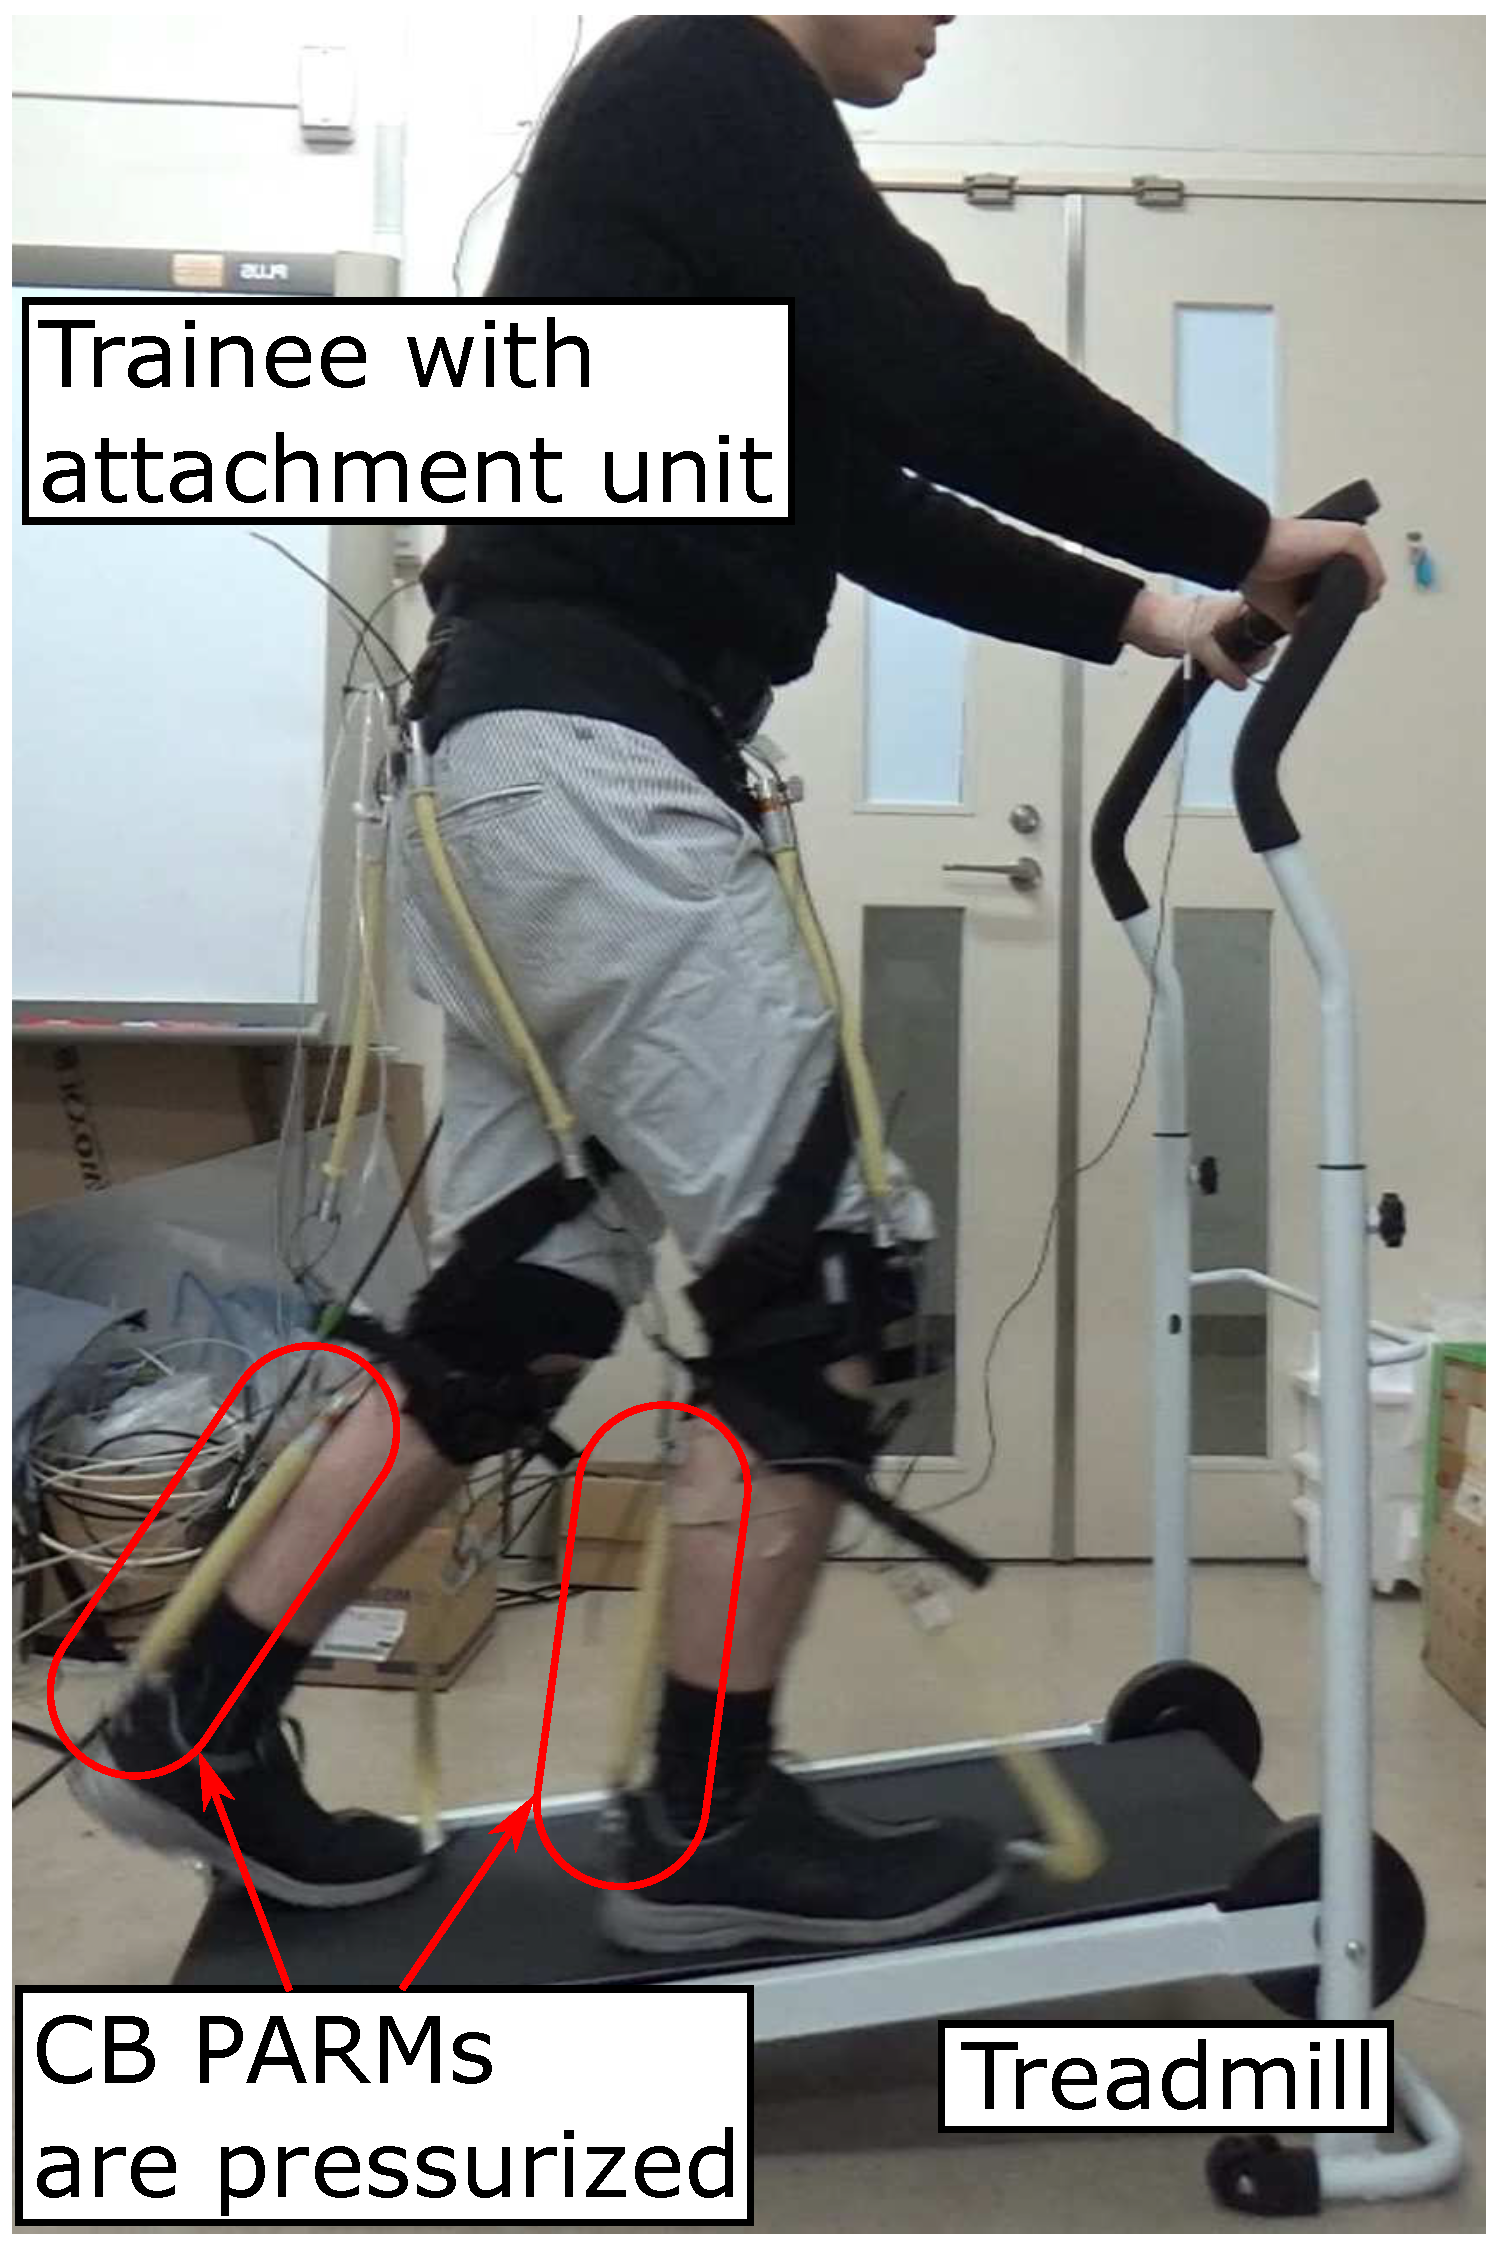
  • We developed the soft gait assistive suit actuated by the PARMs. The target task is to assist the trainee’s forward walking on the treadmill, and the PARMs are placed on the anterior and posterior surfaces of the thigh and the calf. The proposed gait assistive suit consists of the attachment unit and the control unit, and these units are separated physically and only connected by air tubes. The attachment unit has a lightweight soft structure, and the unique feature of the unit is that it has no electrical devices. Because electrical sensors are not needed to be attached to the trainee, and the suit is soft and lightweight, it has the advantage of being easy and safe to use.
  • We proposed the novel phase detection method using pressure and pressure derivative in the PARMs. The novel detection method is more robust to the signal noise compared with the conventional method since the pressure information is utilized which is smoother than the pressure derivative. Also, since the non-detection time is not required, the trainee can walk with a high walking rate.
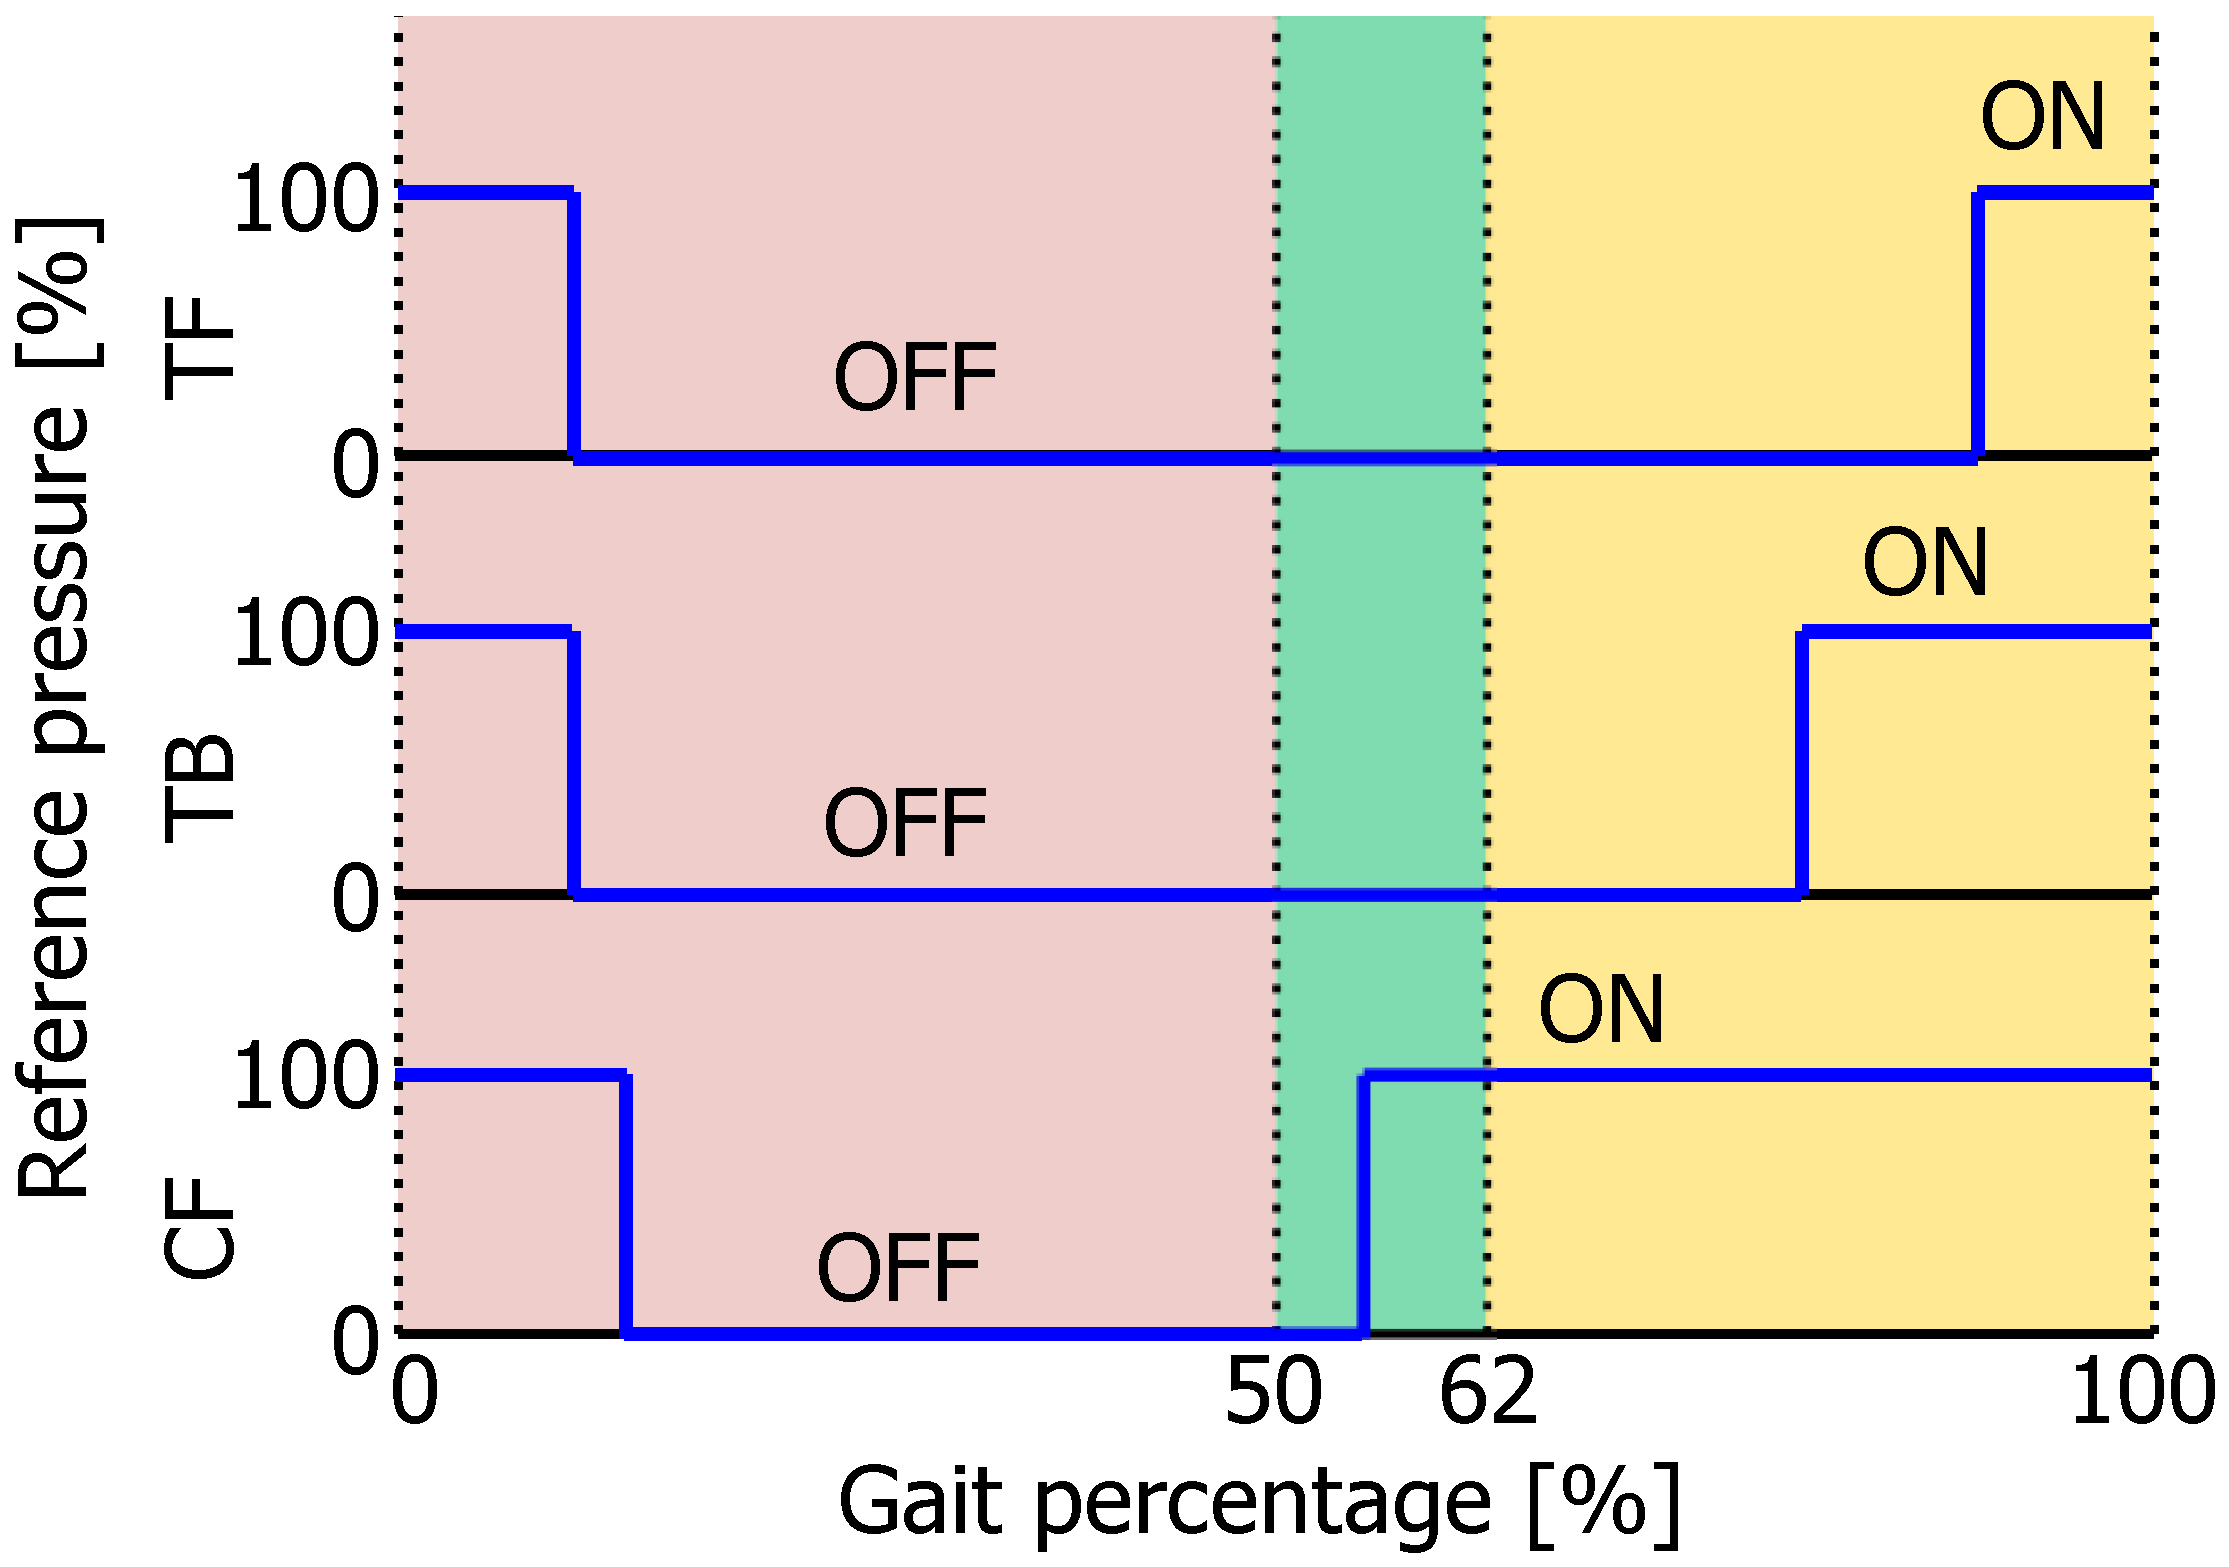
  • We proposed the calculation method of the gait cycle time from the assist timing. The average gait cycle time is calculated from the assist timing, and the proper pressure input time is obtained from the calculation result. The pressurized timing and duration in each PARM are given from the EMG activation time in each muscle near the PARM.
  • We confirmed that the proposed gait assistive suit and its control method works correctly in the experiment. The phase detection accuracy and the change of the pressure input time were confirmed by comparing with the conventional control method. 1 trainee wore the gait assistive suit and walked 100 steps of 50 cycles on the treadmill with its speed of 3.0 km/h in each trial. We measured the two different gaits with their walking rate of 90 and 140 BPM by using a metronome. The total 100 walking steps were measured, and the success rate of the phase detection was counted in each case. In the case of 90 BPM walking, the conventional and the proposed control methods achieved 100% success rate. On the other hand, in the case of 140 BPM, the proposed control method achieved 100% detection, and the success rate of the conventional control method was 72%. As a result, it was confirmed that the regular and precise phase detection can be achieved in an arbitrary walking rate by using the proposed control method.
  • We verified whether the gait assistive suit is effective for decreasing activity in the trainee’s muscles. We measured and compared the muscular activities of the assisted walking and walking without the suit. 5 healthy males in their 20 s and 30 s walked on the treadmill. EMG signals were recorded by EMG sensors, and their % M V C values were calculated. The trainee walks on the treadmill 40 steps of 20 cycles with its speed of 5.0 km/h in each trial. The average % M V C values with assist were less than or equal to the values without assist. This tendency was observed in all subjects. The results quantitatively confirmed that the suit can reduce muscular activity.
We consider that the proposed suit is applicable to underwater training. The underwater training has an effect that the weight is canceled by water’s buoyancy. Therefore, this training is popular as a training method for elder persons and persons in rehabilitation, etc. [39,40]. The conventional assistive devices, which contain many electrical parts, will be difficult to apply for the underwater training from the waterproof point of view. On the other hand, our proposed suit has an advantage for the underwater application since it has no electrical parts on its attachment unit. As a preliminary step, the prototype suit was applied for the underwater walking experiment, and the experimental result demonstrated the applicability of our suit in the underwater situation [41]. As a future work, we will try to expand the application of the proposed suit, for example, underwater walking, swimming, etc.

Author Contributions

Conceptualization, T.M. and T.K. (Takahiro Kanno); methodology, T.M.; software, D.M.; validation, T.M. and R.M.; formal analysis, T.K. (Toshihiro Kawase) and T.M.; investigation, T.T.; Writing—Original Draft preparation, T.M.; Writing—Review and Editing, T.K. (Toshihiro Kawase), T.K. (Takahiro Kanno) and K.K.; project administration, K.K.; funding acquisition, K.K.

Funding

This research was funded by Bridgestone Corporation.

Acknowledgments

This research is based on the Cooperative Research Project of Research Center for Biomedical Engineering. The authors would like to thank Hiroshi Suzuki for his assistance. We also thank Shingo Oono, Ryo Sakurai and Shintaro Yoshida in Bridgestone Corporation for their support.

Conflicts of Interest

The authors declare no conflict of interest.

References

  1. Yan, T.; Cempini, M.; Oddo, C.M.; Vitiello, N. Review of assistive strategies in powered lower-limb orthoses and exoskeletons. Robot. Auton. Syst. 2015, 64, 120–136. [Google Scholar] [CrossRef]
  2. Low, K.H. Robot-assisted gait rehabilitation: From exoskeletons to gait systems. In Proceedings of the 2011 Defense Science Research Conference and Expo (DSR), Singapore, 3–5 August 2011; pp. 1–10. [Google Scholar] [CrossRef]
  3. Herr, H. Exoskeletons and orthoses: Classification, design, and future directions. J. Neuroeng. Rehabil. 2009, 6. [Google Scholar] [CrossRef] [PubMed]
  4. Sankai, Y. HAL: Hybrid assistive limb based on cybernics. In Robotics Research; Kaneko, M., Nakamura, Y., Eds.; Springer: Berlin/Heidelberg, Germany, 2011; pp. 25–34. [Google Scholar]
  5. Yamamoto, K.; Ishii, M.; Noborisaka, H.; Hyodo, K. Stand alone wearable power assisting suit—Sensing and control systems. In Proceedings of the 13th IEEE International Workshop on Robot and Human Interactive Communication (IEEE Catalog No.04TH8759), Okayama, Japan, 22–22 September 2004; pp. 661–666. [Google Scholar] [CrossRef]
  6. Chen, S. Assistive control system for upper limb rehabilitation robot. IEEE Trans. Neural Syst. Rehabil. Eng. 2016, 24, 1199–1209. [Google Scholar] [CrossRef] [PubMed]
  7. Lemerle, S.; Nozaki, T.; Ohnishi, K. Design and evaluation of a remote actuated finger exoskeleton using motion-copying system for tendon rehabilitation. IEEE Trans. Ind. Inf. 2018, 14, 5167–5177. [Google Scholar] [CrossRef]
  8. Lu, R.; Li, Z.; Su, C.; Xue, A. Development and learning control of a human limb with a rehabilitation exoskeleton. IEEE Trans. Ind. Electron. 2014, 61, 3776–3785. [Google Scholar] [CrossRef]
  9. Pyo, S.; Ozer, A.; Yoon, J. A novel design for lower extremity gait rehabilitation exoskeleton inspired by biomechanics. In Proceedings of the ICCAS 2010, Gyeonggi-do, Korea, 27–30 October 2010; pp. 1806–1811. [Google Scholar] [CrossRef]
  10. Gilbert, M.; Zhang, X.; Yin, G. Modeling and design on control system of lower limb rehabilitation exoskeleton robot. In Proceedings of the 2016 13th International Conference on Ubiquitous Robots and Ambient Intelligence (URAI), Xi’an, China, 19–22 August 2016; pp. 348–352. [Google Scholar] [CrossRef]
  11. Asbeck, A.T.; De Rossi, S.M.M.; Galiana, I.; Ding, Y.; Walsh, C.J. Stronger, smarter, softer: Next-generation wearable robots. IEEE Robot. Autom. Mag. 2014, 21, 22–33. [Google Scholar] [CrossRef]
  12. Asbeck, A.T.; De Rossi, S.M.M.; Holt, K.G.; Walsh, C.J. A biologically inspired soft exosuit for walking assistance. Int. J. Robot. Res. 2015, 34, 744–762. [Google Scholar] [CrossRef]
  13. Asbeck, A.T.; Schmidt, K.; Walsh, C.J. Soft exosuit for hip assistance. Robot. Auton. Syst. 2015, 73, 102–110. [Google Scholar] [CrossRef]
  14. Talaty, M.; Esquenazi, A.; Briceno, J.E. Differentiating ability in users of the rewalkTM powered exoskeleton: An analysis of walking kinematics. In Proceedings of the 2013 IEEE 13th International Conference on Rehabilitation Robotics (ICORR), Seattle, WA, USA, 24–26 June 2013; pp. 1–5. [Google Scholar] [CrossRef]
  15. Veneman, J.F.; Kruidhof, R.; Hekman, E.E.G.; Ekkelenkamp, R.; Van Asseldonk, E.H.F.; van der Kooij, H. Design and evaluation of the LOPES exoskeleton robot for interactive gait rehabilitation. IEEE Trans. Neural Syst. Rehabil. Eng. 2007, 15, 379–386. [Google Scholar] [CrossRef] [PubMed]
  16. Kong, K.; Jeon, D. Design and control of an exoskeleton for the elderly and patients. IEEE/ASME Trans. Mechatron. 2006, 11, 428–432. [Google Scholar] [CrossRef]
  17. Kwa, H.K.; Noorden, J.H.; Missel, M.; Craig, T.; Pratt, J.E.; Neuhaus, P.D. Development of the IHMC mobility assist exoskeleton. In Proceedings of the 2009 IEEE International Conference on Robotics and Automation, Kobe, Japan, 12–17 May 2009; pp. 2556–2562. [Google Scholar] [CrossRef]
  18. Kanno, T.; Morisaki, D.; Miyazaki, R.; Endo, G.; Kawashima, K. A walking assistive device with intention detection using back-driven pneumatic artificial muscles. In Proceedings of the 2015 IEEE International Conference on Rehabilitation Robotics (ICORR), Singapore, 11–14 August 2015; pp. 565–570. [Google Scholar] [CrossRef]
  19. Yang, Y.; Ma, L.; Huang, D. Development and repetitive learning control of lower limb exoskeleton driven by electrohydraulic actuators. IEEE Trans. Ind. Electron. 2017, 64, 4169–4178. [Google Scholar] [CrossRef]
  20. Zhu, J.; Wang, Y.; Zhou, H. Human-machine coupling control of exoskeleton intelligent load carry robot. In Proceedings of the 2012 IEEE International Conference on Mechatronics and Automation, Chengdu, China, 5–8 August 2012; pp. 268–272. [Google Scholar] [CrossRef]
  21. Kim, H.; Lee, J.; Jang, J.; Han, C.; Park, S. Mechanical design of an exoskeleton for load-carrying augmentation. In Proceedings of the IEEE ISR 2013, Seoul, Korea, 24–26 October 2013; pp. 1–5. [Google Scholar] [CrossRef]
  22. Walsh, C.J.; Pasch, K.; Herr, H. An autonomous, underactuated exoskeleton for load-carrying augmentation. In Proceedings of the 2006 IEEE/RSJ International Conference on Intelligent Robots and Systems, Beijing, China, 9–15 October 2006; pp. 1410–1415. [Google Scholar] [CrossRef]
  23. Kobayashi, H.; Matsushita, T.; Ishida, Y.; Kikuchi, K. New robot technology concept applicable to human physical support—The concept and possibility of the muscle suit (wearable muscular support apparatus). J. Robot. Mechatron. 2002, 14, 46–53. [Google Scholar] [CrossRef]
  24. Muramatsu, Y.; Kobayashi, H. Assessment of local muscle fatigue by NIRS—Development and evaluation of muscle suit. Robomech J. 2014, 1, 19. [Google Scholar] [CrossRef]
  25. Zoss, A.B.; Kazerooni, H.; Chu, A. Biomechanical design of the berkeley lower extremity exoskeleton (BLEEX). IEEE/ASME Trans. Mechatron. 2006, 11, 128–138. [Google Scholar] [CrossRef]
  26. Lee, S.; Kim, J.; Baker, L.; Long, A.; Karavas, N.; Menard, N.; Galiana, I.; Walsh, C.J. Autonomous multi-joint soft exosuit with augmentation-power-based control parameter tuning reduces energy cost of loaded walking. J. Neuroeng. Rehabil. 2018, 15, 66. [Google Scholar] [CrossRef]
  27. Dzahir, M.A.M.; Yamamoto, S. Recent trends in lower-limb robotic rehabilitation orthosis: Control scheme and strategy for pneumatic muscle actuated gait trainers. Robotics 2014, 3, 120–148. [Google Scholar] [CrossRef]
  28. Wehner, M.; Quinlivan, B.; Aubin, P.M.; Martinez-Villalpando, E.; Baumann, M.; Stirling, L.; Holt, K.; Wood, R.; Walsh, C.J. A lightweight soft exosuit for gait assistance. In Proceedings of the 2013 IEEE International Conference on Robotics and Automation, Karlsruhe, Germany, 6–10 May 2013; pp. 3362–3369. [Google Scholar] [CrossRef]
  29. Sridar, S.; Qiao, Z.; Muthukrishnan, N.; Zhang, W.; Polygerinos, P. A Soft-Inflatable Exosuit for Knee Rehabilitation: Assisting Swing Phase During Walking. Front. Robot. AI 2018, 5, 44. [Google Scholar] [CrossRef]
  30. Park, Y.; Santos, J.; Galloway, K.G.; Goldfield, E.C.; Wood, R.J. A soft wearable robotic device for active knee motions using flat pneumatic artificial muscles. In Proceedings of the 2014 IEEE International Conference on Robotics and Automation (ICRA), Hong Kong, China, 31 May–7 June 2014; pp. 4805–4810. [Google Scholar] [CrossRef]
  31. Sasaki, D.; Noritsugu, T.; Takaiwa, M. Development of pneumatic lower limb power assist wear driven with wearable air supply system. In Proceedings of the 2013 IEEE/RSJ International Conference on Intelligent Robots and Systems, Tokyo, Japan, 3–7 November 2013; pp. 4440–4445. [Google Scholar] [CrossRef]
  32. Huang, H.; Zhang, F.; Hargrove, L.J.; Dou, Z.; Rogers, D.R.; Englehart, K.B. Continuous locomotion-mode identification for prosthetic legs based on neuromuscular-mechanical fusion. IEEE Trans. Biomed. Eng. 2011, 58, 2867–2875. [Google Scholar] [CrossRef]
  33. Lim, D.H.; Kim, W.S.; Kim, H.J.; Han, C.S. Development of real-time gait phase detection system for a lower extremity exoskeleton robot. Int. J. Precis. Eng. Manuf. 2017, 18, 681–687. [Google Scholar] [CrossRef]
  34. Altilio, R.; Paoloni, M.; Panella, M. Selection of clinical features for pattern recognition applied to gait analysis. Med. Biol. Eng. Comput. 2017, 55, 685–695. [Google Scholar] [CrossRef]
  35. Wang, F.; Yan, L.; Xiao, J. Human gait recognition system based on support vector machine algorithm and using wearable sensors. Sens. Mater. 2019, 31. [Google Scholar] [CrossRef]
  36. Lee, S.S.; Choi, S.T.; Choi, S.I. Classification of gait type based on deep learning using various sensors with smart insole. Sensors 2019, 19, 1757. [Google Scholar] [CrossRef]
  37. Perry, J.; Burnfield, J.M. Gait Analysis: Normal and Pathological Function.; SLACK, INC.: Thorefare, NJ, USA, 2010. [Google Scholar]
  38. SENIAM. The SENIAM Project. Available online: http://www.seniam.org/ (accessed on 11 March 2019).
  39. Park, S.W.; Lee, K.J.; Shin, D.C.; Shin, S.H.; Lee, M.M.; Song, C.H. The effect of underwater gait training on balance ability of stroke patients. J. Phys. Ther. Sci. 2014, 26, 899–903. [Google Scholar] [CrossRef] [PubMed]
  40. Kim, M.K.; Lee, S.A. Underwater treadmill training and gait ability in the normal adult. J. Phys. Ther. Sci. 2017, 29, 67–69. [Google Scholar] [CrossRef] [Green Version]
  41. Miyazaki, T.; Suzuki, H.; Morisaki, D.; Kanno, T.; Miyazaki, R.; Kawakami, Y.; Kawashima, K. Underwater walking using soft sensorless gait assistive suit. In Proceedings of the 2019 IEEE/SICE International Symposium on System Integration (SII), Paris, France, 14–16 January 2019; pp. 237–242. [Google Scholar] [CrossRef]
Figure 1. (a) Leg link system attached the PARMs and (b) Illustration of the trainee’s leg wearing the gait assistive suit. PARMs attached on the anterior and posterior surfaces of the trainee’s thigh and calf. Contraction force of these PARMs assists joint torque of the hip, knee, and ankle. (c) The target muscles of the gait assistive suit.
Applsci 09 02869 g001
Figure 2. Attachment unit of the novel gait assistive suit actuated by PARMs. Compared with the previous suit [18] which has a rigid link system, the novel suit consists of only lightweight and soft parts as PARMs, waist supporter, knee supporters, nylon belts and shoes. The 8 PARMs are placed on the surfaces of the legs. The PARMs on the right leg are named as the right thigh front (RTF), right thigh back (RTB), right calf front (RCF), and right calf back (RCB). The PARMs on the left leg are named in the same manner (LTF, LTB, LCF, LCB).
Applsci 09 02869 g002
Figure 3. Schematic of the pneumatic control system. The control unit is connected to the attachment unit by the air tube. The pressure in the PARMs is measured by the pressure sensors, and the analog-to-digital (A/D) board sends the pressure information to the computer. Command voltages for the servo valves are calculated by the computer, and are send by the digital-to-analog (D/A) board. The pressure information of the calf back (CB) PARMs is used for an assist timing detection. Air flows into or out from the CB PARMs are closed by the 2 port valves, and these PARMs are used as deformable closed chambers.
Applsci 09 02869 g003
Figure 4. Block diagram of pneumatic pressure control. P r e f and P (kPa) are reference pressure and current pressure respectively. K p (V/kPa) and K i (V/kPa s) are a proportional and an integral gains. u (V) is a control voltage, and s is a Laplace operator.
Applsci 09 02869 g004
Figure 5. Gait phases in one cycle motion. A horizontal axis represents a gait percentage in the one cycle motion. The gait phases of a white color leg are classified in a stance phase, a pre-swing phase, and a swing phase, and an opposite side leg is also classified in the same manner.
Applsci 09 02869 g005
Figure 6. Deformation of CB PARM in pre-swing phase ((left) long length state, (right) short length state). The red line represents a wire whose length is constant. At the start of the pre-swing phase, the PARM is stretched and its length is long. After that, the stretched PARM contracts in a short time, and its length and pressure become short and low.
Applsci 09 02869 g006
Figure 7. Walking experiments to determine the proper pressure in the CB PARMs. The trainee wearing the gait assistive suit walks on the treadmill with the pressurized CB PARMs.
Applsci 09 02869 g007
Figure 8. Sample experimental data with the initial pressure of 200 kPa. The trainee walked with its walking rate 100 BPM. The horizontal axis shows time (s), and walking phases are distinguished by color areas. Red areas represent the stance phase, green areas represent the pre-swing phase, and yellow areas represent the swing phase. The (upper) figure shows the pressure in the RCB PARM. The (lower) figure shows the pressure derivative.
Applsci 09 02869 g008
Figure 9. Detectability index calculated from the sample data. Blue and red colors mean values of the RCB and LCB PARMs. Markers are average values, and thin bars are standard deviations.
Applsci 09 02869 g009
Figure 10. Control sequence of PARM pressure using conventional pre-swing phase detection.
Applsci 09 02869 g010
Figure 11. Sample data of the pressure and the pressure derivative for checking Equation (7). The horizontal axis shows time (s), and walking phases are distinguished by color areas. Red areas represent the stance phase, green areas represent the pre-swing phase, and yellow areas represent the swing phase. The (upper) figure shows the pressure in the RCB PARM. The (lower) figure shows the pressure derivative in the RCB PARM, and blue solid lines and yellow dashed lines are calculated value and the threshold 0 kPa/s. Red circle markers are detected time step k 1 .
Applsci 09 02869 g011
Figure 12. Sample data of the pressure and the pressure derivative for checking Equation (8). The horizontal axis shows time (s), and walking phases are distinguished by color areas. Red areas represent the stance phase, green areas represent the pre-swing phase, and yellow areas represent the swing phase. The (upper) figure shows the pressure in the RCB PARM. The (lower) figure shows the pressure derivative in the RCB PARM, and blue solid lines and yellow dashed lines are calculated value and the threshold 0 kPa/s. Red circle markers are assist timing k a .
Applsci 09 02869 g012
Figure 13. Pressure input time of PARMs controlled by servo valves. The horizontal axis shows gait percentage, and the vertical axis shows reference pressure in each PARM. ON (100%) and OFF (0%) mean the pressurized state and the depressurized state. Walking phases are distinguished by color areas. Red areas represent the stance phase, green areas represent the pre-swing phase, and yellow areas represent the swing phase. The pressurized timing and duration in each PARM are given from the EMG activation time in each muscle near the PARM [37].
Applsci 09 02869 g013
Figure 14. Assisted walking sequence on the treadmill. The trainee wearing the gait assistive suit walked on the treadmill. The horizontal axis shows the gait percentage of the right leg. The red marker means the pressurized PARM on the right leg.
Applsci 09 02869 g014
Figure 15. RCF PARM pressure trajectories of the 90 and 140 BPM walking. The horizontal axis is time (s), and the vertical axis is pressure (kPa). The solid and dashed lines are the measured pressure and the reference pressure. (a) 90 BPM walking using the conventional method. (b) 140 BPM walking using the conventional method. (c) 90 BPM walking using the proposed method. (d) 140 BPM walking using the proposed method.
Applsci 09 02869 g015
Figure 16. Results of EMG evaluation experiment. The vertical axis represents % M V C value in each electrode. The white and gray bars are the average % M V C values with assist and without assist which are calculated from 20 cycle data. The black thin bars are the standard deviations. The symbols * and * * indicate that the values are statistically different at the significance level of 5% and 1% of the two-sided test.
Applsci 09 02869 g016
Table 1. Parameters of the attachment unit.
Whole mechanism weight (kg)1.0
PARM numbers8
PARM weight (kg)7.0 × 10 2
PARM length (m)300 × 10 3
PARM inner diameter (m)9.5 × 10 3
Target torque (Nm)15
Target contraction force of PARM (N)300
(When pressure is supplied as 400 kPa)
Table 2. Given parameters for the proposed control method.
Proportional gain K p (V/kPa)3.0 × 10 2
Integral gain K i (V/kPa s)7.0 × 10 2
Base pressure (kPa)0.0
Target pressure (kPa)4.0 × 10 2
Threshold of pressure derivative P ˙ t h (kPa/s)0.0
Threshold of pressure Δ P t h (kPa)−15
Control frequency (Hz)5.0 × 10 2
Measuring frequency of EMG (Hz)5.0 × 10 2
Cut-off frequency of numerical
differentiation of pressure (Hz)10
Cut-off frequency
of low-pass filter of pressure (Hz)10
Upper limit of control voltage (V)9.8
Lower limit of control voltage (V)0.2
Upper limit of gait cycle time T c m a x (s)5.0
Walking step number n
for calculating average gait cycle time4
Detection timing in gait cycle time (%)55
Pressurized time of TF PARMs (%)90–10
Pressurized time of TB PARMs (%)80–10
Pressurized time of CF PARMs (%)55–13
Table 3. Given parameters for the conventional control method.
Threshold of pressure derivative P ˙ t h (kPa/s) 1.0 × 10 2
Target walking rate [BPM]90
Target gait cycle time (s) 1.3
Non-detection time (s) 0.9
Table 4. Parameters of the trainees.
Height (m)Weight (kg)Pressure in CB PARMs (kPa)
Trainee 11.7172 1.5 × 10 2
Trainee 21.7673 1.5 × 10 2
Trainee 31.7574 1.0 × 10 2
Trainee 41.7054 1.0 × 10 2
Trainee 51.6168 1.0 × 10 2

