Experimental Study on Mechanics and Permeability Properties of Water-Bearing Raw Coal Samples Under In-Situ Stress


1
State Key Laboratory of Coal Mine Disaster Dynamics and Control, Chongqing University, Chongqing 400044, China
2
College of Resources and Environmental Science, Chongqing University, Chongqing 400044, China
3
Nantong Mine of Chongqing Energy Investment Group Co., Chongqing 400800, China
*
Author to whom correspondence should be addressed.
Appl. Sci. 2019, 9(12), 2549; https://doi.org/10.3390/app9122549
Submission received: 23 May 2019
/
Revised: 19 June 2019
/
Accepted: 20 June 2019
/
Published: 21 June 2019
(This article belongs to the Section Environmental Sciences)
Abstract
:In this paper, we investigated the mechanical and permeability characteristics of water-bearing raw coal samples under in-situ stress, and came to some conclusions, as follows: the peak strength and peak axial strain of samples gradually decrease with the increase of water content. Under the same stress condition, the higher the water content is, the lower the axial strain and radial strain will be. The peak strength and peak strain of the sample both decrease with the water content as a quadratic function. During the post-peak loading and unloading process, with the increase of the number of cycles of loading and unloading, the radial strain decrement and increment of the raw coal sample gradually decrease after loading and unloading confining pressure. The permeability of samples gradually decreases with the loading confining pressure, and the permeability of the sample gradually increases with the unloading confining pressure. The permeability of coal samples increases volatility with the increase of axial strain, and the fitted sample permeability and effective stress are subject to the ExpDec1 function distribution.
1. Introduction
Coal and gas outbursts are one of the most serious disasters in the mine production process, which not only causes serious damage to personnel and equipment, but also has a serious impact on society [1,2]. However, the control of gas disasters can be attributed to the flow of gas in the coal seam, that is, the gas seepage in the coal seam. Therefore, studying the gas flow in coal seams is of of great significance for the control of gas disasters.
At present, domestic and foreign scholars have carried out a series of experimental studies on the permeability properties of coal and rock samples and achieved a series of results. Ye et al. [3] simulated the response characteristics of pore pressure to the permeability characteristics of raw coal under different in-situ stress loading and unloading paths. Wang et al. [4] studied the effect of in-situ stress and joints on coal seam permeability in the Linfen area. Ju et al. [5] conducted a series of tests on the methane permeability of fractured coal under different mining stress paths. Xue et al. [6] studied the deformation, permeability and acoustic emission characteristics of coal under mining stress. Wang et al. [7] measured the permeation characteristics of CH4, CO2 and He in anthracite samples at different gas pressures and temperatures and obtained the relationship between steady-state time and gas pressure and temperature. Li et al. [8,9] carried out isothermal adsorption tests at different temperatures and a seepage test of pore pressure increase. Zhang et al. [10] carried out a permeability test and nuclear magnetic resonance test of coal and rock samples before and after liquid nitrogen cold soaking. Yang et al. [11] used the pressure pulse attenuation method to test the permeability of coal and rock before and after low temperature treatment and revealed the influence of liquid nitrogen injection on the permeability of coal seam. Chen et al. [12] carried out an experimental study on the adsorption-desorption and permeability of anisotropic gases in coal. It was considered that the permeability of coal sample shows different changes at different stages. Zhang et al. [13] studied the permeability evolution law of unloaded coal samples and the influence mechanism of loading rate on it. Zhao et al. [14] analyzed the mechanical properties and permeability evolution law of raw coal under different loading and unloading rates. Duan et al. [15] discussed the deformation, permeability and energy consumption characteristics of raw coal during the staged loading-unloading process and established the damage variable equation. Liu et al. [16] considered that the permeability of coal samples decreases exponentially with the increase of effective stress. Zhang et al. [17] conducted a permeability test of raw coal samples during unloading confining pressure and established an analytical model of damage evolution with the influence permeability characteristics of containing-gas coal.
Scholars at home and abroad have also done research on the effect of water on the mechanics and permeability characteristics of coal and rock. Pan et al. [18] carried out loading and unloading tests of coal samples with different water contents and discussed the relationship between water content and elastic modulus of coal. Liu et al. [19] conducted uniaxial compression tests on raw coal samples after water injection and analyzed the influence of water content on compressive strength and elastic modulus of raw coal samples. Perera et al. [20] compared the strength and deformation characteristics of saturated and dried coal samples. Qin et al. [21] analyzed the stress–strain characteristics and damage evolution characteristics of coal samples with different water content. Wang et al. [22] analyzed the relationship between mechanical parameters and water content of raw coal and briquette samples. Wang et al. [23] compared the mechanical properties of natural saturated anthracite samples with that of strong saturated coal samples. Feng et al. [24] considered the effect of water content from the viewpoint of adsorption. Wang et al. [25] believed that with the increase of water content, the porosity of coal samples gradually decreased, resulting in the decrease of coal permeability. Yin et al. [26,27] carried out gas permeability tests on raw coal samples with different water contents and considered that the water content and gas permeability of coal body obeyed a linear function. Wei et al. [28] considered that water content has an inhibitory effect on the permeability of coal samples. Yuan et al. [29] conducted a test of permeability characteristics under constant effective axial stress and effective confining pressure for coal samples, such as dry, natural water content, liquid water wetting and pressure water injection.
In summary, although many scholars have focused on the effects of moisture on the mechanical and permeability properties of gas-bearing coal, most of them have discussed the effects of moisture content on the compressive strength, elastic modulus and permeability properties of samples under conventional triaxial compression. However, the on-site coal body is under three-way in-situ stress conditions, and the coal body in front of the coal seam undergoes complex loading and unloading processes during the coal seam mining process, while gas flow in the coal body is closely related to the in-situ stress environment, and there are few studies on the permeability characteristics of raw coal under in-situ stress and post-peak loading and unloading. Therefore, based the distribution law of in-situ stress in the 2461 working face of Baijiao Coal Mine, Sichuan Coal Group, this paper conducts a deep study on the mechanics and permeability characteristics of gas-bearing raw coal under the influence of in-situ stress and post-peak loading and unloading conditions, in order to provide some theoretical guidance for gas control in low permeability coal seam.
2. Test Device and Scheme Design
2.1. Test Device
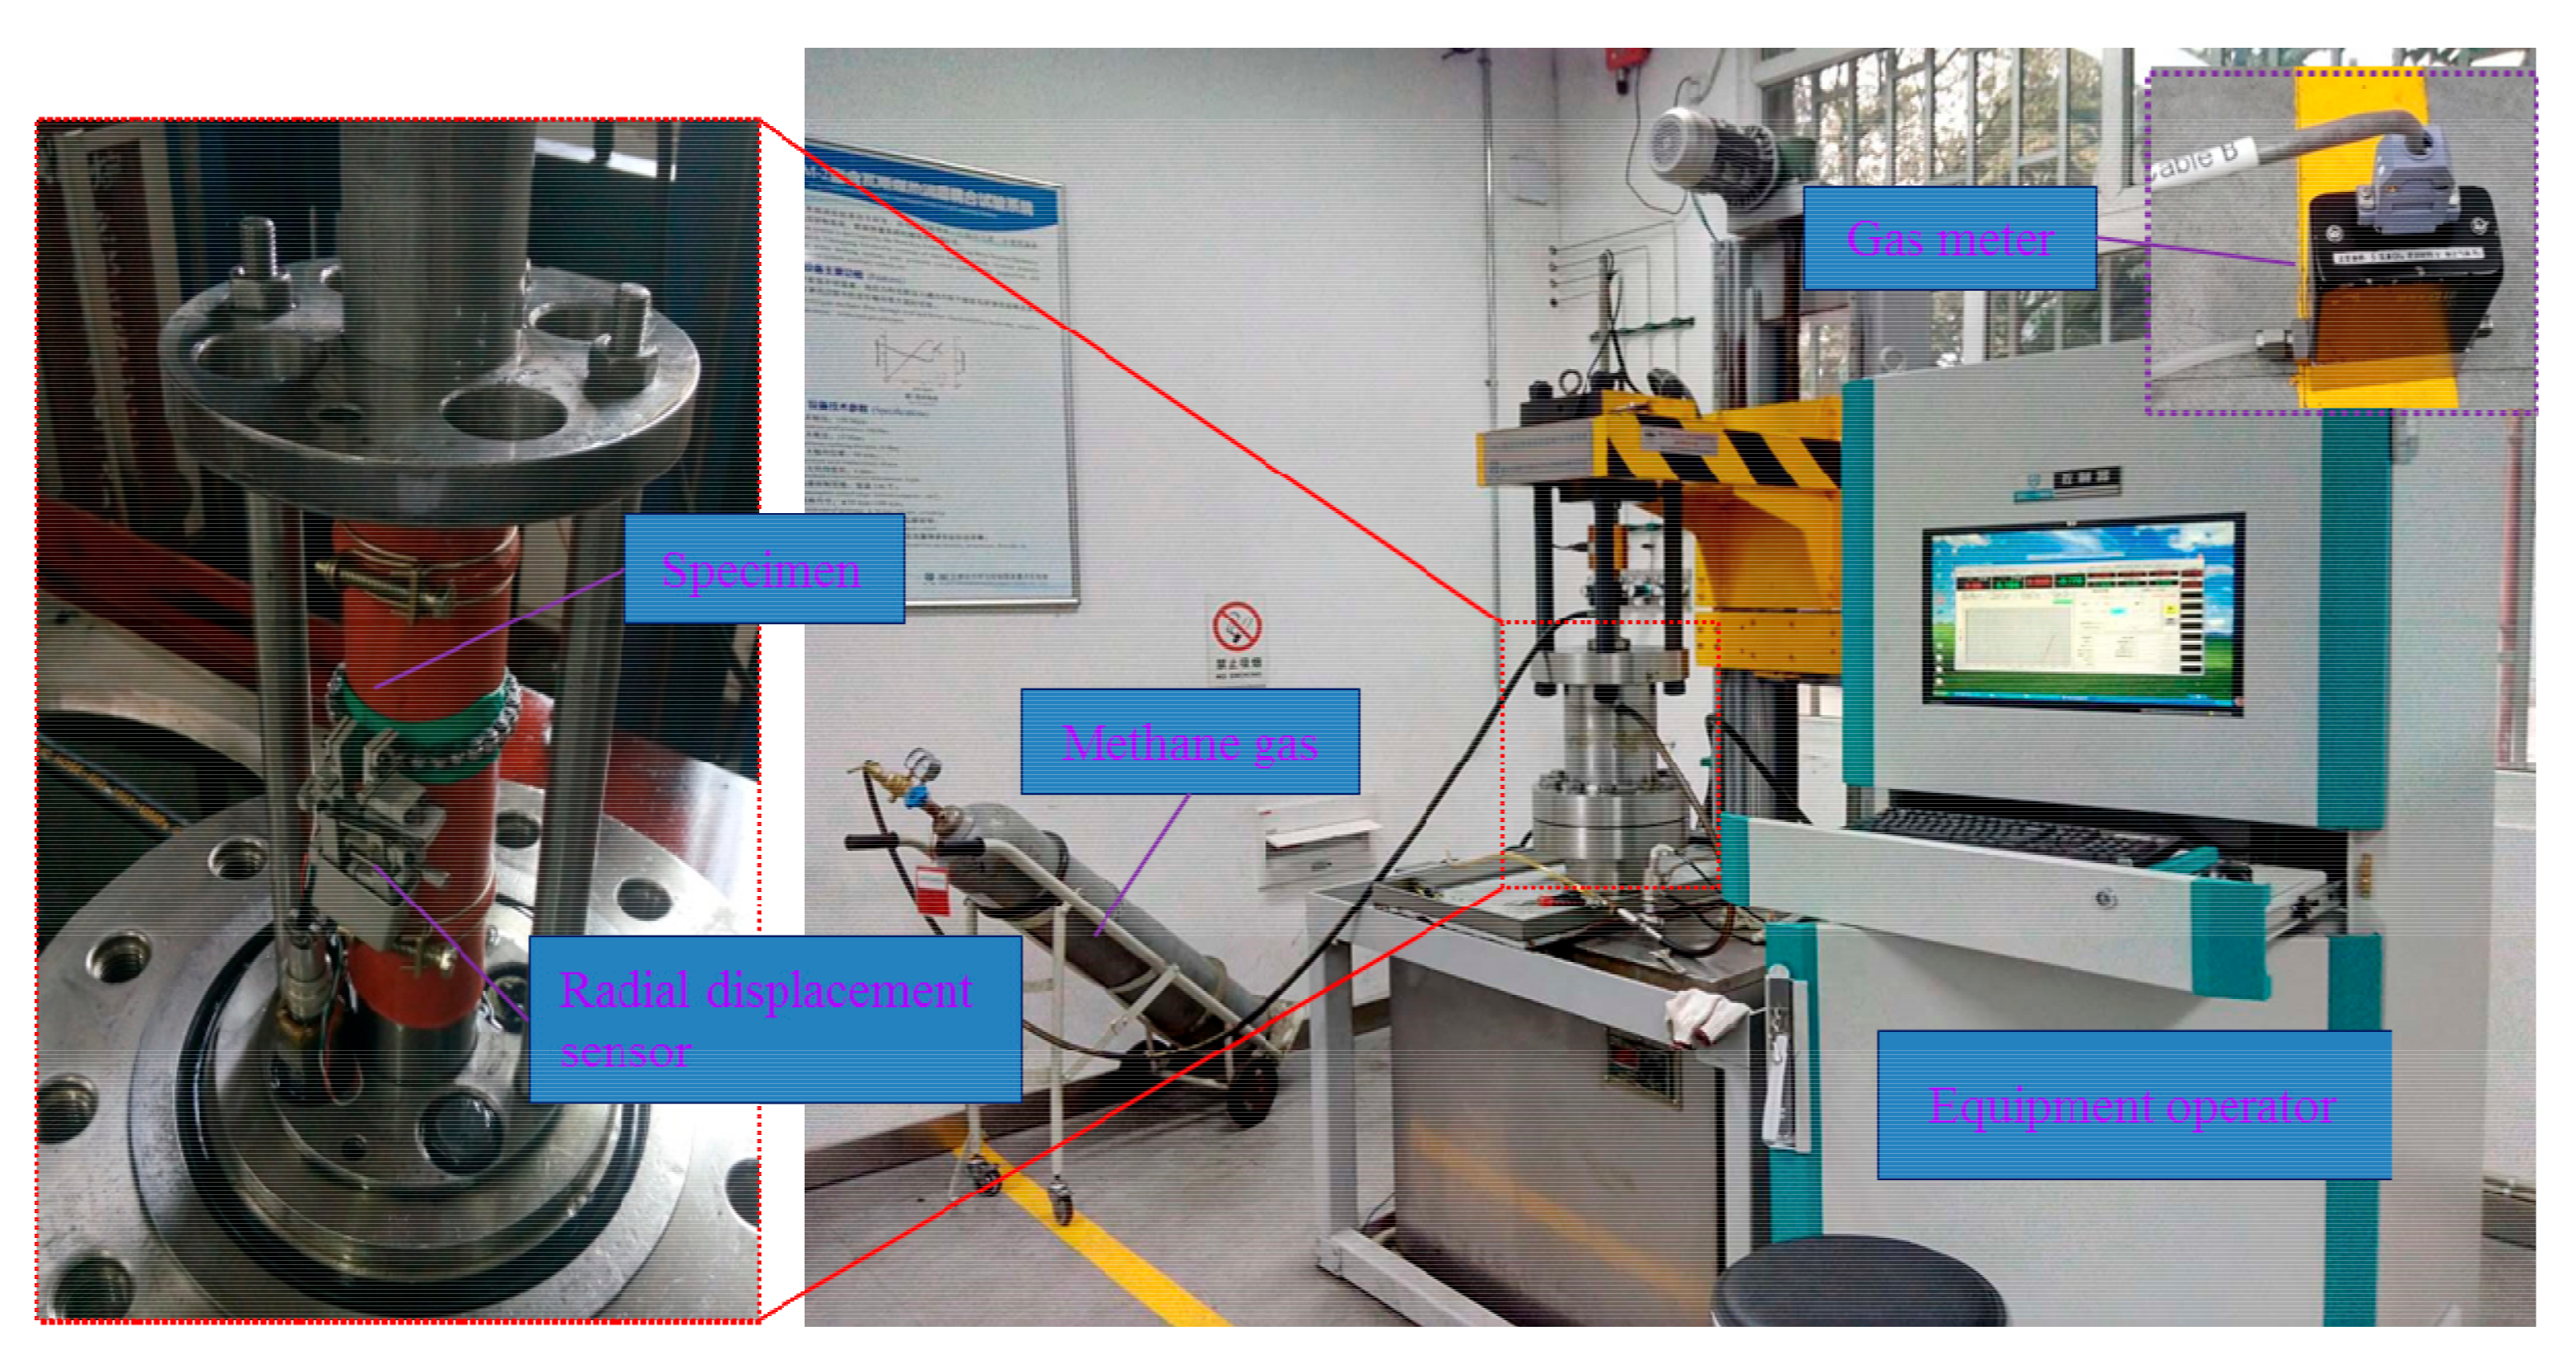
This test adopted the “thermal-fluid-solid coupling triaxial servo seepage device” independently by Chongqing University [30]. The device is mainly composed of a servo loading system, triaxial pressure chamber, water constant temperature system, pore pressure control system, data measurement system and auxiliary system. The maximum axial pressure is 200 kN, the maximum confining pressure is 10 MPa, the maximum gas pressure is 6 MPa, the maximum axial displacement is 60 mm, the maximum radial displacement is 6 mm, and the temperature control range is from room temperature to 100 °C. The stress measurement system has an accuracy of ±1%, a deformation accuracy of ±1%, and a temperature control accuracy of ±1%. The device can simulate a gas permeation test of coal samples under different in-situ stresses (axial stress and confining pressure) and pore pressures, as shown in Figure 1.
2.2. Sample Preparation
The test samples were taken from the 2461 working face of Baijiao colliery, Sichuan Coal Group, Yibin, China, and the B2 coal seam was mined with an average thickness of 2.0 m, the buried depth of the coal seam was 476.3~582.5 m, and the permeability coefficient was 2.7 × 10⁻³~3.0 × 10⁻² m2/(MPa2·d), the density was 1485.8 g/cm3, the gas pressure was 1.57~3.2 MPa, and the industrial index of coal seam was moisture 0.35%, ash 27.01%, volatile matter 9.76%, and fixed carbon 63.77%. The preparation methods of coal samples were as follows: selecting coal blocks larger than 200 mm in size from the fresh coal wall, packaging the lump coal with plastic wrap and transporting it back to the laboratory, and drilling a standard sample of 50 × 100 mm from the lump coal, polishing both ends of coal samples with a cutting machine smoothly and parallel. The two ends of the coal sample were smoothed and paralleled by a cutter, and the non-parallelism and the non-perpendicularity were less than 0.02%. The prepared raw coal samples are shown in Figure 2.
In order to prevent the evaporation of water in the coal sample, the standard samples processed before the test were packaged in plastic wrap, and each sample was treated with different water-bearing states (d1# coal sample drying treatment, d2# and d3# coal samples unsaturated treatment, d4# coal sample saturated treatment). The dry coal samples were put in a 100 °C oven for 24 h to constant weight; d2# and d3# coal sample were unsaturated coal samples, and the water content was 0.15% and 0.32% for 12 h and 24 h, respectively. The d4 # coal sample was treated with water for more than 48 h and was regarded as a saturated coal sample with a water content of 0.65%.
2.3. Scheme Design
During the coal seam mining process, the coal body in front of the working face undergoes loading and unloading processes. Therefore, based on the in-situ stress distribution laws of the 2461 working face of Baijiao colliery [31], the maximum principal stress is 25.85 MPa, the inclination angle is –6.7°, the azimuth angle is 90.1°; the intermediate principal stress is 18.6 MPa, the inclination angle is –16.8°, and the azimuth angle is 358.1°; the minimum principal stress is 8.6 MPa, the inclination angle is –1.8°, and the azimuth angle is 201.1°. The three-way loading and unloading stress path was designed as follows:
(1) Applying axial stress and confining pressure to hydrostatic pressure 8.6 MPa; (2) adjusting gas pressure 2.0 MPa, fully adsorbing sample for 2 h, opening gas outlet valve; (3) loading the axial stress to 18.6 and 25.85 MPa in stages at a rate of 0.05 kN/s, stabilizing each stage for 5 min; (4) loading axial stress at a rate of 0.05 kN/s and unloading confining pressure at a rate of 0.02 MPa/s at the same time, when the confining pressure is unloaded to 3.0 MPa, the axial direction was changed from the force control to the displacement control (0.1 mm/min) to load the axial stress until the specimen was destroyed; (5) after the specimen was destroyed, post-peak cyclic loading and unloading confining pressure (3.0 MPa→9.0 MPa→3.0 MPa) tests were conducted four times, and the loading and unloading confining pressure was at a rate of 0.05 MPa/s. The displacement control was adopted in the axial stress.
3. Test Results and Theoretical Analysis
Assuming that the gas flow in the coal seam during the test conforms to Darcy’s law, the formula for calculating gas permeability of water-bearing raw coal is [18,25].
In the formula, k is permeability (mD), v is gas seepage velocity (cm3/s), μ is gas kinematic viscosity (Pa·s), L is the length of fractured rock (mm), A is cross-section area of sample (mm2), p1 is gas inlet pressure (MPa), p2 is gas outlet pressure (MPa).
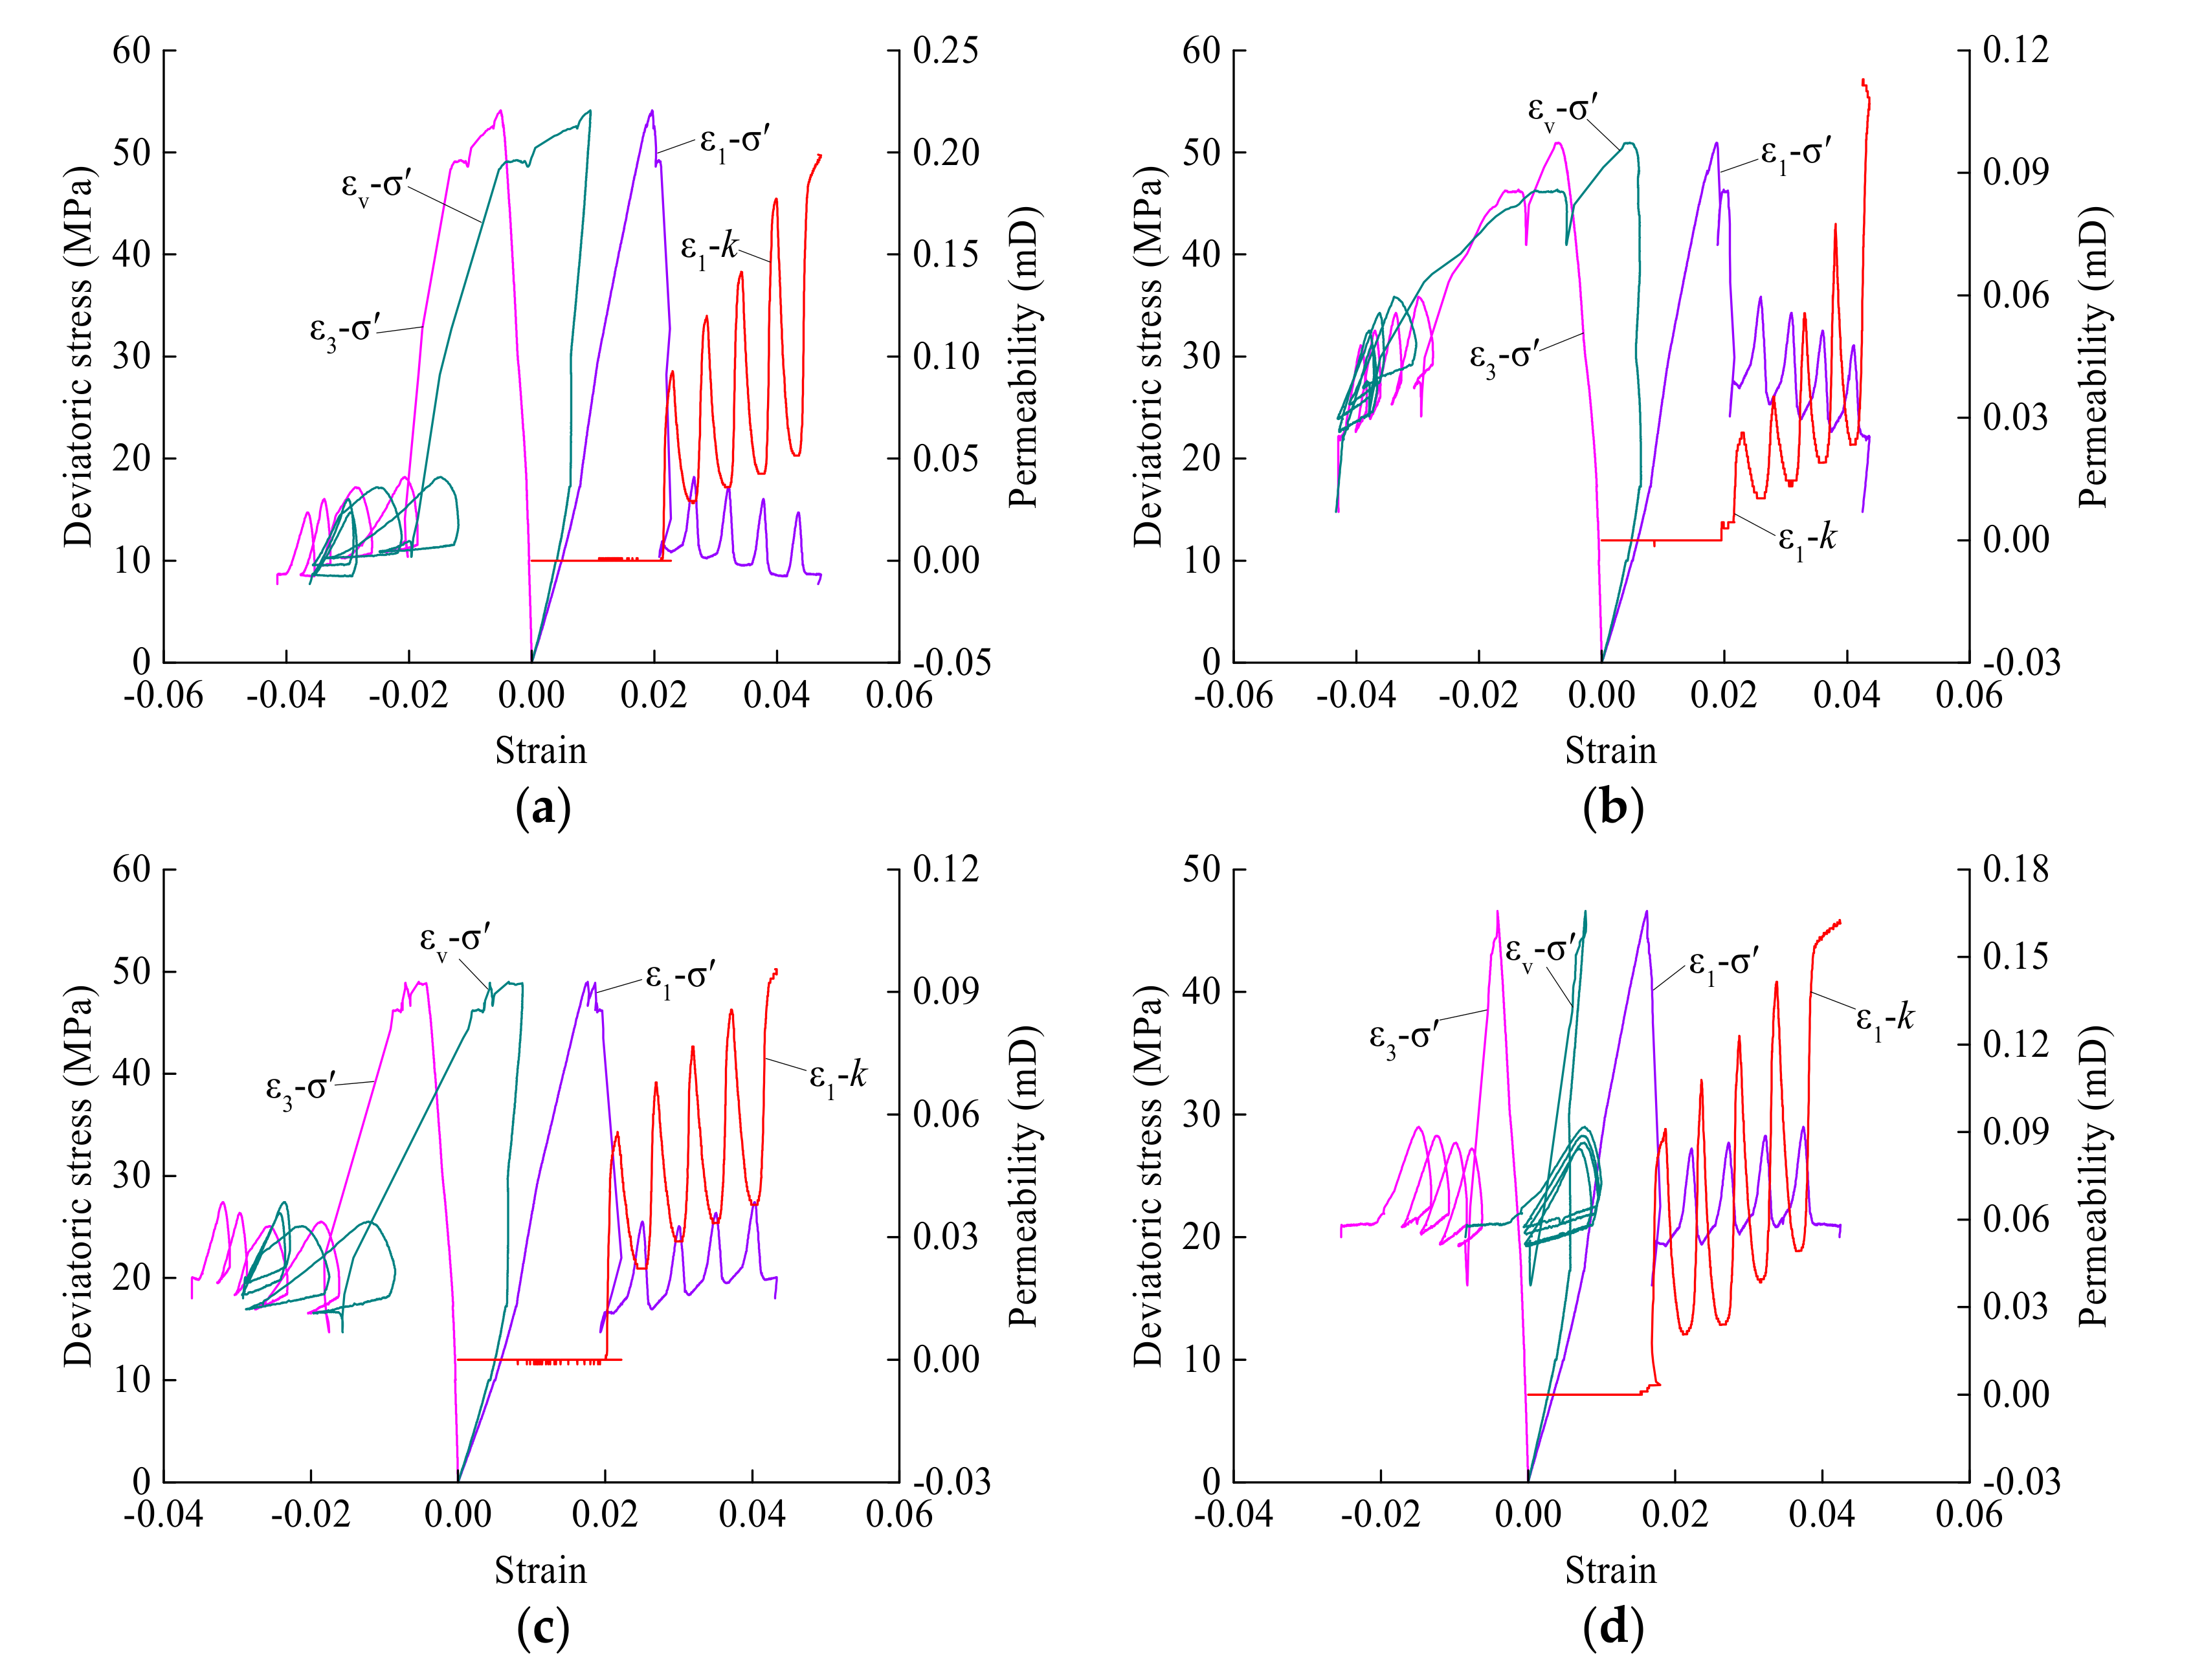
According to the Equation (1), the seepage test results of each coal sample were calculated under loading and unloading conditions, and the deviation stress–strain-permeability relationship curves were drawn, as shown in Figure 3.
3.1. Analysis of Pre-Peak Loading and Unloading Results
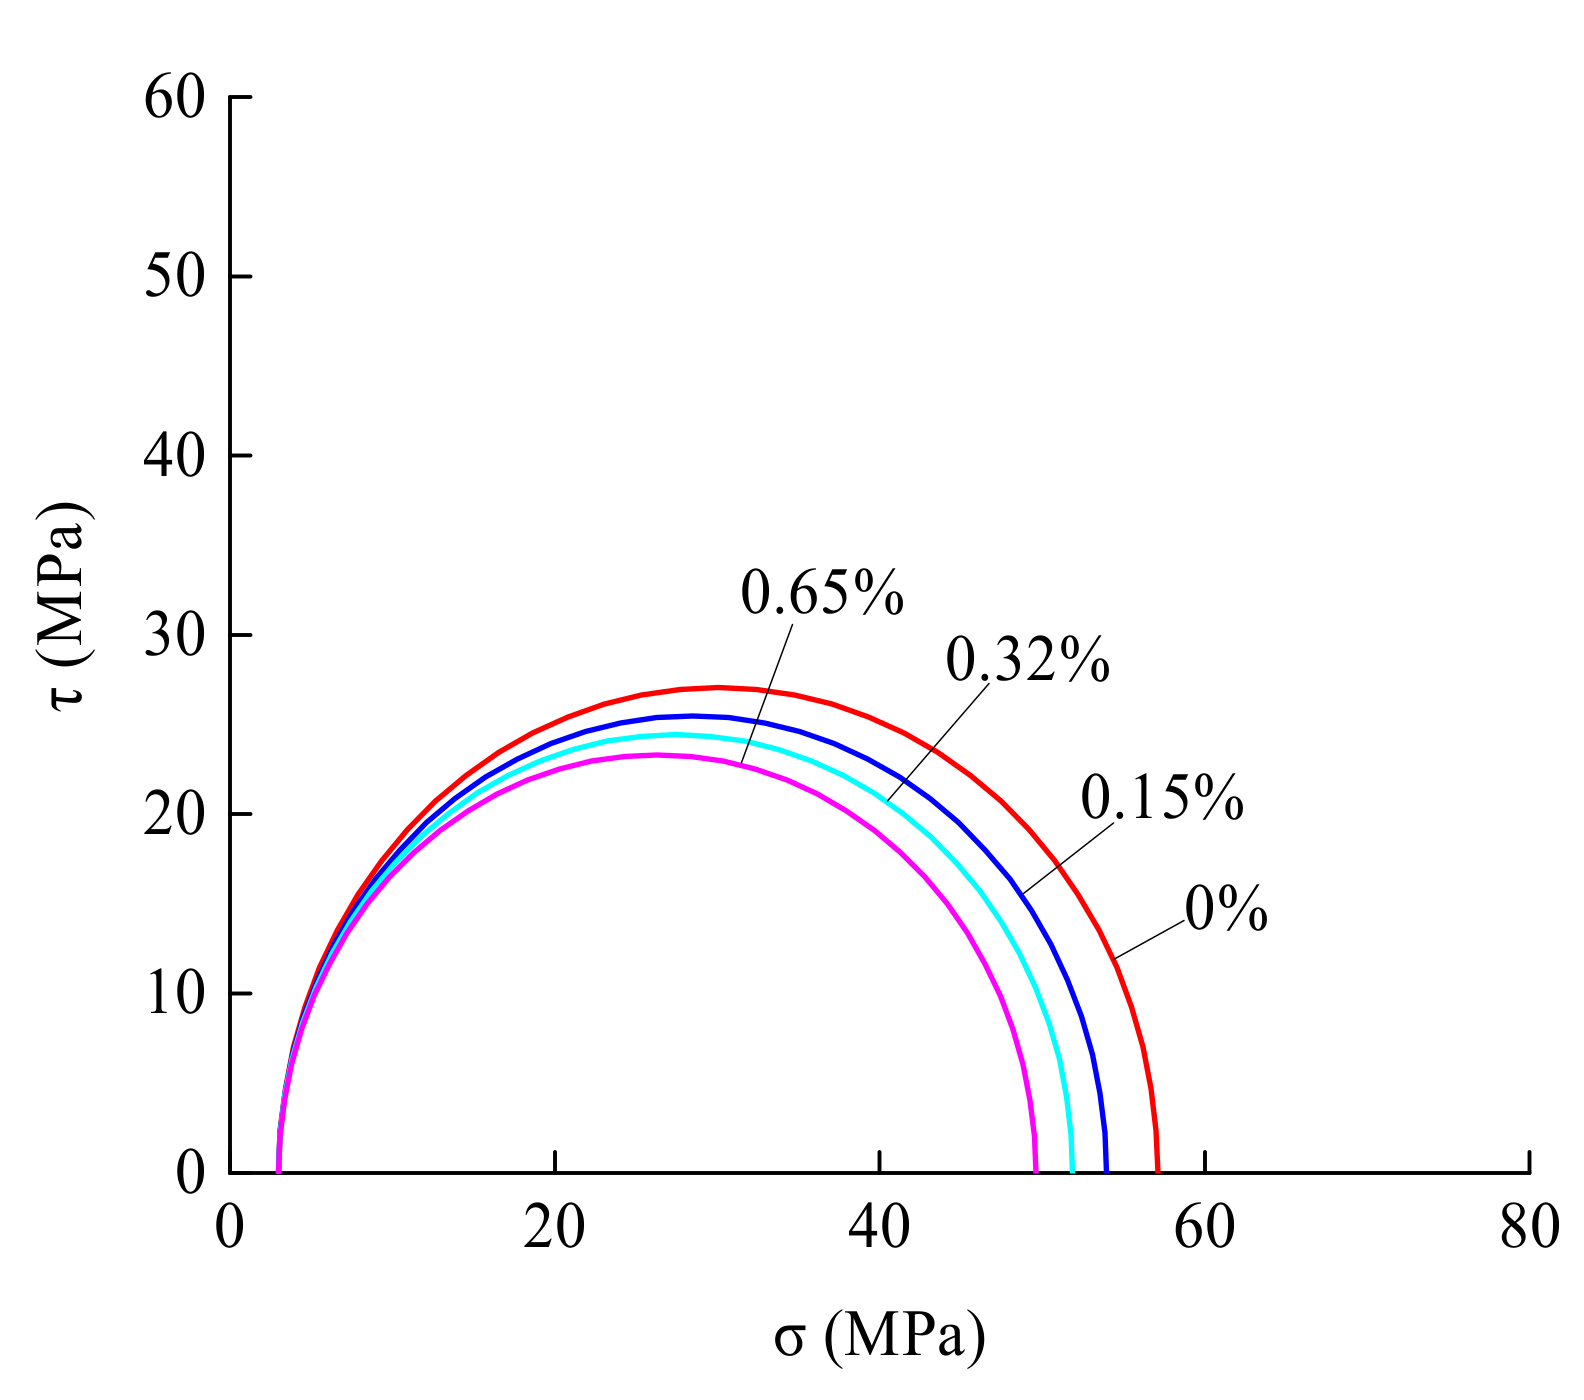
The damage and softening degree of water on coal samples mainly depends on the mineral composition, particle composition, initial water content, stress state and other factors of coal samples [32]. It can be seen from Figure 3 that the difference of the initial water content makes the coal samples show different deformation properties during the whole deformation and failure process. The strength of the coal sample is larger in dry state, the deformation is larger in the whole failure process, the pre-peak deformation value is almost linear elastic, and the duration is longer. The water affects the self-properties of the coal sample, moisture enters into the pore and crack, wets the particles on the free surface, weakens the relationship between the particles, weakens the cohesion and internal friction coefficient of the coal sample, and causes the strength of the coal sample to decrease obviously. With the increase of water content, the deviatoric stress gradually decreases, from 0% to 0.15% of water content, the ultimate strength from 57.12 to 53.96 MPa, which decreases by 5.84%. Compared with the strength of the dry coal sample, when the water content of coal sample is 0.32%, the ultimate strength is 51.88 MPa, which decreases by 9.68%. When the moisture content of coal sample is 0.65%, the ultimate strength is 49.62 MPa, which decreases by 13.86%. It can be seen that the initial moisture content has a significant impact on the mechanical damage of the coal sample until the final fracture failure. Combined with the test results, the Mohr stress circle of each coal sample under different water content conditions is shown in Figure 4. It can be seen that with the increase of water content, the center of the Mohr stress circle moves to the left, and the ultimate strength and peak strain decrease gradually.
In the pre-peak loading process, the specimen exhibits compression deformation in the axial direction and expansion deformation in the radial direction. According to the test results in Figure 4, the deformation parameters under different stress states are listed in Table 1. When the axial stress is loaded to 18.6 MPa, the axial, radial and volumetric strain of the specimens are different under different water content conditions. When the axial stress continues to be loaded to 25.85 MPa, the absolute values of the axial, radial and volumetric strain of the samples increase gradually under different water content conditions, but due to the anisotropy of the raw coal sample, the deformation difference is large. When the sample reaches its ultimate strength, the axial, radial and volumetric strain of coal samples decrease obviously with the increase of water content. Compared with the dry coal sample, the axial strain of the coal samples with water contents of 0.15%, 0.32% and 0.65% decreased by 4.98%, 11.59% and 17.99% respectively, the radial strain decreased by 40.4%, 14.46% and 17.43% respectively, and the volumetric strain decreased by 52.54%, 8.66% and 18.65%, respectively. It can be seen that with the increase of water content, the deformation amount of coal samples in all directions tends to decrease under the same stress.
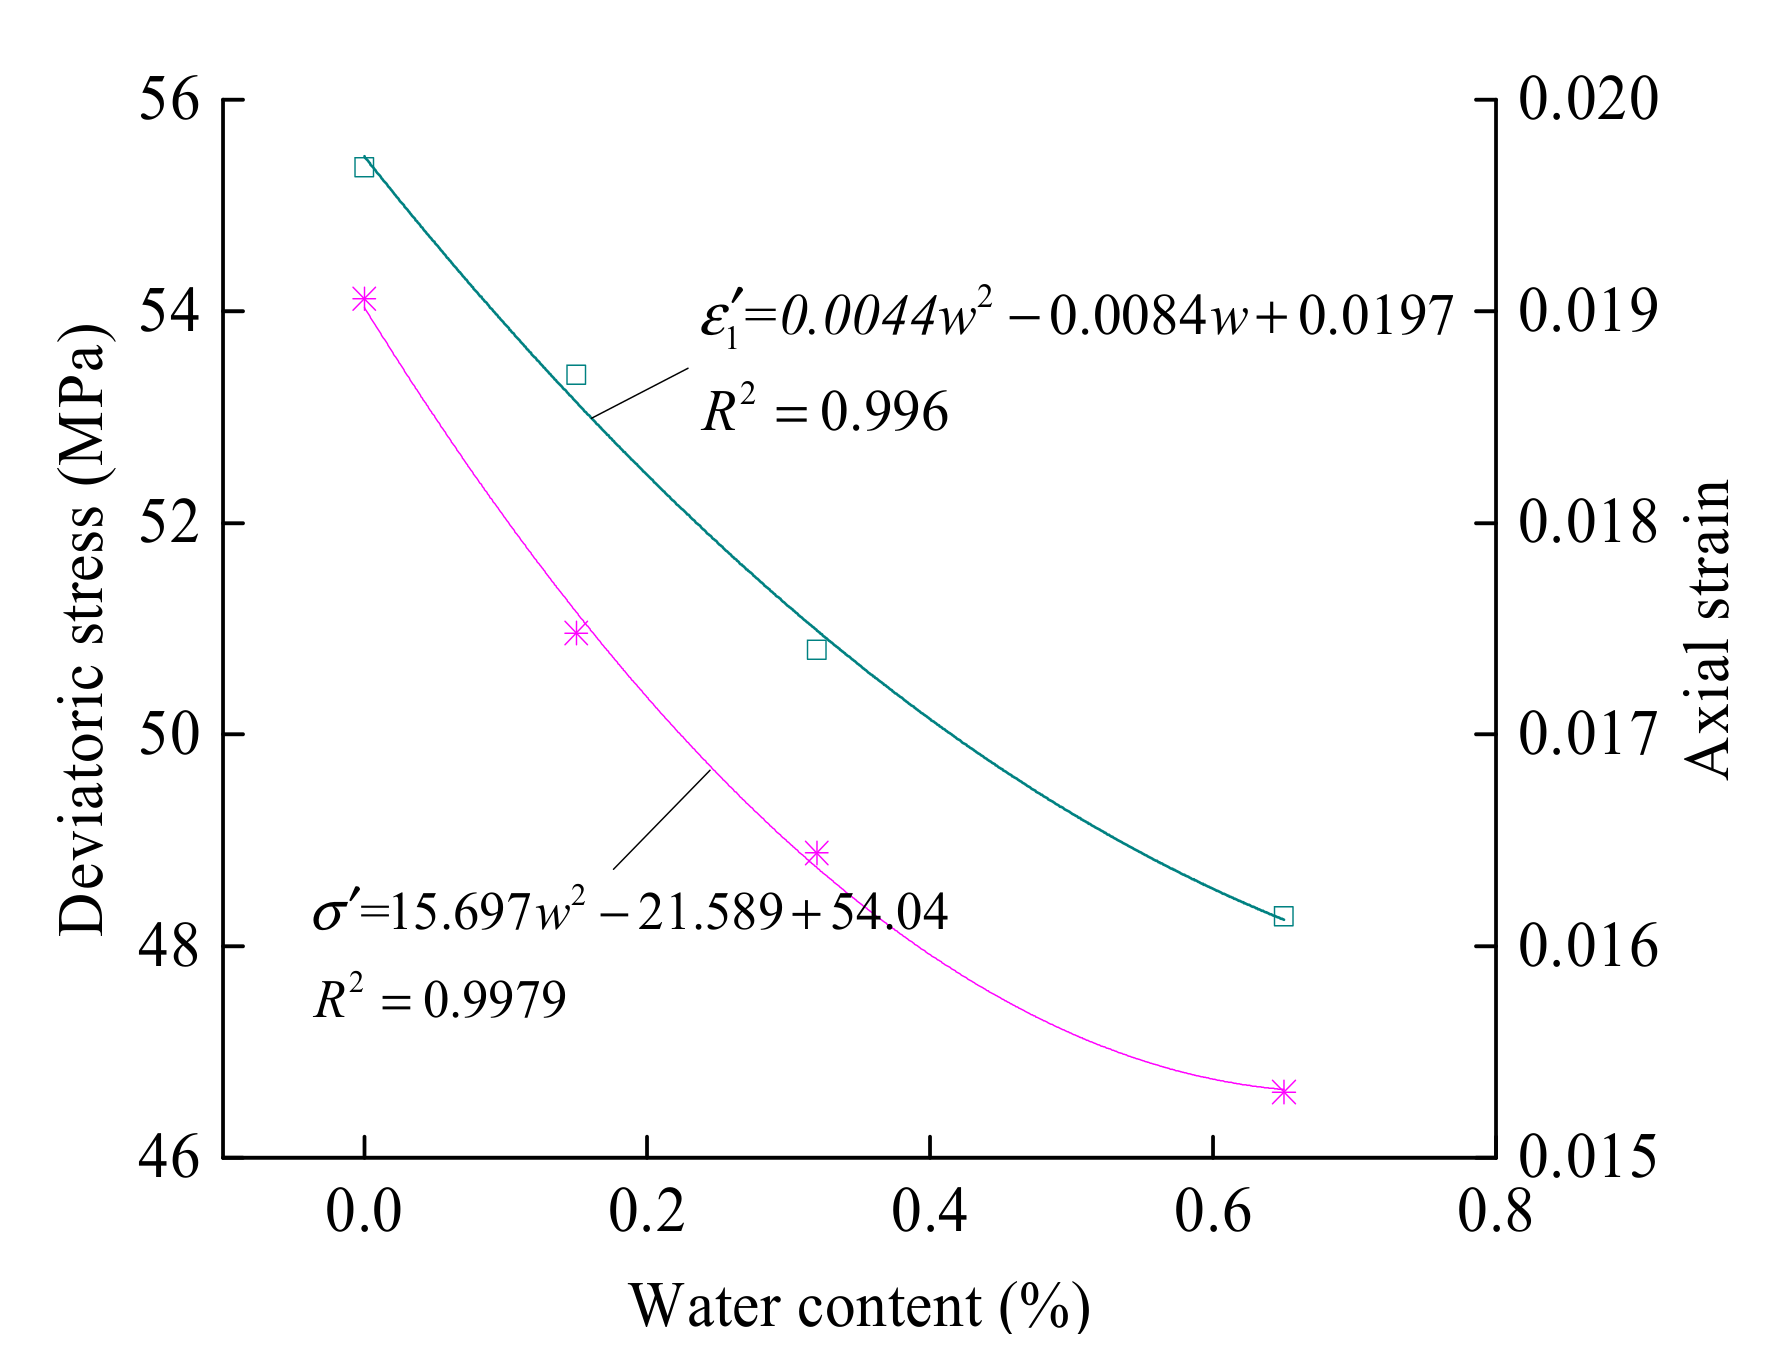
According to the test results in Table 1, the curves of peak intensity and peak axial strain of coal samples with water content under different water content conditions were drawn, and the relationships between peak strength, peak axial strain and water content were established. It can be seen that the relationship between peak intensity, peak axial strain and water content of coal samples obey quadratic polynomial, as shown in Equation (2), and the fitting curve is shown in Figure 5.
where, a1, a2, a3 are the fitted constants; w is the water content; is the peak axial strain at failure; and σ′ is the deviatoric stress at failure (MPa).
3.2. Analysis of the Deformation Properties during Post-Peak Loading and Unloading
As there are fewer cracks in the sample, the permeability of the sample is 0 during the pre-peak loading and unloading process, and the permeability of the sample increases rapidly after the sample is destroyed. The permeability formula reflects the relationship between gas permeability and gas pressure, gas flow rate, sample length and cross-sectional area of the sample. It does not directly reflect the relationship between stress and permeability, but simply studies the relationship between axial stress, confining pressure or pore pressure (provided by gas pressure) and permeability can only explain the one-way action relationship. The permeability is the result of joint action of axial stress, confining pressure and gas pressure, which needs comprehensive consideration. Therefore, the study of the relationship between effective stress and permeability has more practical significance than the study of the relationship between a certain force and permeability alone, and it has a certain positive significance for studying coal and gas outburst.
According to the theory of geotechnical mechanics, the effective stress is the difference between the total stress acting on the coal seam and the fluid pressure existing in the pore or fissure, that is to say:
In the formula, σe is the average effective stress of coal sample, MPa; σ1 and σ3 are the axial stress and confining pressure of coal samples, respectively, MPa; p1 and p2 are the gas pressure at the inlet and outlet of raw coal samples, respectively, MPa.
The deformation parameters of each specimen under different stress states during the post-peak loading and unloading confining pressure are shown in Table 2.
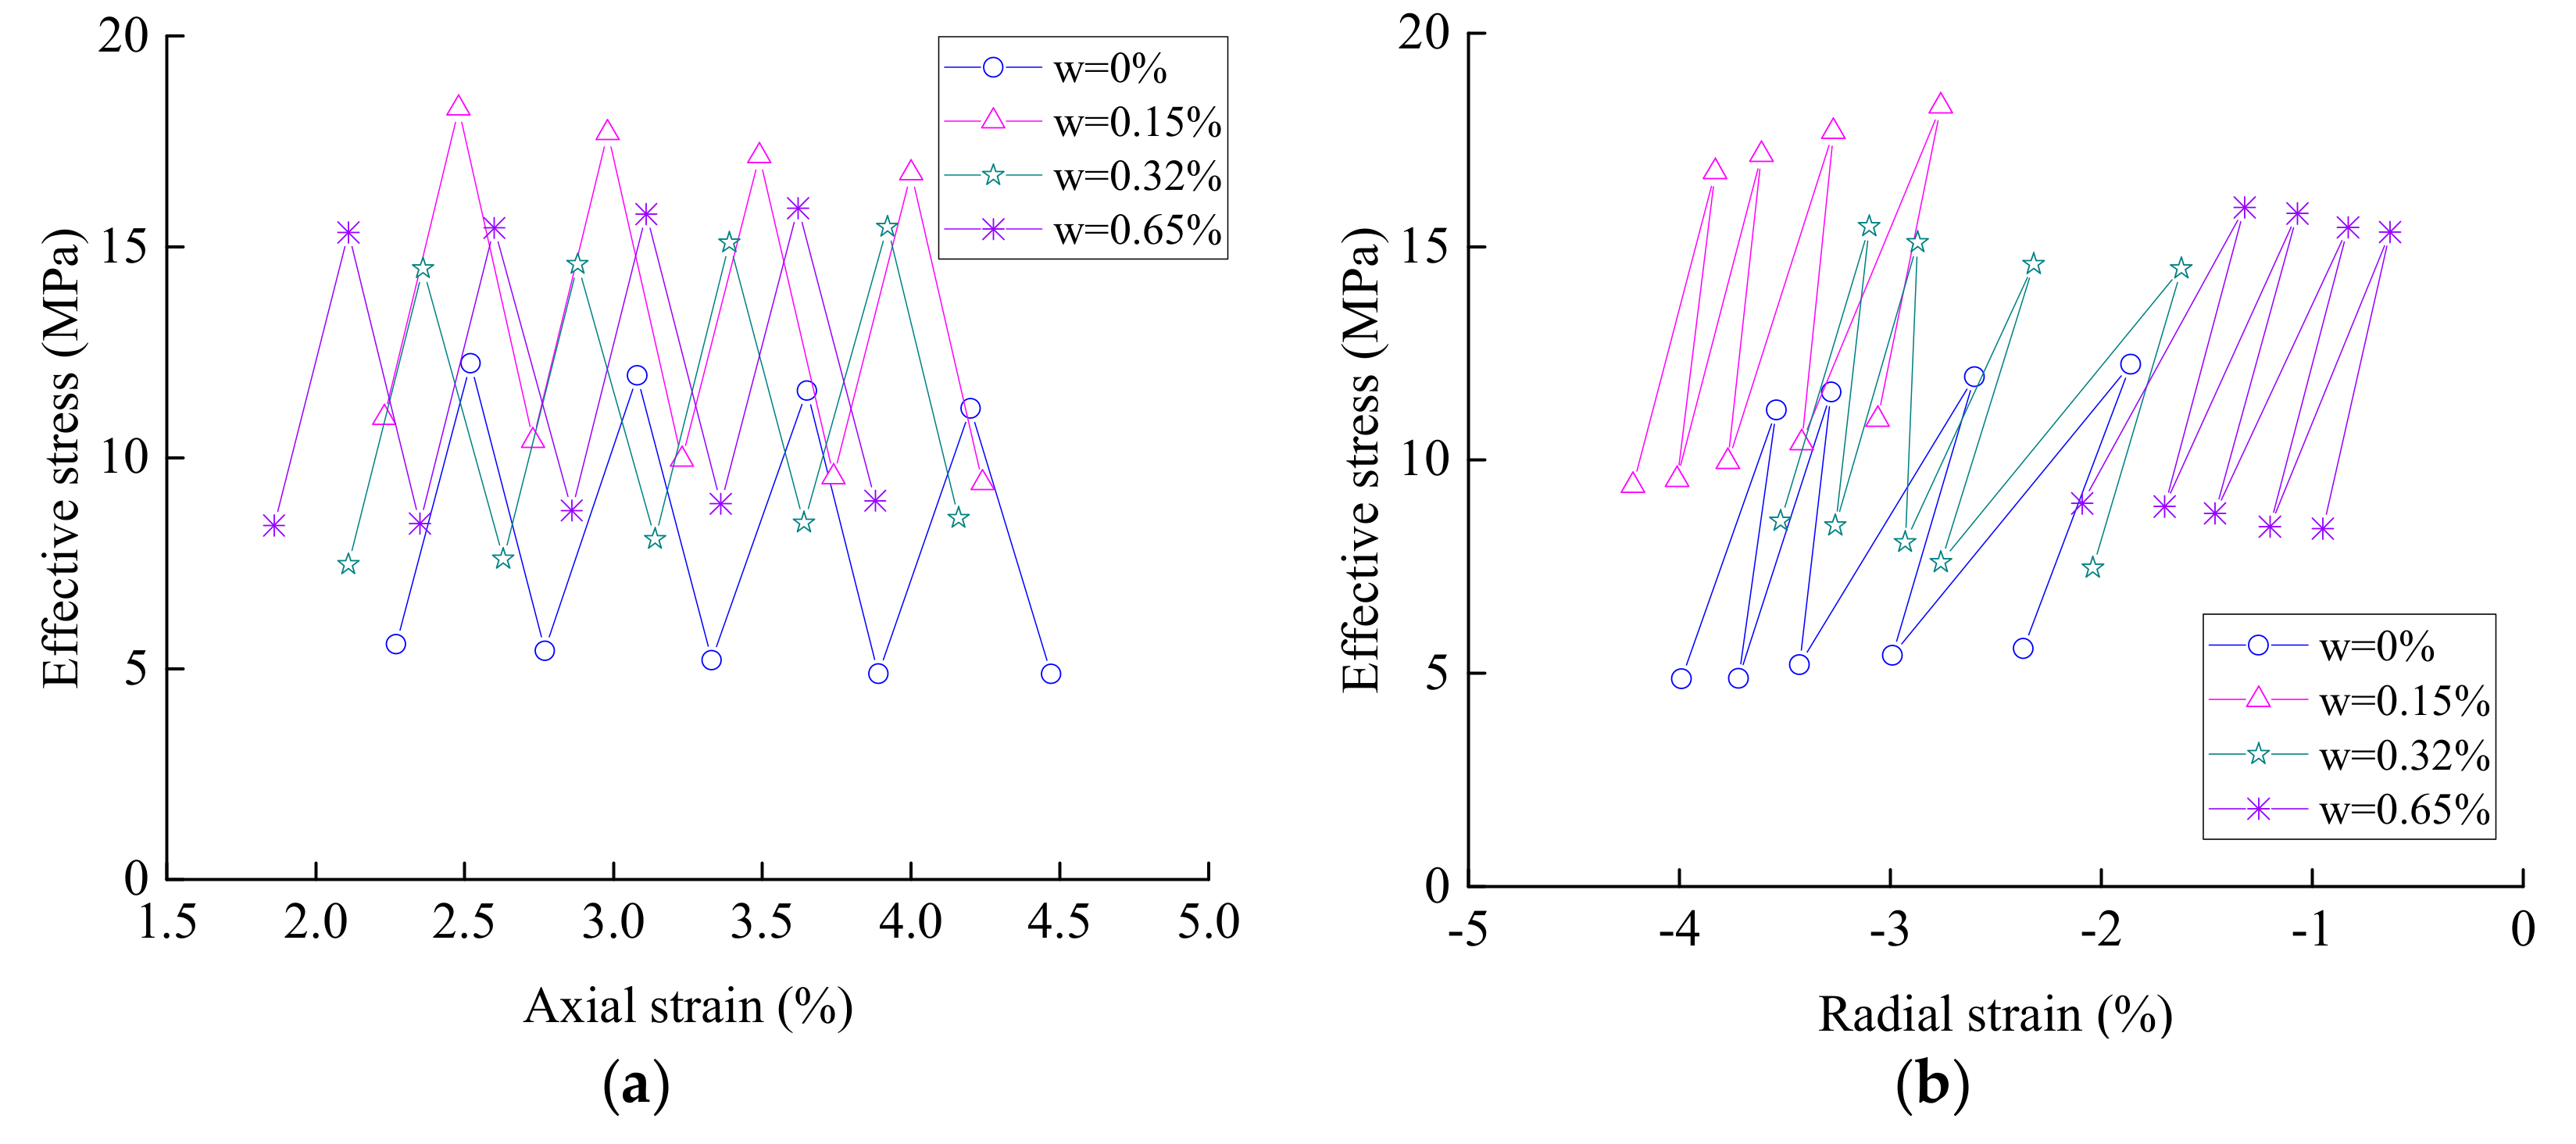
Table 2 shows that in the process of loading and unloading confining pressure post-peak, the axial direction of the sample is applied by the displacement control, which causes the axial strain to increase linearly during the process of loading and unloading confining pressure, that is, the axial direction of the sample is compressed deformation. During the process of loading and unloading confining pressure, the radial deformation of specimens is shrinkage with confining pressure loading, and expansion with confining pressure unloading. According to the test results in Table 2, the relationship curves of axial strain-effective stress and radial strain-effective stress under different stress states were plotted as shown in Figure 6.
As can be seen from Figure 6, for the dry coal sample, the radial strain of the sample decreases from 2.37 × 10⁻² to 1.86 × 10⁻² after the first loading confining pressure, which decreases by 21.54%. After the first unloading confining pressure, the radial strain increases to 2.99 × 10⁻², which increases by 25.89%; the radial strain of the sample decreases to 2.60 × 10⁻² after the second loading confining pressure, which decreases by 12.83%. After the second unloading confining pressure, the radial strain increases to 3.43 × 10⁻², which increases by 15%; the radial strain of the sample decreases to 3.28 × 10⁻² after the third loading confining pressure, which decreases by 4.45%. After the third unloading confining pressure, the radial strain increases to 3.72 × 10⁻², which increases by 8.3%; the radial strain of the sample decreases to 3.54 × 10⁻² after the fourth loading confining pressure, which decreases by 4.48%. After the fourth unloading confining pressure, the radial strain increases to 3.99 × 10⁻², which increases by 7.29%.
For the coal sample with a water content of 0.15%, the radial strain of the sample decreases from 3.06 × 10⁻² to 2.76 × 10⁻² after the first loading confining pressure, which decreases by 10.03%. After the first unloading confining pressure, the radial strain increases to 3.42 × 10⁻², which increases by 11.72%; the radial strain of the sample decreases to 3.27 × 10⁻² after the second loading confining pressure, which decreases by 4.44%. After the second unloading confining pressure, the radial strain increases to 3.77 × 10⁻², which increases by 10.06%; the radial strain of the sample decreases to 3.61 × 10⁻² after the third loading confining pressure, which decreases by 4.2%. After the third unloading confining pressure, the radial strain increases to 4.01 × 10⁻², which increases by 6.53%; the radial strain of the sample decreases to 3.83 × 10⁻² after the fourth loading confining pressure, which decreases by 4.46%. After the fourth unloading confining pressure, the radial strain increases to 4.22 × 10⁻², which increases by 5.21%.
For the coal sample with a water content of 0.32%, the radial strain of the sample decreases from 2.01 × 10⁻² to 1.62 × 10⁻² after the first loading confining pressure, which decreases by 20.67%. After the first unloading confining pressure, the radial strain increases to 2.76 × 10⁻², which increases by 35.25%; the radial strain of the sample decreases to 2.32 × 10⁻² after the second loading confining pressure, which decreases by 15.53%. After the second unloading confining pressure, the radial strain increases to 2.93 × 10⁻², which increases by 6.5%. The radial strain of the sample decreases to 2.87 × 10⁻² after the third loading confining pressure, which decreases by 2.18%. After the third unloading confining pressure, the radial strain increases to 3.26 × 10⁻², which increases by 11.04%; the radial strain of the sample decreases to 3.26 × 10⁻² after the fourth loading confining pressure, which decreases by 4.82%. After the fourth unloading confining pressure, the radial strain increases to 3.52 × 10⁻², which increases by 8.01%.
For the coal sample with a water content of 0.65%, the radial strain of the sample decreases from 0.95 × 10⁻² to 0.63 × 10⁻² after the first loading confining pressure, which decreases by 33.93%. After the first unloading confining pressure, the radial strain increases to 1.20 × 10⁻², which increases by 26.43%; the radial strain of the sample decreases to 0.83 × 10⁻² after the second loading confining pressure, which decreases by 30.35%. After the second unloading confining pressure, the radial strain increases to 1.46 × 10⁻², which increases by 21.74%. The radial strain of the sample decreases to 1.07 × 10⁻² after the third loading confining pressure, which decreases by 26.24%. After the third unloading confining pressure, the radial strain increases to 1.70 × 10⁻², which increases by 17.03%; The radial strain of the sample decreases to 1.32 × 10⁻² after the fourth loading confining pressure, which decreases by 22.65%. After the fourth unloading confining pressure, the radial strain increases to 2.09 × 10⁻², which increases by 22.83%.
In summary, with the increase cyclic loading and unloading confining pressure times, the radial strain decrement and increment of raw coal sample after loading and unloading confining pressure gradually decrease.
3.3. Analysis of the Permeability Properties during Post-Peak Loading and Unloading
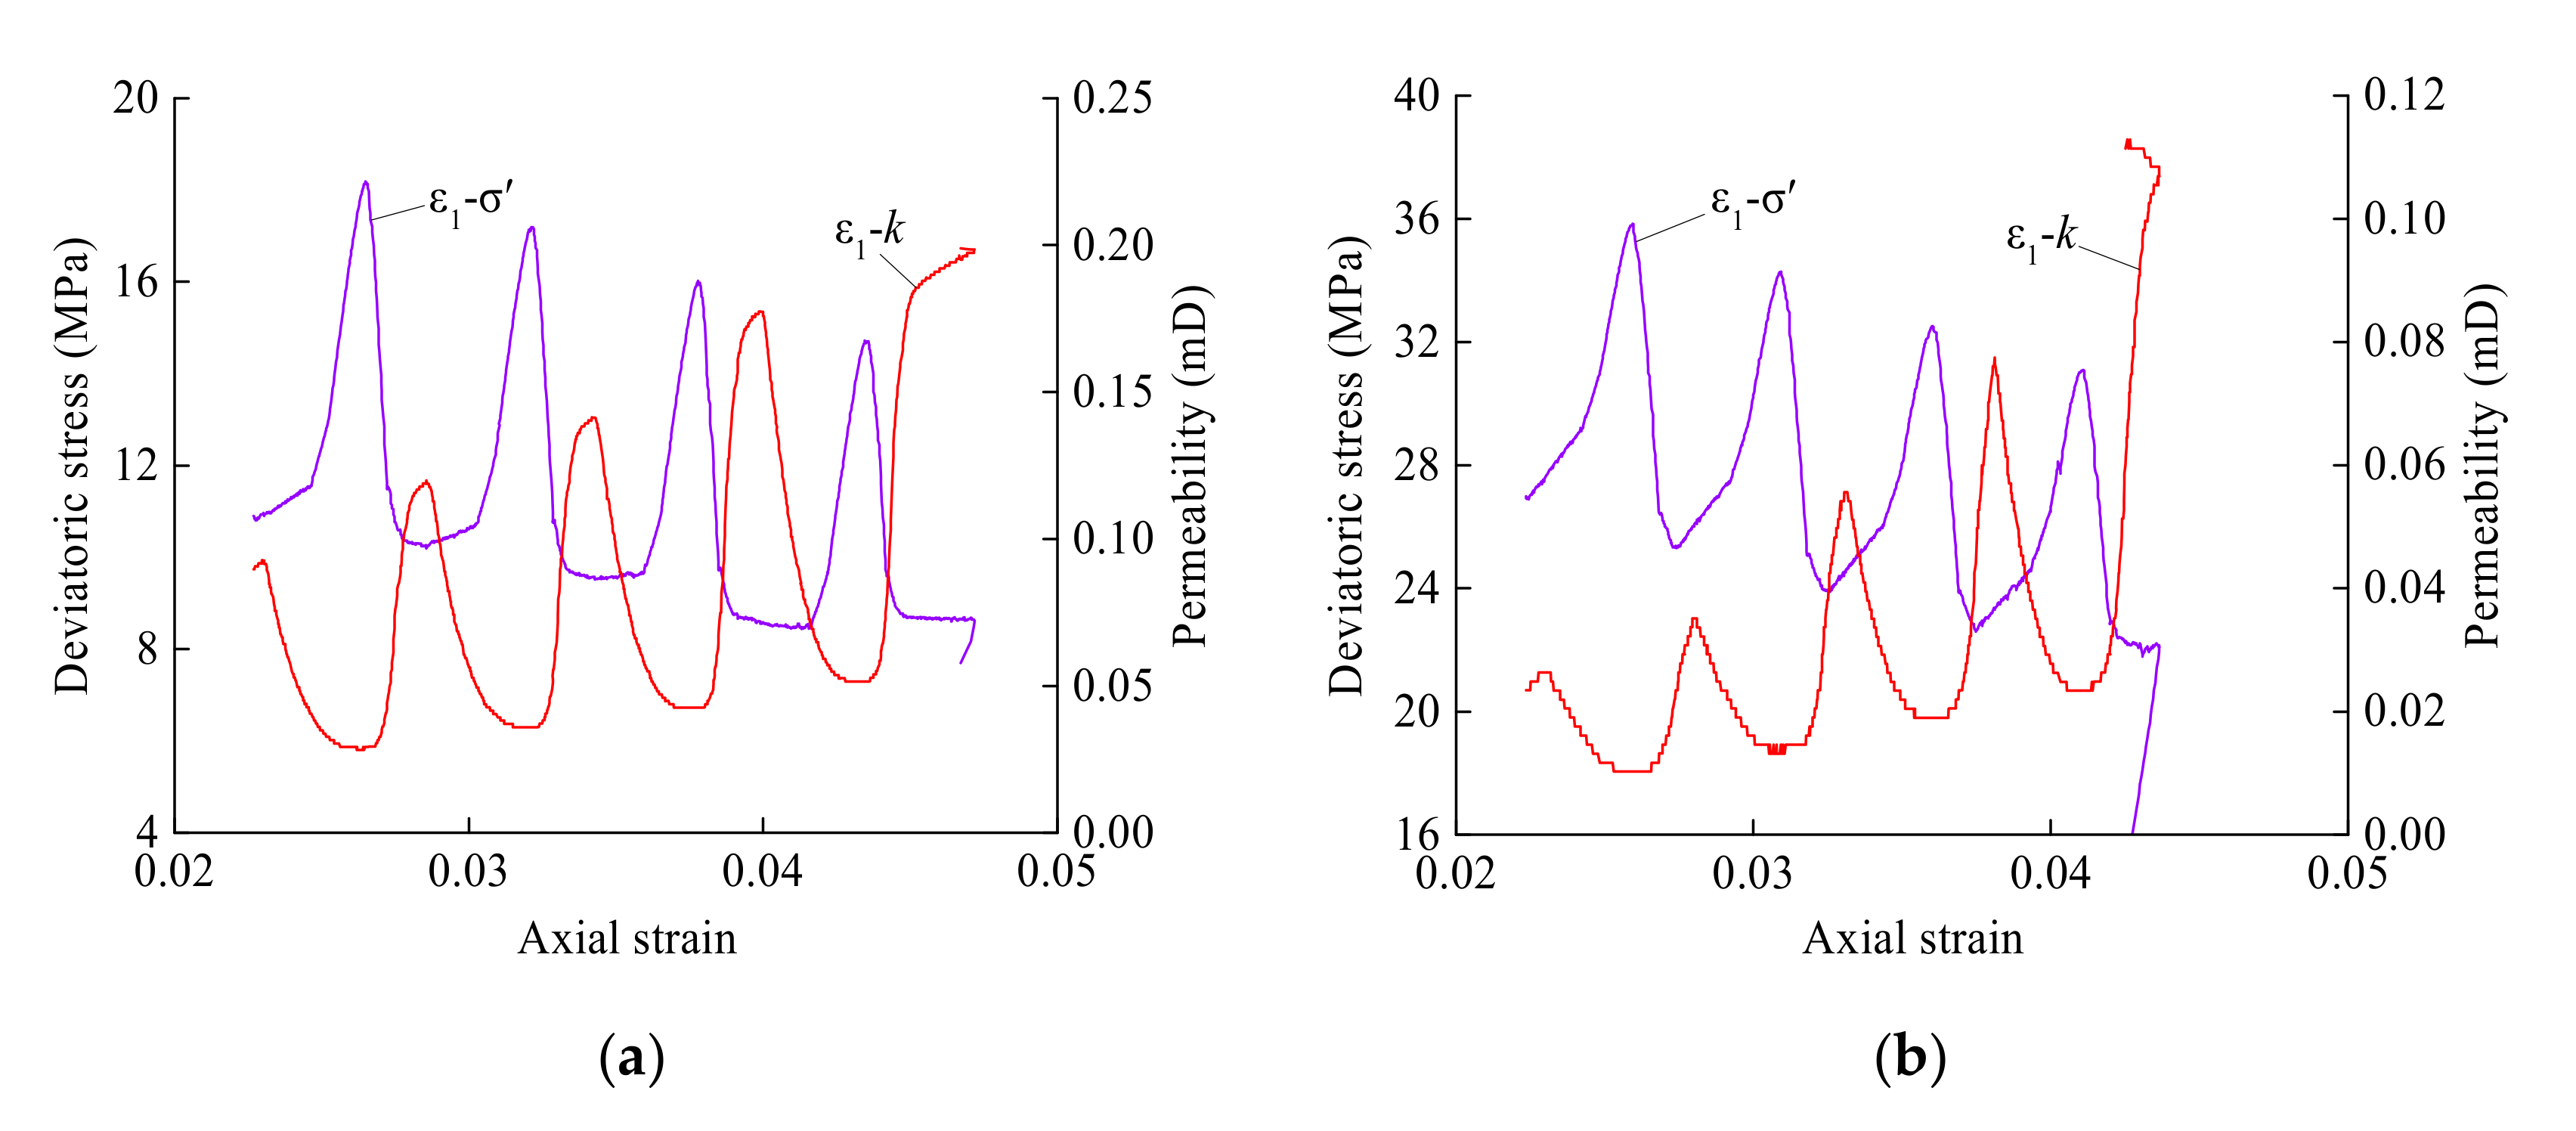
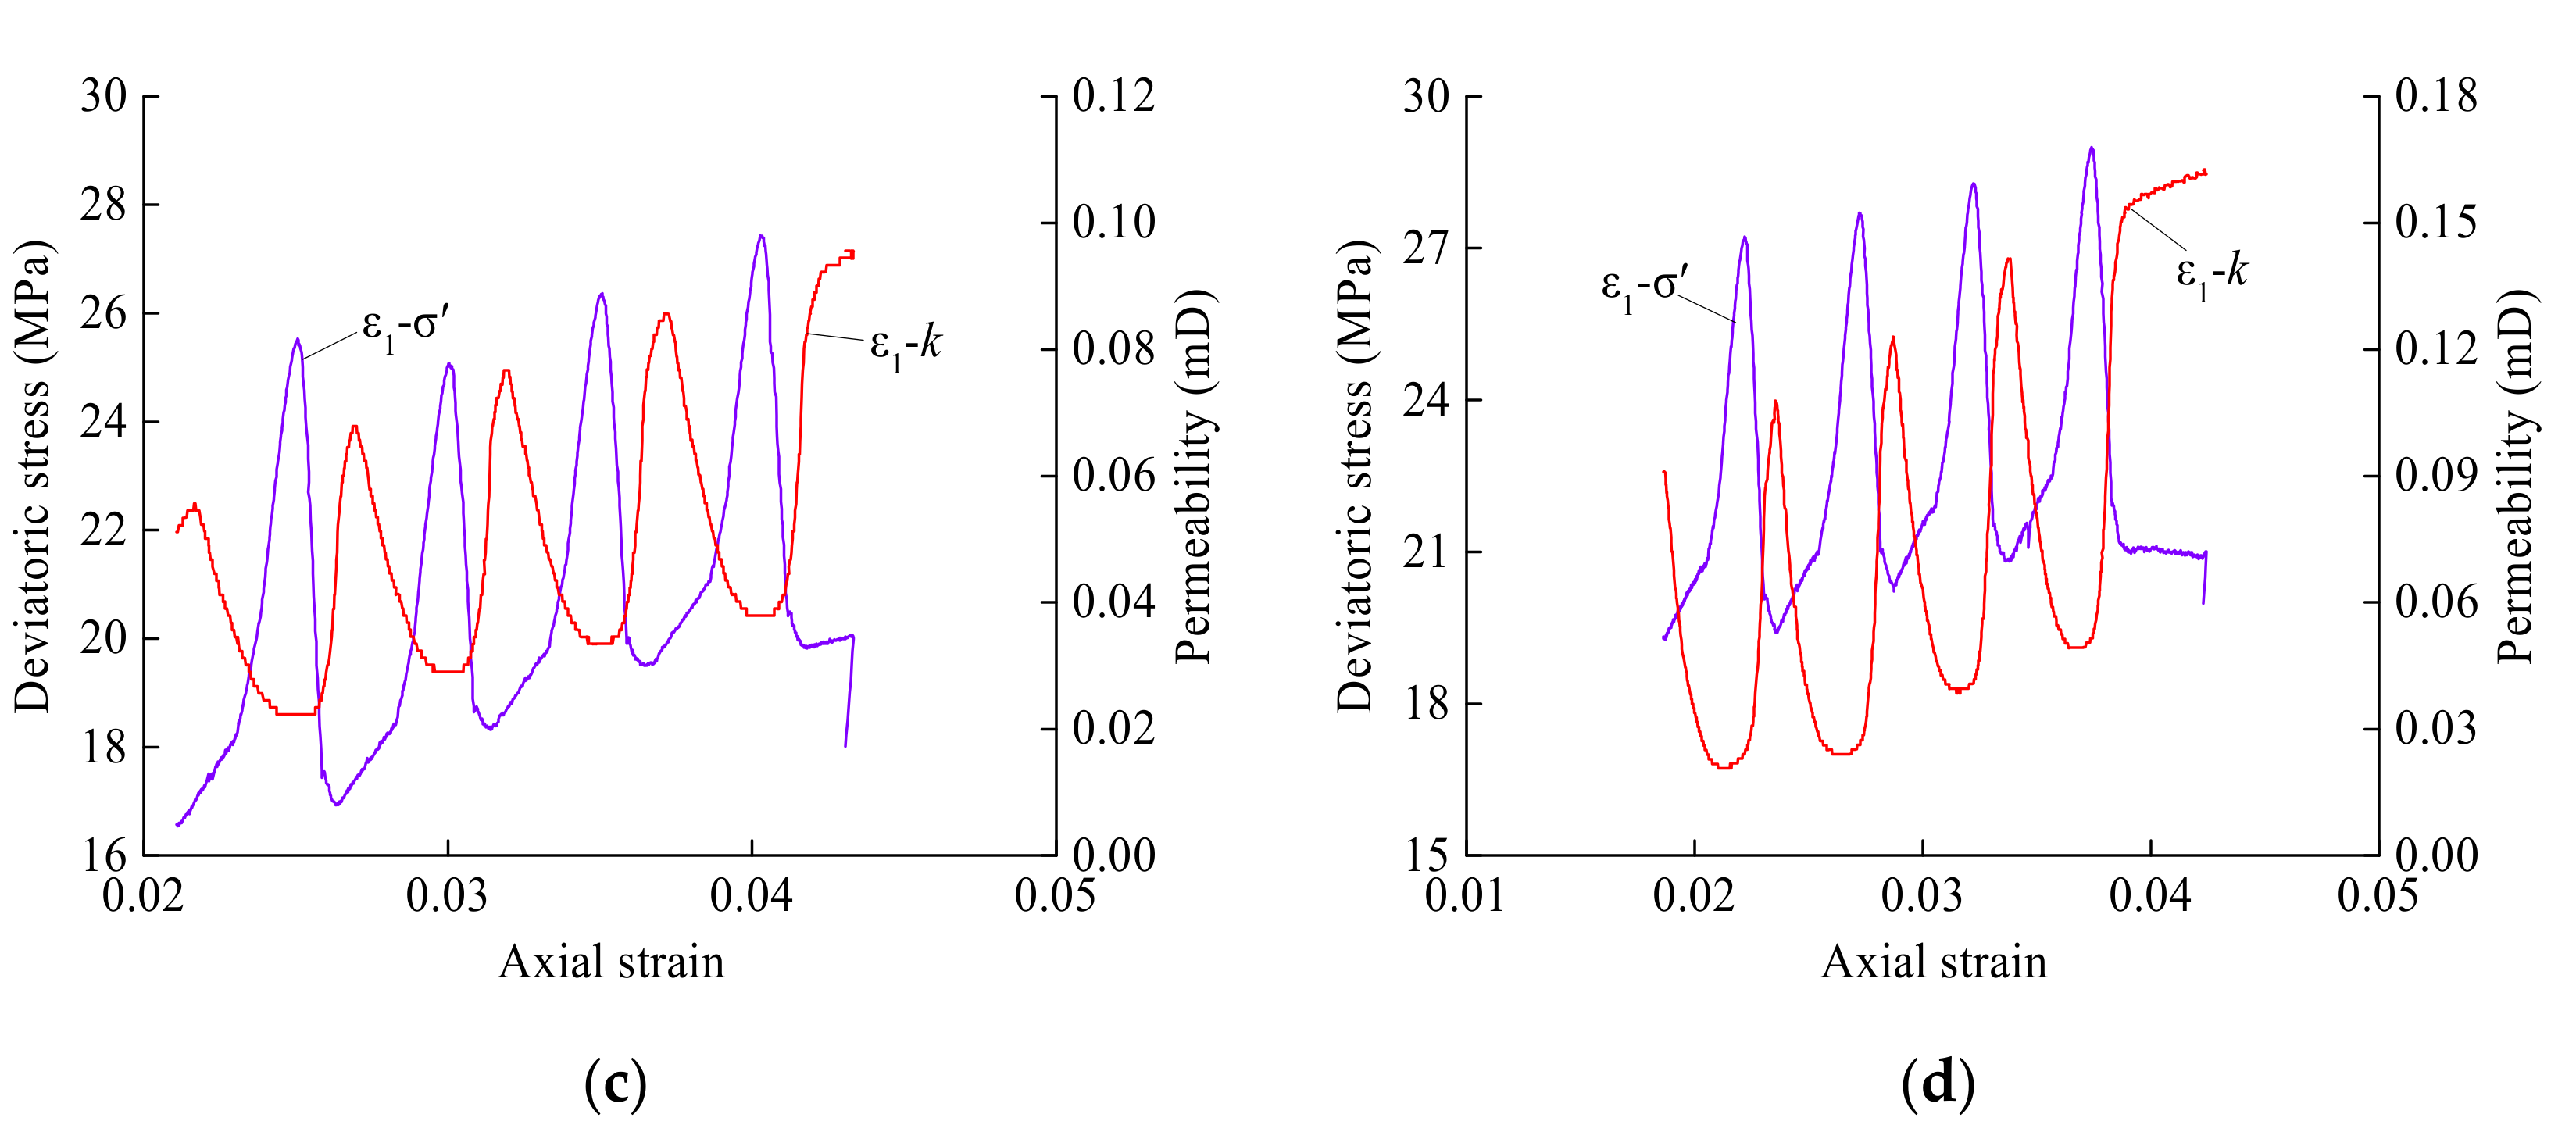
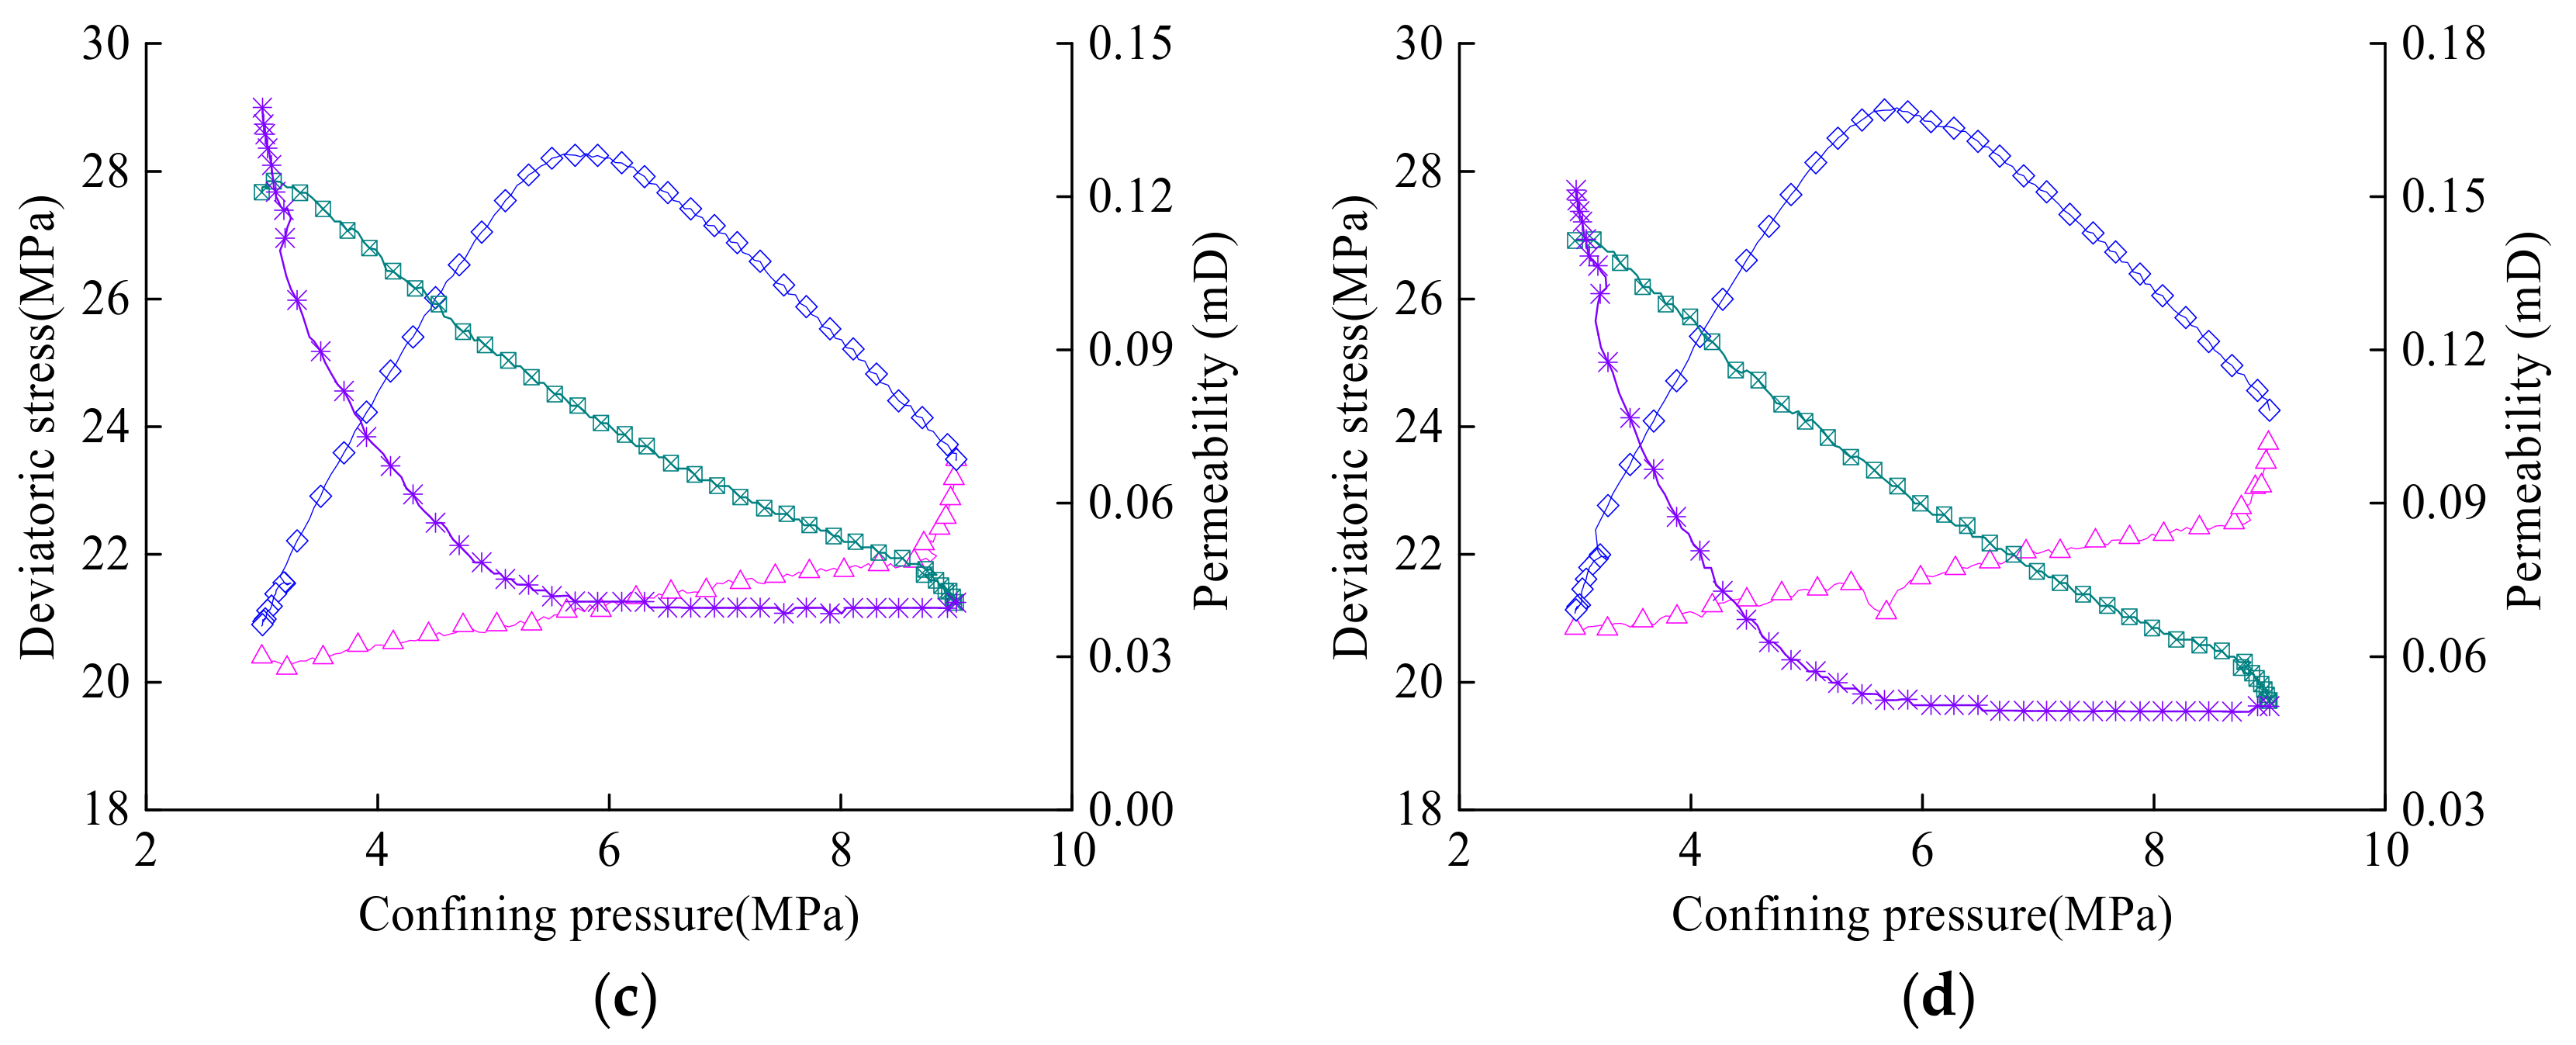
Based on the test results, the relationship curves deviatoric stress-axial strain-permeability of coal samples with different water content under loading and unloading confining pressure are shown in Figure 7.
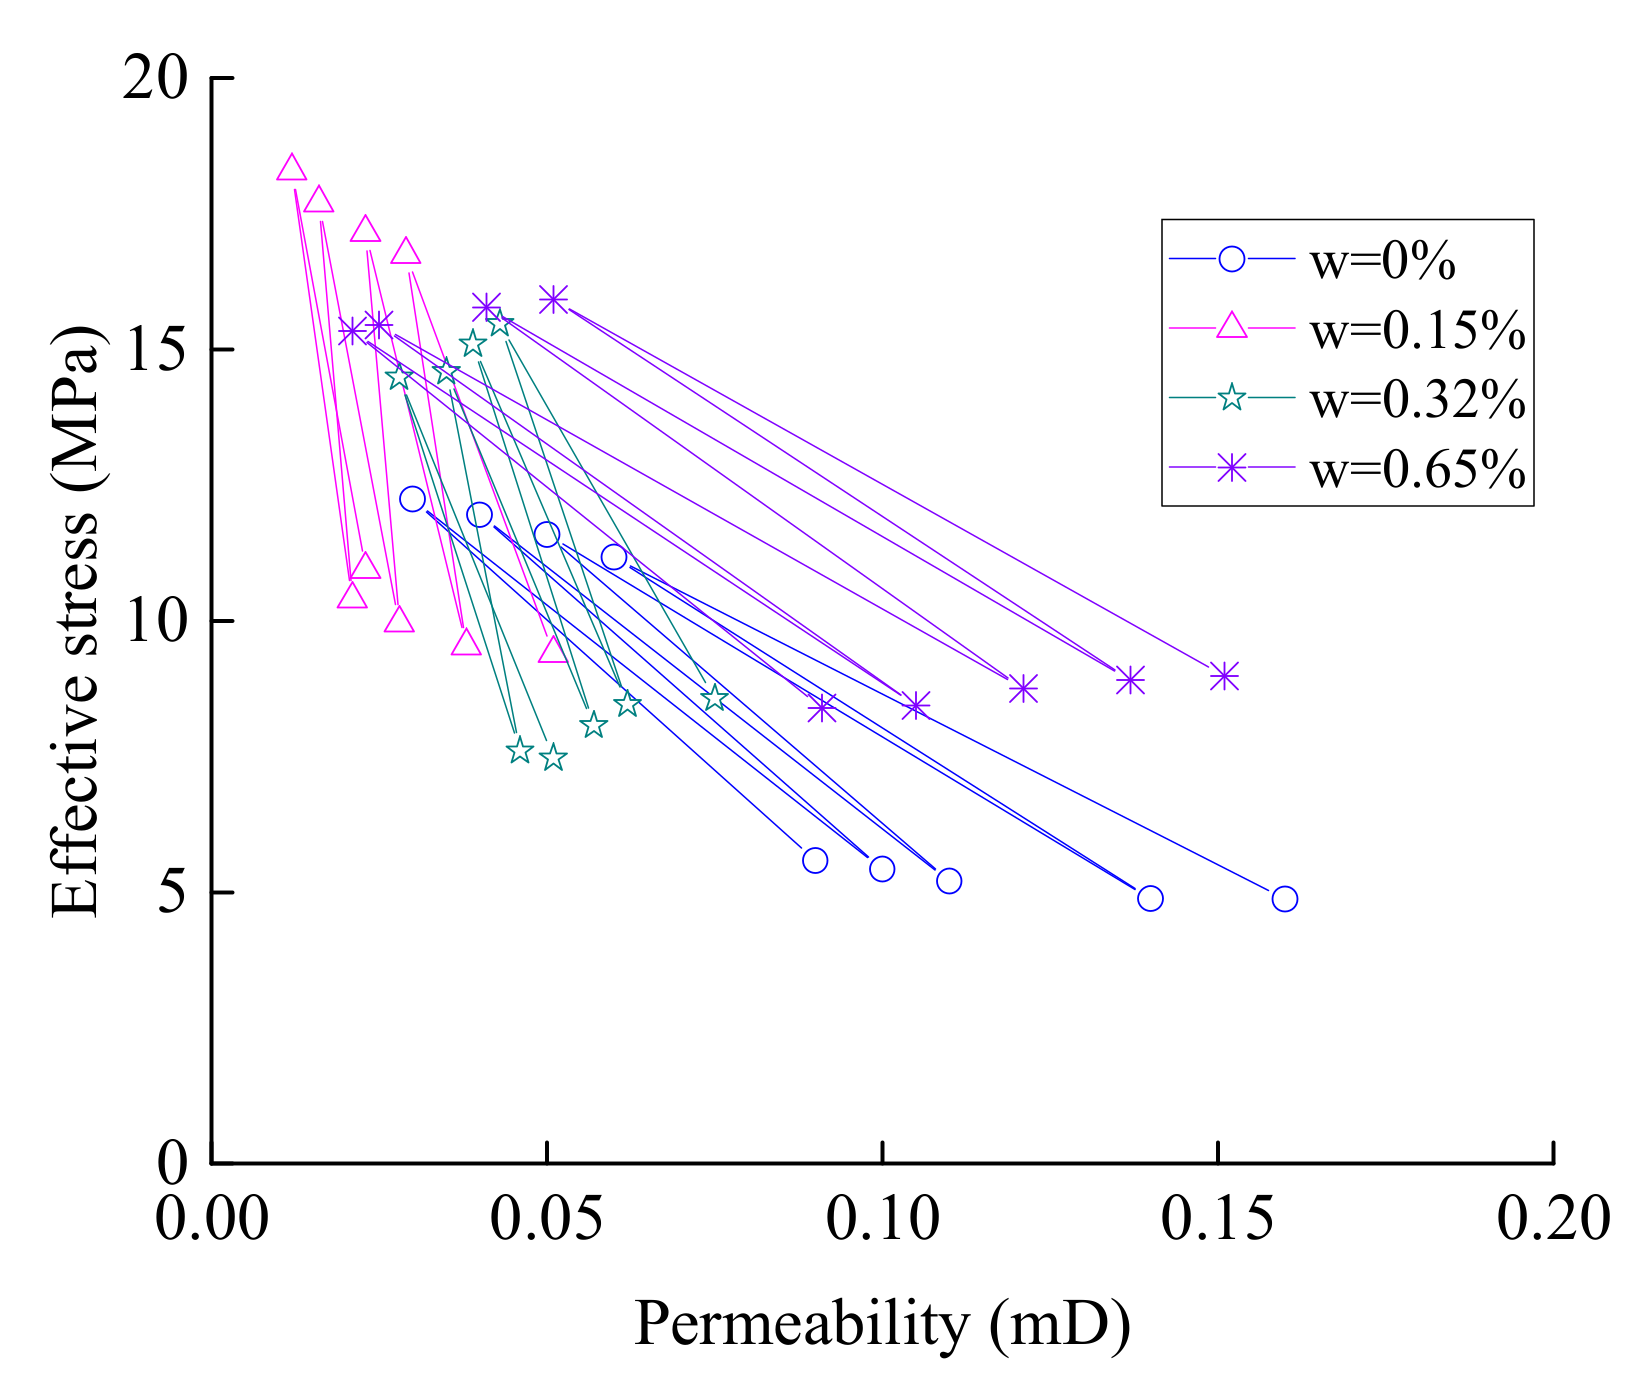
According to the deviatoric stress-axial strain-permeability curve of the sample in Figure 7, the permeability of each sample under different stress states is shown in Table 2. The permeability-effective stress curves of specimens under different stress states were plotted, as shown in Figure 8.
It can be seen that the permeability change of each sample during the post-peak loading and unloading process is as follows: for the dry coal sample, the permeability decreases by 63.54% after the first loading confining pressure, and the permeability increases by 6.43% after unloading confining pressure. After the second loading of confining pressure, the permeability decreases by 56.43%, and the permeability increases by 20.24% after the unloading confining pressure. After the third loading confining pressure, the permeability decreases by 58.99%, and the permeability increases by 24.75% after the unloading confining pressure. After the fourth loading confining pressure, the permeability decreases by 60.16%, and the permeability increases by 11.68% after the unloading confining pressure; for the coal sample with a water content of 0.15%, the permeability decreases by 21.55% after the first loading confining pressure, and the permeability recovered to 87.56% of the initial permeability after unloading confining pressure. After the second loading confining pressure, the permeability decreases by 56.43%, and the permeability increases by 35.61% after the unloading confining pressure. After the third loading confining pressure, the permeability decreases by 15.99%, and the permeability increases by 36.84% after unloading confining pressure. After the fourth loading confining pressure, the permeability decreases by 23.33%, and the permeability increases by 34.72% after unloading confining pressure; for the coal sample with a water content of 0.32%, the permeability decreases by 45.1% after the first loading confining pressure, and the permeability recovered to 90.2% of the initial permeability after unloading confining pressure. After the second loading confining pressure, the permeability decreases by 23.91%, and the permeability increases by 23.91% after the unloading confining pressure. After the third loading confining pressure, the permeability decreases by 31.58%, and the permeability increases by 58.97% after unloading confining pressure. After the fourth loading confining pressure, the permeability decreases by 30.65%, and the permeability increases by 74.42% after unloading confining pressure; for the coal sample with a water content of 0.65%, the permeability decreases by 77.28% after the first loading confining pressure, and the permeability increases by 15.11% after unloading confining pressure. After the second loading of confining pressure, the permeability decreases by 76.06%, and the permeability increases by 15.4% after the unloading confining pressure. After the third loading confining pressure, the permeability decreases by 66.41%, and the permeability increases by 13.73% after the unloading confining pressure. After the fourth loading confining pressure, the permeability decreases by 62.63%, and the permeability increases by 10.11% after the unloading confining pressure.
The above analysis shows that during the post-peak loading and unloading confining pressure, the permeability of the sample gradually decreases with the loading confining pressure and increases with the unloading confining pressure, the permeability of the coal sample increases in wave shape with the increase of axial strain, that is, the permeability increases after each loading and unloading confining pressure compared with that after the previous loading and unloading confining pressure. The possible reason is that the specimen has been destroyed in the process of post-peak loading and unloading confining pressure, and macro-penetrating cracks are generated inside the specimen, and the axial stress is always applied by displacement control. At this time, loading confining pressure can make the macro-cracks produced by sample failure close slowly, resulting in a non-linear decrease in permeability; while unloading confining pressure can make the closed macro-cracks open slowly, but at the same time, under the combined action of axial stress, the cracks in the sample further expand, cracks increase and new cracks are generated, and the gas through the sample capacity increases, resulting in the permeability of the sample after each loading and unloading confining pressure being greater than that of the previous loading and unloading confining pressure.
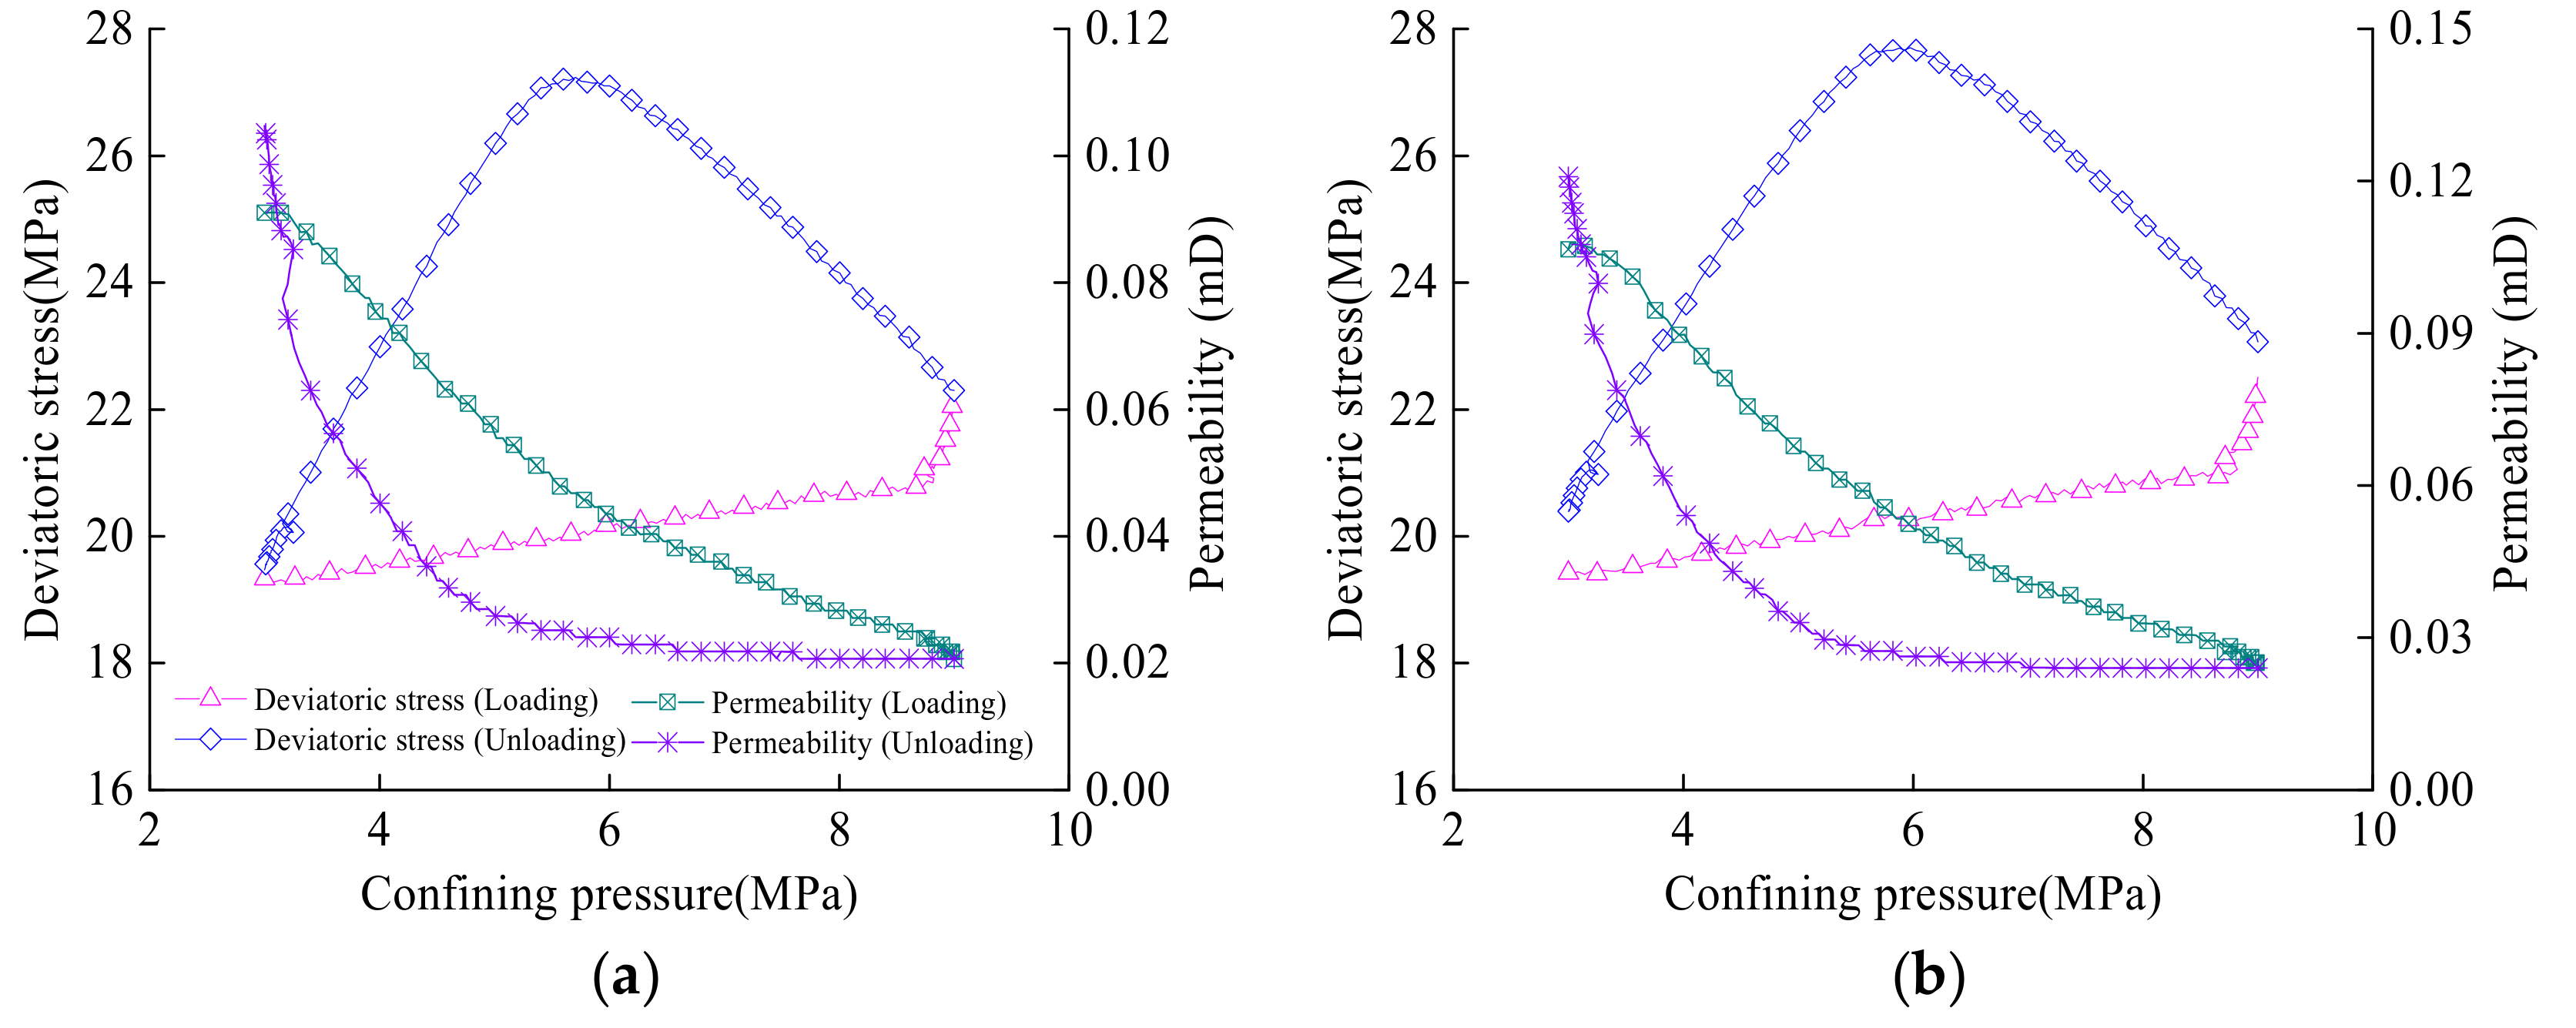
In conclusion, the permeability of coal sample is closely related to confining pressure during loading and unloading. Due to the limitation of the length of the space, this paper only draws the deviatoric stress-confining pressure-permeability curves of water content 0.65% sample during loading and unloading confining pressure post-peak as shown in Figure 9.
It can be seen from Figure 9 that with the loading of the confining pressure, the deviatoric stress increases linearly, and the permeability decreases nonlinearly. When the confining pressure is loaded to about 98% of the predetermined value, the deviatoric stress increases rapidly, and the permeability decreases rapidly. Perhaps it is because under the confining pressure of the raw coal sample, the internal crack and part of the raw coal sample are closed by pressure, which makes the gas flow passage narrow, resulting in a non-linear decrease of gas permeability. When the confining pressure of the specimen is close to the predetermined value of 9 MPa, the confining pressure loading rate automatically decreases under the influence of the test system, and the axial pressure is always in the displacement control uniform loading process, resulting in a rapid increase of the axial stress of the sample, the corresponding deviatoric stress of the specimen increases rapidly, and the permeability of the specimen decreases rapidly. With the unloading of confining pressure, the deviatoric stress of the specimen continues to increase. The deviatoric stress of the specimen reaches the maximum when the confining pressure is unloaded to 5.705 MPa during the first loading and unloading process. The deviatoric stress of the specimen reaches the maximum when the confining pressure is unloaded to 5.975 MPa during the second loading and unloading process. The deviatoric stress of the specimen reaches the maximum when the confining pressure is unloaded to 5.8 MPa during the third loading and unloading process. The deviatoric stress of the specimen reaches the maximum when the confining pressure is unloaded to 5.78 MPa during the fourth loading and unloading process, that is, when the confining pressure is unloaded to an average of about 5.815 MPa (64.61% of the initial confining pressure unloading value), the deviatoric stress of the sample reaches the maximum, and in this process, the permeability of the sample increases slowly, but the rate of increase is small. With the continuous unloading confining pressure, the deviatoric stress of the specimen changes from gradually increasing to decreasing gradually. During this process, the permeability of the sample continues to increase, and the increasing rate is increasing. The possible reason is as follows: at the initial stage of unloading confining pressure, the axial stress of the specimen continues to increase under the control of displacement, that is, the deviatoric stress of the specimen increases gradually. However, the unloading confining pressure cannot effectively open the closed cracks during this process, which leads to a slow increase of the permeability of the sample. When the confining pressure is unloaded to a certain value, the axial stress of the specimen begins to decrease with the unloading confining pressure, that is, there is a turning point in the change of deviatoric stress during the post-peak unloading confining pressure. During the process of unloading confining pressure, the closed cracks and pores of the sample gradually open and expand, and generate new cracks, which results in a non-linear increase of the permeability of the sample and an increasing rate of increase. The difficulty of gas flow in the coal body depends on the development degree of the seepage channel such as cracks and pores in the raw coal sample. The more developed seepage channel is, the more beneficial the gas flow in the coal body will be.
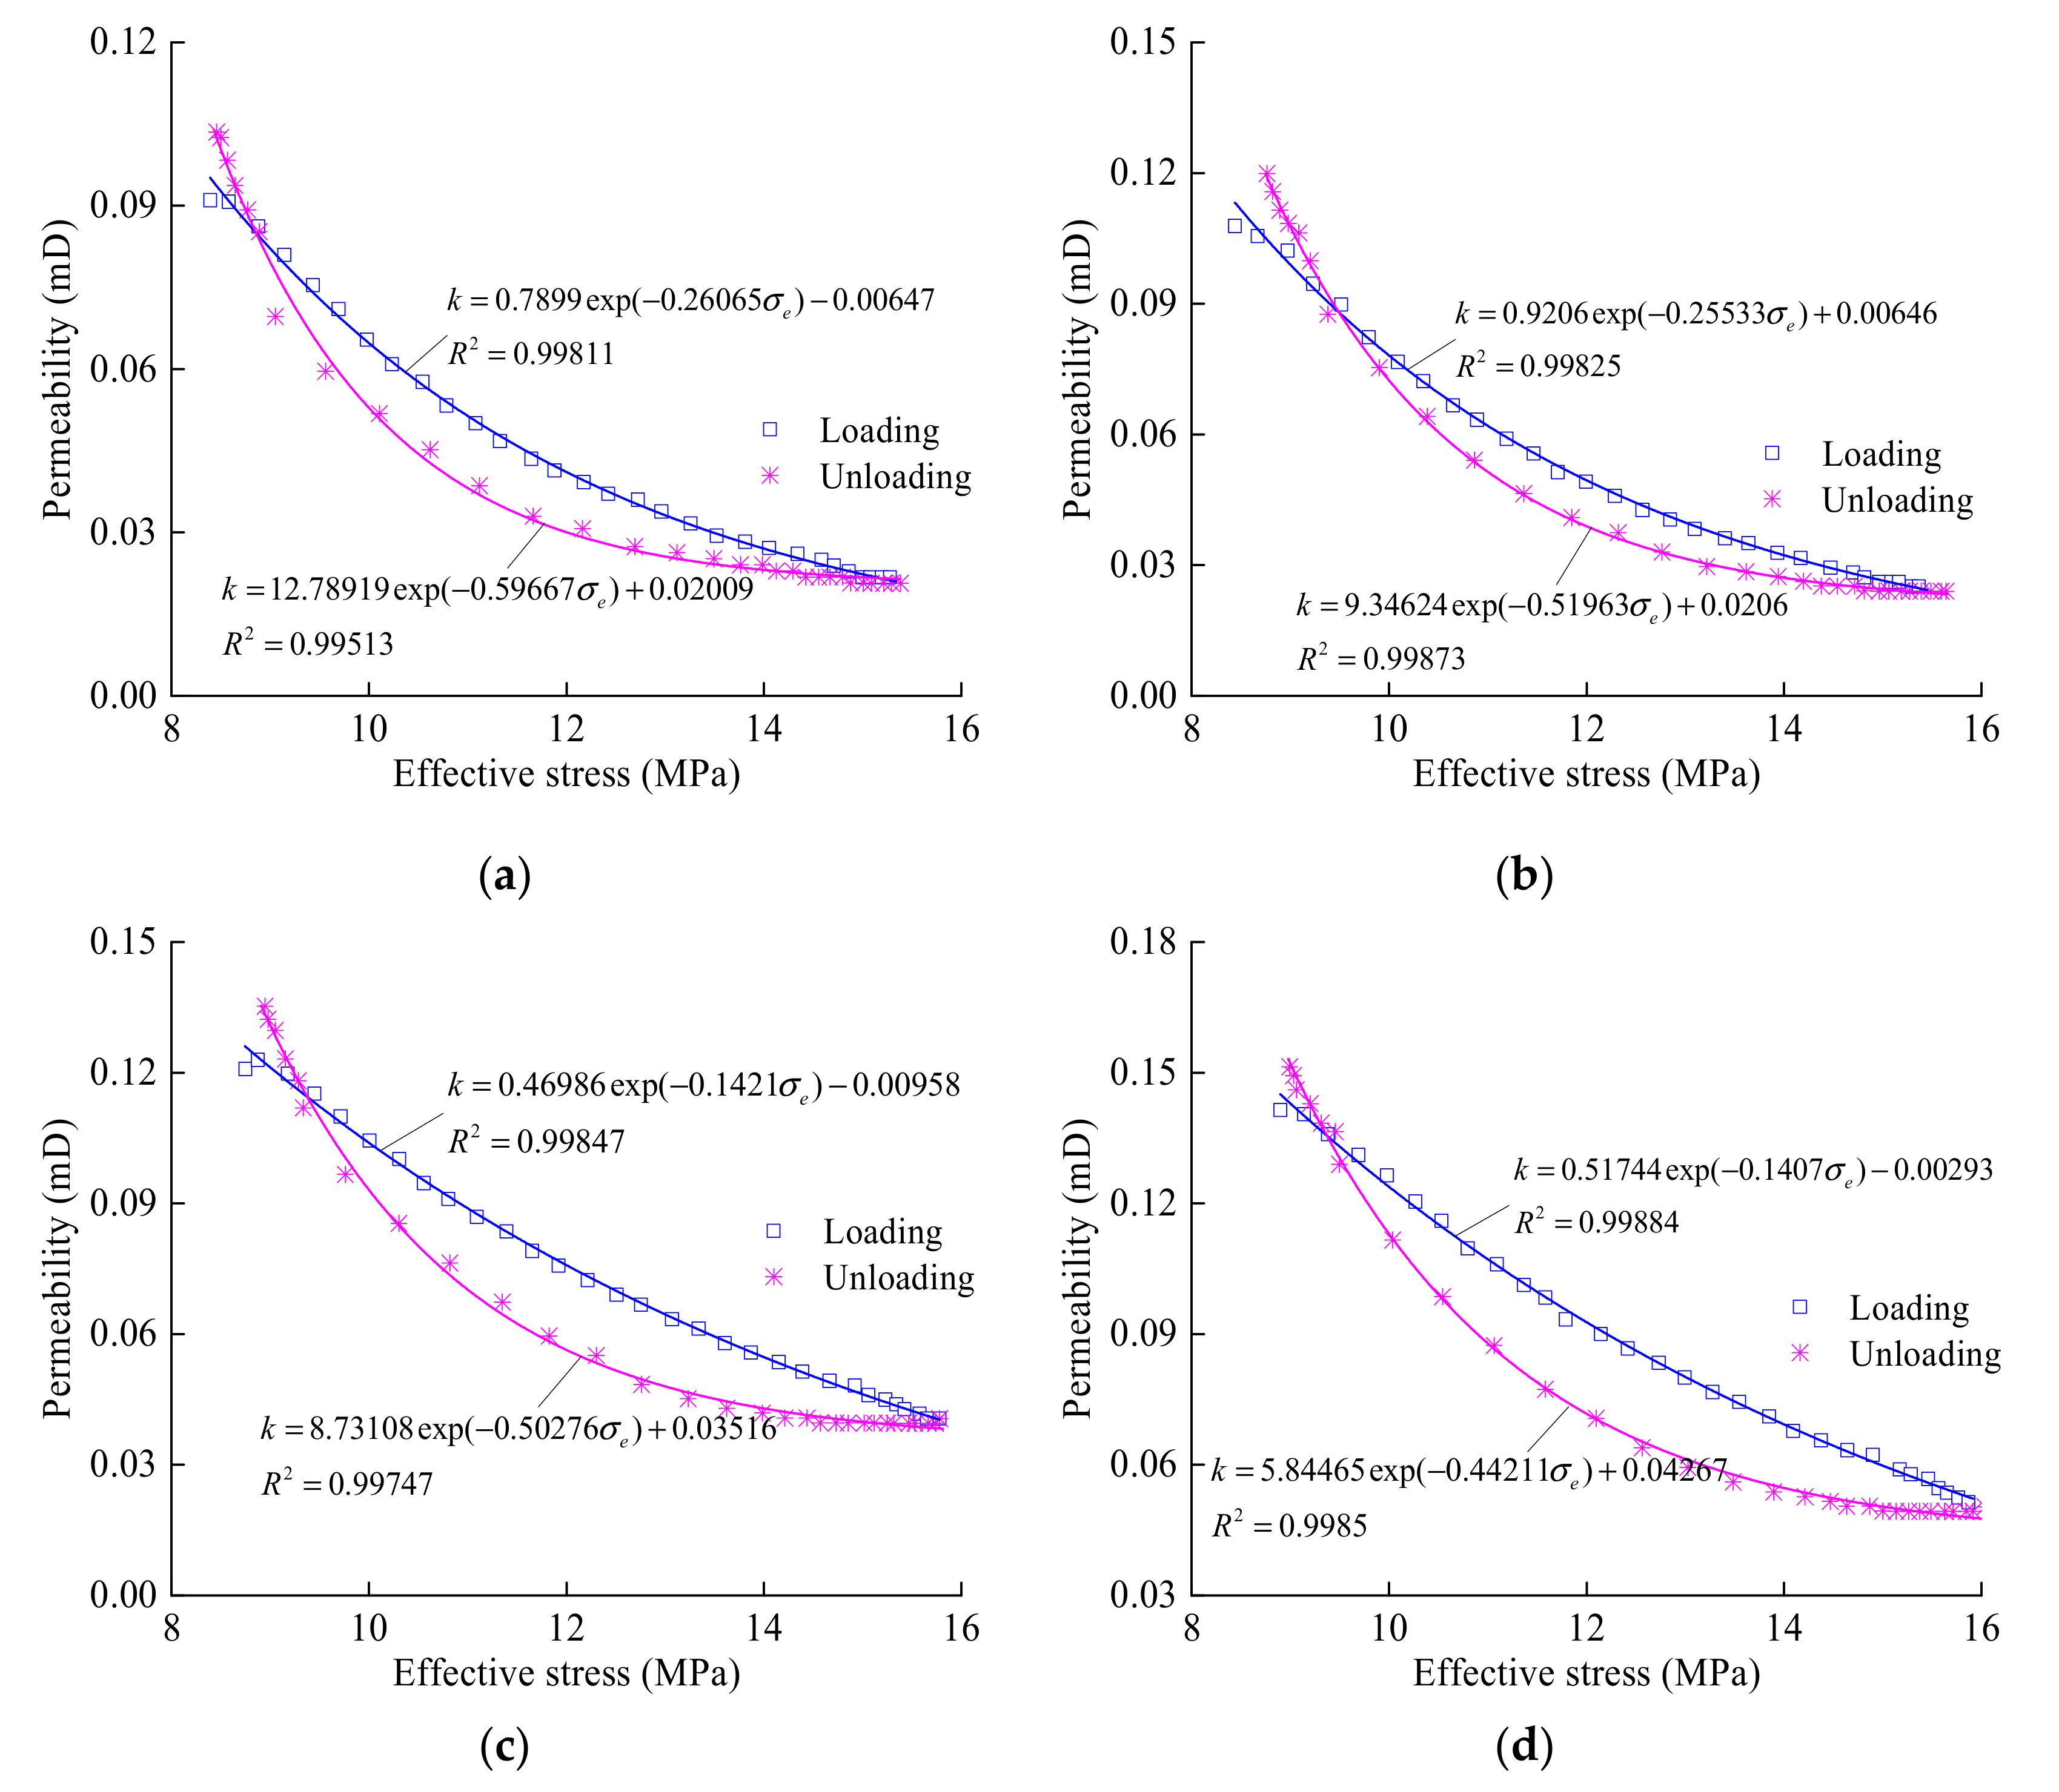
Based on the test results in Figure 9, the relationship between permeability and effective stress during each loading and unloading process is shown in Figure 10, and the relationship is established. It can be seen that the permeability and effective stress of the sample are subject to the ExpDec1 function distribution, as shown in Equation (4).
where, b1, b2, b3 are fitting constants.
It can be seen from Figure 10 that the gas permeability decreases exponentially with the increase of the effective stress, and increases exponentially with the decrease of the effective stress.
4. Discussion
Due to the particularity of the underground environment, the difference of hydrological conditions of coal seam affects the strength and gas seepage characteristics of coal seam to a certain extent. The above experimental results show that the ultimate strength of samples decreases gradually with the increase of water content. The reasons for this result may be as follows: (1) moisture affects the change of coal-rock own properties: water enters into pores, cracks and wets the particles on the free surface, weakens the relationship between the particles, weakens the cohesion and internal friction coefficient of coal sample, and makes the strength of coal sample decrease obviously. At the same time, the lubrication of the water makes the coal sample more susceptible to deformation, and the deformation amount increases under the same stress increases. (2) Moisture affects the distribution of in-situ stress in coal and rock: under the action of loading and unloading stress field, the stress concentration effect on the inner part of coal and rock is caused by pore water pressure. The greater the water content, the greater the wedge effect of water on the fracture poreafter compression, the greater damage degree to the coal by stress. Therefore, the more water inside the coal and rock, the lower the strength of the coal and rock, the greater the deformation and the greater the degree of damage. Therefore, the water content of coal seam can be regarded as one of the important indicators for the determination of coal mine safety coal pillar strength.
After coal seam mining, the coal and rock mass in the state of three-dimensional stress balance causes instability failure, and the stress redistribution of coal-rock mass around the working face. As the working face continues to move forward, the coal body in front of the working face undergoes a complex loading and unloading process. During the test, when the constant confining pressure is 8.6 MPa and the axial stress increases from 18.6 to 25.85 MPa, the axial strain increases by 59.58% when the moisture content is 0%, by 59.18% when the moisture content is 0.15%, by 58.60% when the moisture content is 0.32%, and by 57.84% when the moisture content is 0.65%. When the axial stress is loaded from 25.85 MPa to the sample failure, the axial strain of the sample increases by 300.16% when the moisture content is 0%, by 275.88% when the water content is 0.15%, by 249.19% when the water content is 0.32%, and by 236.04% when the water content is 0.65%. It can be seen that the moisture not only affects the peak strength of the specimen, but also has a great influence on the axial deformation of the specimen. That is, with the increase of moisture content, the axial strain increase of the sample gradually decreases. The permeability of samples is the result of combined action of axial stress, confining pressure and gas pressure. Therefore, it is more meaningful to adopt the relationship between effective stress and permeability. The sample was subjected to post-peak loading and unloading confining pressure tests. The sample had macroscopic cracks, and the axial direction was applied by the displacement control during the process of loading and unloading confining pressure, that is, during the post-peak loading and unloading process, and the axial was simultaneously subjected to axial stress, confining pressure and gas pressure. In the process of post-peak loading confining pressure, the effective stress of the sample increases gradually, which results in the closure of internal voids and cracks, weakens the ability of gas passing through the sample, and decreases the permeability of the sample. In the process of post-peak unloading confining pressure, the effective stress of the sample decreases gradually, resulting in the gradual expansion of the internal voids and cracks, which enhances the gas passing through the sample and increases the permeability of the sample. The permeability and effective stress of the fitted samples obey the ExpDec1 function distribution, because the specimens still have a certain bearing capacity after reaching the peak strength. Therefore, it has a positive effect on the control of coal and gas disasters to study the mechanical and permeability characteristics of the specimen during the post-peak loading and unloading process.
5. Conclusions
In this paper, we investigated the mechanical and permeability characteristics of water-bearing raw coal samples under in-situ stress, the following conclusions are drawn:
(1) The ultimate strength and peak strain of the sample decrease gradually with the increase of water content, and the peak strength and peak axial strain both have a quadratic polynomial relationship with the water content.
(2) With the increase of loading and unloading confining pressure times of post-peak cycles, the radial strain decrement and increment of raw coal sample after loading and unloading confining pressure gradually decrease.
(3) During the process of post-peak loading-unloading confining pressure, the permeability gradually decreases with loading confining pressure, and as the unloading confining pressure gradually increases.
(4) During the process of post-peak loading-unloading confining pressure, the permeability and effective stress are subject to the ExpDec1 function distribution.
Author Contributions
H.W. supervised the research. Z.Z. and L.W. helped in writing and re-checking the paper technically as well as figures and texts. Z.Z. and D.Z. polished the English of the paper.
Funding
This research received no external funding.
Acknowledgments
The authors would like to thank the anonymous reviewers who contributed to the quality of this paper by providing helpful suggestions.
Conflicts of Interest
The authors declare that they have no competing interests.
References
- Jin, H. Experiment and mechanism analysis of the developing process of coal and gas outburst. J. China Coal Soc. 2012, 37, 98–103. [Google Scholar]
- Yan, J.W.; Zhang, X.B.; Zhang, Z.M. Research on geological control mechanism of coal-gas outburst. J. China Coal Soc. 2013, 38, 1174–1178. [Google Scholar]
- Ye, Z.W.; Zhang, L.; Hao, D.Y.; Zhang, C.; Wang, C. Experimental study on the response characteristics of coal permeability to pore pressure under loading and unloading conditions. J. Geophys. Eng. 2017, 14, 1020–1031. [Google Scholar] [CrossRef]
- Wang, L.L.; Jiang, B.; Wang, J.L.; Wang, J.Y.; Qu, Z.H. Effects of in-situ stress and joint on permeability of the coal bed in Linfen block, southeastern Ordos Basin, China. Russ. Geol. Geophys. 2018, 59, 299–312. [Google Scholar] [CrossRef]
- Ju, Y.; Zhang, Q.G.; Zheng, J.T.; Wang, J.G.; Chang, C.; Gao, F. Experimental study on CH4 permeability and its dependence on interior fracture networks of fractured coal under different excavation stress paths. Fuel 2017, 202, 483–493. [Google Scholar] [CrossRef]
- Xue, Y.; Dang, F.N.; Cao, Z.Z.; Du, F.; Ren, J.; Chang, X.; Gao, F. Deformation, Permeability and Acoustic Emission Characteristics of Coal Masses under Mining-Induced Stress Paths. Energies 2018, 11, 2233. [Google Scholar] [CrossRef]
- Wang, K.; Du, F.; Wang, G. Investigation of gas pressure and temperature effects on the permeability and steady-state time of chinese anthracite coal: An experimental study. J. Nat. Gas Sci. Eng. 2017, 40, 179–188. [Google Scholar] [CrossRef]
- Li, B.B.; Yang, K.; Li, J.H.; Ren, C.H.; Xu, J.; Zuo, Y.J.; Zhang, M. Experimental study on the adsorption and permeability characteristics of coal under the coupling of stress and temperature. J. China Coal Soc. 2018, 43, 2857–2865. [Google Scholar]
- Li, B.B.; Yang, K.; Xu, J.; Zhang, M.; Li, X.J. Experimental study on permeability characteristics and adsorption swelling of coal considering temperature effect. J. China Coal Soc. 2018, 43, 1761–1768. [Google Scholar]
- Zhang, L.L.; Li, Q.; Zhang, Q.; Ren, Y.J. Study on pore damage and permeability evolution properties of coal rock caused by liquid nitrogen soaking. Chin. J. Rock Mech. Eng. 2018, 37, 3938–3946. [Google Scholar]
- Yang, Z.Z.; Zhang, Y.P.; Jia, M.; Li, X.G.; Wei, Z.; Zhang, L. Experimental research on influence of low temperature on coal permeability. Rock Soil Mech. 2017, 38, 354–360. [Google Scholar]
- Chen, Y.L.; Li, X.L.; Li, B. Coal Anisotropic Sorption and Permeability: An Experimental Study. Processes 2018, 6, 104. [Google Scholar] [CrossRef] [Green Version]
- Zhang, Z.T.; Zhang, R.; Liu, J.F.; Liu, X.H.; Li, J.W. Permeability evolution of unloaded coal samples at different loading rates. Therm. Sci. 2014, 18, 1497–1504. [Google Scholar] [CrossRef]
- Zhao, H.G.; Zhang, D.M.; Liu, C.; Deng, B.Z.; Bian, G.; Li, W.P. Mechanical characteristics and permeability evolution rule of coal under loading-unloading conditions. Chin. J. Eng. 2016, 38, 1674–1680. [Google Scholar]
- Duan, M.K.; Jiang, C.B.; Yu, H.; Lu, T.Y.; Niu, B.W.; Sun, D.L. Experimental research on energy dissipation and seepage properties of coal under loading-unloading conditions at different stress levels. Rock Soil Mech. 2018, 39, 1346–1354. [Google Scholar]
- Li, Y.; Tang, D.; Xu, H.; Meng, Y.J.; Li, J.Q. Experimental research on coal permeability: The roles of effective stress and gas slippage. J. Nat. Gas Sci. Eng. 2014, 21, 481–488. [Google Scholar] [CrossRef]
- Zhang, X.M.; Zhang, D.M.; Leo, C.J.; Yin, G.Z.; Feng, D.; Liyanapathirana, D.S. Damage Evolution and Post-peak Gas Permeability of Raw Coal Under Loading and Unloading Conditions. Transp. Porous Media 2017, 117, 465–480. [Google Scholar] [CrossRef]
- Pan, Z.; Connell, L.D.; Camilleri, M.; Connelly, L. Effects of matrix moisture on gas diffusion and flow in coal. Fuel 2010, 89, 3207–3217. [Google Scholar] [CrossRef]
- Liu, Z.F.; Kang, T.H.; Lu, W.; Gao, L. Experiment on Water Injection Affected to Mechanics Features of Coal Body. Coal Sci. Technol. 2010, 38, 17–19. [Google Scholar]
- Perera, M.S.A.; Ranjith, P.G.; Peter, M. Effects of saturation medium and pressure on strength parameters valley brown coal: Carbon dioxide, water and nitrogen saturations. Energy 2011, 36, 6941–6947. [Google Scholar] [CrossRef]
- Qin, H.; Huang, G.; Wang, W.Z. Experimental study of acoustic emission characteristics of coal samples with different moisture contents in process of compression deformation and failure. Chin. J. Rock Mech. Eng. 2012, 31, 1115–1120. [Google Scholar]
- Wang, K.; Jiang, Y.F.; Xu, C. Mechanical properties and statistical damage model of coal with different moisture contents under uniaxial compression. Chin. J. Rock Mech. Eng. 2018, 37, 1017–1026. [Google Scholar]
- Wang, S.; Li, H.M.; Wang, W.; Li, D.Y. Experimental study on mechanical behavior and energy dissipation of anthracite coal in natural and forced water-saturation states under triaxial loading. Arab. J. Geosci. 2018, 11, 668. [Google Scholar] [CrossRef]
- Feng, Z.C.; Zhao, D.; Zhao, Y.S. Experimental study on impact of water ratio to adsorption of lump coal. Chin. J. Rock Mech. Eng. 2009, 28, 3291–3295. [Google Scholar]
- Wang, S.; Elsworth, D.; Liu, J. Permeability evolution in fractured coal: The roles of fracture geometry and water-content. Int. J. Coal Geol. 2011, 87, 13–25. [Google Scholar] [CrossRef]
- Yin, G.Z.; Jiang, C.B.; Xu, J.; Guo, L.S.; Peng, S.J.; Li, W.P. An Experimental Study on the Effects of Water Content on Coalbed Gas Permeability in Ground Stress Fields. Transp. Porous Media 2012, 94, 87–99. [Google Scholar] [CrossRef]
- Jiang, C.B.; Duan, M.K.; Yin, G.Z.; Wu, G.P.; Yu, H. Loading-unloading experiments of coal containing gas under the condition of different moisture contents. J. China Coal Soc. 2016, 41, 2230–2237. [Google Scholar]
- Wei, J.P.; Wei, L.; Wang, D.K. Experimental study of moisture content influences on permeability of coal containing gas. J. China Coal Soc. 2014, 39, 97–103. [Google Scholar]
- Yuan, X.; Jiang, D.Y. Experimental study of gas permeability of coal under different moisture state. J. Min. Saf. Eng. 2018, 35, 649–656. [Google Scholar]
- Xu, J.; Peng, S.J.; Yin, G.Z.; Tao, Y.Q.; Yang, H.W.; Wang, W.Z. Development and application of triaxial servo-controlled seepage equipment for thermo-fluid-solid coupling of coal containing methane. Chin. J. Rock Mech. Eng. 2010, 36, 112–117. [Google Scholar]
- Zhang, D.M.; Bai, X.; Qi, X.H.; Zhang, X.M.; Yi, L.D. Acoustic emission characteristics and in-situ stresses of bedding rock based on Kaiser effect. Chin. J. Rock Mech. Eng. 2016, 35, 87–97. [Google Scholar]
- Li, Y.J.; Huang, X.C.; Qiu, Y.P.; Chen, X. Meso-mechanical testing study of microfracturing process property of gypsum breccia under condition of water damage. Rock Soil Mech. 2009, 30, 1221–1225. [Google Scholar]
Figure 1.
Thermal-fluid-solid coupling triaxial servo seepage device.

Figure 2.
Standard raw coal sample.

Figure 3.
Deviation stress–strain-permeability curves of each sample under different water content conditions. (a) water content 0% (b) water content 0.15% (c) water content 0.32% (d) water content 0.65%
Figure 3.
Deviation stress–strain-permeability curves of each sample under different water content conditions. (a) water content 0% (b) water content 0.15% (c) water content 0.32% (d) water content 0.65%

Figure 4.
Coal sample Mohr stress circle under different water content conditions.

Figure 5.
The peak strength, peak axial strain of the sample with water content curves.

Figure 6.
Axial strain-effective stress and radial strain-effective stress curves of specimens with different water content. (a) axial strain-effective stress; (b) radial strain-effective stress.
Figure 6.
Axial strain-effective stress and radial strain-effective stress curves of specimens with different water content. (a) axial strain-effective stress; (b) radial strain-effective stress.

Figure 7.
Post-peak deviatoric stress–strain-permeability curves. (a) water content 0% (b) water content 0.15% (c) water content 0.32% (d) water content 0.65%.
Figure 7.
Post-peak deviatoric stress–strain-permeability curves. (a) water content 0% (b) water content 0.15% (c) water content 0.32% (d) water content 0.65%.


Figure 8.
Permeability-effective stress curves of samples with different moisture contents.

Figure 9.
Deviatoric stress-confining pressure-permeability curves of water content 0.65% coal sample during loading and unloading confining pressure post-peak. (a) First loading and unloading (b) Second loading and unloading (c) Third loading and unloading (d) Fourth loading and unloading
Figure 9.
Deviatoric stress-confining pressure-permeability curves of water content 0.65% coal sample during loading and unloading confining pressure post-peak. (a) First loading and unloading (b) Second loading and unloading (c) Third loading and unloading (d) Fourth loading and unloading


Figure 10.
Fitting curves of effective stress-permeability curves during the process of post-peak loading and unloading confining pressure of the water content 0.65%. (a) First loading and unloading (b) Second loading and unloading (c) Third loading and unloading (d) Fourth loading and unloading
Figure 10.
Fitting curves of effective stress-permeability curves during the process of post-peak loading and unloading confining pressure of the water content 0.65%. (a) First loading and unloading (b) Second loading and unloading (c) Third loading and unloading (d) Fourth loading and unloading


Table 1.
Deformation parameters of each sample in pre-peak.
| Water Content/% | σ1 = 18.6 MPa | σ1 = 25.85 MPa | Peak Strength (σ3 = 3 MPa) | ||||||
|---|---|---|---|---|---|---|---|---|---|
| ε1/% | ε2/% | εv/% | ε1/% | ε2/% | εv/% | ε1/% | ε2/% | εv/% | |
| 0 | 0.4918 | –0.045 | 0.4011 | 0.7848 | –0.082 | 0.6211 | 1.968 | –0.505 | 0.9587 |
| 0.15 | 0.4975 | –0.048 | 0.4017 | 0.7919 | –0.086 | 0.6206 | 1.87 | –0.709 | 0.455 |
| 0.32 | 0.4983 | –0.04 | 0.4192 | 0.7903 | –0.07 | 0.6506 | 1.74 | –0.432 | 0.8757 |
| 0.65 | 0.4803 | –0.054 | 0.373 | 0.7581 | –0.097 | 0.5639 | 1.614 | –0.417 | 0.7799 |
Table 2.
Deformation parameters of each sample with different stress.
| σ3/MPa | Water Content 0% | Water Content 0.15% | ||||||||
|---|---|---|---|---|---|---|---|---|---|---|
| σ1/MPa | σe/MPa | ε1/% | ε3/% | k/mD | σ1/MPa | σe/MPa | ε1/% | ε3/% | k/mD | |
| 3 | 13.90 | 5.58 | 2.27 | –2.37 | 0.09 | 29.99 | 10.95 | 2.23 | –3.06 | 0.023 |
| 9 | 21.86 | 12.24 | 2.52 | –1.86 | 0.03 | 40.01 | 18.29 | 2.48 | –2.76 | 0.012 |
| 3 | 13.41 | 5.42 | 2.77 | –2.99 | 0.10 | 28.35 | 10.40 | 2.73 | –3.42 | 0.021 |
| 9 | 20.99 | 11.95 | 3.08 | –2.60 | 0.04 | 38.25 | 17.70 | 2.98 | –3.27 | 0.016 |
| 3 | 12.74 | 5.20 | 3.33 | –3.43 | 0.11 | 27.04 | 9.96 | 3.23 | –3.77 | 0.028 |
| 9 | 19.93 | 11.59 | 3.65 | –3.28 | 0.05 | 36.64 | 17.16 | 3.49 | –3.61 | 0.023 |
| 3 | 11.80 | 4.88 | 3.89 | –3.72 | 0.14 | 25.78 | 9.54 | 3.74 | –4.01 | 0.038 |
| 9 | 18.66 | 11.17 | 4.20 | –3.54 | 0.06 | 35.4 | 16.75 | 4.00 | –3.83 | 0.029 |
| 3 | 11.77 | 4.87 | 4.47 | –3.99 | 0.16 | 25.34 | 9.40 | 4.24 | –4.22 | 0.051 |
| σ3/MPa | Water Content 0.32% | Water Content 0.65% | ||||||||
| σ1/MPa | σe/MPa | ε1/% | ε3/% | k/mD | σ1/MPa | σe/MPa | ε1/% | ε3/% | k/mD | |
| 3 | 19.57 | 7.47 | 2.11 | –2.04 | 0.051 | 22.33 | 8.39 | 1.86 | –0.95 | 0.091 |
| 9 | 28.61 | 14.49 | 2.36 | –1.62 | 0.028 | 31.16 | 15.34 | 2.11 | –0.63 | 0.021 |
| 3 | 19.94 | 7.60 | 2.63 | –2.76 | 0.046 | 22.47 | 8.44 | 2.35 | –1.20 | 0.105 |
| 9 | 28.93 | 14.59 | 2.88 | –2.32 | 0.035 | 31.50 | 15.45 | 2.60 | –0.83 | 0.025 |
| 3 | 21.37 | 8.07 | 3.14 | –2.93 | 0.057 | 23.39 | 8.75 | 2.86 | –1.46 | 0.121 |
| 9 | 30.45 | 15.10 | 3.39 | –2.87 | 0.039 | 32.49 | 15.78 | 3.11 | –1.07 | 0.041 |
| 3 | 22.53 | 8.46 | 3.64 | –3.26 | 0.062 | 23.88 | 8.91 | 3.36 | –1.70 | 0.137 |
| 9 | 31.56 | 15.47 | 3.92 | –3.10 | 0.043 | 32.90 | 15.92 | 3.62 | –1.32 | 0.051 |
| 3 | 22.87 | 8.57 | 4.16 | –3.52 | 0.075 | 24.08 | 8.98 | 3.88 | –2.09 | 0.151 |
© 2019 by the authors. Licensee MDPI, Basel, Switzerland. This article is an open access article distributed under the terms and conditions of the Creative Commons Attribution (CC BY) license (http://creativecommons.org/licenses/by/4.0/).
Share and Cite
MDPI and ACS Style
Zhang, Z.; Wang, H.; Wang, L.; Zhang, D. Experimental Study on Mechanics and Permeability Properties of Water-Bearing Raw Coal Samples Under In-Situ Stress. Appl. Sci. 2019, 9, 2549. https://doi.org/10.3390/app9122549
AMA Style
Zhang Z, Wang H, Wang L, Zhang D. Experimental Study on Mechanics and Permeability Properties of Water-Bearing Raw Coal Samples Under In-Situ Stress. Applied Sciences. 2019; 9(12):2549. https://doi.org/10.3390/app9122549
Chicago/Turabian StyleZhang, Zuxun, Hongtu Wang, Li Wang, and Dongming Zhang. 2019. "Experimental Study on Mechanics and Permeability Properties of Water-Bearing Raw Coal Samples Under In-Situ Stress" Applied Sciences 9, no. 12: 2549. https://doi.org/10.3390/app9122549
Note that from the first issue of 2016, this journal uses article numbers instead of page numbers. See further details here.