Heating, Ventilation, and Air Conditioning System Optimization Control Strategy Involving Fan Coil Unit Temperature Control

1
Institute of Electrical and Control Engineering, National Chiao Tung University, 1001 University Road, Hsinchu 30010, Taiwan
2
Energy and Environment Research Laboratories, Industrial Technology Research Institute, Rm.820, Bldg.51, 8F, 195, Sec.4, Chung Hsing Rd., Chutung, Hsinchu 31040, Taiwan
*
Author to whom correspondence should be addressed.
Appl. Sci. 2019, 9(11), 2391; https://doi.org/10.3390/app9112391
Submission received: 2 May 2019
/
Revised: 31 May 2019
/
Accepted: 7 June 2019
/
Published: 11 June 2019
(This article belongs to the Special Issue Selected Papers from IEEE ICASI 2019)
Abstract
:The objective of this study was to develop a heating, ventilation, and air conditioning (HVAC) system optimization control strategy involving fan coil unit (FCU) temperature control for energy conservation in chilled water systems to enhance the operating efficiency of HVAC systems. The proposed control strategy involves three techniques, which are described as follows. The first technique is an algorithm for dynamic FCU temperature setting, which enables the FCU temperature to be set in accordance with changes in the outdoor temperature to satisfy the indoor thermal comfort for occupants. The second technique is an approach for determining the indoor cold air demand, which collects the set FCU temperature and converts it to the refrigeration ton required for the chilled water system; this serves as the control target for ensuring optimal HVAC operation. The third technique is a genetic algorithm for calculating the minimum energy consumption for an HVAC system. The genetic algorithm determines the pump operating frequency associated with minimum energy consumption per refrigeration ton to control energy conservation. To demonstrate the effectiveness of the proposed HVAC system optimization control strategy combining FCU temperature control, this study conducted a field experiment. The results revealed that the proposed strategy enabled an HVAC system to achieve 39.71% energy conservation compared with an HVAC system operating at full load.
1. Introduction
Air conditioning, lighting, and ventilation systems constitute approximately 50% of the total power consumption of a building. In particular, air conditioning systems have a considerable effect on energy consumption; hence, energy conservation control mechanisms for air conditioning systems are crucial [1]. Air conditioning systems in a mass building are typically centralized and comprise fan coil units (FCUs) in each area of the building and a chilled water system in the mechanical room [2]. The chilled water system provides chilled water to the cooling coils of the FCUs, and the water in the coils is subsequently converted to cold air that is distributed to each area of the building. In general, because of the change of seasons, chilled water systems are designed on the basis of the maximum load in summer. Therefore, such systems often operate under a partial load ratio, leading to energy waste due to poor operating efficiency. The coefficient of performance of a chilled water system is a critical parameter in evaluating the performance of chilled water systems. A higher coefficient signifies higher chilled water system performance. Chow et al. [3] proposed using a neural network and genetic algorithm optimization to enhance the operating efficiency of a chilled water system to achieve energy conservation. Browne and Bansal [4] used a regression model to predict the performance of a chilled water system to optimize the control of the system. Numerous studies have focused on efficiency optimization control strategies for chilled water systems and cooling towers. For example, Yu and Chan [5] used load-based speed control to determine the optimal control frequency for cooling towers and chilled water pumps to optimize the operating efficiency of chilled water systems. In addition to achieving optimal efficiency for chilled water systems (by controlling their operation), effectively controlling chilled water systems (by using indoor heat demand responses) is another means of achieving cost reduction. Yoon et al. [6] proposed the use of a dynamic demand response controller to change the temperature settings of a chilled water system and control its loading during periods of peak power consumption.
Wang et al. [7] revealed that thermal comfort is a crucial factor influencing the control of heating, ventilation, and air conditioning (HVAC) systems because a user’s thermal comfort demand directly affects HVAC system control. Therefore, effective control of indoor thermal comfort temperature contributes to the maintenance of environmental comfort and the reduction of FCU energy waste. Specifically, an optimization control strategy to balance between HVAC energy consumption and indoor thermal comfort is valuable. The most commonly cited experiments on the human perception of thermal comfort have been performed by Fanger (1982). His analysis indicated the sensation of human thermal comfort by six factors: Four physical variables, including air temperature, mean radiant temperature, air velocity, and air humidity, and two personal variables, including metabolic rate and clothing insulation. Fanger and Toftum [8] proposed the PMV model, which agrees well with high-quality field studies in buildings with HVAC systems, situated in cold, temperature, and warm climates, studied during both summer and winter. Model predictive control (MPC) is comprehensively used to determine indoor HVAC temperature settings and comfortable temperature values by employing optimal control methods to reduce energy consumption and maintain indoor thermal comfort. Castilla et al. [9] proposed a hierarchical control method that entails the use of a non-linear MPC strategy to predict control. The purpose of this method is to maintain indoor comfort while preventing an HVAC system from entering high-load operation and to optimize efficiency during low-load operation. Jazizadeh et al. [10] applied a fuzzy control system for predicting indoor thermal comfort to effectively reduce the daily mean flow of an HVAC system. Chen et al. [11,12] has proposed two MPC systems for determining the optimal solution to balance indoor thermal comfort and chilled water system control; moreover, a model integrating MPC and dynamic thermal sensation could maintain indoor thermal comfort while consuming energy at a rate lower than that of the conventional MPC–PMV model. Human perception of thermal comfort generally varies with climate. Oldewurtel et al. [13] applied a stochastic MPC system for predicting the change in climate to calculate the minimum energy required to achieve indoor thermal comfort. Fong [14] indicated that indoor thermal comfort is not only a perceived response of the human body to environmental comfort but also a demand response (DR) to the cooling ability of HVAC systems. Lin et al. [15] applied an algorithm to solve optimal chiller loading (OCL) problems. ASHRAE [16] has developed an industry consensus standard to describe comfort requirements in buildings. The standard is known as ASHRAE Standard 55-2004 Thermal Environmental Conditions for Human Occupancy. The purpose of this standard is to specify the combinations of indoor thermal environmental factors and personal factors that will produce thermal environmental conditions acceptable to a majority of the occupants within the space. Brager and Dear [17] have proposed the distinction between thermal comfort response in air-conditioned and naturally ventilated buildings and suggested that behavioral adaptation incorporated in conventional heat balance models could only partially explain these differences and that comfort was significantly influenced by people’s expectations of the thermal environment. Brager and Dear [18] have presented the relationship between optimum temperatures and prevailing indoor/outdoor temperatures in the study demonstrated that adaptation is at work in buildings with centralized HVAC. The results were interpreted to indicate that occupants of HVAC buildings had become finely tuned to the very narrow range of indoor temperatures being presented by current HVAC practice. However, there is potentially a very high energy cost to maintaining those narrowly defined comfortable thermal conditions. Humphreys and Nicol [19] presented an adaptive model for thermal comfort, and used a fuzzy logic system to fine tune the room temperature. Dear et al. [20] explained all fields of applied research; it is important that the thermal environment of simulations are regularly ‘ground-truthed’ with real comfort assessments from human subjects in either chamber studies or ‘real’ building occupants in field studies. Thermal comfort evaluations by human subjects are a superior contribution to knowledge, having longer-lasting value to the research community than simulated comfort evaluations coming out of a comfort model. Alfano et al. [21] pointed out that HVAC engineers are, in practice, interested in the air temperature value required to ensure thermal comfort rather than in a comfort index.
Many studies explore the use of PID controllers to control the energy-saving control of HVAC systems with optimized algorithms or to use climatic factors to predict the RT requirements of HVAC systems [22]. A few papers combine HVAC system control with indoor comfort requirements, Kampelis et al. [23] proposed the Daily Discomfort Score (DDS) to assess demand response HVAC control and thermal comfort in a university building. Most of the abovementioned documents are optimized for ice water systems, or use the simulation method to estimate the comfort of the indoor ice-water system energy consumption comparison and prediction, but do not combine the indoor real heat demand and HVAC power consumption. This paper aims to solve the optimal control strategy of the chilled water system of HVAC buildings and approach the request of the occupants for indoor thermal comfort. Occupants’ adjustments of temperature settings are used as feedback to determine the actual refrigeration ton (RT) demand for a chilled water system and a fuzzy logic system continually to determine the cooling air demand for a chilled water system. Finally, the operating point associated with minimum energy consumption per unit RT is derived using a genetic algorithm. The effectiveness of this energy conservation algorithm was tested through a field experiment.
2. Research Background
Most energy conservation methods implemented in cooling systems for a single chilled water system apply frequency down-conversion control to the chilled water system according to the change in outdoor climate; alternatively, such methods adjust the parameter settings of the chilled water system on the basis of the minimum RT demand. However, few methods apply energy conservation control according to indoor heat demands. To meet the indoor thermal comfort demand, users adjust the operating temperature (Top) of an HVAC system through an FCU temperature control panel. This demand defines the required RT that the chilled water system must produce.
The present study focuses on an HVAC system optimization control strategy involving FCU temperature control. In this strategy, indoor air information is included in the analysis, and a user’s heat demand volume for a chilled water system is determined. The determined heat demand volume is then converted to RT demand for the chilled water system. This strategy can be used to change the chilled water flow and cooling water flow to meet indoor heat demands while ensuring minimum power consumption. The main techniques involved in this strategy are as follows: algorithm for dynamic FCU temperature setting, method for indoor heat demand conversion, and optimization control strategy for energy consumption of single cooling machine of the chilled water system.
2.1. Dynamic FCU Temperature Settings
An FCU distributes cold air produced by a chilled water system to an indoor area. In such an area, the demand for cold air can be determined by observing a user’s adjustments of FCU temperature settings. The Daily Discomfort Score (DDS) is developed to assess demand response (DR) and thermal comfort in a building. Baseline and preconditioning scenarios are used to demonstrate the effectiveness of the Daily Discomfort Score in evaluation thermal comfort and demand response HVAC system set-point control [23]. The ASHRAE Standard 55-1992 states that the comfort zone for summer conditions, air temperature to be between 23 °C and 26 °C and relative humidity between 20% and 60%. Surveys of human thermal response in South East Asia produce the Auliciems’ equation for estimating thermal neutrality on the basis of the mean monthly dry bulb temperature [24].
In the proposed method, a regression model that includes outdoor temperature and indoor sensing temperature as variables is used to calculate the indoor HVAC temperature:
where Ta is the indoor HVAC temperature, Ti is the indoor sensing temperature, To is the outdoor temperature, α and β are regression coefficients, and c is a constant.
Ta = α × (Ti) + β × (To) + c
In Equation (1), the range of the indoor HVAC temperature is not constrained; hence, the temperature may be excessively high when the indoor sensing temperature or outdoor temperature is markedly high. To maintain indoor temperature quality, the indoor HVAC temperature can be corrected using tan–1 and limited to the indoor comfortable range of 23–26 °C. The indoor comfort temperature (Tc) can be expressed as follows:
Tc = [tan−1(Ta − 24.5)] + 24.5
An experiment conducted in this study revealed that when Top was adjusted, the indoor environmental temperature normally required 10–20 min to approach Top. To maintain indoor temperature quality and meet the cooling air request, the proposed algorithm based on dynamic FCU temperature settings automatically sends an HVAC setting temperature (Ts) that is within the indoor comfort range every 30 min and calculates the temperature difference between Tc and Top to determine the indoor thermal comfort (ITC), as presented in Equation (3):
ITC = Tc − Top
The derived ITC is then used to correct Ts to achieve indoor comfort. The conditions for determining ITC’ are as follows:
where and is the power law conversion coefficient.
The cooling efficiency of an HVAC system is subject to numerous factors. In general, Top is not equal to Ti; in particular, Ti is typically higher than Top in summer. To maintain indoor comfort, the proposed algorithm determines that users are satisfied with the current environmental temperature when the derived ITC value is within ±1 °C. Additionally, a gamma transformation function is adjusted through power law conversion to adjust Ts; thus, Ti approaches Tc. The purpose of power law conversion is to ensure a high output Ts when the input is high, which enables rapid indoor temperature response. When the input is low, a low Ts output is obtained to prevent excessive energy waste.
An ITC value that is not within ±1 °C signifies that users are not satisfied with the current environmental temperature. Accordingly, Top is adjusted using the FCU temperature control panel. In this situation, the FCU dynamic temperature setting algorithm uses Top as Ts for the HVAC system to meet the user-demanded temperature. Subsequently, the algorithm recalculates Tc and re-executes the ITC determination conditions and temperature control in 30 min.
2.2. Indoor Heat Demand Conversion
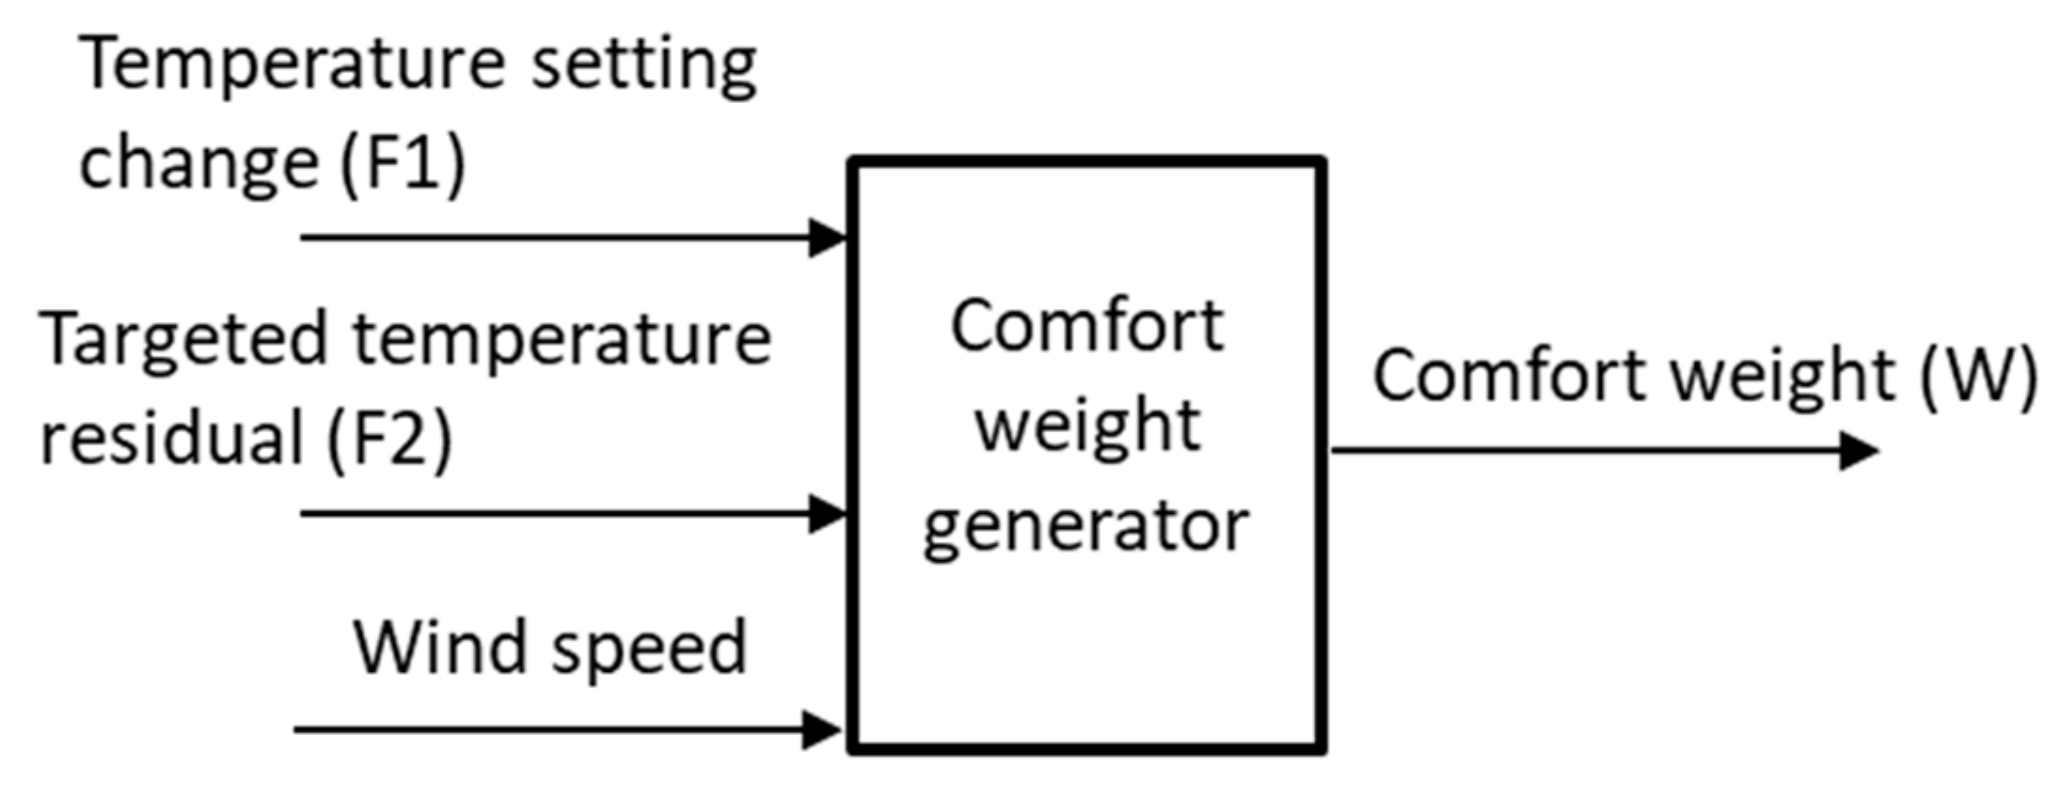
A conventional chilled water system estimates the required RT by relying solely on the difference in temperature between chilled water entering and that exiting the system. However, such a system cannot determine whether the estimated RT can meet the heat demand of an area. Therefore, a measurement index is required to enable the chilled water system to adjust RT supplies. A conventional FCU provides only Ts and Ti information. By contrast, this study proposes a technique that integrates the difference between Ts and Ti with the FCU wind speed to obtain a comfort weight (W) for chilled water system control. Figure 1 illustrates the system framework.
This system is based on a multiple-input single-output (MISO) fuzzy controller, where the output is W. The MISO controller is described as follows:
- The change in temperature settings (F1) is used to understand the required RT for a user, as presented in Equation (5). A negative F1 value (e.g., a change in temperature setting from 26 °C to 24 °C) indicates that the user feels hot, whereas a positive F1 value indicates that the user feels cold:F1 = Ts (t) − Ts (t − 1)In Equation (5), t is the sampling time.
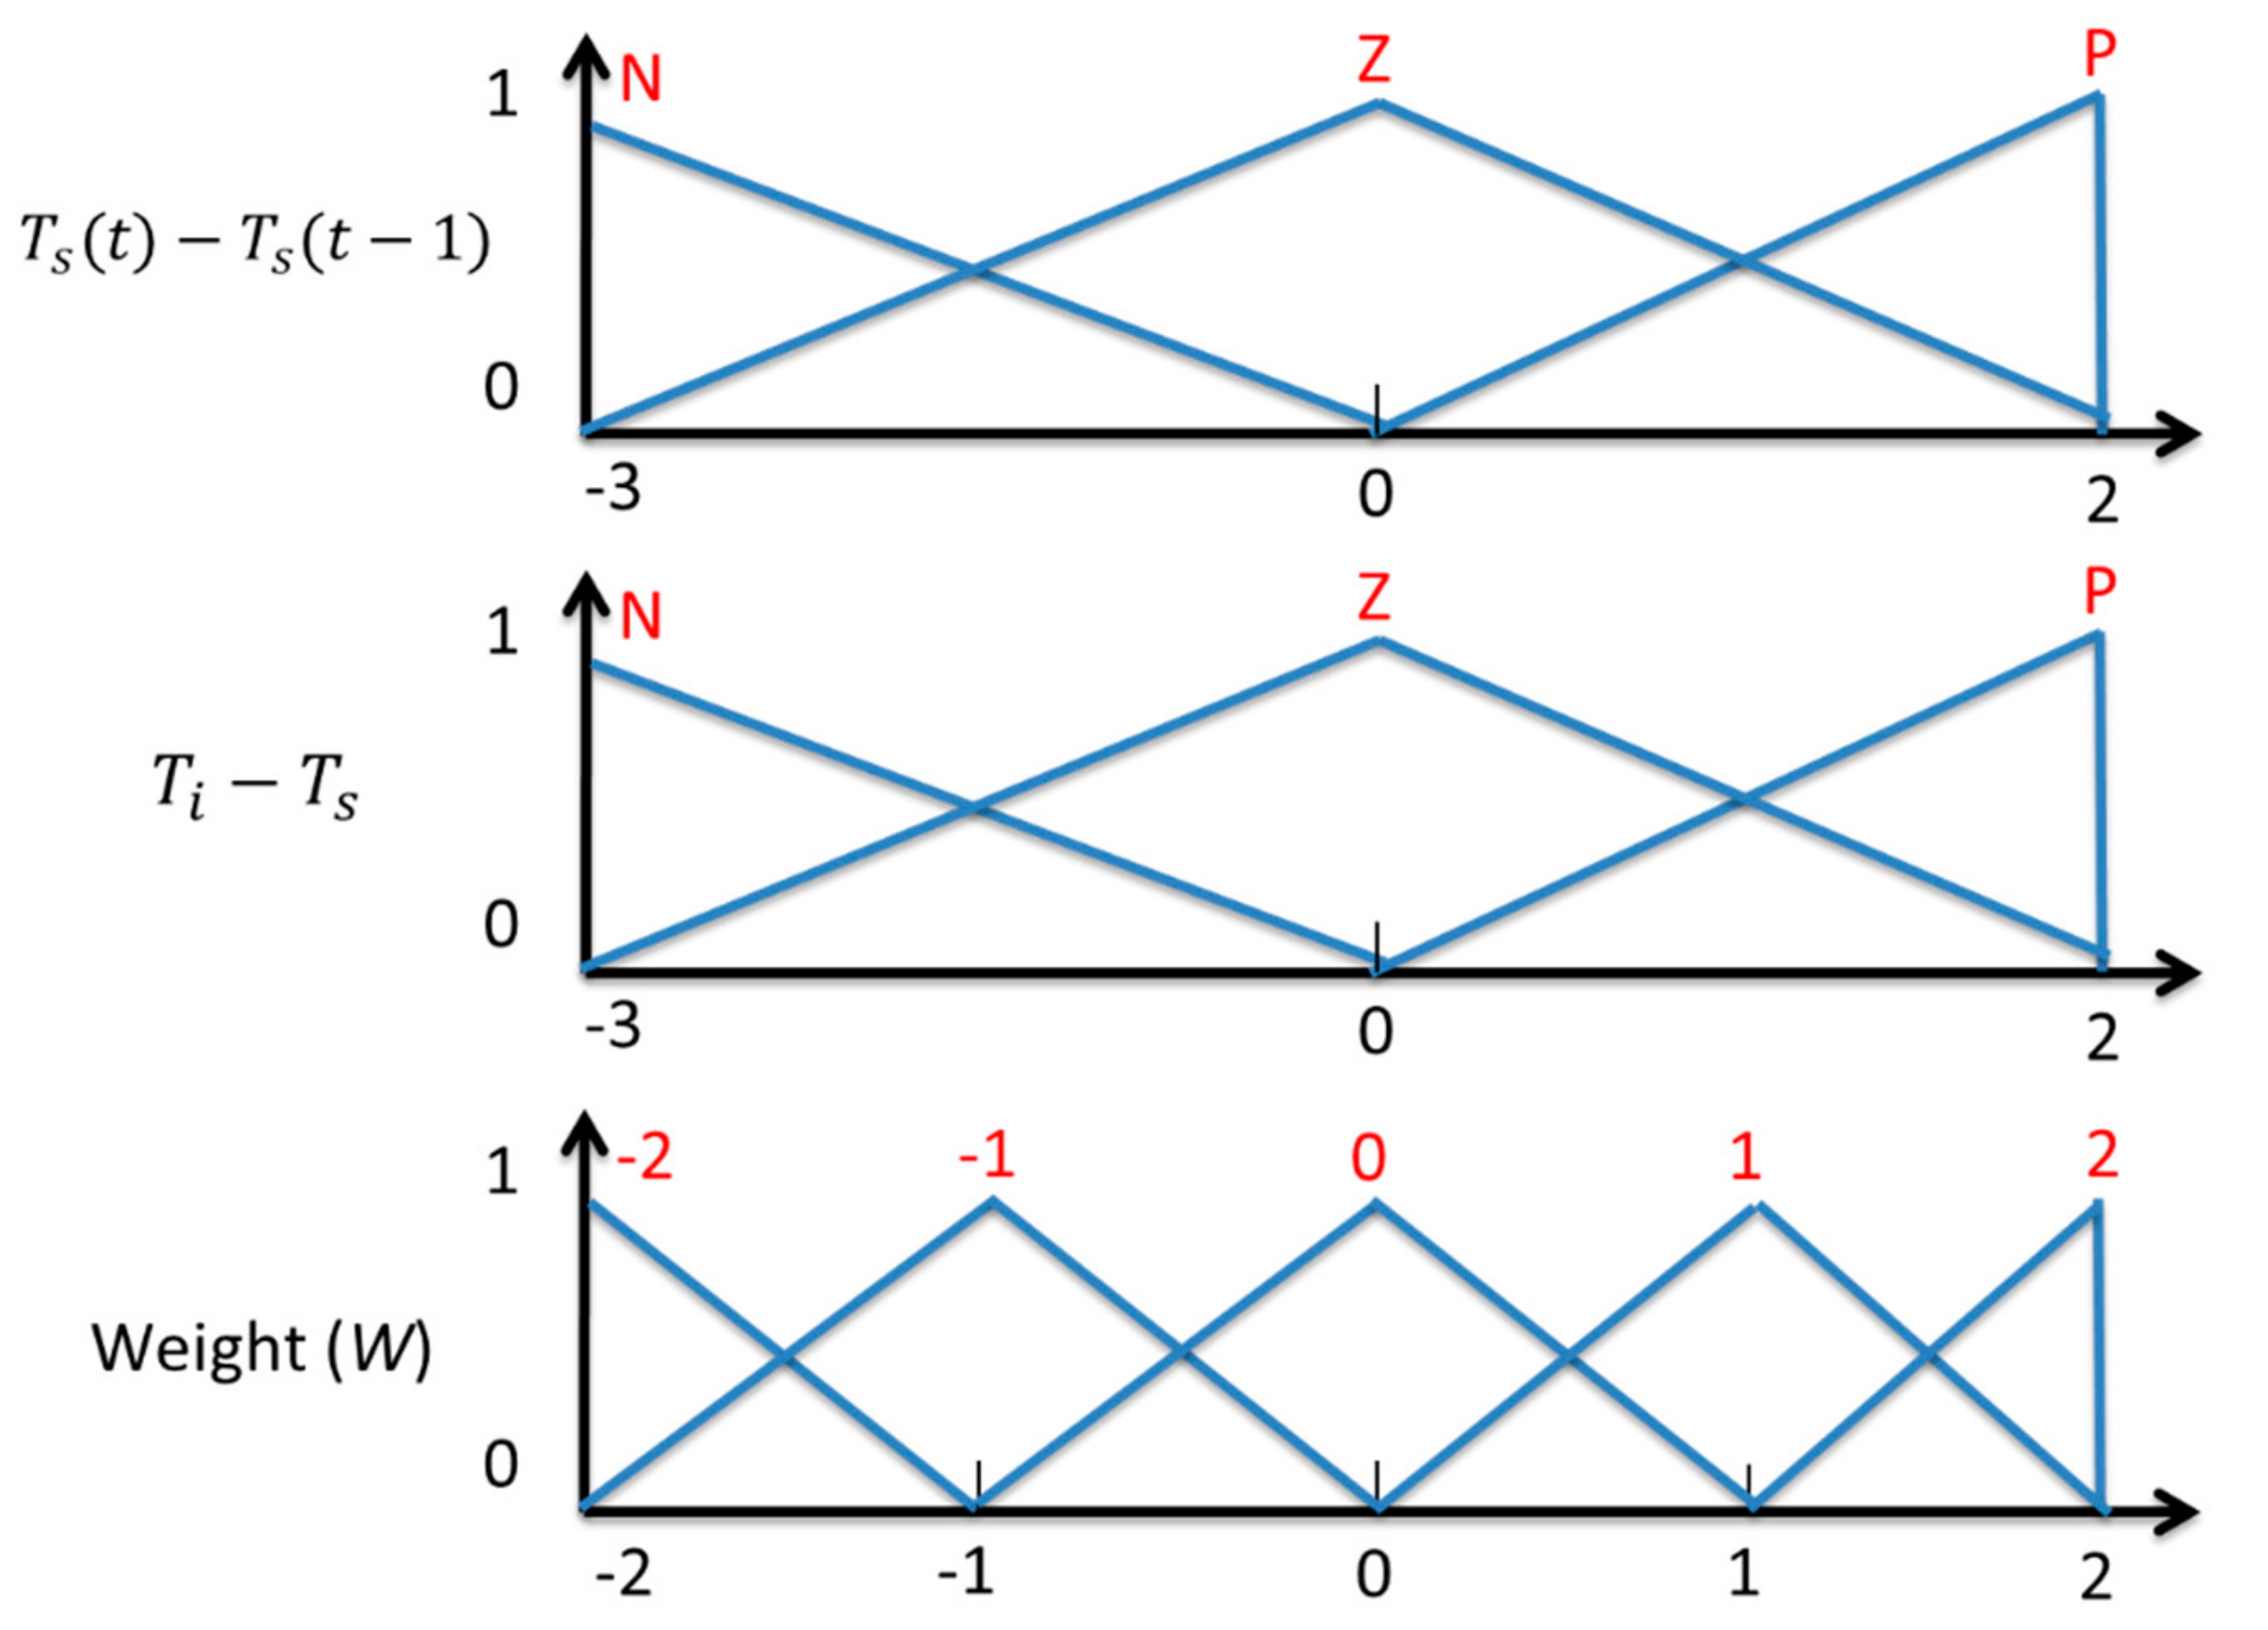
- The target temperature error (F2) is the difference between Ti and Ts, and it represents indoor cooling level, as presented in Equation (6). A negative F2 value (e.g., an actual indoor temperature of 24 °C and set temperature of 26 °C) signifies overcooling, whereas a positive F2 value signifies undercooling. Additionally, wind speed is used to determine whether the FCU is turned on or off:F2 = Ti – TsIn Equation (6), N represents a negative value and P represents a positive value.
Figure 2 shows the input and output fuzzy sets of the fuzzy controller. Table 1 presents the fuzzy rules applied by the system for weight derivation. A W value of 2 means insufficient RT from the chilled water system, indicating a warm indoor environment. By contrast, a W value of −2 means excessive RT from the chilled water system, indicating a cold indoor environment.
In the proposed method, the minimum inference engine and center of gravity defuzzification are used to calculate the comfort weight per time unit W(t), which is presented as follows:
where T denotes the coverage range of sampling time t and B’ denotes the fuzzy set processed by the minimum inference engine.
2.3. Optimization Control Strategy for Single Cooling Machine of Chilled Water System
Among heuristic optimization methods, genetic algorithms are most commonly used. Such algorithms are based on the concept of gene combination in evolution theory. The mechanisms of evolution of life, namely crossover, mutation, and reproduction, are used in genetic algorithms to obtain an optimal solution to a problem. The operating procedures of a genetic algorithm are described below.
2.3.1. Coding
Each individual is randomly assigned a value of 0 or 1 to generate multiple sets of initial solutions. The decoding domains of all initial solutions must fit various design requirements (e.g., the frequency range for a water pump is between 40 and 60 Hz). The solutions are coded using a user operating model, as presented in Figure 3.
2.3.2. Fitness Value Calculation and Reproduction Mechanism
Individuals in an initial population are substituted into a target function to calculate a fitness value. The aim of the target function is to obtain the minimum total power consumption of the water system. The total power consumed by the water system is composed of the power consumed by the cooling machine, water pump, and cooling tower. The power consumed by the cooling tower and water pump can be calculated according to the operating frequency, whereas the power consumed by the cooling machine can be calculated using a multiple linear regression model. Such a model can be established by referring to various water system parameters, including chilled water input and output temperatures, chilled water flow, cooling water input and output temperatures, cooling water flow, cooling machine power consumption, water pump frequency, and outdoor temperature and humidity. Furthermore, such a model can be used to estimate the effects of control conditions in different environments on the power consumption of the cooling machines. The reproduction mechanism involves the application of roulette wheel selection, in which each feasible solution is assigned a roulette wheel slot whose area is proportional to the fitness value of the solution. Thus, a solution with a high fitness value has a high probability of being selected. A power consumption model for chilled water systems applies principal component analysis to select the most influential parameters to establish a regression model for evaluating the power consumption of such systems. Such a model is presented in Equation (8):
where a, b, c, d, e, and f represent regression parameters; Tinchi represents chilled water input temperature; Toutchi represents chilled water output temperature; Tincw represents cooling water input temperature; Toutcw represents cooling water output temperature; Tout represent outdoor temperature; and Hout represents outdoor humidity.
kWchi = a(Tinchi) − b(Toutchi) + c(Tincw) − d(Toutcw) − e(Tout) − f(Hout)
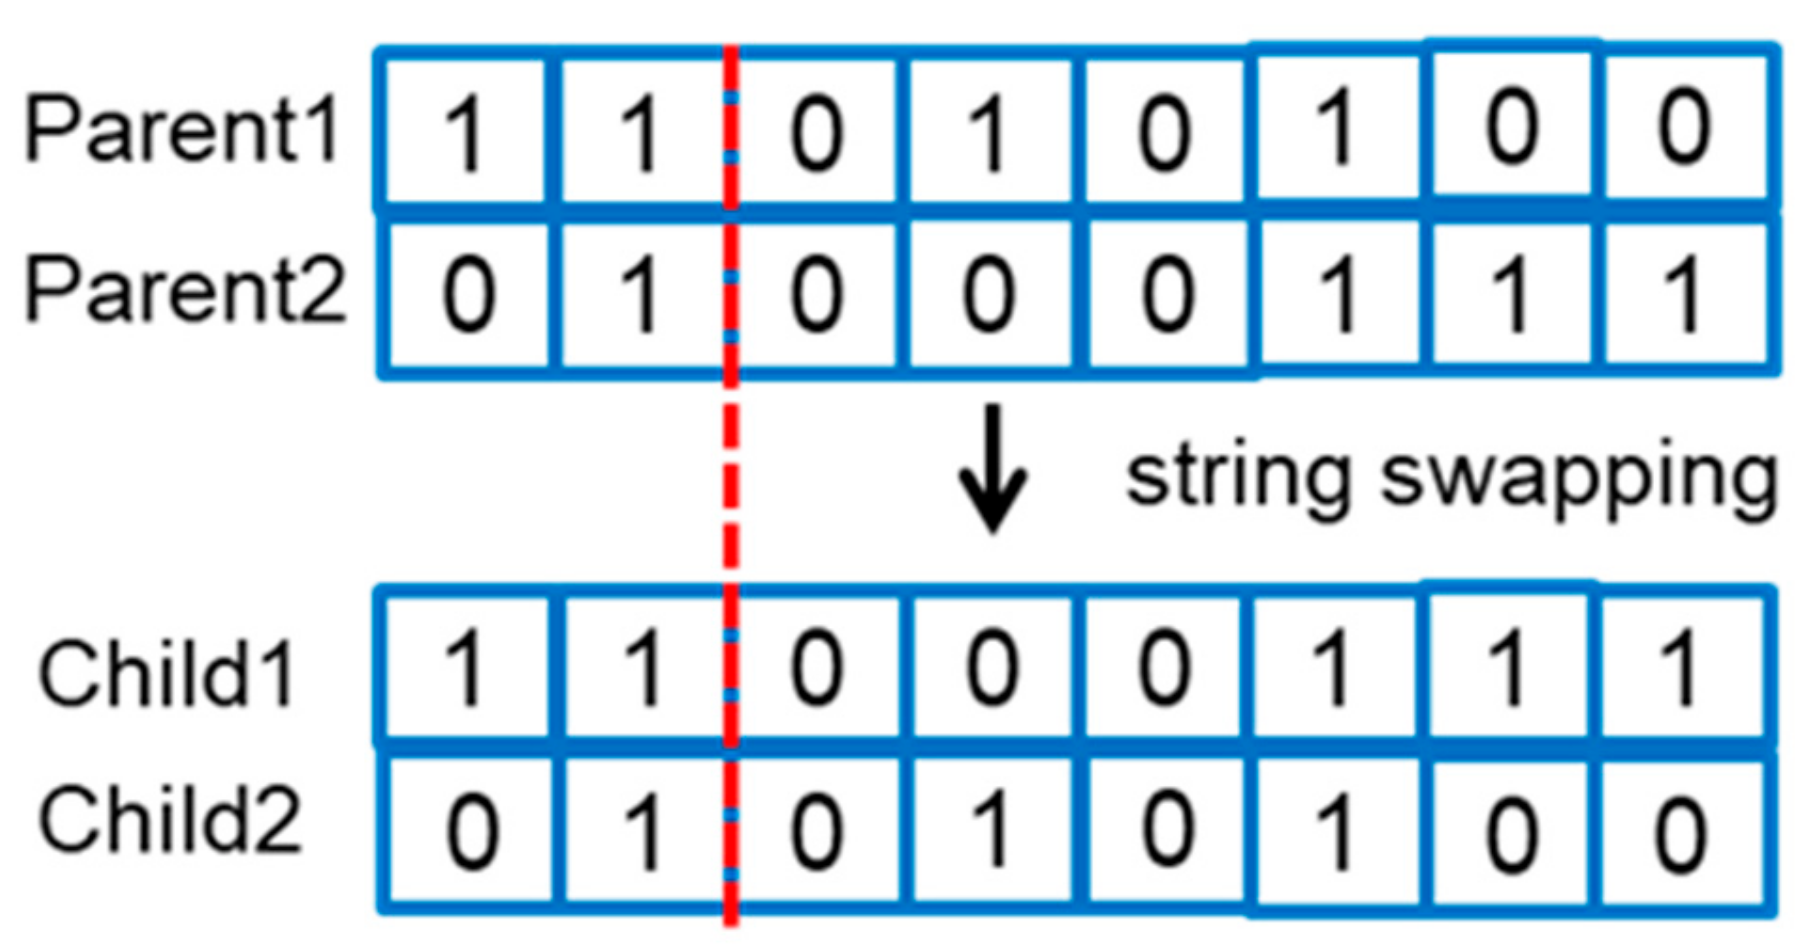
2.3.3. Crossover
Crossover entails producing a new generation of “child” solutions by recombining the genes of a reproduced individual and a “parent”. A single point is selected as the initial crossover point. Figure 4 shows the genetic algorithm crossover process: the red line indicates the genetic crossover point; for each individual, the genetic data behind the red line are replaced.
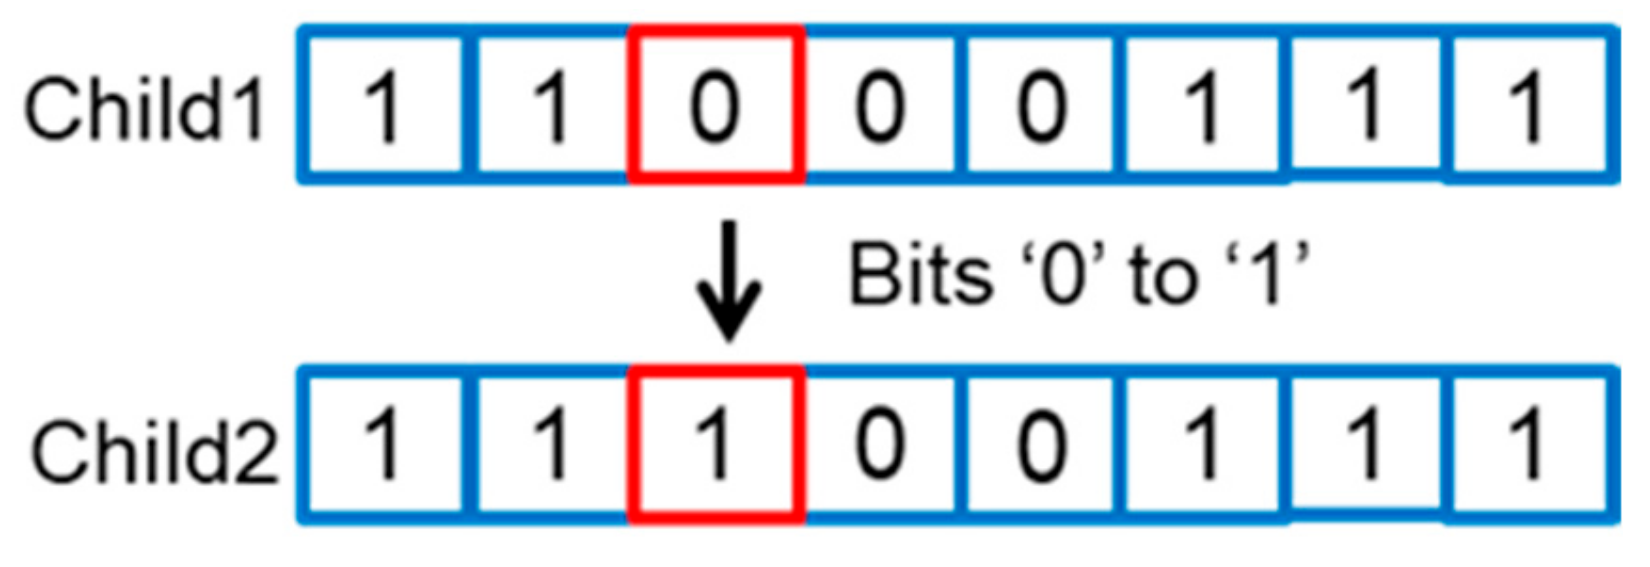
2.3.4. Mutation
Mutation entails randomly selecting a child and replacing one of its genes through a single transformation (replace 0 with 1 or replace 1 with 0). The odds of mutation are considerably lower than those of crossover. Figure 5 illustrates the mutation process.
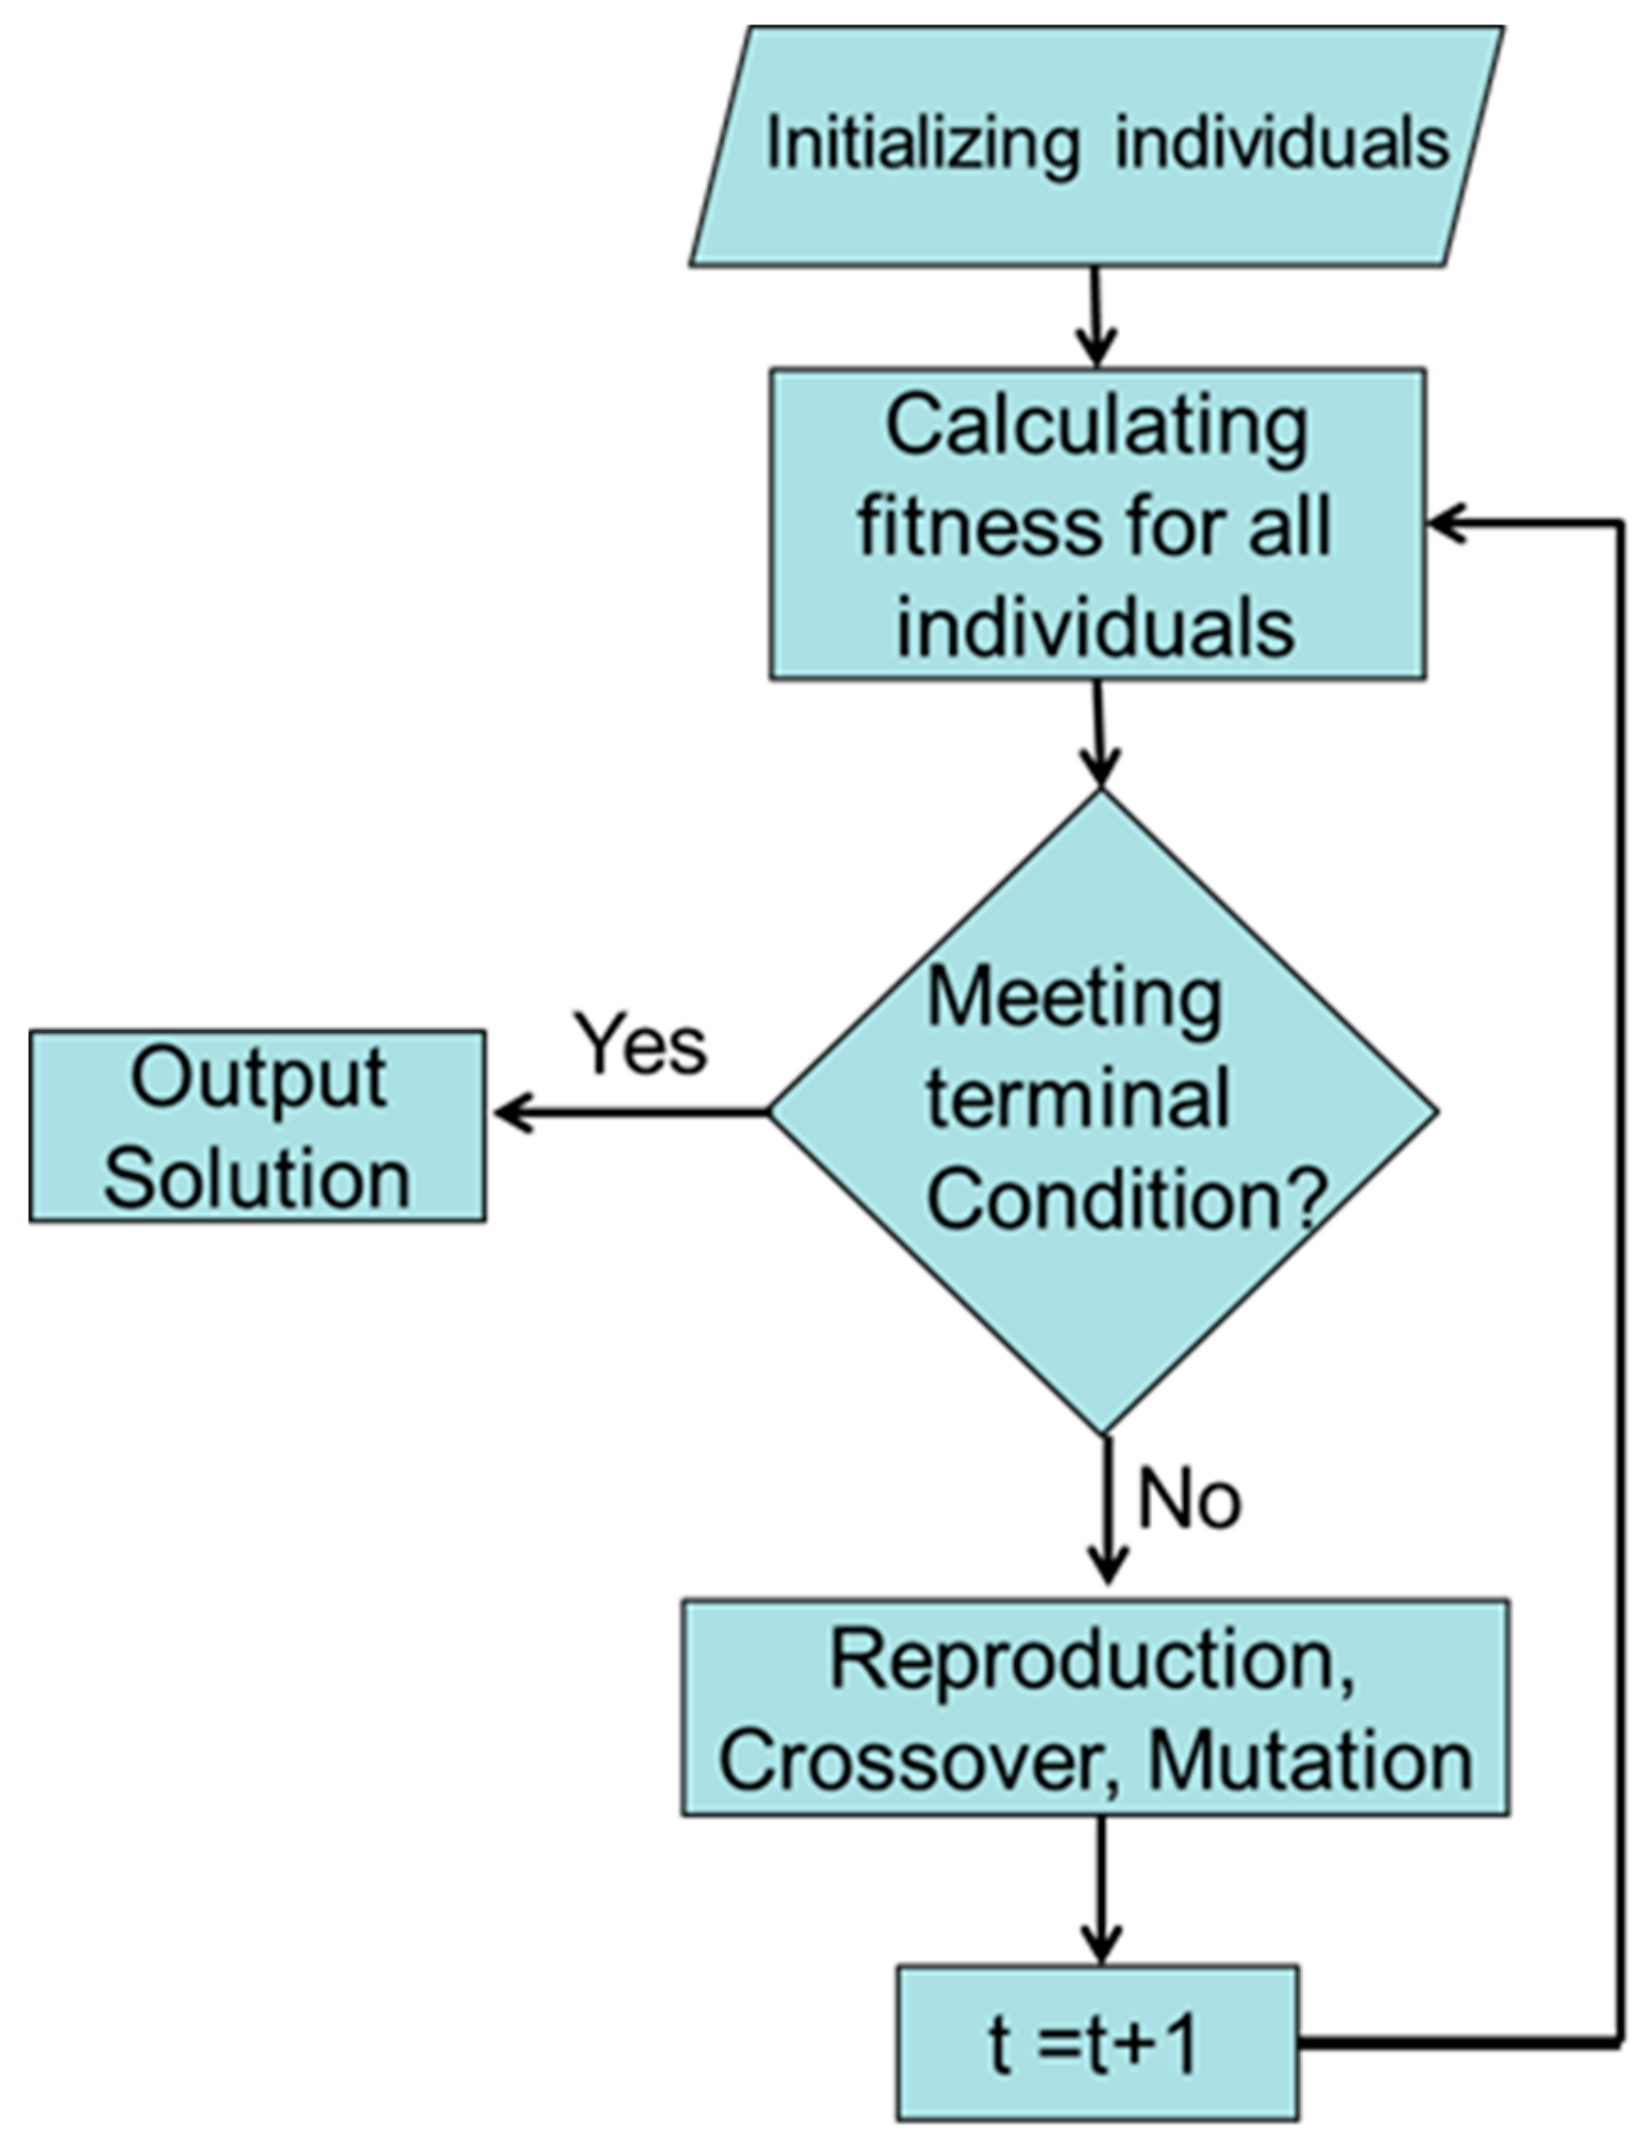
In summary, the genetic algorithm first executes (A) coding, followed by (B) fitness value calculation and reproduction, (C) crossover, and (D) mutation. A selection process is executed to choose a parent from newly reproduced child individuals, and the fitness value is recalculated to determine the suitability of the selected individual becoming a new parent. This evolution process is repeated until a termination condition is reached and an optimal solution is obtained. Examples of termination conditions are outlined as follows: (1) a limited number of generations is reached, and (2) the optimal solution is not updated for a certain number of consecutive iterations. The search process is considered to have reached convergence when either condition is met. Figure 6 shows the overall operating procedure of the genetic algorithm.
The parameters adjusted for the applied genetic algorithm are as follows: chilled water flow, cooling water flow, and chilled water output temperature. The calculated flow is converted to chilled water pump and cooling water pump frequencies by using similar principles. Finally, the chilled water temperature is set. Thus, the three parameters are controlled simultaneously.
3. Case Study
This study executed the proposed HVAC system optimization control strategy involving FCU temperature control in a university in Taipei City, Taiwan. The study focused on energy conservation optimization control for an HVAC system in the university to meet the required levels of indoor thermal comfort. The HVAC system was installed in the teaching and administration building of the university. This HVAC system was determined to comprise a chilled water system, a chilled water pump, a cooling water pump, and two cooling towers. The teaching and administration building was observed to be four stories high, with the HVAC system being operated from 08:00 to 18:00 from Mondays to Fridays; 42 FCUs supply cold air. This study used a Gateway communication system to monitor the water system operation status of the HVAC in the building. In addition, supervisory control and data acquisition (SCADA) was used for energy conservation control in the centralized HVAC system.
The SCADA functions are outlined as follows:
- 1.
- FCU data collection
Data, such as Ti, Ts, and wind speed of the 42 FCUs in the teaching and administration building, were stored in a back-end server using the Modbus transmission method.
- 2.
- Chilled water system power consumption monitoring
Digital electricity meters were installed on the chilled water system, chilled water pump, cooling pump, and cooling towers of the HVAC system. Power consumption data were wirelessly transmitted to the SCADA database.
- 3.
- Chilled water system flow and temperature monitoring
Flow meters were installed on the piping system of the chilled water system and cooling machine, and thermometers were installed on the outlet and return pipes of the chilled water system. Therefore, data concerning the flow of chilled and cooling water and the temperatures of chilled and cooling water in the outlet and return pipes of the HVAC system were transmitted to the PLC controller. Finally, the entire sensor-driven data of the HVAC system were obtained through SCADA using the Modbus transmission method.
- 4.
- Chilled water system ON/OFF and frequency change control
Frequency converters were installed on the chilled water pump, cooling water pump, and cooling tower fans of the chilled water system. Such converters can adjust the frequencies of the chilled water pump, cooling water pump, and cooling tower fans in the event of changes in heat load. Moreover, they can turn the setups on and off through automatic scheduling.
- 5.
- FCU temperature control
The FCU temperature control point in the teaching and administration building enabled automatically setting the indoor temperature according to dynamic FCU temperature settings. Such control was achieved by transmitting temperature settings through SCADA.
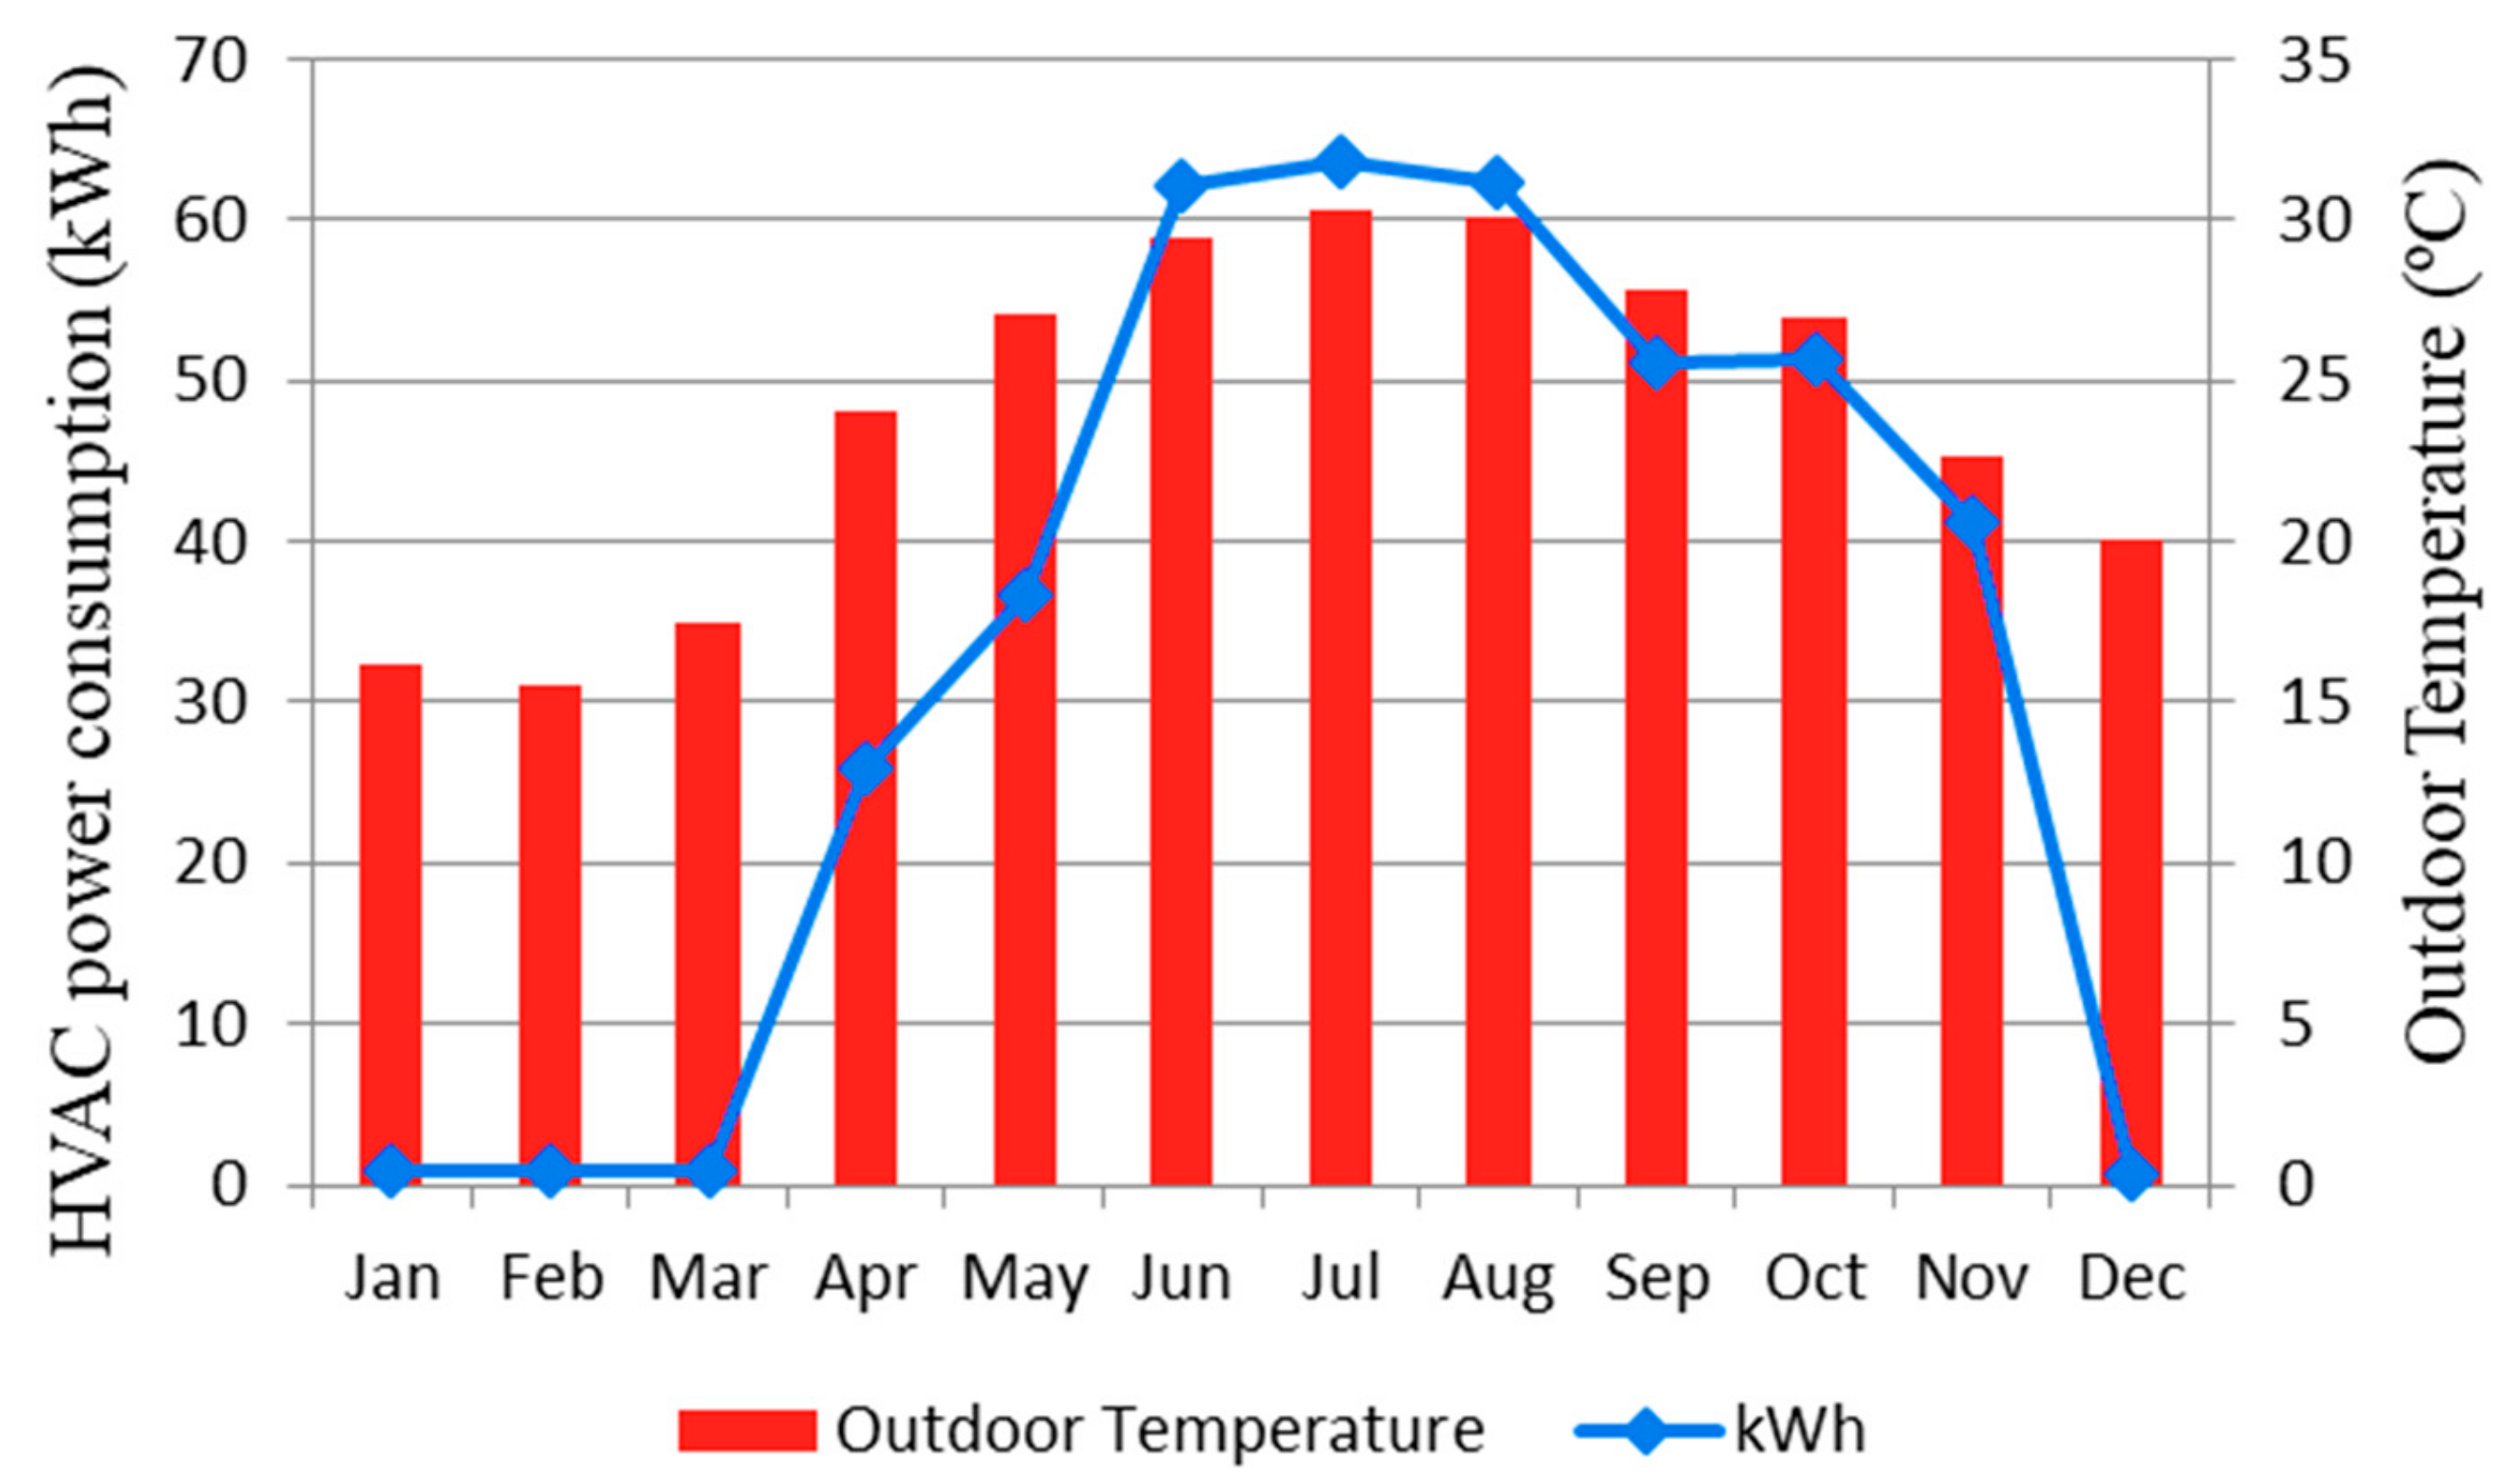
The HVAC system in the aforementioned building was operated at full load (i.e., 60 Hz) in 2016. The annual mean power consumption of the chilled water system was 33.1 kWh. During the summer (i.e., June, July, and August) of that year—characterized by high power consumption—the monthly mean power consumption of the chilled water system was 62.7 kWh. Figure 7 shows statistics of the annual outdoor temperature distribution and power consumption of the HVAC system.
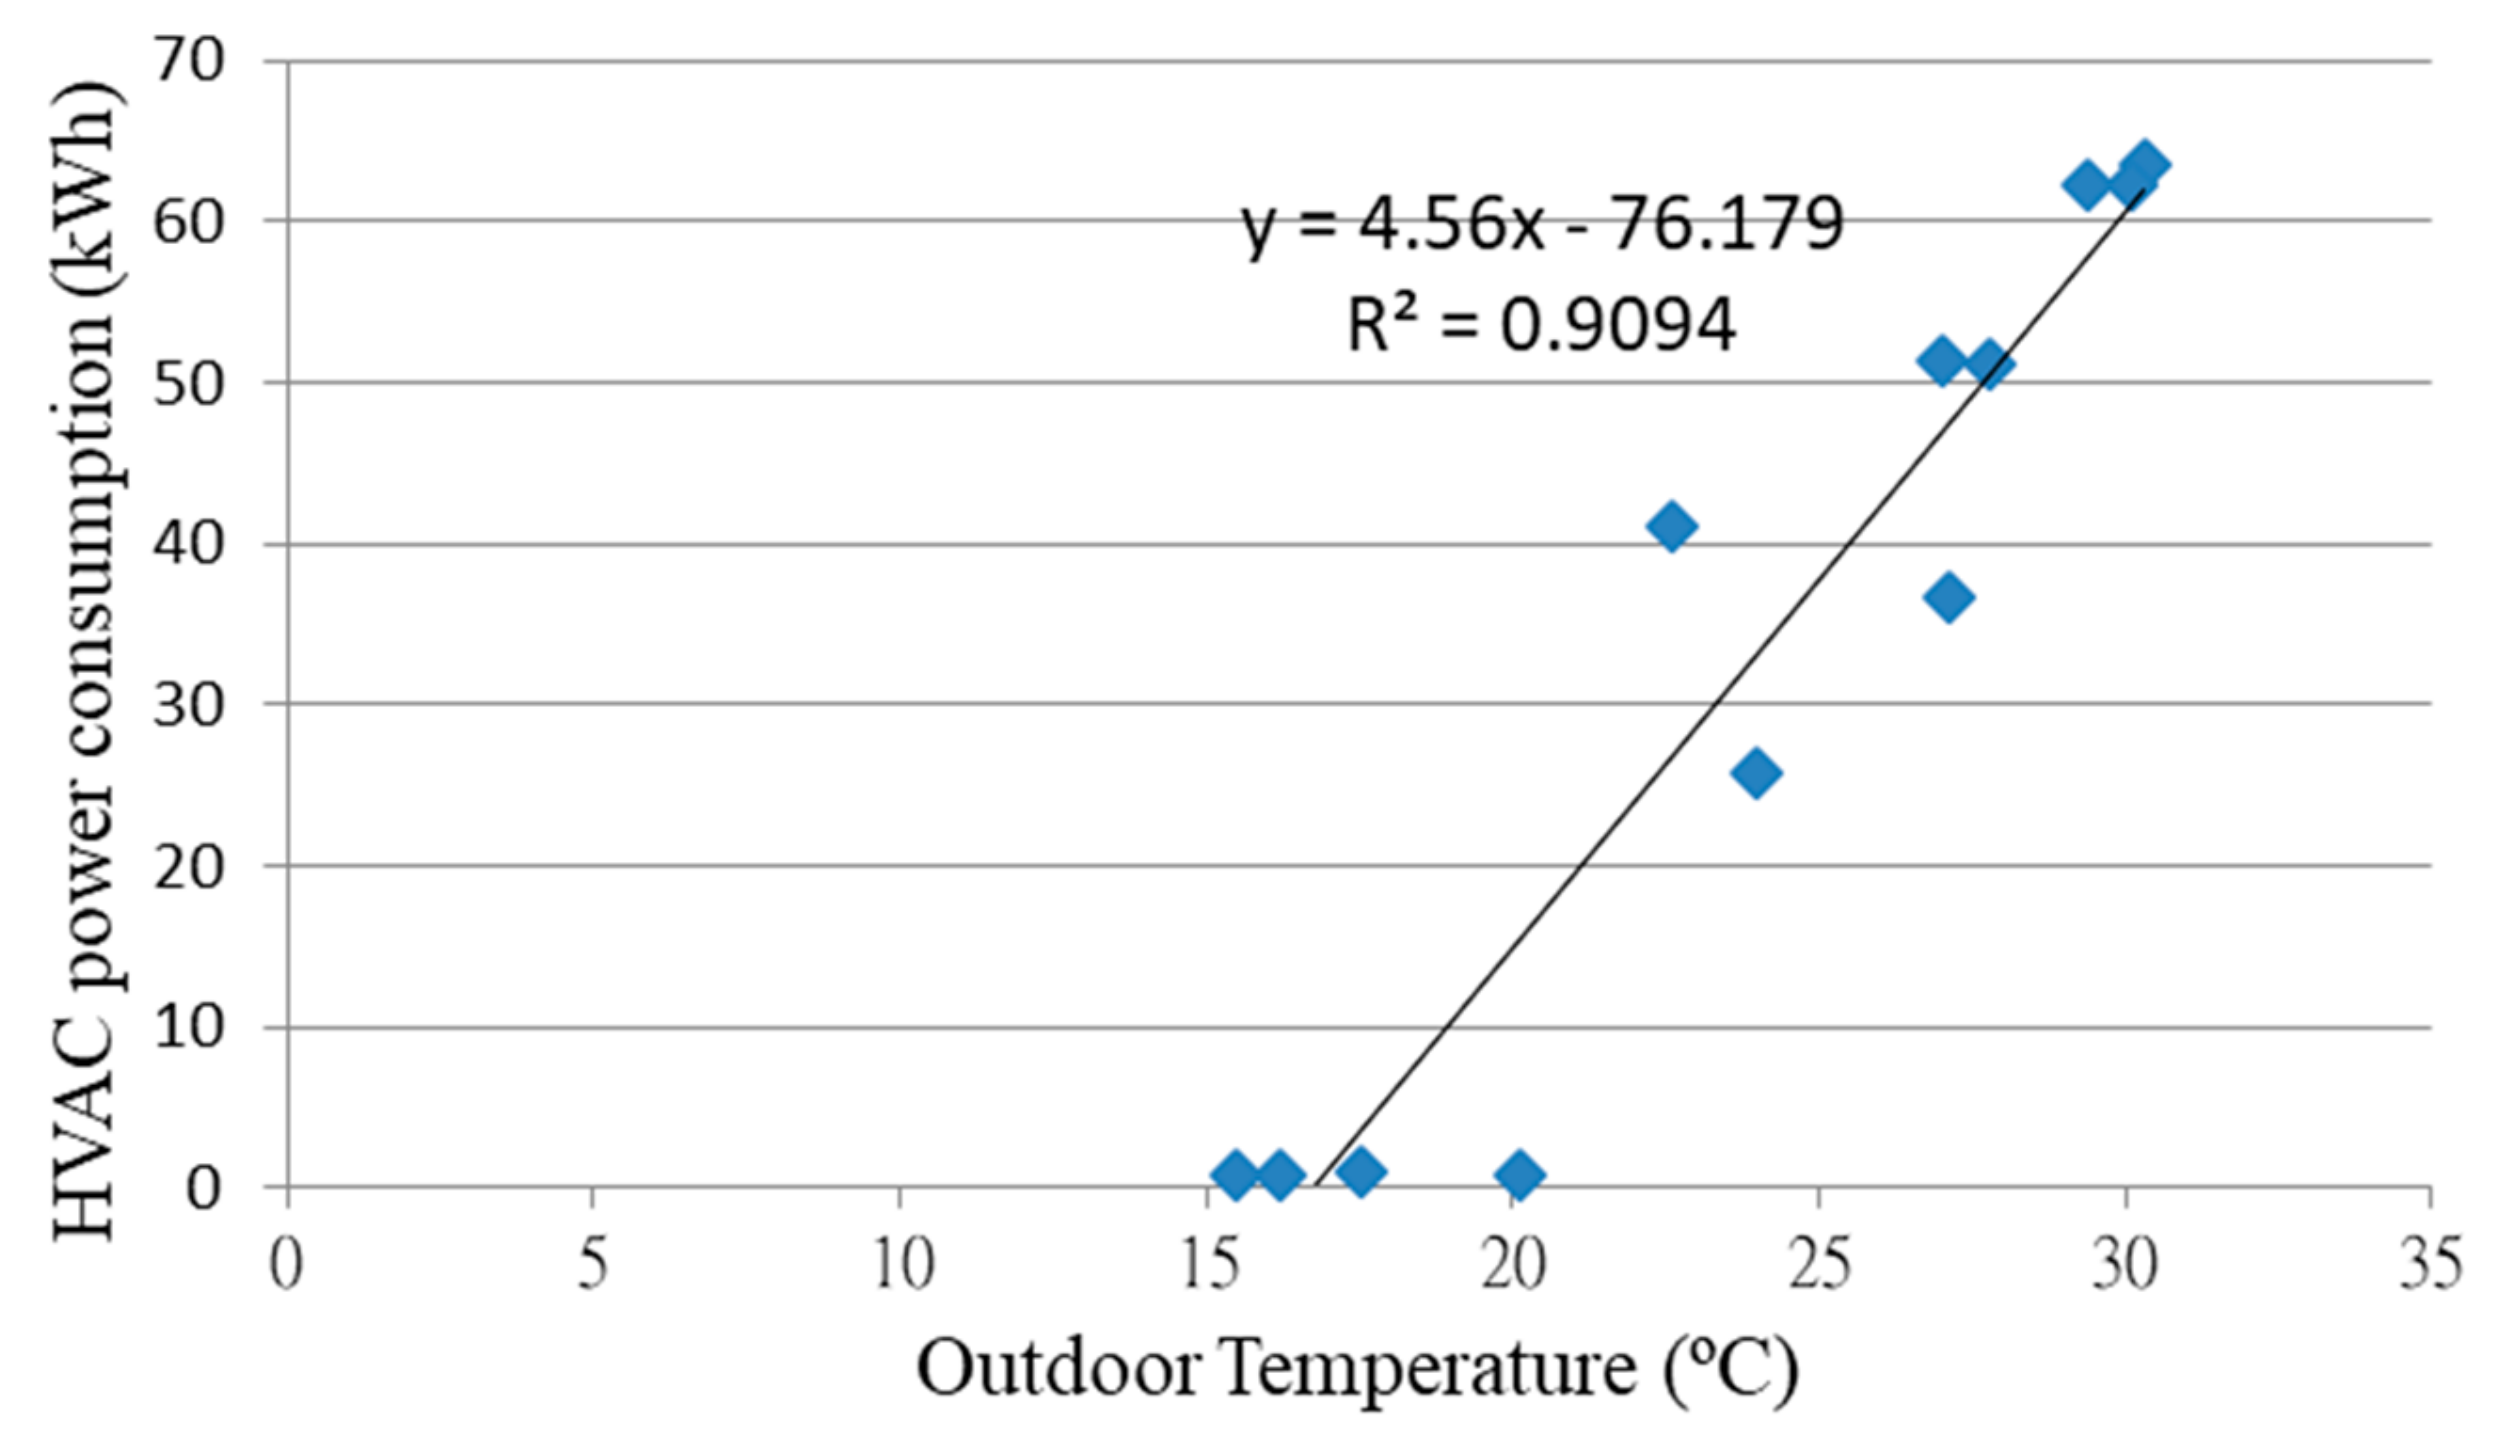
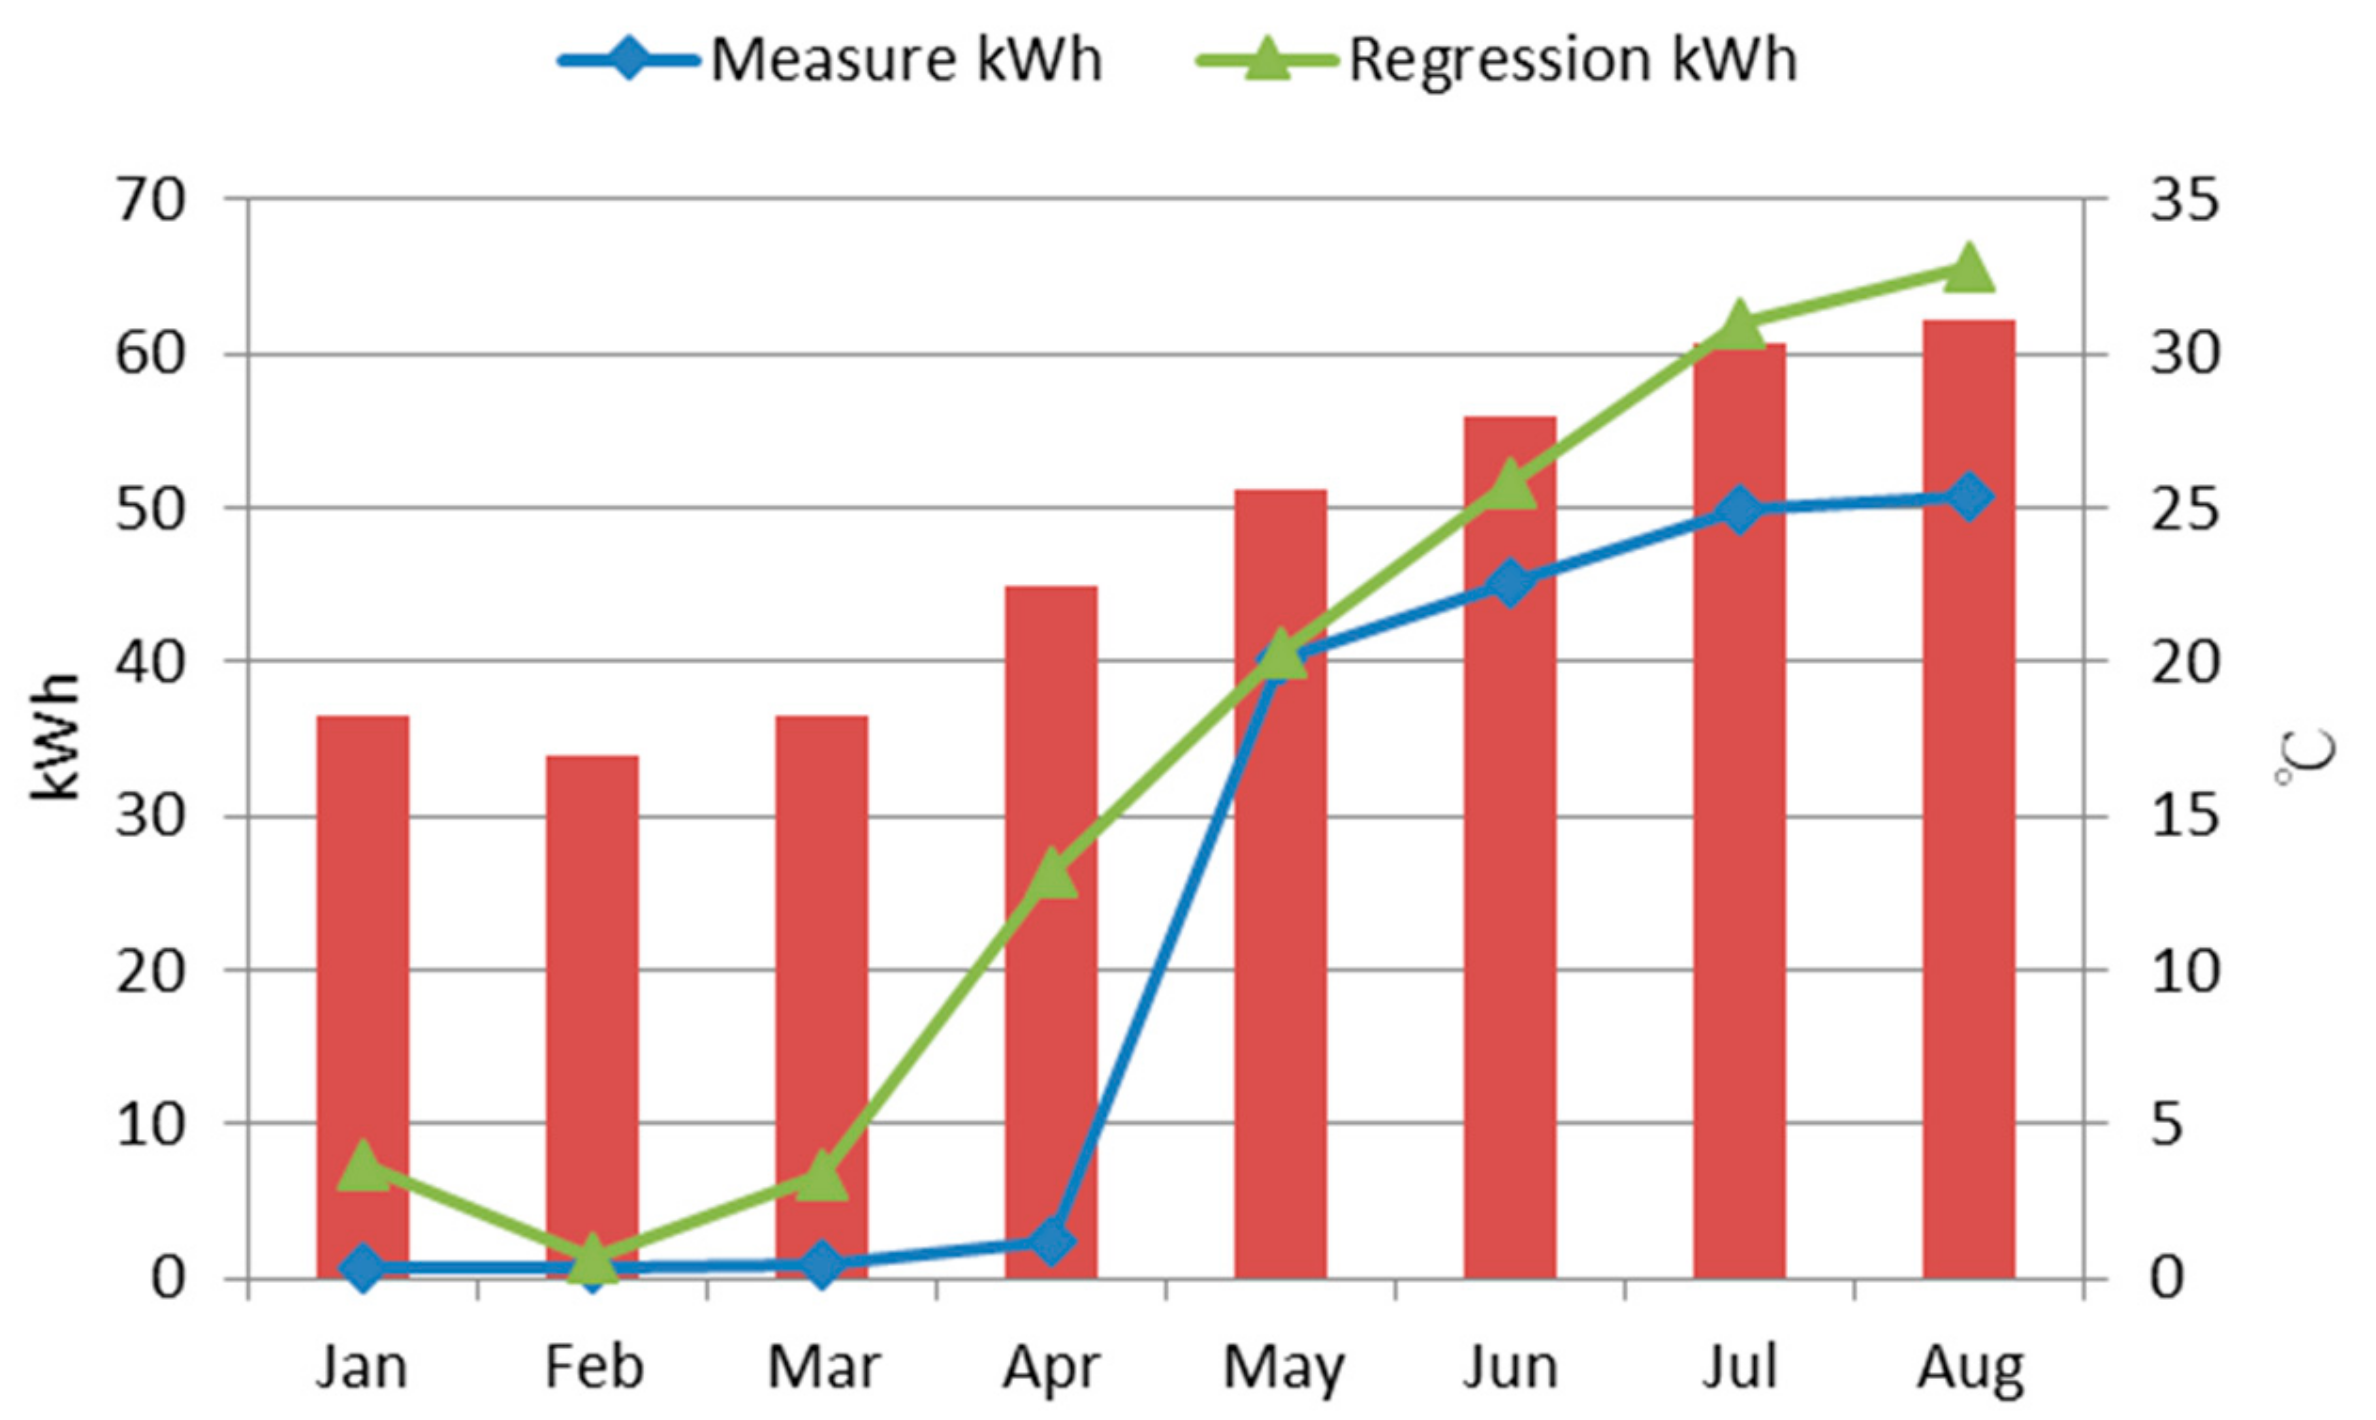
In general, outdoor temperature is a crucial factor affecting the power consumption of an HVAC system in a building. Figure 8 illustrates a regression model of the outdoor temperature and power consumption of the chilled water system in 2016. The reliability of this regression model was determined to be 90.9%. As shown in this figure, the power consumption of the chilled water system increased as the outdoor temperature increased. The regression equation for power consumption is presented as follows:
where the regression coefficient x = To.
kWh = 4.56x − 76.179,
This study also applied the proposed HVAC system optimization control strategy involving FCU temperature control to a single chilled water system with variable frequency from June–August 2017. This strategy was used to calculate the heat demand of the building to correct the supply of chilled water flow. Compared with the HVAC system operated at full load, the HVAC system operated at optimized settings provided by the proposed strategy achieved maximum energy conservation in August, saving 54.9% of energy. The maximum efficiency (in kW/RT) of the chilled water system was 15.6%. Table 2, Table 3 and Table 4 present comparisons of the performance of the HVAC system operated at full load with that of the system operated at the optimized load in terms of power consumption, RT produced, and chilled water system efficiency in summer (i.e., from June to August).
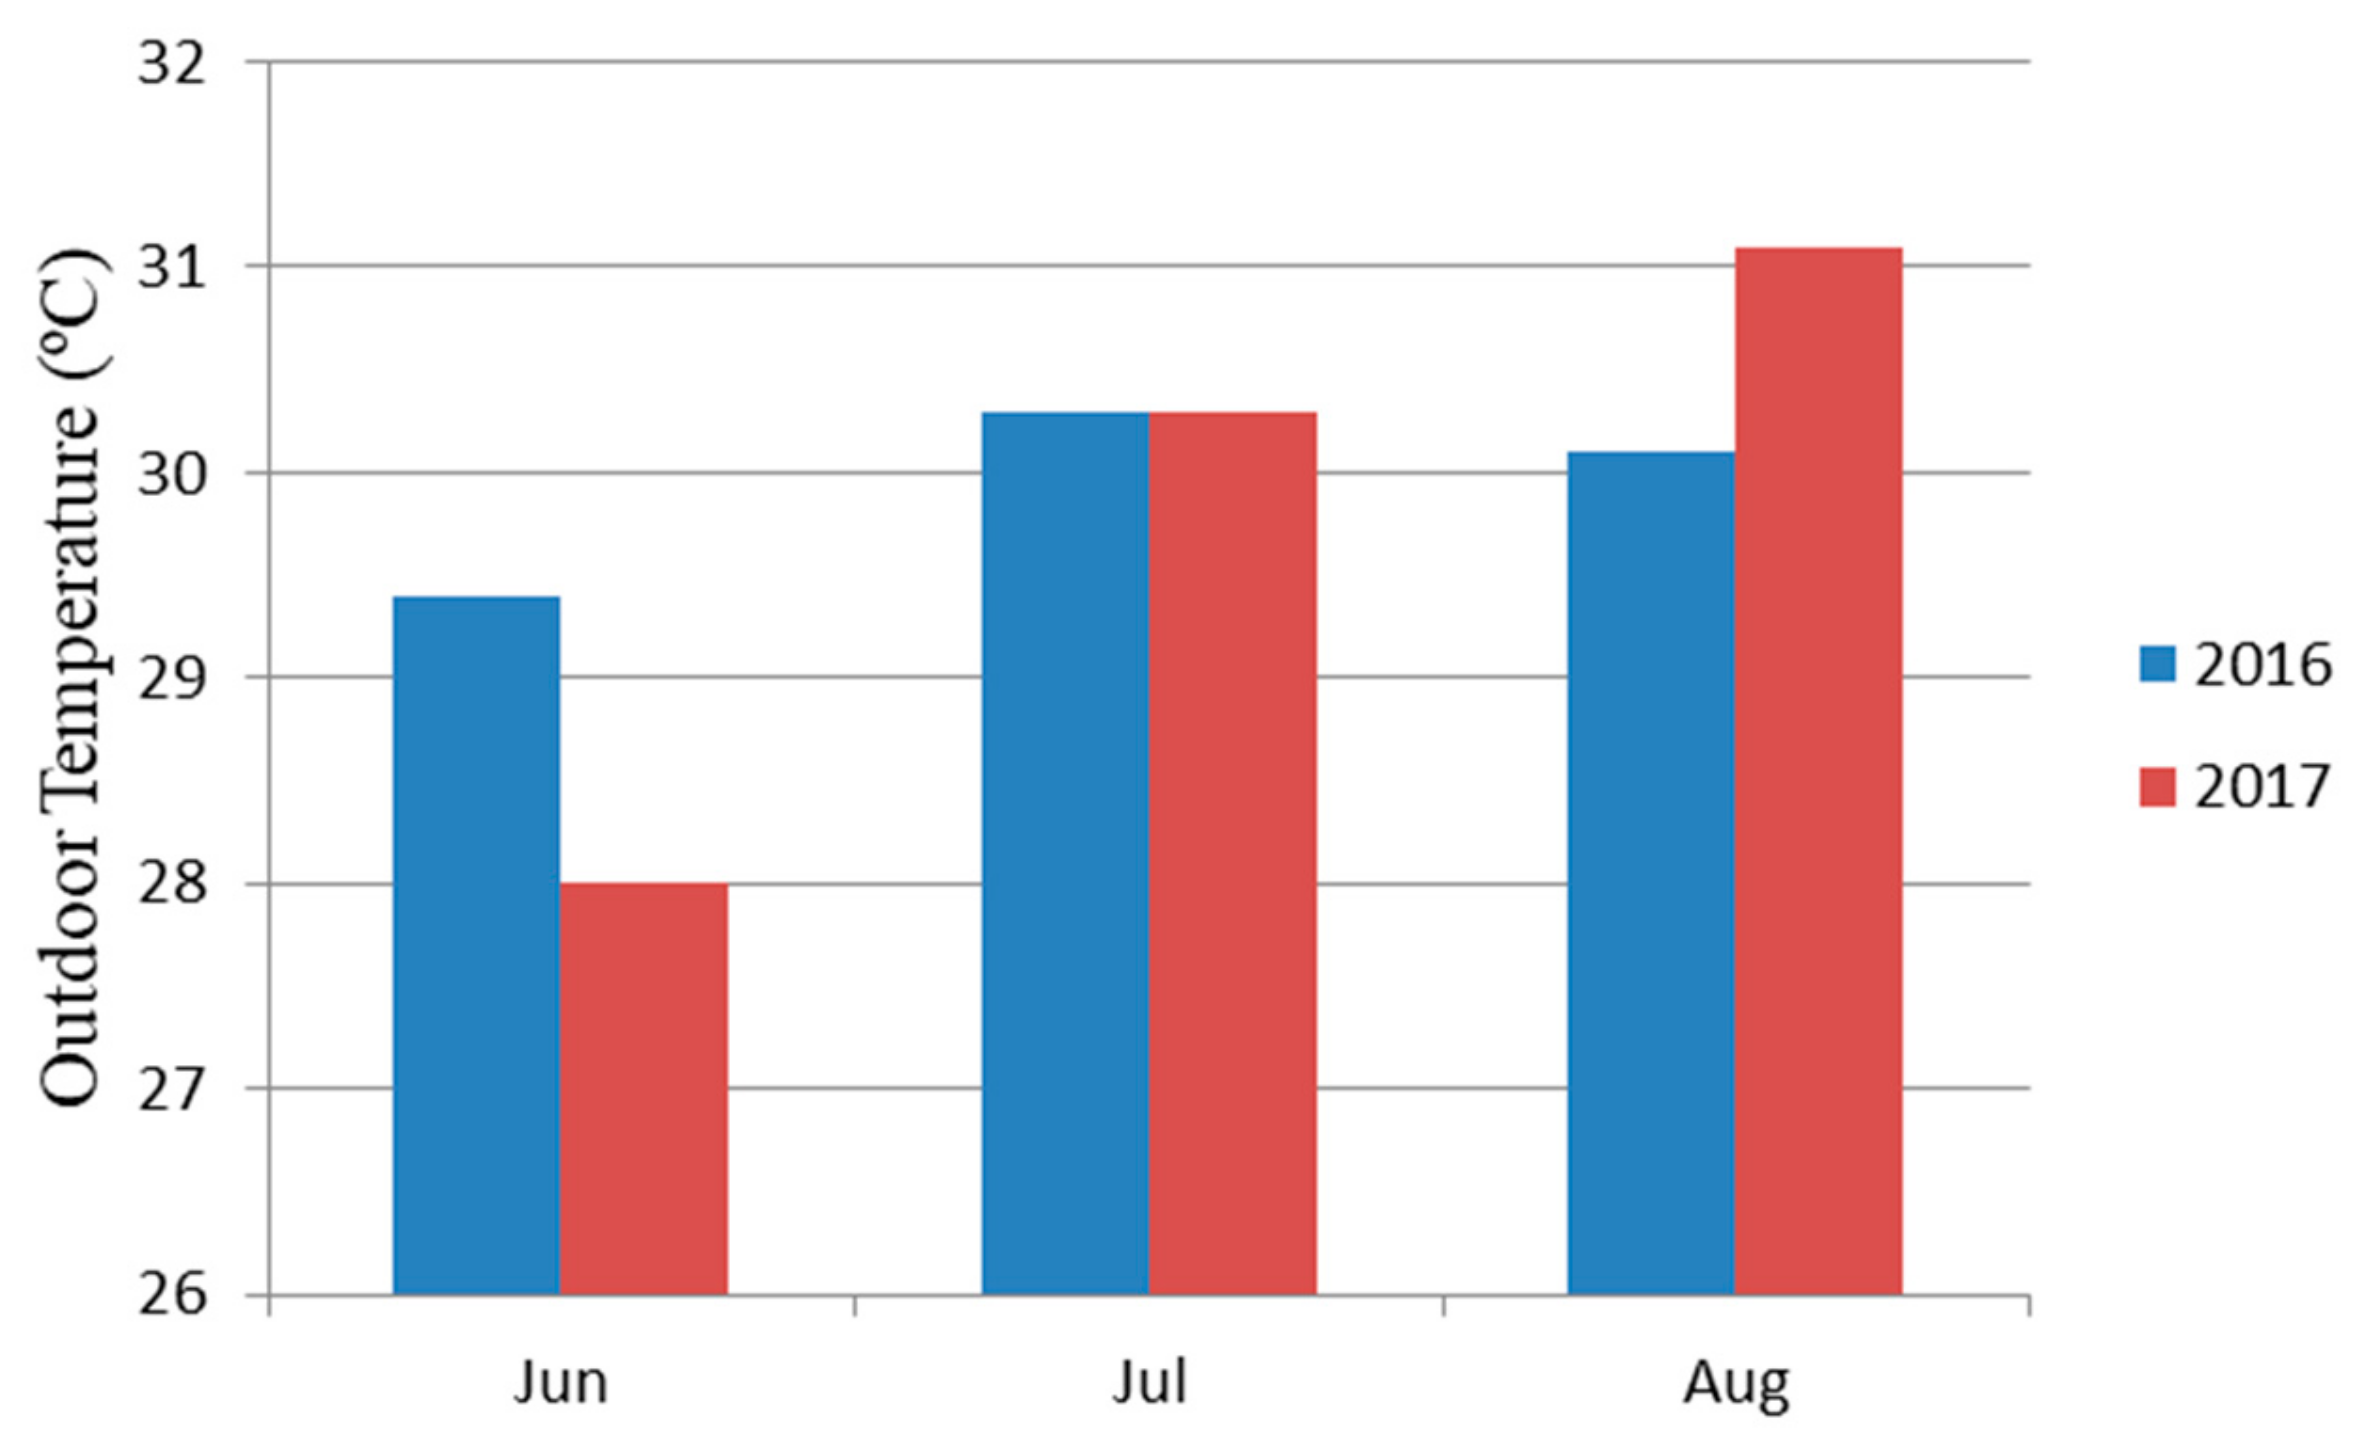
Figure 9 shows a comparison of outdoor temperatures in 2016 with those in 2017. To understand the energy conservation engendered by the proposed strategy, the outdoor temperatures in 2017 were substituted into Equation (9)—the regression model for calculating the power consumption of a chilled water system—to determine the energy conservation effectiveness associated with various outdoor temperatures. The actual power consumption engendered by the proposed strategy was compared with the baseline power consumption calculated using the regression equation. The comparison revealed a maximum energy conservation of 65.6% (Figure 10); the energy conservation increased when outdoor temperature increased. Therefore, the proposed strategy can achieve energy conservation.
4. Conclusions
This study proposes an HVAC system optimization control strategy involving FCU temperature control. This strategy involves three main techniques: dynamic FCU temperature setting, indoor heat demand conversion, energy consumption optimization control strategy for a single chiller unit of HVAC systems. The algorithm for dynamic FCU temperature setting estimates a comfortable indoor temperature according to outdoor and sensed indoor temperatures, and automatically adjust the difference between the indoor comfort temperature (Tc) and the indoor sensing temperature (Ti) every 30 minutes, and achieve the indoor comfort temperature (Tc) within the indoor comfortable range (23–26 °C). The difference in temperature is derived and then converted into an RT for a HVAC system by using fuzzy rules and weight rules on the basis of the change the temperature and wind speed of the FCU by the user. The derived RT is considered the actual cooling air demand of an area for the chilled water system. A genetic algorithm is then applied to adjust chilled water and cooling water flow and calculate the operating frequency of the pumps that are required to meet the cooling air demand and stipulated minimal energy consumption. The effectiveness of the proposed strategy was verified in a field experiment. The study compared the operating status levels of the chilled water pump, cooling water pump, and cooling tower fans in the chosen building during the summer periods (i.e., from June–August) of 2016 and 2017. In 2016, the machines operated at full load, whereas in 2017, the proposed strategy was applied, which enabled the adjustment of the operating frequencies of chilled water system and cooling water pump and airflow of the cooling tower fans of the HVAC system to reduce unnecessary power consumption. Therefore, compared with that in 2016, the actual total power consumption of the HVAC water system in 2017 was reduced by 39.7%, on average. The operating efficiency of the chilled water system was enhanced to 0.68 from 0.8 observed when the system operated at full load. Energy consumption per RT was reduced by approximately 15.6%. According to the baseline energy consumption obtained by a regression model used to calculate the power consumption of a chilled water system, the proposed strategy can achieve energy conservation when temperatures increase.
Author Contributions
Formal analysis, H.-Y.L.; Methodology, C.-M.L.; Software, K.-Y.T.; Validation, S.-F.L.
Funding
Bureau of Energy, Ministry of Economic Affairs, Taiwan: 108-E0203.
Acknowledgments
We appreciate National Chiao Tung University for their generous assistance of computing time and Bureau of Energy, Ministry of Economic Affairs, R.O.C. (Taiwan) for the finical support.
Conflicts of Interest
The authors declare no conflict of interest.
References
- Pe’rez-Lombard, L.; Ortiz, J.; Pout, C. A review on buildings energy consumption information. Energy Build. 2008, 40, 394–398. [Google Scholar] [CrossRef]
- Mathews, E.H.; Botha, C.P.; Arndt, D.C.; Malan, A. HVAC control strategies to enhance comfort and minimize energy usage. Energy Build. 2001, 33, 853–863. [Google Scholar] [CrossRef]
- Chow, T.T.; Zhang, G.Q.; Lin, Z.; Song, C.L. Global optimization of absorption chiller system by genetic algorithm and neural network. Energy Build. 2002, 34, 103–109. [Google Scholar] [CrossRef]
- Browne, M.W.; Bansal, P.K. Transient simulation of vapour-compression packaged liquid chillers. Int. J. Refrig. 2002, 25, 597–610. [Google Scholar] [CrossRef]
- Yu, F.W.; Chan, K.T. Optimization of water-cooled chiller system with load-based speed control. Appl. Energy 2008, 85, 931–950. [Google Scholar] [CrossRef]
- Yoon, J.H.; Baldick, R.; Novoselac, A. Dynamic demand response controller based on real-time retail price for residential buildings. IEEE Trans. Smart Grid 2014, 5, 121–129. [Google Scholar] [CrossRef]
- Wang, Y.; Kuckelkorn, J.; Zhao, F.-Y.; Liu, D.; Kirschbaum, A.; Zhang, J.-L. Evaluation on classroom thermal comfort and energy performance of passive school by optimizing HVAC control systems. Build. Environ. 2015, 89, 86–106. [Google Scholar] [CrossRef]
- Fanger, P.O.; Toftum, J. Extension of the PMV model to non-air-conditioned buildings in warm climates. Energy Build. 2002, 34, 533–536. [Google Scholar] [CrossRef]
- Castilla, M.; Álvarez, J.D.; Normey-Rico, J.E.; Rodríguez, F. Thermal comfort control using a non-linear MPC strategy: A real case of study in a bioclimatic building. J. Process Control 2014, 24, 703–713. [Google Scholar] [CrossRef]
- Jazizadeh, F.; Ghahramani, A.; Becerik-Gerber, B.; Kichkaylo, T.; Orosz, M. User-led decentralized thermal comfort driven HVAC operations for improved efficiency in office buildings. Energy Build. 2014, 70, 398–410. [Google Scholar] [CrossRef]
- Chen, X.; Wang, Q.; Srebric, J. Model predictive control for indoor thermal comfort and energy optimization using occupant feedback. Energy Build. 2015, 102, 357–369. [Google Scholar] [CrossRef] [Green Version]
- Chen, X.; Wang, Q.; Srebric, J. Occupant feedback based model predictive control for thermal comfort and energy optimization: A chamber experimental evaluation. Appl. Energy 2016, 164, 341–351. [Google Scholar] [CrossRef]
- Oldewurtel, F.; Parisio, A.; Jones, C.N.; Gyalistras, D.; Gwerder, M.; Stauch, V.; Lehmann, B.; Morari, M. Use of model predictive control and weather forecasts for energy efficient building climate control. Energy Build. 2012, 45, 15–27. [Google Scholar] [CrossRef] [Green Version]
- Fong, K.F.; Hanby, V.I.; Chow, T.T. HVAC system optimization for energy management by evolutionary programming. Energy Build. 2006, 38, 220–231. [Google Scholar] [CrossRef]
- Lin, C.-M.; Wu, C.-Y.; Tseng, K.-Y.; Ku, C.-C.; Lin, S.-F. Applying two-stage differential evolution for energy saving in optimal chiller loading. Energies 2019, 12, 622. [Google Scholar] [CrossRef]
- ASHRAE 55. Thermal Environmental Conditions for Human Occupancy; American Society of Heating, Refrigerating, and Air-Conditioning Engineers, Inc.: Atlanta, GA, USA, 2017. [Google Scholar]
- Brager, G.S.; de Dear, R.J. Thermal adaptation in the built environment: A liter-ature review. Energy Build. 1998, 27, 83–96. [Google Scholar] [CrossRef]
- Brager, G.S.; de Dear, R.J. Developing an adaptive model of thermal comfort and preference. ASHRAE Trans. 1998, 104, 145–167. [Google Scholar]
- Humphreys, M.A.; Nicol, J.F. Understanding the adaptive approach to thermal comfort. ASHRAE Trans. 1998, 104, 991–1000. [Google Scholar]
- De Dear, R.J.; Akimoto, T.; Arens, E.A.; Brager, G.; Candido, C.; Cheong, K.W.D.; Li, B.; Nishihara, N.; Sekhar, S.C.; Tanabe, S.; et al. Progress inthermal comfort research over the last twenty years. Indoor Air 2013, 23, 442–461. [Google Scholar] [CrossRef]
- Alfano, F.R.d.; Olesen, B.W.; Palella, B.I. Povl Ole Fanger’s Impact Ten Years Later. Energy and Buildings 2017, 152, 243–249. [Google Scholar] [CrossRef]
- Uipiani, G.; Borgognoni, M.; Romagnoli, A.; di Perna, C. Comparing the performance of on/off, PID and fuzzy controllers applied to the heating system of an energy-efficient building. Energy Build. 2016, 116, 1–17. [Google Scholar] [CrossRef]
- Kampelis, N.; Ferrante, A.; Kolokotsa, D.; Gobakis, K.; Standardi, L.; Cristalli, C. Thermal comfort evaluation in HVAC Demand Response control. Energy Procedia 2017, 134, 675–682. [Google Scholar] [CrossRef]
- Daghigh, R.; Adam, N.M.; Sahari, B.; Yousef, B.A.A. Thermal Comfort Study and Ventilation Evaluation of an Office. Adv. Mech. Eng. Its Appl. 2012, 3, 278–283. [Google Scholar]
Figure 1.
Framework of system for deriving comfort weight.

Figure 2.
Fuzzy controller.

Figure 3.
Individual gene coding in genetic algorithm.

Figure 4.
Producing child generations through crossover.

Figure 5.
Mutation process of a child.

Figure 6.
Genetic algorithm flowchart.

Figure 7.
Outdoor temperature and HVAC system power consumption.

Figure 8.
Energy consumption regression model of the chilled water system.

Figure 9.
Outdoor temperature distribution.

Figure 10.
Energy consumption simulation of HVAC system regression model.


Table 1.
Fuzzy rule.
| F1 | N | Z | P | |
|---|---|---|---|---|
| F2 | ||||
| N | 0 | −1 | −2 | |
| Z | 1 | 0 | −1 | |
| P | 2 | 1 | 0 | |
Table 2.
Data of HVAC system operated at full load.
| Full-Load Operation | June | July | August |
|---|---|---|---|
| RT | 176,550.7 | 378,983.8 | 413,532.6 |
| kW | 154,125 | 331,933.6 | 289,985.9 |
| kW/RT | 0.872979 | 0.875852 | 0.701241 |
Table 3.
System optimization control strategy involving FCU temperature information.
| Optimal Control Operation | June | July | August |
|---|---|---|---|
| RT | 253,698.9 | 247,613.1 | 191,023.2 |
| kW | 170,202.6 | 166,792.5 | 130,912.7 |
| kW/RT | 0.670885 | 0.673601 | 0.685324 |
Table 4.
Energy consumption comparison.
| Comparison | RT | kW | kW/RT |
|---|---|---|---|
| Full load | 969,067.1 | 776,044.5 | 0.800816 |
| Optimization | 692,335.1 | 467,907.9 | 0.67584 |
| Energy conservation percentage | 28.56% | 39.71% | 15.61% |
© 2019 by the authors. Licensee MDPI, Basel, Switzerland. This article is an open access article distributed under the terms and conditions of the Creative Commons Attribution (CC BY) license (http://creativecommons.org/licenses/by/4.0/).
Share and Cite
MDPI and ACS Style
Lin, C.-M.; Liu, H.-Y.; Tseng, K.-Y.; Lin, S.-F. Heating, Ventilation, and Air Conditioning System Optimization Control Strategy Involving Fan Coil Unit Temperature Control. Appl. Sci. 2019, 9, 2391. https://doi.org/10.3390/app9112391
AMA Style
Lin C-M, Liu H-Y, Tseng K-Y, Lin S-F. Heating, Ventilation, and Air Conditioning System Optimization Control Strategy Involving Fan Coil Unit Temperature Control. Applied Sciences. 2019; 9(11):2391. https://doi.org/10.3390/app9112391
Chicago/Turabian StyleLin, Chang-Ming, Hsin-Yu Liu, Ko-Ying Tseng, and Sheng-Fuu Lin. 2019. "Heating, Ventilation, and Air Conditioning System Optimization Control Strategy Involving Fan Coil Unit Temperature Control" Applied Sciences 9, no. 11: 2391. https://doi.org/10.3390/app9112391
Note that from the first issue of 2016, this journal uses article numbers instead of page numbers. See further details here.