Identification and Analysis of Exosomes by Surface-Enhanced Raman Spectroscopy


Abstract
:
1. Introduction
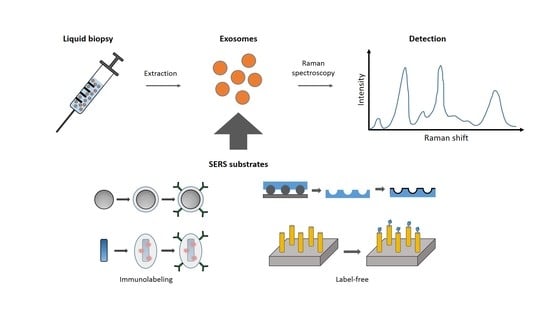
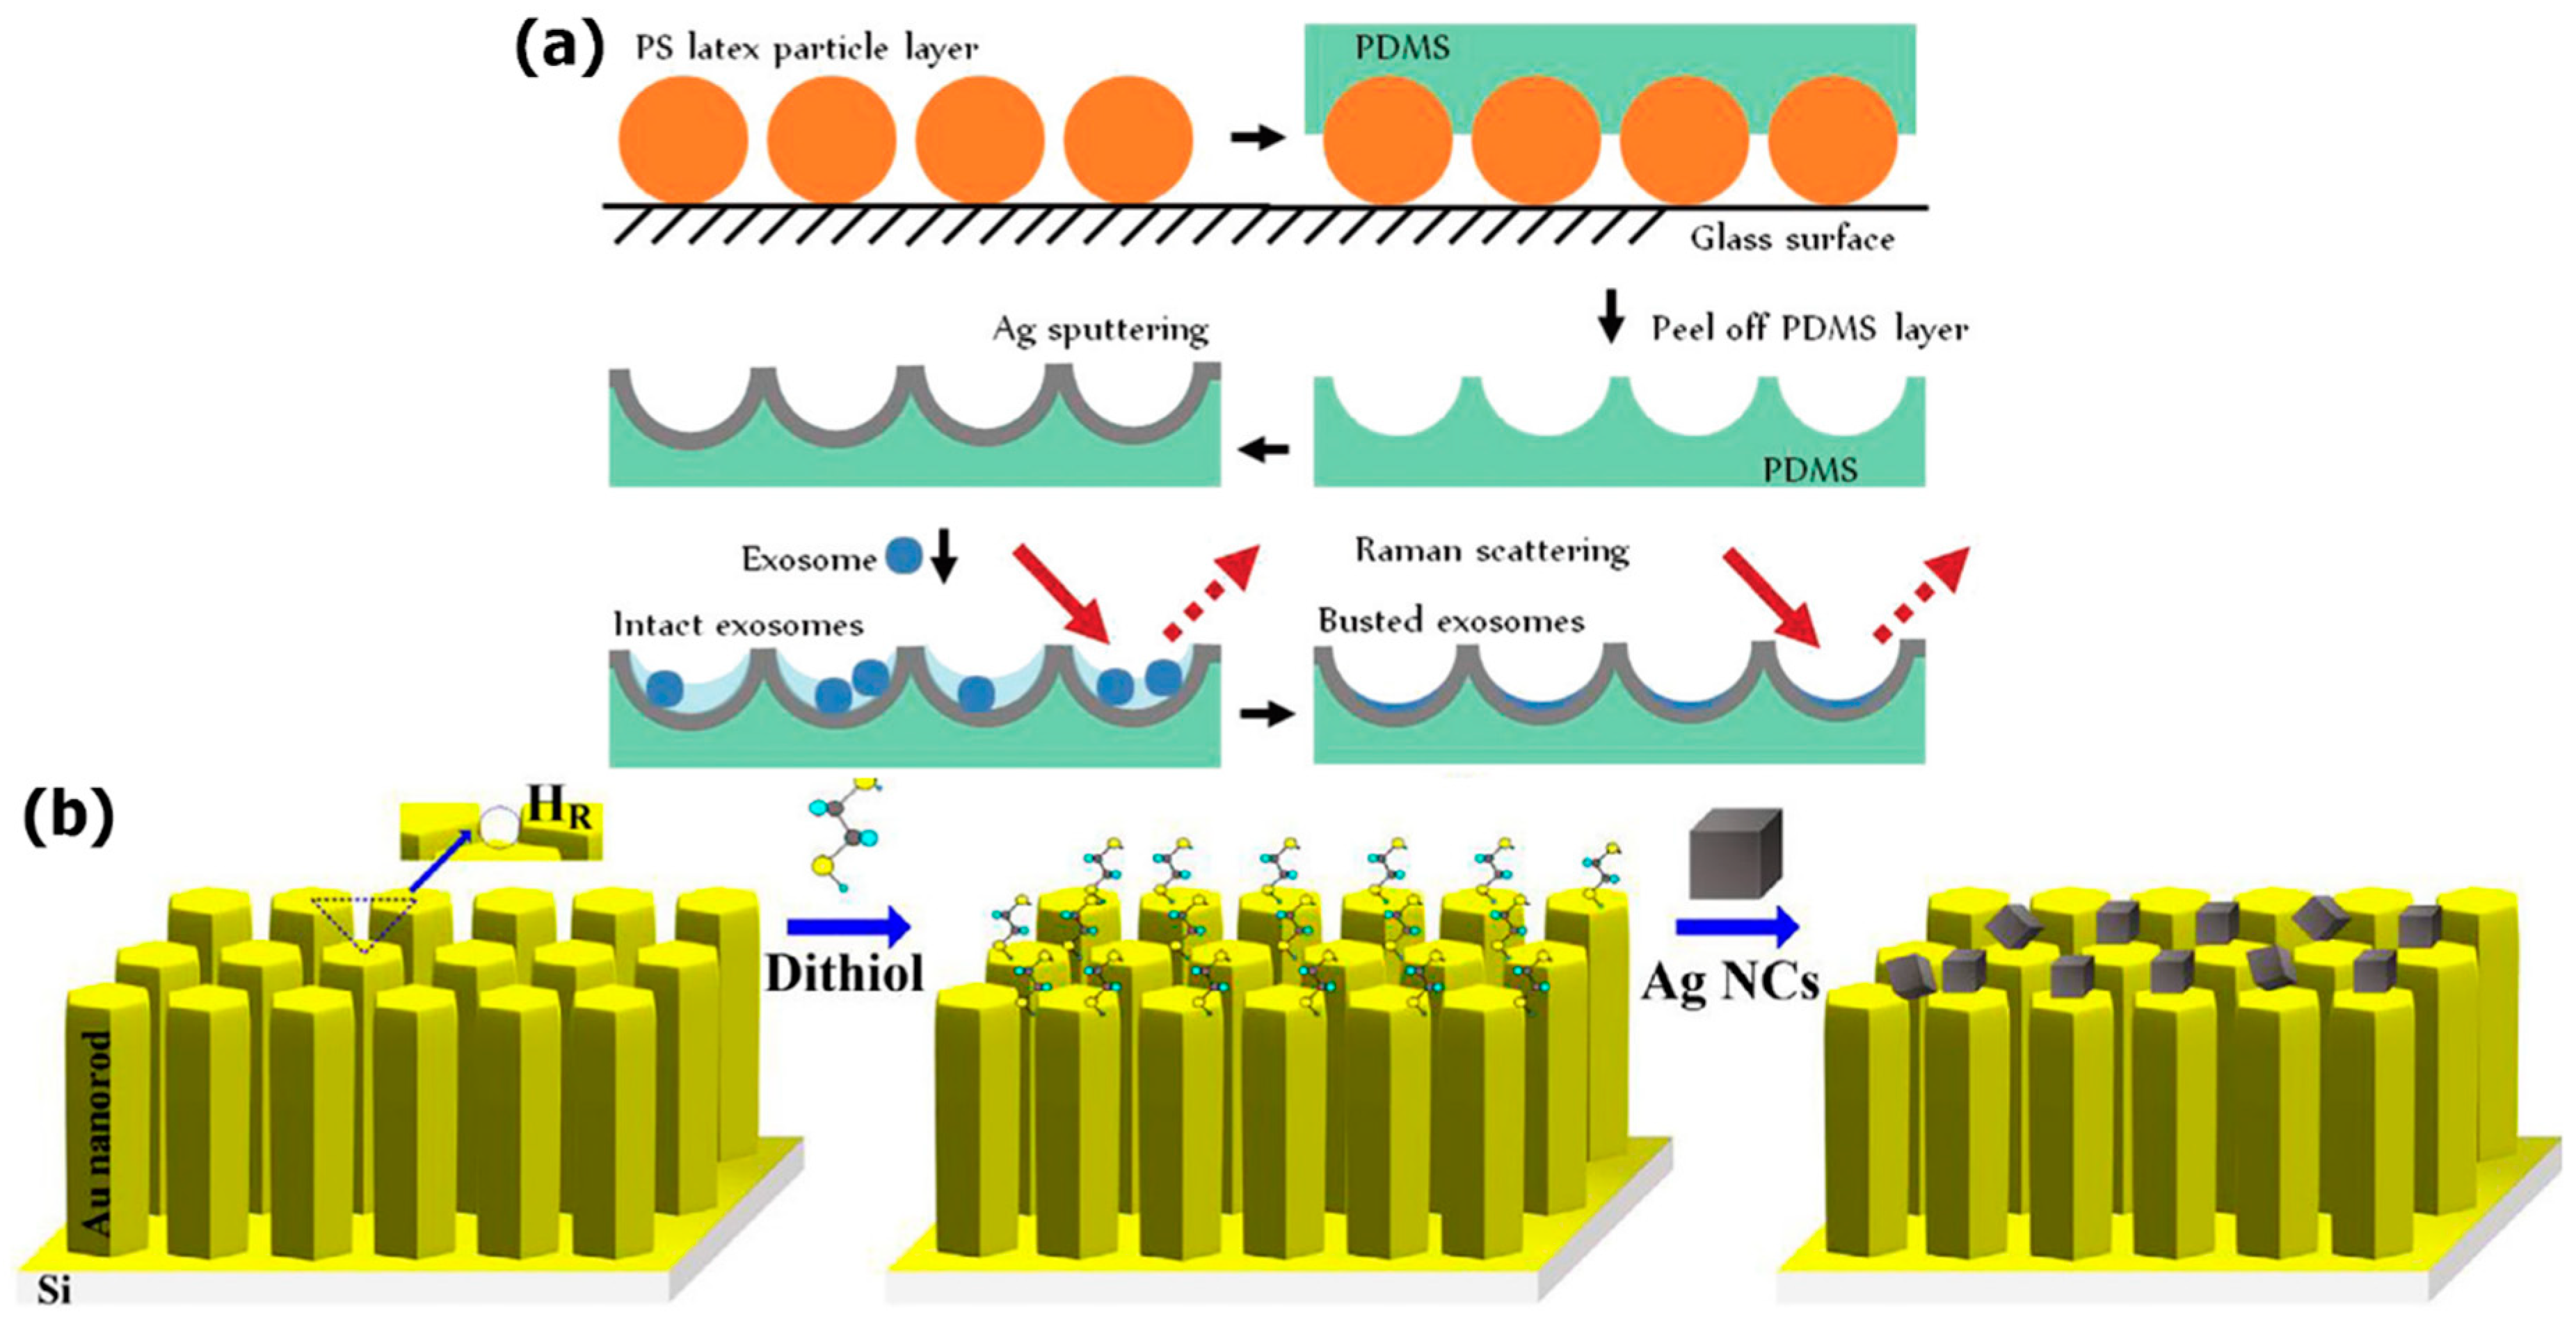
2. The Label-Free Approach
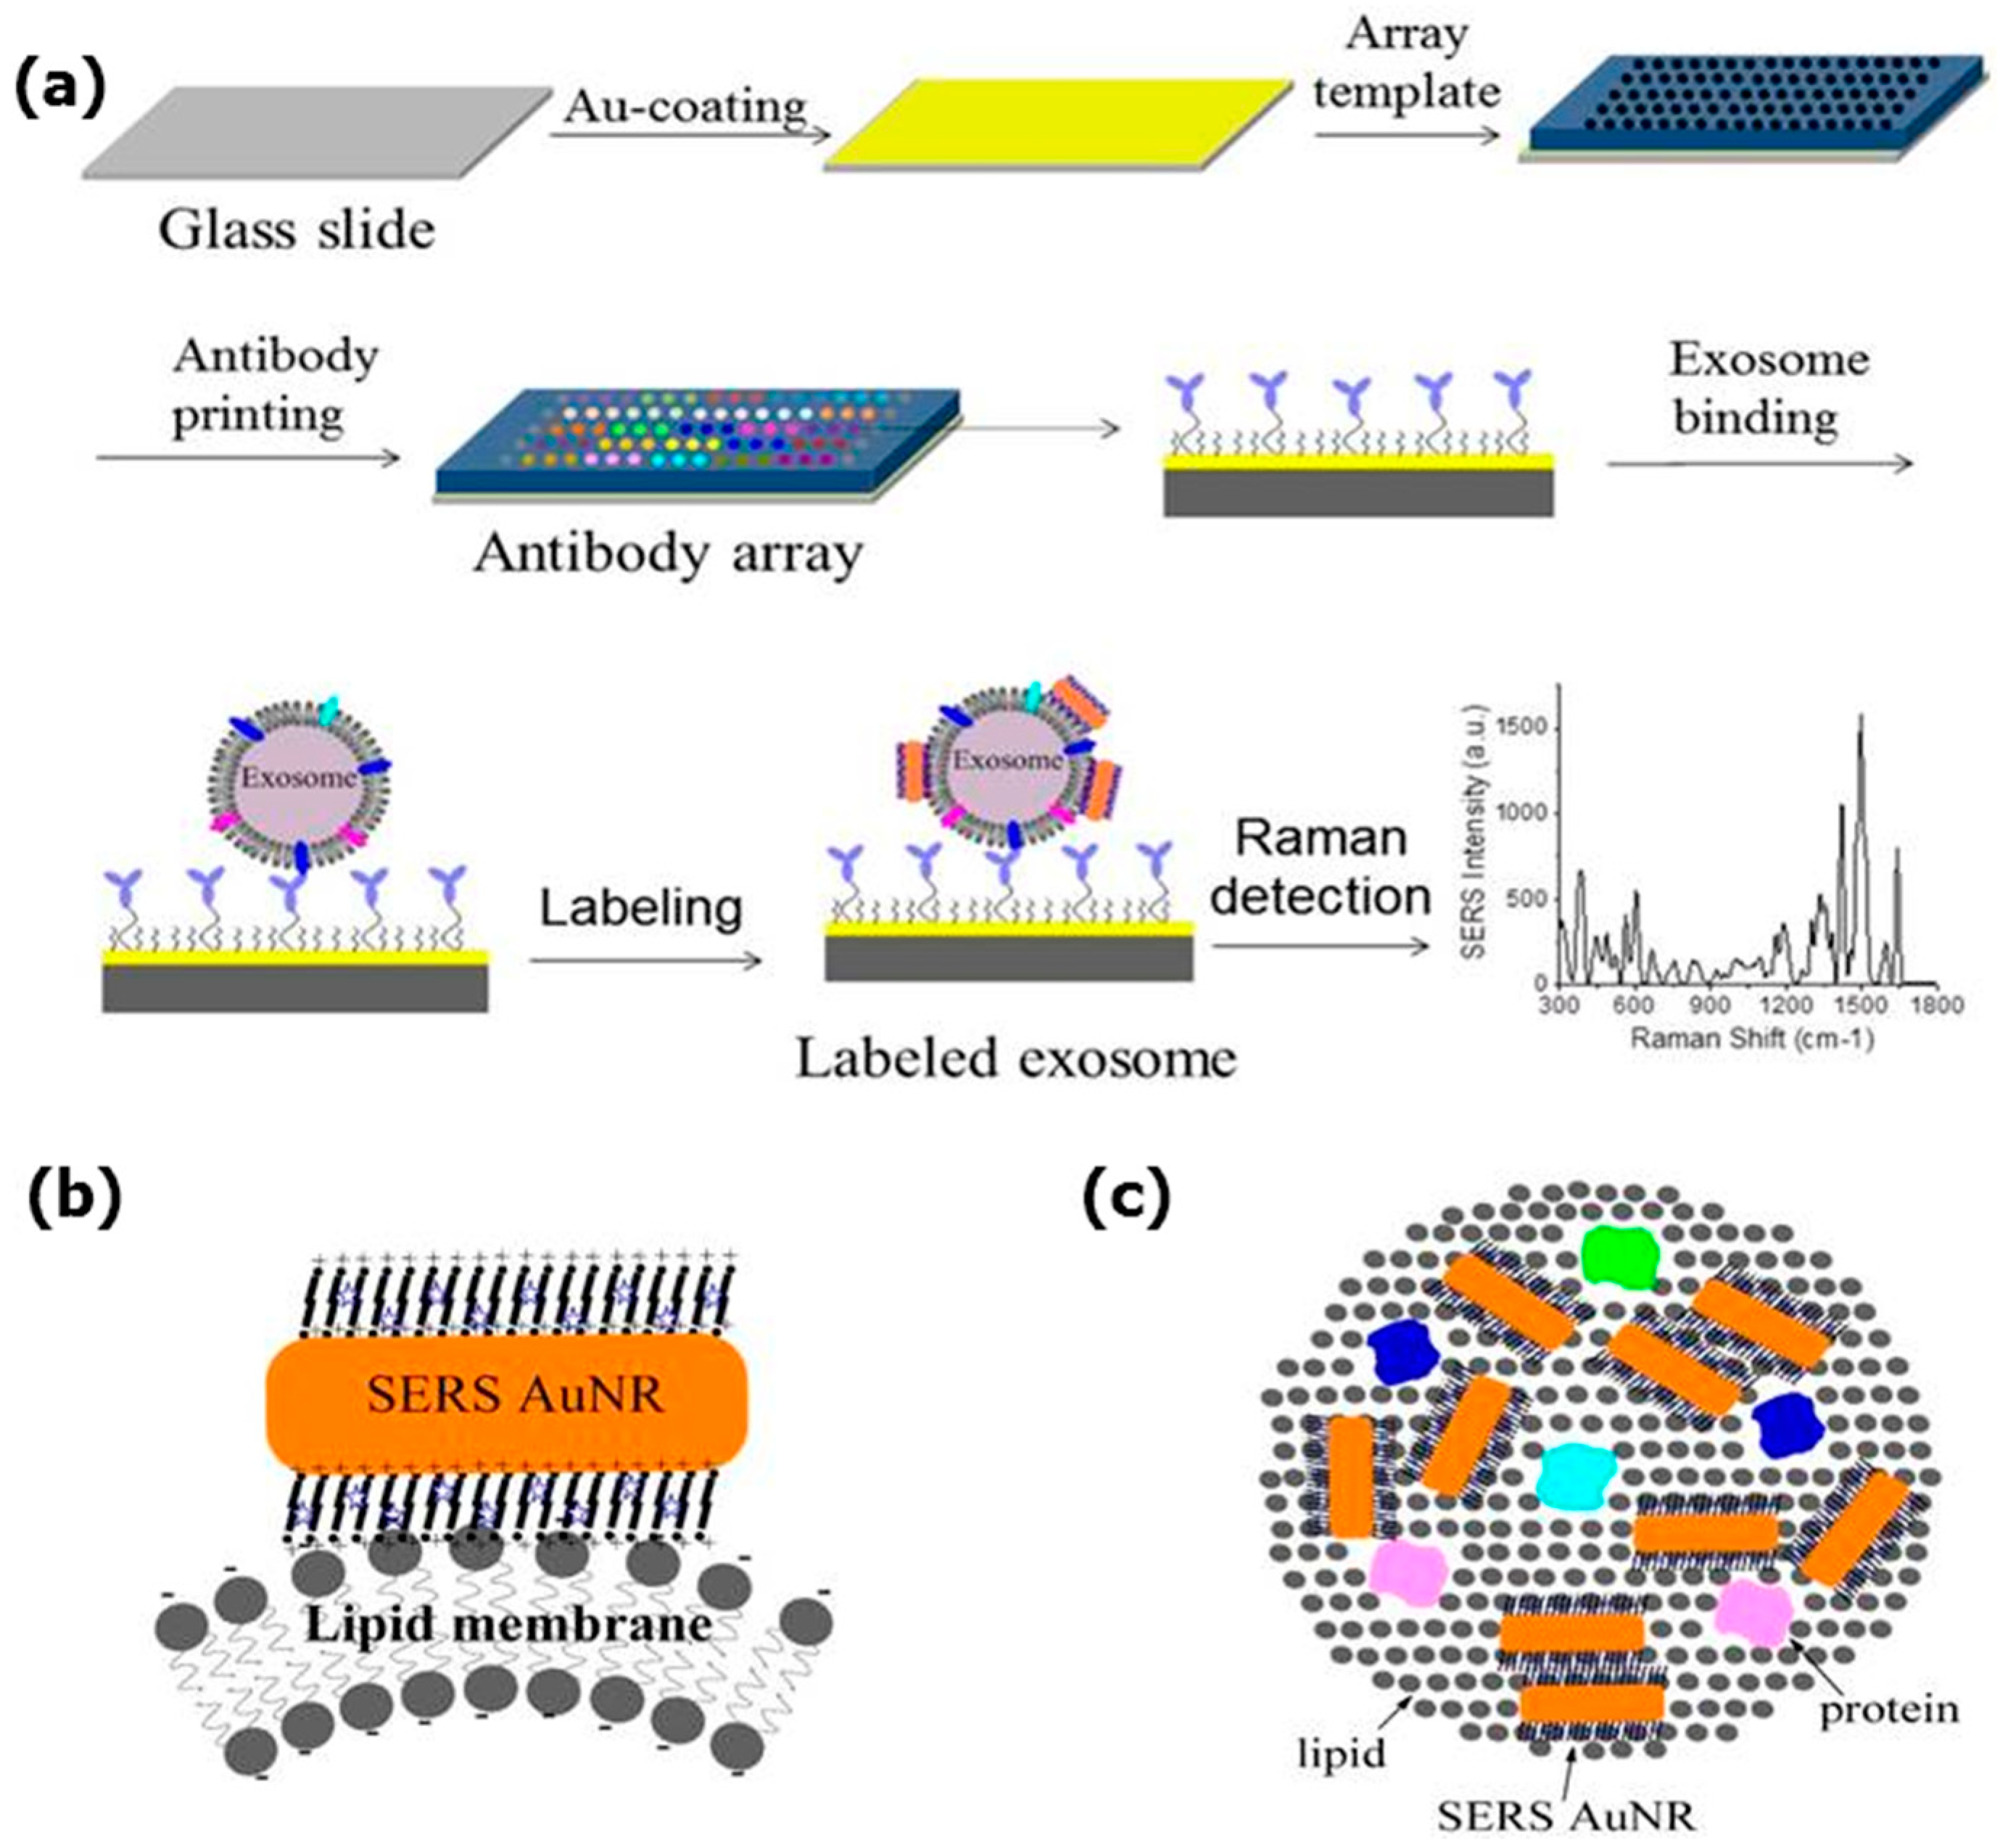
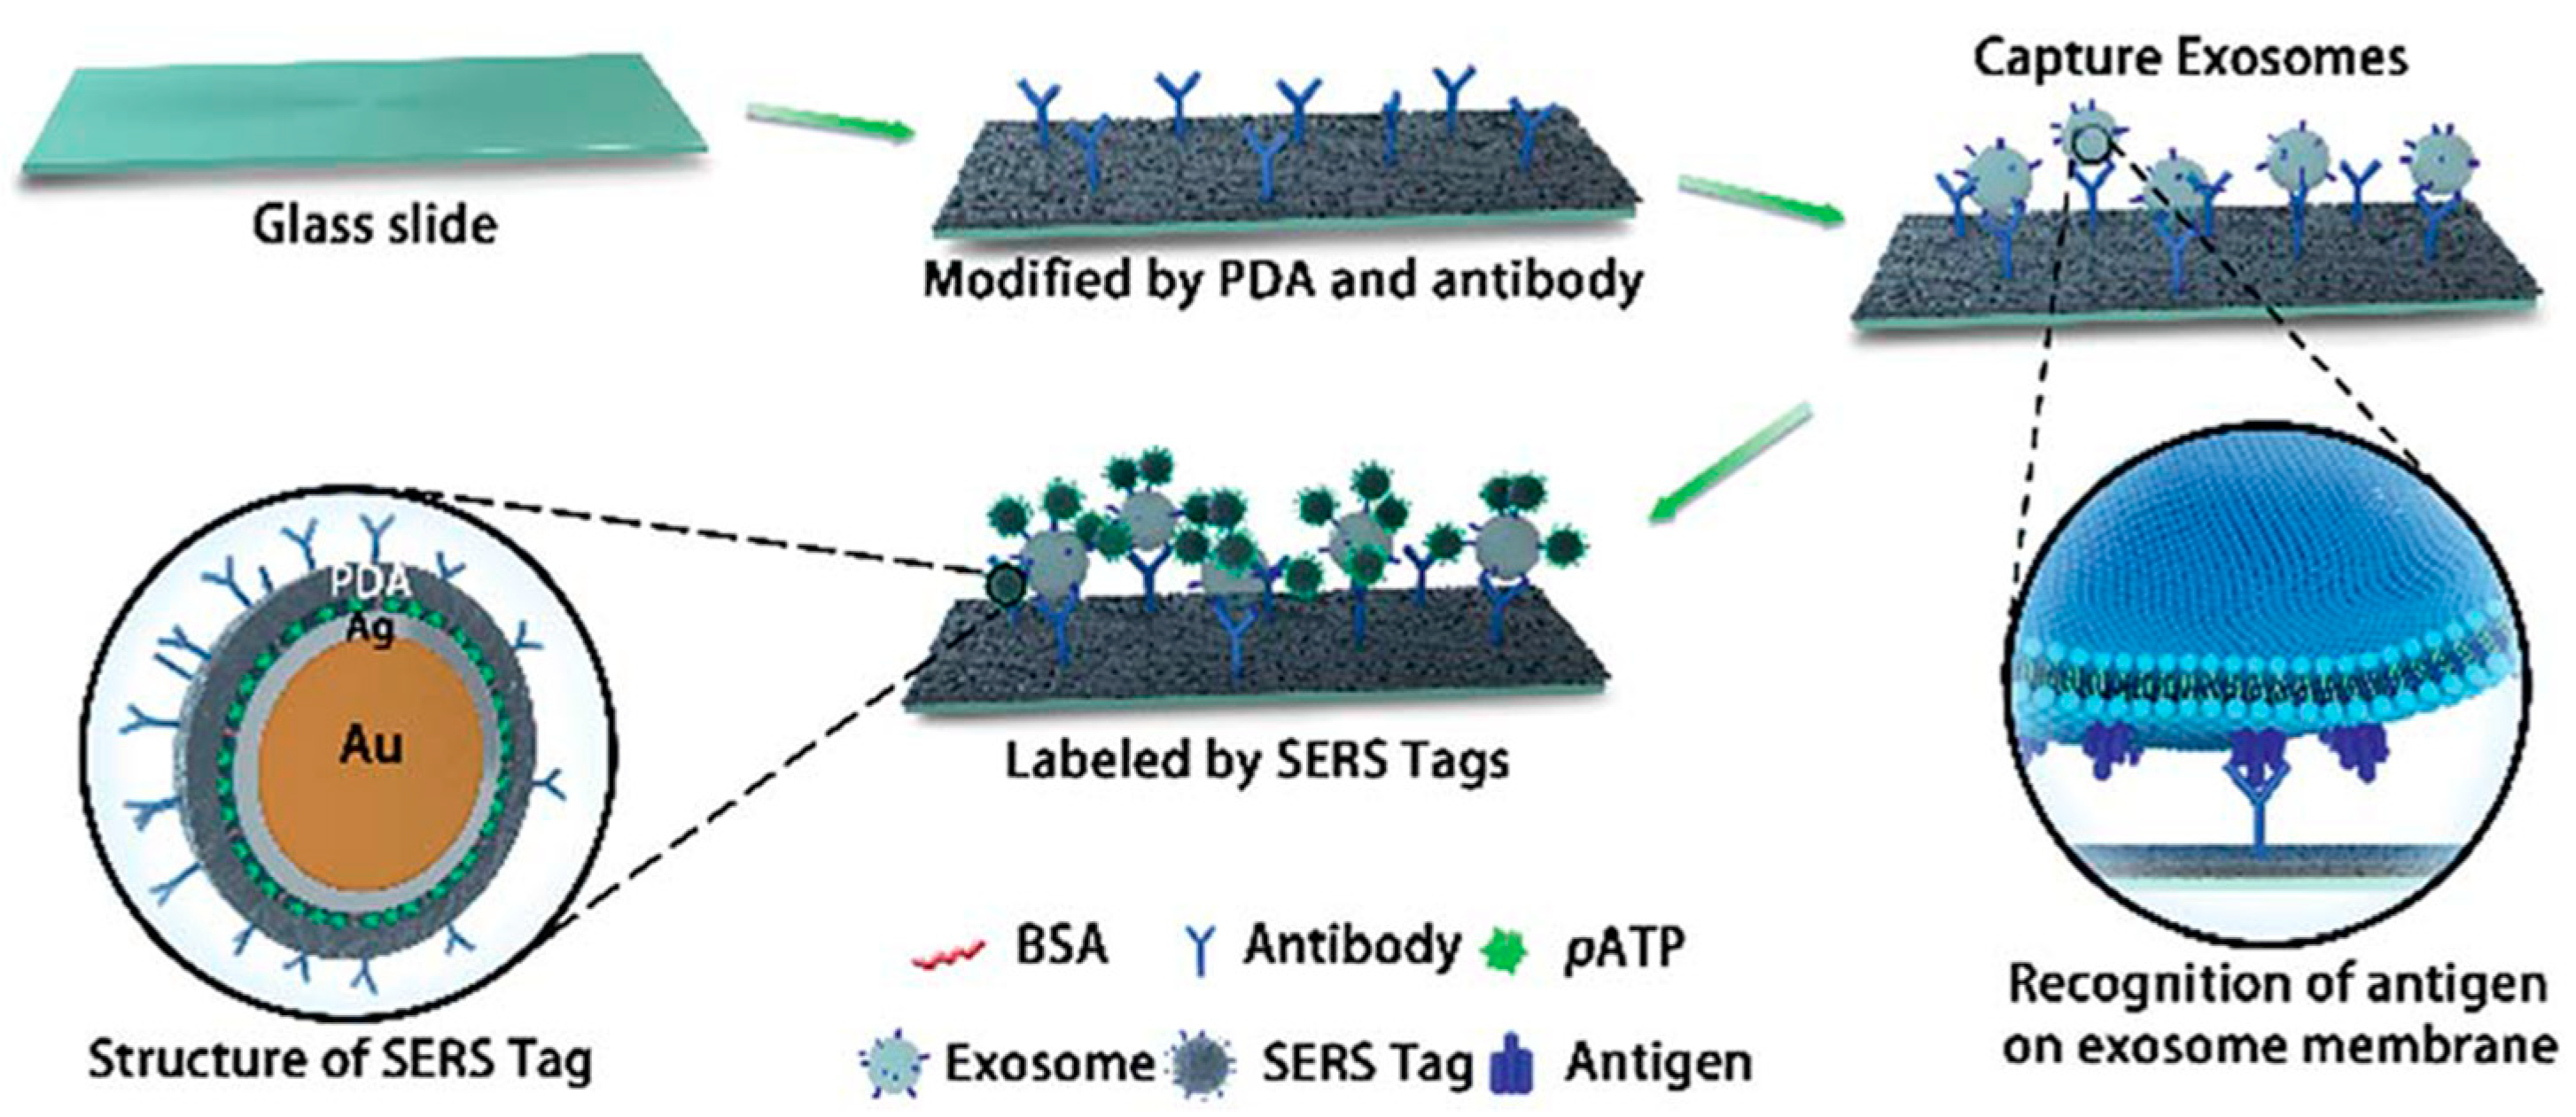
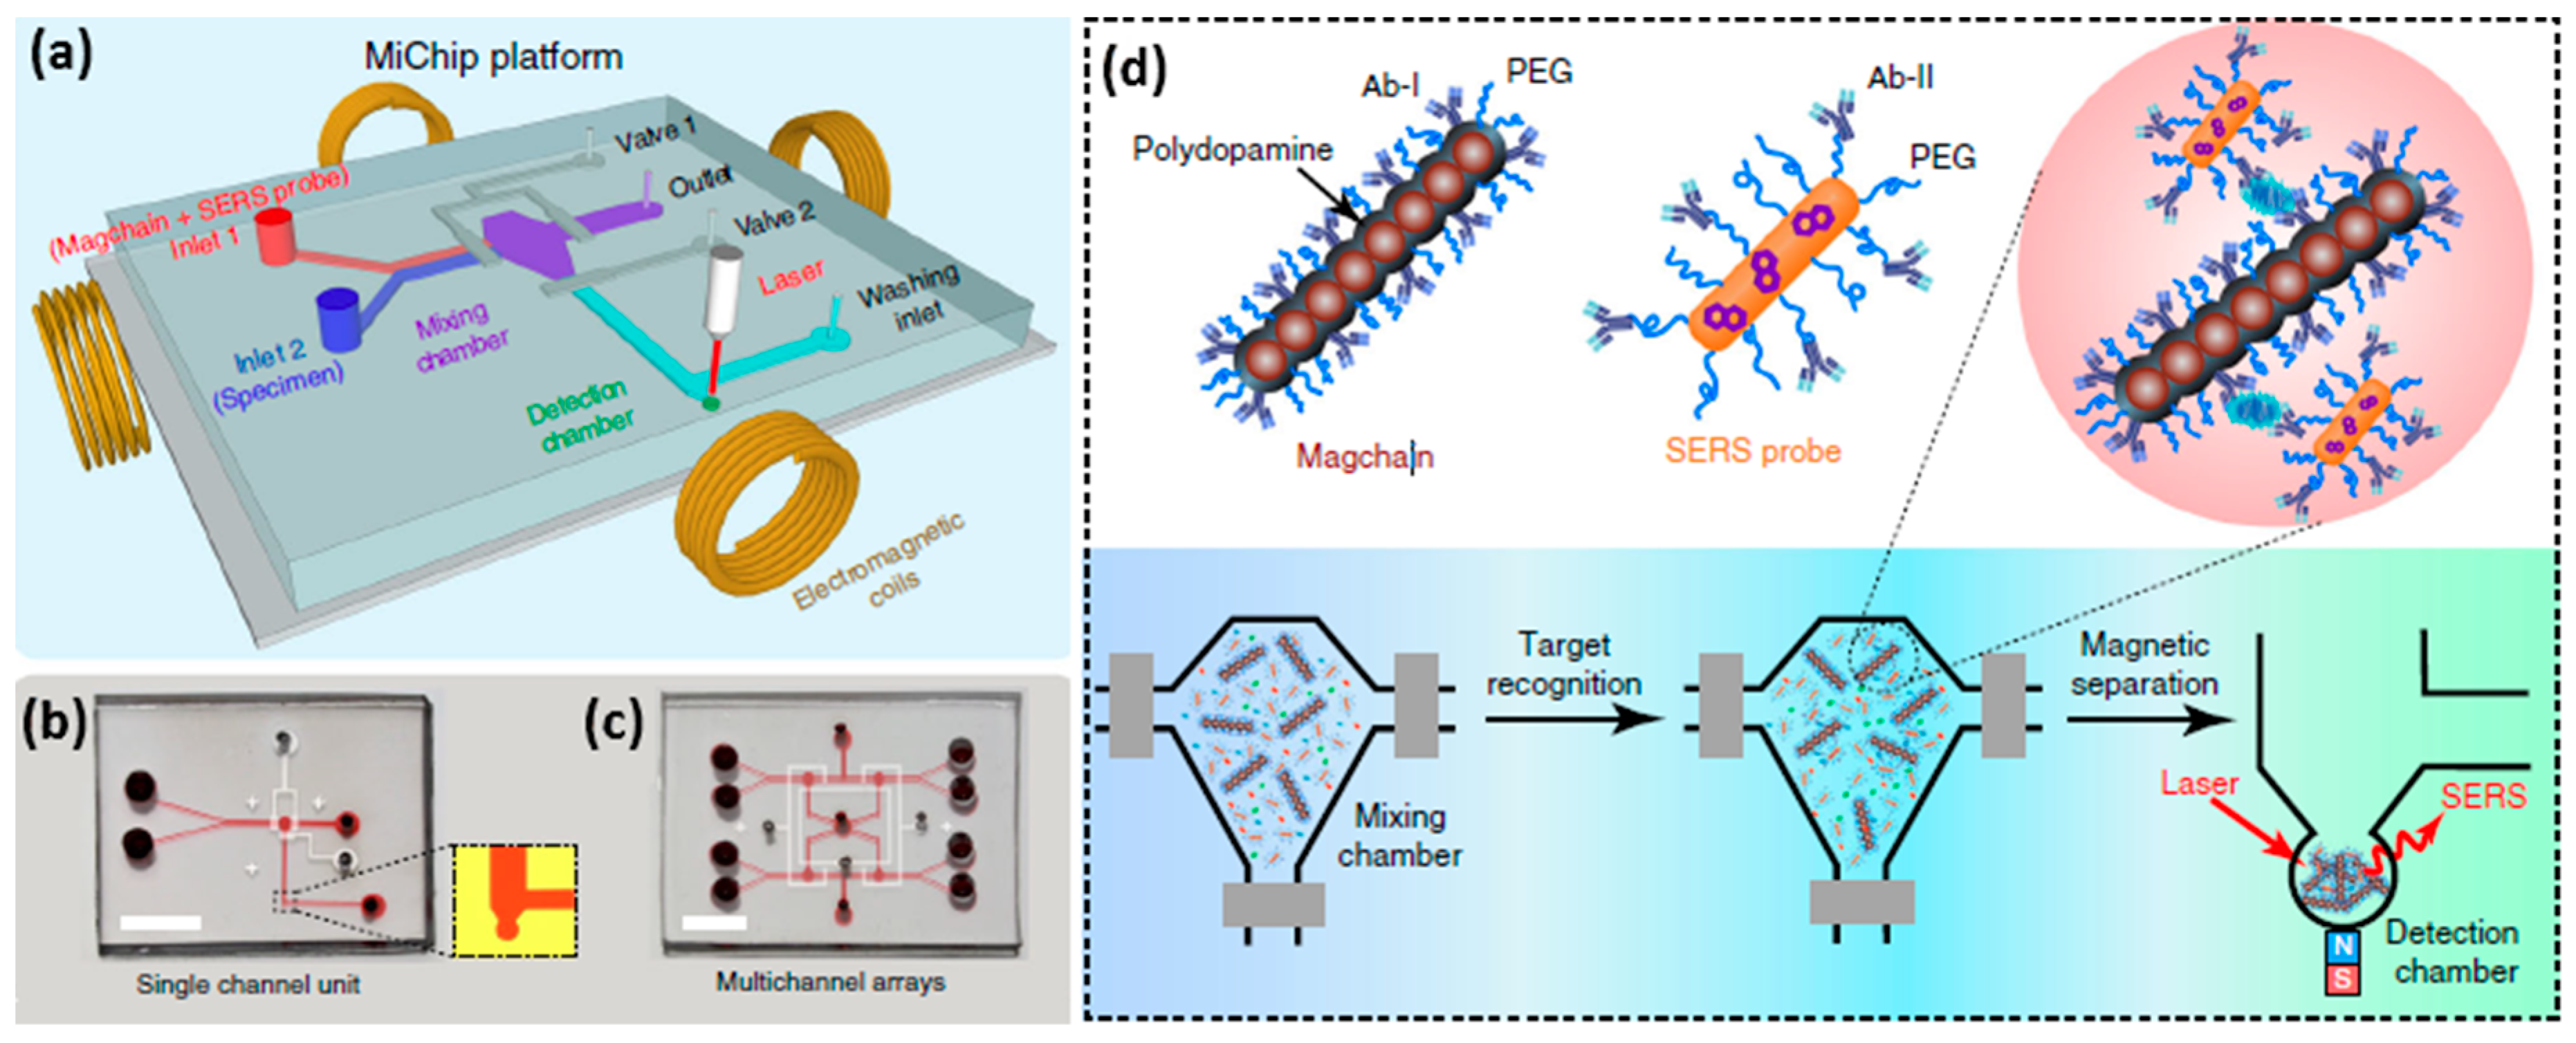
3. Immunolabeling Approach
4. Conclusions
Author Contributions
Funding
Conflicts of Interest
References
- Alix-Panabières, C.; Pantel, K. Challenges in circulating tumour cell research. Nat. Rev. Cancer 2014, 14, 623–631. [Google Scholar] [CrossRef] [PubMed]
- Li, G.; Sun, Y. Liquid Biopsy: Advances, Limitations and Clinical Applications. JSM Biotechnol. Bioeng. 2017, 4, 404–408. [Google Scholar]
- Schøler, L.V.; Reinert, T.; Ørntoft, M.B.W.; Kassentoft, C.G.; Arnadøttir, S.S.; Vang, S.; Nordentoft, I.; Knudsen, M.; Lamy, P.; Andreasen, D.; et al. Clinical implications of monitoring circulating Tumor DNA in patients with colorectal cancer. Clin. Cancer Res. 2017, 23, 5437–5445. [Google Scholar] [CrossRef] [PubMed]
- Cheng, F.; Su, L.; Qian, C. Circulating tumor DNA: A promising biomarker in the liquid biopsy of cancer. Oncotarget 2015, 48832–48841. [Google Scholar] [CrossRef]
- Johann, D.J.; Steliga, M.; Shin, I.J.; Yoon, D.; Arnaoutakis, K.; Hutchins, L.; Liu, M.; Liem, J.; Walker, K.; Pereira, A.; et al. Liquid biopsy and its role in an advanced clinical trial for lung cancer. Exp. Biol. Med. 2018, 243, 262–271. [Google Scholar] [CrossRef]
- Gale, D.; Lawson, A.R.J.; Howarth, K.; Madi, M.; Durham, B.; Smalley, S.; Calaway, J.; Blais, S.; Jones, G.; Clark, J.; et al. Development of a highly sensitive liquid biopsy platform to detect clinically-relevant cancer mutations at low allele fractions in cellfree DNA. PLoS ONE 2018. [Google Scholar] [CrossRef]
- Martins, T.S.; Catita, J.; Rosa, I.M.; Da Cruz e Silva, O.A.B.; Henriques, A.G. Exosome isolation from distinct biofluids using precipitation and column-based approaches. PLoS ONE 2018, 13, e0198820. [Google Scholar] [CrossRef]
- Chernyshev, V.S.; Rachamadugu, R.; Tseng, Y.H.; Belnap, D.M.; Jia, Y.; Branch, K.J.; Butterfield, A.E.; Pease, L.F.; Bernard, P.S.; Skliar, M. Size and shape characterization of hydrated and desiccated exosomes. Anal. Bioanal. Chem. 2015, 407, 3285–3301. [Google Scholar] [CrossRef]
- Alexander, R.P.; Chiou, N.-T.; Ansel, K.M. Improved exosome isolation by sucrose gradient fractionation of ultracentrifuged crude exosome pellets. Protoc. Exch. 2016. [Google Scholar] [CrossRef]
- Trams, E.G.; Lauter, C.J.; Norman Salem, J.; Heine, U. Exfoliation of membrane ecto-enzymes in the form of micro-vesicles. BBA Biomembr. 1981, 645, 63–70. [Google Scholar] [CrossRef]
- Palma, J.; Yaddanapudi, S.C.; Pigati, L.; Havens, M.A.; Jeong, S.; Weiner, G.A.; Weimer, K.M.E.; Stern, B.; Hastings, M.L.; Duelli, D.M. MicroRNAs are exported from malignant cells in customized particles. Nucleic Acids Res. 2012, 40, 9125–9138. [Google Scholar] [CrossRef] [Green Version]
- Hessvik, N.P.; Llorente, A. Current knowledge on exosome biogenesis and release. Cell. Mol. Life Sci. 2018, 75, 193–208. [Google Scholar] [CrossRef]
- Théry, C.; Zitvogel, L.; Amigorena, S. Exosomes: Composition, biogenesis and function. Nat. Rev. Immunol. 2002, 2, 569–579. [Google Scholar] [CrossRef]
- Fernando, M.R.; Jiang, C.; Krzyzanowski, G.D.; Ryan, W.L. New evidence that a large proportion of human blood plasma cell-free DNA is localized in exosomes. PLoS ONE 2017, 12. [Google Scholar] [CrossRef]
- Huang, X.; Yuan, T.; Tschannen, M.; Sun, Z.; Jacob, H.; Du, M.; Liang, M.; Dittmar, R.L.; Liu, Y.; Liang, M.; et al. Characterization of human plasma-derived exosomal RNAs by deep sequencing. BMC Genom. 2013, 14. [Google Scholar] [CrossRef]
- Matsumoto, Y.; Kano, M.; Akutsu, Y.; Hanari, N.; Hoshino, I.; Murakami, K.; Usui, A.; Suito, H.; Takahashi, M.; Otsuka, R.; et al. Quantification of plasma exosome is a potential prognostic marker for esophageal squamous cell carcinoma. Oncol. Rep. 2016, 36, 2535–2543. [Google Scholar] [CrossRef] [Green Version]
- Tamkovich, S.N.; Bakakina, Y.S.; Tutanov, O.S.; Somov, A.K.; Kirushina, N.A.; Dubovskaya, L.V.; Volotovski, I.D.; Laktionov, P.P. Proteome analysis of circulating exosomes in health and breast cancer. Russ. J. Bioorganic Chem. 2017, 43, 126–134. [Google Scholar] [CrossRef]
- Li, M.; Zeringer, E.; Barta, T.; Schageman, J.; Cheng, A.; Vlassov, A.V. Analysis of the RNA content of the exosomes derived from blood serum and urine and its potential as biomarkers. Philos. Trans. R. Soc. B Biol. Sci. 2014, 369, 20130502. [Google Scholar] [CrossRef]
- de la Torre Gomez, C.; Goreham, R.V.; Bech Serra, J.J.; Nann, T.; Kussmann, M. “Exosomics”-A review of biophysics, biology and biochemistry of exosomes with a focus on human breast milk. Front. Genet. 2018, 9. [Google Scholar] [CrossRef]
- Van Niel, G.; D’Angelo, G.; Raposo, G. Shedding light on the cell biology of extracellular vesicles. Nat. Rev. Mol. Cell Biol. 2018, 19, 213–228. [Google Scholar] [CrossRef]
- Simons, M.; Raposo, G. Exosomes-vesicular carriers for intercellular communication. Curr. Opin. Cell Biol. 2009, 21, 575–581. [Google Scholar] [CrossRef] [PubMed]
- Kharaziha, P.; Ceder, S.; Li, Q.; Panaretakis, T. Tumor cell-derived exosomes: A message in a bottle. Biochim. Biophys. Acta Rev. Cancer 2012, 1826, 103–111. [Google Scholar] [CrossRef] [PubMed]
- Vlassov, A.V.; Magdaleno, S.; Setterquist, R.; Conrad, R. Exosomes: Current knowledge of their composition, biological functions, and diagnostic and therapeutic potentials. Biochim. Biophys. Acta Gen. Subj. 2012, 1820, 940–948. [Google Scholar] [CrossRef] [PubMed]
- Raposo, G.; Stoorvogel, W. Extracellular vesicles: Exosomes, microvesicles, and friends. J. Cell Biol. 2013, 200, 373–383. [Google Scholar] [CrossRef] [Green Version]
- Chevillet, J.R.; Kang, Q.; Ruf, I.K.; Briggs, H.A.; Vojtech, L.N.; Hughes, S.M.; Cheng, H.H.; Arroyo, J.D.; Meredith, E.K.; Gallichotte, E.N.; et al. Quantitative and stoichiometric analysis of the microRNA content of exosomes. Proc. Natl. Acad. Sci. USA 2014, 111, 14888–14893. [Google Scholar] [CrossRef]
- Wang, K.; Zhang, S.; Weber, J.; Baxter, D.; Galas, D.J. Export of microRNAs and microRNA-protective protein by mammalian cells. Nucleic Acids Res. 2010, 38, 7248–7259. [Google Scholar] [CrossRef] [Green Version]
- Ge, R.; Tan, E.; Sharghi-Namini, S.; Asada, H.H. Exosomes in cancer microenvironment and beyond: Have we overlooked these extracellular messengers? Cancer Microenviron. 2012, 5, 323–332. [Google Scholar] [CrossRef]
- Pucci, F.; Pittet, M.J. Molecular pathways: Tumor-derived microvesicles and their interactions with immune cells In vivo. Clin. Cancer Res. 2013, 19, 2598–2604. [Google Scholar] [CrossRef]
- Regev-Rudzki, N.; Wilson, D.W.; Carvalho, T.G.; Sisquella, X.; Coleman, B.M.; Rug, M.; Bursac, D.; Angrisano, F.; Gee, M.; Hill, A.F.; et al. Cell-cell communication between malaria-infected red blood cells via exosome-like vesicles. Cell 2013, 153, 1120–1133. [Google Scholar] [CrossRef]
- Whiteside, T.L. Tumor-Derived Exosomes and Their Role in Cancer Progression. In Advances in Clinical Chemistry; Elsevier Science: Amsterdam, The Netherlands, 2016; ISBN 9780128046890. [Google Scholar]
- Witwer, K.W.; Buzás, E.I.; Bemis, L.T.; Bora, A.; Lässer, C.; Lötvall, J.; Nolte-’t Hoen, E.N.; Piper, M.G.; Sivaraman, S.; Skog, J.; et al. Standardization of sample collection, isolation and analysis methods in extracellular vesicle research. J. Extracell. Vesicles 2013, 2. [Google Scholar] [CrossRef]
- Taylor, D.D.; Shah, S. Methods of isolating extracellular vesicles impact down-stream analyses of their cargoes. Methods 2015, 87, 3–10. [Google Scholar] [CrossRef] [PubMed]
- Cantin, R.; Diou, J.; Bélanger, D.; Tremblay, A.M.; Gilbert, C. Discrimination between exosomes and HIV-1: Purification of both vesicles from cell-free supernatants. J. Immunol. Methods 2008, 338, 21–30. [Google Scholar] [CrossRef]
- Baranyai, T.; Herczeg, K.; Onódi, Z.; Voszka, I.; Módos, K.; Marton, N.; Nagy, G.; Mäger, I.; Wood, M.J.; El Andaloussi, S.; et al. Isolation of exosomes from blood plasma: Qualitative and quantitative comparison of ultracentrifugation and size exclusion chromatography methods. PLoS ONE 2015, 10, e0145686. [Google Scholar] [CrossRef] [PubMed]
- Tauro, B.J.; Greening, D.W.; Mathias, R.A.; Ji, H.; Mathivanan, S.; Scott, A.M.; Simpson, R.J. Comparison of ultracentrifugation, density gradient separation, and immunoaffinity capture methods for isolating human colon cancer cell line LIM1863-derived exosomes. Methods 2012, 56, 293–304. [Google Scholar] [CrossRef] [PubMed]
- Nordin, J.Z.; Lee, Y.; Vader, P.; Mäger, I.; Johansson, H.J.; Heusermann, W.; Wiklander, O.P.B.; Hällbrink, M.; Seow, Y.; Bultema, J.J.; et al. Ultrafiltration with size-exclusion liquid chromatography for high yield isolation of extracellular vesicles preserving intact biophysical and functional properties. Nanomed. Nanotechnol. Biol. Med. 2015, 11, 879–883. [Google Scholar] [CrossRef] [Green Version]
- Merchant, M.L.; Powell, D.W.; Wilkey, D.W.; Cummins, T.D.; Deegens, J.K.; Rood, I.M.; McAfee, K.J.; Fleischer, C.; Klein, E.; Klein, J.B. Microfiltration isolation of human urinary exosomes for characterization by MS. Proteom. Clin. Appl. 2010, 4, 84–96. [Google Scholar] [CrossRef] [PubMed]
- Rekker, K.; Saare, M.; Roost, A.M.; Kubo, A.L.; Zarovni, N.; Chiesi, A.; Salumets, A.; Peters, M. Comparison of serum exosome isolation methods for microRNA profiling. Clin. Biochem. 2014, 47, 135–138. [Google Scholar] [CrossRef]
- Petersen, K.E.; Shiri, F.; White, T.; Bardi, G.T.; Sant, H.; Gale, B.K.; Hood, J.L. Exosome Isolation: Cyclical Electrical Field Flow Fractionation in Low-Ionic-Strength Fluids. Anal. Chem. 2018, 90, 12783–12790. [Google Scholar] [CrossRef]
- Yamada, T.; Inoshima, Y.; Matsuda, T.; Ishiguro, N. Comparison of Methods for Isolating Exosomes from Bovine Milk. J. Vet. Med. Sci. 2012, 74, 1523–1525. [Google Scholar] [CrossRef] [Green Version]
- Wu, M.; Ouyang, Y.; Wang, Z.; Zhang, R.; Huang, P.-H.; Chen, C.; Li, H.; Li, P.; Quinn, D.; Dao, M.; et al. Isolation of exosomes from whole blood by integrating acoustics and microfluidics. Proc. Natl. Acad. Sci. USA 2017, 114, 10584–10589. [Google Scholar] [CrossRef] [Green Version]
- Liu, C.; Guo, J.; Tian, F.; Yang, N.; Yan, F.; Ding, Y.; Wei, J.; Hu, G.; Nie, G.; Sun, J. Field-Free Isolation of Exosomes from Extracellular Vesicles by Microfluidic Viscoelastic Flows. ACS Nano 2017, 11, 6968–6976. [Google Scholar] [CrossRef] [PubMed] [Green Version]
- Zhao, Z.; Yang, Y.; Zeng, Y.; He, M. A microfluidic ExoSearch chip for multiplexed exosome detection towards blood-based ovarian cancer diagnosis. Lab Chip 2016, 16, 489–496. [Google Scholar] [CrossRef] [PubMed]
- Kanwar, S.S.; Dunlay, C.J.; Simeone, D.M.; Nagrath, S. Microfluidic device (ExoChip) for on-chip isolation, quantification and characterization of circulating exosomes. Lab Chip 2014, 14, 1891–1900. [Google Scholar] [CrossRef] [PubMed]
- He, M.; Crow, J.; Roth, M.; Zeng, Y.; Godwin, A.K. Integrated immunoisolation and protein analysis of circulating exosomes using microfluidic technology. Lab Chip Miniat. Chem. Biol. 2014, 14, 3773–3780. [Google Scholar] [CrossRef]
- Logozzi, M.; De Milito, A.; Lugini, L.; Borghi, M.; Calabrò, L.; Spada, M.; Perdicchio, M.; Marino, M.L.; Federici, C.; Iessi, E.; et al. High levels of exosomes expressing CD63 and caveolin-1 in plasma of melanoma patients. PLoS ONE 2009, 4, e5219. [Google Scholar] [CrossRef]
- Khan, S.; Bennit, H.F.; Turay, D.; Perez, M.; Mirshahidi, S.; Yuan, Y.; Wall, N.R. Early diagnostic value of survivin and its alternative splice variants in breast cancer. BMC Cancer 2014, 14, 176. [Google Scholar] [CrossRef]
- Lamparski, H.G.; Metha-Damani, A.; Yao, J.Y.; Patel, S.; Hsu, D.H.; Ruegg, C.; Le Pecq, J.B. Production and characterization of clinical grade exosomes derived from dendritic cells. J. Immunol. Methods 2002, 270, 211–226. [Google Scholar] [CrossRef]
- Dragovic, R.A.; Gardiner, C.; Brooks, A.S.; Tannetta, D.S.; Ferguson, D.J.P.; Hole, P.; Carr, B.; Redman, C.W.G.; Harris, A.L.; Dobson, P.J.; et al. Sizing and phenotyping of cellular vesicles using Nanoparticle Tracking Analysis. Nanomed. Nanotechnol. Biol. Med. 2011, 7, 780–788. [Google Scholar] [CrossRef] [Green Version]
- Gardiner, C.; Ferreira, Y.J.; Dragovic, R.A.; Redman, C.W.G.; Sargent, I.L. Extracellular vesicle sizing and enumeration by nanoparticle tracking analysis. J. Extracell. Vesicles 2013, 2. [Google Scholar] [CrossRef]
- Akers, J.C.; Ramakrishnan, V.; Nolan, J.P.; Duggan, E.; Fu, C.C.; Hochberg, F.H.; Chen, C.C.; Carter, B.S. Comparative analysis of technologies for quantifying extracellular vesicles (EVs) in clinical cerebrospinal fluids (CSF). PLoS ONE 2016, 11, e0149866. [Google Scholar] [CrossRef]
- Nolan, J.P. Flow cytometry of extracellular vesicles: Potential, pitfalls, and prospects. Curr. Protoc. Cytom. 2015, 73, 13.14.1–13.14.16. [Google Scholar]
- Van Der Pol, E.; Van Gemert, M.J.C.; Sturk, A.; Nieuwland, R.; Van Leeuwen, T.G. Single vs. swarm detection of microparticles and exosomes by flow cytometry. J. Thromb. Haemost. 2012, 10, 919–930. [Google Scholar] [CrossRef] [Green Version]
- Tian, T.; Zhu, Y.L.; Hu, F.H.; Wang, Y.Y.; Huang, N.P.; Xiao, Z.D. Dynamics of exosome internalization and trafficking. J. Cell. Physiol. 2013, 228, 1487–1495. [Google Scholar] [CrossRef]
- Suetsugu, A.; Honma, K.; Saji, S.; Moriwaki, H.; Ochiya, T.; Hoffman, R.M. Imaging exosome transfer from breast cancer cells to stroma at metastatic sites in orthotopic nude-mouse models. Adv. Drug Deliv. Rev. 2013, 65, 383–390. [Google Scholar] [CrossRef]
- Im, H.; Shao, H.; Park, Y.I.; Peterson, V.M.; Castro, C.M.; Weissleder, R.; Lee, H. Label-free detection and molecular profiling of exosomes with a nano-plasmonic sensor. Nat. Biotechnol. 2014, 32, 490–495. [Google Scholar] [CrossRef] [Green Version]
- Sina, A.A.I.; Vaidyanathan, R.; Dey, S.; Carrascosa, L.G.; Shiddiky, M.J.A.; Trau, M. Real time and label free profiling of clinically relevant exosomes. Sci. Rep. 2016, 6, 30460. [Google Scholar] [CrossRef] [Green Version]
- Alvarez-Puebla, R.; Liz-Marzán, L.M.; García De Abajo, F.J. Light concentration at the nanometer scale. J. Phys. Chem. Lett. 2010, 1, 2428–2434. [Google Scholar] [CrossRef]
- Kahraman, M.; Mullen, E.R.; Korkmaz, A.; Wachsmann-Hogiu, S. Fundamentals and applications of SERS-based bioanalytical sensing. Nanophotonics 2017, 6, 831–852. [Google Scholar] [CrossRef] [Green Version]
- Wang, X.; Qian, X.; Beitler, J.J.; Chen, Z.G.; Khuri, F.R.; Lewis, M.M.; Shin, H.J.C.; Nie, S.; Shin, D.M. Detection of circulating tumor cells in human peripheral blood using surface-enhanced raman scattering nanoparticles. Cancer Res. 2011, 71, 1526–1532. [Google Scholar] [CrossRef]
- Cui, Q.; Yashchenok, A.; Zhang, L.; Li, L.; Masic, A.; Wienskol, G.; Möhwald, H.; Bargheer, M. Fabrication of bifunctional gold/gelatin hybrid nanocomposites and their application. ACS Appl. Mater. Interfaces 2014, 6, 1999–2002. [Google Scholar] [CrossRef]
- Han, X.; Wang, H.; Ou, X.; Zhang, X. Silicon nanowire-based surface-enhanced Raman spectroscopy endoscope for intracellular pH detection. ACS Appl. Mater. Interfaces 2013, 5, 5811–5814. [Google Scholar] [CrossRef]
- Kong, K.V.; Dinish, U.S.; Lau, W.K.O.; Olivo, M. Sensitive SERS-pH sensing in biological media using metal carbonyl functionalized planar substrates. Biosens. Bioelectron. 2014, 54, 135–140. [Google Scholar] [CrossRef]
- Yashchenok, A.; Masic, A.; Gorin, D.; Shim, B.S.; Kotov, N.A.; Fratzl, P.; Möhwald, H.; Skirtach, A. Nanoengineered colloidal probes for raman-based detection of biomolecules inside living cells. Small 2013, 9, 351–356. [Google Scholar] [CrossRef]
- Radziuk, D.; Moehwald, H. Highly effective hot spots for SERS signatures of live fibroblasts. Nanoscale 2014, 6, 6115–6126. [Google Scholar] [CrossRef] [Green Version]
- Wuytens, P.C.; Subramanian, A.Z.; De Vos, W.H.; Skirtach, A.G.; Baets, R. Gold nanodome-patterned microchips for intracellular surface-enhanced Raman spectroscopy. Analyst 2015, 40, 8080–8087. [Google Scholar] [CrossRef]
- Harper, M.M.; Dougan, J.A.; Shand, N.C.; Grahama, D.; Faulds, K. Detection of SERS active labelled DNA based on surface affinity to silver nanoparticles. Analyst 2012, 137, 2063–2068. [Google Scholar] [CrossRef]
- Xu, L.J.; Zong, C.; Zheng, X.S.; Hu, P.; Feng, J.M.; Ren, B. Label-free detection of native proteins by surface-enhanced Raman spectroscopy using iodide-modified nanoparticles. Anal. Chem. 2014, 86, 2238–2245. [Google Scholar] [CrossRef]
- Tian, L.; Fei, M.; Tadepalli, S.; Morrissey, J.J.; Kharasch, E.D.; Singamaneni, S. Bio-Enabled Gold Superstructures with Built-In and Accessible Electromagnetic Hotspots. Adv. Healthc. Mater. 2015, 4, 1502–1509. [Google Scholar] [CrossRef]
- Emory, S.; Nie, S.M. Near-Field Surface-Enhanced Raman Spectroscopy on Single Silver Nanoparticles. Anal. Chem. 1997, 69, 2631–2635. [Google Scholar] [CrossRef]
- Etchegoin, P.G.; Le Ru, E.C. A perspective on single molecule SERS: Current status and future challenges. Phys. Chem. Chem. Phys. 2008, 10, 6079–6089. [Google Scholar] [CrossRef]
- Cui, Q.; Yashchenok, A.; Li, L.; Möhwald, H.; Bargheer, M. Mechanistic study on reduction reaction of nitro compounds catalyzed by gold nanoparticles using in situ SERS monitoring. Colloids Surf. A Physicochem. Eng. Aspects 2015, 470, 108–113. [Google Scholar] [CrossRef]
- Jeanmaire, D.L.; Van Duyne, R.P. Surface raman spectroelectrochemistry: Part, I. Heterocyclic, aromatic, and aliphatic amines adsorbed on the anodized silver electrode. J. Electroanal. Chem. Interf. Electr. 1977, 84, 1–20. [Google Scholar] [CrossRef]
- Otto, A. Surface enhanced Raman scattering (SERS), What do we know? Appl. Surf. Sci. 1980, 6, 309–355. [Google Scholar] [CrossRef]
- Yamamoto, Y.S.; Ishikawa, M.; Ozaki, Y.; Itoh, T. Fundamental studies on enhancement and blinking mechanism of surface-enhanced Raman scattering (SERS) and basic applications of SERS biological sensing. Front. Phys. 2014, 9, 31–46. [Google Scholar] [CrossRef]
- Haynes, C.L.; Van Duyne, R.P. Nanosphere lithography: A versatile nanofabrication tool for studies of size-dependent nanoparticle optics. J. Phys. Chem. B 2001, 105, 5599–5611. [Google Scholar] [CrossRef]
- Merk, V.; Kneipp, J.; Leosson, K. Gap size reduction and increased SERS enhancement in lithographically patterned nanoparticle arrays by templated growth. Adv. Opt. Mater. 2013, 1, 313–318. [Google Scholar] [CrossRef]
- Keating, M.; Song, S.; Wei, G.; Graham, D.; Chen, Y.; Placido, F. Ordered silver and copper nanorod arrays for enhanced Raman scattering created via guided oblique angle deposition on polymer. J. Phys. Chem. C 2014, 118, 4878–4884. [Google Scholar] [CrossRef]
- Chen, B.S.; Meng, G.W.; Zhou, F.; Huang, Q.; Zhu, C.H.; Hu, X.Y.; Kong, M.G. Ordered arrays of Au-nanobowls loaded with Ag-nanoparticles as effective SERS substrates for rapid detection of PCBs. Nanotechnology 2014, 25, 145605. [Google Scholar] [CrossRef]
- Pazos-Perez, N.; Ni, W.; Schweikart, A.; Alvarez-Puebla, R.A.; Fery, A.; Liz-Marzan, L.M. Highly uniform SERS substrates formed by wrinkle-confined drying of gold colloids. Chem. Sci. 2010, 1, 174–178. [Google Scholar] [CrossRef]
- Wu, K.Y.; Rindzevicius, T.; Schmidt, M.S.; Mogensen, K.B.; Hakonen, A.; Boisen, A. Wafer-scale leaning silver nanopillars for molecular detection at ultra-low concentrations. J. Phys. Chem. C 2015, 119, 2053–2062. [Google Scholar] [CrossRef]
- Rycenga, M.; Xia, X.; Moran, C.H.; Zhou, F.; Qin, D.; Li, Z.-Y.; Xia, Y. Generation of hot spots with silver nanocubes for single-molecule detection by surface-enhanced Raman scattering. Angew. Chem. Int. Ed. 2011, 50, 5473–5477. [Google Scholar] [CrossRef]
- Matteini, P.; Cottat, M.; Tavanti, F.; Panfilova, E.; Scuderi, M.; Nicotra, G.; Menziani, M.C.; Khlebtsov, N.; de Angelis, M.; Pini, R. Site-Selective Surface-Enhanced Raman Detection of Proteins. ACS Nano 2017, 11, 918–926. [Google Scholar] [CrossRef]
- Severyukhina, A.N.; Parakhonskiy, B.V.; Prikhozhdenko, E.S.; Gorin, D.A.; Sukhorukov, G.B.; Möhwald, H.; Yashchenok, A.M. Nanoplasmonic Chitosan Nanofibers as Effective SERS Substrate for Detection of Small Molecules. ACS Appl. Mater. Interfaces 2015, 7, 15466–15473. [Google Scholar] [CrossRef]
- Qian, X.; Peng, X.H.; Ansari, D.O.; Yin-Goen, Q.; Chen, G.Z.; Shin, D.M.; Yang, L.; Young, A.N.; Wang, M.D.; Nie, S. In vivo tumor targeting and spectroscopic detection with surface-enhanced Raman nanoparticle tags. Nat. Biotechnol. 2008, 26, 83–90. [Google Scholar] [CrossRef]
- Bohndiek, S.E.; Wagadarikar, A.; Zavaleta, C.L.; Van de Sompel, D.; Garai, E.; Jokerst, J.V.; Yazdanfar, S.; Gambhir, S.S. A small animal Raman instrument for rapid, wide-area, spectroscopic imaging. Proc. Natl. Acad. Sci. USA 2013, 110, 12408–12413. [Google Scholar] [CrossRef] [Green Version]
- Panikkanvalappil, S.R.; MacKey, M.A.; El-Sayed, M.A. Probing the unique dehydration-induced structural modifications in cancer cell DNA using surface enhanced Raman spectroscopy. J. Am. Chem. Soc. 2013, 135, 4815–4821. [Google Scholar] [CrossRef]
- Prikhozhdenko, E.S.; Atkin, V.S.; Parakhonskiy, B.V.; Rybkin, I.A.; Lapanje, A.; Sukhorukov, G.B.; Gorin, D.A.; Yashchenok, A.M. New post-processing method of preparing nanofibrous SERS substrates with a high density of silver nanoparticles. RSC Adv. 2016, 6, 84505–84511. [Google Scholar] [CrossRef]
- Xiong, Q.; Lim, C.Y.; Ren, J.; Zhou, J.; Pu, K.; Chan-Park, M.B.; Mao, H.; Lam, Y.C.; Duan, H. Magnetic nanochain integrated microfluidic biochips. Nat. Commun. 2018, 9, 1743. [Google Scholar] [CrossRef]
- Lin, D.; Gong, T.; Qiu, S.; Wu, Q.; Tseng, C.-Y.; Kong, K.V.; Chen, G.; Chen, R. A dual signal amplification nanosensor based on SERS technology for detection of tumor-related DNA. Chem. Commun. 2019, 55, 1548–1551. [Google Scholar] [CrossRef]
- Wang, Y.; Salehi, M.; Schütz, M.; Schlücker, S. Femtogram detection of cytokines in a direct dot-blot assay using SERS microspectroscopy and hydrophilically stabilized Au-Ag nanoshells. Chem. Commun. 2014, 50, 2711–2714. [Google Scholar] [CrossRef]
- Chao, J.; Cao, W.; Su, S.; Weng, L.; Song, S.; Fan, C.; Wang, L. Nanostructure-based surface-enhanced Raman scattering biosensors for nucleic acids and proteins. J. Mater. Chem. B 2016, 4, 1757–1769. [Google Scholar] [CrossRef]
- Vo-Dinh, T.; Allain, L.R.; Stokes, D.L. Cancer gene detection using surface-enhanced Raman scattering (SERS). J. Raman Spectrosc. 2002, 33, 511–516. [Google Scholar] [CrossRef]
- Stremersch, S.; Marro, M.; Pinchasik, B.-E.; Baatsen, P.; Hendrix, A.; De Smedt, S.C.; Loza-Alvarez, P.; Skirtach, A.G.; Raemdonck, K.; Braeckmans, K. Identification of Individual Exosome-Like Vesicles by Surface Enhanced Raman Spectroscopy. Small 2016, 12, 3292–3301. [Google Scholar] [CrossRef] [Green Version]
- Lee, C.; Carney, R.P.; Hazari, S.; Smith, Z.J.; Knudson, A.; Robertson, C.S.; Lam, K.S.; Wachsmann-Hogiu, S. 3D plasmonic nanobowl platform for the study of exosomes in solution. Nanoscale 2015, 7, 9290–9297. [Google Scholar] [CrossRef]
- Sivashanmugan, K.; Huang, W.L.; Lin, C.H.; Der Liao, J.; Lin, C.C.; Su, W.C.; Wen, T.C. Bimetallic nanoplasmonic gap-mode SERS substrate for lung normal and cancer-derived exosomes detection. J. Taiwan Inst. Chem. Eng. 2017, 80, 149–155. [Google Scholar] [CrossRef]
- Tirinato, L.; Gentile, F.; Di Mascolo, D.; Coluccio, M.L.; Das, G.; Liberale, C.; Pullano, S.A.; Perozziello, G.; Francardi, M.; Accardo, A.; et al. SERS analysis on exosomes using super-hydrophobic surfaces. Microelectron. Eng. 2012, 97, 337–340. [Google Scholar] [CrossRef]
- Park, J.; Hwang, M.; Choi, B.; Jeong, H.; Jung, J.H.; Kim, H.K.; Hong, S.; Park, J.H.; Choi, Y. Exosome Classification by Pattern Analysis of Surface-Enhanced Raman Spectroscopy Data for Lung Cancer Diagnosis. Anal. Chem. 2017, 89, 6695–6701. [Google Scholar] [CrossRef]
- Shin, H.; Jeong, H.; Park, J.; Hong, S.; Choi, Y. Correlation between Cancerous Exosomes and Protein Markers Based on Surface-Enhanced Raman Spectroscopy (SERS) and Principal Component Analysis (PCA). ACS Sens. 2018, 3, 2637–2643. [Google Scholar] [CrossRef]
- Yan, Z.; Dutta, S.; Liu, Z.; Yu, X.; Mesgarzadeh, N.; Ji, F.; Bitan, G.; Xie, Y.-H. A Label-Free Platform for Identification of Exosomes from Different Sources. ACS Sens. 2019, 4, 488–497. [Google Scholar] [CrossRef]
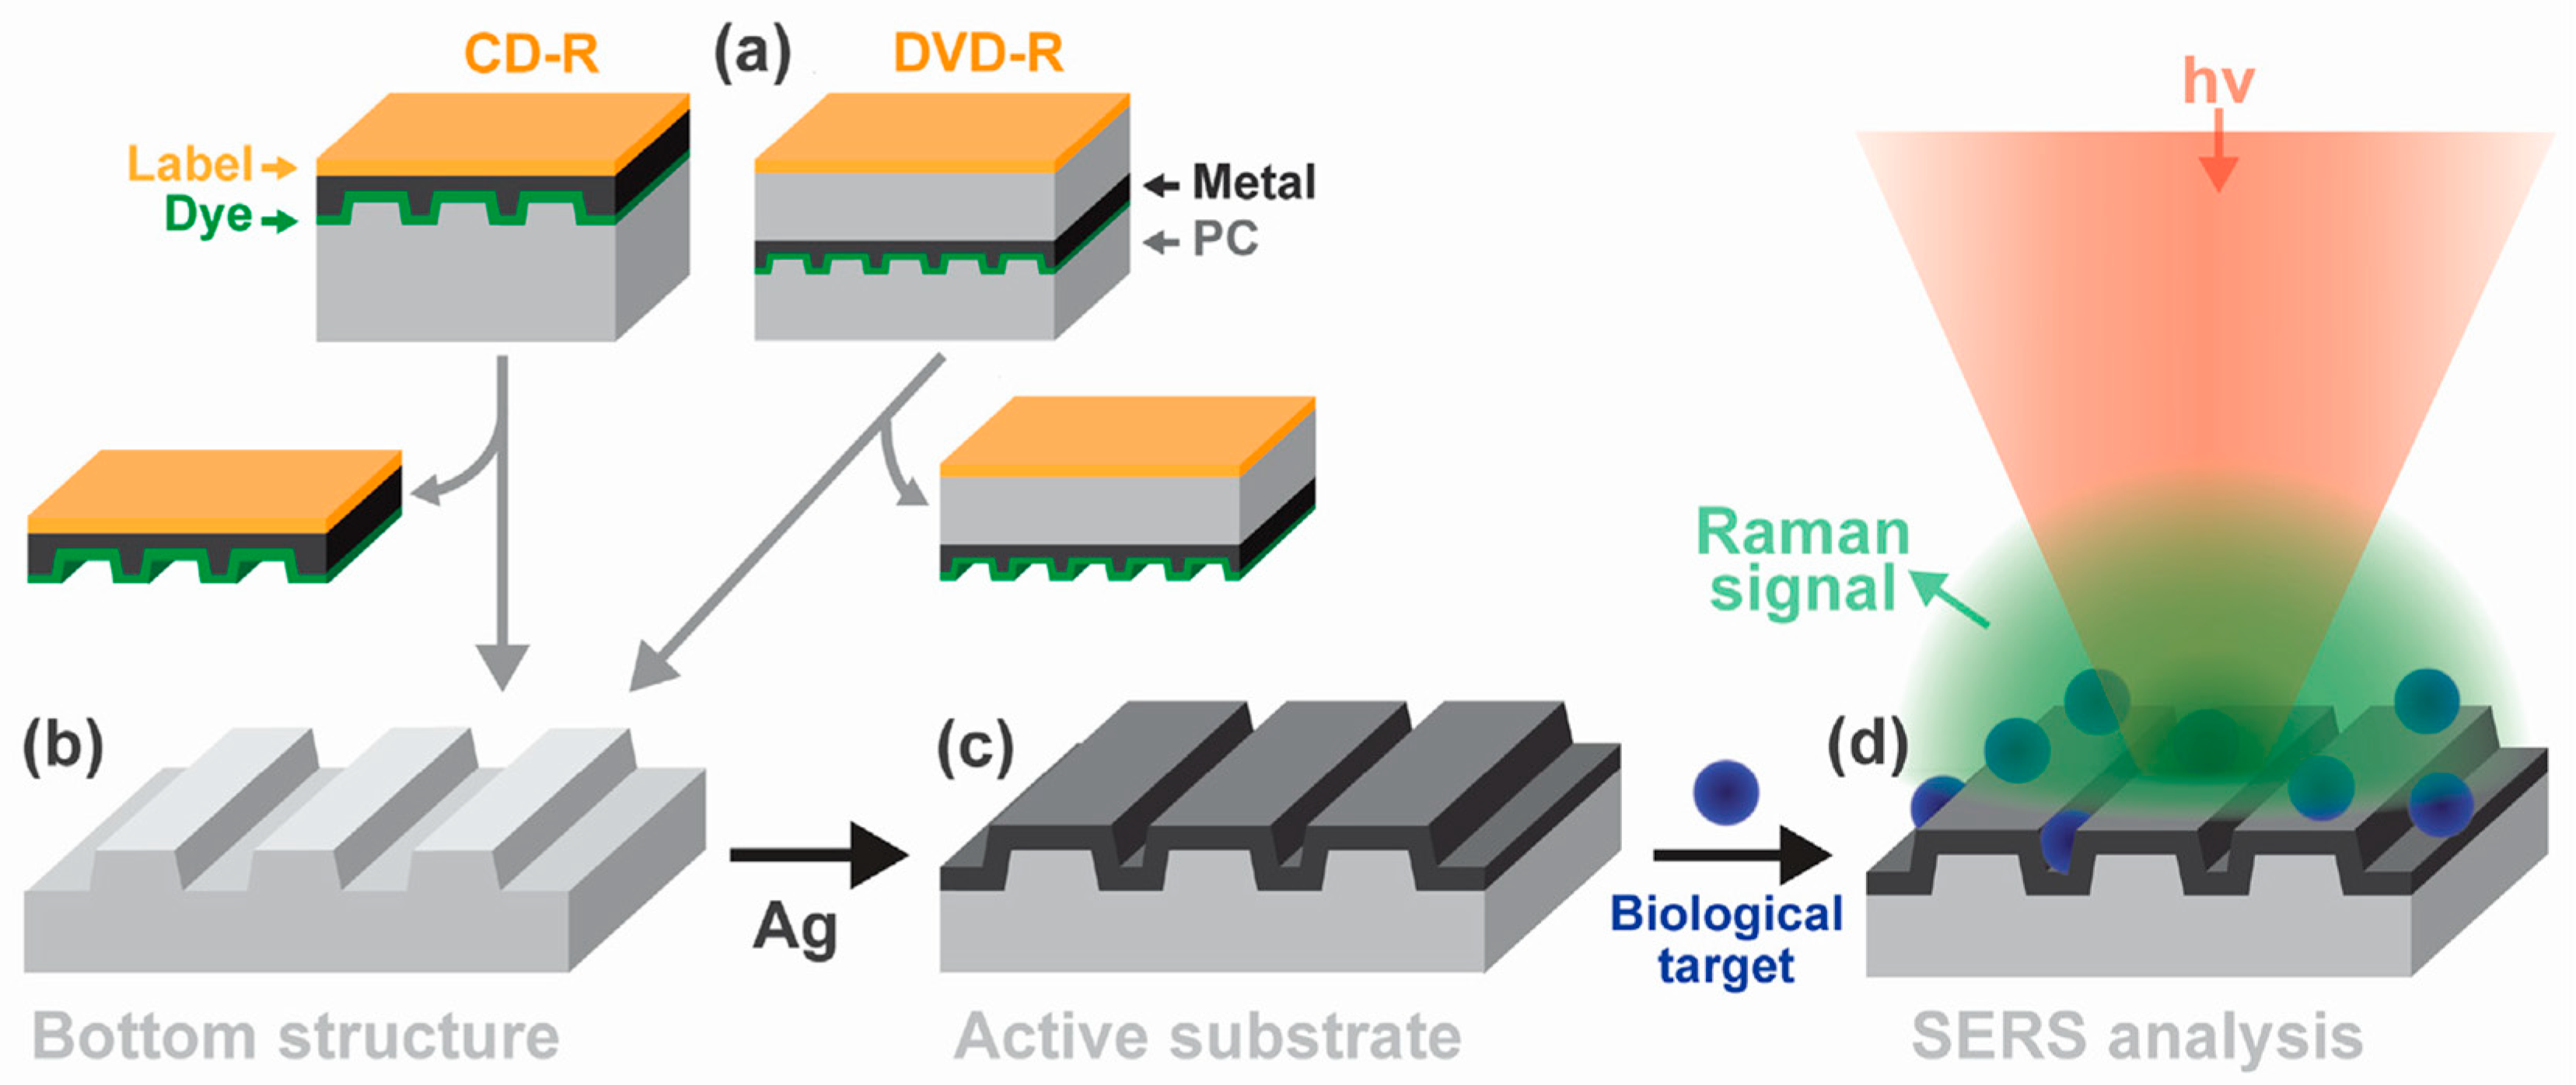
- Avella-Oliver, M.; Puchades, R.; Wachsmann-Hogiu, S.; Maquieira, A. Label-free SERS analysis of proteins and exosomes with large-scale substrates from recordable compact disks. Sens. Actuators B Chem. 2017, 252, 657–662. [Google Scholar] [CrossRef]
- Kerr, L.T.; Gubbins, L.; Weiner Gorzel, K.; Sharma, S.; Kell, M.; McCann, A.; Hennelly, B.M. Raman spectroscopy and SERS analysis of ovarian tumour derived exosomes (TEXs): A preliminary study. Proc. SPIE 2014, 9129, 9. [Google Scholar]
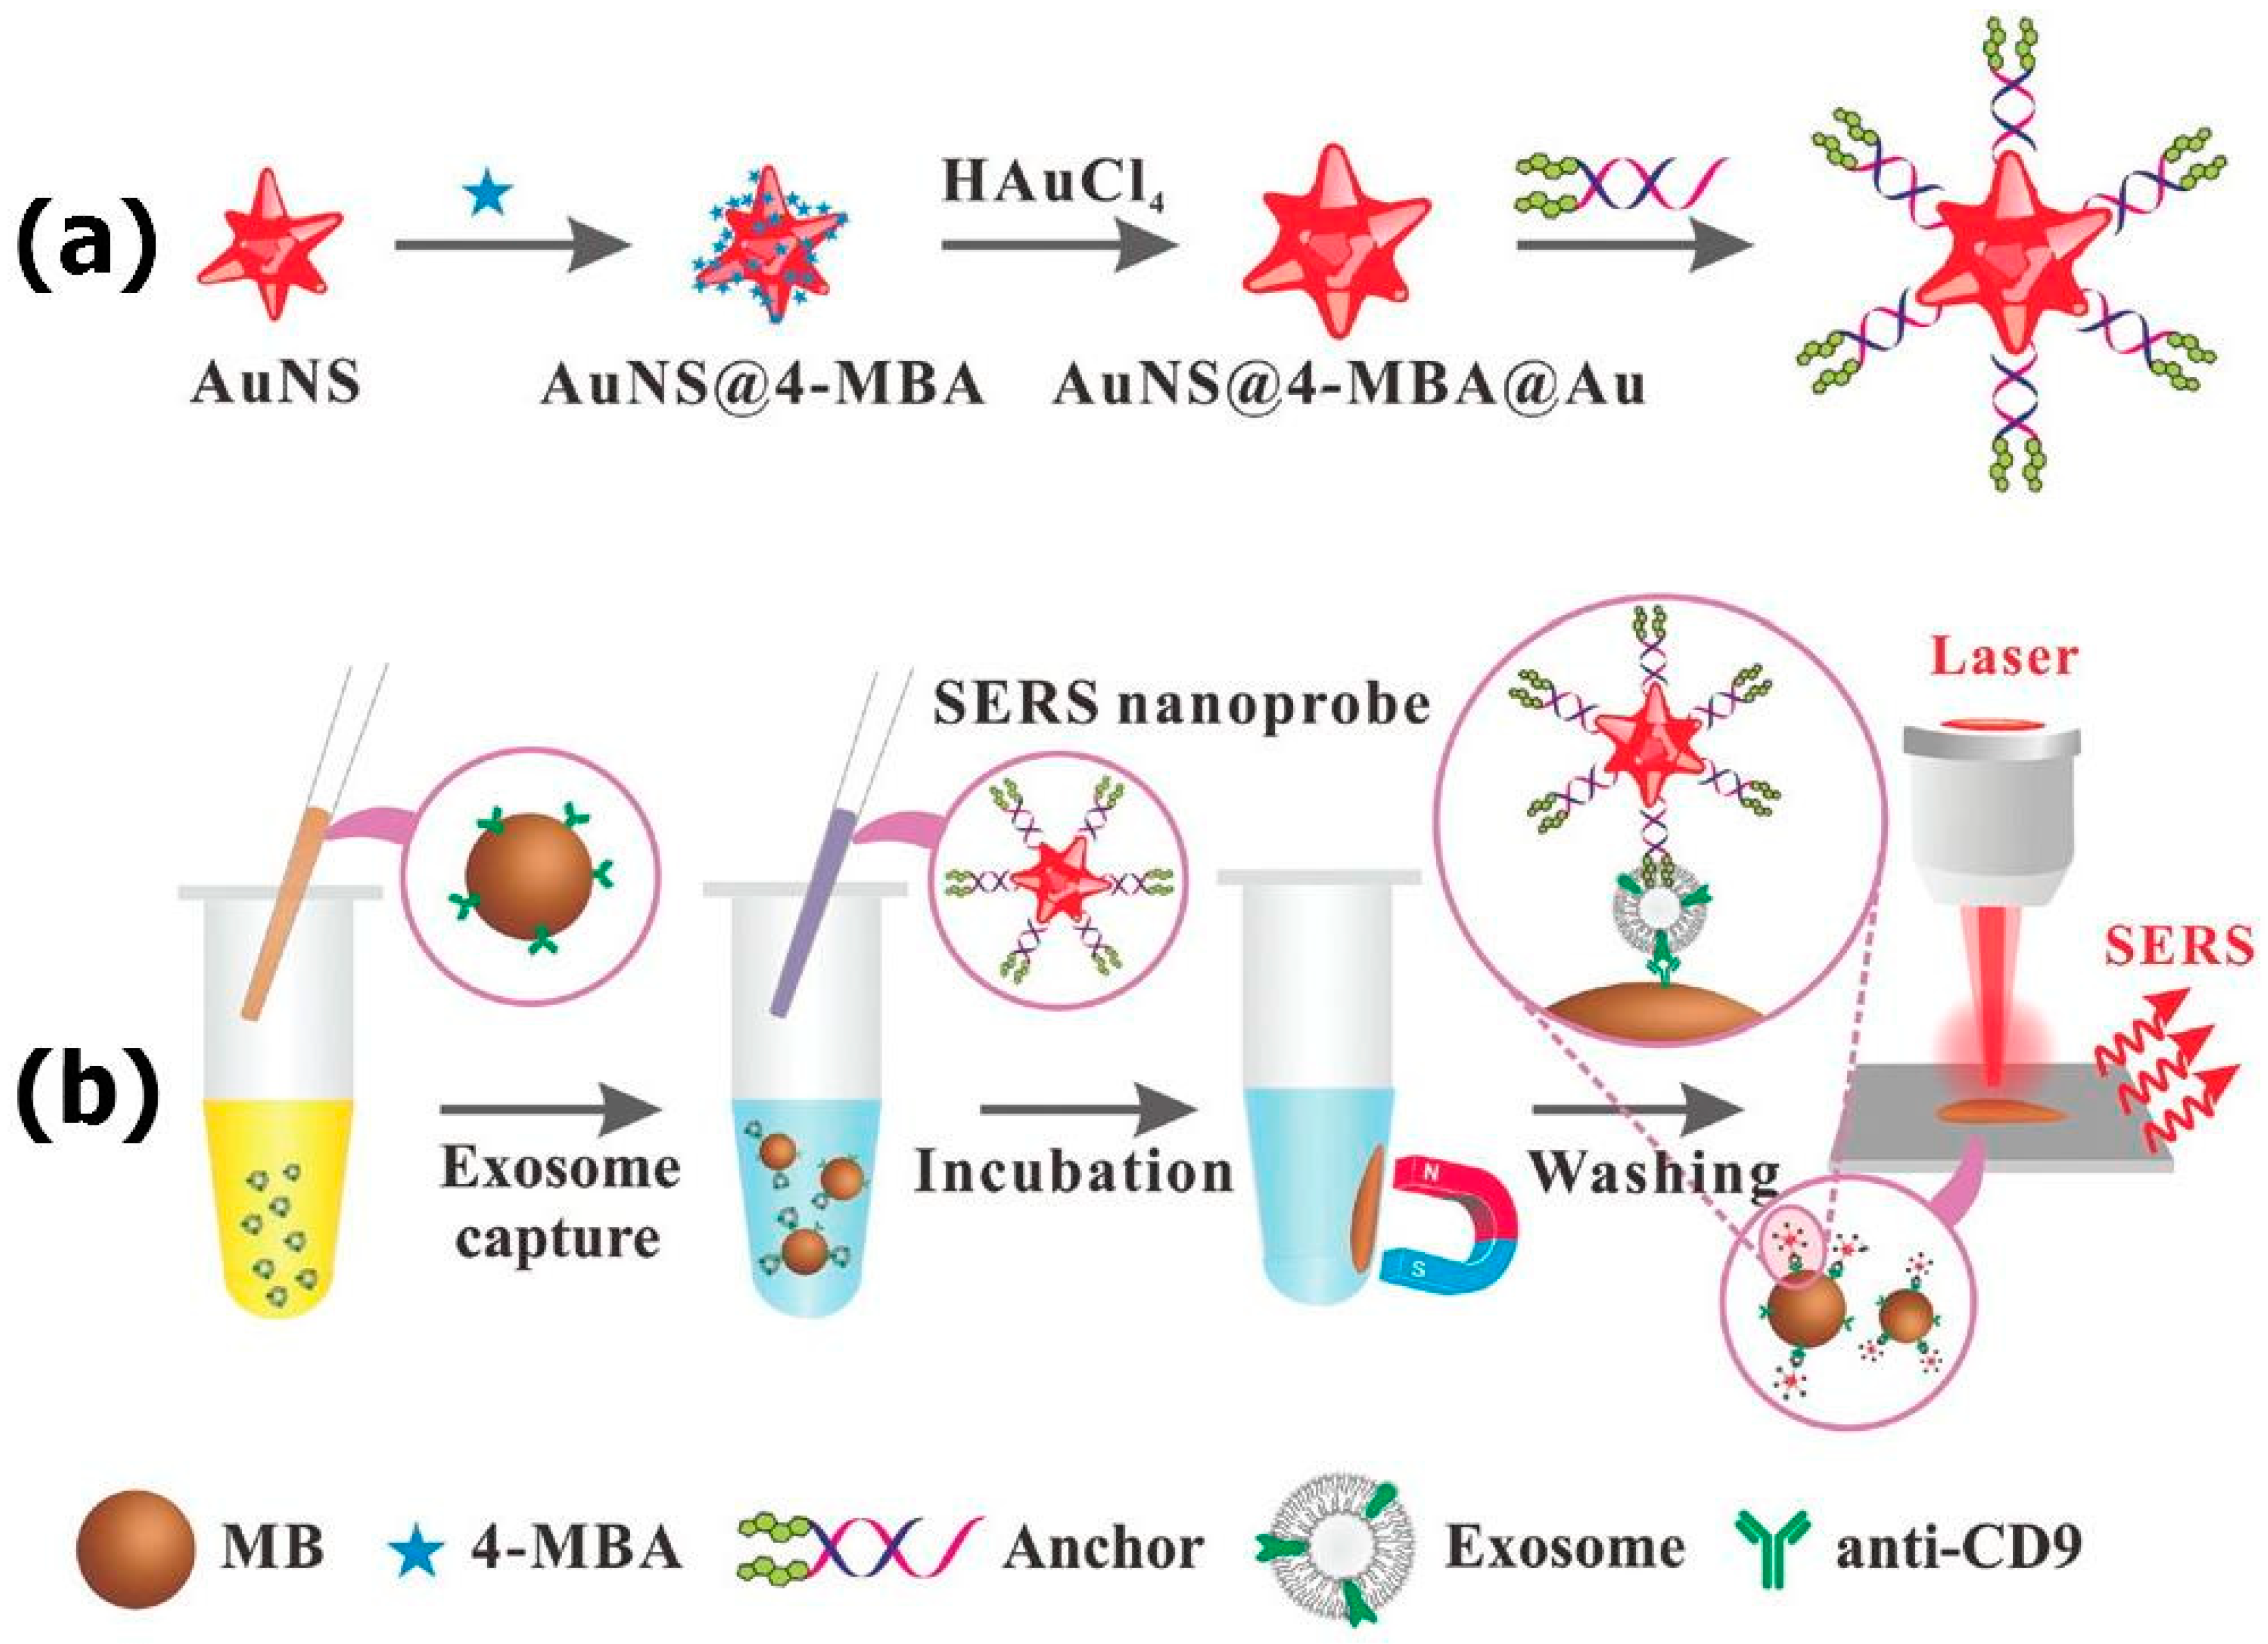
- Zong, S.; Wang, L.; Chen, C.; Lu, J.; Zhu, D.; Zhang, Y.; Wang, Z.; Cui, Y. Facile detection of tumor-derived exosomes using magnetic nanobeads and SERS nanoprobes. Anal. Methods 2016, 8, 5001–5008. [Google Scholar] [CrossRef]
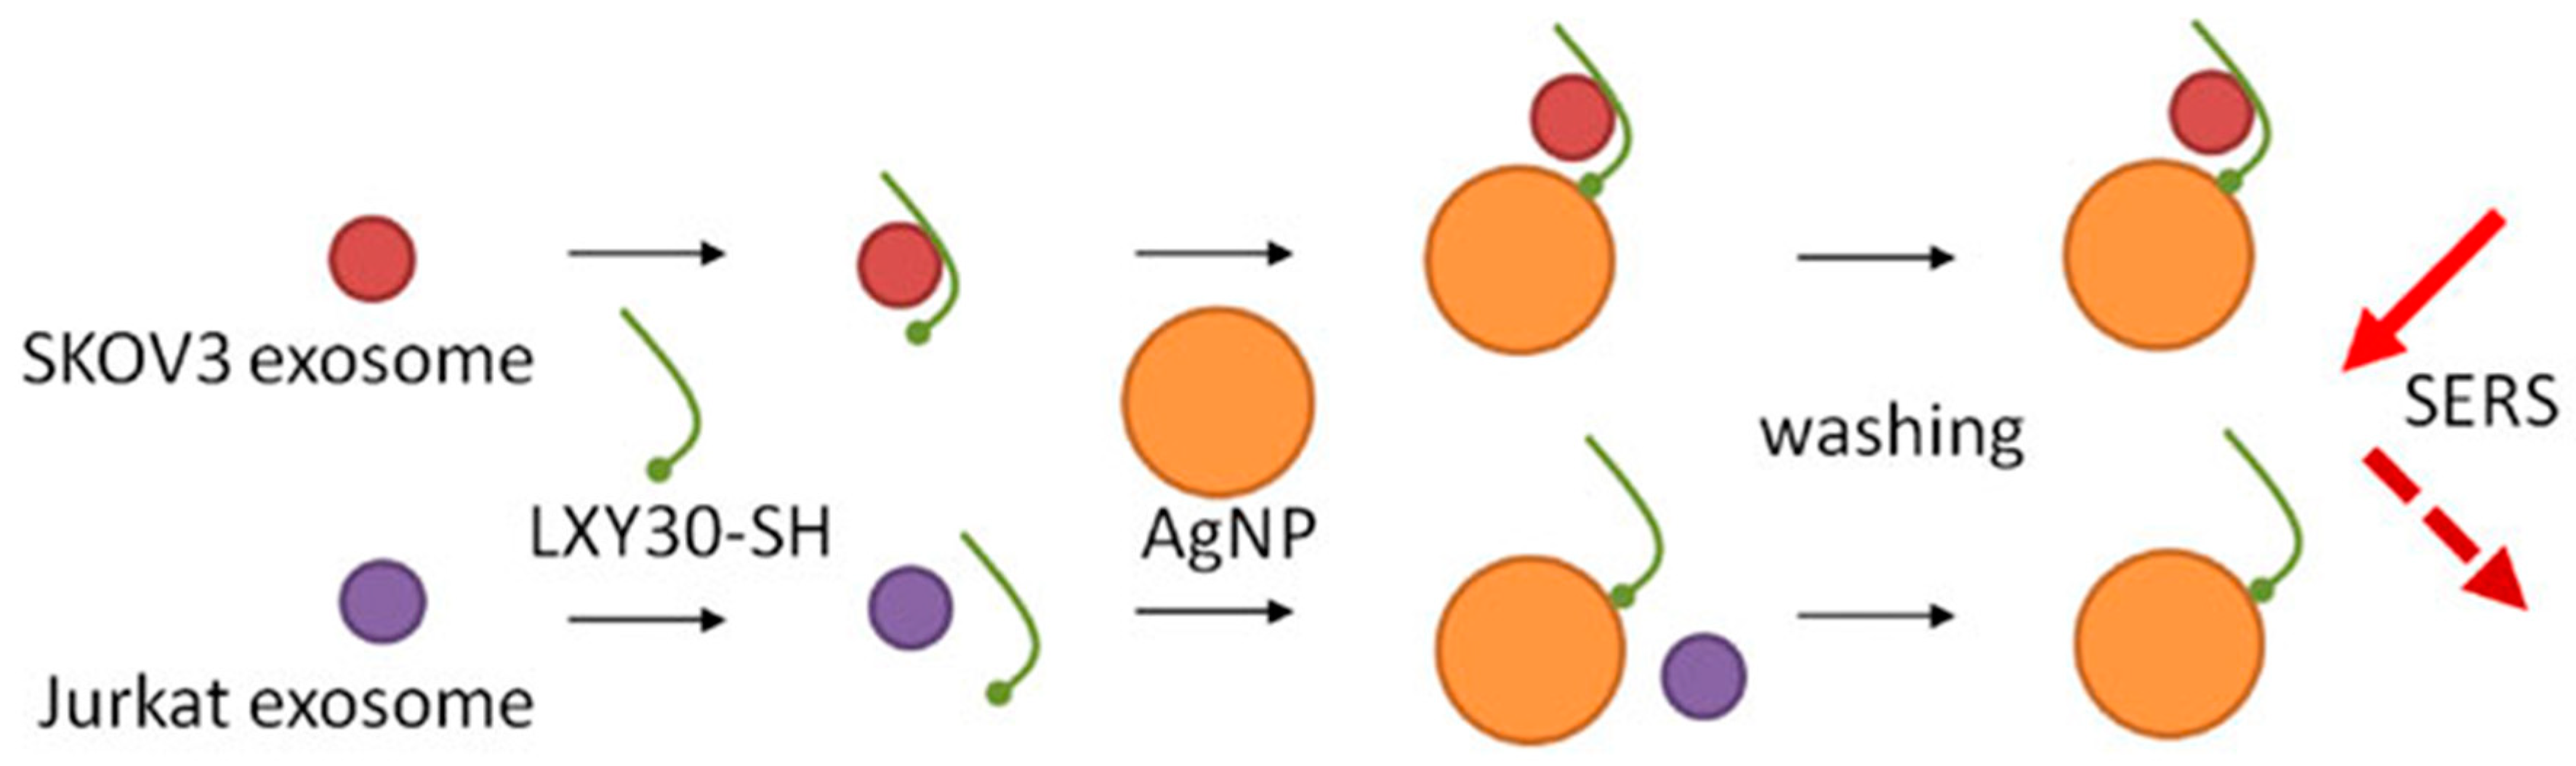
- Lee, C.; Carney, R.; Lam, K.; Chan, J.W. SERS analysis of selectively captured exosomes using an integrin-specific peptide ligand. J. Raman Spectrosc. 2017, 48, 1771–1776. [Google Scholar] [CrossRef]
- Tian, Y.F.; Ning, C.F.; He, F.; Yin, B.C.; Ye, B.C. Highly sensitive detection of exosomes by SERS using gold nanostar@Raman reporter@nanoshell structures modified with a bivalent cholesterol-labeled DNA anchor. Analyst 2018, 143, 4915–4922. [Google Scholar]
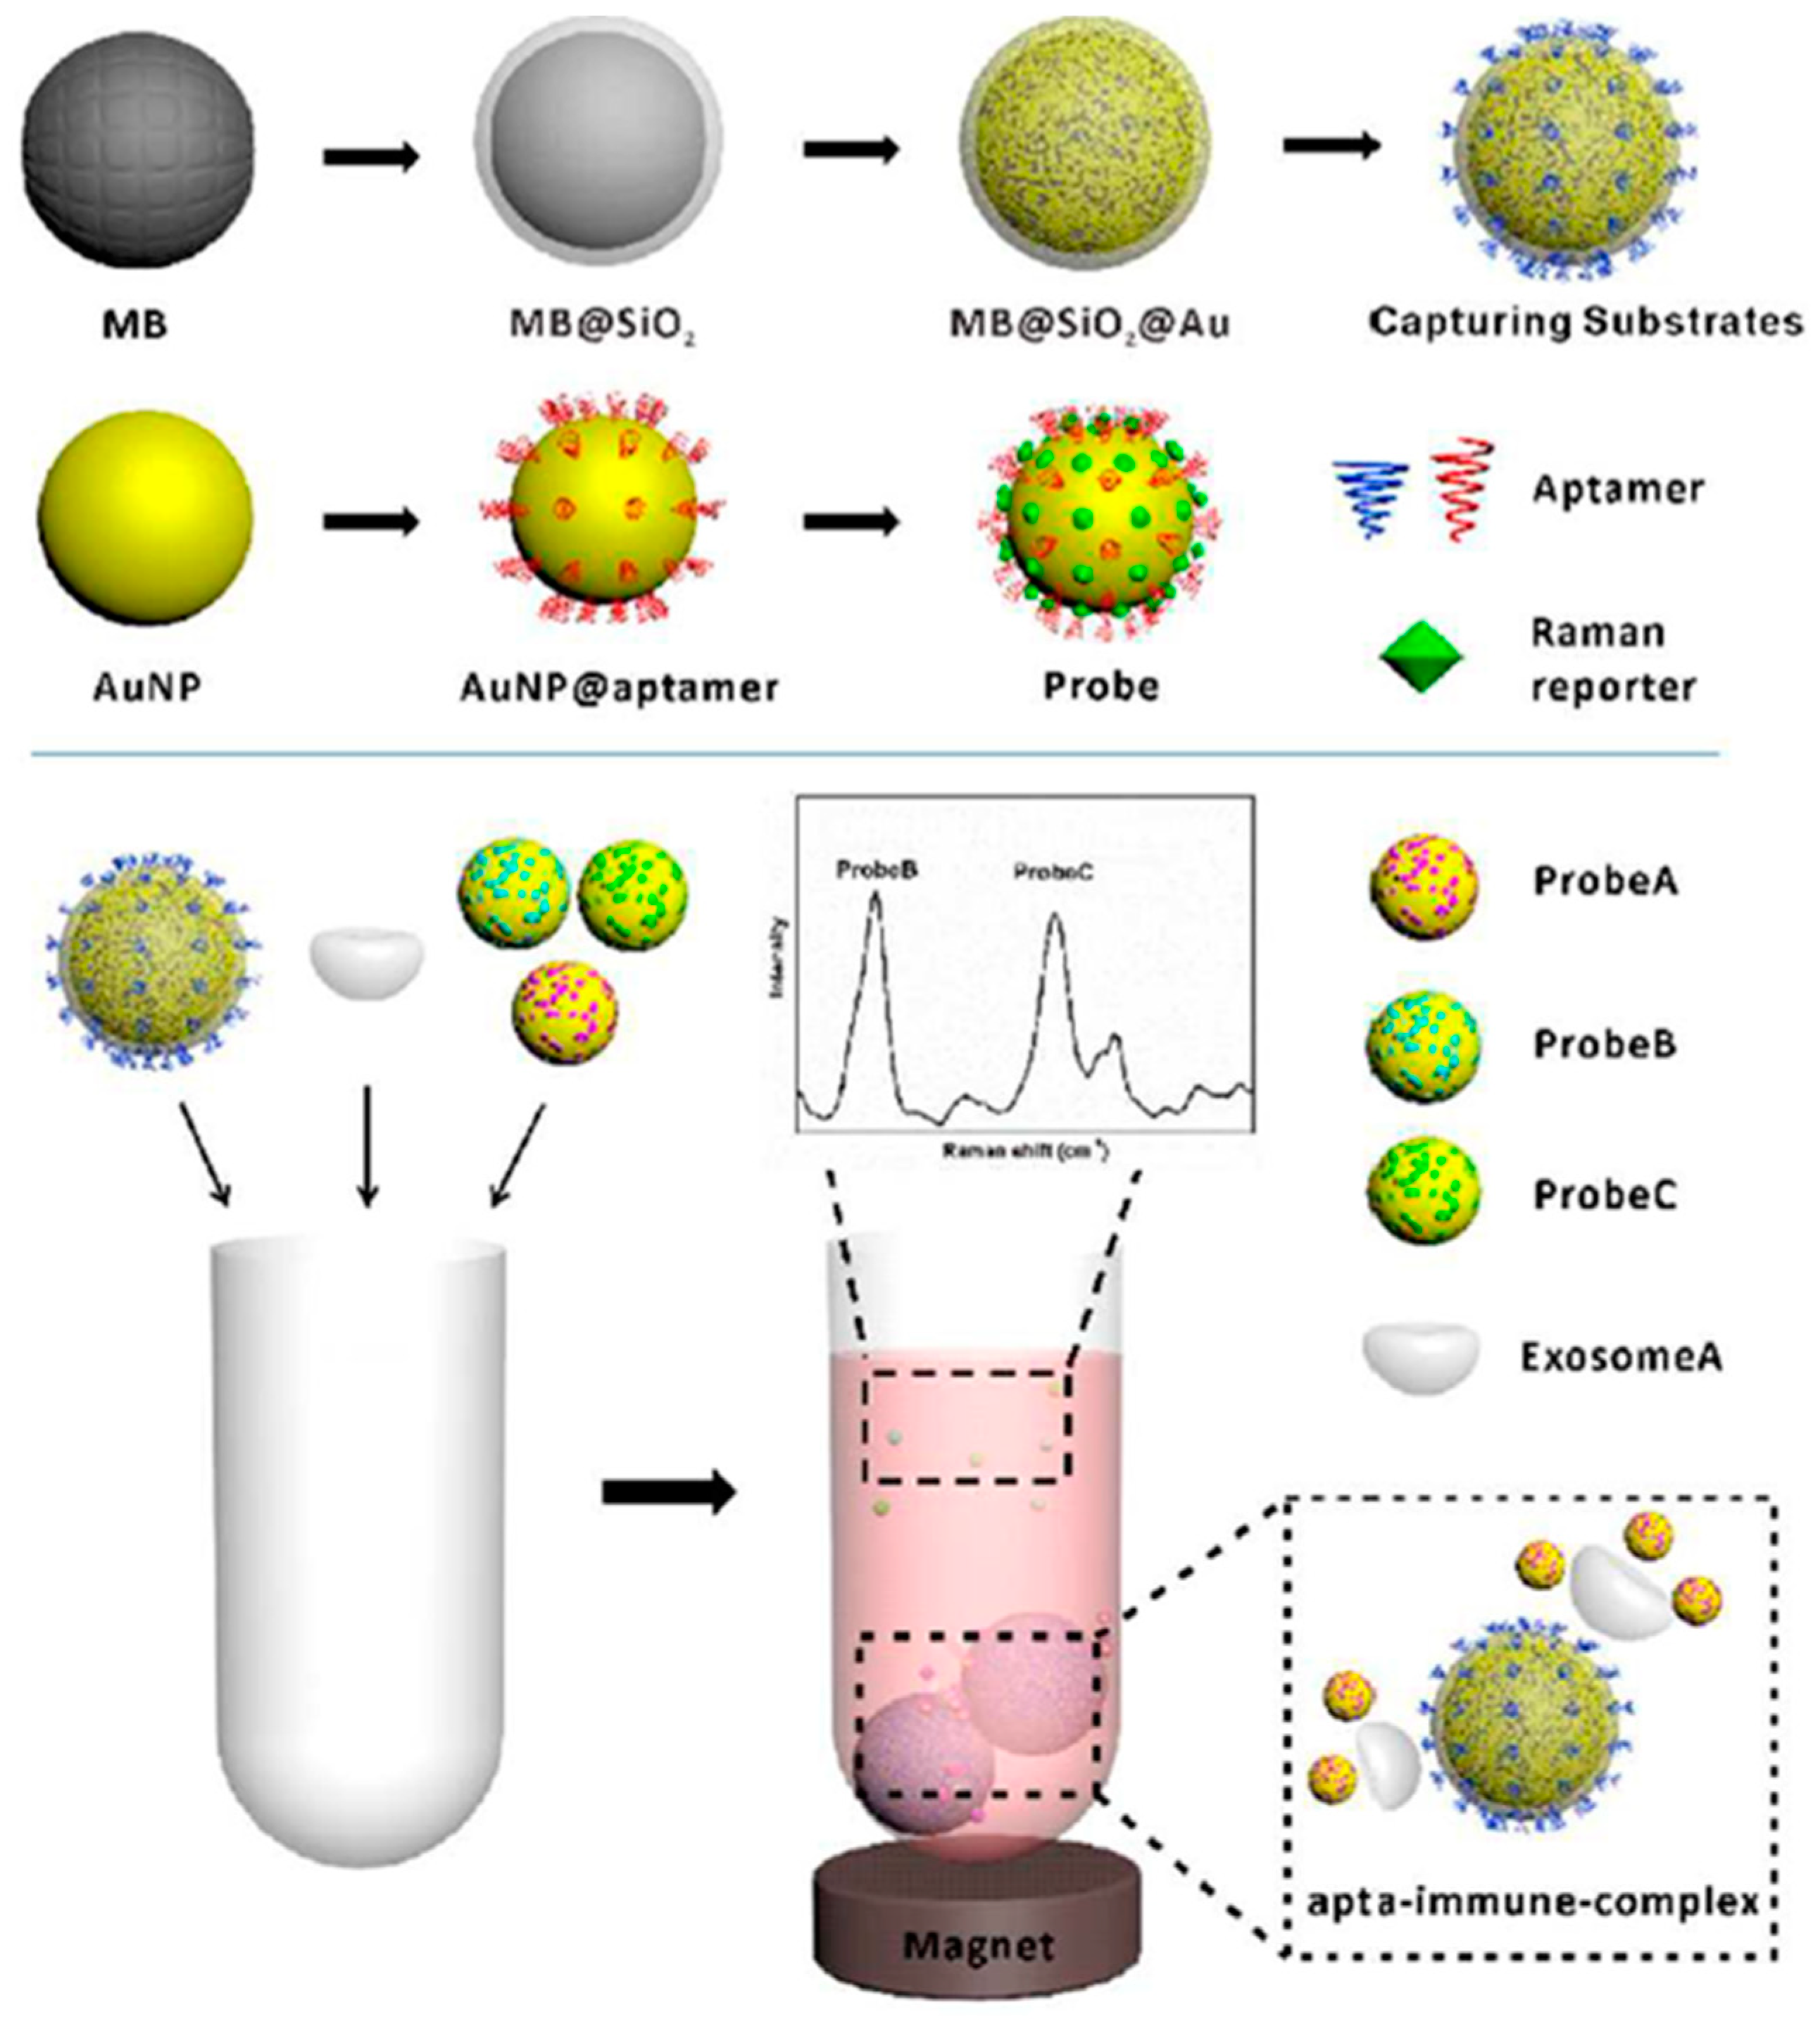
- Wang, Z.; Zong, S.; Wang, Y.; Li, N.; Li, L.; Lu, J.; Wang, Z.; Chen, B.; Cui, Y. Screening and multiple detection of cancer exosomes using an SERS-based method. Nanoscale 2018, 10, 9053–9062. [Google Scholar] [CrossRef]
- Kwizera, E.A.; O’Connor, R.; Vinduska, V.; Williams, M.; Butch, E.R.; Snyder, S.E.; Chen, X.; Huang, X. Molecular Detection and Analysis of Exosomes Using Surface-Enhanced Raman Scattering Gold Nanorods and a Miniaturized Device. Theranostics 2018, 8, 2722–2738. [Google Scholar] [CrossRef] [Green Version]
- Li, T.-D.; Zhang, R.; Chen, H.; Huang, Z.-P.; Ye, X.; Wang, H.; Deng, A.-M.; Kong, J.-L. An ultrasensitive polydopamine bi-functionalized SERS immunoassay for exosome-based diagnosis and classification of pancreatic cancer. Chem. Sci. 2018, 9, 5372–5382. [Google Scholar] [CrossRef] [Green Version]
- Persichetti, G.; Grimaldi, I.A.; Testa, G.; Bernini, R. Multifunctional optofluidic lab-on-chip platform for Raman and fluorescence spectroscopic microfluidic analysis. Lab Chip 2017, 17, 2631–2639. [Google Scholar] [CrossRef]
- Wuytens, P.C.; Skirtach, A.G.; Baets, R. On-chip surface-enhanced Raman spectroscopy using nanosphere-lithography patterned antennas on silicon nitride waveguides. Opt. Express 2017, 25, 12926–12934. [Google Scholar] [CrossRef]


| Exosome Concentration (Volume) | Cells—Sources of the Exosomes and Cancer Type | Cells Origin | Purification | Limit of Detection (LOD) | Type of SERS Substrate | Measurement Conditions | Ref. | ||
|---|---|---|---|---|---|---|---|---|---|
| Integration Time | Laser Power | Excitation Wavelength | |||||||
| ≤ 5 × 10⁷ p/µL (60 μL) | B16F10 (melanoma) RBC | Cell culture | Iodixanol density gradient based UC | Close to single vesicle detection | AuNPs | 10 s 500 min | 15 mW | 785 nm | [94] |
| 580 fM (20 μL) | SKOV3 (ovarian adenocarcinoma) | Cell culture | Total Exosome Solution Reagent (TEIR), UC | Limited by scanned area | Ag-Nanobowls | 10 s | 42 µW | 633 nm | [95] |
| 1.1 × 10⁶–1.2 × 10⁸ p/mL (5 μL) | PC-9 H1975 HCC827 (NSCLC, lung adenocarcinoma) NL-20 BEAS-2B (normal lung epithelial cells) L929 (normal lung fibroblast cells) | Cell culture | Centrifugation and nanomembrane concentration | 106 p/mL | AgNC on AuNR array substrate | 10 s | N/A | 785 nm | [96] |
| 0.2 ng/mL (5 μL) | HCT116 (colorectal carcinoma) CCD841-CoN (healthy colon epithelial cells) | Cell culture | ExoQuick Exosome Precipitation Solution | N/A | Ag-coated super-hydrophobic silicon micropillars | 20 s | 0.18 mW | 514 nm | [97] |
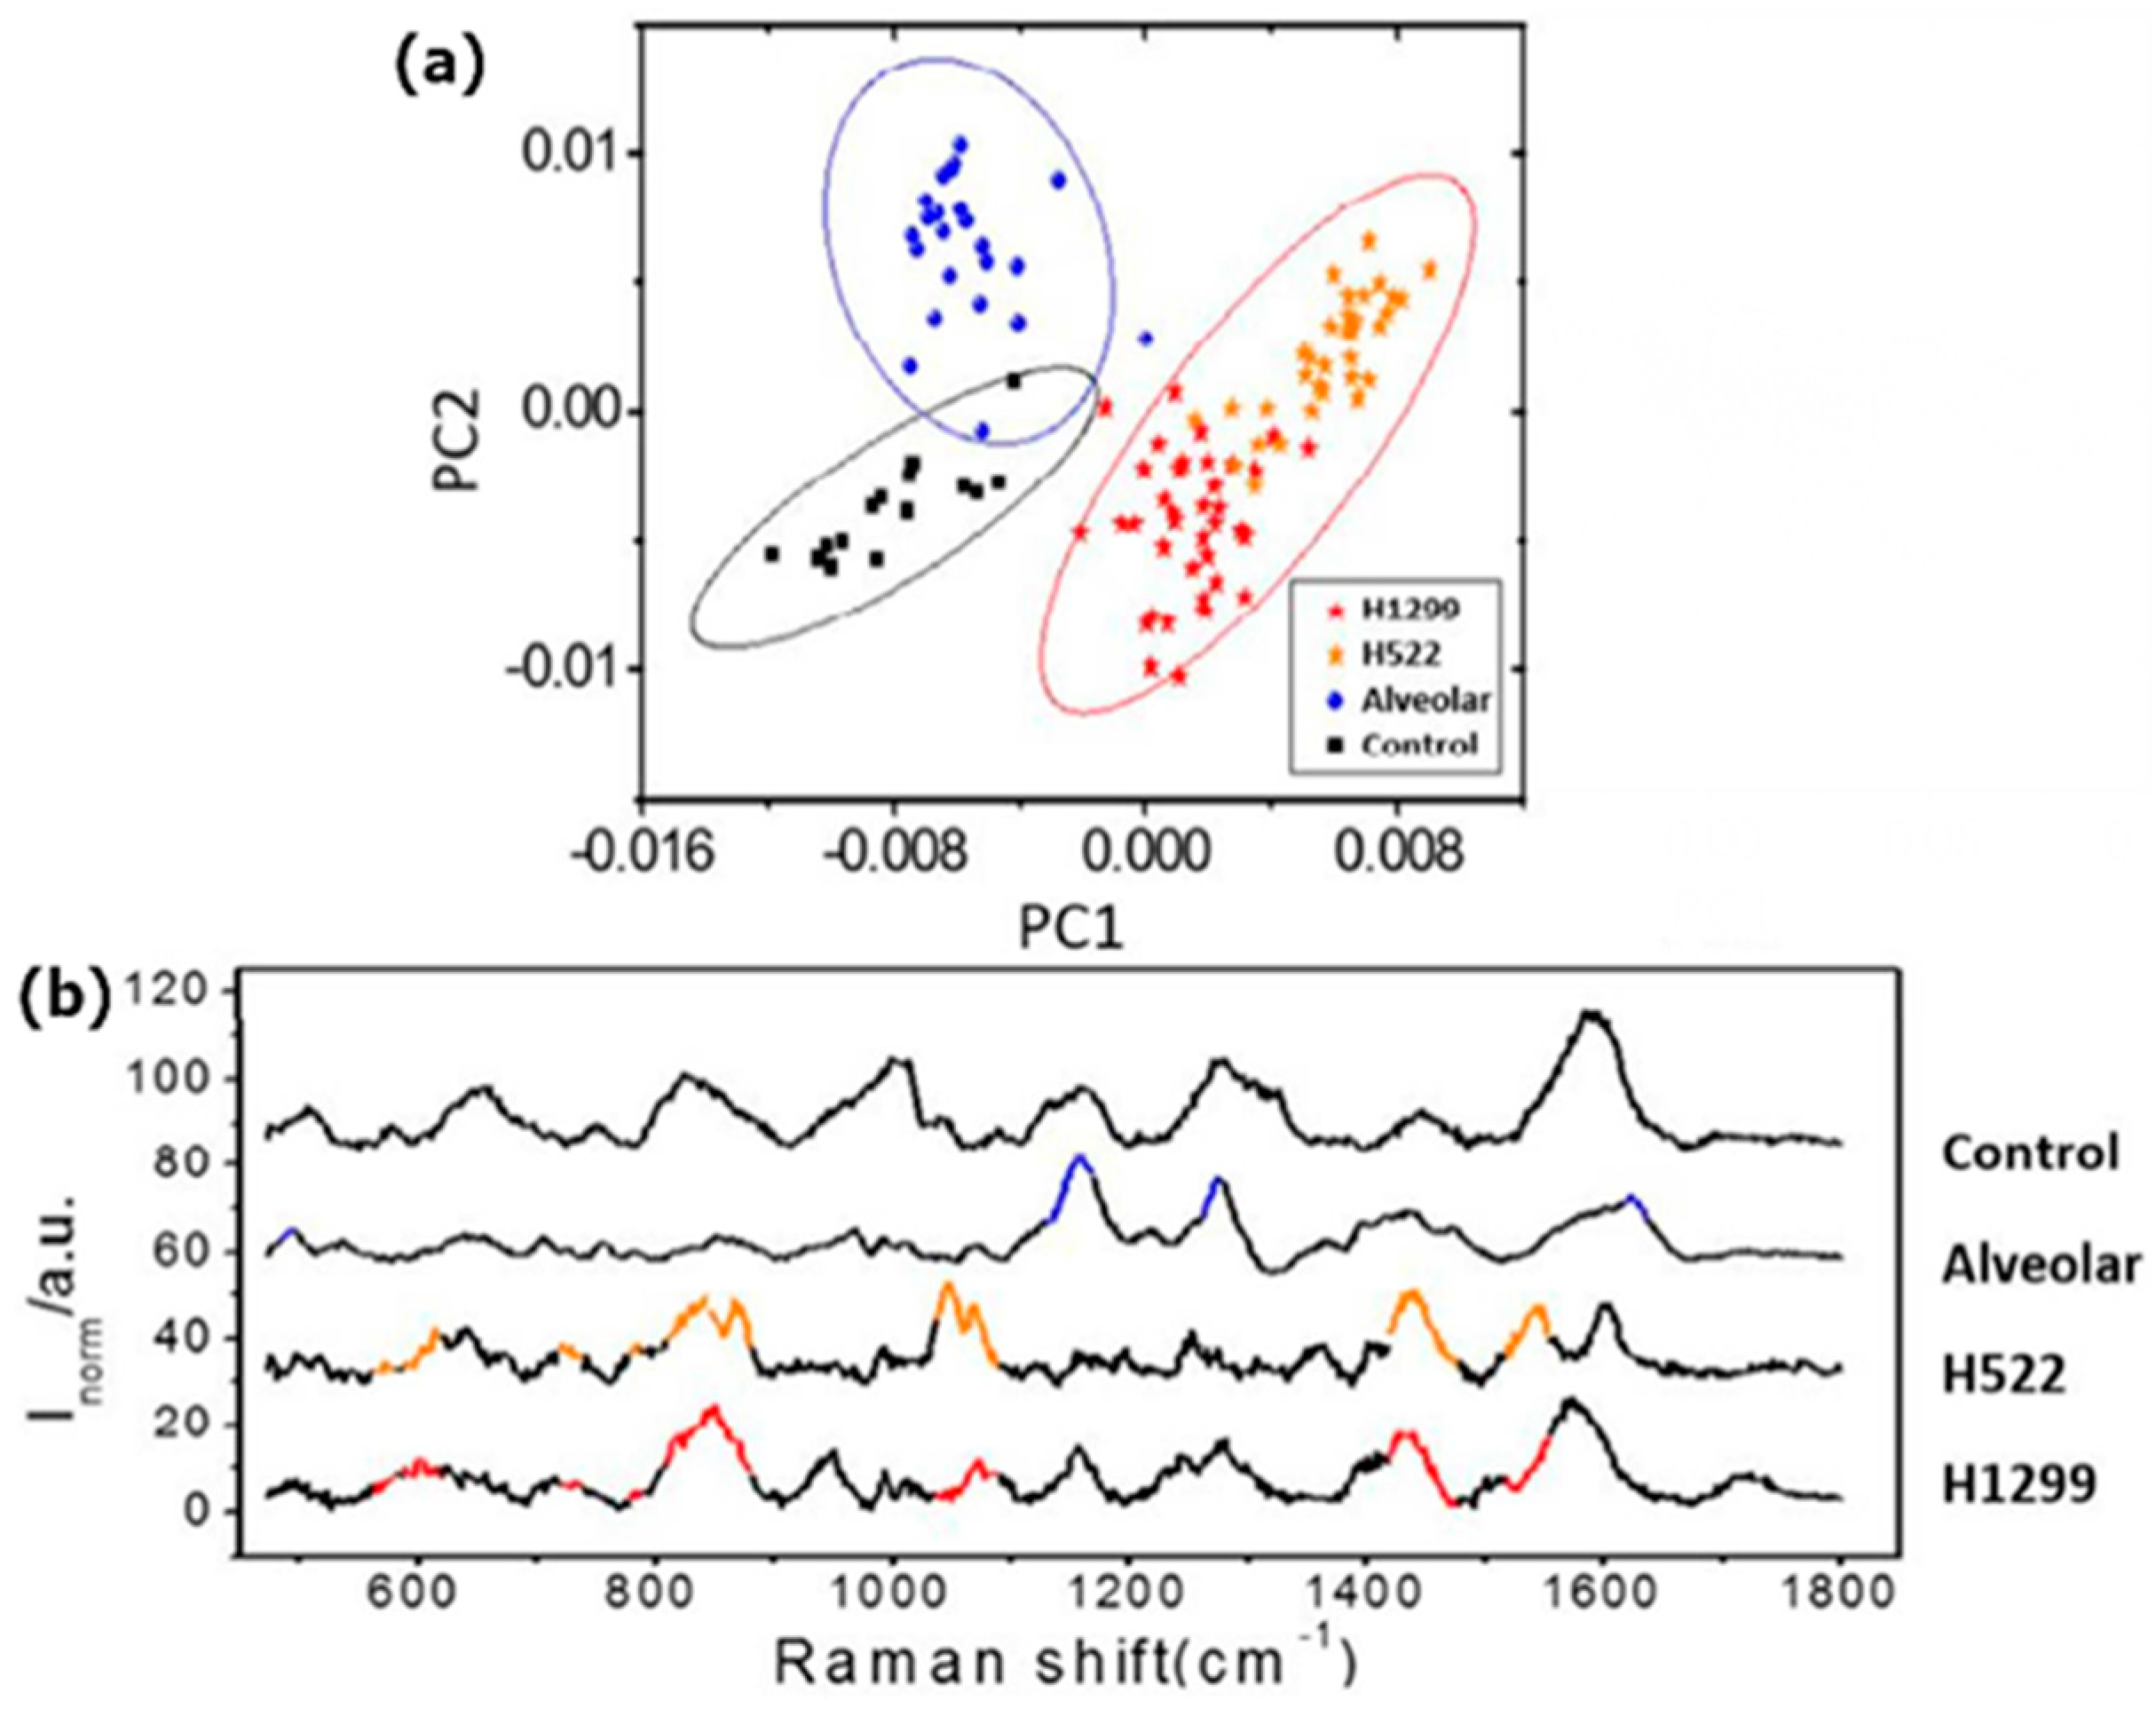
| 109 p/mL (50 μL) | H1299 H522 (NSCLC, lung carcinoma) Normal human pulmonary alveolar epithelial cells | Cell culture | Centrifugation and centrifugal membrane filtration | N/A | AuNP | 10 s | 10 mW | 785 nm | [98] |
| 108 p/mL | PC9 (NSCLC, lung adenocarcinoma) H1299 (NSCLC, lung carcinoma) HPAEC (normal alveolar cells) | Cell culture | Size-exclusion column chromatography | N/A | AuNP | 10 s | 5 mW | 785 nm | [99] |
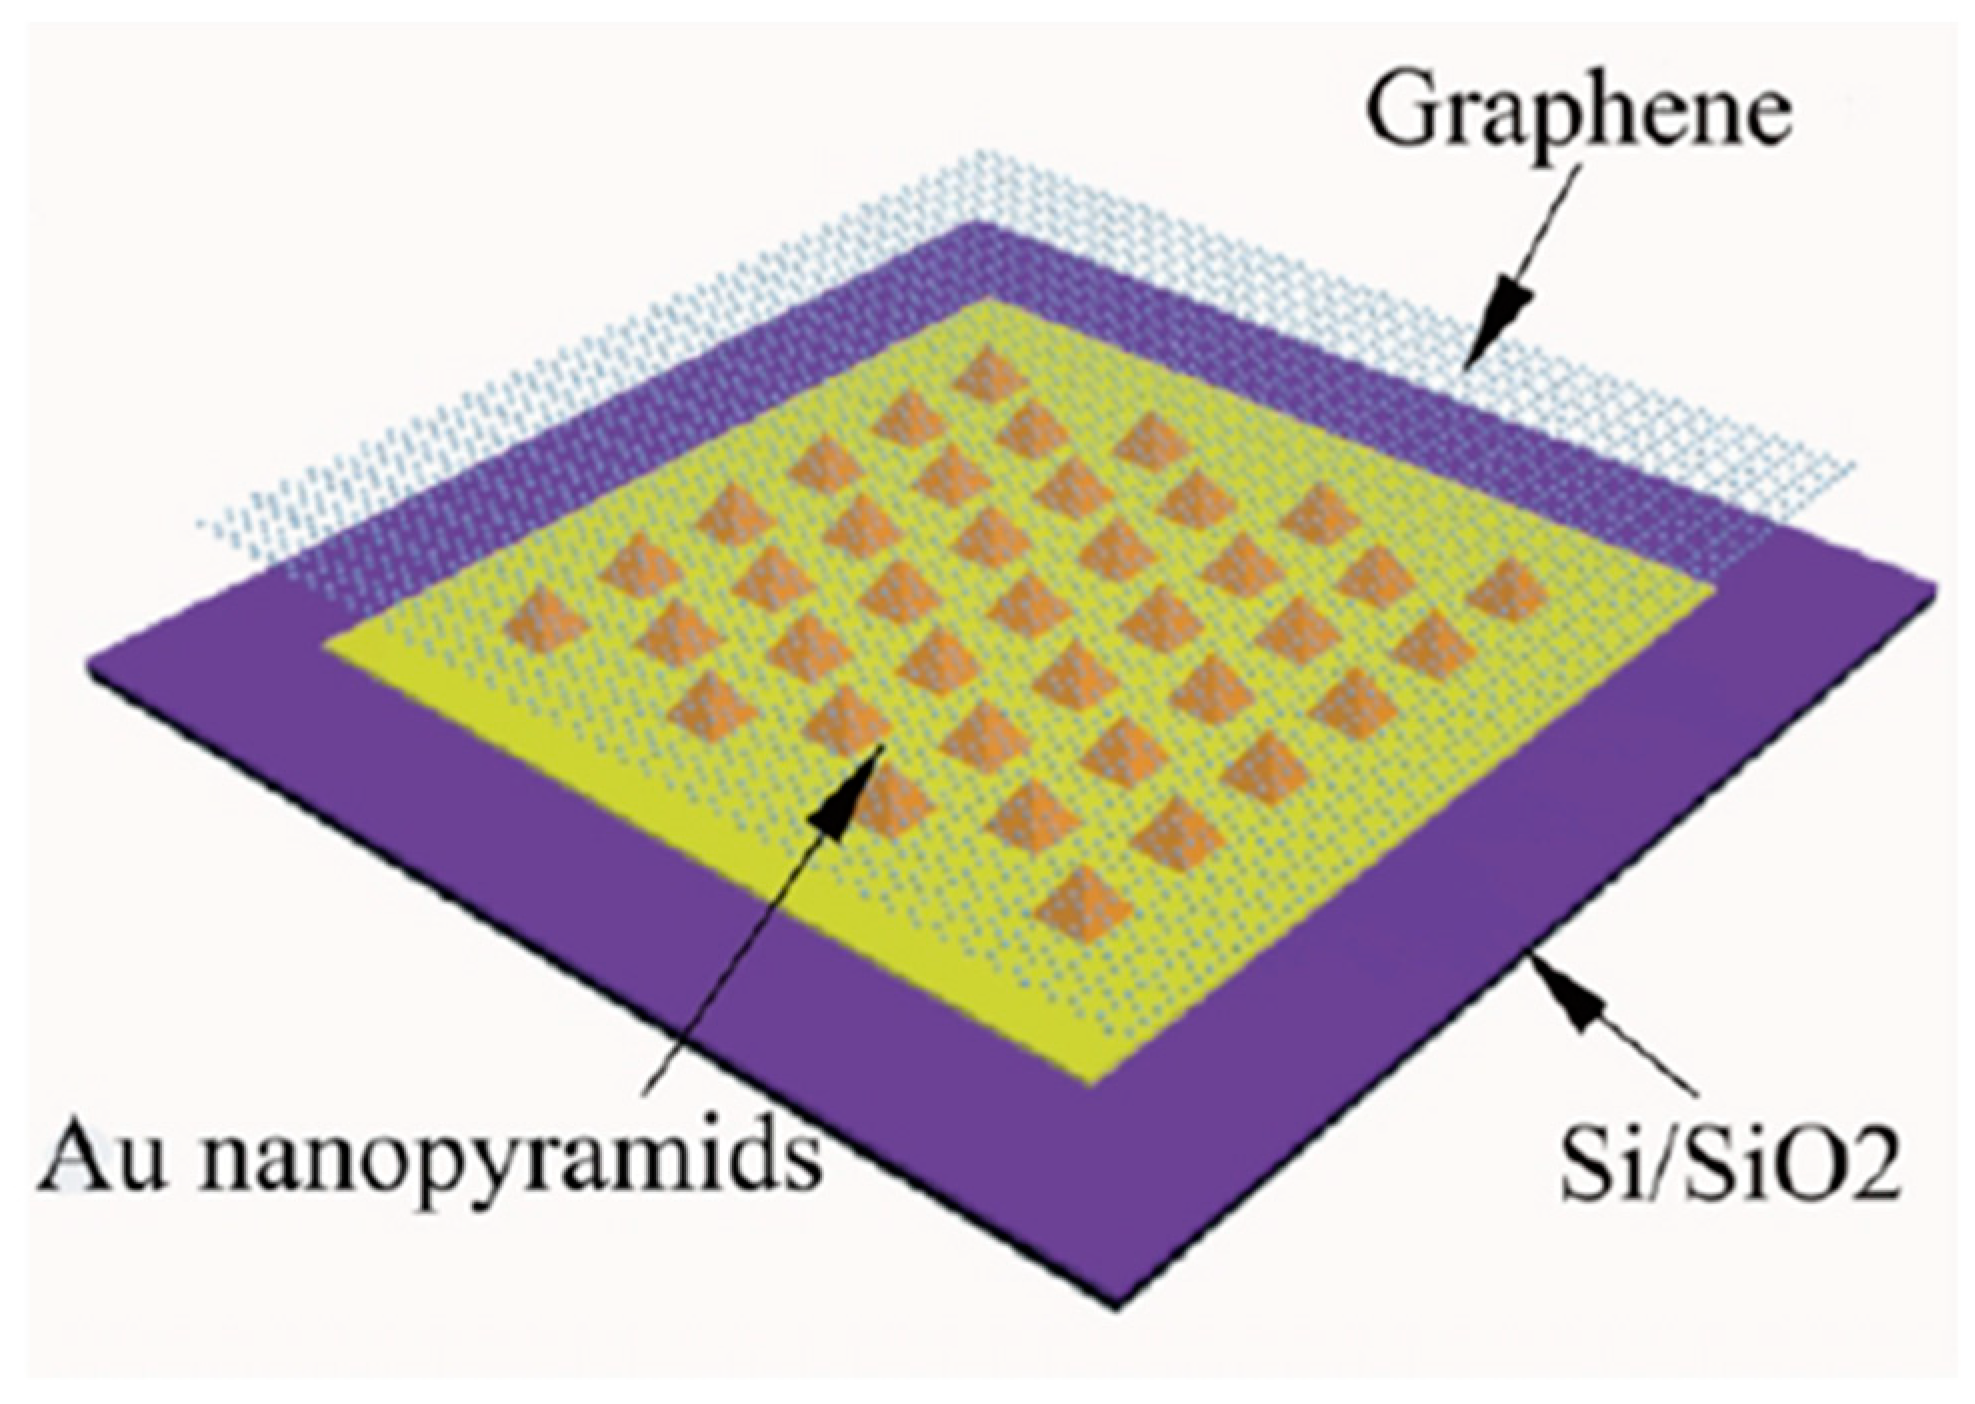
| 2 μL | HCC827 H1975 (NSCLC, lung adenocarcinoma) | Cell culture; human and fetal bovine serum | UC/F (ultracentrifugation/filtration) and ExoQuick kit comparison | Single exosome | Graphene-coated periodic Au-pyramid | 1 s | 5 mW | 785 nm | [100] |
| 5 μL | A549 UC (lung carcinoma) | Cell culture | UC | N/A | Ag-coated structured polycarbonate CD-R and DVD | 10 s | N/A | 633 nm, 785 nm | [101] |
| 10 μL | A2780 (ovarian endometrioid adenocarcinoma) | Cell culture | UC | N/A | AuNP | 20 s | N/A | 532 nm | [102] |
| Exosome Concentration (Volume) | Cells—Sources of the Exosomes and Cancer Type | Cells Origin | Purification | LOD | Type of SERS Substrate | Measurement Conditions | Ref. | ||
|---|---|---|---|---|---|---|---|---|---|
| Integration Time | Laser Power | Excitation Wavelength | |||||||
| 103–106 particles | SKBR3 (mammary gland/breast adenocarcinoma, pleural effusion metastasis epithelial cells) MRC5 (normal human embryonic lung fibroblasts) | Cell culture | ExoQuick-TC Exosome Precipitation Kit | 1200 exosomes (268 aM) | Au@AgNR | N/A | N/A | N/A | [103] |
| 10 μg solution | SKOV3 (ovarian adenocarcinoma) | Cell culture | UC | N/A | AgNP | 10 s | 42 µW | 633 nm | [104] |
| 40–4 × 10⁷ p/µL | HepG2 (hepatocellular carcinoma epithelial cells) | Cell culture and real blood | ExoEasy Maxi Kit | 27 p/µL | AuNS@4-MBA@Au | 10 s | N/A | 785 nm | [105] |
| 2 µL | SKBR3 (mammary gland/breast adenocarcinoma, pleural effusion metastasis epithelial cells) T84 (colon adenocarcinoma, lung metastasis epithelial cells LNCaP (prostate adenocarcinoma epithelial cells from a lymph node metastasis) | Cell culture Human serum Real blood | ExoQuick-TC Exosome Precipitation Kit | SKBR3: 32 p/µL T84: 73 p/µL LNCaP: 203 p/µL | AuNP | 10 s | 0.64 mW | 632.8 nm | [106] |
| 6.2 × 10⁷ p/mL, (15 µL) | MDA-MB-231 MDA-MB-468 (breast adenocarcinoma, pleural effusion metastasis epithelial cells) SKBR3 (mammary gland/breast adenocarcinoma, pleural effusion metastasis epithelial cells) MCF12A | Cell culture Real blood (plasma) | UC | 2 × 10⁶ p/mL (300 particles) | AuNR | 1 s | 50 mW | 785 nm | [107] |
| 5.4 × 10²–2.7 × 10¹⁰ p/mL (2 µL) | PANC-01 (pancreatic epithelioid carcinoma) HPDE6-C7 (normal human pancreatic duct epithelial cells) | Cell culture Human serum | UC (for cell cultures) filtration (for serum) | 1 particle per 2 μL (9 × 10⁻¹⁹ mol/L) | AuNP | 1 s (8 mW) | 8 mW | 785 nm | [108] |
© 2019 by the authors. Licensee MDPI, Basel, Switzerland. This article is an open access article distributed under the terms and conditions of the Creative Commons Attribution (CC BY) license (http://creativecommons.org/licenses/by/4.0/).
Share and Cite
Merdalimova, A.; Chernyshev, V.; Nozdriukhin, D.; Rudakovskaya, P.; Gorin, D.; Yashchenok, A. Identification and Analysis of Exosomes by Surface-Enhanced Raman Spectroscopy. Appl. Sci. 2019, 9, 1135. https://doi.org/10.3390/app9061135
Merdalimova A, Chernyshev V, Nozdriukhin D, Rudakovskaya P, Gorin D, Yashchenok A. Identification and Analysis of Exosomes by Surface-Enhanced Raman Spectroscopy. Applied Sciences. 2019; 9(6):1135. https://doi.org/10.3390/app9061135
Chicago/Turabian StyleMerdalimova, Anastasiia, Vasiliy Chernyshev, Daniil Nozdriukhin, Polina Rudakovskaya, Dmitry Gorin, and Alexey Yashchenok. 2019. "Identification and Analysis of Exosomes by Surface-Enhanced Raman Spectroscopy" Applied Sciences 9, no. 6: 1135. https://doi.org/10.3390/app9061135