Review

Chemical Characteristics of Fine Particulate Matter in Poland in Relation with Data from Selected Rural and Urban Background Stations in Europe

by
Barbara Błaszczak
1,*,
Kamila Widziewicz-Rzońca
1,*,
Natalia Zioła
1,
Krzysztof Klejnowski
1 and
Katarzyna Juda-Rezler
2
1
Institute of Environmental Engineering of the Polish Academy of Sciences, 34 M. Skłodowska-Curie Str., 41-819 Zabrze, Poland
2
Faculty of Building Services, Hydro and Environmental Engineering, Warsaw University of Technology, 20 Nowowiejska Str., 00-653 Warsaw, Poland
*
Authors to whom correspondence should be addressed.
Appl. Sci. 2019, 9(1), 98; https://doi.org/10.3390/app9010098
Submission received: 25 November 2018 / Revised: 16 December 2018 / Accepted: 18 December 2018 / Published: 28 December 2018
(This article belongs to the Special Issue Air Pollution)

Abstract

:
Air pollution by particulate matter (PM) is recognized as a one of the most important environmental issue. A particular attention is being paid to fine PM fraction (PM2.5, PM1.0) due to its detrimental impact on human health and long-term persistence in the air. Presented work is an in-depth bibliometric study on the concentrations and chemical composition of PM2.5 among 27 rural and 38 urban/urban background stations dispersed across the Europe. Obtained results indicate that the chemical composition of PM2.5, in terms of mass concentrations and percentage contribution of main chemical constituents, is relatively different in various parts of Europe. Urban and urban background stations are typically characterized by higher share of total carbon (TC) in PM2.5, compared to rural background sites, mostly pronounced during the heating periods. The share of the secondary inorganic aerosol (SIA) is typically higher at rural background stations, especially in North-Western Europe. In general, the relative contribution of SIA in PM2.5 mass, both at rural and urban background stations, showed more or less pronounced seasonal variation, opposite to Polish measurement sites. Moreover, Poland stands out from the majority of the European stations by strong dominance of total carbon over secondary inorganic aerosol.

1. Introduction

Particulate matter (PM), often defined as atmospheric aerosol, is a general concept used for a mixture of solid or liquid particles suspended in the air, including organic and inorganic substances, volatile and non-volatile compounds, both water-soluble and insoluble, with different chemical, physical and thermodynamic properties [1,2,3]. These substances can originate from natural sources (erosion of rocks, soil resuspension, desert dust, volcanic eruptions, sea spray or biological aerosol) and/or anthropogenic activities (combustion of fossil fuels and biomass, waste incineration, high-temperature industrial processes, road abrasion, transport and municipal sources, etc.) [4] and many of them have a documented negative impact on human health [5,6,7], climate [8,9], ecosystems [10] and materials [11]. The definition of primary PM include particles emitted directly into the atmosphere; whereas PM created as a result of reactions and chemical transformations of its precursors (sulphur and nitrogen compounds, volatile organic compounds) is called a secondary pollution [9].
According to the European Environment Agency (EEA), in addition to ozone (O3) and nitrogen dioxide (NO2), PM is recognized as the most problematic air pollutant in Europe [12]. Particular attention is being paid to the relationship between PM levels in the atmosphere and its impact on the human health, with many authors attributing the most detrimental effects for the smallest particles—PM2.5, especially PM1.0 (particles with aerodynamic diameter not greater than 2.5 and 1.0 μm, respectively), because of their ability to reach the deepest parts of the lungs [5,13]. Numerous studies indicate that ambient air in various areas usually contains a significant portion of fine particles [14,15,16]. In addition, they are often a carriers of various potentially toxic substances, such as polycyclic aromatic hydrocarbons (PAHs) and heavy metals [16,17,18]. Moreover, it was found that fine aerosol particles are capable of long-term persistence in the air and can be transported over long distances–hundreds or even thousands of miles from the emission sources [8,19].
Although epidemiological studies have associated chronic and acute adverse health effects with airborne particulate matter, our understanding of the exact causes and mechanisms of these effects remains limited [20]. Scientific research conducted in recent years indicates that among the physicochemical properties of the PM mainly size distribution, mass concentration and chemical composition are mentioned as those responsible for negative health effects and environmental impact [15]. However air quality standards have been defined exclusively based on PM mass concentration (PM load). Directive 2008/50/EC establishes limit value for PM2.5 annual average concentrations—25 µg·m−3 [21]. In comparison, more rigorous air quality guidelines (AQG), set by World Health Organization (WHO), accounts to 10 µg·m−3 (regarding daily mean) and 25 µg·m−3 (regarding annual mean) [6]. Moreover, the Ambient Air Quality Directive [21] also sets two additional standards for PM2.5, relating to the exposure concentration obligation (20 µg·m−3) and national exposure reduction target (0–20%). Both standards depend on the average exposure indicator (AEI), set at national level, based upon measurements in urban background locations [12,21].
In addition to the PM concentration and size distribution, chemical composition of particulates is another factor, that directly influences the reactivity, toxicity and the scale of PM impacts on the human body [5,7,20,22,23,24]. The knowledge about PM chemical composition also help to understand a time and space variation in ambient particulate concentrations as well as source-receptor relationships [25,26,27]. These in turn allows to take specific actions aimed at reducing air pollution with solid particles [28,29].
The chemical composition of fine PM (PM2.5) differs significantly from the coarse PM fraction (PM2.5–10), which is mainly due to their different origin and life time [2,14,30]. Numerous studies indicate that the main constituent of fine and ultrafine particles are, in particular, carbonaceous aerosol and water-soluble inorganic ions, for example, [31,32,33]. The contribution of sea spray and crustal dust in PM2.5 and PM1 mass is much lower compared to coarse PM. However, in specific locations, it can be quite significant [19,28,34].
In the urban air, particularly in areas with high population density, carbonaceous aerosol can reach very high concentrations [35]. Literature data report that, in urbanized areas, carbon particles can account 40–50% of fine PM mass [3]. Other studies indicate that the share of elemental and organic carbon in PM2.5 from sites located in moderate latitudes varies between 5–9% and 20–50%, respectively [36]. Carbonaceous matter bounded with atmospheric aerosol, named total carbon (TC), consist of elemental carbon (EC), inorganic carbon (IC, or carbonated carbon—CC) and organic carbon (OC) [2,3]. However, most commonly used analytical methods allow for determination of EC and OC contents in aerosol particles.
Elementary carbon is emitted to the atmosphere mostly as primary pollutant, mainly as a result of incomplete combustion of fossil fuels and pyrolysis of biological material during combustion [32,37]. In turn, organic carbon can come from both primary (primary organic carbon, POC) and secondary sources (secondary organic carbon, SOC). The latter are related to oxidation of precursors such as volatile organic compounds of biogenic and/or anthropogenic origin [32,38,39]. Secondary organic aerosol (SOA), formed as a result of VOC oxidation, is an important part of the PM mass, especially during the summer in areas covered with vegetation [31,40]. According to the 2013 EEA report [41], organic substances constitute on average about 30% of the PM2.5 concentration and about 20% of the PM10 concentration, measured at regional background stations in Europe.
Water-soluble ions, next to elemental carbon and organic matter, constitute an important part of fine particulate matter. PM-bound inorganic ions were intensively investigated and many studies showed that they have a significant influence on natural environment. These compounds can alter the chemical properties of other particles [1,42], they have also ability to scatter light and therefore modify visibility. They can also act as cloud condensation nuclei and thereby directly or indirectly affects the climate [3,43]. Moreover, they are among the most common substances contributing to the atmospheric acidity [44,45].
Numerous studies indicate that water-soluble ions in suspended particles play a significant role in atmospheric chemical reactions acting as precursors for new particles, especially sulphates (SO42−), nitrates (NO3) and ammonium (NH4+) [32,46,47]. Secondary Inorganic Aerosol (SIA) is produced in the atmosphere through (photo-)chemical reactions of gaseous precursors (such as NOx, SO2, or NH3) that may react with O3 and other reactive molecules (including radicals) to form mainly ammonium nitrate (NH4NO3), ammonium sulphate ((NH4)2SO4) and ammonium bisulphate (NH4HSO4) [32]. In the atmosphere poor in ammonia, nitrate and sulphate can easily react with the sea salt and crustal aerosols. It results in the formation of calcium and sodium sulphate (respectively: CaSO4 and Na2SO4), as well as calcium and sodium nitrate (respectively: Ca(NO3)2 and NaNO3) in the coarse particles [3,9].
SIA influences, to a large extent, the concentrations and composition of fine PM, both in areas far from significant emission sources as well as in urban areas [46,47,48,49]. In general, many studies have shown that the main part of SIA is associated with fine particles and the largest contribution of SIA to fine PM mass is usually identified at the rural background stations [9,48,50]. According to EEA report [41], SIA constitute about one third of the PM10 and a half of the PM2.5 concentrations, measured at regional background stations in Europe. In urban air, the concentration of SIA in PM mass is smaller, due to the increased proportion of primary particles, coming from local sources [41].
The chemical composition of PM is relatively different in various parts of Europe. In general, there is more carbon matter in PM10 in Central Europe, more nitrates in North-Western Europe and more mineral dust in Southern Europe [34]. The share of carbonaceous matter in PM10 varies from 10% to 40% at EMEP (European Monitoring and Evaluation Programme) sites and between 35 and 50% at sites located in the Mediterranean area. In addition, measurements of the PM chemical composition show that there is a clear decrease in the relative contribution of SO42− and NO3 ions in the PM10 mass as the distance from rural sites towards urban and communication stations increases. On the contrary, the share of carbonaceous matter in the PM10 mass increases in the direction from rural sites to traffic locations [34].
Although the last two decades have brought the improvement of ambient air quality, the problem of exceeding the standards for PM10 and PM2.5 still remains unresolved in many areas within the Europe [12,17,18,32]. As indicated in the latest EEA report [12], the long-term WHO AQG for PM10 (20 µg·m−3) and PM2.5 (10 µg·m−3) was exceeded at 48% and 68% stations respectively and in all the reporting countries except Estonia (PM2.5, PM10), Switzerland (PM2.5, PM10), Finland (PM2.5), Hungary (PM2.5), Norway (PM2.5), Iceland (PM10) and Ireland (PM10).
The research concerning the PM chemical composition and the identification of its sources have been undertaken by many authors, for example, [7,17,25,32,36,51,52,53,54,55,56]. Also, some review studies has been published, for example, [4,12,19,34,35,57,58], which allowed to significantly improve knowledge about PM2.5 air pollution in areas with different emission characteristics. However, there is still a lack of works that would present the above subject in quantitative terms by providing specific data on concentrations and percentage contributions of PM main chemical constituents. Such studies would greatly facilitate comparison of the results obtained by atmospheric pollution researchers, who are often forced to review a significant number of publications. Comparative analysis is highly difficult because the number of sites on which the aerosol was fully characterized is still limited, especially in the southern and eastern parts of Europe [4,12,17,19,31,57]; this is particularly true for the fine PM fraction (PM2.5, PM1.0). Another problem is the inconsistency of location criteria and often limited data sets (in many countries less than 5 years of the reporting time) [58].
In the context of the above-mentioned facts, the aim of the present study is to investigate the concentrations and chemical composition of PM2.5 from selected urban and rural background stations in Europe through a systematic review. This is the first such comprehensive and extensive analysis in this issue, covering spatial and seasonal variability. The starting point for this publication were the results obtained in the framework of the research project called Analysis of the seasonal variability and origin of the secondary inorganic aerosol in fine particulate matter from selected background stations in Poland (PRELUDIUM funding scheme 2nd edition, Project No. 2011/03/N/ST10/05542), conducted during the years 2012–2015. Within the project, the concentrations and contributions of the main chemical compounds of PM2.5 (carbonaceous matter, secondary inorganic ions) were estimated, which has been published already in References [27,32,47,49]. In addition, as part of the project, an in-depth literature studies were also carried out, resulting in this publication. Moreover, the knowledge about the monitoring of air quality in Europe in terms of particulate matter concentrations and chemical composition, especially in relation to PM2.5, was briefly discussed (Section 2).

2. Air Quality Monitoring in Terms of Particulate Matter

2.1. The Need of Measurements and Legal Aspects

The need of air quality monitoring in terms of atmospheric pollution with particulate matter is directly related to its impact on human health, climate and ecosystems [12,34,58]. It also results from the necessity to identify PM sources and to estimate the specific effects of actions aimed at reducing the levels of ambient PM [12,29,59]. The air quality monitoring system operates on the basis of a number of legal acts announced at the European Union level, among which the most important are:
-
Directive 2008/50/EC of the European Parliament and of the Council of 21 May 2008 on ambient air quality and cleaner air for Europe (O.J. UE, L 152/1 of 11.06.2008, p.1);
-
Directive 2004/107/EC of the European Parliament and of the Council of 15 December 2004 relating to arsenic, cadmium, mercury, nickel and polycyclic aromatic hydrocarbons in ambient air (O.J. UE L 23/3 of 26.01.2005, p. 3);
-
Commission Implementing Decision of 12 December 2011 laying down rules for Directives 2004/107/EC and 2008/50/EC of the European Parliament and of the Council as regards the reciprocal exchange of information and reporting on ambient air quality (O.J. UE, L 335/86 of 17.12.2011, p. 86);
-
Commission Directive (EU) 2015/1480 of 28 August 2015 amending several annexes to Directive 2004/107/EC and 2008/50/EC of the European Parliament and of the Council laying down the rules concerning reference methods, data validation and location of sampling points for the assessment of ambient air quality (O.J. UE, L. 226/4 of 29.08.2015, p.4).
The assessment of air quality in EU Member States should be based on the common methods and criteria [21]. The principal requirements in this regard are related to specific threshold concentrations of a given pollutants as well as exposure of populations and ecosystems to these pollutants. As indicated in Art. 6 of the Directive 2008/50/EC, measurements carried out at a fixed sampling points should be mandatory in zones where long-term goals for ozone or thresholds for other pollutants have been exceeded. Data obtained from monitoring can also be supplemented with modelling or objective-estimation techniques to provide adequate information on the spatial distribution of air pollutants. The use of complementary assessment methods should also allow to limit the minimum required number of fixed sampling points.

2.2. Types of Monitoring Stations

The classification of measurement stations in relation to specific criteria is of great importance in air quality management [12]. Within the European Union, the most important legal acts in this area are the Council Decision of 27 January 1997 establishing a reciprocal exchange of information and data from networks and individual stations measuring ambient air pollution within the Member States known as 97/101/EC Decision together with Commission Implementing Decision 2011/850/EC, containing executive provisions on the reciprocal information exchange system and reports on ambient air quality. The primary division of measurement stations into particular types is based on the influence of the dominant emission source and therefore it can be distinguished into [60,61]:
-
Traffic stations—pollutants concentrations are influenced mainly by emissions from neighbouring communication routes;
-
Industrial stations—pollutants concentrations are influenced predominantly by emissions from a neighbouring single industrial source or industrial area with more sources;
-
Background stations—pollutants concentrations are representative of the average exposure of the general population (or vegetation and natural ecosystems) in the area covered by the assessment.
Among background stations, the following subgroups should be distinguished [60]:
-
Urban and suburban background stations;
-
Rural stations:
-
Near-city background stations;
-
Regional stations;
-
Remote stations.
Suburban and urban background stations are located within cities or agglomerations and monitor the “average” air pollution levels (urban background concentrations) resulting from the transport of pollutants from outside the urban area and from emissions within the city [60]. Such stations are not directly influenced by any dominant emission source, unless this source is characteristic for the considered zone. An important goal of measurements carried out at the urban background stations located in the territory of a given EU Member State is also the possibility to determine the average exposure indicator (AEI) and therefore to set the national exposure reduction target and the exposure concentration obligation [21].
It should be noted that in Directive 2008/50/EC particular subgroups of rural background stations are in general considered together [21]. As indicated in the Article 8 of the Directive, measurements carried out at rural background stations are crucial from the point of view of a better understanding of the impacts of fine particulate matter and the development of appropriate policies in this area. Generally, the primary objective of the PM2.5 measurements in rural background stations is to provide reliable information on its background levels (Annex IV of Directive 2008/50/EC). This information is further used to analyse elevated concentration levels in more polluted areas (urban, industrial areas, areas exposed to the impact of road traffic). In addition, the results of measurements carried out at a considered stations could provide information on the possible impact of long-range transport of air pollution on the levels of PM concentrations in the country and on the identification of possible sources of PM-related chemical compounds. More detailed information on the types and criteria to be met by the background stations can be found in, for example, [60,61,62].

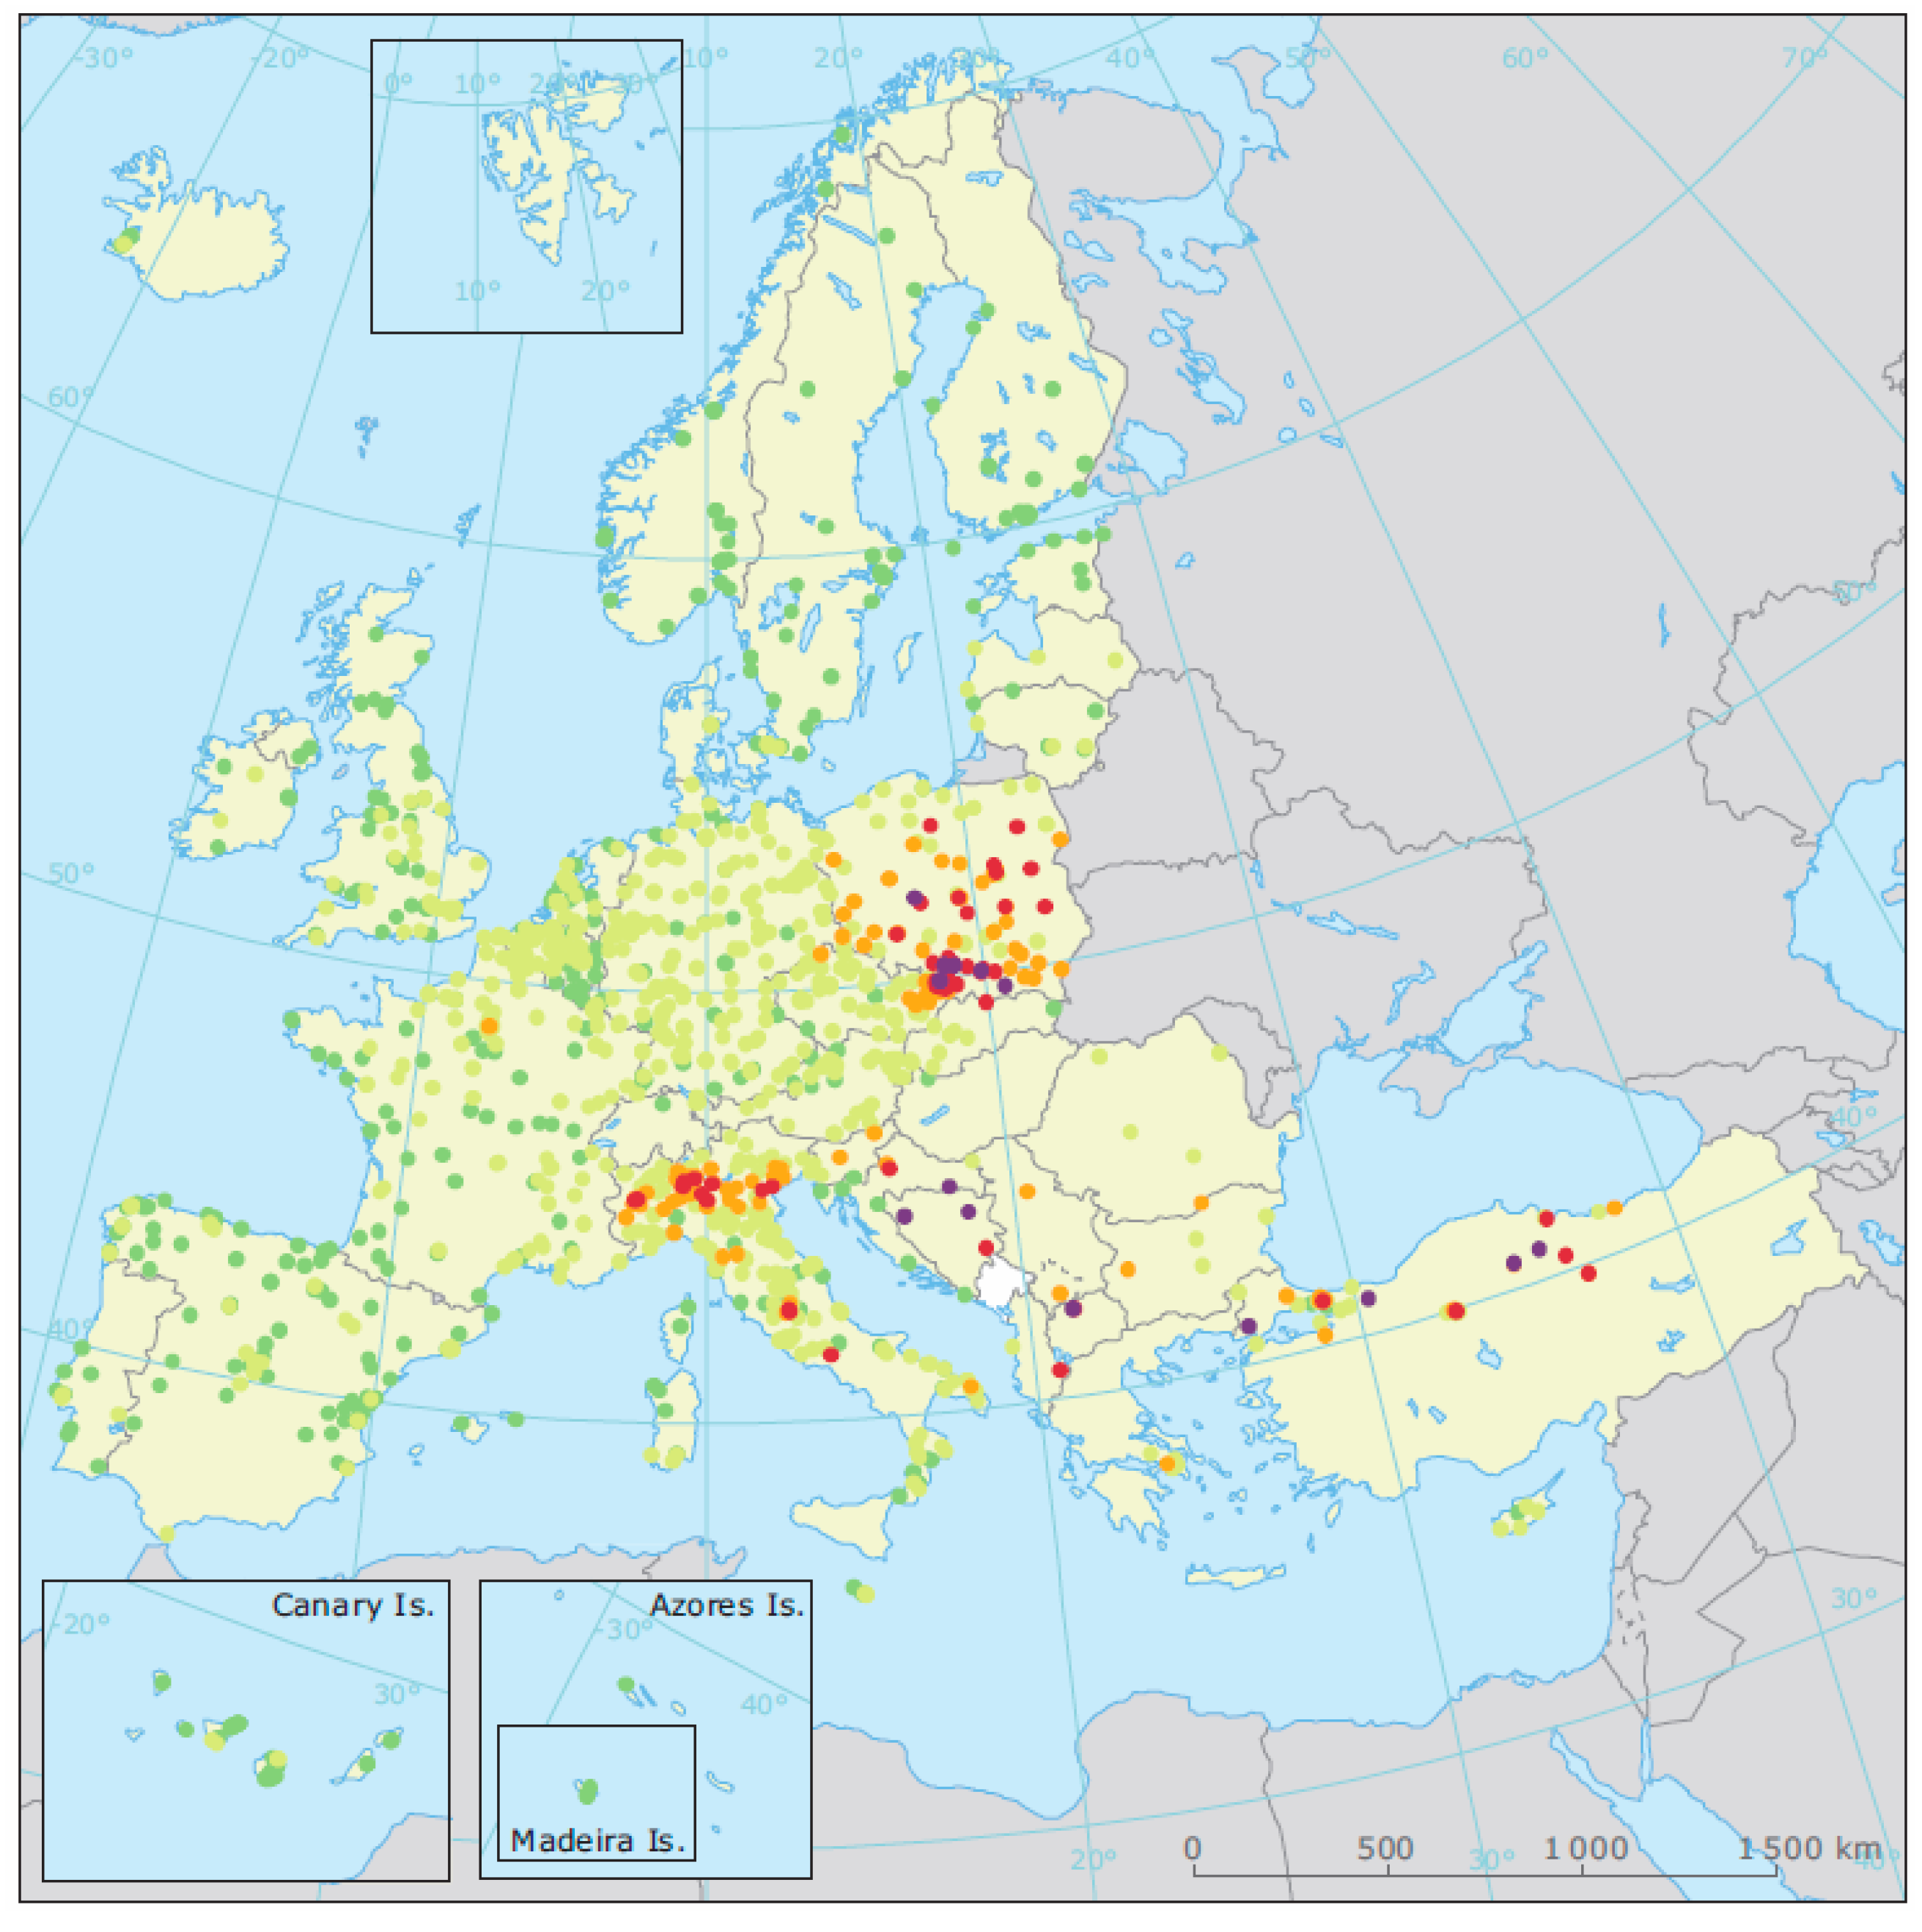
2.3. Localization of Monitoring Sites and the Spatial Distribution of PM Concentrations

Monitoring of air pollution by PM is not an easy task, due to the complex nature of atmospheric particulate matter [3]. Difficulties arise mainly when comparing and analysing the results of PM measurement gathered from different countries. They are also related to the differences in location criteria for measurement stations, limited data sets and the use of different sampling equipment at various stations [34,58]. There are many methods for measuring the concentration of particulate matter that have been developed and improved over the last decades [3,34,63]. National and international guidelines recommend the gravimetric method as a standard method for the determination of the PM2.5 and PM10 concentrations [21,64]. However, as the provisions of Directive 2008/50/EC indicate, Member States may use any other method of collecting PM samples if they can prove its compliance with the reference method. The principles and methodology for demonstrating the equivalence of alternative methods are described in detail in the [65].
The concentration and size distribution of particulate matter as well as its chemical composition varies considerably in time and space [3] and therefore it is necessary to carry out measurements of PM on different types of stations and at different seasons of the year [31]. The detailed requirements for the location of individual types of monitoring stations for particulate matter (and other criterion pollutants) have been specified in Directive 2008/50/EC (Annex III). In addition to meteorological conditions, seasonal changes or long-range transport of air pollutants [66,67,68,69], local conditions may also affect the measurement point [1,70,71]. For a specific urban area, a uniform distribution of PM2.5, PM10 or PM2.5–10 is often only a guess, usually due to the limited availability of measuring equipment [4,34,35,57,72]. The impact is particularly strong for sources within a radius of around 10 km (neighbourhood scale) and very weak for the entire region [70]. Typically, the spatial distribution of PM2.5 is relatively homogeneous; only in the vicinity of the PM emission source the concentrations might be elevated in relation to the background concentrations [46,71]. For larger particles (PM2.5–10), spatial changes are significant [71,73]. This also applies to bioaerosol, due to the strong influence of local sources of pollen, bacteria and spores on the total load of particles in ambient air [74].

2.4. Monitoring of PM—European Data

Within the Europe, the monitoring of PM air pollution is carried out at air quality stations that are a part of a national (e.g., AURN in UK, PAES in France, NEM in Poland) and/or international networks (e.g., WMO’s GAW (Global Atmospheric Watch); European AirBase or EMEP) [75]. The data on the PM mass concentration and chemical composition in Europe is collected within the framework of the European Monitoring and Evaluation Programme (EMEP) [76]. It is also reported by the EU member countries to the European Commission and collected in the EEA’s open-access database, that is, AirBase [77], which contains information submitted by the participating countries throughout the Europe starting from 2012. Information on air quality monitoring data, including PM concentration and composition, is also supported by the European Air Quality Portal [78]. In addition, Member States also publishes an annual reports on air quality to the provisions of the Directive, which include a summary of exceedances of normative values together with a collective assessment of the effects of such exceedances.
Air quality reports within EU countries are published annually by the European Environment Agency and European Topic Centre on Air Pollution and Climate Change Mitigation (ETC/ACM). The most current report, published in 2018, concern the description of the state of air quality in Europe in the years 2000–2016 and presents updated data on air pollutant emissions and concentrations and urban population exposure for 2016 [12]. As indicated within this report, the concentrations of particulate matter continued to exceed the EU limit values and the WHO AQGs in large parts of the Europe (Figure 1). For PM2.5 values above the annual limit were registered at 5% of the reporting stations in four Member States and four other reporting countries. The highest PM2.5 annual average concentrations were registered in Poland, Italy, the Balkan countries, Bulgaria and Turkey.
The number of sites measuring concentrations and chemical composition of PM10 and PM2.5 has been growing evenly over the last decade [58,79,80]. Nevertheless, data published both by the EEA and a group of researchers from all over the Europe indicate that the number of sites on which the aerosol was fully characterized is still limited, especially in the southern and eastern parts of Europe; this is particularly true for fine PM fraction (PM2.5, PM1) [4,17,57]. Another problem is the inconsistency regarding location criteria and often limited data sets (in many countries less than 5 years of the reporting time) [58]. It should be mentioned that most of the studies on air pollution by fine PM have been associated with urban sites, however people living within rural areas are often exposed to PM2.5 originating from both natural sources and human activities [32,81,82]. Therefore, more research is needed to better understand this problem and to evaluate the contribution of local sources and long-range transport of air pollutants in the concentrations and compositions of particulate matter.
According to the data at the end of 2010 [80], the number of air quality monitoring stations at which the chemical composition of PM2.5 was measured was only 15 but twice as many as in the previous year (8 stations). The chemical composition of PM2.5 is investigated at only few EMEP monitoring stations (in Austria, Germany, Spain, Italy and in the case of heavy metals—in Norway and Czech Republic). The latest EEA report on air quality in Europe pointed that the PM2.5 chemical composition (carbonaceous aerosols and water-soluble ions) were reported in many countries, that is,: Austria, Croatia, Cyprus, Denmark, Finland (except EC), Germany, Ireland, Latvia (except EC and OC), Lithuania, Malta, the Netherlands, Poland, Portugal (except NO3), Slovenia, Spain and the United Kingdom. However, at majority of monitoring stations the research on PM2.5 chemistry is not conducted in a continuous manner. They are usually carried out randomly (selected days of the month) or concern aggregated weekly samples. In fact, the German Melpitz station is the only institution where the investigations of the concentrations of anions, cations and carbon matter are conducted in the 24-h PM samples over the whole year [58].
Although the data on the full chemical composition of PM, measured in the main monitoring networks within the Europe (EEA, EMEP) are limited, many information is provided by research projects, carried out by scientific institutions and development units and large infrastructure projects [34]. Among the latter the following should be mentioned:
-
European Supersites for Atmospheric Aerosol Research (EUSAAR) [83],
-
Aerosols, Clouds and Trace gases Research InfraStructure Network (ACTRIS) [84],
-
Integrated non-CO2 Greenhouse Gas Observing System (InGOS) [85];
-
Chemical On-line Composition and Source Apportionment of Fine Aerosol (COLOSSAL) [86].
Monitoring of air pollution with particulate matter in Poland has been carried out for many years as a part of the National Environmental Monitoring (NEM) subsystem [87], however so far an attention has focused mainly on the PM10 fraction. The research on PM2.5 has been conducted systematically since 2000, at various measurement points of the country, belonging to the RIEP (Regional Inspectorate for Environmental Protection) network and within the projects carried out in the research and development sector. As pointed out in numerous scientific publications, for example, [15,17,31,32], an information on PM2.5 concentration and especially on the chemical composition of PM2.5 is still insufficient. There is a need to systematize knowledge on the problem of air pollution with PM2.5 [15,31]. This is especially important in Poland where relatively high concentrations of PM2.5 considerably exceed the European levels. In addition, Poland is a specific country in terms of emission conditions–high share of fossil fuels in energy production together with high emissions from industry against the Western European countries [27,32,69].

3. Materials and Methods

The systematic review presented in this work followed the PRISMA guidelines [88]. Data available in the European open-access databases, that is, Airbase (supported by EEA) and EBAS (supported by Norwegian Institute for Air Research (NILU)) were utilized. Moreover, bibliometric data was gathered using the Science Direct and Scopus databases, with restrictions only to English language publications and original articles that investigated PM2.5 chemical composition. In both checked databases the searching was realized in the advanced search with the search terms (i.e., “PM2.5/fine particulate matter,” “chemical composition,” “secondary inorganic aerosol,” “carbonaceous matter,” “rural background,” “air quality monitoring”), selecting the abstract, title, keywords and all years of publication. Finally we screened all found publications with their looking into their titles, abstracts and by reviewing full texts of articles that met our predetermined inclusion criteria.
The general theoretical information presented in this work was related to monitoring of PM and were divided into 4 categories corresponding to the names of Section 2.1, Section 2.2, Section 2.3 and Section 2.4. In this work we include the results collected from 1998 till 2013, only at European measurement stations, meeting the requirements for rural background stations and urban/urban background stations, which have been briefly described in the Section 2.2. The measuring equipment used to collect PM2.5 samples fulfilled the requirements for reference methods or methods recognized as equivalent [21,64,65]. Therefore the issues related with different location criteria of the monitoring stations and different sampling equipment (Section 2.3) were not taken into account when comparing the results from selected measurement sites. Details on the PM2.5 sampling methodology and analytical methods could be found in particular references cited in the present work (Section 4.1 and Section 4.2).
Among numerous of research studies, only a small percentage fulfilled the inclusion criteria, which were primarily:
-
Sufficient time coverage—only long-term measurements (at least 1 year) were taken into account, with some exceptions regarding to specific season of the year;
-
Full chemical characteristics of PM2.5—understand as full information on ionic and carbon composition;
-
Seasonal variability of PM2.5 concentrations and chemical compositions—we focused on the scientific works in which the chemical composition of PM2.5 was considered in a seasonal approach (heating and non-heating period, winter and summer season).
The starting point for this publication was the results obtained in the framework of research project called Analysis of the seasonal variability and origin of the secondary inorganic aerosol in fine particulate matter from selected background stations in Poland (PRELUDIUM funding scheme 2nd edition, Project no. 2011/03/N/ST10/05542), conducted during the years 2012–2015. The main goal of the project was the analysis of the concentration, chemical composition and sources of fine particulate matter PM2.5, from selected urban and rural background stations and the assessment of SIA contribution to PM2.5 mass in investigated areas, including examination of its seasonal variation. Research material included PM2.5 samples from 3 air quality monitoring stations, belonging to the National Environment Monitoring (NEM) network and located in Szczecin (urban background), Trzebinia (urban background) and Złoty Potok (rural background). The study included 2 periods of the year 2013, representing the heating (January–March) and non-heating (May–June) season. Within the project, the concentrations and contributions of main chemical compounds of PM2.5 (carbonaceous matter, secondary inorganic ions) were estimated, what has been published already in References [27,32,47,49]. Mass concentration of PM2.5 was determined by the gravimetric method, according to the standard PN-EN 12341:2014-07 [64]. For analyses of elemental and organic carbon content in PM2.5 thermal-optical method was used, whereas ion content was determined by ion chromatography. The details of analytical procedures could be found in the previous works for example, [31,32].
Summarizing, the daily mean concentrations of PM2.5, as well as the concentration of its related components, varied in wide range of values and exhibited spatial and seasonal variations. Regardless of the season, the share of total carbon in PM2.5 exceeded 40% and was primarily determined by fluctuations in the share of OC, which was generally above 30% of the PM2.5 mass. Ion composition of PM2.5, from all measurement stations, was dominated by sulphates (SO42−), nitrates (NO3) and ammonium (NH4+). Combined share of above mentioned ions was (on average) ~34%, ~30% and ~18% of PM2.5 mass, respectively in Szczecin, Trzebinia and Złoty Potok. The contribution of SIA was, in general, higher than SOC (secondary organic carbon) contribution. In addition, inorganic ions contents showed spatial variation with the highest levels recorded at urban background station in Trzebinia, located in highly urbanized and industrialized area and lowest observed at rural background station in Złoty Potok. The obtained results revealed that SIA contribution in PM2.5 mass was relatively constant in both periods (in contrast to SOC contribution), however the share of individual inorganic ions in PM2.5 mass showed different seasonal variations.
It was also found that the seasonal variation of PM2.5 concentrations and concentrations of its major components was mainly due to changes in the intensity of emissions of PM2.5 and its precursors from combustion sources, which increases in heating period, while clearly falls in the non-heating period. Secondary aerosol, whose presence is related to oxidation of gaseous precursors emitted from fuel combustion and biomass burning, had the largest contribution in observed PM2.5 concentrations. In addition, the contribution of traffic sources together with road dust resuspension, was observed. The share of natural sources (sea spray, crustal dust) was generally lower.
Obtained results and comprehensive bibliometric studies were the basis of the present work, which is addressed on the quantitative comparison of the chemical characteristics of PM2.5 from different rural and urban background stations in Europe (Section 4.1 and Section 4.2). It should be noted that information on concentrations of PM2.5 and related chemical constituents is an important contribution to the knowledge of fine aerosol particles measured at ground level [47]. However, in order to obtain full information about the seasonal and spatial variability of the chemical composition of fine PM and the impact of different emission sources, it is also necessary to examine the relative content of compounds contained in it, in particular the secondary inorganic aerosol and carbonaceous matter, which is the dominant part of PM2.5 and PM1.0 [2,31,32]. Taking into consideration, the comparative data is presented in the following form:
-
tabular (Table 1 and Table 2), where the data on concentrations of selected major components of PM2.5 are summarized (Section 4.1);
-
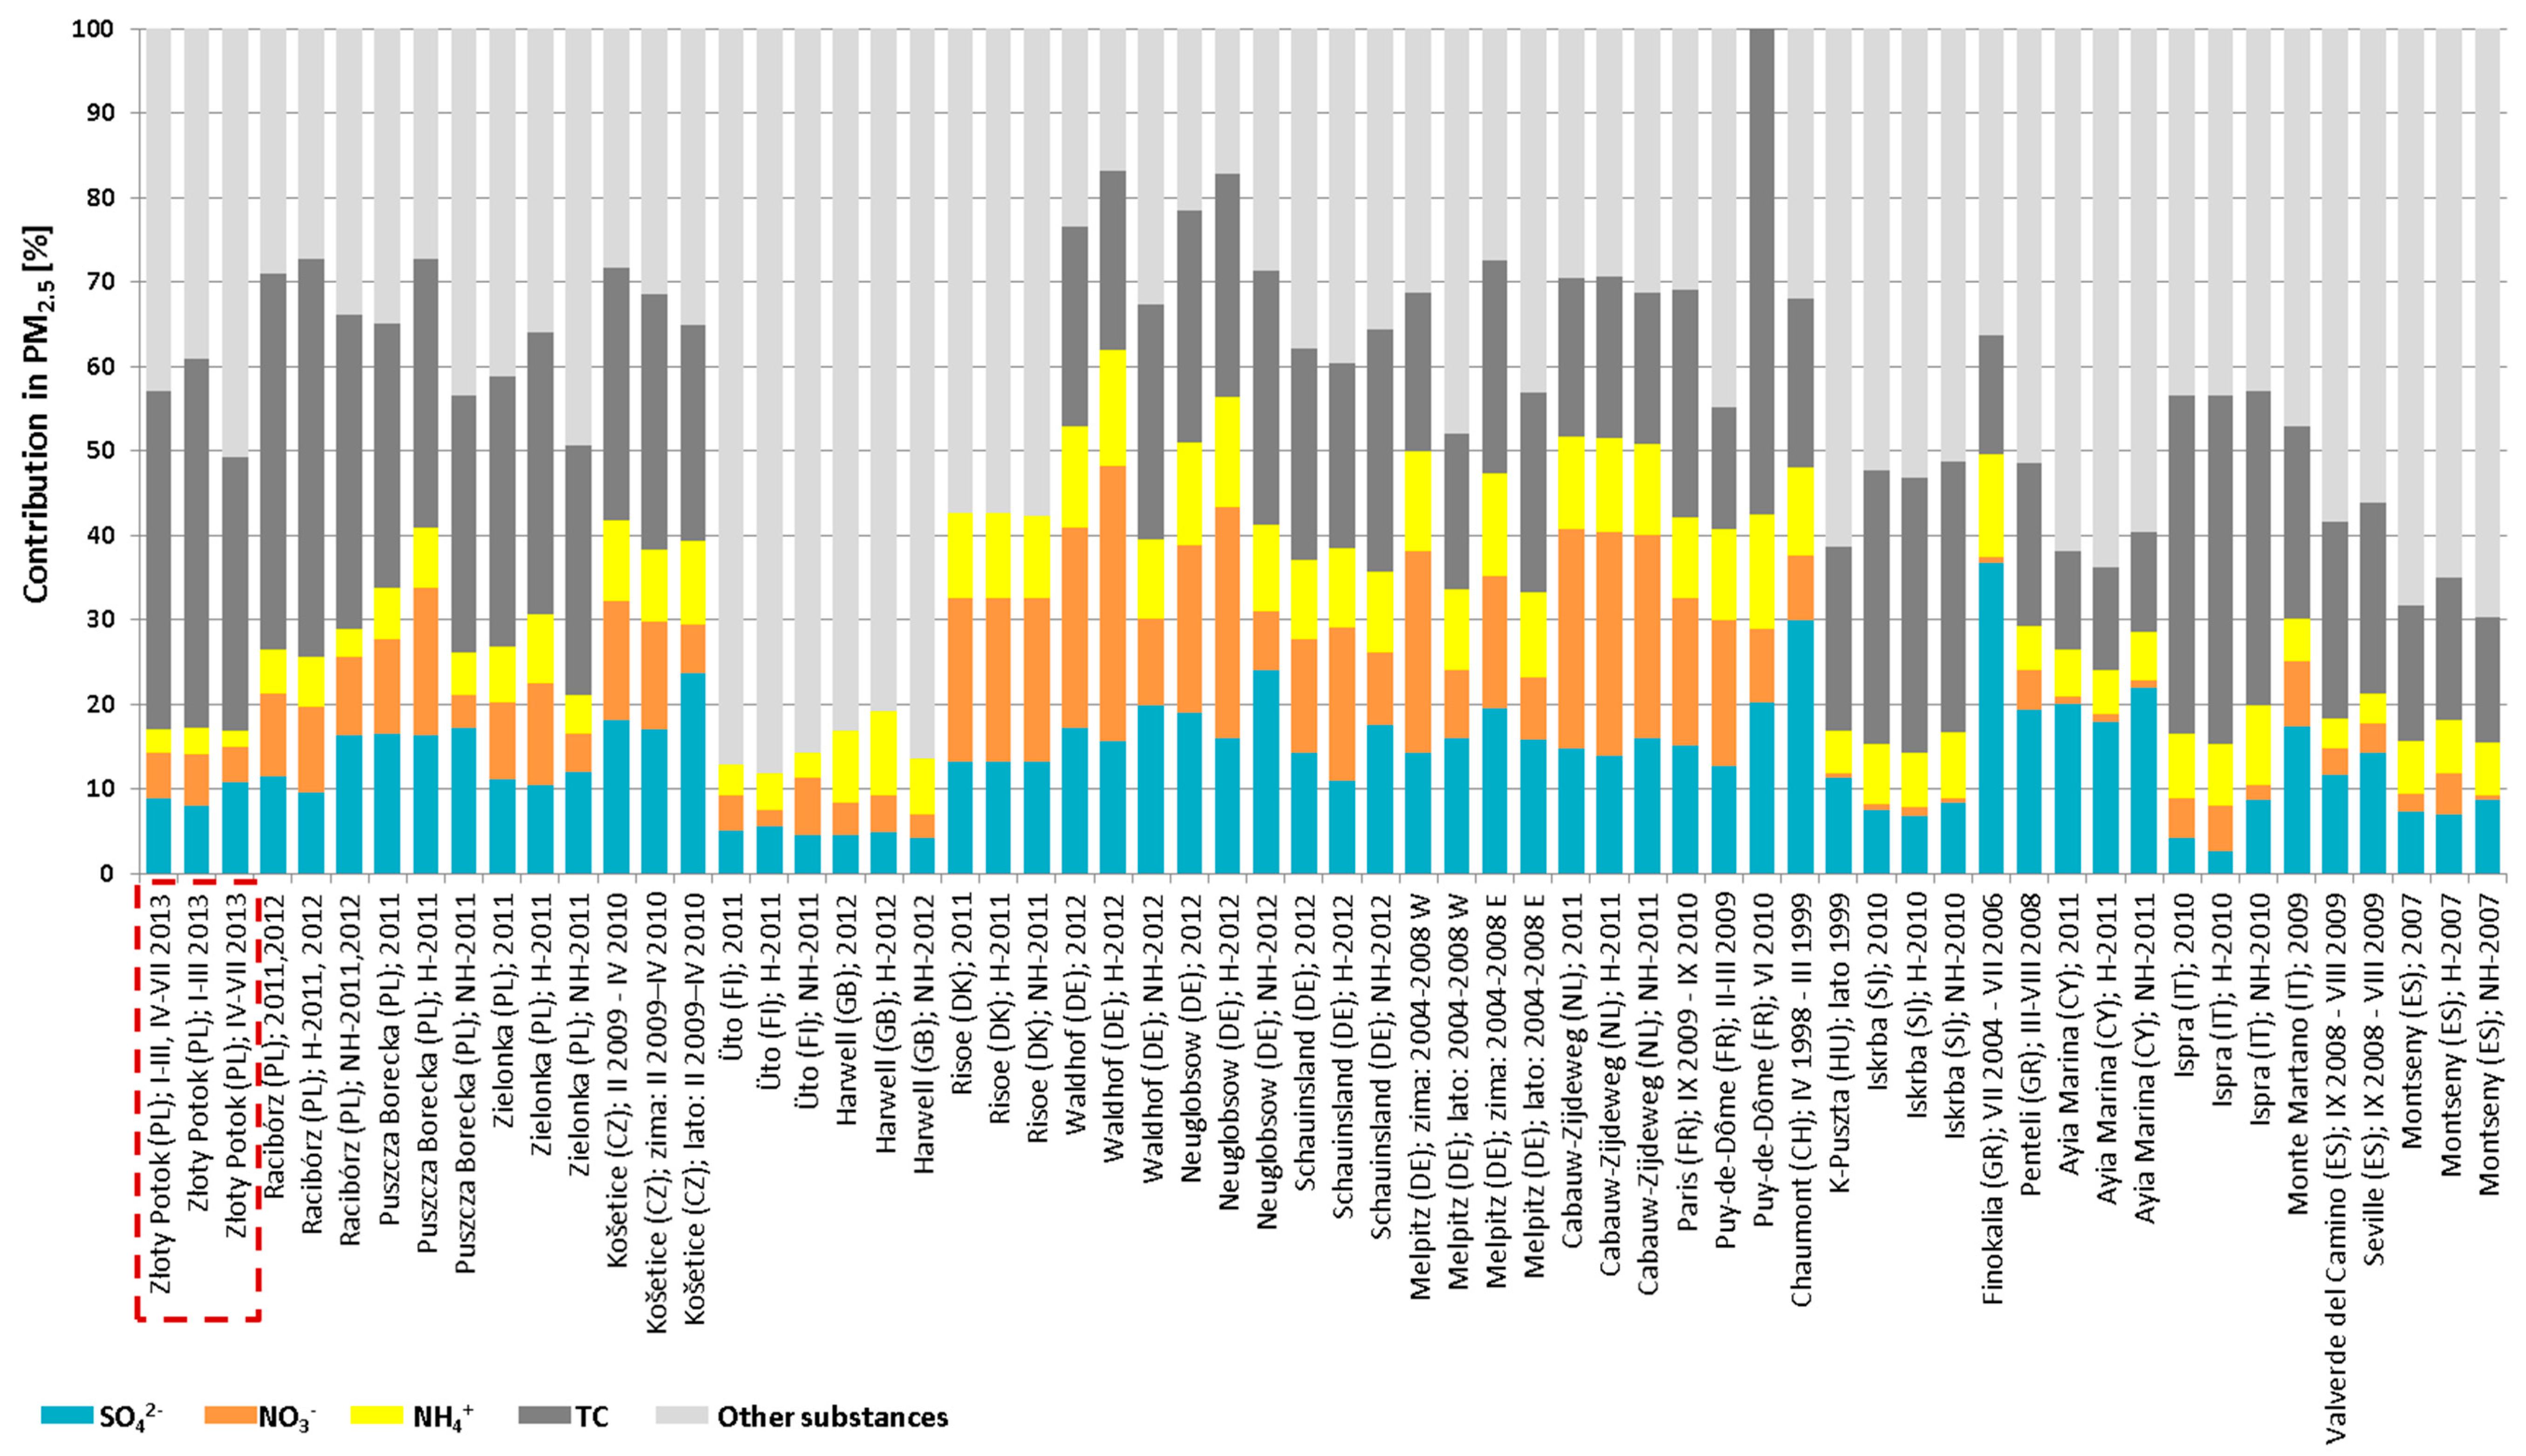
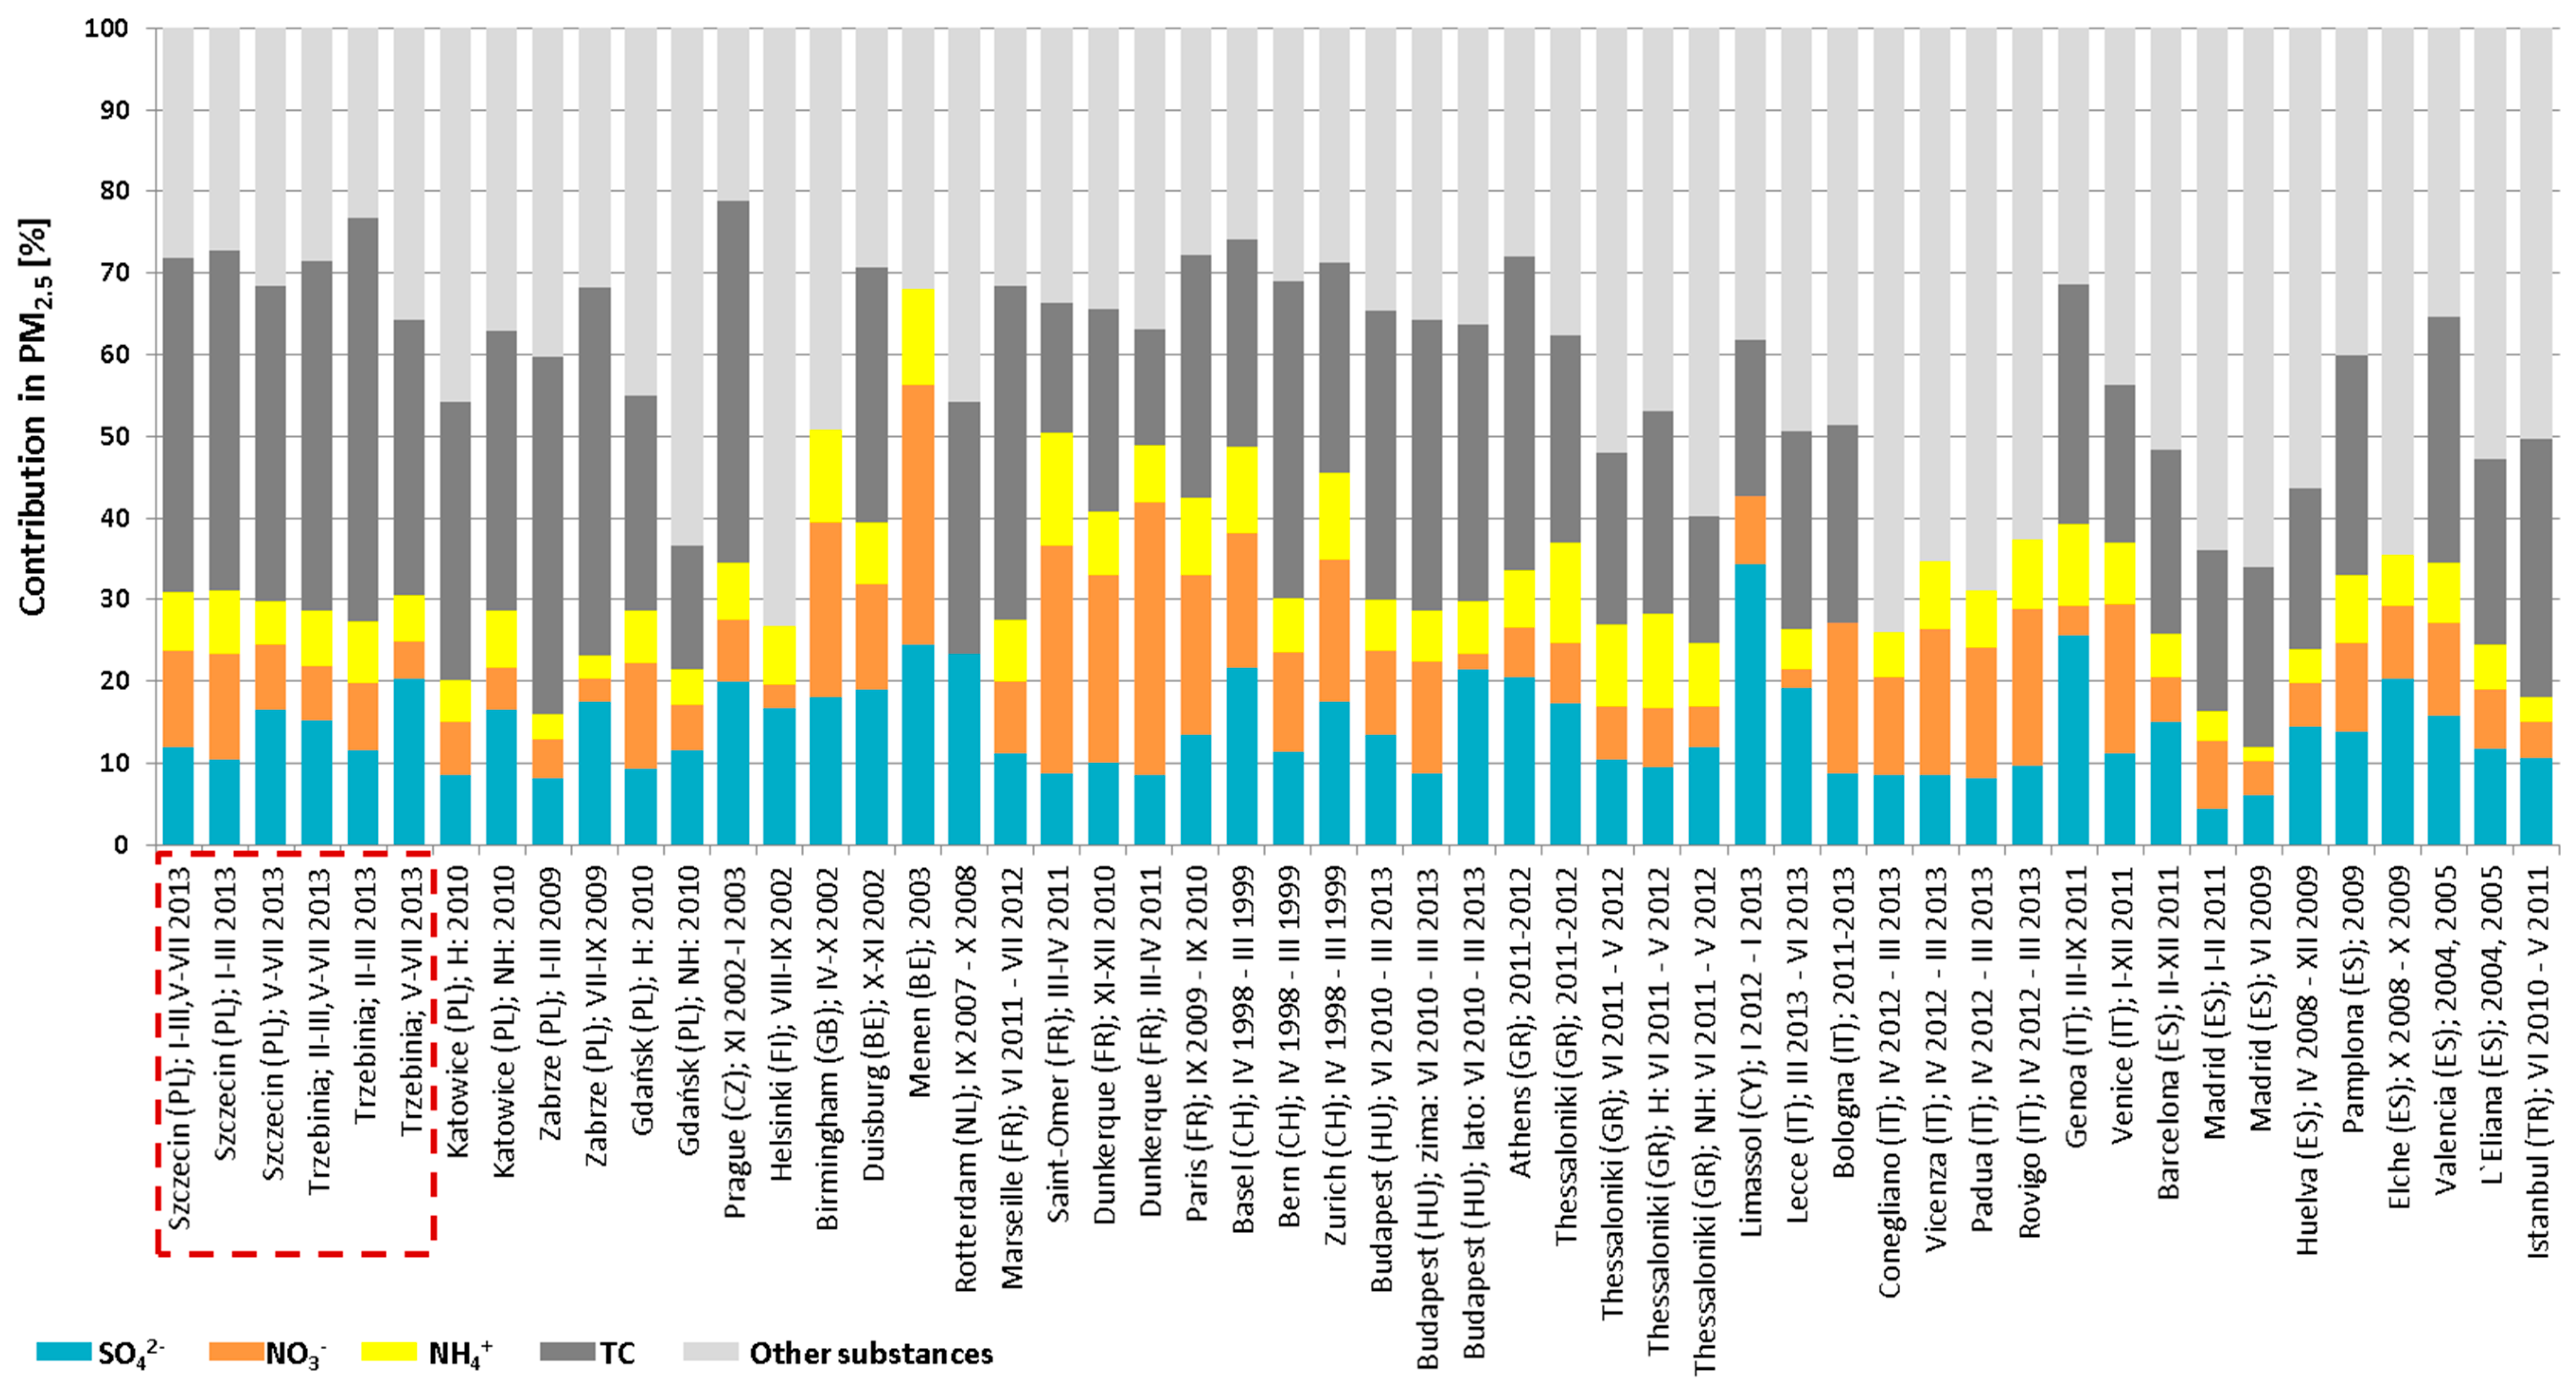
graphical (Figure 2 and Figure 3), where the shares of secondary inorganic ions (SO42−, NO3 and NH4+) and total carbon (TC = EC + OC) in PM2.5 are shown (Section 4.2).
In order to clarify the discussion of the comparative results, the following abbreviations appear in the Section 4.1 and Section 4.2 (where necessary): (a) Ep—values averaged over entire measuring period; (b) Hp/Ws—values averaged over heating period/winter season; (c) NHp/Ss—values averaged over non-heating period/summer (/spring) season.

4. Results and Discussion

4.1. Concentrations of PM2.5 and Its Related Main Chemical Compounds

The concentrations of PM2.5 registered both at rural (Table 1) and urban background stations (Table 2), varied within wide range of values. Considering data for the former type of stations, it can be observed that the concentrations of PM2.5 in Złoty Potok were visibly higher compared to the values registered on most of the European rural sites, especially during the heating period. This suggests that the main factor determining the concentration of PM2.5 in the investigated area was the emission from anthropogenic sources, especially fossil fuels and biomass combustion in households (low-level emission sources) [25,27,31,32,49,69]. The average concentrations of the main components in PM2.5 from Złoty Potok were also higher, which is particularly evident in the case of the carbonaceous aerosol, which was the predominant PM2.5 component from mentioned station (TC = 10.07 µg·m−3, Ep), as well as other rural stations located in different parts of Poland. However, it is worth to note that TC concentrations in Złoty Potok and Racibórz were higher compared to stations located in the central and north-eastern part of the country (Zielonka, Puszcza Borecka) (see also [31]).
PM2.5 concentrations and associated carbon compounds from stations located in north-western European countries were clearly lower, for example, Üto (Finland) (PM2.5 = 6.55 µg·m−3, Ep), Waldhof (Germany) (PM2.5 = 11.45 µg·m−3; TC = 2.71 µg·m−3; Ep), Cabauw-Zijdeweg (the Netherlands) (PM2.5 = 11.45 µg·m−3; TC = 2.86 µg·m−3; Ep), Paris (France) (PM2.5 = 12.60 µg·m−3; TC = 3.40 µg·m−3). This also applies to the rural background stations located in Mediterranean area, for example, Finokalia (Greece) (PM2.5 = 12.00 µg·m−3; TC = 1.69 µg·m−3), Monte Martano (Italy) (PM2.5 = 10.09 µg·m−3; TC = 2.48 µg·m−3) or Montseny (Spain) (PM2.5 = 11.96 µg·m−3; TC = 1.91 µg·m−3; Ep), where the proportion of PM2.5 in PM10 reaches relatively lower values, due to the higher load of crustal species and sea spray in PM mass [91,92,93].
In the case of concentration of secondary inorganic ions (SO42− + NO3 + NH4+), regarded as secondary inorganic aerosol (SIA), the situation was more diversified. The SIA concentrations in Złoty Potok (SIA = 4.36 µg·m−3; Ep) was lower compared to the values recorded at many rural background stations in Europe, for example, Košetice (the Czech Republic) (SIA = 6.57 µg·m−3; Ep), Risø (Denmark) (SIA = 6.43 µg·m−3; Ep), Cabauw-Zijdeweg (the Netherlands) (SIA = 7.89 µg·m−3; Ep), Paris (France) (SIA = 5.30 µg·m−3), Neuglobsow (SIA = 5.25 µg·m−3; Ep) as well as other German stations (with exception to Schauinsland). However, it was higher than the SIA concentrations registered in: Rucava (Latvia) (SIA = 1.17 µg·m−3; Ep), Utö (Sweden) (SIA = 0.85 µg·m−3; Ep), Harwell (United Kingdom) (SIA = 2.17 µg·m−3; Ep), Chaumont (Switzerland) (SIA = 3.70 µg·m−3), Iskrba (Slovenia) (SIA = 1.78 µg·m−3; Ep), Ispra (Italy) (SIA = 2.97 µg·m−3; Ep), Monte Martano (Italy) (SIA = 3.28 µg·m−3) and Montseny (Spain) (SIA = 1.88 µg·m−3; Ep). Taking into account the rural background stations in Poland, the SIA concentration in Złoty Potok was ~2 times lower than the concentration of SIA in Raciborz (SIA = 8.36 µg·m−3; Ep), while comparable to the values registered in Zielonka and Puszcza Borecka (in both cases: SIA = 4.32 µg·m−3; Ep), which applies also to other averaging periods (Table 1). Moreover, it was comparable to the SIA concentration from the measurement station at Ayia Marina (Cyprus) (SIA = 4.28 µg·m−3; Ep) and Seville (Spain) (SIA = 4.25 µg·m−3), however in the first case higher concentration levels were recorded in the non-heating season (opposite to Złoty Potok).
Generally, fine particulate matter concentrations recorded at urban and urban background stations (Table 2) are higher than the PM2.5 concentrations from the rural background station (Table 1). As an example, the following could be mentioned:
-
Urban background station in Paris (PM2.5 = 14.8 µg·m−3) and station in its suburbs (PM2.5 = 12.6 µg·m−3) (France);
-
Urban station in Thessaloniki (PM2.5 = 25.9 µg·m−3 and 37.7 µg·m−3 (Ep)) and rural background stations in Finokalia (PM2.5 = 12.00 µg·m−3) and Penteli (PM2.5 = 23.8 µg·m−3) (Greece),
-
Urban background station in Prague (PM2.5 = 29.6 µg·m−3) and regional background station in Košetice (PM2.5 = 22.5 µg·m−3 (Ep)) (the Czech Republic, heating period).
The exceptions to the above rule could be explained by the different research period (e.g., PM2.5 concentrations in the summer season in Budapest (14 μg·m−3) and K-Puszta (23.32 μg·m−3), Hungary) and the location conditions of measurement stations [31,71]. This is clearly visible on the basis of the results obtained in the earlier mentioned research project (Section 3)—lower values of PM2.5 concentrations were recorded in Szczecin compared to Złoty Potok, due to the location of the former station in a relatively “clean” coastal area [27,32,47,49].
Similarly, the concentrations of the selected main constituents of PM2.5 from urban areas (Table 2) are generally higher compared to the values obtained in rural background stations (Table 1). The exceptions concern mainly concentrations of secondary inorganic ions and as an example such situation could be observed in:
-
Poland: SIA concentrations in Szczecin (SIA = 5.42 µg·m−3; Ep) was closer to the value recorded in Złoty Potok (SIA = 4.36 µg·m−3; Ep) than in Trzebinia (SIA = 7.35 µg·m−3; Ep);
-
Germany: similar levels of the SIA concentrations from rural background stations located in Waldhof (SIA = 6.06 µg·m−3; Ep) and Neuglobsow (SIA = 5.25 µg·m−3; Ep) and urban background station in Duisburg (SIA = 5.80 µg·m−3);
-
The Netherlands: higher SIA concentrations from rural background station in Cabauw-Zijdeweg (SIA = 7.89 µg·m−3; Ep) in comparison with urban background station in Rotterdam (SIA = 4.10 µg·m−3).
Regarding the concentrations of PM2.5 main constituents, urban background station in Szczecin generally differed significantly compared to Trzebinia (Table 2), which information was mentioned in the Section 3. Therefore, the comparison of the concentrations of these components with the values recorded at other urban and urban background stations in Europe should be performed separately. Thus, concentrations of carbonaceous aerosol in Trzebinia (TC = 10.81 µg·m−3 (Ep), 19.36 µg·m−3 (Hp) and 5.63 µg·m−3 (NHp)) were significantly higher compared to the values obtained at majority of stations presented in Table 2, for example, Birmingham (UK) (TC = 3.30 µg·m−3), Marseille (France) (TC = 8.00 µg·m−3) and Barcelona (Spain) (TC = 4.20 µg·m−3). Slightly similar values of TC concentrations were noted only in Prague (the Czech republic) (TC = 13.11 µg·m−3) and Istanbul (Turkey) (TC = 12.66 µg·m−3). The TC concentrations in Szczecin (TC = 7.01 µg·m−3 (Ep), 10.15 µg·m−3 (Hp) and 3.34 µg·m−3 (NHp)) was lower than the TC concentrations from Trzebinia and other stations located in southern Poland. They were also comparable or slightly lower in respect to the values registered in Athens (Greece) (TC = 6.90 µg·m−3), Marseille (France) (TC = 8.00 µg·m−3), Bologna (Italy) (TC = 6.70 µg·m−3) as well as in Budapest (Hungary) (TC = 7.44 µg·m−3 (Ep)) and Thessaloniki (Greece) (TC = 7.91 µg·m−3 (Ep)), where in addition a similar seasonal variation of TC concentrations was observed (Table 2). On the other hand, they were relatively higher compared to the data from many urban stations presented in Table 2, for example, Gdańsk (Poland) (TC = 8.65 µg·m−3 (Hp) and 2.20 µg·m−3 (NHp)), Birmingham (UK) (TC = 3.30 µg·m−3), Duisburg (Germany) (TC = 4.58 µg·m−3), Saint-Omer (France) (TC = 5.21 µg·m−3), Limassol (Cyprus) (TC = 6.90 µg·m−3) and majority of stations located in Italy (e.g., Genoa, TC = 4.10 µg·m−3) and Spain (e.g., Pamplona, TC = 6.90 µg·m−3).
Considering the total concentration of secondary inorganic ions, the values recorded in Trzebinia (SIA = 7.35 µg·m−3 (Ep), 10.83 µg·m−3 (Hp) and 5.23 µg·m−3 (NHp)) were similar or lower than the concentrations of SIA in Zabrze (Poland) (SIA = 10.64 µg·m−3 (Hp) and 4.27 µg·m−3 (NHp)), Menen (Belgium) (SIA = 12.15 µg·m−3 (Ws) and 9.32 µg·m−3 (Ss)), Prague (Czech Republic) (SIA = 10.24 µg·m−3), Dunkerque (France) (SIA = 10.14 µg·m−3 (Ws) and 16.32 µg·m−3 (Ss)) as well as Zurich (SIA = 9.10 µg·m−3) and other stations located in Switzerland. However, they were higher than the values recorded in Paris (France) (SIA = 6.30 µg·m−3), Madrid (Spain) (SIA = 2.25 µg·m−3 (Ws) and 1.98 µg·m−3, (Ss)) or Duisburg (Germany) (SIA = 5.80 µg·m−3).
In comparison to the urban and urban background stations listed in Table 2, the concentration of SIA from Szczecin (SIA = 5.42 µg·m−3 (Ep), 7.74 µg·m−3 (Hp) and 2.72 µg·m−3 (NHp)) was generally lower (e.g., Saint-Omer (France) (SIA = 16.37 µg·m−3), Thessaloniki (Greece) (SIA = 10.16 µg·m−3 (Ep)), Bologna (Italy) (SIA = 7.50 µg·m−3), Istanbul (Turkey) (SIA = 7.23 µg·m−3)) or comparable (e.g., Athens (Greece) (SIA = 6.05 µg·m−3), Limassol (Cyprus) (SIA = 5.60 µg·m−3), Conegliano (Italy) (SIA = 5.20 µg·m−3), Barcelona (Spain) (SIA = 4.80 µg·m−3)). The exceptions were the urban background stations in Lecce (Italy) (SIA = 3.81 µg·m−3) and Rotterdam (the Netherlands) (SIA = 4.10 µg·m−3). Moreover, SIA concentrations in Szczecin were also relatively low in relation to the values observed at urban background stations in Poland (with the exception of the measurements in Zabrze, in 2008), in contrast to Trzebinia, where SIA concentrations did not differ significantly from those recorded at other stations located in the southern parts of the country.

4.2. Chemical Composition of PM2.5—Contributions

The relative content of SIA as well as carbonaceous aerosol and other chemical constituents bounded with particulate matter can demonstrate considerable seasonal and temporal variability [31,34,79]. Both short-term and long-term studies indicate that meteorological parameters, such as temperature, precipitation, wind direction and wind velocity, have great influence on atmospheric aerosol properties [67,96,107]. In addition, temporal and spatial variation of particulate matter characteristics is the function of the local emission sources as well as long-range transport of pollutants [49,96].
The contribution of main chemical compounds in PM2.5 mass (Figure 2 and Figure 3) was calculated on the basis of data contained in Table 1 and Table 2. In case of the rural background stations selected for comparisons, the SIA share in PM2.5 were within the range from ~12% (Hp) (Utö, Finland) to ~62% (Hp) (Waldhof, Germany) (Figure 2). The contribution of SIA in PM2.5 from the selected urban and urban background stations ranged from ~12% (Ss) (Madrid, Spain) to ~68% (Menen, Belgium) (Figure 3). The share of the secondary inorganic aerosol (SIA) was typically dominated by sulphates and less often by nitrates (North-Western Europe, some urban background stations in Italy) (Figure 2 and Figure 3). The content of ammonium ions was quite lower. In general, higher SIA shares in PM2.5 were found at measurement stations located in central (Switzerland) and western Europe (France, Germany) compared to the central and southern parts (Slovenia, Hungary, Italy, Spain). This applies to both urban and urban background stations (Figure 3) as well as the rural background stations (Figure 2). It is also worth to note that the contribution of SIA can change significantly within one country, as confirmed by the urban background stations in France (from ~28% (Marsylia) to ~50% (Saint-Omer)) and Spain (from ~12% (Ss) (Madrid) to ~36% (Elche) and rural background stations in Greece (from ~29% (Penteli) to ~50% (Finokalia)) and Germany (from ~33% (Ss) (Melpitz) to ~62% (Hp) (Waldhof)).
Numerous studies have shown that the largest proportion of SIA in the PM mass is usually identified at the background sites [9,48,50]. This can be also observed when looking into the data presented in Figure 2 and Figure 3, with the following stations as an example: Czech Republic (SIA: ~42% (Ep) and ~35% in Košetice and Prague, respectively), Germany (SIA: ~53% (Ep), ~51% (Ep) and ~39% in Waldhof, Neuglobsow and Duisburg, respectively) and Greece (SIA: ~50%, ~30% and ~27% (Ep) in Penteli, Finokalia and Thessaloniki, respectively). However, the situation is often more complex—for example in Finland, PM2.5 from Helsinki was characterized by a higher SIA content (~27%) compared to Utö (~13% (Ep)). Another example could be the stations in Italy where, in general, higher SIA shares were recorded in PM2.5 from urban and urban background stations. An exception may be the rural background station in Monte Martano with a relatively high proportion of SIA in the fine particulate matter (~30%). In case of Poland, results from the studies conducted as part of the mentioned research project, have shown a significantly higher share of SIA in PM2.5 from Szczecin (~31% (Ep)) and Trzebinia (~29% (Ep)) compared to Złoty Potok (~17% (Ep)). Nevertheless, the share of SIA in PM2.5 from two considered urban background stations was quite lower with reference to the values recorded in Puszcza Borecka (~34% (Ep)).
Taking into account the results recorded at the rural background station in Złoty Potok, the total share of the secondary inorganic ions was generally lower in relation to the values recorded at the stations listed in Figure 2 (e.g., stations in Germany, the Netherlands, France and Greece). It was also lower compared to the share of SIA in PM2.5 from Raciborz, Puszcza Borecka and Zielonka, with average (during calendar year) SIA/PM2.5 ratios at the level of ~26%, ~34% and ~27%, respectively. Almost the same content of SIA in PM2.5 to the one found in Złoty Potok was recorded at the rural background stations in Harwell (UK) (Ep), K-Puszta (Hungary) and Ispra (Italy) (Ep). It should be noted that for the majority of the rural background stations (Figure 2), the share of SIA in PM2.5 showed more or less pronounced seasonal variation (in contrast to Złoty Potok), with higher values recorded in the heating period (e.g., Puszcza Borecka (~41%), Zielonka (~31%), Harwell (~19%), Waldhof (~62%), Neuglobsow (~56%), Melpitz (~47–50%), Montseny (~18%)), less often in the non-heating period (e.g., Racibórz (~29%), Üto (~14%), Ispra (~20%)) (Figure 2). However, the situation observed in Złoty Potok (SIA: ~17%) is nothing exceptional—the lack of clear seasonal variability of the SIA contribution in PM2.5 was also noted at some other stations in Europe, for example, Košetice (the Czech Republic) (~39%), Risø (Denmark) (~43%), Schauinsland (Germany) (~36–38%), Cabauw-Zijdeweg (The Netherlands (~51%), Puy-de-Dôme (France) (~41%), Iskrba (Slovenia) (~15–16%) (Figure 2).
It is also easily observable that in the case of many rural background stations, the secondary inorganic aerosol clearly dominates over the carbon matter (Figure 2). Exceptions are two stations located in Central Europe–Iskrba (Slovenia) (SIA: ~15% and TC: ~32%; Ep) and K-Puszta (Hungary) (SIA: ~17% and TC: ~22%; Ss) as well as stations located in Italy (Ispra, SIA: ~17% and TC: ~40%; Ep) and Spain (e.g., Montseny with similar contributions both for SIA and TC (~16%, Ep). The rural background stations in Poland also differ a lot from the majority of stations listed in Figure 2 by the strong dominance of TC over SIA. This situation also applies to the urban background station (Figure 3), however the difference in the shares of the above-mentioned main components is less visible.
The contribution of TC in PM2.5 from the rural background stations reached values ranging from ~12% (all averaging periods) (Ayia Marina, Cyprus) to ~59% (Puy-de-Dôme, France) (Figure 2). Considering the measurement station in Złoty Potok (~40% (Ep)), the share of TC in PM2.5 was close to the value recorded in Racibórz (~45% (Ep)) and clearly higher compared to the stations located in Puszcza Borecka and Zielonka (respectively ~31% and ~32%; Ep), which applies to all averaging periods. A comparable share of TC in the fine particulate matter was recorded only at the regional background station in Ispra (Italy) (~40% (Ep)), however without distinct seasonal variation as in the case of Złoty Potok. A clearly higher value of the share of TC in PM2.5 was recorded at the regional background station in Puy-de-Dôme (France) during summer season (~59%), which could be explained by the occurrence of an additional source of TC in this period—the emission of secondary organic aerosol from biogenic sources (location of the station in the agricultural and forest area) [40].
In contrast to the secondary inorganic aerosol, the contribution of TC in PM2.5 from Złoty Potok showed a clear seasonal variation with a higher shares in the heating period (~44%) compared to the non-heating one (~32%) (Figure 2). Similar results were also found at other rural background stations in Poland (except for Puszcza Borecka, TC: ~31% for all averaging period) and on some European stations (e.g., Košetice (Czech Republic) (~30% (Ws) and ~26% (Ss)) and Ispra (Italy) (~41% (Hp) and ~37% (NHp)). However, in general the contribution of TC in PM2.5 from the rural background stations listed in Figure 2 remained relatively constant over the year or was higher in the warm period, for example, Schauinsland (Germany) (~22% (Hp) and ~28% (NHp)) and Puy-de-Dôme (France) (~14% (Ws) and ~59% (Ss)).
Urban and urban background stations were typically characterized by higher share of TC in PM2.5, which ranged from ~14% (Dunkerque (France), Ss) to ~49% (Trzebinia (Poland), Hp) (Figure 3). Considering the entire period of research, the share of TC in PM2.5 from Szczecin (~41%) and Trzebinia (~43%) was generally much higher in relation to data from the majority of stations listed in the Figure 3 (e.g., Saint-Omer (France) (~16%), Huelva (Spain) (~20%)). Relatively high TC/PM2.5 ratios were also recorded at the measurement stations in Marseille (France) (~41%), Prague (the Czech Republic) (~44%, Hp), Athens (Greece) (~38%) and Bern (Switzerland) (~39%).
In the case of urban and urban background stations, there is no such visible difference in the share of SIA and TC in PM2.5 (Figure 3). A higher share of SIA was found, among others, at many stations in Spain (e.g., Valencia, SIA: ~35% and TC: 30%), Duisburg (Germany) (SIA: ~39% and TC: 31%), Thessaloniki (Greece) (SIA: ~27% and TC: 21%; Ep) and Genoa (Italy) (SIA: ~39% and TC: 29%). A clear dominance of SIA over TC contribution characterized especially the PM2.5 composition in France (e.g., Saint Omer, SIA: ~50% and TC: 16%), Zurich (Switzerland) (SIA: ~46% and TC: 26%) and Limassol (Cyprus) (SIA: ~43% and TC: 19%). The total carbon had the highest share of analysed chemical components in the case of measurement stations in Prague (the Czech Republic) (SIA: ~36% and TC: ~44%), Rotterdam (the Netherlands) (SIA: ~23% and TC: ~31%), Marseille (France) (SIA: ~28% and TC: ~41%), Bern (Switzerland) (SIA: ~30% and TC: ~39%), Budapest (Hungary) (SIA: ~30% and TC: ~35%) and Istanbul (Turkey) (~18% and ~32%). Also urban background stations in Szczecin and Trzebinia (Poland) were characterized by a clear dominance of TC over SIA, with mean values averaged over entire period amounted to: ~31% and ~41% (Szczecin) and ~29% and ~43% (Trzebinia), respectively.
The total share of secondary inorganic ions in PM2.5 from Szczecin and Trzebinia was generally lower compared to the data registered at many stations located in the northern and central parts of Europe, for example, Menen (Belgium) (~68%), Birmingham (UK) (~51%), Saint-Omer (France) (~50%), Dunkerque (France) (~41% (Hp) and 49% (NHp)) and Basel (Switzerland) (~49%) (Figure 3). The share of SIA remained in a similar range of values as SIA contribution registered at stations in Marseille (France) (~28%), Bern (Switzerland) (~30%), Budapest (Hungary) (~28–30%), Padua (Italy) (~31%) or Thessaloniki (~28%, Hp). Slightly lower shares of SIA were noted, among others, at stations in Helsinki (Finland) (~27%), Rotterdam (the Netherlands) (~23%), Leece and Conegliano (Italy) (~26%), L`Eliana and Barcelona (Spain) (~25%) and Istanbul (Turkey) (~18%). Both stations in Szczecin and Trzebinia were also characterized by a higher SIA share in PM2.5 and less pronounced seasonal variation of this share compared to other urban background stations located in Poland (Figure 3). For most stations listed in Figure 3, the higher SIA contribution in PM2.5 were generally found during the heating season than non-heating one, for example, Thessaloniki (Greece) (~28% (Hp) and ~25% (NHp)) and Madrid (Spain) (~16% (Hp) and ~12% (NHp)).

5. Conclusions

Comprehensive literature studies allowed to summarize knowledge about the monitoring of air quality in Europe in terms of particulate matter, especially in relation to PM2.5. The present work was addressed on quantitative comparison of the PM2.5 chemical characteristics measured at different rural and urban background stations in Europe. The concentrations of PM2.5, as well as PM2.5-related SIA and TC, registered both at rural and urban background stations varied within wide range of values. Considering data for the former type of stations, it can be observed that the concentrations of PM2.5 from Złoty Potok were visibly higher compared to the values observed on most rural sites (north-western Europe, Mediterranean area) especially during the heating period. The average concentrations of the main components in PM2.5 from Złoty Potok were also higher, which is particularly evident in the case of the carbonaceous aerosol, which was the predominant PM2.5 component from mentioned station, as well as other rural stations located in different parts of Poland.
Generally, PM2.5 concentrations recorded at urban and urban background stations are higher than the PM2.5 concentrations from the rural background stations. Some exceptions from this rule could be explained by the different research period and the specific location conditions in the measurement stations. This for example applies to the sites in Szczecin and Trzebinia, which generally differed significantly in terms of concentrations of PM2.5 main constituents, with higher values for the latter station. Taking into consideration the European data, the highest concentration of carbonaceous aerosol was found in the central parts of Europe (southern Poland—Trzebinia, Katowice; Czech Republic—Prague) and in some southern European countries (Greece—Thessaloniki; Turkey—Istanbul). The concentrations of SIA were more diversified, in general, with the highest levels recorded in some French stations (Saint-Omer, Dunkerque), following by Menen (Belgium), Thessaloniki (Greece), Helsinki (Finland), Rovigo (Italy) and stations located in southern Poland (Trzebinia, Katowice, Zabrze).
The relative content of SIA as well as carbonaceous aerosol demonstrated different spatial and seasonal variability. In general, higher SIA shares in PM2.5 were found at measurement stations located in central (Switzerland) and western Europe (France, Germany) compared to the central and southern parts (Slovenia, Hungary, Italy, Spain), which applies both to urban and urban background stations as well as the rural background stations. In many cases (e.g., Czech Republic, Germany, Greece) the largest proportion of SIA in the PM mass was identified at the rural background sites. However, research conducted as a part of this work has shown that those ratios differs from site to site without any trend—for example in Italy, Finland and Poland, with higher SIA shares in PM2.5 from urban background sites.
Taking into account the results recorded at the rural background station in Złoty Potok, the total share of secondary inorganic ions was generally lower or comparable to many European stations having similar characteristics, without any significant seasonal variations. Another difference is related to a strong dominance of TC over SIA in the case of Złoty Potok compared to the European data. A comparable share of TC in the fine particulate matter was recorded only at the regional background station in Ispra (Italy), however without any distinct seasonal variation as in the case of Złoty Potok.
Urban and urban background stations were typically characterized by a higher share of TC in PM2.5, compared to the rural background sites, which ranged from ~14% (Dunkerque (France)) to ~49% (Trzebinia (Poland)). Moreover, for the former type of stations, there is also no such visible difference in the share of SIA and TC in PM2.5. Considering the entire period of the measurements, the share of TC in PM2.5 from Szczecin and Trzebinia was generally much higher in relation to data from the majority of the European urban stations. Relatively high values of TC/PM2.5 ratio were also recorded at the measurement stations in Marseille (France), Prague (Czech Republic), Athens (Greece) and Bern (Switzerland). The total share of the secondary inorganic ions in PM2.5 from Szczecin and Trzebinia was generally lower compared to data registered at many stations located in the northern and central parts of the Europe (e.g., Menen (Belgium), Birmingham (UK), Saint-Omer and Dunkerque (France) and Basel (Switzerland).
Finally, it was found that the measurement stations in Poland stand out from the other European stations with lower or comparable contribution of SIA in PM2.5 mass and relatively high share of total carbon. The strong dominance of carbonaceous aerosol over SIA results from the structure of energy consumption in the country, with the dominance of fossil fuels, especially coal and lignite and the wide use of biomass in low-efficiency furnaces. This probably results from the combustion conditions favouring emissions of substances rich in organic carbon. It is also worth to note that the seasonal variation of the SIA share in PM2.5 from Szczecin and Trzebinia is definitely less pronounced and almost negligible in case of rural background station in Złoty Potok. While analysing the data recorded at other European stations it could be easily observe that if seasonal differences occur, they are more visible in the case of rural background stations.

Author Contributions

B.B.: conceptualization, methodology, formal analysis, resources, data curation, visualization, investigation, writing—original draft preparation, writing—review and editing, project administration; K.W.-R.: methodology, formal analysis, writing—review and editing, English correction; N.Z.—formal analysis, writing—original draft preparation; K.K.: writing—review & editing, project administration, supervision, funding acquisition; K.J.-R.: writing—review and editing, project administration, supervision.

Funding

This work was supported by the Polish National Science Centre under PRELUDIUM funding scheme 2nd edition, Project no. 2011/03/N/ST10/05542 (Investigations of chemical composition of fine particles and assessment of secondary inorganic aerosol contribution at urban and regional background sites, 2012–2015). Data analysis was supported by the Institute of Environmental Engineering of the Polish Academy of Sciences basic (statutory) research project no. A1-104/2015 (The influence of local and synoptic factors on the physicochemical composition of aerosols and selected gaseous substances, 2015–2017).

Acknowledgments

Review materials presented in this work is a part of the doctoral dissertation of the corresponding author (Analysis of the seasonal variability and origin of the secondary inorganic aerosol in the fine particulate matter from selected background stations in Poland, under preparation).

Conflicts of Interest

The authors declare no conflict of interest.

References

  1. Hinds, W.C. Aerosol Technology. Properties, Behaviour, and Measurement of Airborne Particles, 2nd ed.; John Wiley & Sons, Inc.: New York, NY, USA, 1998; pp. 1–11. ISBN 0-471-19410-7. [Google Scholar]
  2. Chow, J.C.; Lowenthal, D.H.; Chen, L.-W.A.; Wang, X.; Watson, J.G. Mass reconstruction methods for PM2.5: A review. Air Qual. Atmos. Health 2015, 8, 243–263. [Google Scholar] [CrossRef] [PubMed]
  3. Seinfeld, J.H.; Pandis, S.N. Atmospheric Chemistry and Physics: From Air Pollution to Climate Change, 3rd ed.; John Wiley & Sons Inc.: New York, NY, USA, 2016; pp. 325–656. ISBN 978-1-118-94740-1. [Google Scholar]
  4. Calvo, A.I.; Alves, C.; Castro, A.; Pont, V.; Vicente, A.M.; Fraile, R. Research on aerosol sources and chemical composition: Past, current and emerging issues. Atmos. Res. 2013, 120–121, 1–28. [Google Scholar] [CrossRef]
  5. Pope, C.A.; Dockery, D.W. Health effects of fine particulate air pollution: Lines that connect. J. Air Waste Manag. Assoc. 2006, 56, 709–742. [Google Scholar] [CrossRef] [PubMed]
  6. World Health Organization. Air Quality Guidelines. Global Update 2005. Particulate Matter, Ozone, Nitrogen Dioxide and Sulfur Dioxide; WHO Regional Office for Europe: Copenhagen, Denmark, 2006; ISBN 92-890-2192-6. [Google Scholar]
  7. Basagaña, X.; Jacquemin, B.; Karanasiou, A.; Ostro, B.; Querol, X.; Agis, D.; Alessandrini, E.; Alguacil, J.; Artiñano, B.; Catrambone, M.; et al. Short-term effects of particulate matter constituents on daily hospitalizations and mortality in five South-European cities: Results from the MED-PARTICLES project. Environ. Int. 2015, 75, 151–158. [Google Scholar] [CrossRef] [PubMed]
  8. Solomon, S.; Qin, D.; Manning, M.; Marquis, M.; Averyt, K.; Tignor, M.M.B.; LeRoy Miller, H. Climate Change 2007: The Physical Science Basis; Contribution of Working Group I to the Fourth Assessment Report of the IPCC; Cambridge University Press: New York, NY, USA, 2007; ISBN1 978-0521-88009-1. ISBN2 978-0521-70596-7. [Google Scholar]
  9. Squizzato, S.; Masiol, M.; Innocente, E.; Pecorari, E.; Rampazzo, G.; Pavoni, B. A procedure to assess local and long-range transport contributions to PM2.5 and secondary inorganic aerosol. J. Aerosol Sci. 2012, 46, 64–76. [Google Scholar] [CrossRef]
  10. Grantz, D.A.; Garner, J.H.B.; Johnson, D.W. Ecological effects of particulate matter. Environ. Int. 2003, 29, 213–239. [Google Scholar] [CrossRef]
  11. Sánchez, J.S.; Vidal Romaní, J.R.; Alves, C. Deposition of particles on gypsum-rich coatings of historic buildings in urban and rural environments. Constr. Build. Mater. 2011, 25, 813–822. [Google Scholar] [CrossRef]
  12. European Environment Agency. Air Quality in Europe–2018 Report; EEA Report No 12/2018; Publication office of the European Union: Luxembourg, 2018; ISBN 978-92-9213-921-6.
  13. Fann, N.; Risley, D. The public health context for PM2.5 and ozone air quality trends. Air Qual. Atmos. Health 2013, 6, 1–11. [Google Scholar] [CrossRef]
  14. Yin, J.; Harrison, R.M. Pragmatic mass closure study for PM1.0, PM2.5 and PM10 at roadside, urban background and rural sites. Atmos. Environ. 2008, 42, 980–988. [Google Scholar] [CrossRef]
  15. Klejnowski, K.; Krasa, K.; Rogula-Kozłowska, W.; Błaszczak, B. Number Size Distribution of Ambient Particles in a Typical Urban Site: The First Polish Assessment Based on Long-Term (9 Months) Measurements. Sci. World J. 2013, 2013. [Google Scholar] [CrossRef]
  16. Masiol, M.; Squizatto, S.; Ceccato, D.; Pavoni, B. The size distribution of chemical elements of atmospheric aerosol at a semi-rural coastal site in Venice (Italy). The role of atmospheric circulation. Chemosphere 2015, 119, 400–406. [Google Scholar] [CrossRef] [PubMed]
  17. Rogula-Kozłowska, W.; Kozielska, B.; Klejnowski, K. Concentration, Origin and Health Hazard from Fine Particle-Bound PAH at Three Characteristics Sites in Southern Poland. Bull. Environ. Contam. Toxicol. 2013, 91, 349–355. [Google Scholar] [CrossRef] [PubMed]
  18. Rogula-Kozłowska, W.; Kozielska, B.; Klejnowski, K.; Szopa, S. Hazardous compounds in urban PM in the central part of Upper Silesia (Poland) in winter. Arch. Environ. Prot. 2013, 39, 53–65. [Google Scholar] [CrossRef]
  19. Transboundary Particulate Matter, Photo-Oxidants, Acidifying and Euthrophying Components. EMEP Status Report 1/2018. 22 August 2018. Available online: http://www.emep.int/publ/common_publications.html (accessed on 23 October 2018).
  20. Harrison, R.M.; Yin, J. Particulate matter in the atmosphere: Which particle properties are important for its effects on health? Atmos. Environ. 2000, 249, 85–101. [Google Scholar] [CrossRef]
  21. Directive 2008/50/EC of the European Parliament and of the Council of 21 May 2008 on Ambient Air Quality and Cleaner Air for Europe. Available online: https://eur-lex.europa.eu/eli/dir/2008/50/oj (accessed on 23 October 2018).
  22. Shao, J.; Wheeler, A.J.; Chen, L.; Strandberg, B.; Hinwood, A.; Johnston, F.H.; Zosky, G.R. The pro-inflammatory effects of particulate matter on epithelial cells are associated with elemental composition. Chemosphere 2018, 202, 530–537. [Google Scholar] [CrossRef] [PubMed]
  23. Wu, W.; Jin, Y.; Carlsten, C. Inflammatory health effects of indoor and outdoor particulate matter. J. Allergy Clin. Immunol. 2018, 141, 833–844. [Google Scholar] [CrossRef] [PubMed]
  24. Pozzer, A.; Bacer, S.; De Zolt Sappadina, S.; Predicatori, F.; Caleffi, A. Long-term concentrations of fine particulate matter and impact on human health in Verona, Italy. Atmos. Pollut. Res. 2018. [Google Scholar] [CrossRef]
  25. Juda-Rezler, K.; Reizer, M.; Oudinet, J.-P. Determination and analysis of PM10 source apportionment during episodes of air pollution in Central Eastern European urban areas: The case of wintertime 2006. Atmos. Environ. 2011, 45, 6557–6566. [Google Scholar] [CrossRef]
  26. Majewski, G.; Rogula-Kozłowska, W. The elemental composition and origin of fine ambient particles in the largest Polish conurbation: First Results from the short-term winter campaign. Theor. Appl. Climatol. 2016, 125, 79–92. [Google Scholar] [CrossRef]
  27. Błaszczak, B. The Use of Principal Component Analysis for Source Identification of PM2.5 from Selected Urban and Regional Background Sites in Poland. In Proceedings of the E3S Web of Conferences, X-th Scientific Conference Air Protection in Theory and Practice, Zakopane, Poland, 18–21 October 2017. [Google Scholar]
  28. Caggiano, R.; Macchiato, M.; Trippetta, S. Levels, chemical composition and sources of fine aerosol particles (PM1) in an area of the Mediterranean basin. Sci. Total Environ. 2010, 408, 884–895. [Google Scholar] [CrossRef]
  29. Diapouli, E.; Manousakas, M.; Vratolis, S.; Vasilatou, V.; Maggos, T.; Saraga, D.; Grigoratos, T.; Argyropoulos, G.; Voutsa, D.; Samara, C.; et al. Evolution of air pollution source contributions over one decade, derived by PM10 and PM2.5 source apportionment in two metropolitan urban areas in Greece. Atmos. Environ. 2017, 164, 416–430. [Google Scholar] [CrossRef]
  30. Spindler, G.; Brüggemann, E.; Gnauk, T.; Grüner, A.; Müller, K.; Herrmann, H. A four-year size-segregated characterization study of particles PM10, PM2.5 and PM1 depending on air mass origin at Melpitz. Atmos. Environ. 2010, 44, 164–173. [Google Scholar] [CrossRef]
  31. Rogula-Kozłowska, W.; Klejnowski, K.; Rogula-Kopiec, P.; Ośródka, L.; Krajny, E.; Błaszczak, B.; Mathews, B. Spatial and seasonal variability of the mass concentrations and chemical composition of PM2.5 in Poland. Air Qual. Atmos. Health 2014, 7, 41–58. [Google Scholar] [CrossRef] [PubMed]
  32. Błaszczak, B.; Rogula-Kozłowska, W.; Mathews, B.; Juda-Rezler, K.; Klejnowski, K.; Rogula-Kopiec, P. Chemical Compositions of PM2.5 at Two Non-Urban Sites from the Polluted Region in Europe. Aerosol Air Qual. Res. 2016, 16, 2333–2348. [Google Scholar] [CrossRef]
  33. Squizzato, S.; Cazzaro, M.; Innocente, E.; Visin, F.; Hopke, P.K.; Rampazzo, G. Urban air quality in a mid-size city–PM2.5 composition, sources and identification of impact areas: From local to long range contributions. Atmos. Res. 2017, 186, 51–62. [Google Scholar] [CrossRef]
  34. Putaud, J.-P.; Van Dingenen, R.; Alastuey, A.; Bauer, H.; Birmili, W.; Cyrys, J.; Flentje, H.; Fuzzi, S.; Gehrig, R.; Hansson, H.C.; et al. A European aerosol phenomenology–3: Physical and chemical characteristics of particulate matter from 60 rural, urban, and kerbside sites across Europe. Atmos. Environ. 2010, 44, 1308–1320. [Google Scholar] [CrossRef]
  35. Viana, M.; Kuhlbusch, T.A.J.; Querol, X.; Alastuey, A.; Harrison, R.M.; Hopke, P.K.; Winiwarter, W.; Vallius, W.; Szidat, S.; Prévôt, A.S.H.; et al. Source apportionment of particulate matter in Europe: A review of methods and results. J. Aerosol Sci. 2008, 39, 827–849. [Google Scholar] [CrossRef]
  36. Sillanpää, M.; Hillamo, R.; Saarikoski, S.; Frey, A.; Pennanen, A.; Makkonen, U.; Spolnik, Z.; Van Grieken, R.; Braniš, M.; Brunekreef, B.; et al. Chemical composition and mass closure of particulate matter at six urban sites in Europe. Atmos. Environ. 2006, 40, 212–223. [Google Scholar] [CrossRef]
  37. Jones, A.M.; Harrison, R.M. Interpretation of particulate elemental and organic carbon concentrations at rural, urban and kerbside sites. Atmos. Environ. 2005, 39, 7114–7126. [Google Scholar] [CrossRef]
  38. Plaza, J.; Artñano, B.; Salvador, P.; Gómez-Moreno, F.J.; Pujadas, M.; Pio, C.A. Short-term secondary organic carbon estimations with a midified OC/EC primary ratio methos at suburban site in Madrid (Spain). Atmos. Environ. 2011, 45, 2496–2506. [Google Scholar] [CrossRef]
  39. Khan, M.B.; Masiol, M.; Formenton, G.; Di Gilio, A.; de Gennaro, G.; Agostinelli, C.; Pavoni, B. Carbonaceous PM2.5 and secondary organic aerosol across the Veneto region (NE Italy). Sci. Total Environ. 2016, 542, 172–181. [Google Scholar] [CrossRef] [PubMed]
  40. Freney, E.J.; Sellegri, K.; Canonaco, F.; Boulon, J.; Hervo, M.; Weigel, R.; Pichon, J.M.; Colomb, A.; Prévôt, A.S.H.; Laj, P. Seasonal variations in aerosol particle composition at the Puy-de-Dôme research station in France. Atmos. Chem. Phys. 2011, 11, 13047–13059. [Google Scholar] [CrossRef]
  41. Guerreiro, C. Air Quality in Europe–2013 Report; EEA Report No 9/2013; Publication Office of the European Union: Luxembourg, 2013; ISBN 978-92-9213-406-8. [Google Scholar]
  42. Duvall, R.M.; Majestic, B.J.; Shafer, M.M.; Chuang, P.Y.; Simoneit, B.R.T.; Schauer, J.J. The water-soluble fraction of carbon, sulfur, and crustal elements in Asian aerosols and Asian soils. Atmos. Environ. 2008, 42, 5872–5884. [Google Scholar] [CrossRef]
  43. Préndez, M.; Wachter, J.; Vega, C.; Flocchini, R.G.; Wakayabashi, P.; Morales, J.R. PM2.5 aerosols collected in the Antarctic Peninsula with a solar powered sampler during austral summer periods. Atmos. Environ. 2009, 43, 5575–5578. [Google Scholar] [CrossRef]
  44. Galindo, N.; Gil-Moltó, J.; Varea, M.; Chofre, C.; Tubero, E. Seasonal and interannual trends in PM levels and associated inorganic ions in southeastern Spain. Microchem. J. 2013, 110, 81–88. [Google Scholar] [CrossRef]
  45. Rogula-Kozłowska, W.; Sówka, I.; Mathews, B.; Klejnowski, K.; Zwoździak, A.; Kwiecińska, K. Size-Resolved Water-Soluble Ionic Composition of Ambient Particles in an Urban Area in Southern Poland. J. Environ. Prot. 2013, 4, 371–379. [Google Scholar] [CrossRef]
  46. Alastuey, A.; Querol, X.; Rodríguez, S.; Plana, F.; Lopez-Soler, A.; Ruiz, C.; Mantilla, E. Monitoring of atmospheric particulate matter around sources of secondary inorganic aerosol. Atmos. Environ. 2004, 38, 4979–4992. [Google Scholar] [CrossRef]
  47. Błaszczak, B.; Juda-Rezler, K.; Rogula-Kozłowska, W.; Reizer, M.; Mathews, B.; Maciejewska, K.; Klejnowski, K. Ionic Composition of Fine Particulate Matter from Urban and Regional Background Sites in Poland. Environ. Eng. Sci. 2017, 34, 236–250. [Google Scholar] [CrossRef]
  48. Minguillón, N.C.; Querol, X.; Baltensperger, U.; Prévôt, A.S.H. Fine and coarse PM composition and sources in rural and urban sites in Switzerland: Local or regional pollution? Sci. Total Environ. 2012, 427–428, 191–202. [Google Scholar]
  49. Błaszczak, B.; Reizer, M.; Juda-Rezler, K.; Krajny, E.; Mathews, B.; Klejnowski, K. Analysis of national vs. long-range transport contribution to organic and inorganic aerosol load in selected location in Poland. In Air Pollution Modeling and Its Application XXIV; Steyn, D.G., Chaumerliac, N., Eds.; Springer International Publishing: Cham, Switzerland, 2016; pp. 65–70. ISBN 978-3-319-24478-5. [Google Scholar]
  50. Đordević, D.; Vakmirović, Z.; Tošić, I.; Unkašević, M. Contribution of dust transport and resuspension to particulate matter levels in the Mediterranean atmosphere. Atmos. Environ. 2004, 38, 3637–3645. [Google Scholar] [CrossRef]
  51. Hueglin, C.; Gehrig, R.; Baltensperger, U.; Gysel, M.; Monn, C.; Vonmont, H. Chemical characterization of PM2.5, PM10 and coarse particles at urban, near-city and rural sites in Switzerland. Atmos. Environ. 2005, 39, 637–651. [Google Scholar] [CrossRef]
  52. Makkonen, U.; Virkkula, A.; Mäntykenttä, J.; Hakola, H.; Keronen, P.; Vakkari, V.; Aalto, P.P. Semi-continuous gas and inorganic aerosol measurements at a Finnish urban site: Comparisons with filters, nitrogen in aerosol and gas phases, and aerosol acidity. Atmos. Chem. Phys. 2012, 12, 5617–5631. [Google Scholar] [CrossRef]
  53. Szigeti, T.; Óvári, M.; Dunster, C.; Kelly, F.J.; Lucarelli, F.; Záray, G. Changes in chemical composition and oxidative potential of urban PM2.5 between 2010 and 2013 in Hungary. Sci. Total Environ. 2015, 518–519, 534–544. [Google Scholar] [CrossRef] [PubMed]
  54. Ledoux, F.; Kfoury, A.; Delmaire, G.; Roussel, G.; Zein, A.E.; Courcot, D. Contributions of local and regional anthropogenic sources of metals in PM2.5 at an urban site in northern France. Chemosphere 2017, 181, 713–724. [Google Scholar] [CrossRef] [PubMed]
  55. Bressi, M.; Sciare, J.; Ghersi, V.; Bonnaire, N.; Nicolas, J.B.; Petit, J.-E.; Moukhtar, S.; Rosso, A.; Mihalopoulos, N.; Féron, A. A one-year comprehensive chemical characterisation of fine aerosol (PM2.5) at urban, suburban and rural background sites in the region of Paris (France). Atmos. Chem. Phys. 2013, 13, 7825–7844. [Google Scholar] [CrossRef]
  56. Salameh, D.; Detournay, A.; Pey, J.; Pérez, N.; Liguori, F.; Saraga, D.; Bove, M.C.; Brotto, P.; Cassola, F.; Massabò, D.; et al. PM2.5 chemical composition in five European Mediterranean cities: A 1-year study. Atmos. Res. 2015, 155, 102–117. [Google Scholar] [CrossRef]
  57. Belis, C.A.; Karagulian, F.; Larsen, B.R.; Hopke, P.K. Critical review and meta-analysis of ambient particulate matter source apportionment using receptor models in Europe. Atmos. Environ. 2013, 69, 94–108. [Google Scholar] [CrossRef]
  58. Tørseth, K.; Aas, W.; Breivik, K.; Fjaeraa, A.M.; Fiebig, M.; Hjellbrekke, A.G.; Lung Myhre, C.; Solberg, S.; Yttri, K.E. Introduction to the European Monitoring and Evaluation Programme (EMEP) and observed atmospheric composition change during 1972–2009. Atmos. Chem. Phys. 2012, 12, 5447–5481. [Google Scholar] [CrossRef] [Green Version]
  59. CAFE Working Group on Particulate Matter: Second Position Paper on Particulate Matter. 20 December 2004. Available online: http://ec.europa.eu/environment/archives/cafe/pdf/working_groups/2nd_position_paper_pm.pdf (accessed on 23 October 2018).
  60. Larssen, S.; Sluyter, R.; Helmis, C. Criteria for EUROAIRNET, the EEA Air Quality Monitoring and Information Network; Technical Report No. 12; EEA: Copenhagen, Denmark, 2003; ISBN 92-9167-513-X.
  61. Spangl, W.; Schneider, J.; Moosmann, L.; Nagl, C. Representativeness and Classification of Air Quality Monitoring Stations. Draft Final Report; Umweltbundesamt: Vienna, Austria, 2007; Available online: http://ec.europa.eu/environment/air/quality/legislation/pdf/report_uba.pdf (accessed on 23 October 2018).
  62. Guidance on Commision Implementing Decision Laying Down Rules for Directives 2004/107/EC and 2008/50/EC of the European Parliament and of the Council as Regards the Reciprocal Exchange on Information and Reporting on Ambient Air (Decision 2011/850/EU); European Commission Directorate-General for Environment: Brussels, Belgium, 2018; Available online: http://ec.europa.eu/environment/air/quality/data_reporting.htm (accessed on 23 October 2018).
  63. Bulpitt, S.; Price, M. The composition of PM10 as collected by a conventional TEOM, a modified TEOM and a Partisol gravimetric monitor at a kerbside site in the north east of England. Environ. Monit. Assess. 2006, 121, 479–489. [Google Scholar] [CrossRef] [PubMed]
  64. The National Standards Authority of Ireland. PN-EN 12341:2014-07: Ambient Air–Standard Gravimetric Measurement Method to Determine the Concentration of Mass Fractions PM10 or PM2.5 Particulate Matter; The National Standards Authority of Ireland (NSAI): Dublin, Ireland, 2014.
  65. Guide to the Demonstration of Equivalence of Ambient Air Monitoring Methods. Report by an EC Working Group on Guidance for the Demonstration of Equivalence. January 2010. Available online: http://ec.europa.eu/environment/air/quality/legislation/pdf/equivalence.pdf (accessed on 23 October 2018).
  66. Glavas, S.D.; Nikolakis, P.; Ambatzoglou, D.; Mihalopoulos, N. Factors affecting the seasonal variation of mass and ionic composition of PM2.5 at a central mediterranean coastal site. Atmos. Environ. 2008, 42, 5365–5373. [Google Scholar] [CrossRef]
  67. Galindo, N.; Varea, M.; Gil-Moltó, J.; Yubero, E.; Nicolás, J. The Influence of Meteorology on Particulate Matter Concentrations at an Urban Mediterranean Location. Water Air Soil Pollut. 2011, 215, 365–372. [Google Scholar] [CrossRef]
  68. Pateraki, S.; Asimakopoulos, D.N.; Bougiatioti, A.; Maggos, T.; Vasilakos, C.; Mihalopoulos, N. Assessment of PM2.5 and PM1 chemical profile in a multiple-impacted Mediterranean urban area: Origin, sources and meteorological dependence. Sci. Total Environ. 2014, 479–480, 210–220. [Google Scholar] [CrossRef] [PubMed]
  69. Reizer, M.; Juda-Rezler, K. Explaining the high PM10 concentrations observed in Polish urban areas. Air Qual. Atmos. Health 2015, 9, 517–531. [Google Scholar] [CrossRef] [PubMed]
  70. VanCuren, T. Spatial Factors Influencing Winter Primary Particle Sampling and Interpretation. J. Air Waste Manag. Assoc. 1999, 45, 3–15. [Google Scholar] [CrossRef] [PubMed]
  71. Rogula-Kozłowska, W.; Błaszczak, B.; Klejnowski, K. Concentrations of PM2.5, PM2.5-10 and PM-related elements at two heights in an urban background area in Zabrze (Poland). Arch. Environ. Prot. 2011, 37, 31–47. [Google Scholar]
  72. Sanderson, P.; Delgado Saborit, J.M.; Harrison, R.M. A review of chemical and physical characterisation of atmospheric metallic nanoparticles’. Atmos. Environ. 2014, 94, 353–365. [Google Scholar] [CrossRef]
  73. Wilson, J.G.; Kingham, S.; Pearce, J.; Sturman, A.P. A Review of Intraurban Variations in Particulate Air Pollution: Implications for Epidemiological Research. Atmos. Environ. 2005, 39, 6444–6462. [Google Scholar] [CrossRef]
  74. Monn, C. Exposure Assessment of Air Pollutants: A Review on Spatial Heterogeneity and Indoor/Outdoor/Personal Exposure to Suspended Particulate Matter, Nitrogen, Dioxide and Ozone. Atmos. Environ. 2001, 35, 1–32. [Google Scholar] [CrossRef]
  75. Laj, P.; Klausen, J.; Bilde, M.; Plaß-Duelmer, C.; Pappalardo, G.; Clerbaux, C.; Baltensperger, U.; Hjorth, J.; Simpson, D.; Reimann, S.; et al. Measuring atmospheric composition change. Atmos. Environ. 2009, 43, 5351–5414. [Google Scholar] [CrossRef]
  76. EBAS Database. Available online: http://ebas.nilu.no (accessed on 25 February 2014).
  77. AirBase Official Website. Available online: https://www.eea.europa.eu/data-and-maps/data/airbase-the-european-air-quality-database-7 (accessed on 25 August 2017).
  78. European Air Quality Portal. Available online: http://eeadmz1-cws-wp-air.azurewebsites.net/ (accessed on 28 August 2018).
  79. Transboundary Particulate Matter in Europe. EMEP Status Report 4/2011. August 2011. Available online: http://www.emep.int/publ/common_publications.html (accessed on 23 October 2018).
  80. The European Exchange of Information in 2011. ETC/ACM Technical Paper 2012/1. May 2012. Available online: https://acm.eionet.europa.eu/reports/docs/ETCACM_TP_2012_1_eoi2011_2010aqdata.pdf (accessed on 23 October 2018).
  81. Braniš, M.; Domasová, M.; Řezáčová, P. Particulate air pollution in a small settlement: The effect of local heating. Appl. Geochem. 2007, 22, 1255–1264. [Google Scholar] [CrossRef]
  82. Samek, L.; Zwoździak, A.; Sówka, I. Chemical characterization and source identification of particulate matter PM10 in a rural and urban site in Poland. Environ. Prot. Eng. 2013, 39, 91–103. [Google Scholar]
  83. European Supersites for Atmospheric Aerosol Research (EUSAAR). Available online: www.eusaar.net/ (accessed on 28 August 2018).
  84. Aerosols, Clouds, and Trace Gases Research InfraStructure Network (ACTRIS). Available online: https://www.actris.eu/default.aspx (accessed on 28 August 2018).
  85. Integrated Non-CO2 Greenhouse Gas Observing System (InGOS). Available online: http://www.ingos-infrastructure.eu/ (accessed on 28 August 2018).
  86. Chemical On-Line Composition and Source Apportionment of Fine Aerosol (COLOSSAL). Available online: https://www.costcolossal.eu (accessed on 25 February 2014).
  87. Chief Inspectorate of Environmental Protection. Air Quality Portal. Available online: http://powietrze.gios.gov.pl/pjp/current?lang=en (accessed on 28 August 2018).
  88. PRISMA Guidelines. Available online: www.prisma-statement.org/ (accessed on 10 September 2018).
  89. Schwarz, J.; Cusack, M.; Karban, J.; Chalupníčková, E.; Havránek, V.; Smolík, J.; Ždímal, V. PM2.5 chemical composition at a rural background site in Central Europe, including correlation and air mass back trajectory analysis. Atmos. Res. 2016, 176–177, 108–120. [Google Scholar] [CrossRef]
  90. Temesi, D.; Molnár, A.; Mészáros, E.; Feczkó, T.; Gelencsér, A.; Kiss, G.; Krivácsy, Z. Size resolved chemical mass balance of aerosol particles over rural Hungary. Atmos. Environ. 2001, 35, 4347–4355. [Google Scholar] [CrossRef]
  91. Koulouri, E.; Saarikoski, S.; Theodosi, C.; Markaki, Z.; Gerasopoulos, E.; Kouvarakis, G.; Mäkelä, T.; Hillamo, R.; Mihalopoulos, N. Chemical composition and sources of fine and coarse aerosol particles in the Eastern Mediterranean. Atmos. Environ. 2008, 42, 6542–6550. [Google Scholar] [CrossRef]
  92. Moroni, B.; Castellini, S.; Crocchianti, S.; Piazzalunga, A.; Fermo, P.; Scardazza, F.; Cappelletti, D. Ground-based measurements of long-range transported aerosol at the rural regional background site of Monte Martano (Central Italy). Atmos. Res. 2015, 155, 26–36. [Google Scholar] [CrossRef]
  93. Milford, C.; Castell, N.; Marrero, C.; Rodríguez, S.; Sánchez de la Campa, A.M.; Fernández-Camacho, R.; de la Rosa, J.; Stein, A.F. Measurements and simulation of speciated PM2.5 in south-west Europe. Atmos. Environ. 2013, 77, 36–50. [Google Scholar] [CrossRef]
  94. Rogula-Kozłowska, W.; Klejnowski, K.; Rogula-Kopiec, P.; Mathews, B.; Szopa, S. A Study on the Seasonal Mass Closure of Ambient Fine and Coarse Dusts in Zabrze, Poland. Bull. Environ. Contam. Toxicol. 2012, 88, 722–729. [Google Scholar] [CrossRef]
  95. Laongsri, B.; Harrison, R.M. Atmospheric behaviour of particulate oxalate at UK urban background and rural sites. Atmos. Environ. 2013, 71, 319–326. [Google Scholar] [CrossRef]
  96. Ravindra, K.; Stranger, M.; Van Grieken, R. Chemical characterization and multivariate analysis of atmospheric PM2,5 particles. J. Atmos. Chem. 2008, 59, 199–218. [Google Scholar] [CrossRef]
  97. Keuken, M.; van der Gon, H.D.; van der Valk, K. Non-exhaust emissions of PM and the efficiency of emission reduction by road sweeping and washing in the Netherlands. Sci. Total Environ. 2012, 408, 4591–4599. [Google Scholar] [CrossRef]
  98. Kfoury, A.; Ledoux, F.; Roche, C.; Delmaire, G.; Roussel, G.; Courcot, D. PM2.5 source spportionment in a French urban coastal site under steelworks emission influences using constrained non-negative matrix factorization receptor model. J. Environ. Sci. 2016, 40, 114–128. [Google Scholar] [CrossRef] [PubMed]
  99. Tolis, E.I.; Saraga, D.E.; Lytra, M.K.; Papathanasiou, A.C.; Bougaidis, P.N.; Prekas-Patronakis, O.E.; Ioannidis, I.I.; Bartzis, J.G. Concentration and chemical composition of PM2.5 for a one-year period at Thessaloniki, Greece: A comparison between city and port area. Atmos. Environ. 2015, 113, 197–207. [Google Scholar] [CrossRef]
  100. Achilleos, S.; Wolfson, J.M.; Ferguson, S.T.; Kang, C.-M.; Hadjimitsis, D.G.; Hadjicharakambous, M.; Achilleos, C.; Christodoulou, A.; Nisantzi, A.; Papoutsa, C.; et al. Spatial variability of fine and coarse particle composition and sources in Cyprus. Atmos. Res. 2016, 169, 255–270. [Google Scholar] [CrossRef]
  101. Cesari, D.; Donateo, A.; Conte, M.; Merico, E.; Giangreco, A.; Giangreco, F.; Contini, D. An inter-comparison of PM2.5 at urban and urban background sites: Chemical characterization and soruce apportionment. Atmos. Res. 2016, 174–175, 106–119. [Google Scholar] [CrossRef]
  102. Masiol, M.; Benetello, F.; Harrison, R.M.; Formenton, G.; De Gaspari, F.; Pavoni, B. Spatial, seasonal trends and transboundary transport of PM2.5 inorganic ions in the Veneto region (Northeastern Italy). Atmos. Environ. 2015, 117, 19–31. [Google Scholar] [CrossRef]
  103. Mirante, F.; Salvador, P.; Pio, C.; Alves, C.; Artiñano, B.; Caseiro, A.; Revuelta, M.A. Size fractionated aerosol composition at roadside and background environments in the Madrid urban atmosphere. Atmos. Res. 2014, 138, 278–292. [Google Scholar] [CrossRef]
  104. Fernández-Camacho, R.; Rodríguez, S.; de la Rosa, J.; Sánchez de la Campa, A.M.; Alastuey, A.; Querol, X.; González-Castanedo, Y.; Garcia-Orellana, I.; Nava, S. Ultrafine particle and fine trace metal (As, Cd, Cu, Pb and Zn) pollution episodes induced by industrial emissions in Huelva, SW Spain. Atmos. Environ. 2012, 61, 507–517. [Google Scholar] [CrossRef] [Green Version]
  105. Aldabe, J.; Elustondo, D.; Santamaría, C.; Lasheras, E.; Pandolfi, M.; Alastuey, A.; Querol, X.; Santamaría, J.M. Chemical characterization and source apportionment of PM2.5 and PM10 at rural, urban and traffic sites in Navarra (North of Spain). Atmos. Res. 2011, 102, 191–205. [Google Scholar] [CrossRef]
  106. Szigeti, T.; Mihucz, V.G.; Óvári, M.; Baysal, A.; Atilgan, S.; Akman, S.; Záray, G. Chemical characterization of PM2.5 fractions of urban aerosol collected in Budapest and Istanbul. Microchem. J. 2013, 107, 86–94. [Google Scholar] [CrossRef]
  107. Koçak, M.; Mihalopoulos, N.; Kubilay, N. Chemical composition of the fine and coarse fraction of aerosols in the northeastern Mediterranean. Atmos. Environ. 2007, 41, 7351–7368. [Google Scholar] [CrossRef]
Figure 1. PM2.5 concentrations in Europe (annual mean) in 2016 [12]. Dots designate PM2.5 concentrations in the following ranges [in µg·m−3]: ≤ 10; 10–20; 20–25; 25–30; ≥ 30; Applsci 09 00098 i001 No data; Applsci 09 00098 i002 Countries/regions not included in the data exchange process.
Applsci 09 00098 g001
Figure 2. Contributions of secondary inorganic ions and total carbon in PM2.5 [%] from selected rural background stations in Europe. (the results obtained within the project no. 2011/03/N/ST10/05542 were marked by red dotted line).
Applsci 09 00098 g002
Figure 3. Contributions of secondary inorganic ions and total carbon in PM2.5 [%] from selected urban and urban background stations in Europe. (the results obtained within the project no. 2011/03/N/ST10/05542 were marked by red dotted line).
Applsci 09 00098 g003
Table 1. Concentrations of PM2.5 and its main chemical constituents [µg·m−3] recorded at selected rural background stations in Europe.
LocationPeriodConcentration [µg·m−3]
PM2.5SO42−NO3NH4+ClK+Na+Mg2+Ca2+ECOC
Złoty Potok (PL), A [32,47]Jan–Mar, Apr–Jul 201325.162.311.360.690.120.070.240.030.041.488.59
Jan–Mar 201334.022.802.041.080.200.100.260.030.052.1712.69
Apr–Jul 201316.291.810.680.300.030.030.210.030.030.794.49
Racibórz (PL), C [32]2011, 201231.563.643.061.661.350.120.280.030.041.9612.08
H-2011, 201255.365.365.503.313.010.250.490.030.053.5922.54
NH-2011, 201214.762.431.340.500.180.020.120.030.040.804.70
Puszcza Borecka (PL), B [77]201112.792.111.430.780.140.110.300.020.080.583.42
H-201116.492.692.891.160.150.180.560.020.080.844.41
NH-20119.791.690.370.500.040.060.100.020.080.362.62
Zielonka (PL), A [77]201116.071.781.461.080.140.100.120.010.100.884.25
H-201120.492.152.471.660.230.150.130.010.081.255.59
NH-201111.971.440.540.540.050.060.110.010.120.533.02
Košetice (CZ), B [89]Feb 2009–Apr 201015.72.852.201.520.040.090.04<0.01-0.614.07
winter: Feb 2009–Apr 201022.503.862.831.920.050.150.04<0.01-0.806.00
summer: Feb 2009–Apr 20109.702.300.550.960.010.030.03<0.01-0.362.12
Rucava (LV), B [76]200916.740.760.41-0.250.100.500.030.26--
H-200919.180.920.50-0.250.120.790.020.09--
NH-200913.660.570.32-0.240.070.180.040.46--
Üto (FI), B [76]20116.550.330.280.240.050.230.280.220.02--
H-20116.580.370.120.290.050.050.350.040.02--
NH-20116.530.300.440.190.060.410.200.410.02--
Harwell (UK), A [77]201212.840.590.491.090.530.051.240.140.57--
H-201213.900.670.621.370.580.081.700.140.45--
NH-201211.740.500.330.760.470.020.710.130.71--
Risø (DK), B [77]201115.062.002.901.530.340.100.290.030.04--
H-201117.442.323.351.780.450.140.350.040.05--
NH-201112.351.632.391.210.200.050.220.020.04--
Waldhof (DE), A [77]201211.451.982.701.380.170.100.170.020.030.302.41
H-201214.132.224.591.950.290.130.220.020.030.412.59
NH-20128.791.740.900.840.060.060.120.010.040.202.24
Neuglobsow (DE), B [77]201210.311.952.061.240.130.090.170.020.030.322.52
H-201213.142.113.591.710.210.120.220.020.030.453.02
NH-20127.471.790.530.760.060.050.120.010.040.202.05
Schauinsland (DE), BD [77]20126.400.910.860.600.020.040.050.010.030.141.47
H-20126.580.721.190.620.020.040.04<0.010.020.161.28
NH-20126.221.090.540.590.020.040.050.010.030.121.66
Melpitz (DE), B [30]winter: 2004–2008 (a)16.002.303.801.900.240.140.160.030.071.501.50
summer: 2004–2008 (a)12.502.001.001.200.050.080.110.020.081.101.20
winter: 2004–2008 (b)29.805.804.703.600.180.250.120.020.103.603.90
summer: 2004–2008 (b)22.003.501.602.200.060.180.060.020.102.402.80
Cabauw-Zijdeweg (NL), A [77]201115.252.273.931.690.200.100.250.040.060.562.30
H-201118.562.594.912.070.310.140.260.040.060.722.83
NH-201111.971.922.881.280.080.070.250.040.060.391.75
Paris [FR], A [55]Sep 2009–Sep 201012.601.902.201.200.160.120.140.020.050502.90
Puy-de-Dôme (FR), BD [40]Feb-Mar 2009 (c)10.001.281.711.080.07----0.20 (d)1.24 (e)
Jun 2010 (c)27.005.452.333.690.06----0.47 (d)15.59 (e)
Chaumont (CH), AD [51]Apr 1998–Mar 19997.702.300.600.800.050.050.070.010.070.401.14
K-Puszta (HU), A [90]Summer 1999 (f)23.322.660.100.17-0.24---5.09
Iskrba (SI), B [76]201011.610.880.080.820.040.120.040.020.070.383.38
H-201013.220.910.120.850.050.170.050.020.060.533.77
NH-201010.070.850.040.790.030.080.040.020.080.232.99
Finokalia (GR), BE [91]Jul 2004–Jul 2006 (g)12.004.400.101.450.080.120.050.010.070.271.42
Penteli (GR), BE [68]Mar–Aug 200823.804.621.111.251.53-0.520.192.030.484.10
Ayia Marina (CY), BE [77]201116.223.250.140.890.060.110.120.020.250.221.68
H-201113.112.350.120.690.060.090.070.010.190.221.36
NH-201119.144.210.171.100.070.140.180.020.300.232.02
Ispra (IT), B [77]201017.920.750.831.390.550.330.110.020.061.275.88
H-201026.560.711.411.960.320.590.100.020.011.919.03
NH-20109.020.780.170.840.790.070.110.030.100.652.71
Monte Martano (IT), A [92]200910.901.900.840.540.070.060.020.060.250.182.30
Valverde del Camino (ES), A [93]Sep 2008–Aug 200921.562.500.700.73-----0.374.67
Seville (ES), AD [93]Sep 2008–Aug 200919.982.870.680.70-----0.364.14
Montseny (ES), B [76]200711.960.880.250.750.080.100.030.030.090.171.74
H-200710.820.760.520.680.130.090.090.020.070.181.64
NH-200713.411.180.060.830.030.100.190.050.130.171.82
Country abbreviations (code ISO 3166): PL—Poland, CZ—Czech Republic; LV—Latvia; FI—Finland; UK—United Kingdom; DK—Denmark; DE—Germany; NL—Netherlands; FR—France; CH—Switzerland; HU—Hungary; SI—Slovenia; GR—Greece; CY—Cyprus; IT—Italy; ES—Spain. Designations of stations: A—rural background station; B—regional background station; C—suburban background station; D—high-altitude station (above 1000 m a.s.l.); E—rural station located in coastal area. H—heating season (months: Jan–Mar and Oct–Dec); NH—non-heating season (months: Apr–Sep). (a) inflow of air masses from the western sector; (b) inflow of air masses from the eastern sector; (c) data for PM1.0 fraction; (d) expressed as BC concentration; (e) expressed as the concentration of organic matter; (f) data for PM2.6 fraction; (g) data for PM1.3 fraction. The values read from the chart were written in italics.
Table 2. Concentrations of PM2.5 and its main chemical constituents [µg·m−3] recorded at selected urban and urban background stations in Europe.
LocationPeriodConcentration [µg·m−3]
PM2.5SO42−NO3NH4+ClK+Na+Mg2+Ca2+ECOC
Szczecin (PL), A [32,47]Jan—Mar, May—Jul 201317.112.192.011.220.220.120.60.040.131.215.8
Jan—Mar 201324.362.733.131.880.340.210.630.050.161.678.48
May—Jul 20138.661.570.690.460.080.020.560.020.090.682.66
Trzebinia (PL), A [32,47]Feb—Mar, May—Jul 201325.213.961.681.710.470.160.510.040.132.218.6
Feb—Mar 201339.164.73.192.941.060.290.60.070.183.9715.39
May—Jul 201316.743.50.770.960.110.080.460.020.11.154.48
Katowice (PL), A [31]H-201063.045.384.063.272.630.270.920.060.2713.577.91
NH-201022.733.781.131.590.810.21.460.120.454.473.32
Zabrze (PL), A [45]Aug—Dec 200833.351.710.880.960.680.180.220.050.21--
Zabrze (PL), A [94]Jan—Mar 200966.855.513.122.011.530.40.450.140.4719.349.9
Jul—Nov 200918.443.230.510.530.040.140.24--4.124.21
Gdańsk (PL), A [31]H-201033.023.084.282.131.020.231.510.080.214.434.22
NH-201014.571.70.790.650.210.070.650.050.161.230.97
Prague (CZ), A [36]Nov 2002—Jan 200329.65.92 (a)2.222.1-----1.6911.42
Helsinki (FI), A [52]Nov 2009—Feb 2010-3.182.270.740.10.040.050.040.26--
Mar—May 2010-1.641.40.460.040.010.040.050.18--
Birmingham (UK), A [95]Nov 2008—Apr 2011-1.61.61-0.35----12.3
Duisburg (DE), A [36]Oct—Nov 200214.72.79 (a)1.911.1-----1.323.26
Menen (BE), B [96]winter 2003174.995.281.880.890.25-0.030.07--
summer 20033.234.171.920.250.13-0.020.06--
Rotterdam (NL), A [97]Sep 2007—Oct 200817.54.1-----2.13.3
Marseille (FR), A [56]Apr 2011—Jul 201219.62.2 (a)1.71.5-0.080.1--1.86.2
Saint-Omer (FR), C [54]Mar—Apr 201132.52.839.074.470.51----5.21
Dunkerque (FR), E [98]Nov—Dec 201024.92.525.711.910.58----6.2
Mar—Apr 201133.22.8511.062.310.54----4.73
Paris (FR), A [55]Sep 2009—Sep 201014.822.91.40.190.120.180.030.121.43
Basel (CH), B [51]Apr 1998—Mar 199918.94.13.120.150.220.110.010.071.63.21
Bern (CH), C [51]Apr 1998—Mar 199924.62.831.60.10.180.090.010.134.25.36
Zurich-Kaserne (CH), C [51]Apr 1998—Mar 1999203.53.52.10.070.180.080.010.071.83.36
Budapest (HU), C [53]Jun 2010—Mar 2013212.842.141.330.110.180.220.050.162.025.42
winter: Jun 2010—Mar 201328.72.543.91.80.20.30.30.040.1228.23
summer: Jun 2010—Mar 20131430.260.90.030.090.130.040.11.882.87
Athens (GR), A [29]2011—2012183.701.081.270.10.220.290.050.370.925.98
Thessaloniki (GR), A [29]2011—201225.94.51.893.20.140.120.090.020.180.695.89
Thessaloniki (GR), C [99]Apr 2011—May 201237.73.962.43.80.390.140.290.071.431.296.62
H: Apr 2011—May 201241.93.963.074.850.370.120.140.051.61.58.84
NH: Apr 2011—May 201232.93.961.612.580.40.160.470.091.251.054.06
Limassol (CY), C [100]Jan 2012—Jan 2013 (b)13.14.51.1------0.71.8
Lecce (IT), A [101]Mar 2013—Jun 201314.42.760.340.710.170.180.340.030.20.522.97
Bologna (IT), A [7]2011-201327.62.45.1------1.65.1
Conegliano (IT), D [102]Apr 2012—Mar 2013201.72.41.10.120.290.31-0.15--
Vicenza (IT), D [102]Apr 2012—Mar 2013282.452.30.190.310.15-0.15--
Padua (IT), D [102]Apr 2012—Mar 2013292.44.620.190.390.47-0.16--
Rovigo (IT), D [102]Apr 2012—Mar 2013272.65.22.30.240.30.23-0.15--
Genoa (IT), A [56]Mar—Sep 2011143.6 (a)0.51.4-0.060.1--1.42.7
Venice (IT), A [56]Jan—Dec 2011303.4 (a)5.42.3-0.40.2--5.8
Barcelona (ES), A [56]Feb—Dec 201118.62.8 (a)11--0.3--1.23
Madrid (ES), A [103]Jan—Feb 201113.80.611.160.480.150.050.170.010.11.531.2
Jun 200916.61.020.690.270.160.050.20.030.210.942.71
Huelva (ES), A [104]Apr 2008—Dec 200919.32.810.80.2-0.5--0.6 (c)3.22
Pamplona (ES), C [105]2009152.071.631.240.08----4.04
Elche (ES), A [44]Oct 2008—Oct 200913.62.761.220.850.190.240.430.040.42--
Valencia (ES), C [35]2004, 2005243.82.71.80.8----7.2
L`Eliana (ES), B [35]2004, 2005222.61.61.20.4----5
Istanbul (TR), C [106]Jun 2010—May 2011404.271.721.240.34----12.66
Country abbreviations (code ISO 3166): PL—Poland, CZ—Czech Republic; FI—Finland; UK—United Kingdom; DE—Germany; BE—Belgium; NL—Netherlands; FR—France; CH—Switzerland; HU—Hungary; GR—Greece; CY—Cyprus; IT—Italy; ES—Spain; TR—Turkey. Designations of stations: A—urban background station; B—suburban background station; C—mixed urban stations (with influences from different emission sources); D—urban station located within residential zone; E—urban station with influences from industrial sources. H—heating season (months: Jan-Mar and Oct-Dec); NH—non-heating season (months: Apr-Sep). (a) expressed as concentration of non-sea salt sulphates, nss-SO42−; (b) non-dust days; (c) EC as BC. The values estimated based on the percentage contribution of particular compound in the PM2.5 mass were written in italics.

