Article

Black Heart Detection in White Radish by Hyperspectral Transmittance Imaging Combined with Chemometric Analysis and a Successive Projections Algorithm

1
College of Food Science and Technology, Nanjing Agricultural University, NO.1 Weigang Road, Nanjing 210095, China
2
College of Science, Nanjing Agricultural University, No. 1 Weigang Road, Nanjing 210095, China
3
College of Life Science, Tarim University, Alar 843300, China
4
Key Laboratory of Advanced Process Control for Light Industry (Ministry of Education), Jiangnan University, Wuxi 214122, China
*
Author to whom correspondence should be addressed.
Appl. Sci. 2016, 6(9), 249; https://doi.org/10.3390/app6090249
Submission received: 22 June 2016 / Revised: 28 July 2016 / Accepted: 1 September 2016 / Published: 6 September 2016
(This article belongs to the Special Issue Applications of Hyperspectral Imaging for Food and Agriculture)

Abstract

:
Radishes with black hearts will lose edible value and cause food safety problems, so it is important to detect and remove the defective ones before processing and consumption. A hyperspectral transmittance imaging system with 420 wavelengths was developed to capture images from white radishes. A successive-projections algorithm (SPA) was applied with 10 wavelengths selected to distinguish defective radishes with black hearts from normal samples. Pearson linear correlation coefficients were calculated to further refine the set of wavelengths with 4 wavelengths determined. Four chemometric classifiers were developed for classification of normal and defective radishes, using 420, 10 and 4 wavelengths as input variables. The overall classifying accuracy based on the four classifiers were 95.6%–100%. The highest classification with 100% was obtained with a back propagation artificial neural network (BPANN) for both calibration and prediction using 420 and 10 wavelengths. Overall accuracies of 98.4% and 97.8% were obtained for calibration and prediction, respectively, with Fisher's linear discriminant analysis (FLDA) based on 4 wavelengths, and was better than the other three classifiers. This indicated that the developed hyperspectral transmittance imaging was suitable for black heart detection in white radishes with the optimal wavelengths, which has potential for fast on-line discrimination before food processing or reaching storage shelves.

Graphical Abstract

1. Introduction

White radish, as the second most common vegetable in China and a rich source of glucose, carotenoids, starch, and other nutrients, has been cultivated for thousands of years. It is mainly consumed in fresh and processed products and may be pickled or dried [1]. Black heart is an internal defect seen in postharvest radishes which is due to lack of boron, waterlogging, anoxia in soil, and black rot during growth [2]. Generally, with this condition there are no obvious symptoms in the external appearance, but it is characterized by black dry rot in the medulla and the formation of voids. Although the white matter can be consumed when the diseased part is removed, the yield and quality declines greatly, and radish production has suffered serious losses as a result. Because the defects are internal, human visual inspection has limitations in evaluating the defects, which is time-consuming, subjective, and costly. Hence, an effective nondestructive inspection technology is valuable and necessary for efficient removal of defective radishes before they enter the market.
Many nondestructive sensing techniques, like spectroscopy, acoustics, and X-ray imaging, have been reported for internal quality inspection of fruits and vegetables [3,4,5,6]. Among these methods, substantial work has focused on using near-infrared spectroscopy (NIRS) to inspect internal defects, like brown core in Chinese pears [7], brown heart in Braeburn apples [8,9] and in Conference pears [10], translucent flesh disorder in mangosteen [11], black air-cavity defects in Japanese radishes [12], and mealiness in apples [13]. Although NIRS is a fast, nondestructive, and effective method for measuring multiple quality attributes simultaneously [14], its measurement only gives an approximate quantification of the total light on a limited area and does not provide spatially resolved information. Hence, NIRS may not comprehensively evaluate internal defects in fruits and vegetables that may occur locally along the cavity [15].
Recently, hyperspectral imaging has entered wide use for evaluating the quality and safety of food and agricultural products [16,17,18]. Characterized as a rapid, nondestructive, and chemical-free method, hyperspectral imaging can simultaneously offer spatial information and spectral signals from one object, with the combination of conventional imaging and spectroscopy. The information obtained forms a three-dimensional data cube and can be processed to detect, identify, and quantify imaged objects in more detail than either traditional imaging or spectroscopic techniques [19]. Recently, considerable applications of hyperspectral imaging have been reported for the evaluation of internal quality in fruits and vegetables. For example, Cen et al. [20] reported internal defect detection of cucumbers during pickling using hyperspectral imaging for real-time grading. Their previous studies also demonstrated the feasibility of detecting both external characteristics and internal defects of pickling cucumbers [15,21]. Pan et al. [22] conducted a study to detect cold injury in peaches. Based on the selected wavelengths and using an artificial neural network, 95.8% discrimination accuracy of chilled peaches was obtained. Huang and Lu [23] carried out apple mealiness detection using hyperspectral scattering imaging. Furthermore, quality attributes like soluble solids content, pH, and firmness can be successfully predicted by hyperspectral imaging [6,24,25,26]. The technique, however, has so far been largely limited to laboratory or benchtop applications because of the cost, huge volume of data, and computing requirements. One way to solve these problems is to identify a few key discriminating wavelengths for real-time implementation and industrial applications, when the selected wavelengths contain approximately the same information as and/or are more efficient than full spectra [27,28].
Therefore, the specific objectives of this study were to: (1) acquire hyperspectral transmittance images of normal and defective radishes over the spectral range of 400–1000 nm; (2) identify the optimal wavelengths for black heart detection using the successive projections algorithm (SPA) and correlation analysis; and (3) develop classification models based on selected wavelengths and compare the classification performance among different classifiers.

2. Materials and Methods

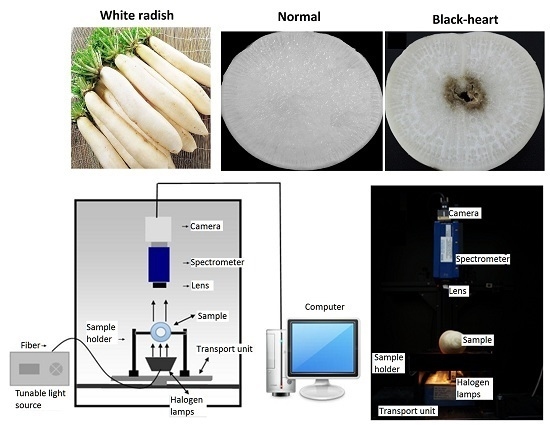
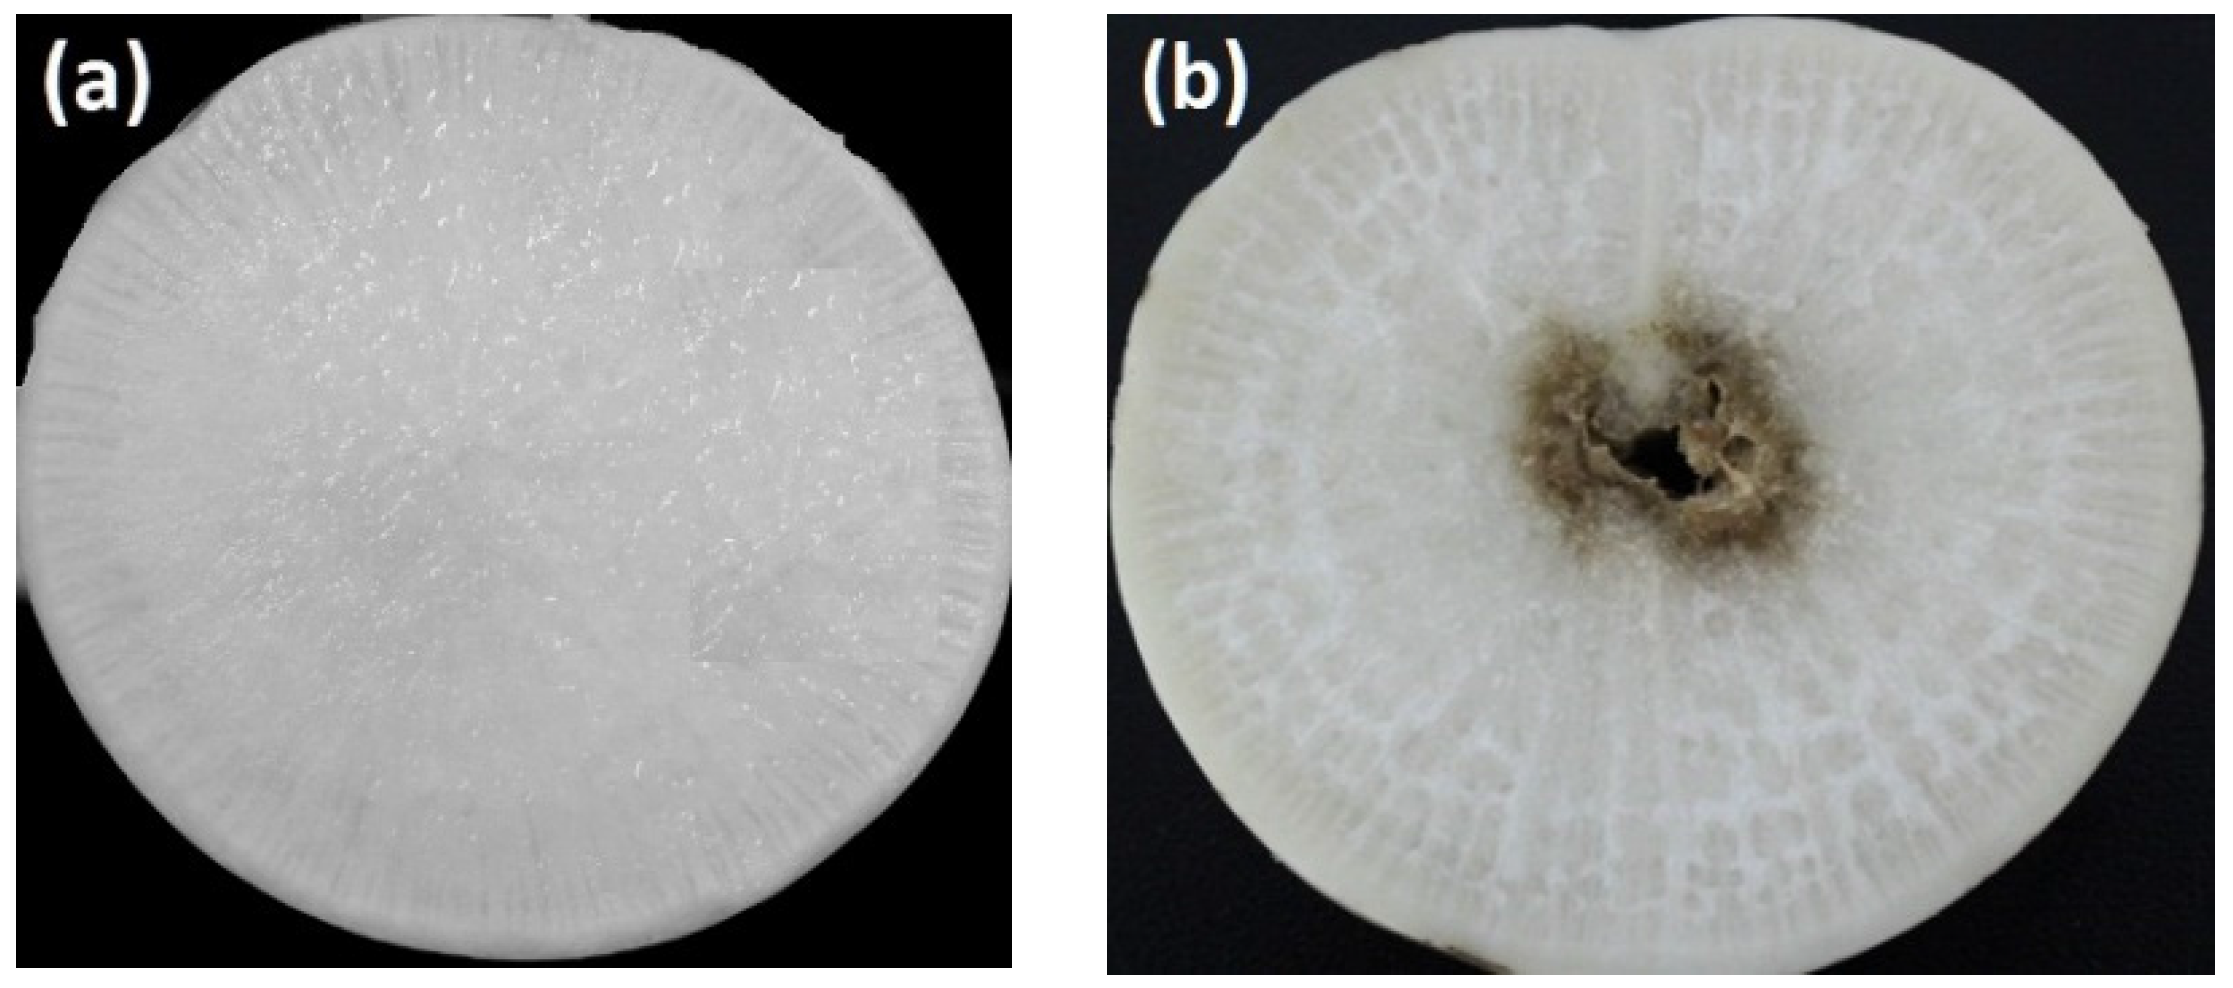
2.1. White Radish Samples

A number of 502 “Chunguang Type A” white radishes were purchased from a local farm in Jiangsu Province of China. The samples had similar size and shape, and were free of external defects based on visual inspection. The thickness of radish samples was 96 ± 2.94 mm. Because it is difficult to get natural defective samples, black heart was induced by inoculating with Xanthomonas campestris in the middle of the radishes along the longitudinal axis. Xanthomonas campestris, a bacterial pathogen, can harm the leaf and root and cause black heart in the fleshy root of the radish [29]. Before inoculation, the Xanthomonas was grown on LB (Luria-Bertani) solid medium at 35 °C and 75% relative humidity for 7 d. Bacterium suspension (3 mL) with a concentration of 4 × 10⁴ cells/mL was inoculated into the radishes. To allow black heart to develop, the inoculated samples were stored at 35 °C and 75% relative humidity for 7 d in incubators. Typical normal and defective (with black heart) radishes slices are shown in Figure 1. Prior to the hyperspectral imaging experiments, 247 normal radishes and 255 defective radishes with black heart were obtained for the experiment.

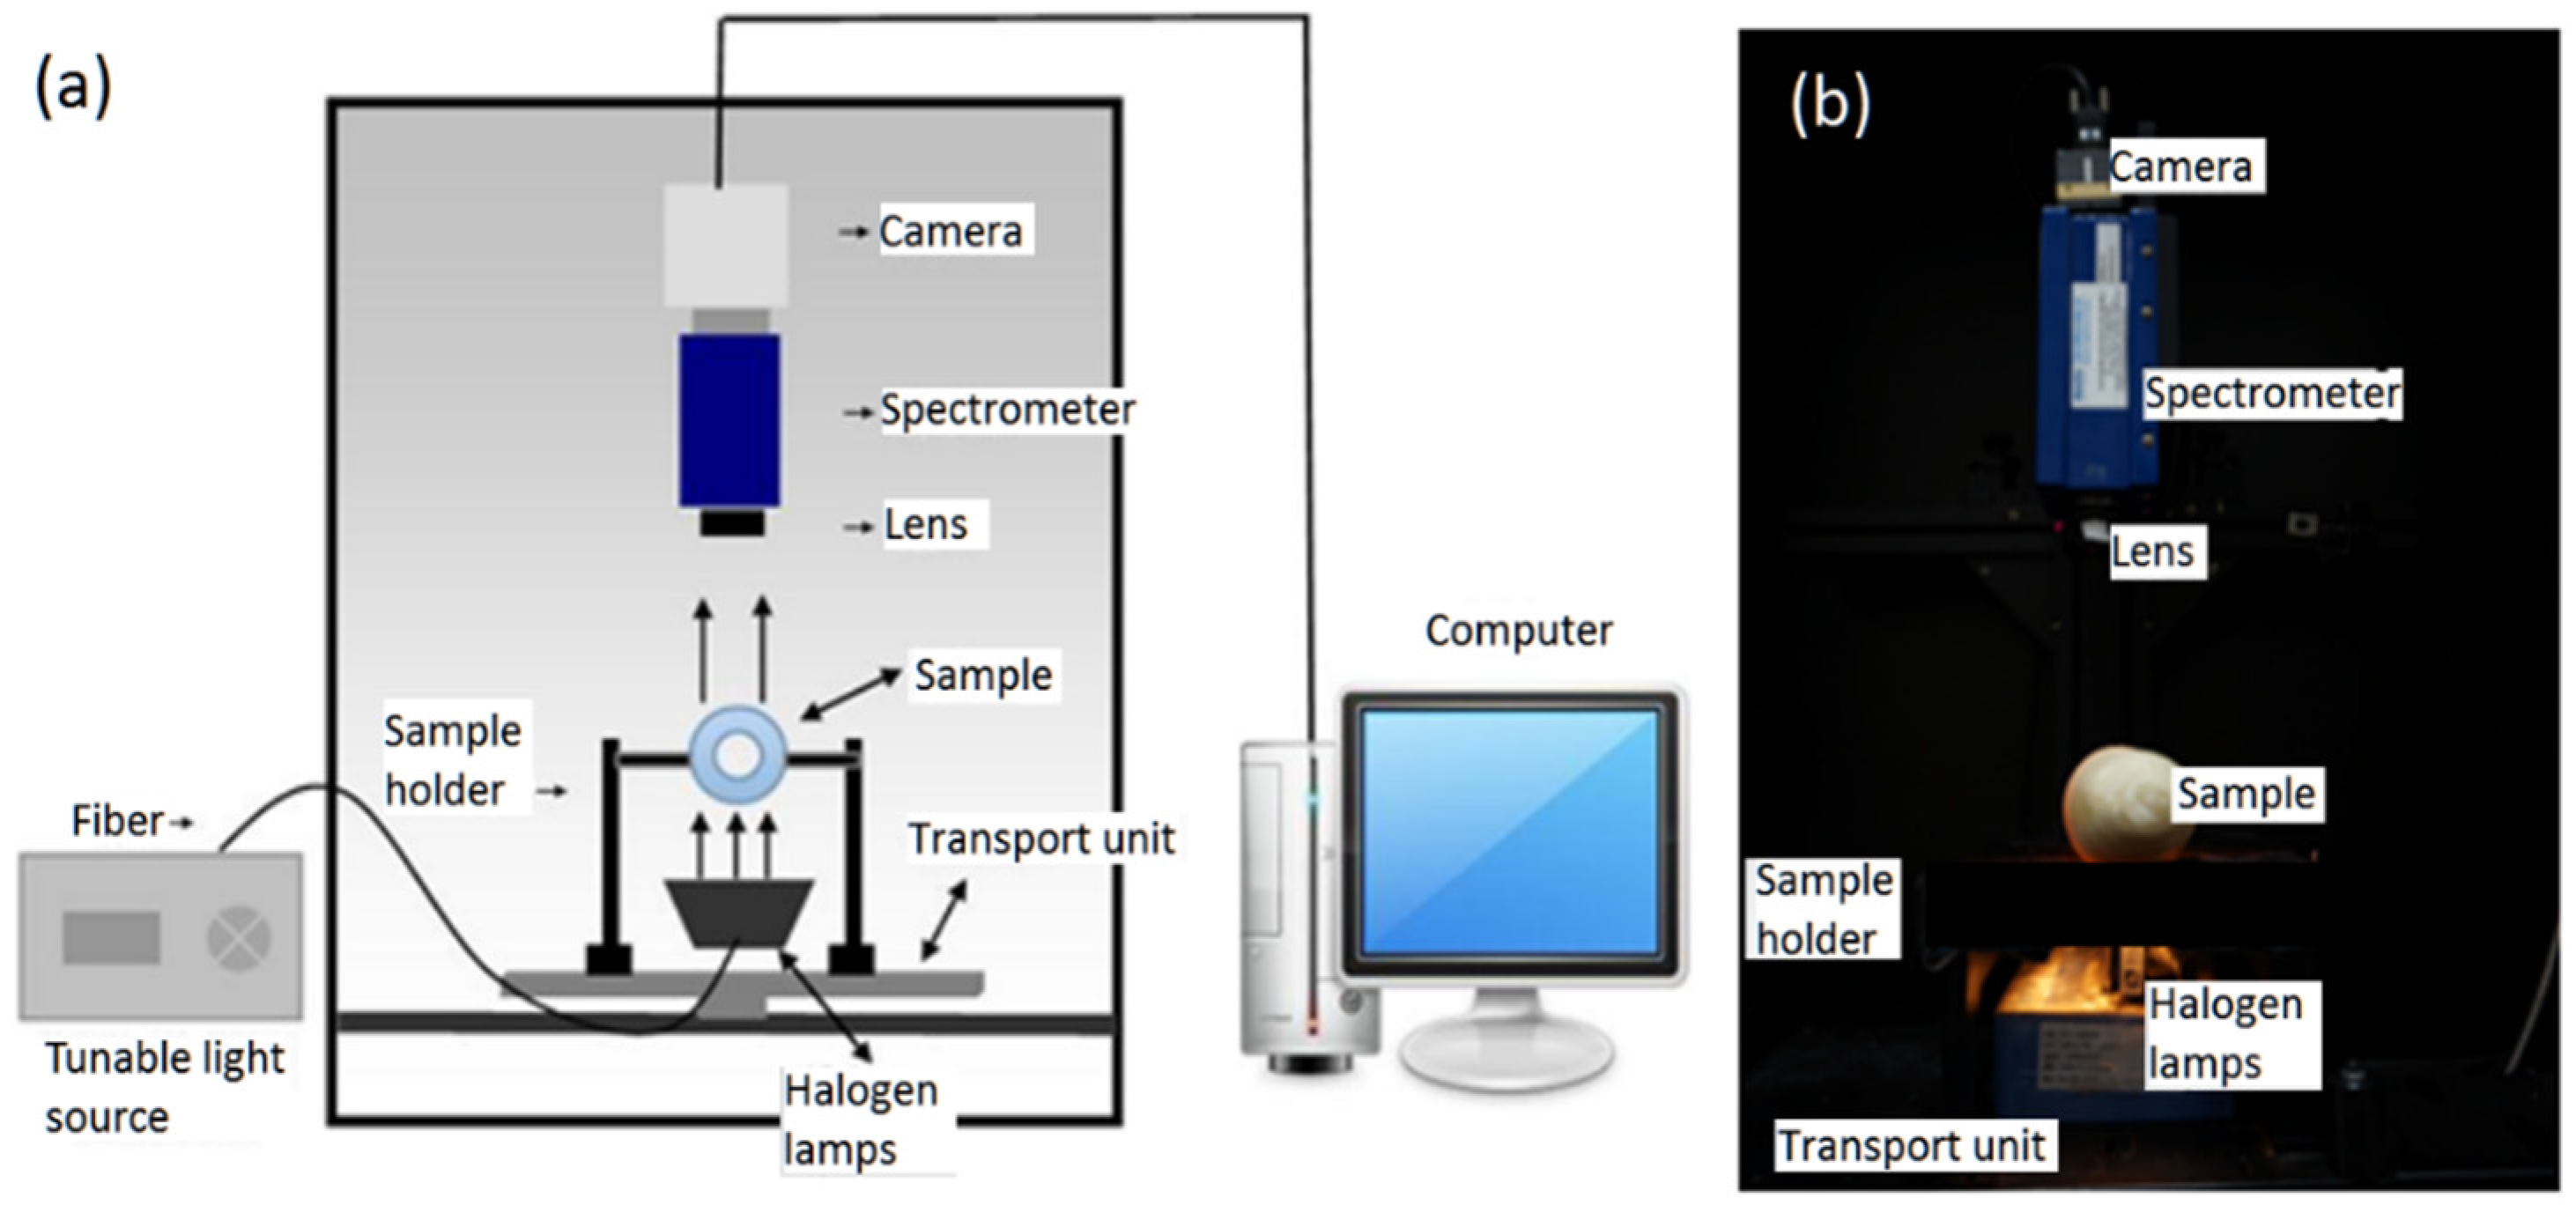
2.2. Hyperspectral Imaging System

Figure 2 shows the hyperspectral transmittance imaging system used in our study, with a schematic diagram in Figure 2a and a physical map in Figure 2b. The system consisted of hardware and software components. The hardware component was composed of: a charge-coupled device (CCD) camera (ICL-B1620, Imperx, Boca Raton, FL, USA), a spectrometer (ImSpectorV10E, Spectral imaging, Oulu, Finland) with spectral resolution of 2.8 nm, a variable-focal-length lens, two halogen lamps connected using optical fiber with a direct-current, tunable light source (150 W halogen tungsten lamp controller, 3900ER, Illumination Technologies Inc., East Syracuse, NY, USA), transport unit with a sample holder station, an electronically-controlled, motorized horizontal stage (IRCP0076-ICOMB001, Isuzu, Zhubei, Taiwan), and a computer (Intel E5800 3.2 GHz CPU, 2GB RAM, 256 MB GeForce GT240 GPU, Dell, Round Rock, TX, USA). In order to acquire the transmittance images, the two 90 W halogen lamps were fixed directly below the sample (Figure 2b). The speed of the transport unit and exposure time was set at 2.5 mm/s and 70 ms, respectively. Software developed by Isuzu Optics Corp. (Zhubei, Taiwan) was used for image acquisition and parameter setting. The imaging spectrograph worked in line scanning mode and covered the spectral range of 400–1000 nm.

2.3. Image Calibration and Roi Identification

In order to reduce the influence of illumination and dark current of the CCD detectors as well as the differences in camera and physical configuration in the imaging system, raw acquired images (R0) were calibrated by two reference images, dark (Rd) and white (Rw). The dark image (with 0% reflectance) was collected by recording a spectral image after turning off the light source and fully covering the camera lens with its black cap. The white image was acquired from a standard Teflon white reference board (with 99% reflectance). Therefore, the calibrated image (R) was calculated according to the following formula:
R = R 0 R d R w R d
After image acquisition and calibration, regions of interest (ROIs) in radish samples were identified. In order to extract spectra of each radish, the sub-image at 688 nm, which represents the best contrast between sample and background, was selected from the spectral space, and segregated using global thresholding as a mask to produce an image containing only the radish, avoiding any interference from the background. All images were processed and analyzed individually. The pixels in the mask were used as the region of interest (ROI) to extract spectral data from the calibrated hyperspectral image, and the mean reflectance spectrum of the hyperspectral image was calculated as an average of the spectral values of all pixels in the ROIs. All of the calibrated images were processed and analyzed by accessory image acquisition software and Environment for Visualizing Images software program (ENVI 4.7, Exelis Visual Information Solutions Inc., Redlands, CA, USA, 2010).

2.4. Wavelength Selection

In order to reduce co-linearity and redundancy in hyperspectral data, to simplify the complexity of computation, to improve the efficiency of rottenness detection, and to meet the inspection speed required by industry, wavelength selection is a critical and important step. The successive projections algorithm (SPA), a novel variable selection algorithm, is designed to solve the co-linearity problem by selecting variables with minimal redundancy [30]. In brief, there are three steps in SPA. First, the algorithm builds candidate subsets of variables with minimum co-linearity as the result of projection operations applied to the columns of the spectral matrix available for the training data. Second, from the results of the multi-linear regression (MLR) model assessed by cross-validation or by applying a separate validation set, the algorithm evaluates candidate subsets of variables on the basis of the value of the root mean square error (RMSE). Finally, a variable elimination procedure is carried out to remove uninformative variables without significant loss of predictive power [31,32]. SPA has been successfully applied in hyperspectral image analysis for multivariate calibration in food safety and quality evaluation [33,34]. SPA was performed using Matlab software (Version 7.9, The Mathworks Inc., Natick, MA, USA, 2009) in this work. Then a series of wavelengths was formed according to the importance for discriminating black-hearted radishes. After wavelengths selection by SPA, Pearson’s linear correlation was applied to further simplify the wavelengths. If the Pearson correlation coefficients were greater than 0.99, one of the wavelengths was selected and used for the next step. Usually, the group of adjacent wavelengths had high coefficients. In such a case, the wavelength of the most importance was selected. Pearson’s linear correlation analysis was executed in IBM (International Business Machine) SPSS (Statistical Product and Service Solutions) Statistics (Version 20; IBM Corporation, Armonk, NY, USA, 2011).

2.5. Spectra Processing and Chemometric Model Development

Relative spectra were calculated from the ROIs, and spectra pretreatment was required to reduce the random noises, baseline offset, non-uniformity in samples, and surface scattering, thus enhancing the accessibility of information related to the existence of black heart in a white radish. These pretreatment methods included Savitzky–Golay first derivative (SG1), Savitzky–Golay smoothing (SGS), detrend (D), standard normal variate (SNV), multiplicative scatter correction (MSC), autoscale (A), and mean center (M), as well as their combinations, and all were compared. The optimum method was determined based on the overall classification accuracy by a partial least square discrimination analysis model.
After comparisons among the preprocessing procedures, partial least squares discrimination analysis (PLSDA), back propagation artificial neural network (BPANN), and support vector machine (SVM) methods were used to build calibration models for black heart identification. PLSDA is a multivariate inverse least squares discrimination method used for classification and discrimination problems (i.e., supervised classification). This produces essentially the same results as linear discrimination analysis (LDA), but with the noise reduction and variable selection advantages of partial least squares (PLS) [35]. BPANN is one of the most widely applied neural network models, as a type of feed-forward, supervised learning network which can adapt its knowledge by adjusting weights, based on the classification error of one or more outputs [36]. SVM was developed as a powerful algorithm with state-of-the-art performance in a variety of classification tasks. The algorithm is well-suited to deal with high dimensional data with low sensitivity to the curse of dimensionality. An SVM can search for a hyperplane between itself and the closest samples from each of two classes with maximal distance [37]. After optimum wavelengths are selected by SPA, new models of SPA-PLDA, SPA-ANN, and SPA-SVM were evaluated and compared for classification performance of black heart. Furthermore, the commonly used calibration method of Fisher's linear discriminant analysis (FLDA), which is simple and easy in many practical applications (e.g., in-field evaluation), was also incorporated in the model SPA-FLDA.
All calibration models were used to identify black heart in white radish for two classes (i.e., normal and black heart). Using the Kennard–Stone (KS) algorithm [38], all samples were divided into two groups, with two-thirds for the calibration set and one-third for the prediction set. As a result, for the two-class classification, 160 normal and 162 black heart samples were assigned to the calibration set and 87 normal and 93 black heart samples were assigned to the prediction set. Normal samples were labeled as 1, while black heart samples were labeled as 2. Calibration models were developed for the black heart classification, using MATLAB (Version 7.9, The MathWorks Inc., Natick, MA, USA, 2009) with the PLS toolbox (Version 7.9, Eigenvector Research Inc., Wenatchee, WA, USA, 2014). For each class, accuracy was defined as the percentage of predicted normal samples by models to the total normal samples, and predicted black heart samples by models to all black heart samples; the overall accuracy was the percentage of predicted normal plus black heart samples to the total samples.

3. Results and Discussion

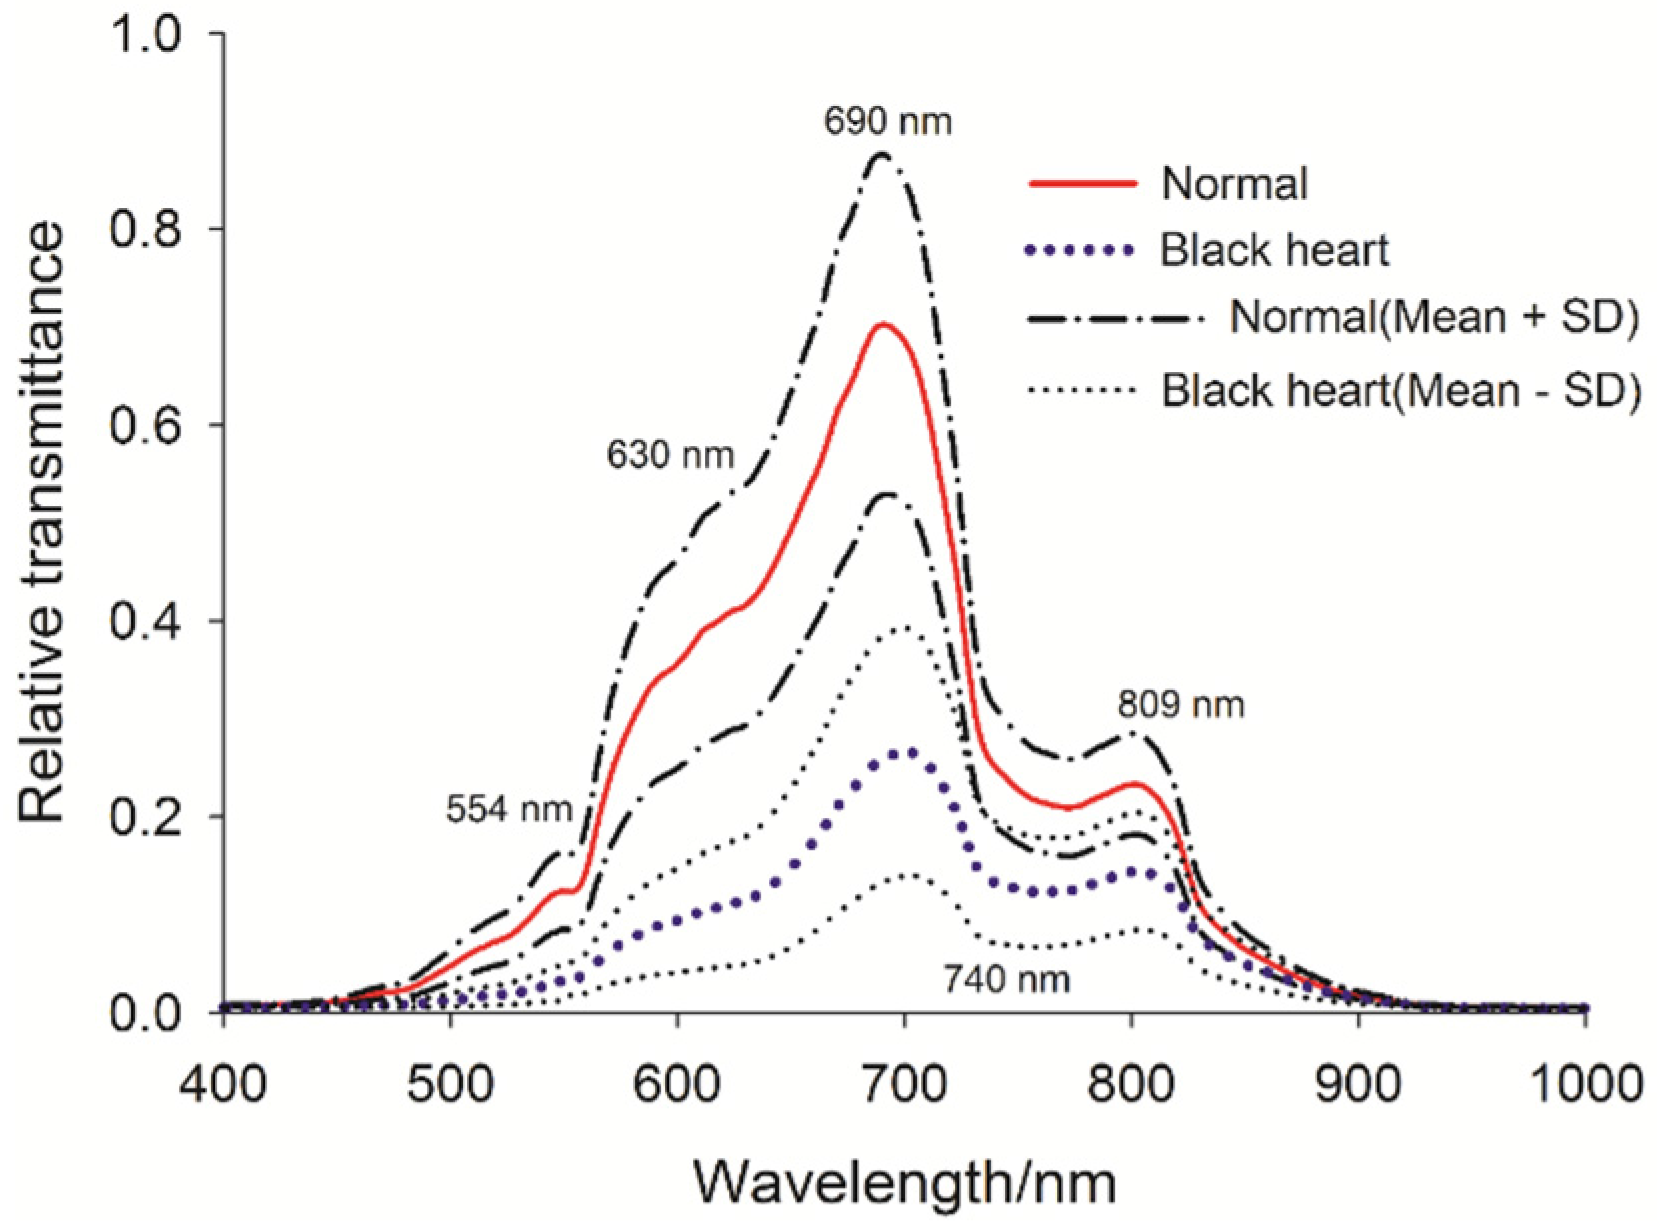
3.1. Mean Spectra for Normal and Defective White Radishes

Figure 3 shows the mean relative transmittance spectra and standard deviations (SD) extracted from the ROIs of normal and black-heart white radishes covering the spectral range of 400–1000 nm. The relative transmittance for samples of both classes increased over the spectral range of 400–690 nm, except for two small valleys at 554 nm and 630 nm. The transmittance decreased sharply from the peak at 690 nm to another lower valley at 740 nm, then increased slightly to a peak at 809 nm, then fell rapidly between 809 nm and 1000 nm. Comparing the relative transmittance spectra between normal and black heart radishes, apparent differences exist in the mean relative transmittance spectra from 500 nm to 900 nm; for instance, a difference of 0.44 in the peak at 690 nm. There was strong absorption in the wavebands of 400–500 nm and 900–1000 nm for all samples. Therefore, the difference between normal and black heart samples provided substantial spectral information for black heart detection and classification.

3.2. Spectra Preprocessing Method Selection

Generally, calibration models will perform better if the noise level can be minimized either through hardware improvements or data preprocessing [39]. Table 1 shows the discrimination performance between normal and black-heart samples after different spectral preprocessing methods. All single preprocessing methods, except SGS (Savitzky-Golay smoothing), demonstrated better discriminating accuracy for calibration of 98.1%–99.1% and prediction of 96.1%–98.3% than the raw spectra. SGS had the worst performance among all preprocessing methods and was even worse than not preprocessing. This could be because SGS discarded important information for black heart detection in white radishes. Standard normal variate (SNV) had the best accuracy with 99.1% and 98.9% for calibration and prediction, respectively, followed by mean center. SNV is commonly used to eliminate variations in spectral intensity due to light scattering. Mean center helps to enhance the differences between spectra. Their combination was also evaluated for preprocessing the raw spectra. Among all spectral preprocessing combination methods, the highest accuracies of 100% and 99.4% were achieved with calibration and prediction, respectively, using SNV and mean center. Therefore, the combination of the two methods was chosen to preprocess the spectra.

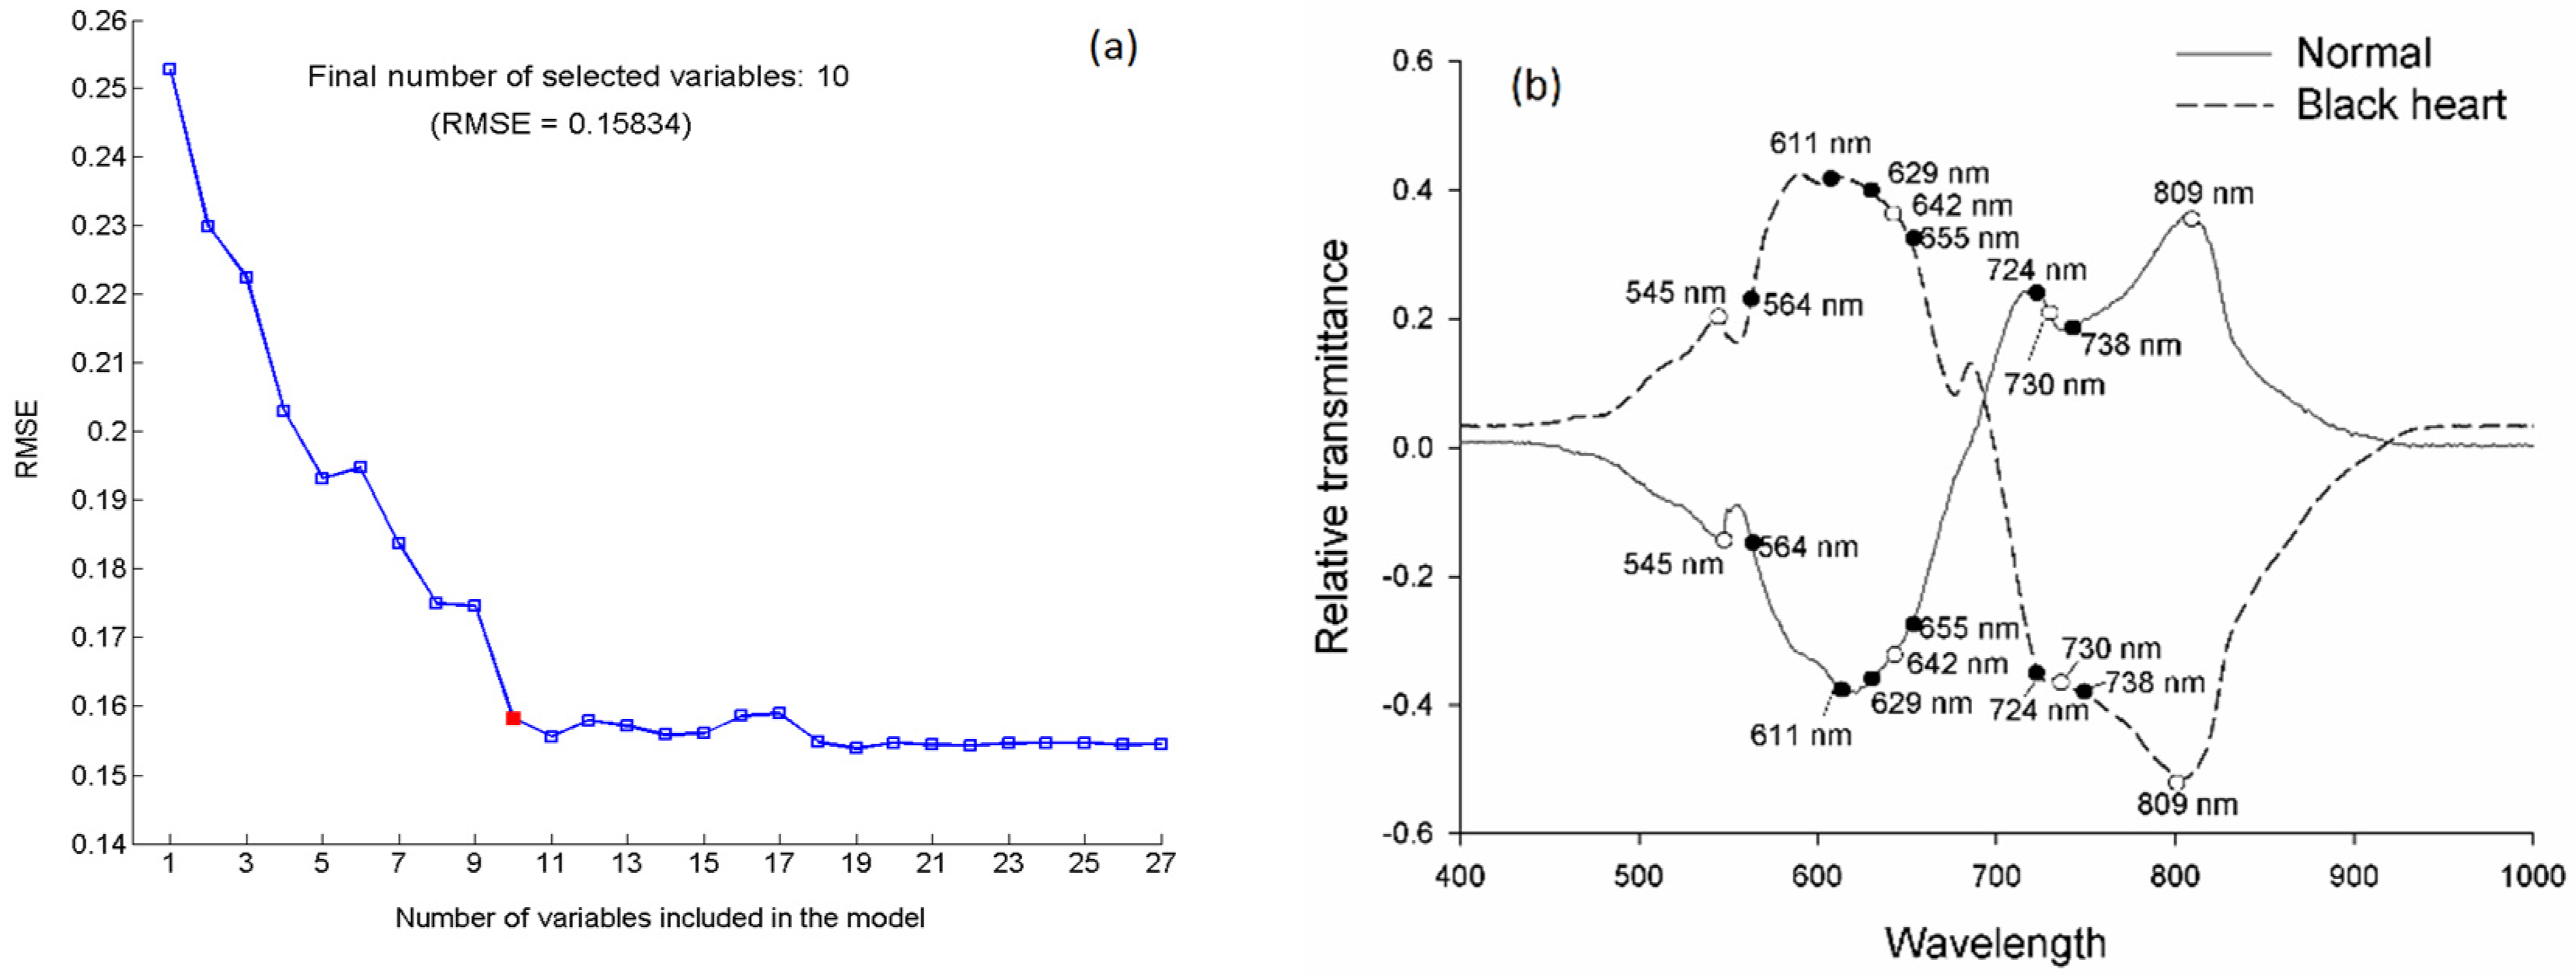
3.3. Optimum Wavelength Selection

SPA was first used for the selection of the optimal wavelengths for the discrimination of black- heart white radishes, followed by preprocessing with SNV and mean center. During the SPA selection procedure, the SPA-MLR procedure was used to acquire the RMSE values based on the selected variable subsets. In the toolbox, the maximum number of variables selected by SPA was set as 27, because the number of variables reached 27, the RMSE value was lowest. As shown in Figure 4a, the RMSE values gradually decreased as the number of selected wavelengths increased from 1 to 11. When the number exceeded 10, RMSE did not perceptibly change. Using 10 selected wavelengths for the MLR model (solid square markers), the root mean square error (RMSE) reached its optimal values (0.15834) for the two-class discrimination. The selected ten optimal wavelengths designated by open or solid circle markers and their distribution in the typical preprocessed spectral curves are shown in Figure 4b. Figure 4b shows the spectral curves of single normal and black-heart radishes respectively after preprocessing using SNV+ mean center. In order of importance in the projection procedure, the wavelengths were 642, 629, 655, 730, 611, 809, 724, 738, 545 and 564 nm.
In order to further reduce the number of input wavelengths, Pearson’s linear correlation coefficients and probability levels were analyzed in Table 2. There were very high and positive correlations among the 10 wavelengths with coefficients in the range of 0.843–1.000. Furthermore, the correlations among the groups of 545 nm and 564 nm; 611 nm, 629 nm, 642 nm, and 655 nm; 724 nm, 730 nm, and 738 nm were extremely high with coefficients exceeding 0.990. This cross-correlation indicates that one of the wavelengths in each group can provide the same information as the other wavelengths in the group. Therefore, in line with the importance in the projection procedure in SPA, 642 nm, 730 nm, 809 nm, and 545 nm were selected (designated by open circle markers in Figure 4b) to build the classification model, in which their correlation coefficients were in the range of 0.843–0.987. Models developed using those four wavelengths will be compared with other models based on the ten wavelength inputs and the full wavelengths inputs.

3.4. Classification Results between Normal and Defective White Radishes

Table 3 summarizes the classification results between normal and defective classes using different wavelengths based on PLS-DA, SVM, ANN, and FLDA models. All the models presented satisfactory prediction performance with overall accuracies of 95.6%–100% for discriminating black-heart white radishes. When using the full spectrum of 420 wavelengths, three models including PLS-DA, SVM, and ANN had high overall accuracies with 100% for calibration and 98.9%–100% for prediction. There was one normal radish misclassified as defective for prediction by PLS-DA, and two defective radishes misclassified as normal for prediction by SVM. Furthermore, ANN had the best results with an overall accuracy of 100% for both calibration and prediction.
To verify detection performance based on the selected wavelength for further on-line or real-time inspection systems, spectral responses including ten and four wavelengths were separately evaluated for classification between normal and defective radishes, based on the PLS-DA, SVM, ANN, and FLDA models. With ten wavelengths as inputs, the models achieved overall accuracies of 99.7%–100% and 98.9%–100% for calibration and prediction, respectively. ANN gave the highest overall accuracy of 100% for both calibration and prediction. SVM had a relatively low overall accuracy due to misclassification by recognizing one defective radish as normal and one normal radish as defective. PLS-DA and FLDA had the same overall accuracy with 99.7% and 99.4% for calibration and prediction, respectively, although they had slight discriminating differences between normal and defective classes. While using four wavelengths, the overall classification accuracy decreased slightly to 97.2%–98.8% for calibration and 95.6%–97.8% for prediction. Among the four models, FLDA had the best results with overall accuracy of 98.4% for calibration and 97.8% for prediction.
Compared with full spectrum-based models, models based on select highly discriminant wavelengths (i.e., the best 10 and reduced 4 wavelengths) achieved slightly lower overall accuracy for discriminating between normal and defective white radishes. However, models based on fewer wavelengths were more suitable for on-line or real-time applications, and the loss was only slight; for example, using four wavelengths (reduction of 99.5% of the input variables) only resulted in a 2.8% decrease of overall accuracy for prediction based on ANN. With respect to different models, ANN, as a nonlinear model obtained the best discriminating performance not only using full wavelengths but also using selected wavelengths (i.e., 10 and 4) for both calibration and prediction. However, it had less overall accuracy than FLDA for prediction. For the on-line or real-time field, FLDA could have the most potential for discrimination of normal and black-heart white radishes using just four wavelengths.

4. Conclusions

This study demonstrated the capability of hyperspectral transmittance imaging for detecting black heart in white radishes. The combination of SNV and mean center was determined as the best spectral preprocessing method. Optimal wavelengths were selected by a successive projection algorithm (SPA) and Pearson linear correlation coefficients (PLCC). Ten wavelengths selected by SPA and four wavelengths further selected by PLCC, as well as the full spectrum (420 wavebands), were used to build classification models. The prediction performance in the four models of PLS-DA, SVM, ANN, and FLDA were compared, and all had good results with overall discriminating accuracy of 95.6%–100%. With the full-spectrum and best 10 wavelengths as inputs, ANN presented the highest overall accuracy of 100%. On the basis of the reduced four wavelengths, FLDA obtained better results than the other models for both calibration and prediction. Overall, these results demonstrated that hyperspectral transmittance imaging was suitable for detecting black heart in white radishes when combined with the PLS-DA, SVM, ANN, and FLDA models. A simple FLDA model using four wavelengths shows promise for fast, real-time monitoring of internal defects, namely black heart in white radishes.

Acknowledgments

The research was financially supported by National Key Technology R & D Program of China (2015BAD19B03). The authors acknowledge the support received.

Author Contributions

L.P. and L.S. conceived and designed the experiments; D.S. and P.H. performed the experiments; D.S., Y.S. and H.Y. analyzed the data; K.T. and M.H. contributed materials and analysis tools; D.S. and L.P. wrote the paper.

Conflicts of Interest

The authors declare no conflict of interest.

References

  1. Hu, X.; Li, N.; He, Z. Analysis of the current situation and prospect of radish industry development in China. Agric. Outlook 2012, 10, 35–37. [Google Scholar]
  2. Li, Y.; Li, H.; Zhang, X.; Li, W.; Wang, Y. Cause and control measures of piquancy, bitterness, black heart and skin in radish. Northern Hortic. 2015, 11, 53–54. [Google Scholar]
  3. Elbatawi, I.E. An acoustic impact method to detect hollow heart of potato tubers. Biosyst. Eng. 2008, 100, 206–213. [Google Scholar] [CrossRef]
  4. Ying, Y.; Liu, Y. Nondestructive measurement of internal quality in pear using genetic algorithms and FT-NIR spectroscopy. J. Food Eng. 2008, 84, 206–213. [Google Scholar] [CrossRef]
  5. Mathanker, S.K.; Weckler, P.R.; Bowser, T.J. X-ray applications in food and agriculture: A review. Trans. ASABE 2013, 56, 1227–1239. [Google Scholar]
  6. Pu, H.; Liu, D.; Wang, L.; Sun, D. Soluble solids content and ph prediction and maturity discrimination of lychee fruits using visible and near infrared hyperspectral imaging. Food Anal. Method 2016, 9, 235–244. [Google Scholar] [CrossRef]
  7. Han, D.; Tu, R.; Lu, C.; Liu, X.; Wen, Z. Nondestructive detection of brown core in the Chinese pear ‘Yali’ by transmission visible–NIR spectroscopy. Food Control 2006, 17, 604–608. [Google Scholar] [CrossRef]
  8. Clark, C.J.; McGlone, V.A.; Jordan, R.B. Detection of Brownheart in ‘Braeburn’ apple by transmission NIR spectroscopy. Postharvest Biol. Technol. 2003, 28, 87–96. [Google Scholar] [CrossRef]
  9. McGlone, V.A.; Martinsen, P.J.; Clark, C.J.; Jordan, R.B. On-line detection of Brownheart in Braeburn apples using near infrared transmission measurements. Postharvest Biol. Technol. 2005, 37, 142–151. [Google Scholar] [CrossRef]
  10. Zerbini, P.E.; Grassi, M.; Cubeddu, R.; Pifferi, A.; Torricelli, A. Nondestructive detection of brown heart in pears by time-resolved reflectance spectroscopy. Postharvest Biol. Technol. 2002, 25, 87–97. [Google Scholar] [CrossRef]
  11. Teerachaichayut, S.; Kil, K.Y.; Terdwongworakul, A.; Thanapase, W.; Nakanishi, Y. Non-destructive prediction of translucent flesh disorder in intact mangosteen by short wavelength near infrared spectroscopy. Postharvest Biol. Technol. 2007, 43, 202–206. [Google Scholar] [CrossRef]
  12. Takizawa, K.; Nakano, K.; Ohashi, S.; Yoshizawa, H.; Wang, J.; Sasaki, Y. Development of nondestructive technique for detecting internal defects in Japanese radishes. J. Food Eng. 2014, 126, 43–47. [Google Scholar] [CrossRef]
  13. Valero, C.; Barreiro, P.; Ruiz-altisent, M.; Cubeddu, R.; Pifferi, A.; Taroni, P.; Torricelli, A.; Valentini, G.; Johnson, D.; Dover, C. Mealiness detection in apples using time resolved reflectance spectroscopy. J. Texture Stud. 2005, 36, 439–458. [Google Scholar] [CrossRef] [Green Version]
  14. Pan, L.; Zhu, Q.; Lu, R.; McGrath, J.M. Determination of sucrose content in sugar beet by portable visible and near-infrared spectroscopy. Food Chem. 2015, 167, 264–271. [Google Scholar] [CrossRef] [PubMed]
  15. Ariana, D.P.; Lu, R. Hyperspectral waveband selection for internal defect detection of pickling cucumbers and whole pickles. Comput. Electron. Agric. 2010, 74, 137–144. [Google Scholar] [CrossRef]
  16. Kamruzzaman, M.; ElMasry, G.; Sun, D.; Allen, P. Application of NIR hyperspectral imaging for discrimination of lamb muscles. J. Food Eng. 2011, 104, 332–340. [Google Scholar] [CrossRef]
  17. Pu, Y.; Feng, Y.; Sun, D. Recent progress of hyperspectral imaging on quality and safety inspection of fruits and vegetables: a review. Compr. Rev. Food Sci. 2015, 14, 176–188. [Google Scholar] [CrossRef]
  18. Sanz, J.A.; Fernandes, A.M.; Barrenechea, E.; Silva, S.; Santos, V.; Gonçalves, N.; Paternain, D.; Jurio, A.; Melo-Pinto, P. Lamb muscle discrimination using hyperspectral imaging: Comparison of various machine learning algorithms. J. Food Eng. 2016, 174, 92–100. [Google Scholar] [CrossRef]
  19. Lorente, D.; Aleixos, N.; Gómez-Sanchis, J.; Cubero, S.; García-Navarrete, O.L.; Blasco, J. Recent advances and applications of hyperspectral imaging for fruit and vegetable quality assessment. Food Bioprocess Technol. 2012, 5, 1121–1142. [Google Scholar] [CrossRef]
  20. Cen, H.; Lu, R.; Ariana, D.P.; Mendoza, F. Hyperspectral imaging-based classification and wavebands selection for internal defect detection of pickling cucumbers. Food Bioprocess Technol. 2014, 7, 1689–1700. [Google Scholar] [CrossRef]
  21. Ariana, D.P.; Lu, R. Evaluation of internal defect and surface color of whole pickles using hyperspectral imaging. J. Food Eng. 2010, 96, 583–590. [Google Scholar] [CrossRef]
  22. Pan, L.; Zhang, Q.; Zhang, W.; Sun, Y.; Hu, P.; Tu, K. Detection of cold injury in peaches by hyperspectral reflectance imaging and artificial neural network. Food Chem. 2016, 192, 134–141. [Google Scholar] [CrossRef] [PubMed]
  23. Huang, M.; Lu, R. Apple mealiness detection using hyperspectral scattering technique. Postharvest Biol. Technol. 2010, 58, 168–175. [Google Scholar] [CrossRef]
  24. Fan, S.; Huang, W.; Guo, Z.; Zhang, B.; Zhao, C. Prediction of soluble solids content and firmness of pears using hyperspectral reflectance imaging. Food Anal. Method 2015, 8, 1936–1946. [Google Scholar] [CrossRef]
  25. Leiva-Valenzuela, G.A.; Lu, R.; Aguilera, J.E.M. Prediction of firmness and soluble solids content of blueberries using hyperspectral reflectance imaging. J. Food Eng. 2012, 115, 91–98. [Google Scholar] [CrossRef]
  26. Leiva-Valenzuela, G.A.; Lu, R.; Aguilera, J.M. Assessment of internal quality of blueberries using hyperspectral transmittance and reflectance images with whole spectra or selected wavelengths. Innov. Food Sci. Emerg. 2014, 24, 2–13. [Google Scholar] [CrossRef]
  27. Chao, K.; Yang, C.; Kim, M.S. Line-scan spectral imaging system for online poultry carcass inspection. J. Food Process. Eng. 2011, 34, 125–143. [Google Scholar] [CrossRef]
  28. Cen, H.; Lu, R.; Zhu, Q.; Mendoza, F. Nondestructive detection of chilling injury in cucumber fruit using hyperspectral imaging with feature selection and supervised classification. Postharvest Biol. Technol. 2016, 111, 352–361. [Google Scholar] [CrossRef]
  29. Meenu, G.; Amit, V.; Narender, B. Black rot-A devastating disease of crucifers: A review. Agric. Rev. 2013, 34, 269–278. [Google Scholar]
  30. Araújo, M.C.U.; Saldanha, T.C.B.; Galvão, R.K.H.; Yoneyama, T.; Chame, H.C.; Visani, V. The successive projections algorithm for variable selection in spectroscopic multicomponent analysis. Chemom. Intell. Lab. Syst. 2001, 57, 65–73. [Google Scholar] [CrossRef]
  31. Soares, S.F.C.; Gomes, A.A.; Araujo, M.C.U.; Filho, A.R.G.; Galvão, R.K.H. The successive projections algorithm. TrAC Trends Anal. Chem. 2013, 42, 84–98. [Google Scholar] [CrossRef]
  32. Galvão, R.K.H.; Araújo, M.C.U.; Fragoso, W.D.; Silva, E.C.; José, G.E.; Soares, S.F.C.; Paiva, H.M. A variable elimination method to improve the parsimony of MLR models using the successive projections algorithm. Chemom. Intell. Lab. Syst. 2008, 92, 83–91. [Google Scholar] [CrossRef]
  33. Kamruzzaman, M.; ElMasry, G.; Sun, D.; Allen, P. Non-destructive assessment of instrumental and sensory tenderness of lamb meat using NIR hyperspectral imaging. Food Chem. 2013, 141, 389–396. [Google Scholar] [CrossRef] [PubMed]
  34. Zhang, B.; Li, J.; Fan, S.; Huang, W.; Zhao, C.; Liu, C.; Huang, D. Hyperspectral imaging combined with multivariate analysis and band math for detection of common defects on peaches (Prunus persica). Comput. Electron. Agric. 2015, 114, 14–24. [Google Scholar] [CrossRef]
  35. Barker, M.; Rayens, W. Partial least squares for discrimination. J. Chemom. 2003, 17, 166–173. [Google Scholar] [CrossRef]
  36. Pan, L.; Zhan, G.; Tu, K.; Tu, S.; Liu, P. Eggshell crack detection based on computer vision and acoustic response by means of back propagation artificial neural network. Eur. Food Res. Technol. 2011, 233, 457–463. [Google Scholar] [CrossRef]
  37. Vapnik, V.N. An overview of statistical learning theory. IEEE Trans. Neural Netw. 1999, 10, 988–999. [Google Scholar] [CrossRef] [PubMed]
  38. Galvao, R.; Araujo, M.; Jose, G.; Pontes, M.; Silva, E.; Saldanha, T. A method for calibration and validation subset partitioning. Talanta 2005, 67, 736–740. [Google Scholar] [CrossRef] [PubMed]
  39. Dachoupakan Sirisomboon, C.; Putthang, R.; Sirisomboon, P. Application of near infrared spectroscopy to detect aflatoxigenic fungal contamination in rice. Food Control 2013, 33, 207–214. [Google Scholar] [CrossRef]
Figure 1. Normal (a); and defective (b) (with black heart) slices of radishes.
Applsci 06 00249 g001
Figure 2. Hyperspectral imaging system. (a) schematic diagram; (b) physical map.
Applsci 06 00249 g002
Figure 3. Mean relative transmittance spectra and standard deviation (SD) calculated from the regions of interest (ROIs) of all the normal and defective white radishes.
Applsci 06 00249 g003
Figure 4. The RMSE (root mean square error) plot (a) and selected wavelengths (designated by open and solid circle markers); (b) by SPA (successive projections algorithm) with spectral preprocessing using SNV+ MC (mean center).
Applsci 06 00249 g004
Table 1. Comparison of the different preprocessing methods based on partial least squares discrimination analysis (PLSDA) models.
Pretreatment MethodsNPSGFDDSGSMSCSNVAMCSNV+MC
LVs444334485
Calibration (%)97.598.198.196.698.199.198.198.8100
Prediction (%)95.696.196.795.696.798.996.798.399.4
LVs: Latent variables; NP: Not preprocessing; SGFD: Savitzky-Golay first derivative; D: Detrend; SGS: Savitzky-Golay smoothing (Width=5); MSC: Multiplicative scatter correction; SNV: Standard normal variate; A: Autoscale; MC: Mean center; SNV: Standard normal variate.
Table 2. Pearson’s linear correlation coefficients and probability levels among 10 selected wavelengths by SPA (successive projections algorithm).
Wavelengths545 nm564 nm611 nm629 nm642 nm655 nm724 nm730 nm738 nm809 nm
545 nm1.000---------
564 nm0.998 **,11.000--------
611 nm0.988 **0.994 **1.000-------
629 nm0.987 **0.993 **1.000 **1.000------
642 nm0.984 **0.992 **0.999 **1.000 **1.000-----
655 nm0.980 **0.989 **0.998 **0.999 **1.000 **1.000----
724 nm0.943 **0.951 **0.963 **0.966 **0.969 **0.974 **1.000---
730 nm0.928 **0.934 **0.945 **0.949 **0.953 **0.958 **0.998 **1.000--
738 nm0.911 **0.916 **0.926 **0.931 **0.935 **0.941 **0.992 **0.998 **1.000-
809 nm0.843 **0.846 **0.854 **0.860 **0.866 **0.874 **0.957 **0.974 **0.984 **1.000
1 Correlation coefficients followed by one asterisk * and two asterisks ** are significant at p < 0.05 and p < 0.01, respectively.
Table 3. Classification results (%) for normal and defective radishes with black heart based on transmittance using four models.
ModelWavelengths NumberParametersClassCalibration (%)Prediction (%)
AccuracyOverallAccuracyOverall
PLS-DA 1420LVs: 5Normal10010098.999.4
Black heart100100
10LVs: 7Normal10099.710099.4
Black heart99.498.9
4LVs: 1Normal98.797.298.996.1
Black heart95.793.5
SVM420KT: RBF; C: 100;
γ: 0.031623
Normal10010010098.9
Black heart10097.8
10KT: RBF; C: 100;
γ: 3.1623
Normal10010098.998.9
Black heart10098.9
4KT: RBF; C: 100;
γ: 0.0001
Normal98.797.297.795.6
Black heart95.793.5
ANN420HLAF: tangent; OLAF: softmax; HLN: 15Normal100100100100
Black heart100100
10HLAF: Hyperbolic tangent; OLAF: softmax; HLN: 6Normal100100100100
Black heart100100
4HLAF: Hyperbolic tangent; OLAF: softmax; HLN: 3Normal99.498.898.997.2
Black heart98.195.7
FLDA420-Normal----
Black heart--
10-Normal99.499.710099.4
Black heart10098.9
4-Normal99.498.410097.8
Black heart97.595.7
1 PLS-DA: partial least squares discrimination analysis; SVM: support vector machine; ANN: artificial neural network; FLDA: Fisher's linear discriminant analysis; LVs: Latent variables; KT: Kernel type; C: Cost; γ: Gamma; RBF: radial basis function; HLAF: hidden layer activation function; OLAF: output layer activation function; HLN: hidden layers nodes.

