Article

Monitoring Techniques of Cerium Stabilized Zirconia for Medical Prosthesis †

by
Adriana Savin
1,*,
Mihail-Liviu Craus
1,2,*,
Vitalii Turchenko
2,
Alina Bruma
3,
Pierre-Antoine Dubos
4,
Sylvie Malo
4,
Tatiana E. Konstantinova
5 and
Valerii V. Burkhovetsky
5
1
Nondestructive Testing Department, National Institute for Research and Development for Technical Physics, 47 D. Mangeron Blvd., Iasi 700050, Romania
2
Frank Laboratory for Neutron Physics, Joint Institute for Nuclear Research, 6 Joliot-Curie Avenue, Dubna 141980, Russia
3
Department of Physics and Astronomy, University of Texas at San Antonio, One University of Texas at San Antonio Circle, San Antonio, TX 78249, USA
4
Laboratory of Crystallography and Materials Science (CRISMAT), CNRS-ENSICAEN-Université de Caen Basse Normandie, Caen 14050, France
5
Department of Physical Materials Science, Donetsk Institute for Physics and Engineering named after O.O. Galkin of National Academy of Sciences of Ukraine, 72 R. Luxemburg str., Donetsk 83114, Ukraine
*
Authors to whom correspondence should be addressed.
This paper is an extended version of paper published in the 6th International Conference on Emerging Technologies in Non-destructive Testing (ETNDT6), Brussels, Belgium, 27–29 May 2015.
Appl. Sci. 2015, 5(4), 1665-1682; https://doi.org/10.3390/app5041665
Submission received: 20 October 2015 / Revised: 30 November 2015 / Accepted: 1 December 2015 / Published: 8 December 2015
(This article belongs to the Special Issue Acoustic and Elastic Waves: Recent Trends in Science and Engineering)

Abstract

:
The purpose of this paper is to emphasize the improvement of Zr-based ceramics properties as a function of addition of Ce ions in the structure of the original ceramics. The structural investigations proposed in this paper cover X-ray, and neutron diffraction offered the first indication of the variation of the phase composition and the structural parameters, micro-hardness measurements as well as non-destructive evaluations in order to analyze the structural properties of these materials with utmost importance in fields such as medicine, where these composite materials are used in hip-implants or dental implants/coatings. In combination of Resonant Ultrasound Spectroscopy, which makes use of the resonance frequencies corresponding to the normal vibrational modes of a solid in order to evaluate the elastic constants of the materials, we emphasize a unique approach on evaluating the physical properties of these ceramics, which could help in advancing the understanding of properties and applications in medical fields.

1. Introduction

Recent developments in advanced dental materials [1,2], solid-oxide fuel-cell design to oxygen detection [3], nuclear waste confinement [4], optics [5], medical prosthesis [6,7], and catalytic [8] technologies have drawn attention towards the remarkable structural properties of zirconia (ZrO2)-based ceramics. In all the current technological applications, ZrO2-based ceramics are preferred due to their advanced mechanical properties such as high-fracture toughness and bulk modulus, corrosion resistance, chemical inertness, low chemical conductivity and biocompatibility [9]. It is well known that three polymorphic forms of pure ZrO2 can be found: the monoclinic state, P21/c, stable at temperatures below 1170 °C; the tetragonal phase, P42/nmc stable in the temperature range between 1170 and 2370 °C; and the cubic, Fm-3m phase, appearing at a temperature above 2370 °C [10]. These ceramics have mechanical properties, promoting them to special applications. Under external stress, as grinding or impact, transition from the tetragonal (t) to monoclinic (m) phase can appear at normal temperatures, being followed by an increase of volume of at least 4%, causing compressive stress. This can cause material failure. Ceria (Ce2O3) or yttria (Y2O3) are used to stabilize these ceramics at room temperature and allowing t → m transformation to prevent crack propagation.
The main method used for the stabilization of the ZrO2 tetragonal phase is the introduction of stabilization components in the zirconia lattice, such as Mg, Ce, Fe, Y, etc. [11,12,13,14]. At nanoscale level, the metastable phase formation in ZrO2 can be induced by including in the oxide structure some vacancy defects [11]. Although, the stabilization effect of the oxygen vacancies in tetragonal ZrO2 is not yet well understood (contrary to cubic ZrO2) [14], the concentration of oxygen vacancies in the lattice required to stabilize the tetragonal phase is found in phases like ZrO1.97 and ZrO1.98 for tetragonal zirconia doped by rare-earth elements, mainly cerium (Ce) and yttrium (Y).
Our aim is to investigate the influence of the phase change of ZrO2 ceramics following doping with Ce on the mechanical properties. We investigated the structure of these ceramics and the phase stabilization using X-ray and neutron diffraction, Scanning Electron Microscopy (SEM) as well as microstructure characterization methods, including micro-hardness measurements. Moreover, we employed Resonant Ultrasound Spectroscopy (RUS) as a non-destructive evaluation method in order to estimate the presence of low-density regions, state of sintering, and the presence and development of small cracks in the structure, by evaluating the complete elasticity matrix. RUS appears to be a feasible method for the inspection of zirconia ceramics based on the changes of the resonance frequencies, being easily applied for the quality control procedure of such ceramic samples; essentially monitoring of a single resonance peak within the frequency band included in experiment would be sufficient for this purpose. We emphasize the properties of zirconium-based ceramics for applications in the biomedical field, such as ceramic femoral heads used in hip implant procedures, which are very resistant to scratches resulting from debris caused by accumulation of bone parts, cement, or metal that occasionally fall between artificial joint surfaces, but are extremely fragile.

2. Materials and Methods

The Ce doped zirconia samples have been obtained through the standard ceramic technology [15], a mixture of ceria and zirconia oxides (Zr1-xCexO2 (x = 0–0.17)) being used in proportions established a priori. After grinding and pressing, the samples were shaped in form of cylinders. Finally we treated cylindrical samples at a temperature of 1500 °C for six hours in air.
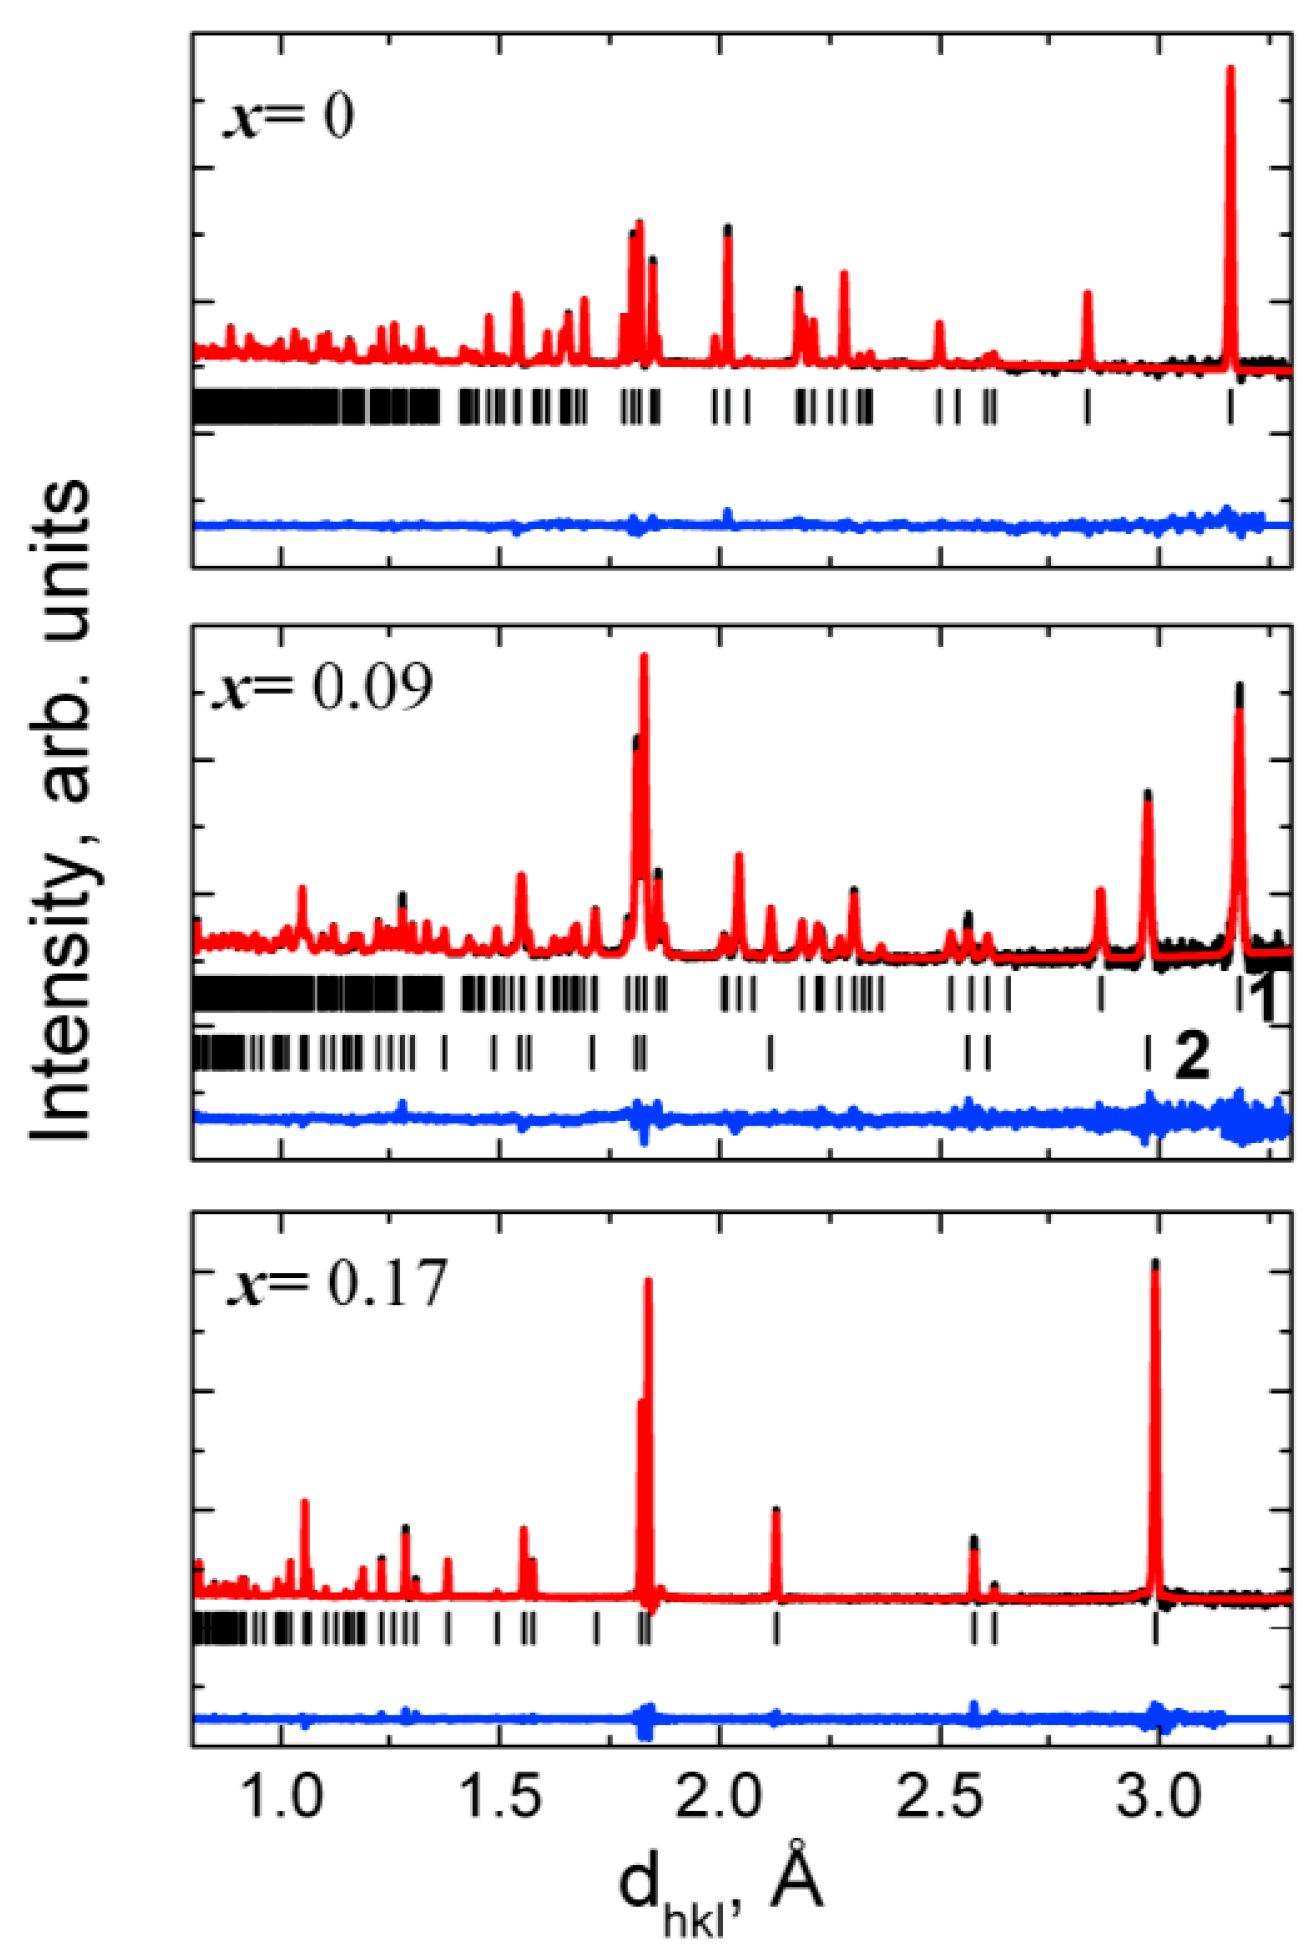
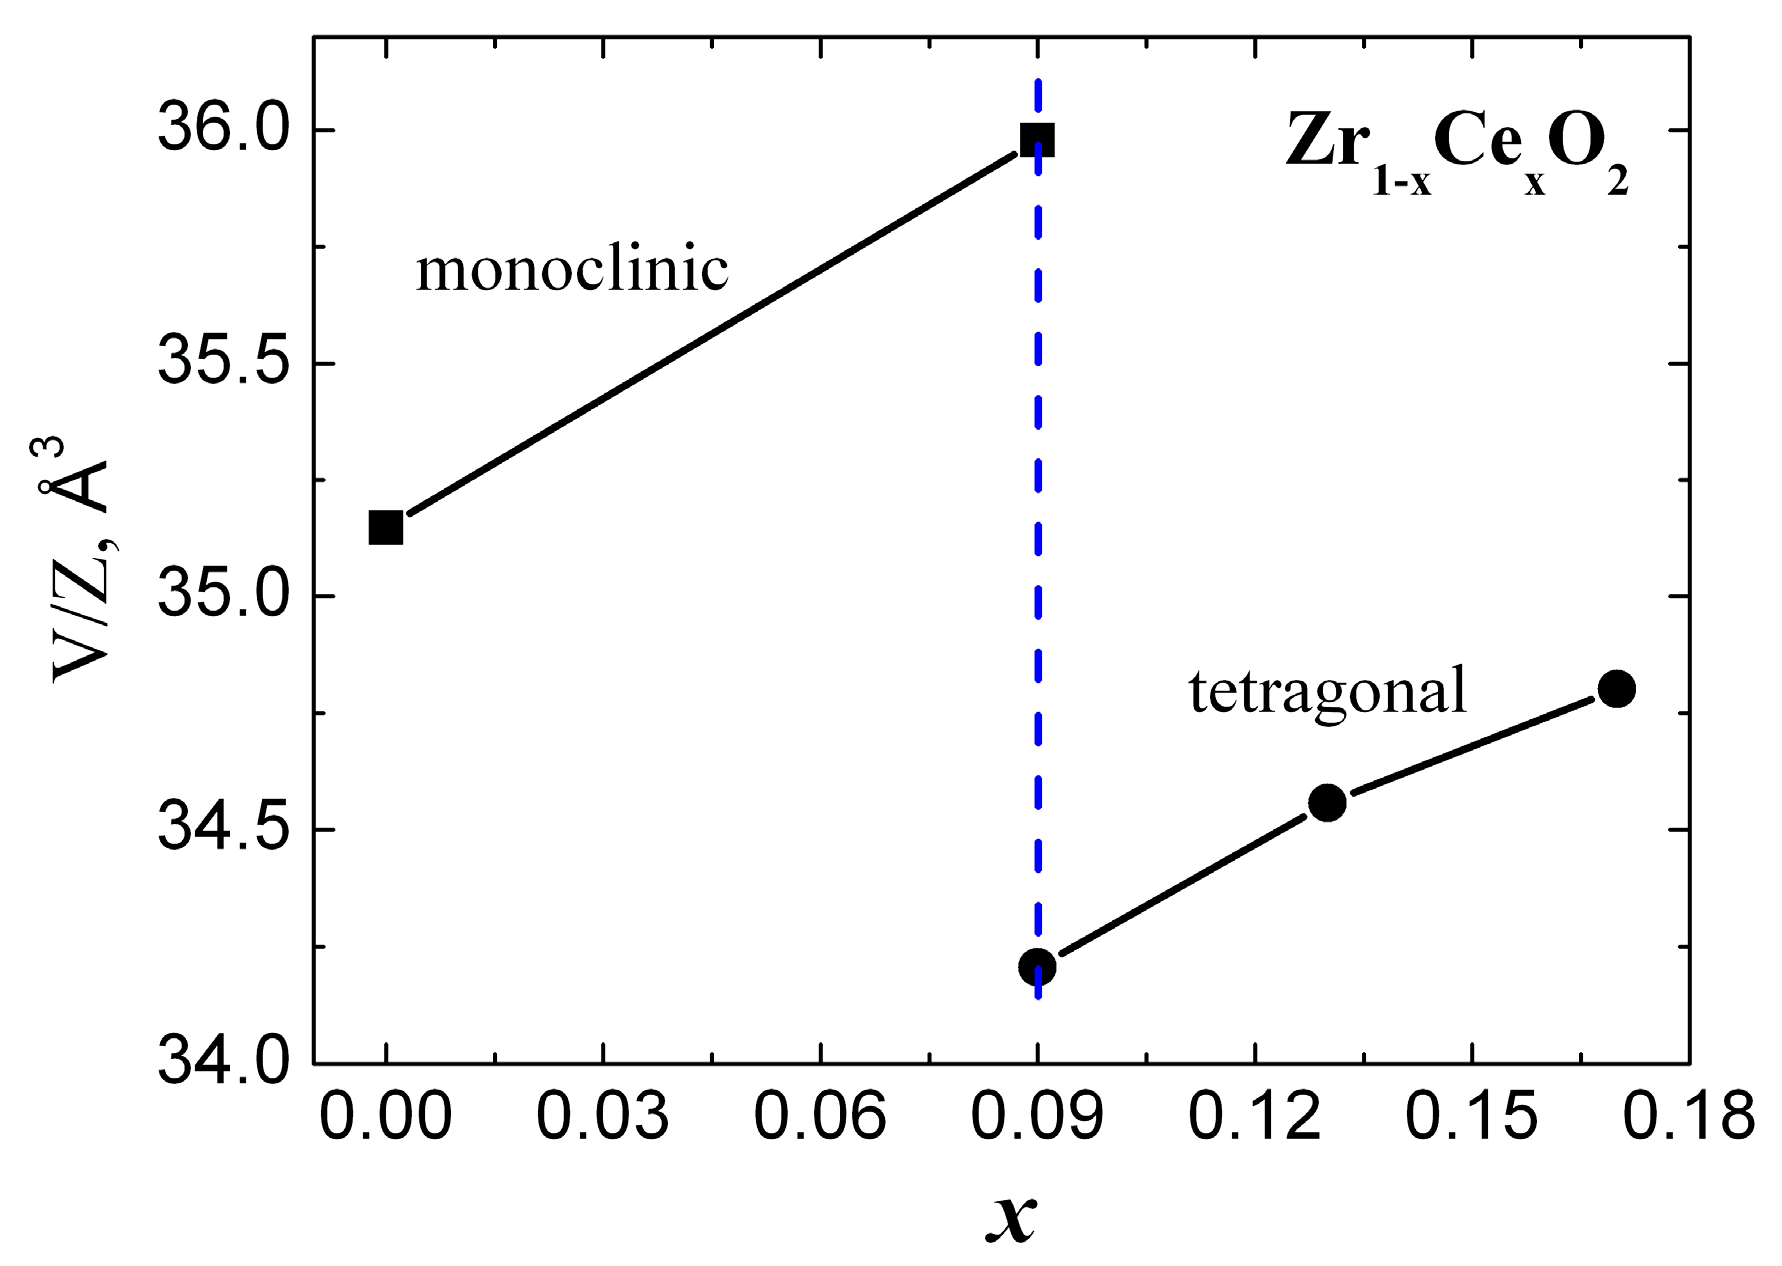
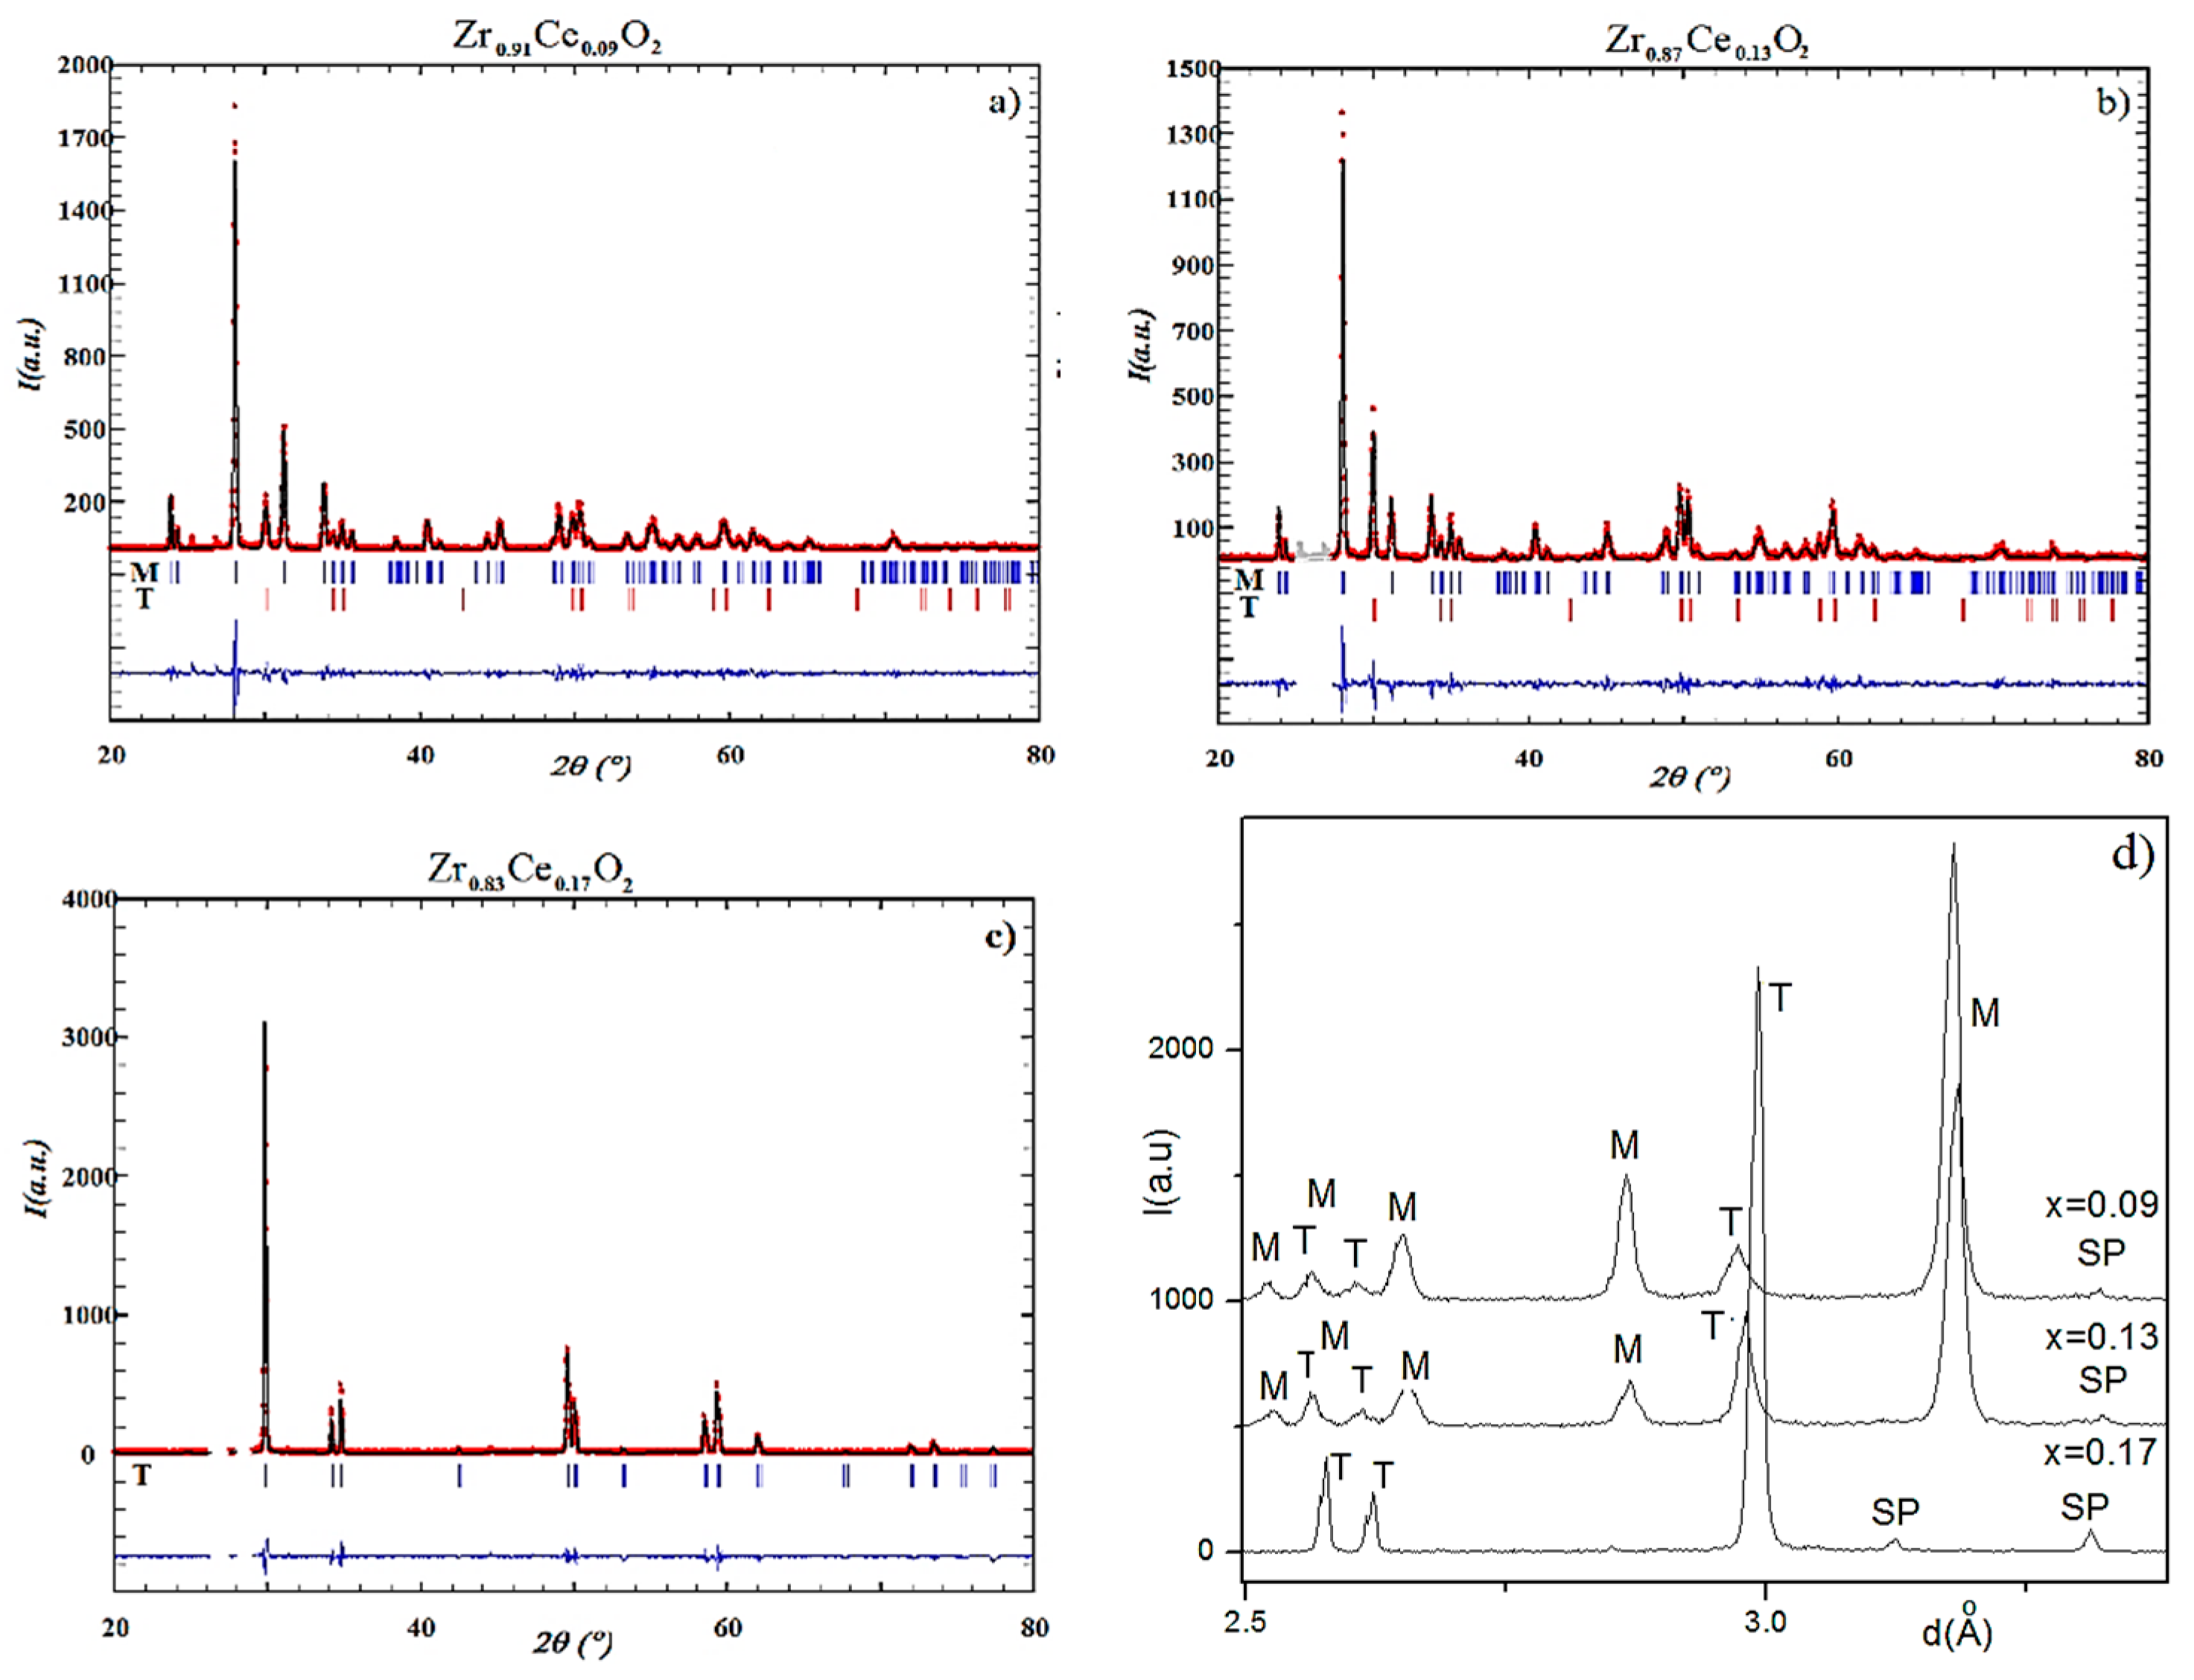
The phase composition, the lattice constants, space group, average size of coherent blocks, microstrains, and positions of cations and anions in the unit cell have been determined using XRD and ND data.
For XRD analysis the samples surface were prepared by a standard metallographic technique [16]. XRD data were acquired with a X’pert Pro MPD PANalytical diffractometer (PANalytical Inc., Westborough, MA, USA) and a BRUKER AXS D8—Advance diffractometer (Bragg—Brentano geometry, CuKα, 2θ range of 20°–80°) (BRUKER AXS Inc., Madison, WI, USA). A powder diffraction software package, which includes the standards of the Crystallography Open Database (COD) [17], was used in order to identify the phase composition of the samples. The microstrains and average size of crystalline blocks of the thin layer from the surface of the bulk samples were obtained using the XRD data, processed by the Rietveld method, PowderCell [18]. LaB6 was used as standard for XRD measurements (NIST SRM-660—a lanthanum hexaboride powder LaB6, for line position and line shape).
The structural analysis of the Zr1−xCexO2 (x = 0.0, 0.09, 0.13, 0.17) ceramic samples was performed also using the time-of-flight (TOF) High Resolution Fourier Diffractometer (HRFD) at the IBR-2 pulsed reactor in Joint Institute for Nuclear Research, Dubna, Russia [19]. At the HFRD diffractometer, the correlation technique of data acquisition is used, providing a very high resolution of Δd/d ~ 0.001, practically constant in a wide interval of dhkl spacings [19]. We collected the high resolution diffraction patterns by using a detector placed at backscattering angles 2θ = ±152°, dhkl = 0.6–3.6 Å. It is important to mention that via X-ray diffraction, a layer of typically 10 μm thickness has been investigated, whereas in the case of neutron diffraction, a thickness of tens of centimeters of a sample has been investigated.
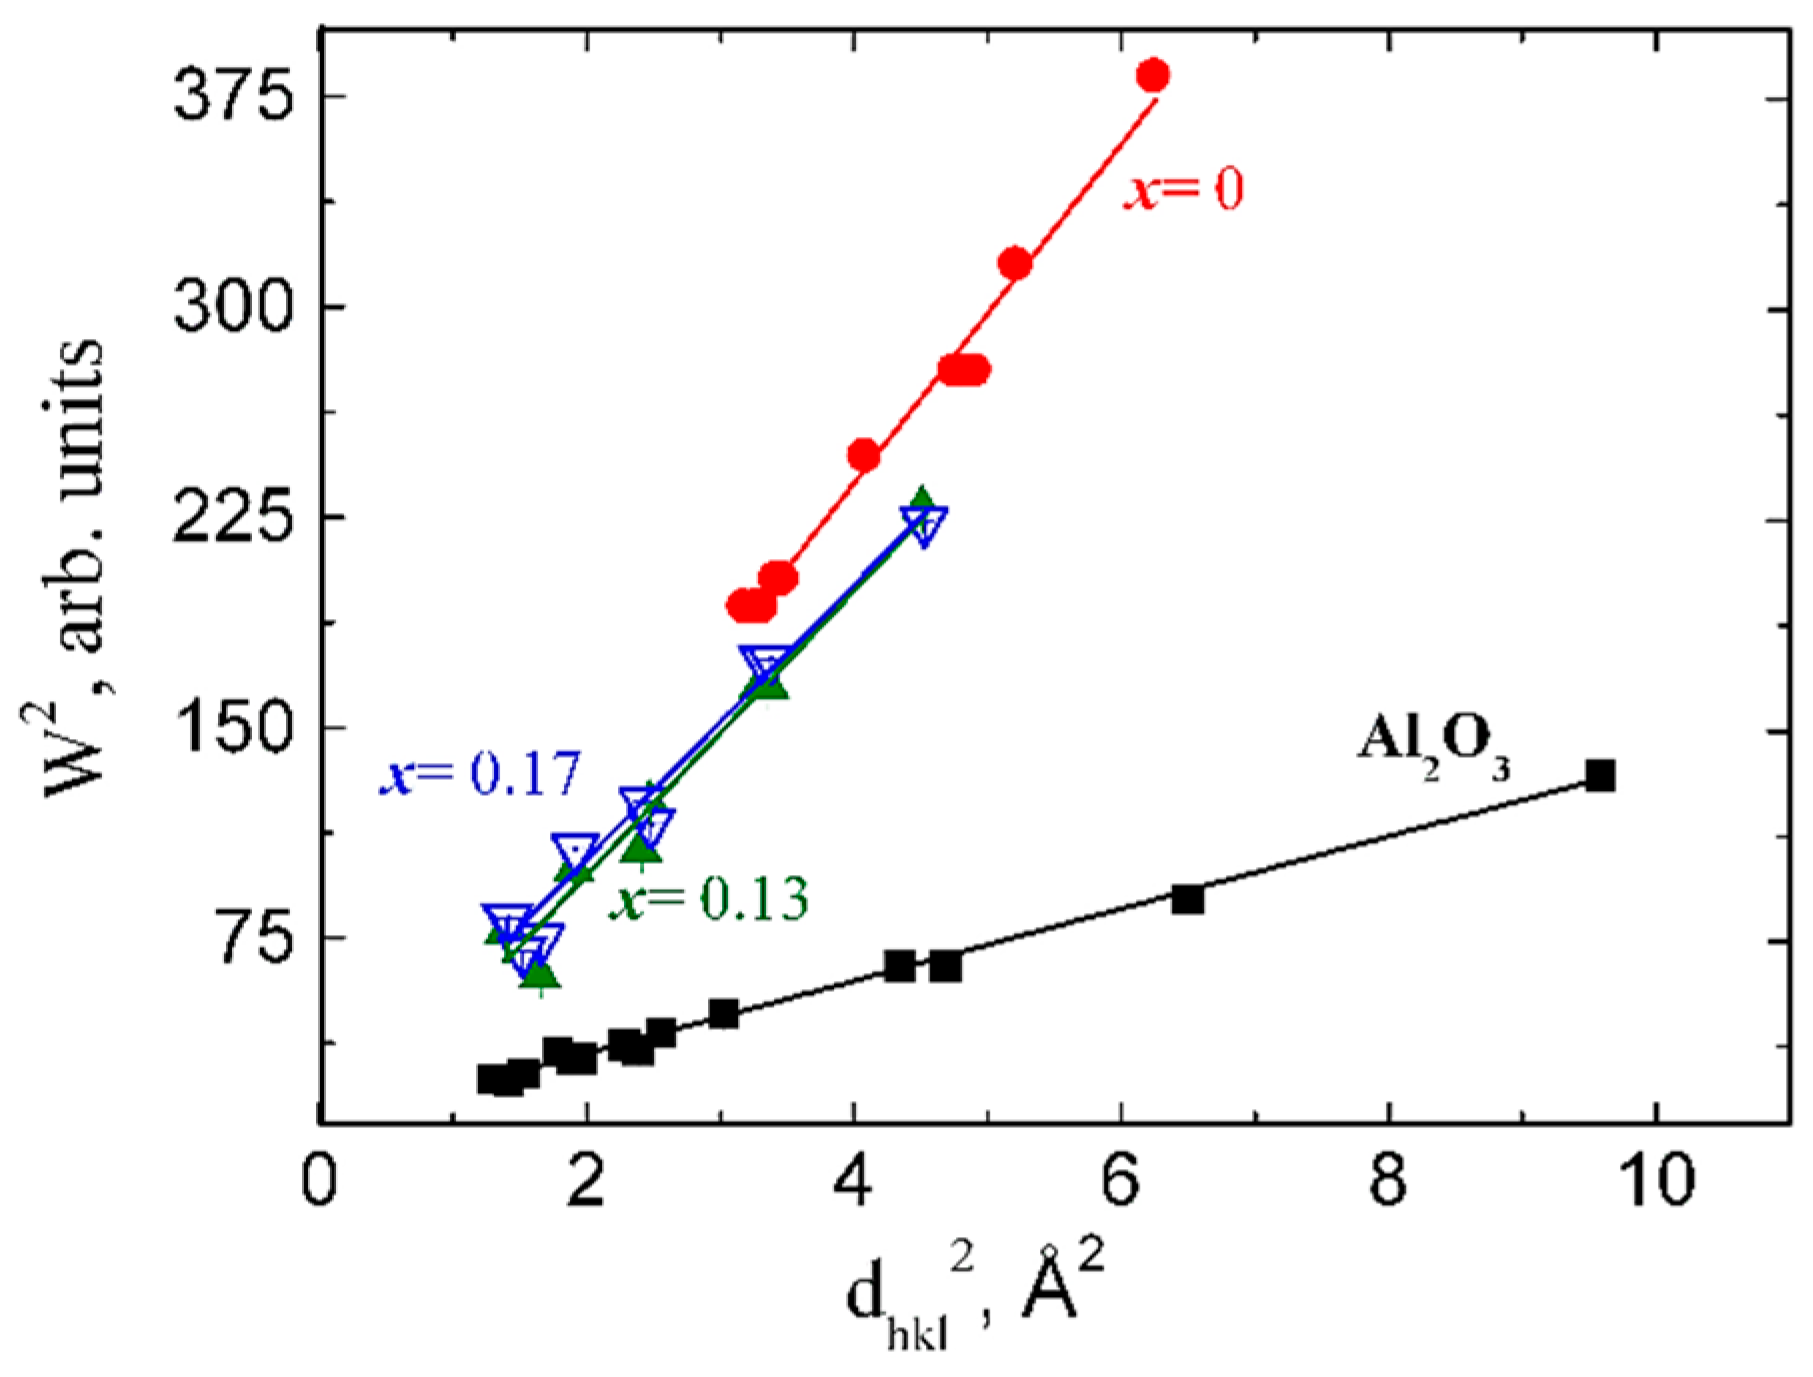
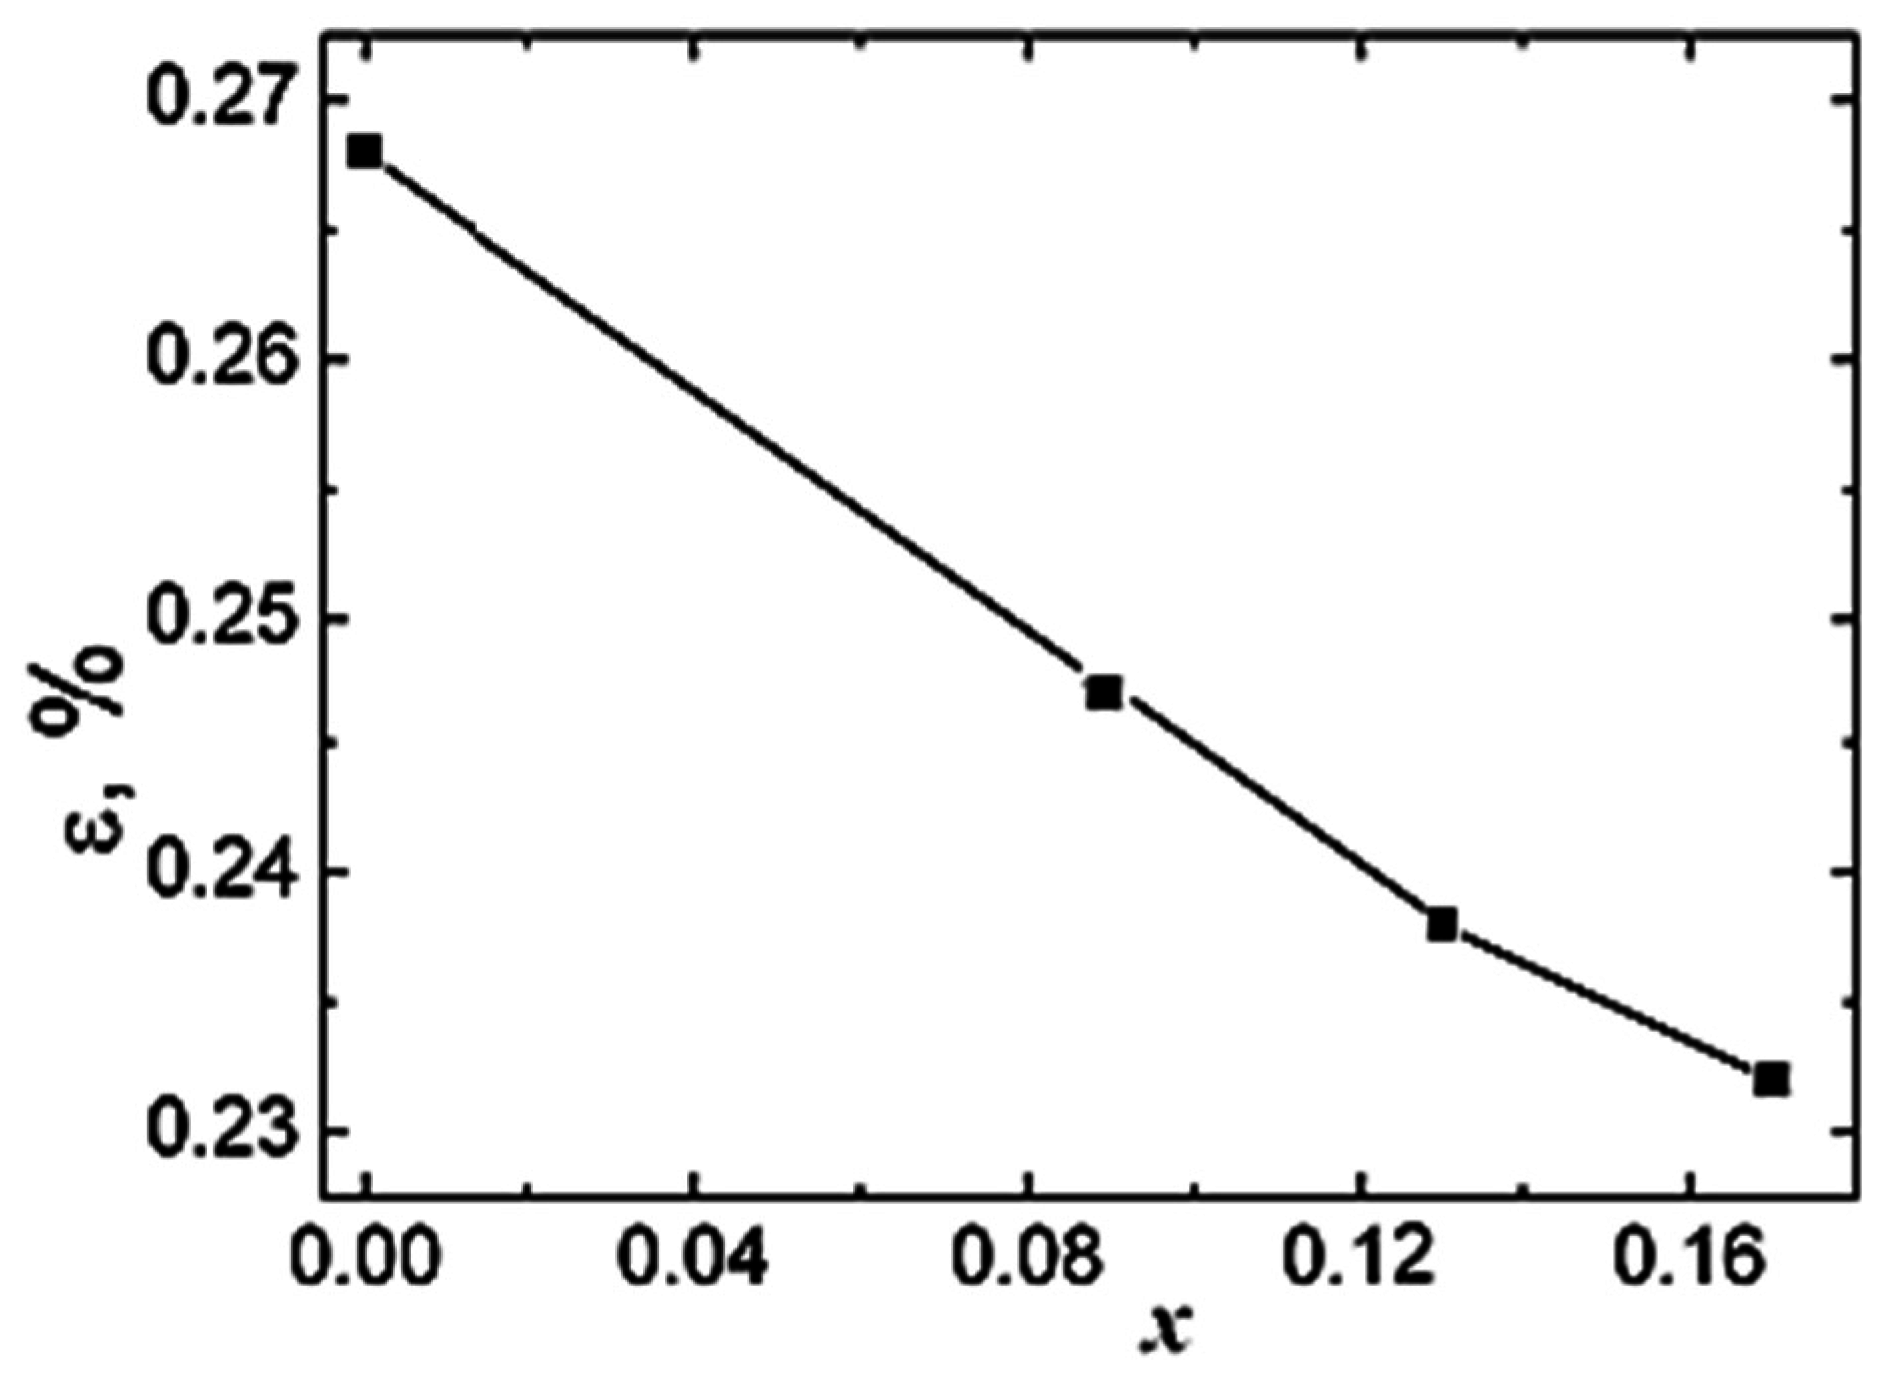
Information about microstructural parameters, such as crystalline size (average size of crystalline blocks) and microstrains were obtained from the lines broadening. From the dependence between the square of Full Width at Half Maximum (W) of neutron peaks and the square of the interplanar spacing, d2, described by the Equation (1) [20,21]
W 2 = C 1 + ( C 2 + C 3 ) d 2 + C 4 d 4
we extracted the microstrain values (ε).
Here, C1, C2 are the refining constants of the resolution function of HRFD obtained from a standard Al2O3 (SRM-676 of NIST, USA); C3 ~ ε2, where ε is the microstrain; C4 ~ 1/L where L is the size of the coherently scattering blocks. The values of ε and L can be determined from the true physical characteristics of line broadening, whose value is defined as the difference between broadening of peaks of the experimental sample and the standard Al2O3.
RUS is a complex method that allows the determination of elastic constant and the elements of elasticity matrix for samples with certain shapes [22,23,24,25,26]. Sample geometry affects data acquisition [26]. For cylinders with a high ratio of length to diameter we have few excitation modes and the spectra are simple [26,27]. In the case of the studied samples the ratio is around the unit and the spectrum requires more analysis than a long bar. The increasing of spectral complexity supposes adjacent analyses before concluding about these samples. In order to determine a parameter, more resonance frequencies must be searched [25]. This requires a lot of computational calculation time and repeated tests. The same number of normal modes for a short cylinder compared with a long cylinder requires a narrower frequency range.
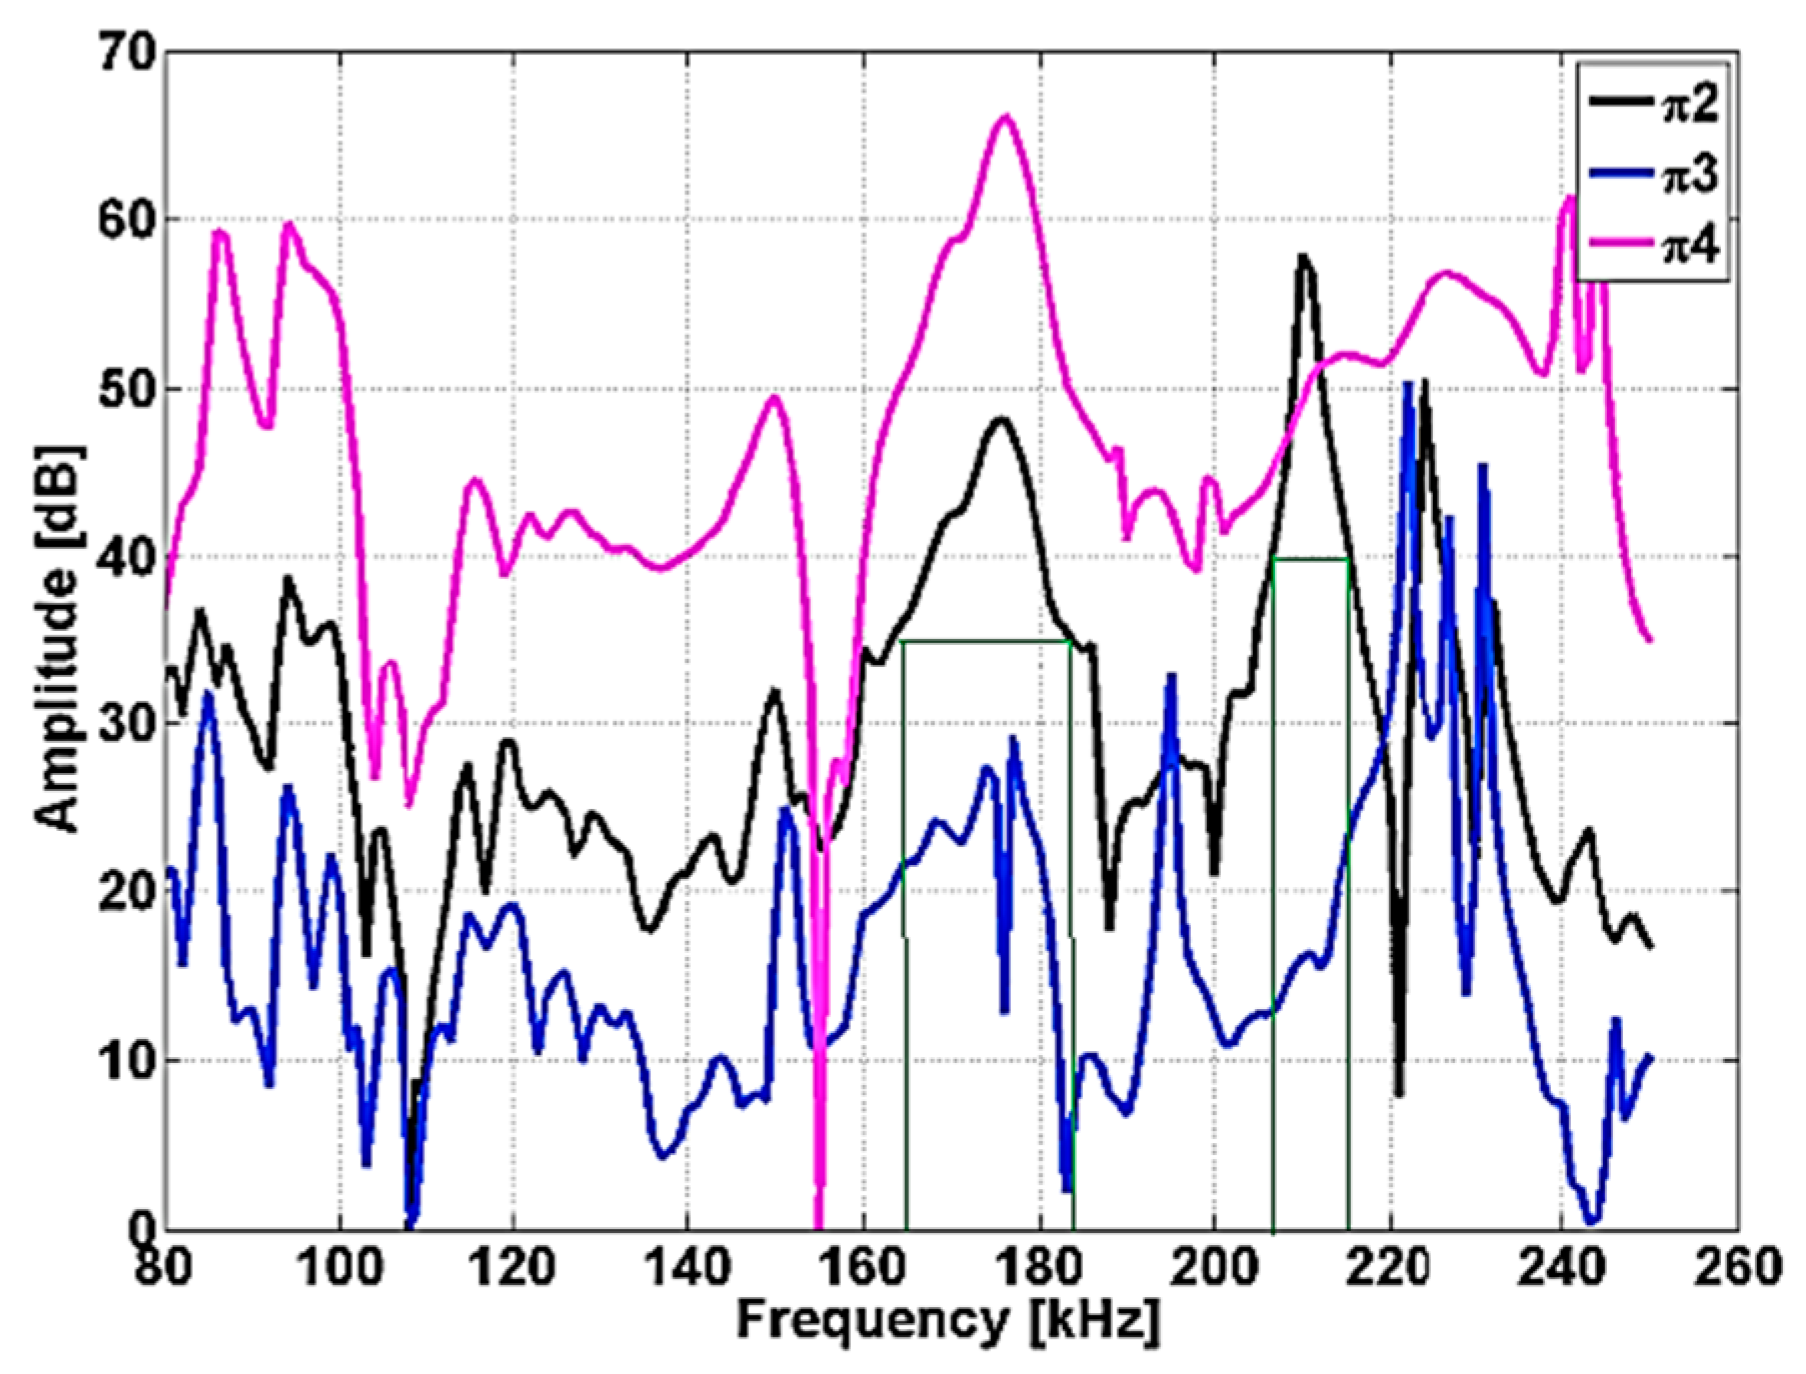
In the case of cylindrical samples, having diameter approximately equal with height, the first mode is the fundamental torsional mode allowing the direct determination of shear modulus. RUS involves scanning the resonance structure of a compact specimen (in our case a ceramic cylinder) with the aim of determining its mechanical properties [28,29]. In principle, RUS is composed of three parts. Successful use of this method implies the obtaining of a resonant ultrasound spectrum, meaning obtaining the frequency answer for a certain excitation for the analyzed sample. It is necessary to develop a computing method which can help in predicting the resonant ultrasound spectrum for the estimated parameters. The third component represents the iterative refinement of the estimated parameters, in agreement with the measured spectrum. Each of the steps mentioned above have multiple solutions. In the classical RUS experiment, a sample is placed between two US transducers. The primary advantages of this contact technique are its relative simplicity and low cost.
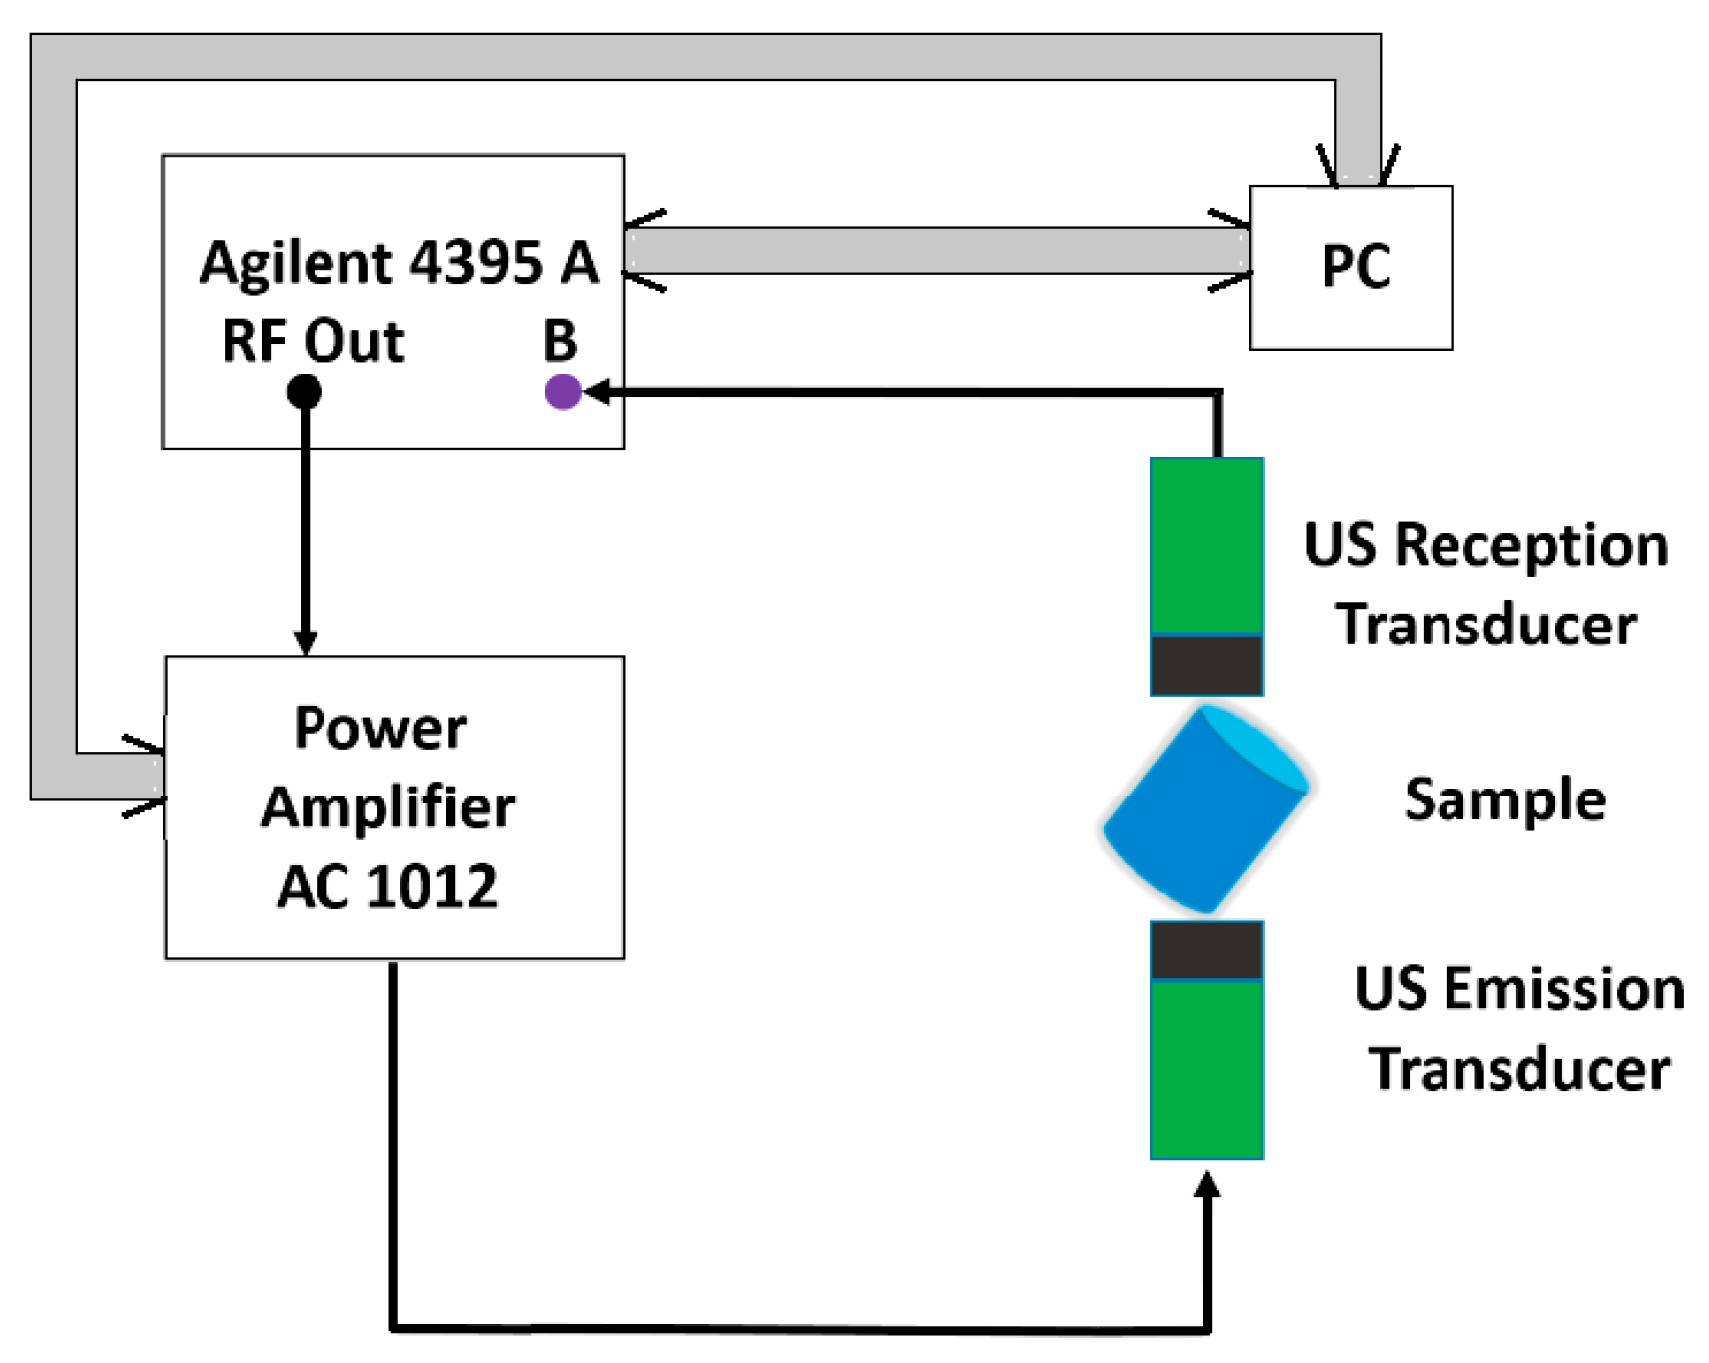
For the RUS method, the samples have been supported by two identical piezoelectric ultrasonic transducers, for emission and reception respectively, placed at the opposite ends of the cylindrical sample (see Figure 1). The measurements are carried out via transducers with contact. The coupling of the transducer with the specimen influences which modes are measured. When the sample is pinned on its edge, more modes are excited and the modes are better defined than when the transducers are placed on the ends of the cylinder. The probe is fixed between the emission and reception transducers in order to accomplish the condition of a stress free surface. The equipment allows the setting so that for the established position of the cylindrical sample, the contact on the edge assures the excitation of a maximum number of possible resonances for the fixed geometry.
A Network/Spectrum/Impedance Analyzer 4395A (Agilent Technologies, Santa Clara, CA, USA), generates a sweep frequency ranging between 80 and 250 kHz with a 1 kHz step. The signal is amplified using a Power amplifier AG 1012 (T&C Power Conversion Inc., Rochester, NY, USA) and applied to the US emission transducer is applied to the B port of the 4395 A Agilent, the spectrum being acquired by a PC used to program the functioning of the equipment as well with a numerical code developed in Matlab 2012b (The MathWorks Inc., Natick, MA, USA, 2012) via a PCIB interface (National Instruments, Mopac Expwy, Austin, TX, USA).
The command of the power amplifier is made using the same PC via a RS232 interface (National Instruments). For the determination of the elasticity and shear moduli of the samples, the propagation speed of the longitudinal and transversal ultrasound waves were measured using a transmission procedure. The emission transducer is applied at one base of the sample via a delay line from Perspex® (Perspex Acrylic Brand, Darwen, Lancashire, UK) 20 mm in length, while the reception transducer is applied on the other base.
Figure 1. RUS Experimental setup schematic block diagram. Thin lines correspond to coaxial cable for sinusoidal wave transmission; thick lines are GPIB cable for digitalized data.
Applsci 05 01665 g001
A G5KB GE transducer (General Electric Measurement & Control, Boston, MA, USA) with a central frequency of 5 MHz has been used for the measurement of the propagation speed of the longitudinal waves, the coupling being made using a ZG-F Krautkramer (General Electric Measurement & Control, Boston, MA, USA), whereas for the transversal waves, a MB4Y GE transducer (General Electric Measurement & Control, Boston, MA, USA) was used, with a central frequency of 4 MHz, the coupling being made with honey. The generation of emission impulses and the reception of signals delivered by the reception transducer has been made using a PR 5073 Pulser Receiver former Panametrics NDT USA (Olympus Corporation Waltham, MA, USA).
The densities of the samples were obtained by means of Archimedes’ method, by using water as fluid. The measurements of microhardness were performed by Vickers method, with a load of 50 g and a dwell time of 20 s.

3. Results and Discussion

3.1. Structural Parameters

The experimental results obtained from X-ray and neutron data emphasize that the Zr1-xCexO2 (x = 0–0.17) samples do not have a homogeneous structure (see Figure 2). The sample containing pure ZrO2 has a monoclinic (P21/c) crystalline structure [10]. Once the concentration of Ce cations increases, the crystal structure changes, from monoclinic to tetragonal (P42/nmc) (see Figure 2) with two formula units (Z = 2) per unit cell. The ND diffractograms indicated that the sintered Zr0.91Ce0.09O2 (x = 0.09) contains both monoclinic and tetragonal phases, whereas when x > 0.09, the samples only contain tetragonal phases, with a unit cell volume increasing from 69.2 Å3 (x = 0.13) to 69.7 Å3 (x = 0.17) (see Figure 2 and Table 1).
Data were acquired at room temperature and refined using the Fullprof program [30,31], and shown in Figure 2. From the analysis of the neutron diffraction data, we were able to define with precision the phase composition, crystal lattice, and the atomic structure of each phase.
Lattice parameters and atomic fractional positions, as well as background parameters, scale factors, occupancy, and isotropic thermal parameters were refined in this case (see Table 1).
Figure 2. Diffraction patterns for the Zr1-xCexO2 samples measured using HRFD at room temperature, the data were treated using a Fullprof program. The experimental and calculated diffractograms and the difference between calculated and observed diffractograms are shown. The difference is weighted by the mean-squares deviation for each point. Below each graph, ticks indicate the position of the calculate peaks for each phase. 1—monoclinic structure (P21/c (SG 14)); 2—tetragonal structure (P42/nmc (SG 137)).
Applsci 05 01665 g002
Table 1. Refined structural parameters of Zr1-xCexO2 (x = 0.0–0.17) at room temperature, obtained by processing the data collected using the High Resolution Fourier Diffractometer at the Joint Institute for Nuclear Research, Dubna, Russia (x represents the nominal Ce concentration).
Parametersx
x = 0x = 0.09x = 0.13x = 0.17
Monoclinic P21/cMonoclinic P21/cTetragonal P42/nmcTetragonal P42/nmcTetragonal P42/nmc
a, (Å)5.1453 ± 0.00015.2046 ± 0.00033.6236 ± 0.00023.6358 ± 0.00013.6452 ± 0.0002
b, (Å)5.2091 ± 0.00015.2155 ± 0.00033.6236 ± 0.00023.6358 ± 0.00013.6452 ± 0.0002
c, (Å)5.3116 ± 0.00015.3776 ± 0.00025.2163 ± 0.00035.2378 ± 0.00015.2471 ± 0.0002
β, (°)99.225 ± 0.00198.938 ± 0.000290.090.090.0
Vcell/Z, (Å3)35.13036.0534.24734.61934.860
Volume fraction1.00.378 ± 0.0040.622 ± 0.0061.001.00
Rwp, %9.514.310.410.4
The Rwp values indicate a good fit between the calculated and the experimental data (see Table 1). The refined atomic positions are indicated in Table 2. Temperature corresponding to the ions oscillations have been taken into account in the isotropic approximation.
Table 2. Atomic positions and isotropic thermal parameters of Zr1-xCexO2(x = 0–0.17) calculated using the Rietveld method from neutron diffraction data. P21/c: Zr (4e) (xyz); O1 (4e) (x,y,z); O2 (4e) (x,y,z); P42/nmc: Zr (2a) (0.75, 0.25, 0.75); O (4d) (0.25, 0.25, z) (ND data).
Atomic ParametersCe Concentration
x = 0x = 0.09x = 0.13x = 0.17
Monoclinic P21/cMonoclinic P21/cTetragonal P42/nmcTetragonal P42/nmcTetragonal P42/nmc
Zr/Cex0.2752 ± 0.00010.2683 ± 0.00040.75000.750000.75000
y0.0405 ± 0.00020.0364 ± 0.00030.25000.250000.25000
z0.2084 ± 0.00010.2084 ± 0.00040.75000.750000.75000
Biso (Å2)0.116 ± 0.0000.287 ± 0.0000.283 ± 0.000.143 ± 0.000.169 ± 0.00
Occupation1.00.903/0.0970.89/0.090.87/0.130.83/0.17
O1x0.0710 ± 0.00010.0533 ± 0.00050.25000.250000.25000
y0.3341 ± 0.00020.3146 ± 0.00050.25000.250000.25000
z0.3452 ± 0.00030.3604 ± 0.00040.0476 ± 0.00020.0474 ± 0.00010.0467 ± 0.0001
Biso (Å2)0.096 ± 0.0030.59 ± 0.040.37 ± 0.030.419 ± 0.0010.521 ± 0.002
Occupation1.01.01.01.01.0
O2x0.4488 (1)0.4500 ± 0.0004---
y0.7570 (3)0.7513 ± 0.0005---
z0.4799 (2)0.4735 ± 0.0004---
Biso (Å2)0.137 (3)0.59 ± 0.04---
Occupation1.001.00---
The neutron peaks broadening (W), related to the sample of ZrO2, decreases as the concentration of Ce ions is increasing (see Figure 3). It is observable that the experimental points can be fitted with linear functions and consequently, the size effect is absent (L > 3000 Å).
As it can be clearly observed, the volume of the unit cell increases as the concentration of Ce cations is increased (see Figure 4). For x = 0.09 a change of the unit cell symmetry, from monoclinic to tetragonal, takes place. The change of the symmetry is associated with a sudden decrease of the volume associated (see Figure 4). The slope of the linear functions decreases as the concentration of Ce ions is increasing. This behavior signifies that microstrains in the investigated samples are decreasing with the concentration of Ce ions, as shown in Figure 5.
First sample, for which x = 0.0, have the baddeleyite structure [32]. The modification of the crystal structure due to the substitution of Zr ions with Ce ions is related to the variation of the observed distance between Zr–O ions (see Table 2 and Figure 6). Cerium cations have two possible valence: +3 and +4. On the same type of places Ce3+/Ce4+ have a larger ionic radius as Zr4+ cations (rCe3+ = 1.143 Å; rCe4+ = 0.97 Å; rZr4+ = 0.84 Å, for C.N. = 8, after Shannon [31]). The substitution of Zr4+ with Ce4+/Ce3+ should lead to an increase of the lattice constants, of the unit cell volume and of the microstrains. On other hand, the increase of the lattice energy can cause a change in crystal structure and can sit at the basis of the explanation related to the observed transition from monoclinic to tetragonal structure at room temperature. The transition is accompanied by a relaxation of energy part due to the microstrain. In the same time, the substitution of Zr4+ with Ce3+ leads to a corresponding decrease of oxygen concentration, implicitly to the appearance of anionic voids and/or other types of crystalline defaults, for example dislocations.
Figure 3. The dependency of the square of FWHM of diffraction peaks vs. the square of inter-planar spacing.
Applsci 05 01665 g003
Figure 4. Variation of the unit cell volume of Zr1-xCexO2 vs. Ce concentration (x). Z—the number of molecules in the unit cell.
Applsci 05 01665 g004
Figure 5. The dependency of microstrain, ε, on the concentration of Ce ions (x).
Applsci 05 01665 g005
Figure 6. The dependence of Zr-O distances vs. the Ce concentration (x).
Applsci 05 01665 g006
XRD data were obtained from the surface of the bulk samples and correspond to the structure of a thin layer (see Table 3). The common phase for these samples has a tetragonal structure, P42/nmc. For a concentration x = 0.09, we observed a mixture of tetragonal (P42/nmc, SG 137) and monoclinic (P21/c, SG 14) phases (see Table 1).
Table 3. Lattice constants (a, b, c, β), unit cell volume (Vcell), average size of crystalline blocks (L), microstrains (ε), and calculated densities (ρcal,phase) and observed densities (ρcal,sample) of each phase and each Zr1-xCexO2 (x = 0.9–0.17) sample at room temperature, obtained by processing the data collected with the Bruker Advance diffractometer (XRD data).
ParametersCe Concentration x
x = 0.09x = 0.13x = 0.17
Monoclinic P21/cTetragonal P42/nmcTetragonal P21/cTetragonal P42/nmcTetragonal P42/nmc
a, (Å)5.1959 ± 0.00013.6218 ± 0.00015.1933 ± 0.00013.6269 ± 0.00013.6442 ± 0.0001
b, (Å)5.2161 ± 0.00013.6218 ± 0.00015.2247 ± 0.00013.6269 ± 0.00013.6442 ± 0.0001
c, (Å)5.3698 ± 0.00015.2170 ± 0.00015.3803 ± 0.00015.2431 ± 0.00015.2440 ± 0.0001
β, °98.93 ± 0.0190.098.93 ± 0.0190.090.0
Vcell/Z, (Å3)35.94034.21736.05434.41734.824
L, (Å)132035411376051606
ε, (%)0.070.0860.0270.0510.036
Rwp, %10.511.49.2
ρcal,phase (kg/m3)56937747567577957798
Volume fraction0.90 ± 0.030.10 ± 0.030.84 ± 0.020.16 ± 0.021.00
ρcal,sample (kg/m3)589860147798
The distances Zr-O for each phase and Ce concentration were calculated by using the position of cations and anions in the unit cells (see Table 4). The average size of crystalline blocks and the microstrains were obtained by using the Williamson-Hall plot. For the calculated density of the samples (see Table 3) we take account of the monoclinic and tetragonal phase concentrations.
Table 4. Atomic positions, isotropic thermal parameters, and Zr-O distances of Zr1-xCexO2 (x = 0.9–0.17) calculated using the Rietveld method from XRD data. (P 21/c: Zr (4e) (xyz); O1 (4e) (x,y,z); O2 (4e) (x,y,z); P 42/nmc: Zr (2a) (0.75, 0.25, 0.75); O (4d) (0.25, 0.25, z).
Atomic ParametersCe Concentration x
x = 0.09x = 0.13x = 0.17
P21/cP42/nmcP21/cP42/nmcP42/nmc
Zr/Cex0.2953 ± 0.00020.750000.2885 ± 0.00010.750000.75000
y0.0287 ± 0.00010.250000.0227 ± 0.00010.250000.25000
z0.2277 ± 0.00030.750000.2463 ± 0.00030.750000.25000
Biso2)0.400 ± 0.0000.407 ± 0.0000.412 ± 0.0000.410(0)0.433(0)
O1x0.0640 ± 0.00010.250000.0630 ± 0.00010.250000.25000
y0.3291 ± 0.00030.250000.3301 ± 0.00030.250000.25000
z0.3291 ± 0.00010.04654 ± 0.00010.3281 ± 0.00010.0467 ± 0.00010.0203 ± 0.0001
Biso2)0.704 ± 0.0010.246 ± 0.0030.860 ± 0.002)0.419 ± 0.0010.519 ± 0.001
O2x0.4251 ± 0.0001-0.4291 ± 0.0001--
y0.7561 ± 0.0002-0.7610 ± 0.0001--
z0.4844 ± 0.0003-0.4801 ± 0.0001--
Biso2)0.800 ± 0.000-0.920 ± 0.000--
dZr-O1(Å)2.1946-2.2210--
dZr-O2(Å)2.2135-2.2387--
dZr-O(Å)-2.1933-2.19872.2257
As observed, including for large Ce ion concentration, in the layer from the surface of the samples corresponding to x = 0.09 and x = 0.13 a tetragonal phase appears concomitantly with the monoclinic phase (see Table 3 and Figure 7). As shown in Figure 7, we can observe that the samples contain a small amount of unknown phases.
The variation of the lattice constants and the unit cell volume, corresponding to the thin layer from the samples surface as a function of the substitution of Zr with Ce, is similar to the variation of the lattice constant observed for the entire sample volume (see Table 1 and Table 3). An investigation related to the difference between the chemical composition at the surface and inside the sample is ongoing.

3.2. Resonant Ultrasound Spectroscopy

In order to determine mechanical properties of a compact specimen (in our case a ceramic cylinder), the resonance structure is scanned by RUS [22,23,29,33]. This analysis comes in completion and adds more information related to the structural analysis performed above. In comparison to other ultrasound methods, resonant techniques are particularly interesting because they allow for easy and inexpensive detection of both internal and surface defects with a single test and it has a suite of advantages, among them is its applicability to small volume specimens. RUS is based on the principle that the mechanical resonant response of solids depend strongly on its elastic moduli, shape, and density. Resonant (or natural) frequencies of a system can be either measured or calculated by solving equations of motion for the known shape [34]. The reverse is also true: if resonant frequencies of an object are known, its elastic properties can be determined [23,34,35].
Figure 7. X-ray diffractograms corresponding to (a) x = 0.09; (b) x = 0.13; (c) x = 0.17; (d) difractograms presenting the dependence of intensity (I) on interplanar distances (d) and Ce concentration (x). The vertical bars correspond to the monoclinic (M) and tetragonal (T) phases (FullProf program was used for determination of parameters). SP represents the foreign phase.
Applsci 05 01665 g007
Inhomogeneity in an object may be identified from a resonant frequency spectrum by resonant frequency shifts, peak splitting, increases in peak width, and changes in amplitude. The method is based on the estimation of resonant eigenfrequencies [27], based on an eigenvalue and eigenfunction method [26]. For these, we have used an equipment configuration as the one shown in Figure 1. The ceramic sample is supported by two piezoelectric ultrasound transducers, for emission and reception respectively, placed at opposite edges of the ceramic cylinders. The resonance spectra were traced for the cylindrical samples noted corresponding to x = 0.09, 0.13 and 0.17 Ce concentrations in the samples (π2, π3, π4), whose properties have been presented in Table 4. Due to the fact that the samples π2–π4 are axisymmetric, isotropic, and homogeneous [25], we can conclude that every mode observed on samples must fall into the following three categories [33]:
  • Torsional axisymmetric pure share motion consisting of rigid rotation of rings of materials around the sample axis. The frequency of these modes depend strongly on the sample’s shear velocity
  • Extensional axisymmetric mixtures of compression and shear modulus
  • Flexural modes along paths that are tilted with respect to the cylinder axis. These modes occur in pairs named doublets, with the same resonance frequency.
Figure 8 shows the resonance spectra for the samples π2–π4 in the frequency range 80 kHz to 250 kHz. The RUS spectrum describes a large amplitude response detected when the frequency corresponds to one of the samples eigenfrequencies.
Figure 8. Resonance ultrasound spectra for samples π2–π4.
Applsci 05 01665 g008
Figure 9 describes the typical response of one from the three tested samples, namely π2, in a frequency range comprised between 80 and 250 kHz chosen based on our preliminary analysis performed on similar materials.
Figure 9. Resonant modes for sample π2: (a) extensional mode, f = 163 kHz; (b) extensional mode, f = 185 kHz; (c) flexural mode f = 208 kHz; (d) flexural mode f = 214 kHz.
Applsci 05 01665 g009
It is immediately observed that for the three samples, there is a pronounced amplitude response in intervals of frequency corresponding to the samples eigenfrequency. The amplitude responses in the swept frequency range are in tight connection to the sample’s properties, especially the ones related to the density. The maximum displacements appear as red patches in the above representations, the intermediate ones appear in yellow and green and the minimum ones appear in blue. It is noticeable that for the analyzed frequencies, the maximum displacements take place at the edges of the cylinders in opposite directions, with a minima in the middle of the samples.
The eigenfrequency intervals exhibit a slight shift towards smaller values as the density of the samples decrease (see Table 3 and Figure 8). Resonant ultrasound spectroscopy is a reliable technique for monitoring structural modifications related to samples density.
In Figure 9, we are showing the simulation of deformations for two extensional modes (a,b) and two flexural modes (c,d) for sample π2. The simulations have been made using the finite element method using SolidWorks 2011 (Dassault Systèmes SolidWorks Corporation, Waltham, MA, USA), Simulation-Frequency toolbox [36] using a solid mesh type, curvature based mesher, with a total number of 13145 nodes and 8777 total elements.
The resonance frequencies obtained by simulations could give us information similarly to the ones experimentally obtained, that could be chosen at full width at half maximum of the amplitude [33]. It is important to specify that the simulated information is useful in order to determine which of the resonances are observables for an investigated spectrum. The inversion of data has been used in order to determine the elastic properties from the measured resonance spectra, using the conjugate gradient method with minimizing the objective function [33]:
F = i w i ( f i ( p ) f i ( m ) ) 2
here, f(p) and f(m) are the computed and respective measured frequencies, respectively; wi are the measured weights, which describe the confidence in the performed measurements.
The optimization problem has been numerically computed in Matlab 2013a. Due to the fact that the number of peaks and the corresponding frequencies is relatively small, the inversion was only applied to determine the Elastic (E) and shear (G) moduli and not the geometrical dimensions and densities of the cylindrical samples made from zirconia.
An increase of the relative density with Ce concentration takes places (see Table 5). We considered that a decrease of the pores concentration takes place with the increase of the Ce concentration in the samples.
Table 5. Some crystallographic and mechanical characteristics of Zr1-xCexO2 samples.
Ce concentration (x)Molecular MassCrystallographic StructureRelative Density (%)Elasticity Modulus (GPa)Shear Modulus (GPa)Poisson Ratio
0.09127.62Monoclinic + tetragonal88.9145.8556.490.291
0.13129.58Monoclinic + tetragonal94.7168.5364.470.307
0.17131.53tetragonal99.9193.4373.160.322

3.3. Microhardness Measurements

Microhardness measurements were performed on both natural (as sintered) faces of the samples and the resulting face after cutting with a diamond wire. The Vickers microhardnesses increase with the increase of the Ce concentration in the samples. On other hand, the micro-hardness of the sample corresponding to the natural face is smaller than those obtained from the cutting face, except those corresponding to the sample with x = 0.17 (see Table 6). The results are in agreement with the literature data.
Table 6. Results of microhard ness measurements (x—nominal Ce concentration in the samples; S—the surface area of the resulting indentation; h—indentation depth; HV—microhardness of the sample).
Results Corresponding to the Natural FaceResults Corresponding to the Face after Cutting with Diamond Wire
xS (μm2)H (μm)HV (GPa)xS (μm2)H (μm)HV (GPa)
0.0954.471.49.0 ± 0.70.0953.391.49.2 ± 0.7
0.1337.601.213.0 ± 0.10.1334.511.114.2 ± 0.7
0.1722.430.921.9 ± 0.60.1727.181.018.0 ± 0.7
For the samples with x > 0.09 we observe a larger microhardness on the face after cutting as comparing with those corresponding to the natural face. It is observable that the results related to the hardness measurements from the sample having a concentration x = 0.17 are slightly different compared to the other two concentrations, before and after the mechanical cutting is made. A possible explanation can be that, once the cutting of the natural (original) phase is made, a micro-crack could have appeared on the surface of this sample, the measured hardness being lower on a damaged surface, a result in agreement with literature observations [37].
We performed the chemical analysis on the surface of the samples and on the surface of fractured samples (see Table 7). The results confirmed that the increase of the Ce concentration will produce an increase of unit cell volumes of monoclinic and the tetragonal phases, respectively (see Table 1 and Table 3), in agreement with the literature. On other side, we observed that for the same sample the unit cell volumes will increase from the surface to the inner part (see Table 1 and Table 3). It is not clear if we have a continuous decrease of Ce concentration from inner side to the surface of the sample or only the surface layer has another chemical composition as compared with the inner side.
Table 7. The chemical composition from EDX measurements (see Figure S1).
Nominal CompositionChemical Composition at the Surface of the SamplesChemical Composition at the Surface Obtained after Fracture
Zr0.91Ce0.09O2Zr0.88±0.03Ce0.12±0.03O1.82±0.03Zr0.84±0.03Ce0.16±0.03O2.00±0.03
Zr0.87Ce0.13O2Zr0.85±0.03Ce0.15±0.03O2.00±0.03Zr0.79±0.03Ce0.21±0.03O2.00±0.03
Zr0.83Ce0.17O2Zr0.79±0.03Ce0.21±0.03O2.00±0.03Zr0.75±0.03Ce0.25±0.03O2.00±0.03

4. Conclusions

The substitution of the Zr with Ce in Zr1-xCexO2 leads to a change of the phase composition, a gradual transition from the monoclinic to tetragonal structure. Concerning the substitution of Zr with Ce we observed a difference of the phase composition between the surface layer of the sample and the phase composition of the bulk samples. We attributed this difference to the various oxygen concentration in the surface layer and in the bulk sample. The investigations performed by means of neutron diffractometry, which “viewed” a large volume of the samples, indicated a transition from the monoclinic to tetragonal phase for x = 0.09. On other hand, XRD investigations, which “viewed” only a thin layer have shown that the phase composition of the samples corresponding to x = 0.09 and 0.13 represents a mixture between a monoclinic phase and a tetragonal phase, the tetragonal phase concentration increasing with the increase of Ce concentration. The unit cell volumes of the tetragonal and monoclinic phases and Zr-O distances increase with the increase of Ce concentration, for the inner part of the samples. The calculated and measured densities increase also with the increase of Ce concentration. A maximum of the average size of coherent blocks and of the microstrain appear in the tetragonal phase for the sample with x = 0.13. The increase of Ce concentration leads also to an increase of the volumes of both monoclinic and tetragonal unit cells. From the variation of unit cell volume of the surface layer, compared with those corresponding to the unit cell volume of the sample core, we conclude that a small but systematic decrease of the large radii cation concentration takes place at the surface layer. An increase of the relative density and of the mechanical parameters (elasticity and shear moduli) was obtained with the increase of Ce concentration.
RUS is a reliable technique, which emphasizes the eigenfrequency intervals which exhibit a slight change as a function of samples composition, for monitoring structural modifications related to sample density. Slight material anisotropy leads to splitting of the higher modes but not of the fundamental torsion mode. In the case of the studied samples, whose ratio is around the unit, the interpretation is favorable because the torsional mode is the lowest one, well separated from the others for ν > 0, allowing immediate extraction of the shear modulus and its damping. The initiation of fracture of ceramic elements can be due to the presence of low density zone-containing dispersed high density agglomerates in the volume and any deformation which will be immediately apparent through changes in the resonance modes, with deviations from the normal spectrum. RUS can be used for quality control of certain ceramic elements of hip prosthesis, such as femoral heads. If the elements are incorrectly sintered, with a density smaller than the prescribed value and the elastic and shear moduli smaller, important modifications appear in the shape of the spectrum and the resonance frequencies.
Future research in this area should concentrate on the SEM analysis concerning the ceramic samples, whose aspects change dramatically with increasing concentrations of Ce ions, an effect which needs to be further analyzed in a future study.

Supplementary Files

Supplementary File 1

Acknowledgments

This work was supported by a grant of the Ministry of National Education, National Research Council (CNCS)—Executive Unit for Financing Higher Education, Research, Development and Innovation (UEFISCDI), project number PN-II-ID-PCE-2012-4-0437 and bilateral cooperation with JINR Dubna by the grant “Zirconia doped with transition metals. Synthesis, electric and magnetic properties”, protocol 04-4-1121-2015/2017.

Author Contributions

Adriana Savin wrote of the paper, except the parts which concern the results corresponding to the ND experiments (written by Vitalii Turchenko) and XRD experiments (written by Mihail-Liviu Craus). Valerii V.Burkhovetsky has made EDX measurements. Tatiana E. Konstantinova had obtained the samples. Alina Bruma, Pierre-Antoine Dubos, and Sylvie Malo have made hardness measurements and analyzed the experimental data. All authors have participated in analysis and comments of the results. All of the authors read and approved the final manuscript.

Conflicts of Interest

The authors declare no conflict of interest.

References

  1. Guazzato, M.; Albakry, M.; Ringer, S.P.; Swain, M. Strength, fracture toughness and microstructure of a selection of all-ceramic materials. Part II. Zirconia-based dental ceramics. Dent. Mater. 2004, 20, 449–456. [Google Scholar] [CrossRef] [PubMed]
  2. Panadero, R.A.; Roman-Rodriguez, J.L.; Ferreiroa, A.; Sola-Ruiz, M.F.; Fons-Font, A. Zirconia in fixed prosthesis. A literature review. J. Clin. Exp. Dent. 2014, 6, 66–73. [Google Scholar] [CrossRef] [PubMed]
  3. Badwal, S.P.S.; Giddey, S.; Munnings, C.; Kulkarni, A. Review of Progress in High Temperature Solid Oxide Fuel Cells. J. Aust. Ceram. Soc. 2014, 50, 23–37. [Google Scholar]
  4. Ashton Acton, Q. Electrolytes: Advances in Research and Application; Scholarly Editions: Atlanta, GA, USA, 2011. [Google Scholar]
  5. Juškevičius, K.; Audronis, M.; Subačius, A.; Drazdys, R.; Juškėnas, R.; Matthews, A.; Leyland, A. High-rate reactive magnetron sputtering of zirconia films for laser optics applications. Appl. Phys. A 2014, 116, 1229–1240. [Google Scholar] [CrossRef]
  6. D’Antonio, J.A.; Capello, W.N.; Naughton, M. Ceramic bearings for total hip arthroplasty have high survivorship at 10 years. Clin. Orthop. Relat. Res. 2012, 470, 373–381. [Google Scholar] [CrossRef] [PubMed]
  7. Bal, B.S.; Garino, J.; Ries, M.; Rahman, M.N. A review of ceramic bearing materials in total joint arthroplasty. Hip Int. 2007, 17, 21–30. [Google Scholar] [PubMed]
  8. Mercer, P.D.L.; van Ommen, J.G.; Doesburg, E.B.M.; Burgraff, A.J.; Ross, J.R.H. Zirconia as a support for catalysts Influence of additives on the thermal stability of the porous texture of monoclinic zirconia. Appl. Catal. 1991, 71, 363–391. [Google Scholar] [CrossRef]
  9. Depprich, R.; Zipprich, H.; Ommerborn, M.; Naujoks, C.; Wiesmann, H.P.; Kiattavorncharoen, S.; Lauer, H.C.; Meyer, U.; Kubler, N.; Handschel, J. Osseointegration of zirconia implants: An SEM observation of the bone-implant interface. Head Face Med. 2008, 4, 1–8. [Google Scholar] [CrossRef] [PubMed]
  10. French, R.H.; Glass, S.J.; Ohuchi, F.S.; Xu, Y.-N.; Ching, W.Y. Experimental and theoretical determination of the electronic structure and optical properties of three phases of ZrO2. Phys. Rev. B 1994, 49, 5133. [Google Scholar] [CrossRef]
  11. Okabayashi, S.; Kono, S.; Yamada, Y.; Nomura, K. Fabrication and magnetic properties of Fe and Co co-doped ZrO2. AIP Adv. 2011, 1. [Google Scholar] [CrossRef]
  12. Bechepeche, A.P.; Treu, O.; Longo, E. Experimental and theoretical aspects of the stabilization of zirconia. J. Mater. Sci. 1999, 34, 2751–2756. [Google Scholar] [CrossRef]
  13. Zhu, W.Z. Effect of cubic phase on the kinetics of the isothermal tetragonal to monoclinic transformation in ZrO2 (3 mol% Y2O3) ceramics. Ceram. Int. 1998, 24, 35–43. [Google Scholar] [CrossRef]
  14. Li, P.; Chen, I.; Penner-Hahn, J.E. Effect of Dopants on Zirconia Stabilization—An X-ray Absorption Study: I, Trivalent Dopants. J. Am. Ceram. Soc. 1994, 77, 1289–1295. [Google Scholar] [CrossRef]
  15. ISO 13356–2015—Implants for surgery—Ceramic materials based on yttria-stabilized tetragonal zirconia. Available online: http://www.iso.org/iso/home/store/catalogue_ics/catalogue_detail_ics.htm?ics1=11&ics2=040&ics3=40&csnumber=62373 (accessed on 18 September 2015).
  16. Samuels, L.E. Metallographic Polishing by Mechanical Methods, 4th ed.; ASM International: Novelty, OH, USA, 2003. [Google Scholar]
  17. Crystallography Open Database. Available online: http://www.crystallography.net (accessed on 15 September 2015).
  18. Kraus, W.; Noltze, G. Noltze, Powder Cell for Windows, 2.4; Federal Institute for Materials Research and Testing: Berlin, Germany, 2000. [Google Scholar]
  19. Balagurov, A.M. Scientific Reviews: High-Resolution Fourier Diffraction at the IBR-2 Reactor. Neutron News 2005, 16, 8–12. [Google Scholar] [CrossRef]
  20. Bruno, G.; Efremov, A.M.; Clausen, B.; Balagurov, A.M.; Simkin, V.N.; Wheaton, B.R.; Webb, E.J.; Brown, D.W. On the stress-free lattice expansion of porous cordierite. Acta Mater. 2010, 58, 1994–2003. [Google Scholar] [CrossRef]
  21. Hauk, V. Structural and Residual Stress Analysis by Non-Destructive Methods; Elsevier: Amsterdam, the Netherlands, 1997. [Google Scholar]
  22. Visscher, W.M.; Migliori, A.; Bell, T.M.; Reinert, R.A. On the normal modes of free vibration of inhomogeneous and anisotropic elastic objects. J. Acoust. Soc. Am. 1991, 90, 2154–2162. [Google Scholar] [CrossRef]
  23. Migliori, A.; Sarrao, J.; Visscher, W.M.; Bell, T.; Lei, M.; Fisk, Z.; Leisure, R. Resonant ultrasound spectroscopic techniques for measurement of the elastic moduli of solids. Phys. B Condens. Matter 1993, 183, 1–24. [Google Scholar] [CrossRef]
  24. Migliori, A.; Maynard, J.D. Implementation of a modern resonant ultrasound spectroscopy system for the measurement of the elastic moduli of small solid specimens. Rev. Sci. Instrum. 2005, 76. [Google Scholar] [CrossRef]
  25. Demarest, H.H., Jr. Cube-Resonance Method to Determine the Elastic Constants of Solids. J. Acoust. Soc. Am. 1971, 49, 768–775. [Google Scholar] [CrossRef]
  26. Jaglinski, T.R.; Lakes, S. Resonant ultrasound spectroscopy of cylinders over the full range of Poisson’s ratio. Rev. Sci. Instrum. 2011, 82. [Google Scholar] [CrossRef] [PubMed]
  27. Myasnikov, D.V.; Konyashkin, A.V.; Ryabushkin, O.A. Identification of eigenmodes of volume piezoelectric resonators in resonant ultrasound spectroscopy. Tech. Phys. Lett. 2010, 36, 632–635. [Google Scholar] [CrossRef]
  28. Carter, C.B.; Norton, M.G. Ceramic Materials, 2nd ed.; Springer: New York, NY, USA, 2013. [Google Scholar]
  29. Migliori, A.; Sarro, J.L. Resonant Ultrasound Spectroscopy: Applications to Physics, Materials Measurement and Nondestructive Evaluation; Wiley: New York, NY, USA, 1997. [Google Scholar]
  30. Rodriguez-Carvajal, J. Recent advances in magnetic structure determination by neutron powder diffraction. Phys. B Condens. Matter 1993, 192, 55–69. [Google Scholar] [CrossRef]
  31. Shannon, R.T. Revised effective ionic radii and systematic studies of interatomic distances in halides and chalcogenides. Acta. Crystallogr. Sect. A 1976, 32, 751–767. [Google Scholar] [CrossRef]
  32. Howard, C.J.; Hill, R.J.; Reichert, B.E. Structures of ZrO2 polymorphs at room temperature by high-resolution neutron powder diffraction. Acta. Crystallogr. Sect. B Struct. Sci. 1988, 44, 116–120. [Google Scholar] [CrossRef]
  33. Zadler, B.J.; le Rousseau, J.H.; Scales, J.A.; Smith, M.L. Resonant ultrasound spectroscopy: Theory and application. Geophys. J. Int. 2004, 156, 154–169. [Google Scholar] [CrossRef]
  34. De Silva, C.W. Vibration: Fundamentals and Practice; CRC Press: Boca Raton, FL, USA, 2000. [Google Scholar]
  35. Ren, F.; Case, E.D.; Morrison, A.; Tafesse, M.; Baumann, M.J. Resonant ultrasound spectroscopy measurement of Young’s modulus, shear modulus and Poisson’s ratio as a function of porosity for alumina and hydroxyapatite. Philos. Mag. 2009, 89, 1163–1182. [Google Scholar] [CrossRef]
  36. SolidWorks 2011—Simulation-Frequency Toolbox User Guide. Available online: www.solidworks.com (accessed on 18 September 2015).
  37. Wachtman, J.B.; Cannon, W.R.; Matthewson, M.J. Mechanical Properties of Ceramics; Springer International Publishing: Cham, Switzerland, 2014. [Google Scholar]

