Article

Size Effect of Silver Nanoparticles Derived from Olive Mill Wastewater in THP-1 Cell Lines

1
Department of Mathematics and Physics “Ennio De Giorgi”, University of Salento, Via Arnesano, 73100 Lecce, Italy
2
Institute for Microelectronics and Microsystems (IMM), CNR, Via Monteroni, 73100 Lecce, Italy
3
Department of Pharmaceutical Sciences (DISFARM), University of Milan, Via G. Balzaretti 9, 20133 Milan, Italy
4
University Centre for Research & Development, Chandigarh University, Mohali, Punjab 140413, India
5
Institute for Bioengineering of Catalonia (IBEC), The Barcelona Institute of Science and Technology, Baldiri Reixac 10–12, 08028 Barcelona, Spain
*
Author to whom correspondence should be addressed.
Appl. Sci. 2023, 13(10), 6033; https://doi.org/10.3390/app13106033
Submission received: 22 March 2023 / Revised: 4 May 2023 / Accepted: 12 May 2023 / Published: 14 May 2023
(This article belongs to the Special Issue Next Steps for the Production of Nanoparticles for Nanomedicine)

Abstract

:
The constant demand of silver nanoparticles (AgNPs) for different applications requires a new selection of solvents and reagents for their synthesis, to make them less toxic to living organisms and the environment. Among the alternative technologies that can be used to exclude the use of toxic products, green chemistry is based on the employment of biomolecules derived from plants or microorganisms to achieve NPs. Therefore, with the aim of applying the principles of circular economy, the waste deriving from the production of olive oil represents a useful source of polyphenols to be used as reduction agents to obtain AgNPs. In our work, we employed the Olive Mill Wastewater (OMWW), the so-called vegetation water typical of the Mediterranean geographical area, to achieve two sizes of AgNPs, i.e., 50 nm and 30 nm. These NPs were tested on the human monocytic cell line (THP-1) using two concentrations (3 µM and 5 µM) to understand their ability to trigger or not the inflammatory response. This was undertaken following IL-6, IL-8, IL-5 and TNF-α secretion and the NF-kB translocation. We concluded that the AgNPs did not induce strong activation of these pathways, especially when the cells were treated with higher dimensional NPs. Consequently, the application of these NPs in vivo for therapeutic purpose could be significant.

1. Introduction

Silver nanoparticles (AgNPs) are broadly applied in the biomedical field for their antibacterial and anticancer properties [1,2,3,4]. Frequently, the use of toxic solvents could increase the NPs toxicity since the reaction residues or toxic molecules can remain adhered to the surface of the AgNPs [5]. Therefore, recent research has focused on alternative methods that require the use of extracts from agricultural wastes such as leaves or tree parts [6]. However, in the Mediterranean area, the most abundant waste is represented by the residue of oil production, namely OMWW [7]. It is a serious problem, since OMWW is characterized by a high organic pollution load, namely Chemical Oxygen Demand (COD), polyphenols and suspended solids. For this reason, this waste cannot be disposed in the environment as irrigation water [8,9]. However, the high concentration of polyphenols could be advantageous with the aim of obtaining safe metallic NPs, since these biomolecules act as reducing agents [10]. In this experimental work, we achieved AgNPs with two sizes (30 nm and 50 m), using two distinct concentrations of silver salt and OMWW. The NPs were characterized by TEM, DLS, zeta potential, UV–VIS and FTIR to know their size, morphology, surface charge and UV-Infrared absorption. Then, we used two different concentrations, 3 µM and 5 µM, of AgNPs (30 nm and 50 nm) to test their capability to trigger an inflammatory response in vitro, using macrophage cell lines (THP-1). Compared with other kinds of AgNPs achieved by the standard chemical route, our method allowed us to obtain safe AgNPs, useful for biomedical application from agricultural waste. The experimental results obtained in this work showed that both the sizes of AgNPs did not activate THP-1 in a significative manner; however, the larger size of the AgNPs was more suitable for application in vivo due to their lower capability to induce the inflammatory response. This conclusion is important because the low activation of the immune system is desirable in order to have nanocarriers which are not destroyed by immune cells once they enter into the circulatory system [11].

2. Materials and Methods

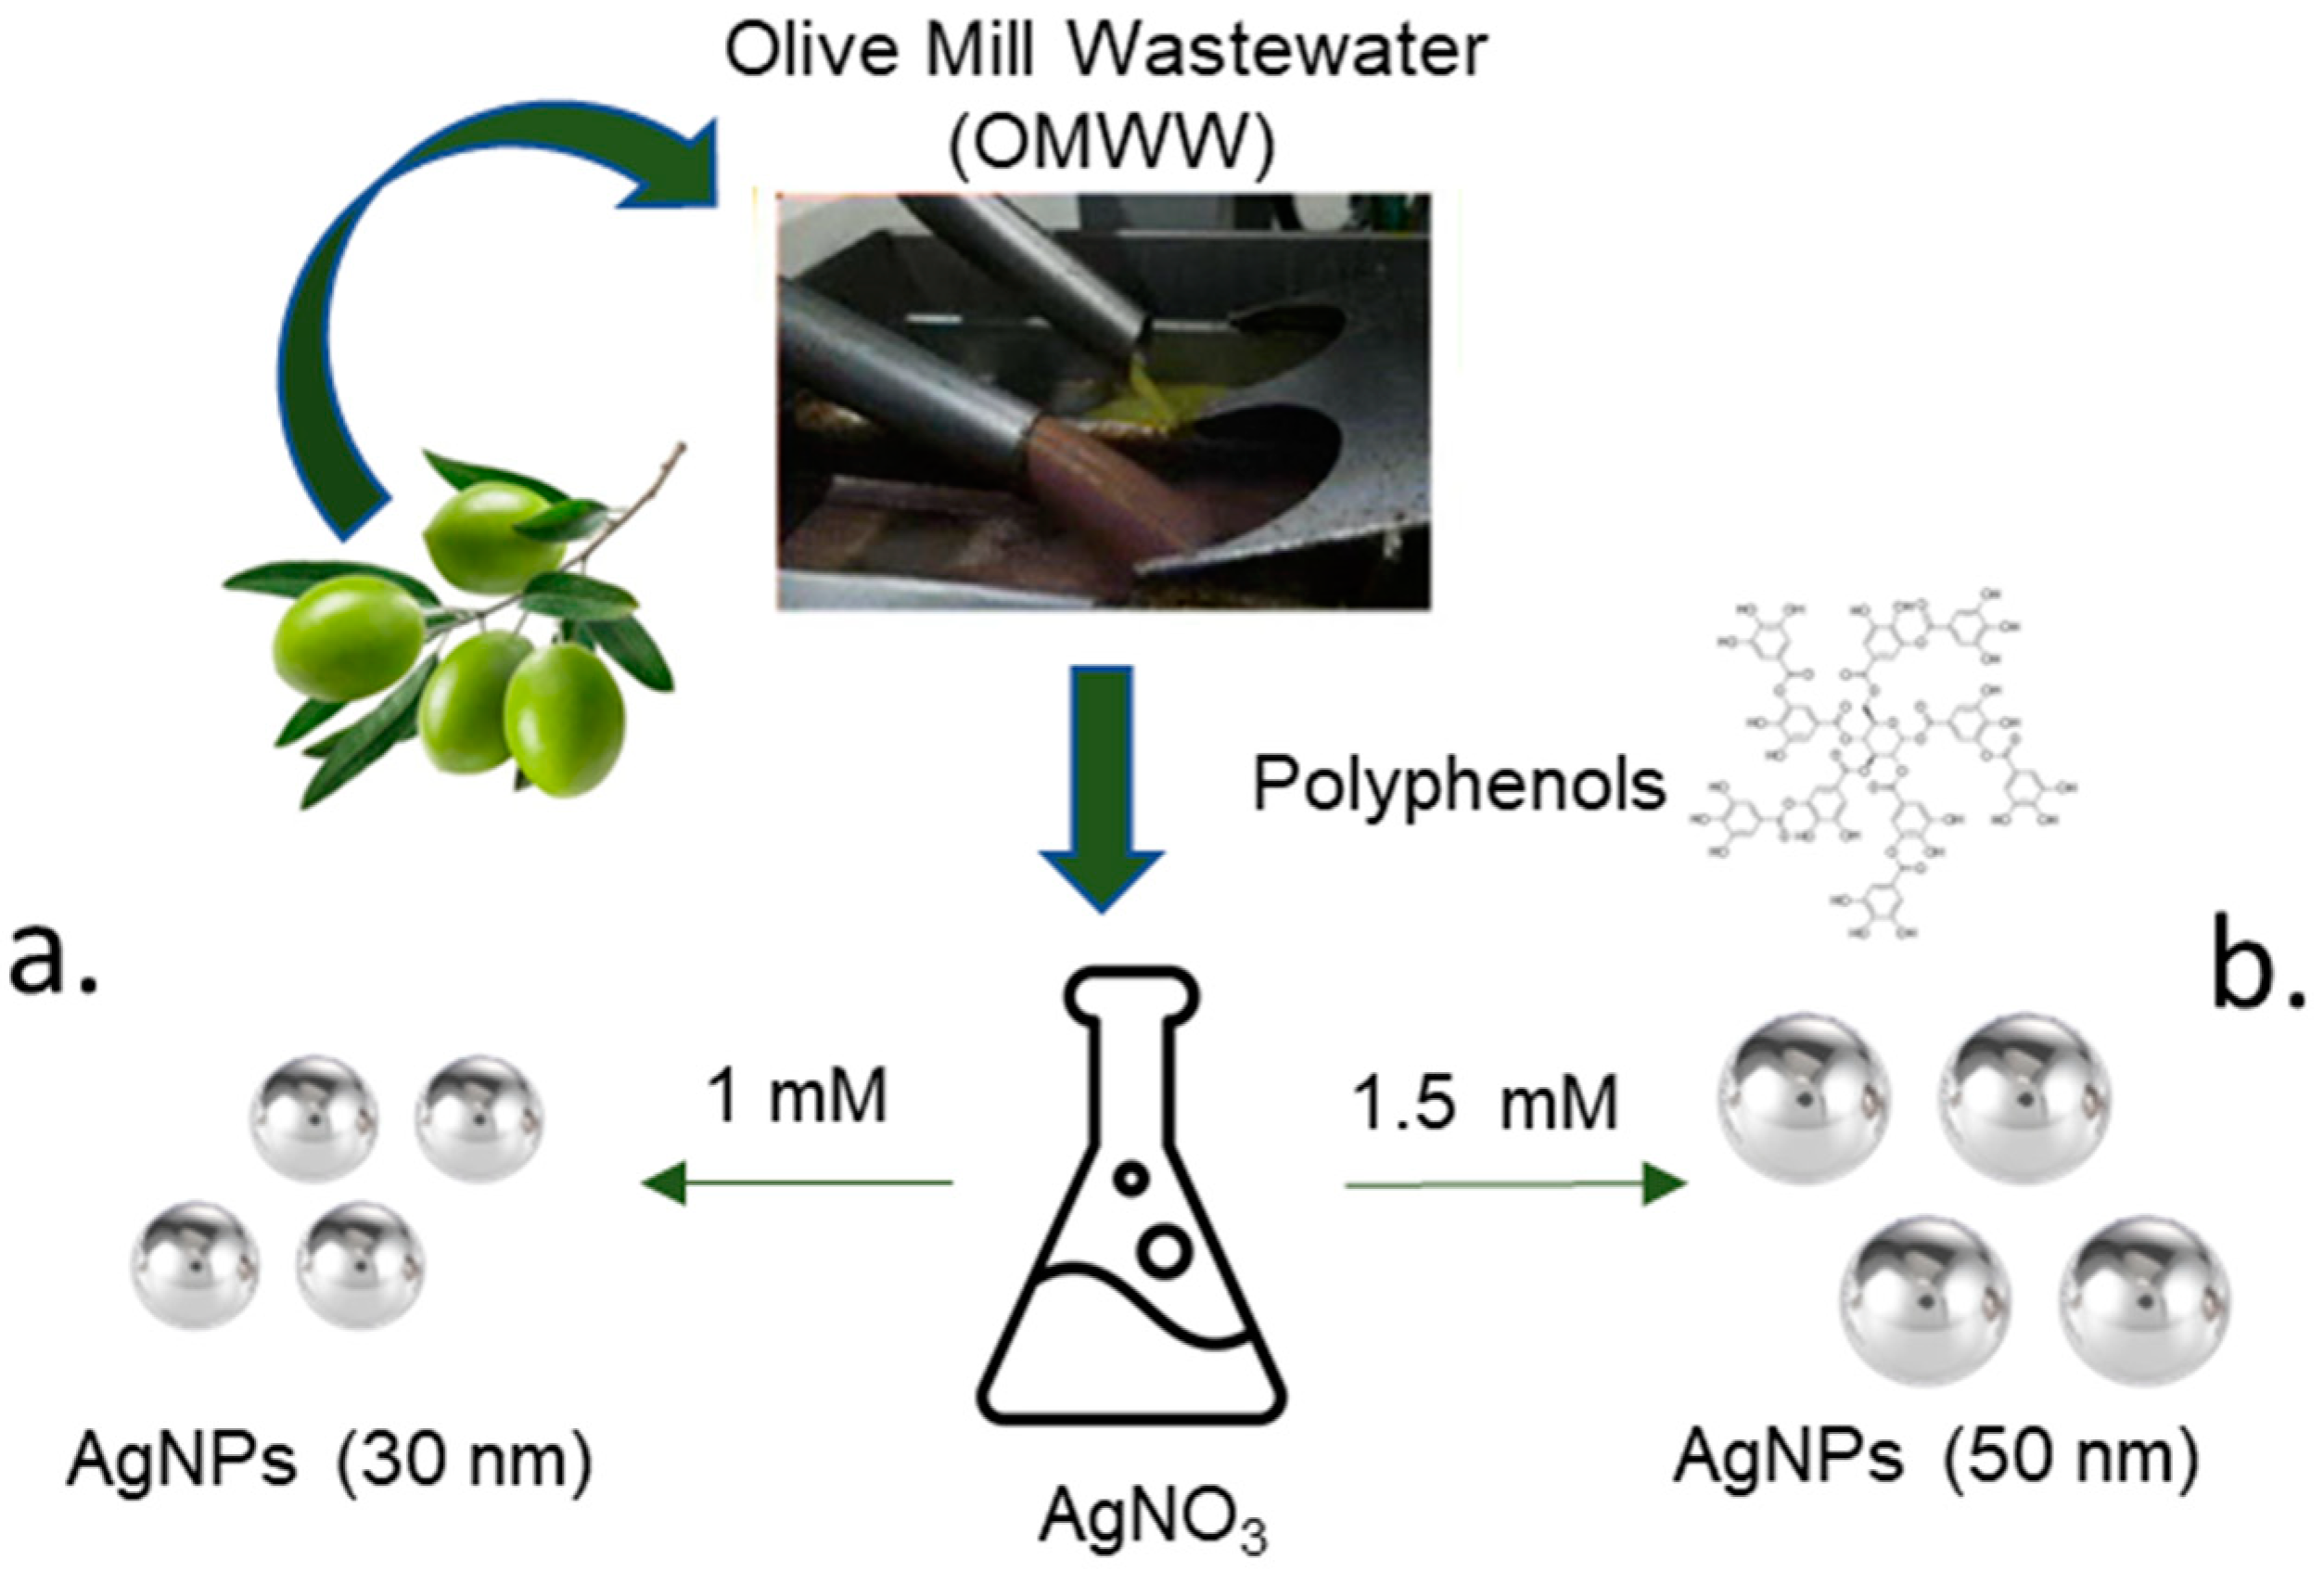
2.1. Synthesis of AgNPs (30 nm and 50 nm) from OMWW

The OMWW was provided in winter from a mill located in Salento, a geographic area in the south of Italy, and stored at 4 °C in sterile containers until use. The raw OMWW was centrifugated (1 h at 6000 rpm) to remove the solid part. After filtration, the purified OMWW was employed to obtain AgNPs. The AgNPs (30 nm) were synthesized using 5 mL of OMWW and added in an aqueous solution of AgNO3 (1 mM) (Figure 1a). For AgNPs with a size of 50 nm, 1.5 mM of AgNO3 was used (Figure 1b). The solutions were stirred at 300 rpm for 1 h at room temperature. After the synthetic route, a centrifugation step was undertaken (4000 rpm) to separate the supernatant from the pellet containing the metal NPs. The AgNPs were collected, washed by centrifugation with ethanol absolute and water (1:1) and finally kept in the dark at 4 °C.

2.2. AgNPs Concentration Measurements by Inductively Coupled Plasma–Optical Emission Spectroscopy ICP-OES

The concentrations of the two types of AgNPs synthetized using OMWW were estimated by elemental analysis using ICP-OES Perkin Elmer AVIO 500. An amount of 200 μL of the AgNPs solutions was degraded in 2 mL of HNO3 (>90%) for 24 h. Prior to analysis, the solutions containing AgNPs were diluted with MilliQ water (1:5).

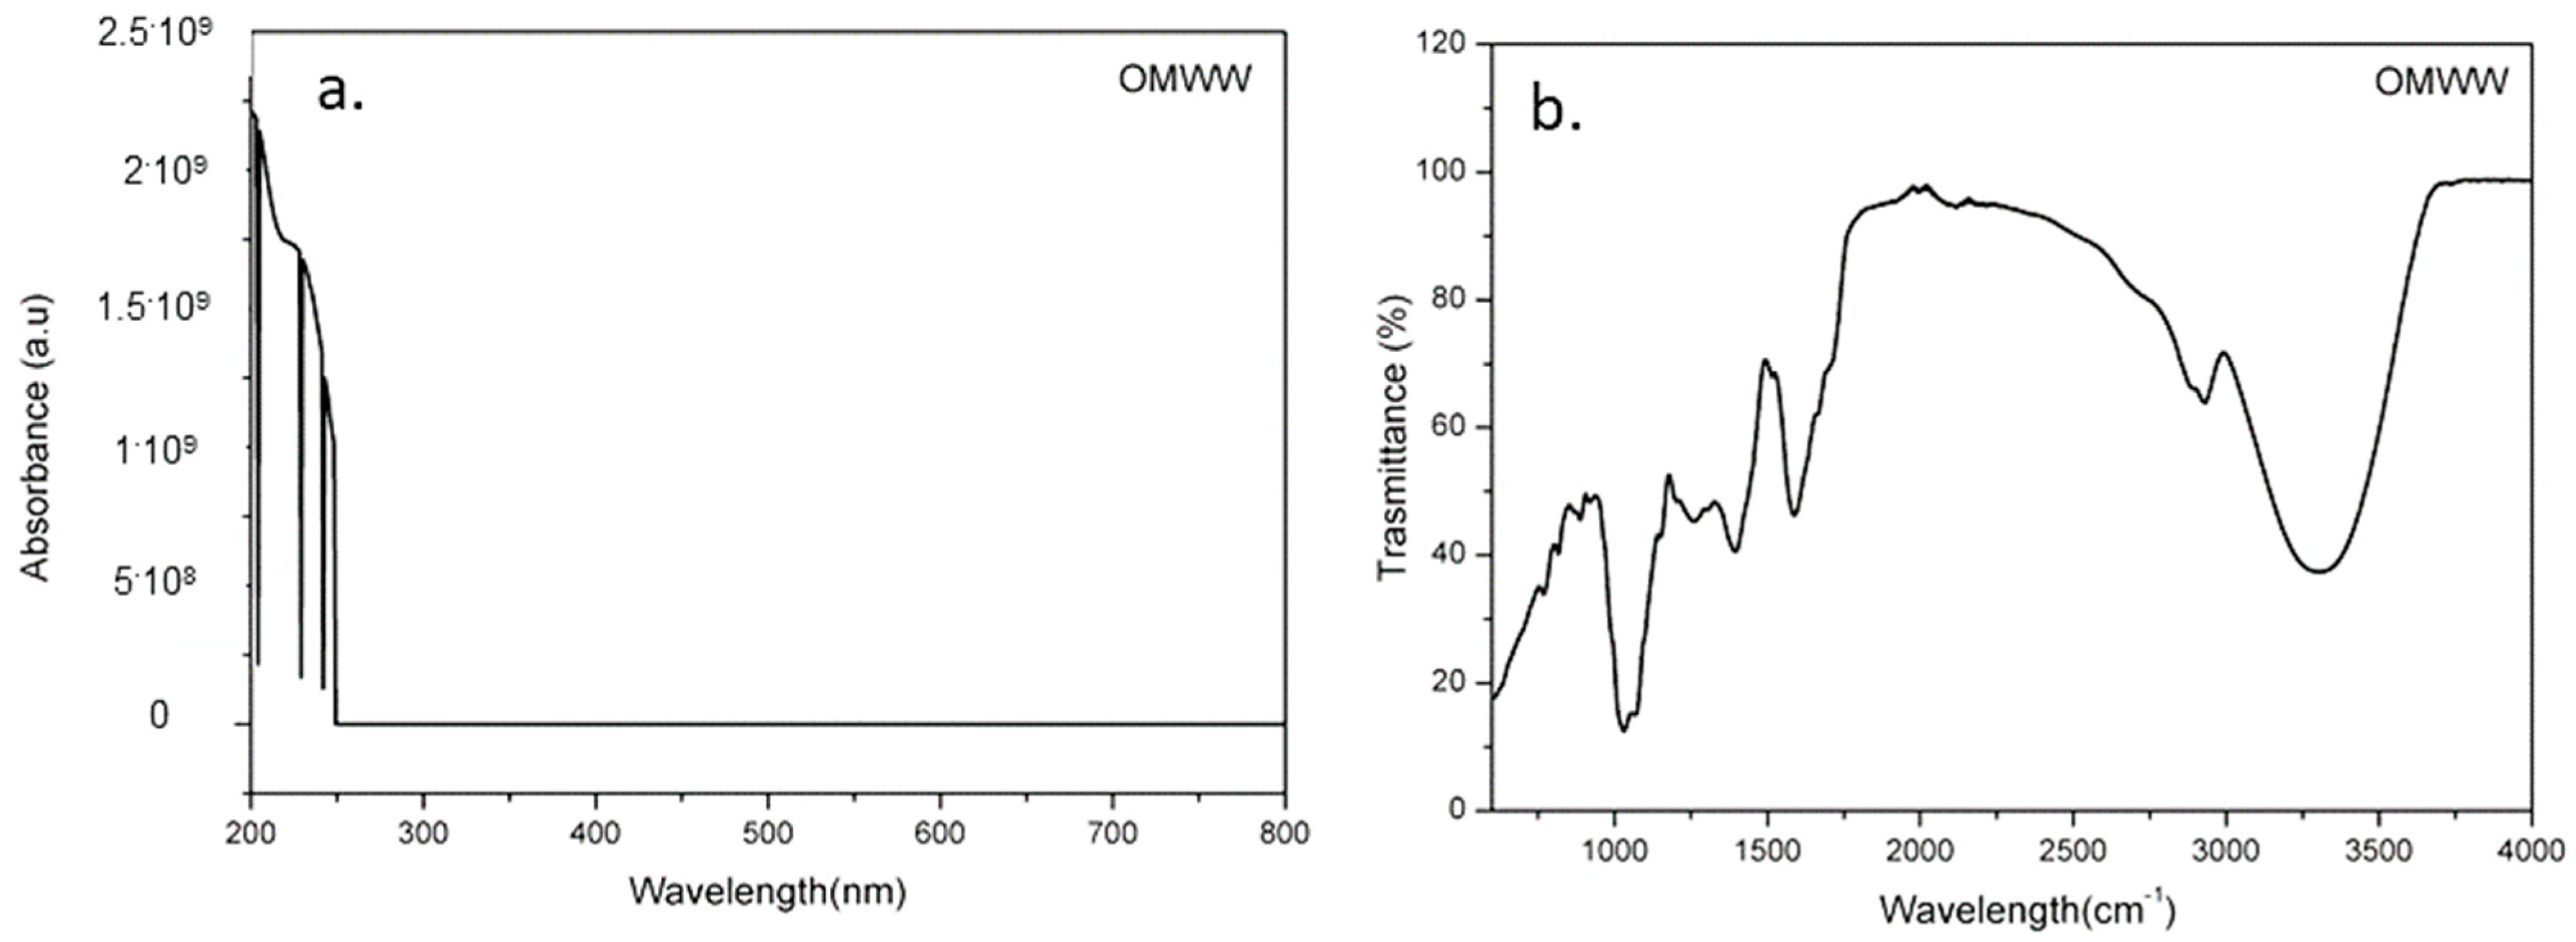
2.3. Total Polyphenols Measurements

The total polyphenolic content in OMWW was assessed by the Folin–Ciocalteu phenol reagent following the method previously described by De Matteis et al. [8]. The Folin–Ciocalteu reagent (1.8 mL) and sodium bicarbonate (7.5%) were mixed in a small amount (40 µL) of OMWW without the solid part. After 1 h in the dark, the phenolic content was measured using a Jasco V-630 spectrophotometer at 765 nm. The standard phenolic compound was represented by gallic acid used for the calibration curve construction (r2 = 0.999). The total phenolic compound amount was expressed as the residual gallic acid equivalents (mg/L of the OMWW). The data reported were expressed as the mean ± SD.

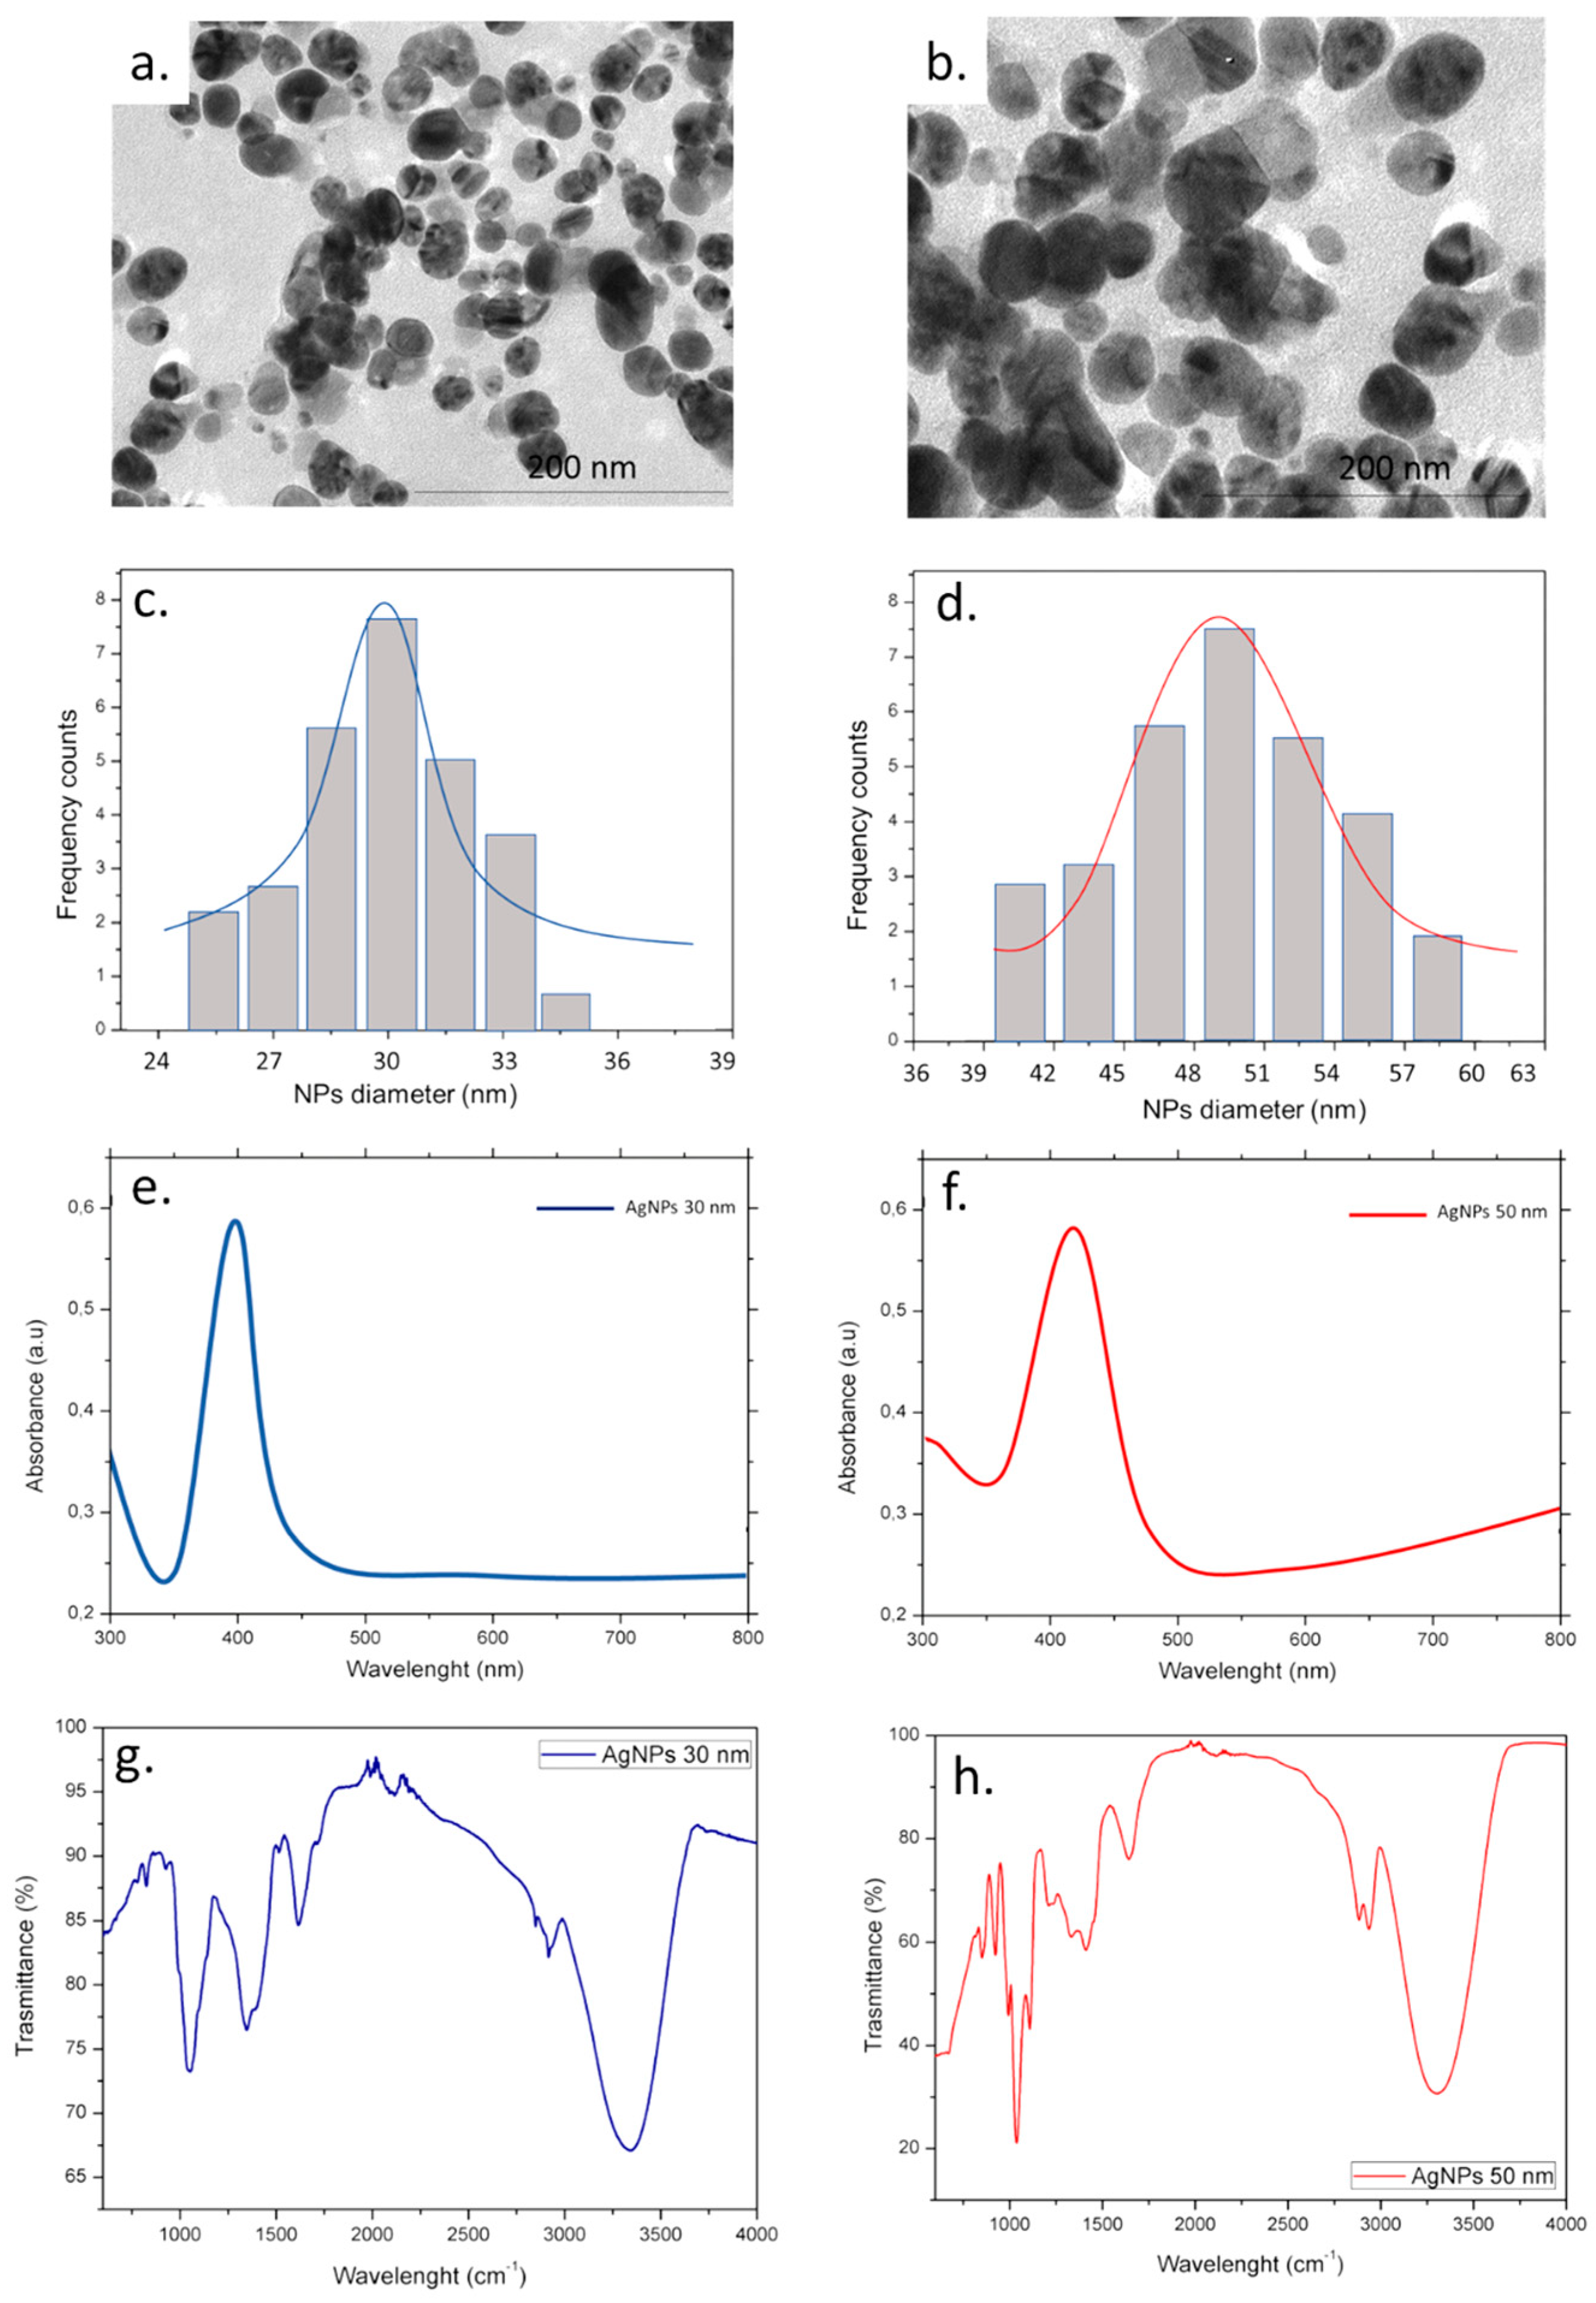
2.4. Characterization of AgNPs

Morphological analysis was carried out by Hitachi 7700 Transmission Electron Microscope (Hitachi High-Tech, Tokyo, Japan), using 100 kV; a small amount of the two AgNP solutions (with different sizes) was deposited onto 400-mesh carbon-supported copper grids by drop-casting. After drying, the samples were observed. Statistical analysis of 70 AgNPs was undertaken by ImageJ software using a Gaussian fit. The absorption spectra of 30 nm and 50 nm AgNPs were obtained using a Shimadzu-2550 with 1 cm quartz cuvettes. The DLS and ζ-potential acquisitions were acquired by a Zetasizer Nano-ZS, with a HeNe laser (4.0 mW) working at 633 nm detector (ZEN3600, Malvern Instruments Ltd., Malvern, UK), in an aqueous solution (25 °C, pH 7). The FTIR measurements (400–4000 cm−1) were performed at a resolution of 4 cm−1 using a Jasco-670 (Jasco, Tokyo, Japan).

2.5. THP-1 Culture and Differentiation Procedure

The Human Leukemic Monocytes (THP-1) (ATCC-TIB-202) were grown in RPMI-1640 with 2 mM l-glutamine, 25 mM HEPES (Sigma-Aldrich, Dorset, UK), 10% (v/v) fetal bovine serum (FBS, Sigma-Aldrich, Dorset, UK) and 1% (v/v) penicillin–streptomycin (Sigma-Aldrich, Dorset, UK). The THP-1 cells were differentiated into M0-macrophages by using 10 ng/mL of phorbol 12-myristate 13-acetate (PMA, Sigma-Aldrich, Dorset, UK) for 48 h at standard conditions (95% air and 5% CO2, at 37 °C).

2.6. In Vitro Assays
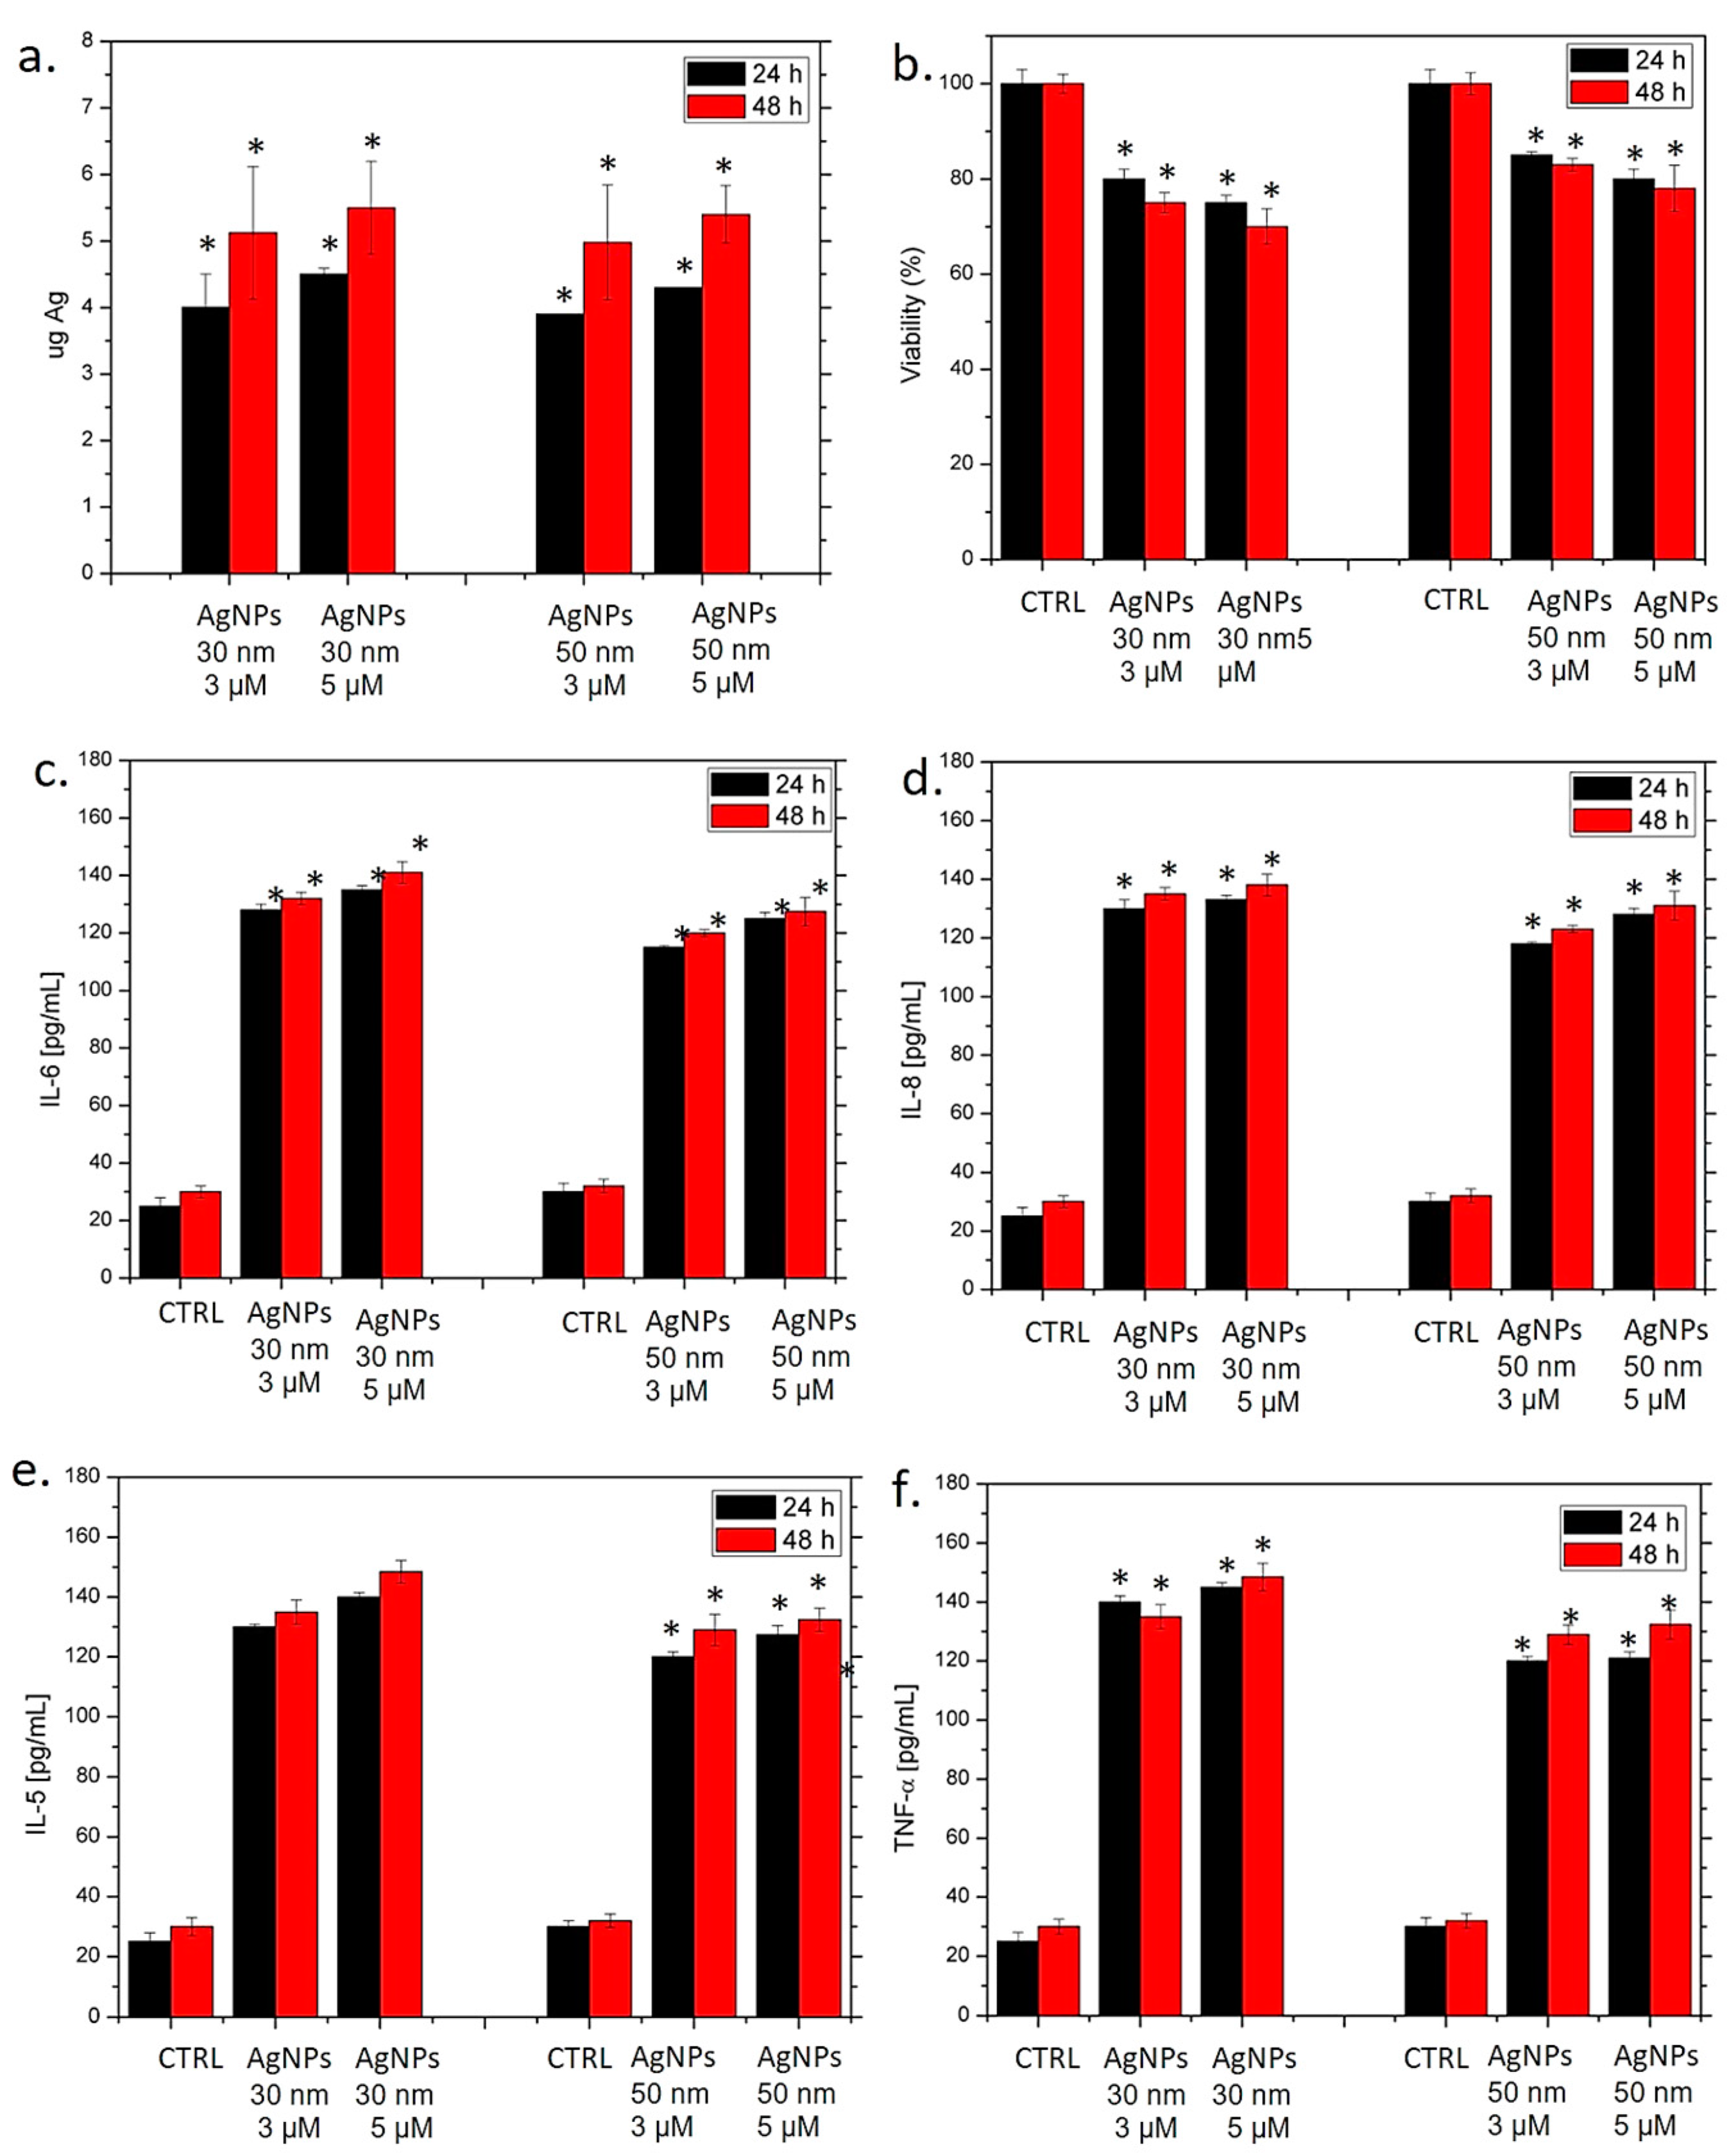
2.6.1. Uptake

Following the differentiation of the THP-1, 1 × 10⁵ cells were seeded in 1 mL of RPMI-1640. After 24 h, the medium was changed with a fresh medium in which the 30 nm and 50 nm AgNPs were dissolved at a concentration of 3 μM and 5 μM. After 24 h and 48 h, the RPMI-1640 was removed, and the cells were washed 5 times with PBS. The cells were treated with trypsin and counted with an automated cell counting system (Biorad). Then, 36 × 104 cells were digested by HNO3 after dilution in MilliQ water. The solutions were examined to estimate the Ag content using an ICP-OES Perkin Elmer AVIO 500.

2.6.2. Cell Viability, IL-6,IL-8, IL-5,TNF-α Assays

The THP-1 cells were seeded at a concentration of 5 × 10³ cells per well in 96-well plates and differentiated as previously described in 2.4. After 24 h, the cells were exposed to AgNPs solutions (AgNPs 30 nm and Ag NPs 50 nm) at concentrations of 3 µM and 5 µM for 24 h and 48 h. Then, cell viability was performed using a MTT (3-(4,5-dimethylthiazol-2-yl)-2,5-diphenyltetrazolium bromide) kit (Sigma-Aldrich, Dorset, UK) following the methodology reported in [12].
Enzyme-linked immunosorbent assay (ELISA) was used to measure the levels of the cytokines IL-6, IL-8, IL-5 and TNF-α on the THP-1 exposed to 3 μM and 5 μM of the two sizes of the AgNPs for 24 h and 48 h. The supernatants from the cultures containing 0.5 × 10⁶ cells/mL in a final volume of 1 mL was obtained by a centrifugation cycle (2000× g for 10 min). Subsequently, the cells were harvested and stored at −80 °C. Human IL-6, IL-8, IL-5 and TNF-α ELISA kits (Abcam, Cambridge, UK) were used. The quantification of cytokines was carried out by a spectrophotometer. Data were reported as mean ± SD.

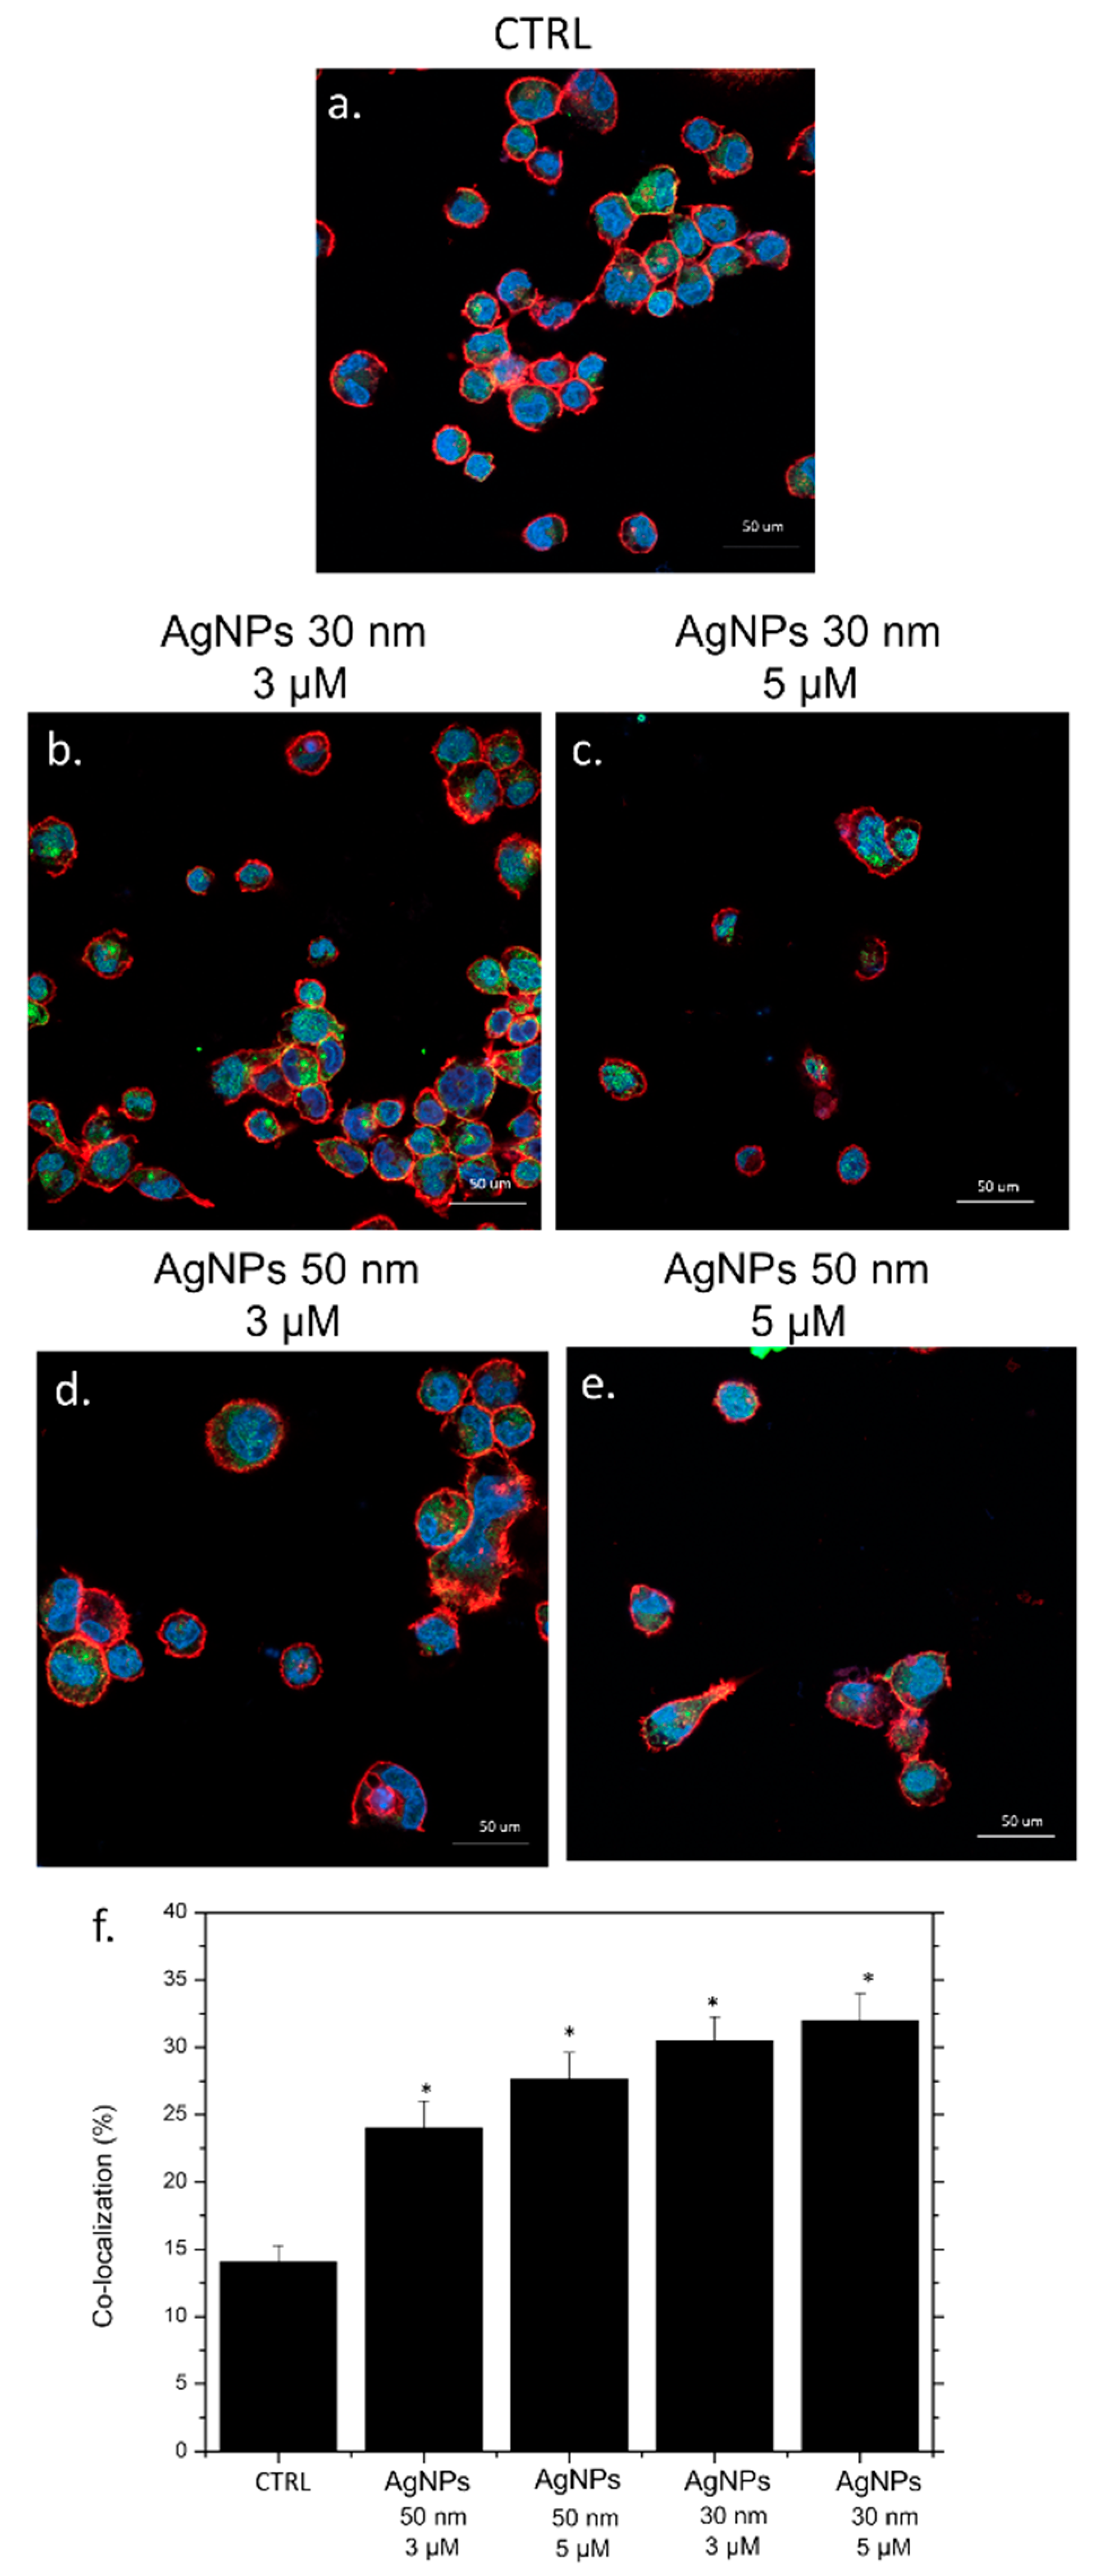
2.6.3. Confocal NF-κB Translocation Imaging and Quantification

A Confocal Laser Scanning Microscope (CLSM, Leica SP8, Milton Keynes, UK) was used to acquire images regarding NF-κB signaling. Following the THP-1 differentiation, M0 macrophages were incubated to the two sizes of AgNPs (30 nm and 50 nm) at 3 µM and 5 µM of concentrations for 24 h and 48 h in an incubator. Then, the cells were washed with PBS (Sigma-Aldrich, Dorset, UK) and fixed with 3.7% formaldehyde (Sigma-Aldrich, Dorset, UK) for 10 min at room temperature. The cell permeabilization step was carried out by Triton X (0.2%) (Sigma-Aldrich, Dorset, UK) and then, the cells were stained using NF-κB p65 Antibody (F-6) and FITC (Santa Cruz Biotechnology Inc., Heidelberg, Germany) in 1% of BSA (overnight, 4 °C).
Subsequently, the fixed cells were washed and marked with DAPI (Sigma-Aldrich, Dorset, UK) for nuclei imaging. The NF-κB nuclear translocation imaging analysis was performed by co-localization (Pierce’s coefficient values) of the NF-κB and nucleus fluorescence intensity by Fiji ImageJ software (version 2.0, National Institutes of Health, Bethesda, MD, USA). The cell membrane was marked using a CellMask™ Deep Red Plasma Membrane Stain (Thermo Fisher Scientific, Waltham, MA, USA).

2.7. Statistical Analysis

OriginPro (version 8.1) was used to perform statistical analyses. A two-tailed Student’s-test was used when the comparison was between two groups. One-way or two-way ANOVA multiple comparisons were used when three or more groups were analyzed. The differences were statistically significant when * p < 0.05.

3. Results and Discussion

OMWW is produced in large quantities in the Mediterranean area because most of the agricultural companies produce olive oil in winter [13]. However, the OMWW is characterized by a great concentration of polyphenols (up to 10 g/L) that represents a big problem for disposal. Since in the green processes polyphenols are involved to produce metallic NPs [14], this agricultural waste can be useful to obtain nanomaterials with specific physicochemical properties [15]. In general, metal oxide and metallic NPs were used to purify OMWW, as described in different works [16,17,18].
In our case, we synthesized AgNPs with two different sizes starting from solutions of AgNO3 (1 mM and 1.5 mM) to which we added OMWW after its purification from solid residues. The OMWW was used as a pristine medium without the extraction of polyphenols that were directly involved in the synthetic route as reducing and capping agents. The entire process occurred at room temperature and for this, the energy consumption was minimal; this is fundamental to meet the scope of the green chemistry principles [19]. In order to understand the quantity of polyphenols in the OMWW and in the solution containing AgNPs after synthesis, a Folin–Ciocalteu analysis was carried out. We quantified 24 ± 1.7 mg/L as reported in Table 1.
The TEM images shown multifaceted spherical nanostructures, both for 30 nm and 50 nm (Figure 2a,b). The statistical analysis was carried out on the TEM images measuring 100 of each NP type with a Gaussian fitting using ImageJ software. The NPs size were 30 ± 5 nm and 50 ± 6 nm. (Figure 2c,d).
The UV–Vis spectra of the two sizes of AgNPs are reported in Figure 2e,f, showing the Localized Surface Plasmon Resonance (LSPR) absorption peaks at c.a. 410 nm and 430 nm for the 30 nm AgNPs and 50 nm AgNPs, respectively. The FTIR analysis of the two sizes of NPs (Figure 2g,h) exhibited peaks for the –OH, -CH2, -CH3 stretching modes corresponding to the phenolic groups. In the 1742 cm−1 and 1642 cm−1 wavelengths, the bands corresponded to the –C=O stretching vibration and the –C=C- of the aliphatic vinyl ethers. At 1417 cm−1, we found vibrations ascribed to the -CH and the 1455 cm−1 peak corresponding to the –C=C- bonds. The peaks at 850 cm−1, 1038 cm−1, 1108 cm−1, 1163 cm−1, 1209 cm−1 and 1233 cm−1 were related to the -C-H, C-O, –C-O-C-, -O-C-C-, -O-H, –C(=O)-O- stretching vibrations. These results meant that the polyphenols from the OMWW were also capping agents on the NPs surface.
We also analyzed the UV–Vis absorption of pristine OMWW. The UV–Vis absorption showed an intense absorption band in 230 nm that was associated with carbon bonds of the aromatic phenolic compounds (Figure 3a). In the infrared spectrum of the OMWW, -OH groups were represented by the band between 3650 and 3000 cm−1. The 2924 cm−1, and 2884 cm−1 bands corresponded to the CH2 and CH3 stretching of polyphenolic molecules. The 1708 cm−1 and 1666 cm−1 bands corresponded to the –C=O whereas the peak at 1587 cm−1 was related to the –C=C- vibration of aromatic rings. Lastly, 1396 cm−1, 1260 cm−1 and 1068 cm−1 peaks were related to –OH, –C-O and C-O-C- bonds, respectively.
DLS acquisitions were in line with the data acquired by TEM regarding the size of NPs; the hydrodynamic radius were 31 ± 6 nm and 50 ± 8 nm for the smaller and bigger AgNPs, respectively. The NPs surface charge of −40 ± 3 mV and −35 ± 4 mV were also measured (Table 2).
Following the characterization of the NPs, we moved to understanding their potential effects on the THP1 differentiated in the primary macrophage (M0) phenotype after PMA incubation. The M0 macrophages can be polarized in M1 or M2 phenotypes: they control the inflammation phenomena in different ways; the M1 are pro-inflammatory, the M2 are anti-inflammatory cells [20,21,22]. The THP-1 were incubated with the two sizes of AgNPs at two different concentrations, namely 3 µM and 5 µM, for 24 h and 48 h, and the internalization amount of Ag was analyzed by elemental analysis. As shown in Figure 4a, the incubation with the two sizes of AgNPs did not induce evident differences in Ag uptake at either 24 h or 48 h. Subsequently, we concluded that the uptake in cells was independent from the size and time of incubation. The THP-1 viability assay (Figure 4b) showed viability reduction, although it was never below 25%. The effect was more evident when the NPs with smaller size were used compared to the 50 nm AgNPs. In particular, at the higher concentration tested, the 30 nm AgNPs induced a reduction of cell viability (25%), whereas the 50 nm AgNPs were responsible for about 20% of cell mortality after 48 h. To monitor the immune response onset, we evaluated the activation of the cytokines, proteins involved in inflammation control and activating immune cells [23]. IL-6 activates the acute phase response and hematopoiesis and it is synthesized by the immune cells, fibroblasts, and endothelial cells [24]. Additionally, IL-8, a neutrophil chemo-attractant, is produced by neutrophils, endothelial cells, fibroblasts and monocytes [25].
IL-5 is a cytokine secreted by type 2 T helper lymphocytes, mast cells and dendritic cells. Its main function is to stimulate the activation of B lymphocytes, mainly inducing them to produce IgA antibodies. Interleukin-5 also acts as a mediator in the activation process of eosinophilic white blood cells [26]. Finally, TNF-α is an inflammatory cytokine secreted by macrophages and monocytes during acute inflammation [27].
Next, we used an ELISA assay to quantify the amount of IL-6, IL-8, IL-5 and TNF-α produced by THP-1 following interaction with the NPs after 24 h and 48 h of exposure. Generally, we observed an increase of the IL-6 amount both for the 30 nm AgNPs and the 50 nm AgNPs, but, similar to the viability assay, we found a high amount of IL-6 production after incubation with the 30 nm AgNPs compared to the NPs with the larger size (Figure 4c). Specifically, an amount of c.a. 142 pg/mL versus 134 pg/mL was measured using the concentration of 5 µM for 30 nm AgNPs and 50 nm AgNPs, respectively. A similar trend was observed when we performed the IL-8, IL-5 and TNF-αassays. Additionally, in these cases, the greater secreted quantity observed was related to the smaller AgNPs (Figure 4d–f).
Finally, the translocation of Nuclear Factor kappa-light-chain-enhancer of activated B cells (NF-κB) was assessed by fluorescent analysis. This factor is physiologically localized in the cytoplasm and it translocate to the nucleus when an inflammation phenomenon occurs activating the cytokines production and transcription of DNA [28]. The evaluation of NF-κB was important to corroborate the previous experiments. The translocation of NF-κB was assessed by confocal analysis (Figure 5). Since the higher concentration showed stronger effects in the cells, we followed the exposure to the 5 µM of AgNPs (30 nm and 50 nm) after 48 h in the THP-1 cells. In the control cells, the NF-κB was localized in the cytoplasm; this evidence suggested that not all the inflammation pathways were activated (Figure 5a). Conversely, the exposure to the AgNPs induced an evident merge between the green florescence of the NF-κB and DAPI (the nuclei label). This effect was clearer in the cells exposed to the smaller size of NPs (Figure 4b,c) compared with the others (Figure 4c,d). The quantitative analysis (Figure 4e) showed a rise of the co-localization percentage, measured by the Pearson coefficient, especially when the THP-1 cells were exposed to the 30 nm AgNPs. Hence, at the highest concentration tested, the 30 nm AgNPs triggered a 34% of NF-κB translocation compared to the 50 nm AgNPs (24%).

4. Conclusions

In our experimental work, we synthesized AgNPs at two different sizes (30 nm and 50 nm) by using OMWW, known to have a very high concentration of polyphenols. The AgNPs obtained were stable and exhibited negative charge. Because Ag-based materials can be exploited in biomedical fields, we evaluated the activation of the inflammatory response exposing macrophage cells to two concentrations of NPs in vitro (3 µM and 5 µM). Our results indicated that both nanostructures did not induce a noticeable inflammatory response, as demonstrated by the analysis of the cytokines IL-6, IL-8, IL-5 and NF-κB. However, the larger size was more suitable for their further application in vitro, since the inflammation response activation was lower than the smaller size.

Author Contributions

Conceptualization, V.D.M.; methodology, V.D.M., A.G., E.S., M.C. and J.S. software, V.D.M. and M.C.; validation, V.D.M.; formal analysis, V.D.M.; investigation, V.D.M. and L.R.; data curation, V.D.M. and L.R.; writing original draft preparation, V.D.M.; review and editing, A.G., E.S., M.C., J.S. and L.R.; supervision, V.D.M. and L.R. All authors have read and agreed to the published version of the manuscript.

Funding

V.D.M. kindly acknowledges Programma Operativo Nazionale (PON) Ricerca e Innovazione 2014-20202014-azione IV.6 “Contratti su tematiche green”-DM 1062/2021 for sponsoring her salary and work. L.R. sincerely acknowledges the ERC-2.019-STG (grant number 850936) and the Fondazione Cariplo (grant number 2019-4278) for sponsoring his salary and work.

Institutional Review Board Statement

Not applicable.

Informed Consent Statement

Not applicable.

Data Availability Statement

The data presented in this study are available in this article.

Conflicts of Interest

The authors declare no conflict of interest.

References

  1. Naganthran, A.; Verasoundarapandian, G.; Khalid, F.E.; Masarudin, M.J.; Zulkharnain, A.; Nawawi, N.M.; Karim, M.; Che Abdullah, C.A.; Ahmad, S.A. Synthesis, Characterization and Biomedical Application of Silver Nanoparticles. Materials 2022, 15, 427. [Google Scholar] [CrossRef] [PubMed]
  2. Bressan, E.; Ferroni, L.; Gardin, C.; Rigo, C.; Stocchero, M.; Vindigni, V.; Cairns, W.; Zavan, B. Silver Nanoparticles and Mitochondrial Interaction. Int. J. Dent. 2013, 2013, 312747. [Google Scholar] [CrossRef] [PubMed]
  3. He, Y.; Du, Z.; Lv, H.; Jia, Q.; Tang, Z.; Zheng, X.; Zhang, K.; Zhao, F. Green synthesis of silver nanoparticles by Chrysanthemum morifolium Ramat. extract and their application in clinical ultrasound gel. Int. J. Nanomed. 2013, 8, 1809–1815. [Google Scholar] [CrossRef] [PubMed]
  4. Li, L.; Bi, Z.; Hu, Y.; Sun, L.; Song, Y.; Chen, S.; Mo, F.; Yang, J.; Wei, Y.; Wei, X. Silver nanoparticles and silver ions cause inflammatory response through induction of cell necrosis and the release of mitochondria in vivo and in vitro. Cell Biol. Toxicol. 2021, 37, 177–191. [Google Scholar] [CrossRef] [PubMed]
  5. Egbuna, C.; Parmar, V.K.; Jeevanandam, J.; Ezzat, S.M.; Patrick-Iwuanyanwu, K.C.; Adetunji, C.O.; Khan, J.; Onyeike, E.N.; Uche, C.Z.; Akram, M.; et al. Toxicity of Nanoparticles in Biomedical Application: Nanotoxicology. J. Toxicol. 2021, 2021, 9954443. [Google Scholar] [CrossRef] [PubMed]
  6. Gour, A.; Jain, N.K. Advances in green synthesis of nanoparticles. Artif. Cells Nanomed. Biotechnol. 2019, 47, 844–851. [Google Scholar] [CrossRef] [PubMed]
  7. Souilem, S.; El-Abbassi, A.; Kiai, H.; Hafidi, A.; Sayadi, S.; Galanakis, C.M. Olive oil production sector: Environmental effects and sustainability challenges. In Olive Mill Waste-Recent Advances for Sustainable Management; Academic Press: Cambridge, MA, USA, 2017; pp. 1–28. [Google Scholar]
  8. De Matteis, V.; Rizzello, L.; Ingrosso, C.; Rinaldi, R. Purification of olive mill wastewater through noble metal nanoparticle synthesis: Waste safe disposal and nanomaterial impact on healthy hepatic cell mitochondria. Environ. Sci. Pollut. Res. 2021, 28, 26154–26171. [Google Scholar] [CrossRef]
  9. Daâssi, D.; Sellami, S.; Frikha, F.; Rodriguez-Couto, S.; Nasri, M.; Mechichi, T. Assessment of Coriolopsis gallica-treated olive mill wastewater phytotoxicity on tomato plants. Environ. Sci. Pollut. Res. 2016, 23, 15370–15380. [Google Scholar] [CrossRef]
  10. Miu, B.A.; Dinischiotu, A. New Green Approaches in Nanoparticles Synthesis: An Overview. Molecules 2022, 27, 647. [Google Scholar] [CrossRef]
  11. Liu, J.; Liu, Z.; Pang, Y.; Zhou, H. The interaction between nanoparticles and immune system: Application in the treatment of inflammatory diseases. J. Nanobiotechnol. 2022, 20, 127. [Google Scholar] [CrossRef]
  12. De Matteis, V.; Cascione, M.; Rizzello, L.; Manno, D.E.; Di Guglielmo, C.; Rinaldi, R. Synergistic Effect Induced by Gold Nanoparticles with Polyphenols Shell during Thermal Therapy: Macrophage Inflammatory Response and Cancer Cell Death Assessment. Cancers 2021, 13, 3610. [Google Scholar] [CrossRef] [PubMed]
  13. Mouzakitis, Y.; Adamides, E.D. Techno-Economic Assessment of an Olive Mill Wastewater (OMWW) Biorefinery in the Context of Circular Bioeconomy. Eng 2022, 3, 488–503. [Google Scholar] [CrossRef]
  14. Cassano, A.; Conidi, C.; Galanakis, C.M.; Castro-Muñoz, R. Recovery of polyphenols from olive mill wastewaters by membrane operations. In Membrane Technologies for Biorefining; Figoli, A., Cassano, A., Basile, A., Eds.; Woodhead Publishing: Cambridge, UK, 2016; pp. 163–187. ISBN 978-0-08-100451-7. [Google Scholar]
  15. Amini, S.M.; Akbari, A. Metal nanoparticles synthesis through natural phenolic acids. IET Nanobiotechnol. 2019, 13, 771–777. [Google Scholar] [CrossRef] [PubMed]
  16. Rapa, M.; Vinci, G.; Ciano, S.; Cerra, S.; Fratoddi, I. Gold nanoparticles-based extraction of phenolic compounds from olive mill wastewater: A rapid and sustainable method. AIP Conf. Proc. 2020, 2257, 020010. [Google Scholar] [CrossRef]
  17. Odeh, F.; Abu-Dalo, M.; Albiss, B.; Ghannam, N.; Khalaf, A.; Amayreh, H.H.; Al Bawab, A. Coupling magnetite and goethite nanoparticles with sorbent materials for olive mill wastewater remediation. Emergent Mater. 2022, 5, 77–88. [Google Scholar] [CrossRef]
  18. Peeters, K.; Miklavčič Višnjevec, A.; Tavzes, Č. The Use of Modified Fe3O4 Particles to Recover Polyphenolic Compounds for the Valorisation of Olive Mill Wastewater from Slovenian Istria. Nanomaterials 2022, 12, 2327. [Google Scholar] [CrossRef]
  19. Anastas, P.T.; Zimmerman, J.B. Zimmerman Design through the Twelve Principles of Green Engineering. Environ. Sci. Technol. 2003, 37, 94A–101A. [Google Scholar] [CrossRef]
  20. Atri, C.; Guerfali, F.Z.; Laouini, D. Role of Human Macrophage Polarization in Inflammation during Infectious Diseases. Int. J. Mol. Sci. 2018, 19, 1801. [Google Scholar] [CrossRef]
  21. Wang, L.X.; Zhang, S.X.; Wu, H.J.; Rong, X.L.; Guo, J. M2b macrophage polarization and its roles in diseases. J. Leukoc. Biol. 2019, 106, 345–358. [Google Scholar] [CrossRef]
  22. McWhorter, F.Y.; Wang, T.; Nguyen, P.; Chung, T.; Liu, W.F. Modulation of macrophage phenotype by cell shape. Proc. Natl. Acad. Sci. USA 2013, 110, 17253–17258. [Google Scholar] [CrossRef]
  23. Liew, F.Y. The role of innate cytokines in inflammatory response. Immunol. Lett. 2003, 85, 131–134. [Google Scholar] [CrossRef] [PubMed]
  24. Tanaka, T.; Narazaki, M.; Kishimoto, T. IL-6 in inflammation, immunity, and disease. Cold Spring Harb. Perspect. Biol. 2014, 6, a016. [Google Scholar] [CrossRef] [PubMed]
  25. Tajima, A.; Iwase, T.; Shinji, H.; Seki, K.; Mizunoe, Y. Inhibition of endothelial interleukin-8 production and neutrophil transmigration by Staphylococcus aureus beta-hemolysin. Infect. Immun. 2009, 77, 327–334. [Google Scholar] [CrossRef] [PubMed]
  26. Hirai, K.; Yamaguchi, M.; Misaki, Y.; Takaishi, T.; Ohta, K.; Morita, Y.; Ito, K.; Miyamoto, T. Enhancement of human basophil histamine release by interleukin 5. J. Exp. Med. 1990, 172, 1525–1528. [Google Scholar] [CrossRef] [PubMed]
  27. Idriss, H.T.; Naismith, J.H. TNF alpha and the TNF receptor superfamily: Structure-function relationship(s). Microsc. Res. Technol. 2000, 50, 184–195. [Google Scholar] [CrossRef]
  28. Park, M.H.; Hong, J.T. Roles of NF-κB in Cancer and Inflammatory Diseases and Their Therapeutic Approaches. Cells 2016, 5, 15. [Google Scholar] [CrossRef]
Figure 1. Schematic representation of AgNPs synthesis: 30 nm (a) and 50 nm (b) using OMWW.
Applsci 13 06033 g001
Figure 2. (a,b) Representative TEM images of 30 nm AgNPs and 50 nm AgNPs derived from the OMWW synthetic route; statistical analysis with Gaussian fit for 30 nm AgNPs (c) and 50 nm AgNPs (d); UV–vis of 30 nm AgNPs (e) and 50 nm AgNPs (f). FTIR spectra of 30 nm AgNPs (g) and 50 nm AgNPs (h).
Applsci 13 06033 g002
Figure 3. UV–vis (a) and FTIR spectra (b) of pristine OMWW.
Applsci 13 06033 g003
Figure 4. (a) Uptake of the AgNPs (3 µM and 5 µM), 30 nm and 50 nm in THP-1 cell lines for 24 h and 48 h. Control cells were represented by cells without NP treatment (data not shown) Data are the mean ± SD performing three independent experiments, and statistically significant for exposed cells vs. control cells with a p value < 0.05 (<0.05 *). (b) Viability of THP-1 cell lines after 24 h and 48 h of incubation with 3 µM and 5 µM of 30 nm and 50 nm AgNPs. The viability data of cells incubated with NPs was normalized to non-treated cells. The positive control (P) was represented by cells treated with 5% DMSO (data not shown). Data reported as the mean ± SD from three independent experiments are considered statistically significant, compared with the control (n = 8) for p value < 0.05 (<0.05 *). (c) IL-6 (d), IL-8 (e), IL-5 (f), TNF-α, amount expressed as pg/mL. The experiment consisted of cells treated with AgNPs (30 nm and 50 nm) at two concentrations (3 µM and 5 µM) for 24 h and 48 h. The cytokine amount was revealed in supernatants from the untreated cells and cells exposed to NPs by an ELISA assay. The results are reported as the mean ± standard deviation of three independent experiments for * p < 0.05 compared to the control for 24 h and 48 h.
Applsci 13 06033 g004
Figure 5. Confocal images of non-treated macrophages (M0) (a) and M0 incubated for 48 h with the 3 µM and 5 µM of 30 nm AgNPs (b,c) and 50 nm AgNPs (d,e). Cells were fixed with formaldehyde and stained. The nuclei visualization was carried out by the use of Dapi (blue), the actin fibers with CellMask™ Deep Red (red) and NF-κB with NF-κB p65 Antibody (F-6) FITC (green signal). The co-localization analysis was carried out considering the merge of the fluorescence intensity related to blue (nuclei) and green (NF-κB) due to the NF-κB translocation from the cytoplasm to the nuclei (f). The data were expressed as the mean ±SD and they were statistically significant for * p < 0.5.
Applsci 13 06033 g005
Table 1. Quantification of total polyphenols in OMWW.
Sample Total Polyphenols (mg/L)
Olive Mill Wastewater (OMWW)24 ± 1.7 mg/L
Table 2. Characterization of AgNPs (30 nm and 50 nm) in water by DLS and ζ-potential (mV) measurements.
SamplesDLSZeta Potential
AgNPs (30 nm)31 ± 6 nm−22 mV
AgNPs (50 nm)50 ± 8 nm−28 mV
Disclaimer/Publisher’s Note: The statements, opinions and data contained in all publications are solely those of the individual author(s) and contributor(s) and not of MDPI and/or the editor(s). MDPI and/or the editor(s) disclaim responsibility for any injury to people or property resulting from any ideas, methods, instructions or products referred to in the content.

