1. Introduction
To perform an assessment of the existing structures, typically, numerical models are developed to represent the structural behavior, namely through finite-element techniques, allowing the accurate representation of the static and dynamic structural behaviors. The fast development of the computational tools, with user friendly packages available to all the engineering community, introduces a great instrument to perform the assessment of existing structures. However, to apply these powerful tools, the accuracy of the computer models becomes essential, and any uncertainty in the obtained results should be minimized. Considering that for complex structures, the use of complex numerical models is undeniably the most correct method, the user must be assured of how accurately the model represents the real behavior of the structure. To improve the accuracy of the numerical models to represent the structural behavior, a detailed investigation should be performed, i.e., verifying the geometry, assessing the mechanical properties of the materials, identifying zones where the deterioration or damage is present, and also checking the information in the design documents and drawings. For all these reasons, the use of nondestructive testing (NDT) techniques has become more common in the condition assessment of existing structures, as it enables to gather data with minimum damage to the structure in study [
1,
2].
The aim of this work is, on the one hand, to characterize specimens of reinforced masonry walls of soil-cement compressed earth blocks and understand their structural behavior using NDT techniques, such as sonic tests and environmental vibration tests, while, on the other hand, to develop a numerical model of the walls and calibrate it with the information obtained from an analysis of the data collected during the experimental campaign. This work will make it possible to verify the reliability of the application of sonic tests in the characterization of masonry, and to test a methodology of combined tests for a structural assessment by carrying out a comparative study.
Among the NDT methods, sonic tests are commonly applied to existing masonry structures as it has several applications, namely for masonry characterization and the detection of voids, delamination, and weak areas [
3,
4]. In fact, the velocity of propagation of sonic waves through the material is related to its physical and elastic mechanical properties, making sonic tests a solution for estimating the elastic properties of masonry and to identify unknown conditions inside the material [
5,
6,
7].
The impact of an object on a material generateS-waves that propagate inside the material (body waves) and waves that propagate on the surface of the material (surface waves). Thus, in terms of mechanical waves, it is possible to encounter: (i) longitudinal waves (P-waves), which propagate by motion in the direction of propagation and are the fastest, (ii) transverse waves (S-waves), which propagate by motion perpendicular to the direction of propagation, and (iii) Rayleigh waves (R-waves), which are surface waves with retrograde elliptical motion and are the ones with the highest percentage of energy.
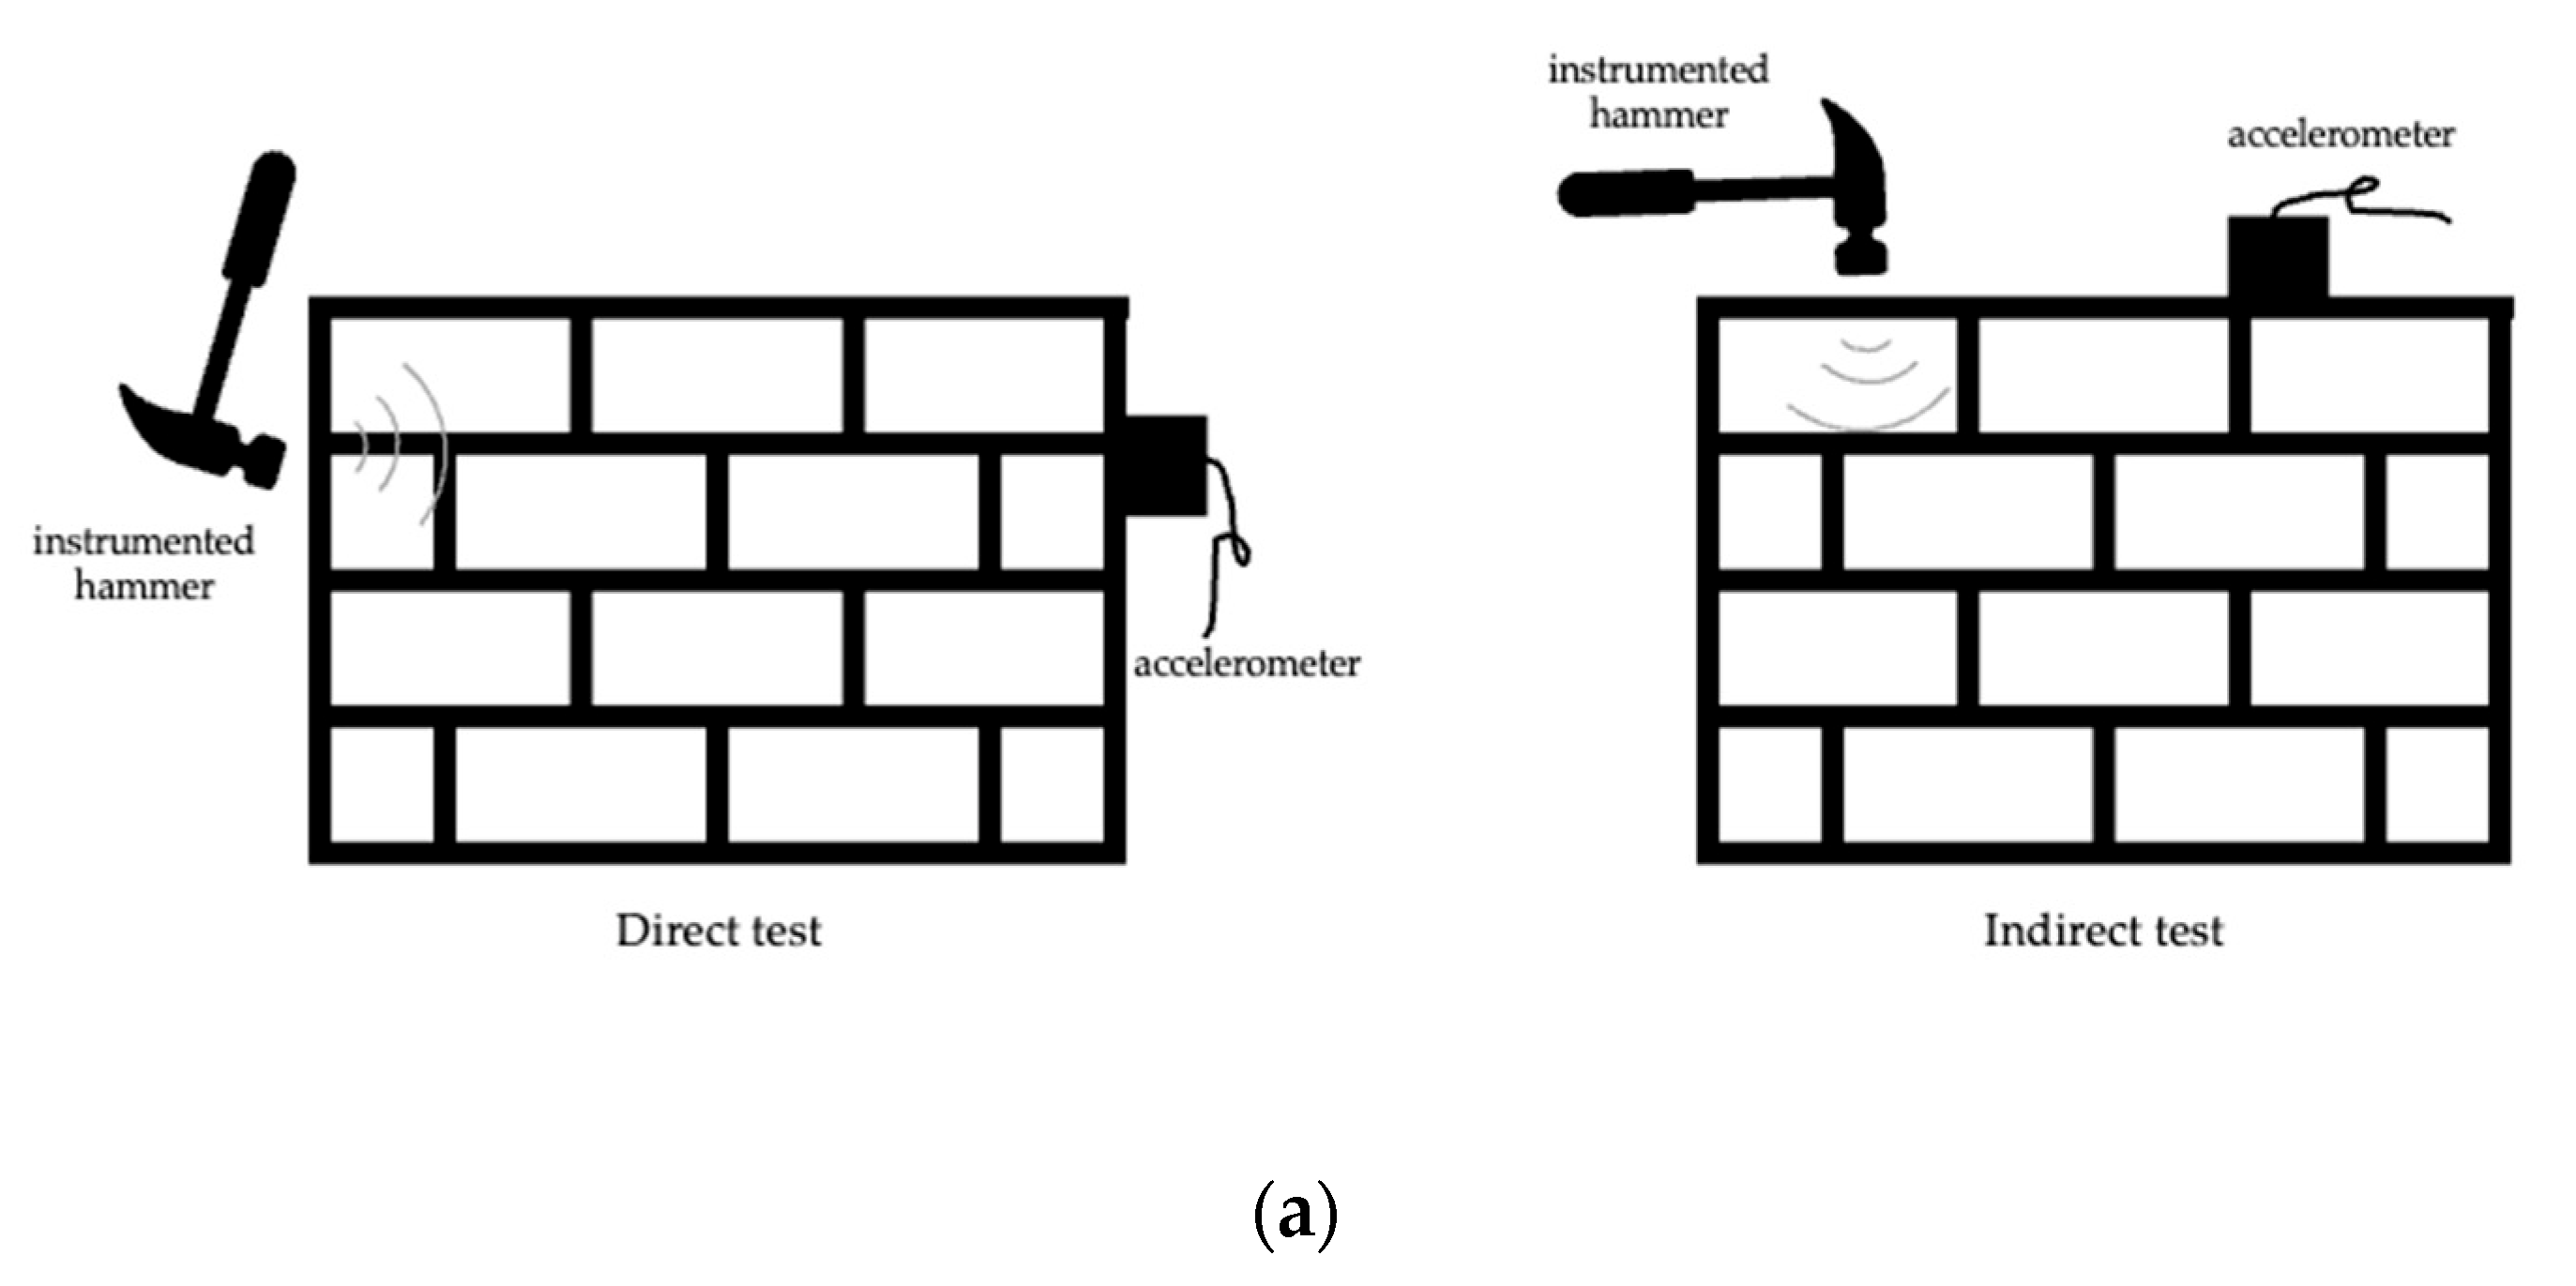
Depending on the configuration adopted in the test (the relative position of the emitter and receiver), it is possible to identify different types of waves (
Figure 1a). Direct tests aim to measure the velocity (VP) of primary waves (P-waves) by placing the hammer and accelerometer in line at opposite sides of the wall. Indirect tests can measure both the velocity of P- and R-waves (VR) [
8].
Considering a particle at the surface, it is known that it will first experience the arrival of P-waves, followed by S-waves, after a period of quietness. Subsequently, the particle experiences the arrival of R-waves, which are characterized by oscillations of a much higher amplitude that corresponds to a higher percentage of energy, and that attenuate much more slowly than the P- and S-waves. This theory, applied to the wave identification of the indirect tests, is illustrated in the scheme of
Figure 1b, where it is possible to identify the P-waves as those that arrive first (1), followed by the arrival of the R-waves (2), signaled by an increase in the percentage of energy.
The dynamic response of structures is mainly dependent on the material properties, geometry, and supporting conditions. If any physical changes or damage in the structure are made, the dynamic response, in most of the cases, will not remain constant [
9]. As the structural integrity can relate with natural frequencies, an analysis of periodical frequency measurements can be used to monitor the structural condition [
7,
10,
11]. In the present day, several works have been proposed regarding the structural damage identification using different techniques, taking advantage of NDT to improve the location and the quantification of the damage [
12,
13,
14,
15,
16].
In this work, a numerical model of the walls is developed and calibrated with the mechanical properties of the masonry obtained from the analysis of the sonic tests, namely the modulus of elasticity of the masonry. With the numerical simulation analysis, it will be possible to acquire the natural frequencies of the masonry walls and to compare them with the frequency data from the environmental vibration tests.
2. Experimental Campaign
The SHS project (Simple Housing Solution) consists a methodology for (re)building homes and other small buildings, in a joint working system (community construction), seeking to optimize available resources and contribute to the organization of chaos installed in critical situations, such as post-disaster, post-conflict, refugee relocation, or risk mitigation. It is based on the fundamental principles for the sustainable restoration of housing declared by the United Nations Development Program (UNDP) and the International Platform for Recovery (IRP): environmental, technical, financial, and socio-organizational sustainability. The project was one of the finalists for the 2019 Sasakawa Awards, a United Nations (UN) award in the area of disasters, with impacts on several sustainable development goals. SHS-Multirisk is a spin-off project that is under development through a partnership between the Federal University of Rio de Janeiro (UFRJ) and the University of Aveiro (UA). It proposes a residence model that is simultaneously resistant to earthquakes and hurricanes, within a specific range of magnitude to be defined in the project, using simple, low-cost, and environmental-friendly construction technologies when compared to traditional alternatives or more technological, but less accessible ones. In its current phase, the first SHS-Multirisk house model [
17] is being improved, aiming at more aggressive scenarios.
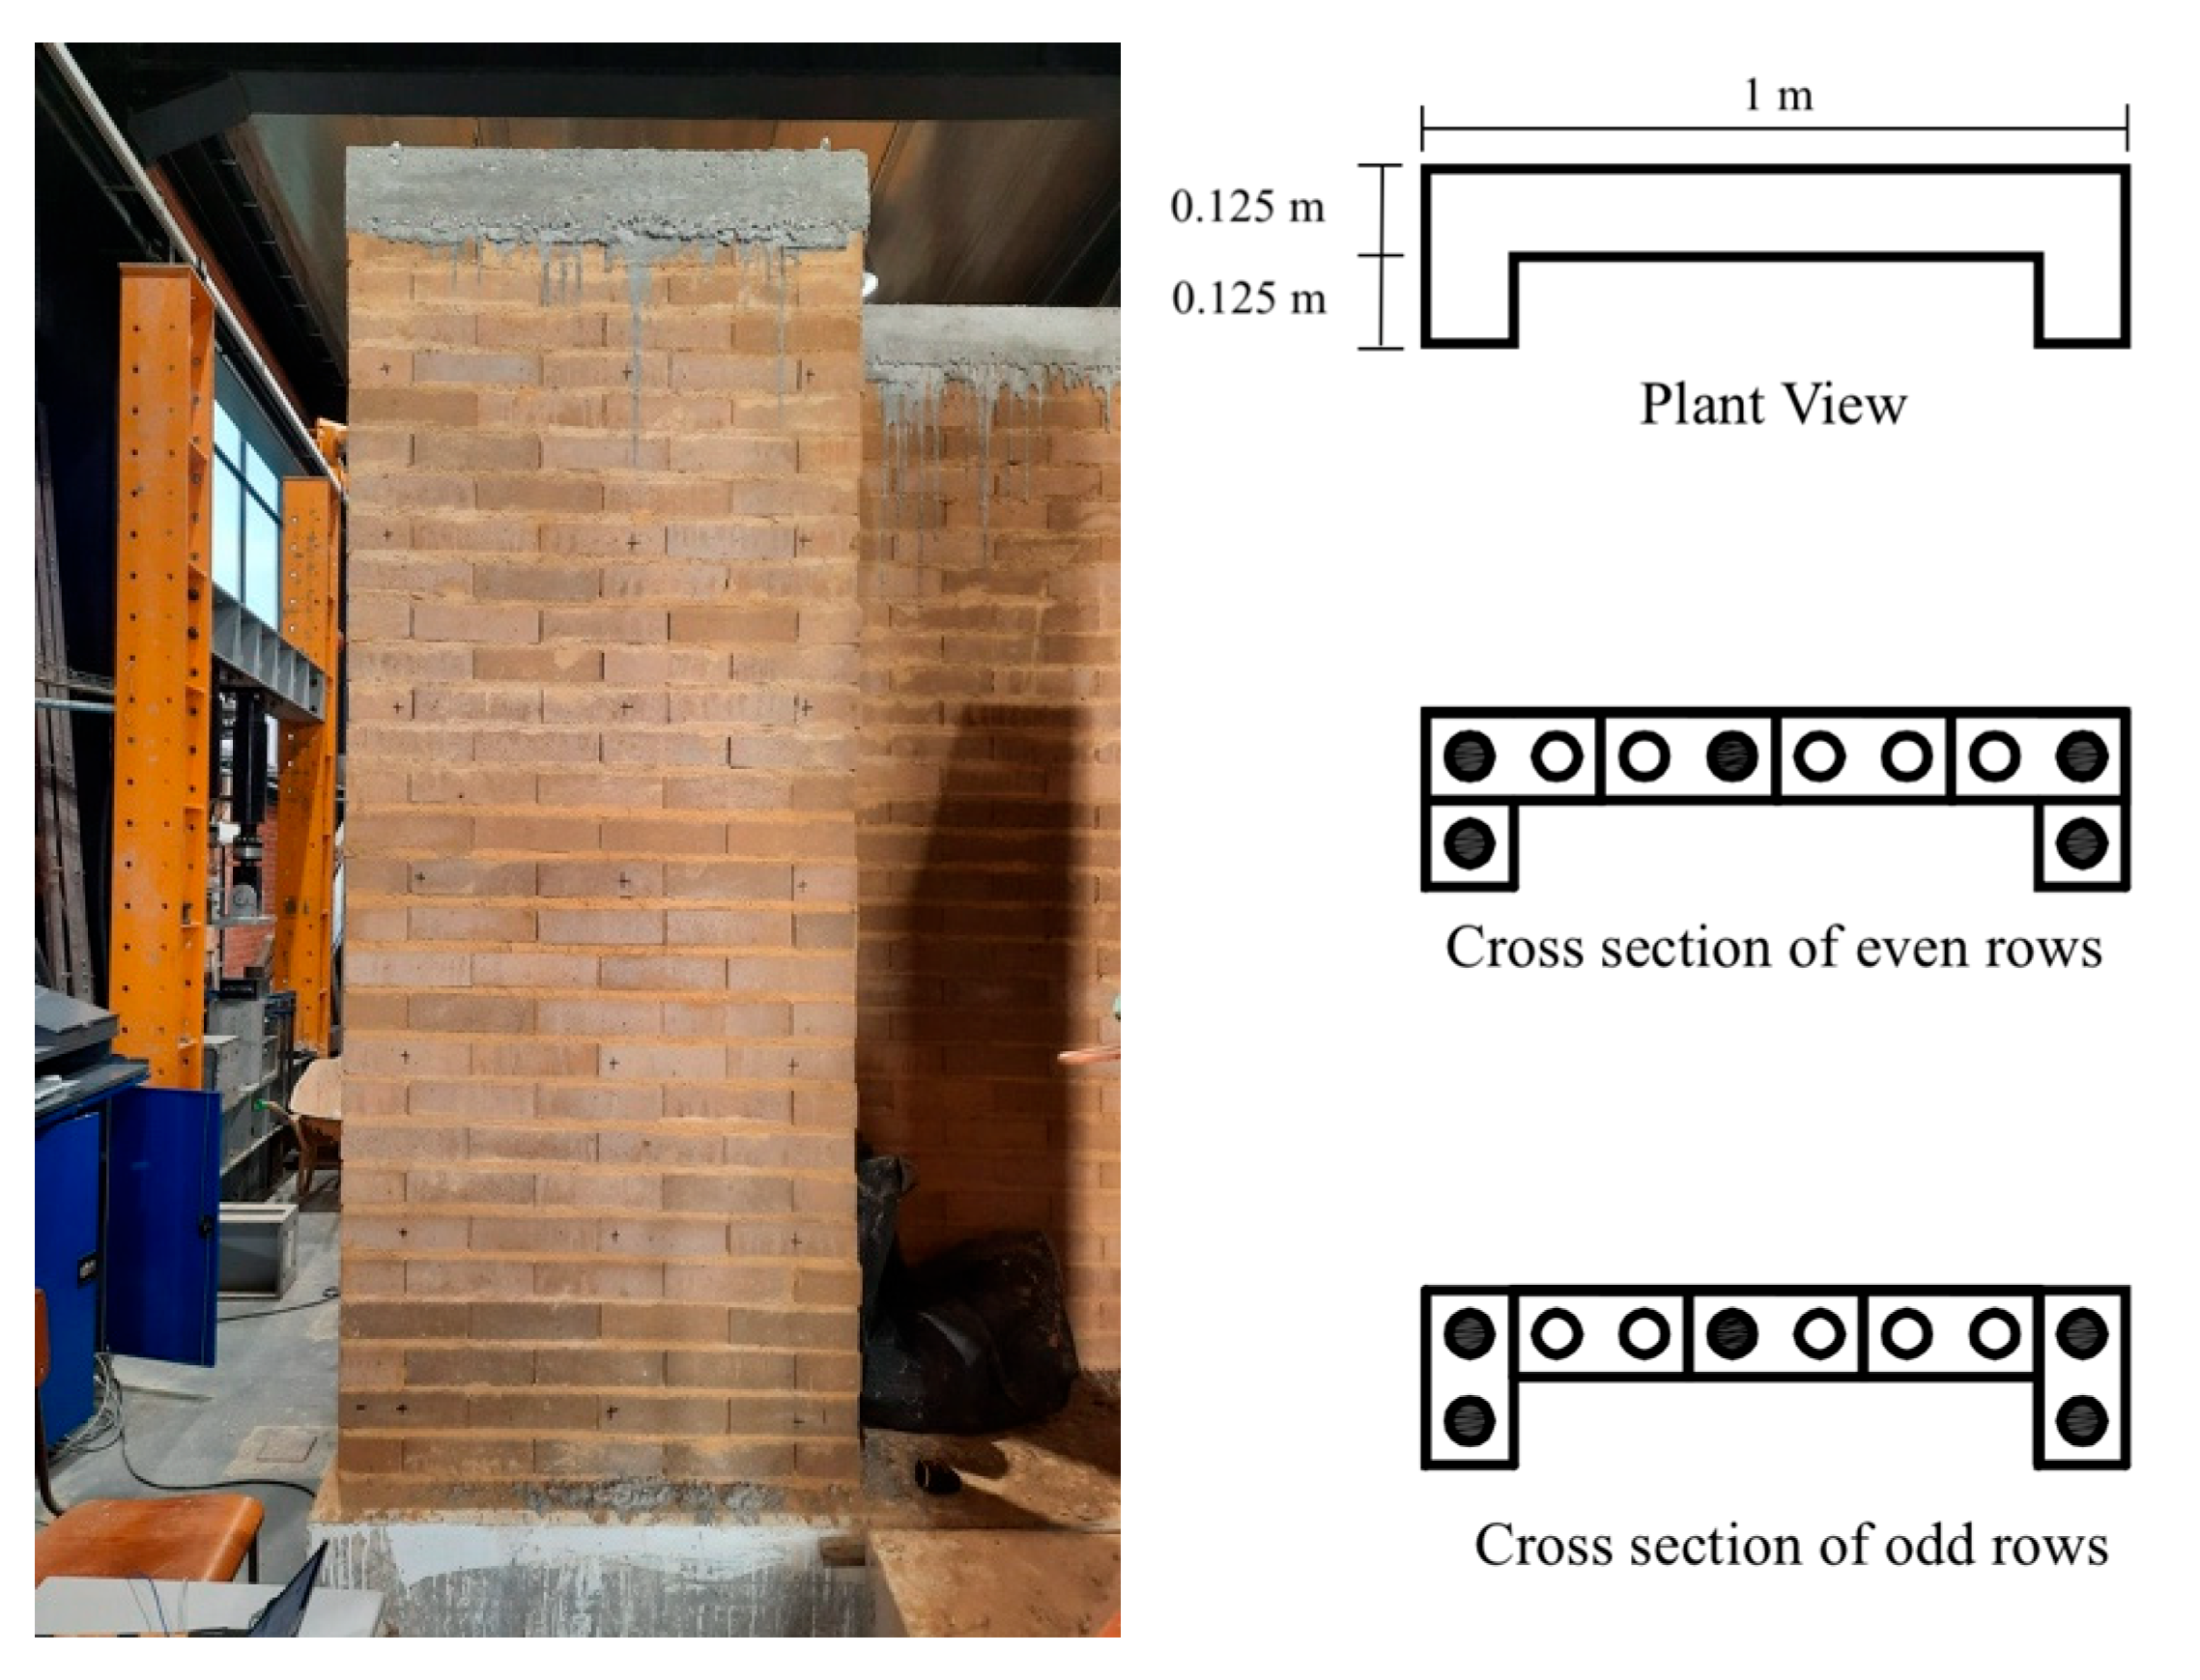
The present experimental SHS campaign was performed at UA, which involved a set of six reinforced masonry soil-cement compressed earth blocks walls, with 1 m width, a height of 2.3 m and a thickness of 0.125 m. The walls have a U section and are constituted by soil-cement blocks (with two holes) in the proportion 8:1, vertical 10 mm diameter A400 steel bars (in five filled holes), horizontal 6 mm diameter A400 steel bars (in four 55 cm spaced levels, starting from the top) and soil-cement mortar in the proportion 5:1 (See
Figure 2). All the specimens were built on a 60 cm height reinforced concrete base and designed with the same layout and materials, W1, W2, and W3 without plaster and W4, W5, and W6 with 3 cm of soil-cement plastering in one side of the wall.
The dry blocks were tested according to NBR 8492:2012 [
18] and showed an average compressive strength of 7.29 MPa and an average compressive strength in saturated specimens of 5.17 MPa, with coefficients of variation at around 20% in both cases. The average compressive strength of the laying mortars for the blocks and plaster was obtained by the prism test in accordance with EN1015-11:1999 [
19] and showed values of around 11.70 MPa. The mean tensile stress in bending was around 2.60 MPa, representing about 20% of the compressive strength, within the expected range.
Each row has five whole blocks or four whole blocks and two half-blocks, laid on a layer of mortar about 1 cm thick, without mortar in the vertical joints, which are alternated between the thirty rows. Holes with vertical reinforcements are filled with the same mortar used as the blocks, with manual compaction. The vertical reinforcements have an overlapping splice at mid-height, and the lower bar was anchored with a chemical anchor in the reinforced concrete footing. The horizontal reinforcements are embedded in the mortar joints. At the top of each specimen, a crown was built in reinforced concrete, approximately 10 cm high. All production of blocks and construction of masonry walls were carried out strictly by hand, without the use of electricity. This guideline was adopted to approximate as much as possible the conditions of laboratory production to those situations of project application when there is not always electricity available.
3. Sonic Tests
Sonic tests allow the characterization of a material by analyzing the propagation of acoustic waves produced by the percussion of an object. Acoustic waves are mechanical waves, which comprise a set of movements that occur in nature and which, by the action of forces of different types, end up being annulled, restoring the particles to their positions of equilibrium by means of elastic forces [
20]. They can be classified according to their frequency of propagation as: sonic (20 Hz–20 kHz), infrasonic (<20 Hz), and ultrasonic (20 kHz–200 kHz). When using acoustic tests to characterize masonry, which is a heterogeneous material, the sonic test is the most suitable compared to the ultrasonic test because it has lower frequencies and longer wavelengths that can complete the emitter–receiver path [
21,
22].
The use of sonic tests [
8] in the characterization of construction material are based on the propagation of acoustic waves and, depending on the configuration adopted in the test (the relative position of the emitter and receiver), it is possible to identify different types of waves. Direct tests aim to measure the velocity (VP) of primary waves (P-waves) by placing the hammer and accelerometer in line at opposite sides of the wall. Indirect tests can measure both the velocity of P- and R-waves (VR) [
8].
It is possible to correlate the velocities with the physical and elastic properties of the analyzed solid [
12], namely Poisson’s ratio and dynamic modulus, through the following expressions:
where υ is the Poisson’s ratio,
E is the dynamic modulus and
is the density of the material. These expressions were developed for solid, elastic, isotropic, and homogeneous materials; however, it is adequate to use them in masonry structures, as they provide approximate estimations of their mechanical properties.
Regarding the testing campaign, direct and indirect sonic tests and environmental vibration tests were carried out on the walls. The equipment used for the execution of the sonic tests was an instrumented hammer with a 1 kg mass and a nylon tip, an accelerometer, a data acquisition system from National Instruments, and a personal computer. With respect to the process of the dynamic characterization, tests were carried out on all walls. The equipment used thus included four accelerometers (PCB model 393B12), with a measurement range of ±0.5 g and 10,000 mV/g, and a frequency range between 0.15 and 1000 Hz, a personal computer, cables, and a data acquisition system from National Instruments.
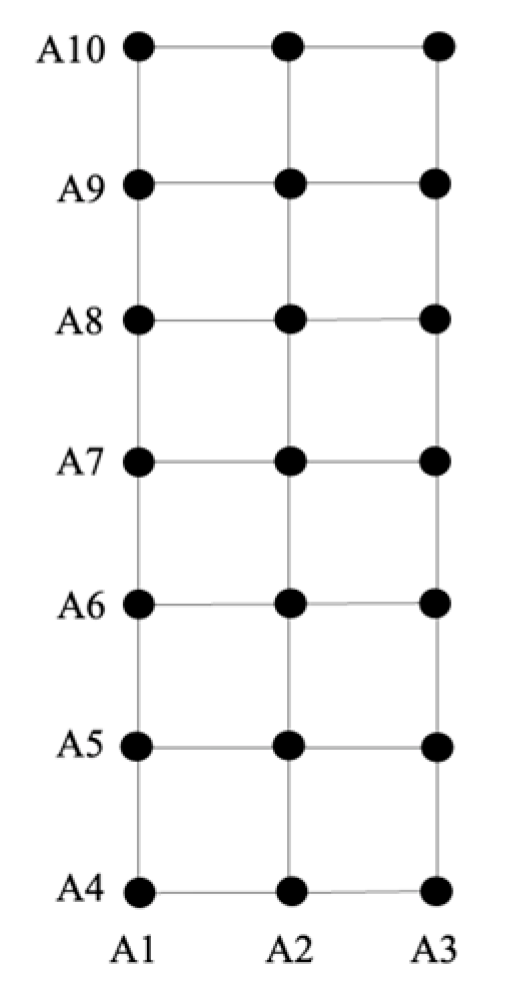
In this experimental campaign, two test configurations were performed: direct and indirect (vertical and horizontal analysis). For the direct tests, the set used constituted nine rows, spaced by 20 cm in the vertical slope, and by 1 m in the horizontal slope. The instrumented hammer (emitter) and accelerometer (receiver) were placed on opposite sides of the specimen faces. Waves were generated by the impact of the instrumented hammer in each row and recorded by the data acquisition system. To perform the indirect tests, a grid of points was marked on each wall with a 7 × 3 configuration, spaced by 30 cm, both in vertical and horizontal slopes (see
Figure 3). To collect data corresponding to the horizontal slope, the accelerometer was fixed at position A1, and the instrumented hammer was struck at points A2 and A3, along the points of the vertical slope. In turn, to collect data corresponding to the vertical slope, the accelerometer was fixed in position A4, and the instrumented hammer was struck at points A5, A6, A7, A8, A9, and A10, along the points of the horizontal slope.
For the data processing, the sonic analyzer tool was used to extract the arrival times of the waves. This process involved taking the moment when the wave was generated by the instrumented hammer and the moment when the accelerometer recorded the arrival of the wave and subtracting the values to obtain the arrival time. The arrival times taken from both tests were those corresponding to the P-waves, since they correlate better with the modulus of elasticity of the material.
For calculation purposes, it was assumed that the masonry wall structures have a Poisson’s ratio in the range of 0.2–0.3 based on the literature [
23,
24], and without additional information, was assumed a Poisson coefficient of 0.25. A density of 1937 kg/m
3 was considered. The density value was based on simple measurements in the laboratory of small wallets considering the brick, mortar, and reinforcement.
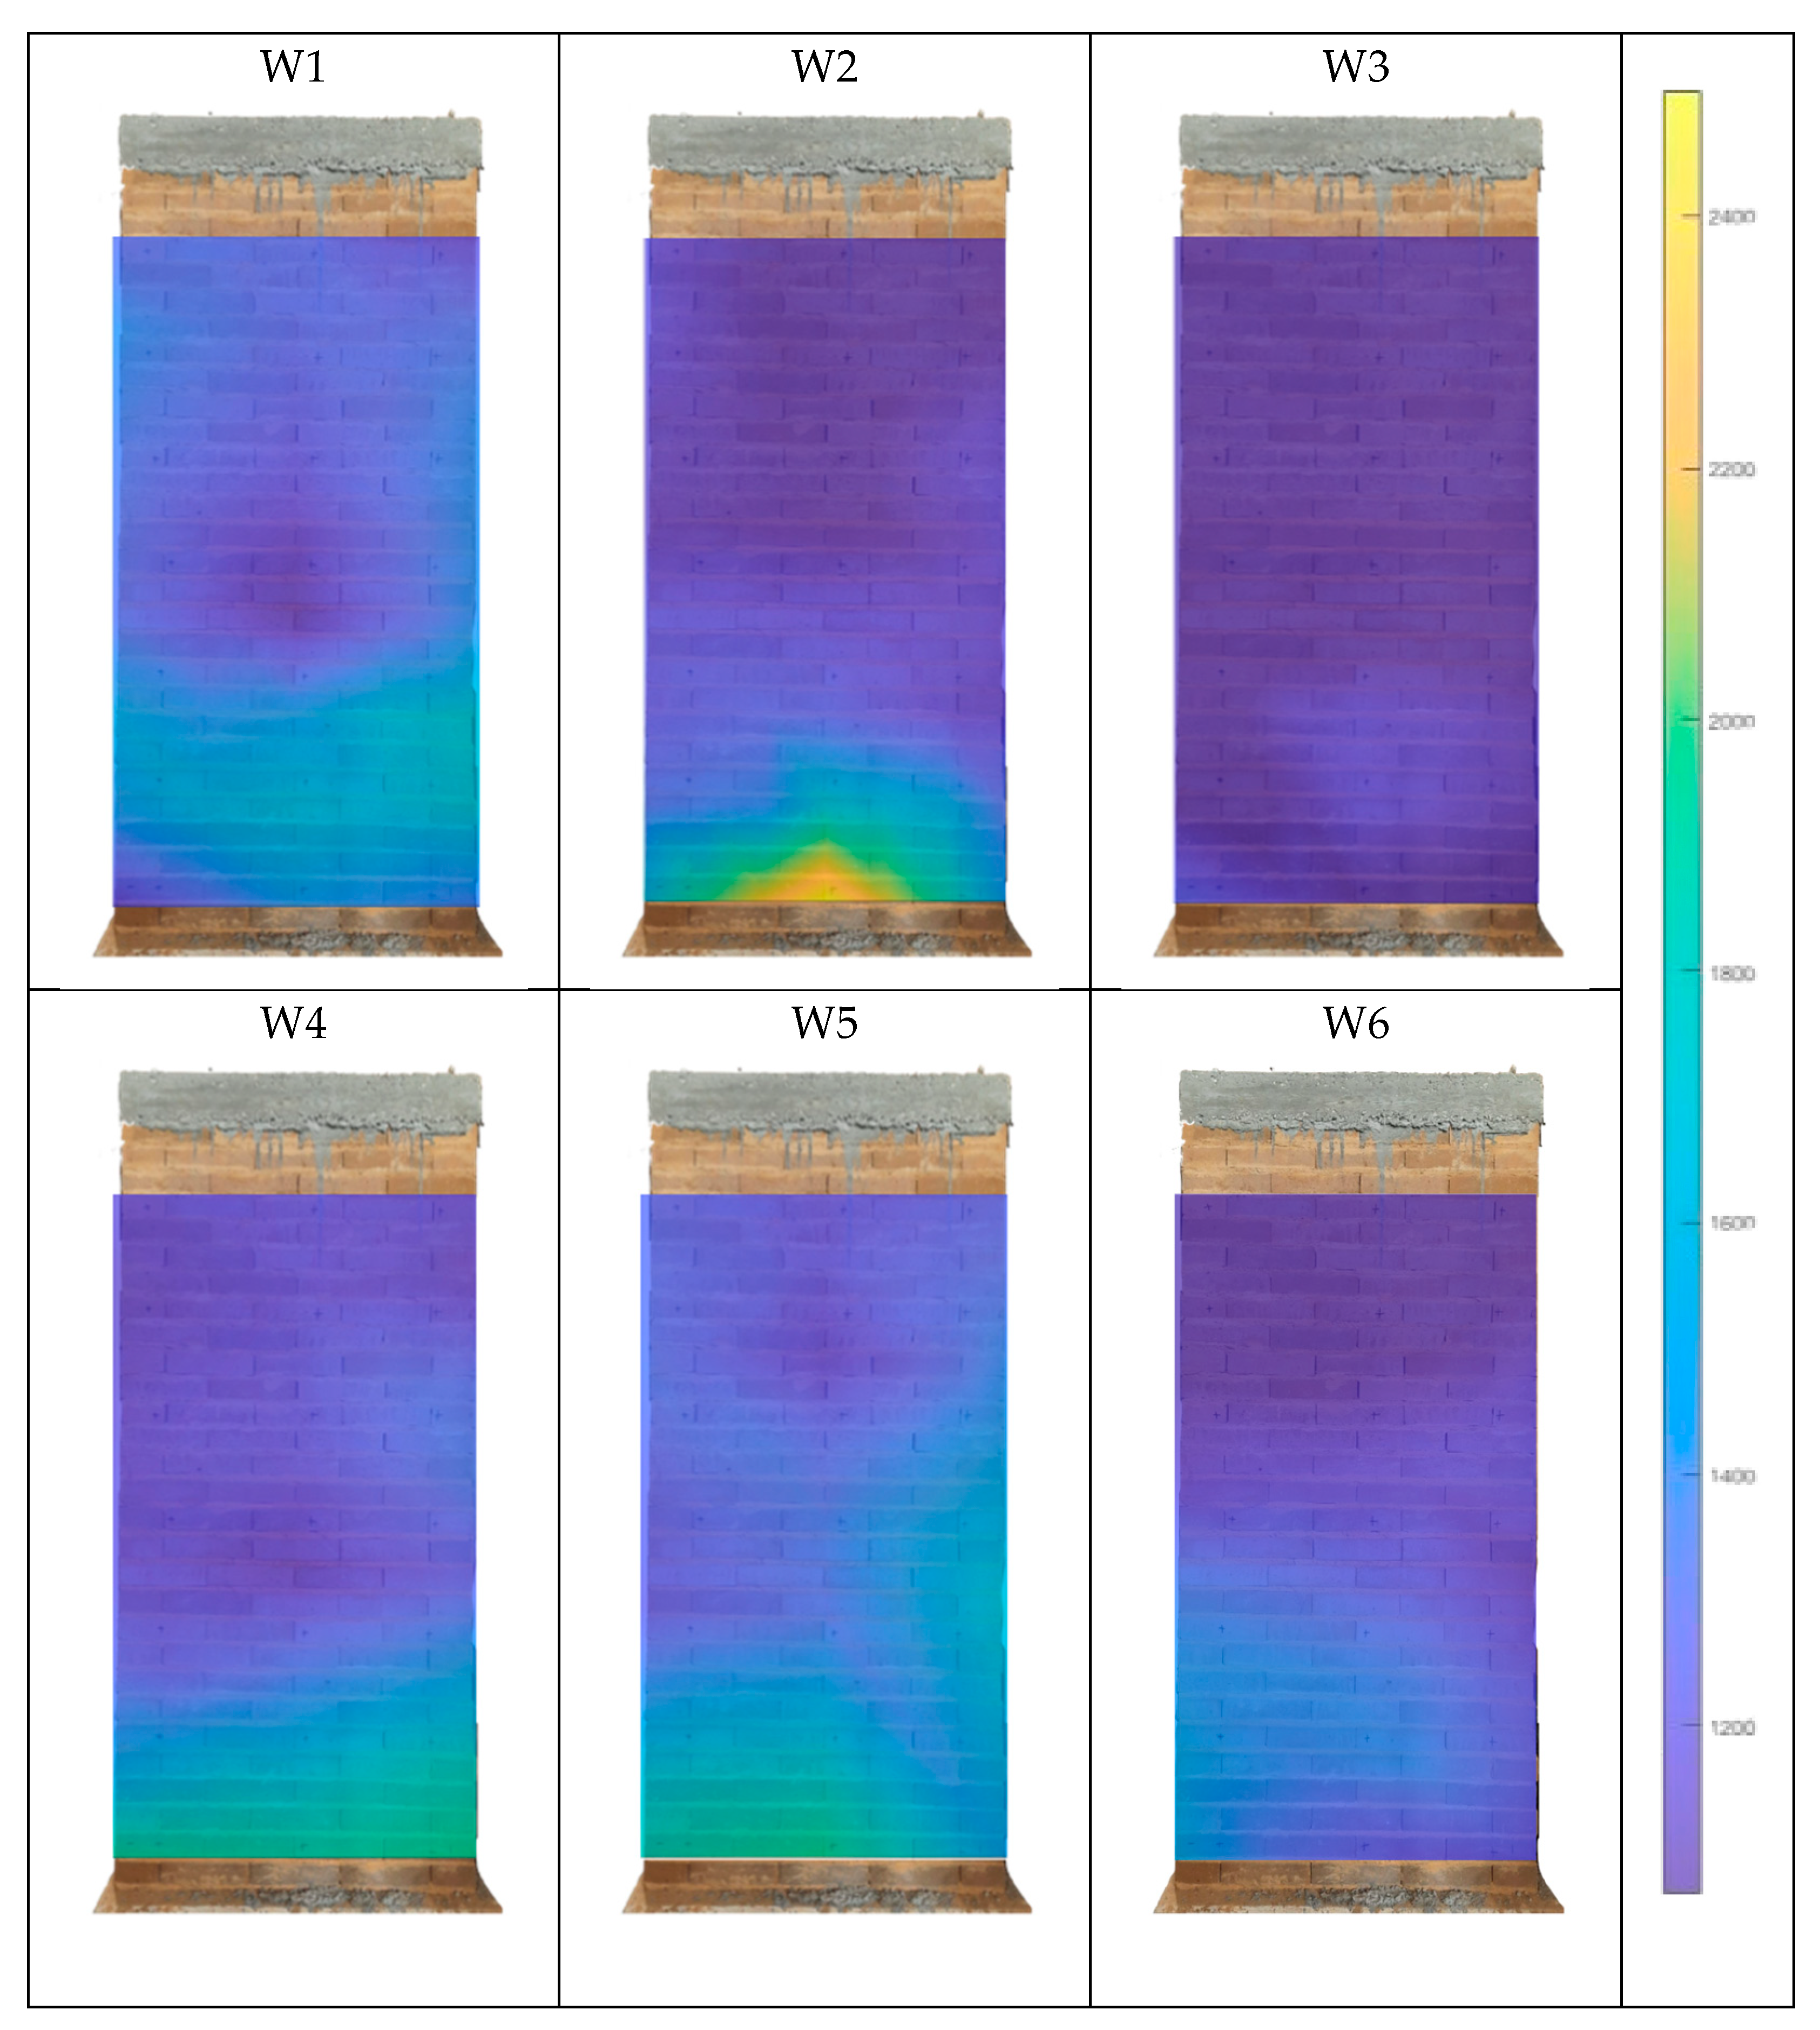
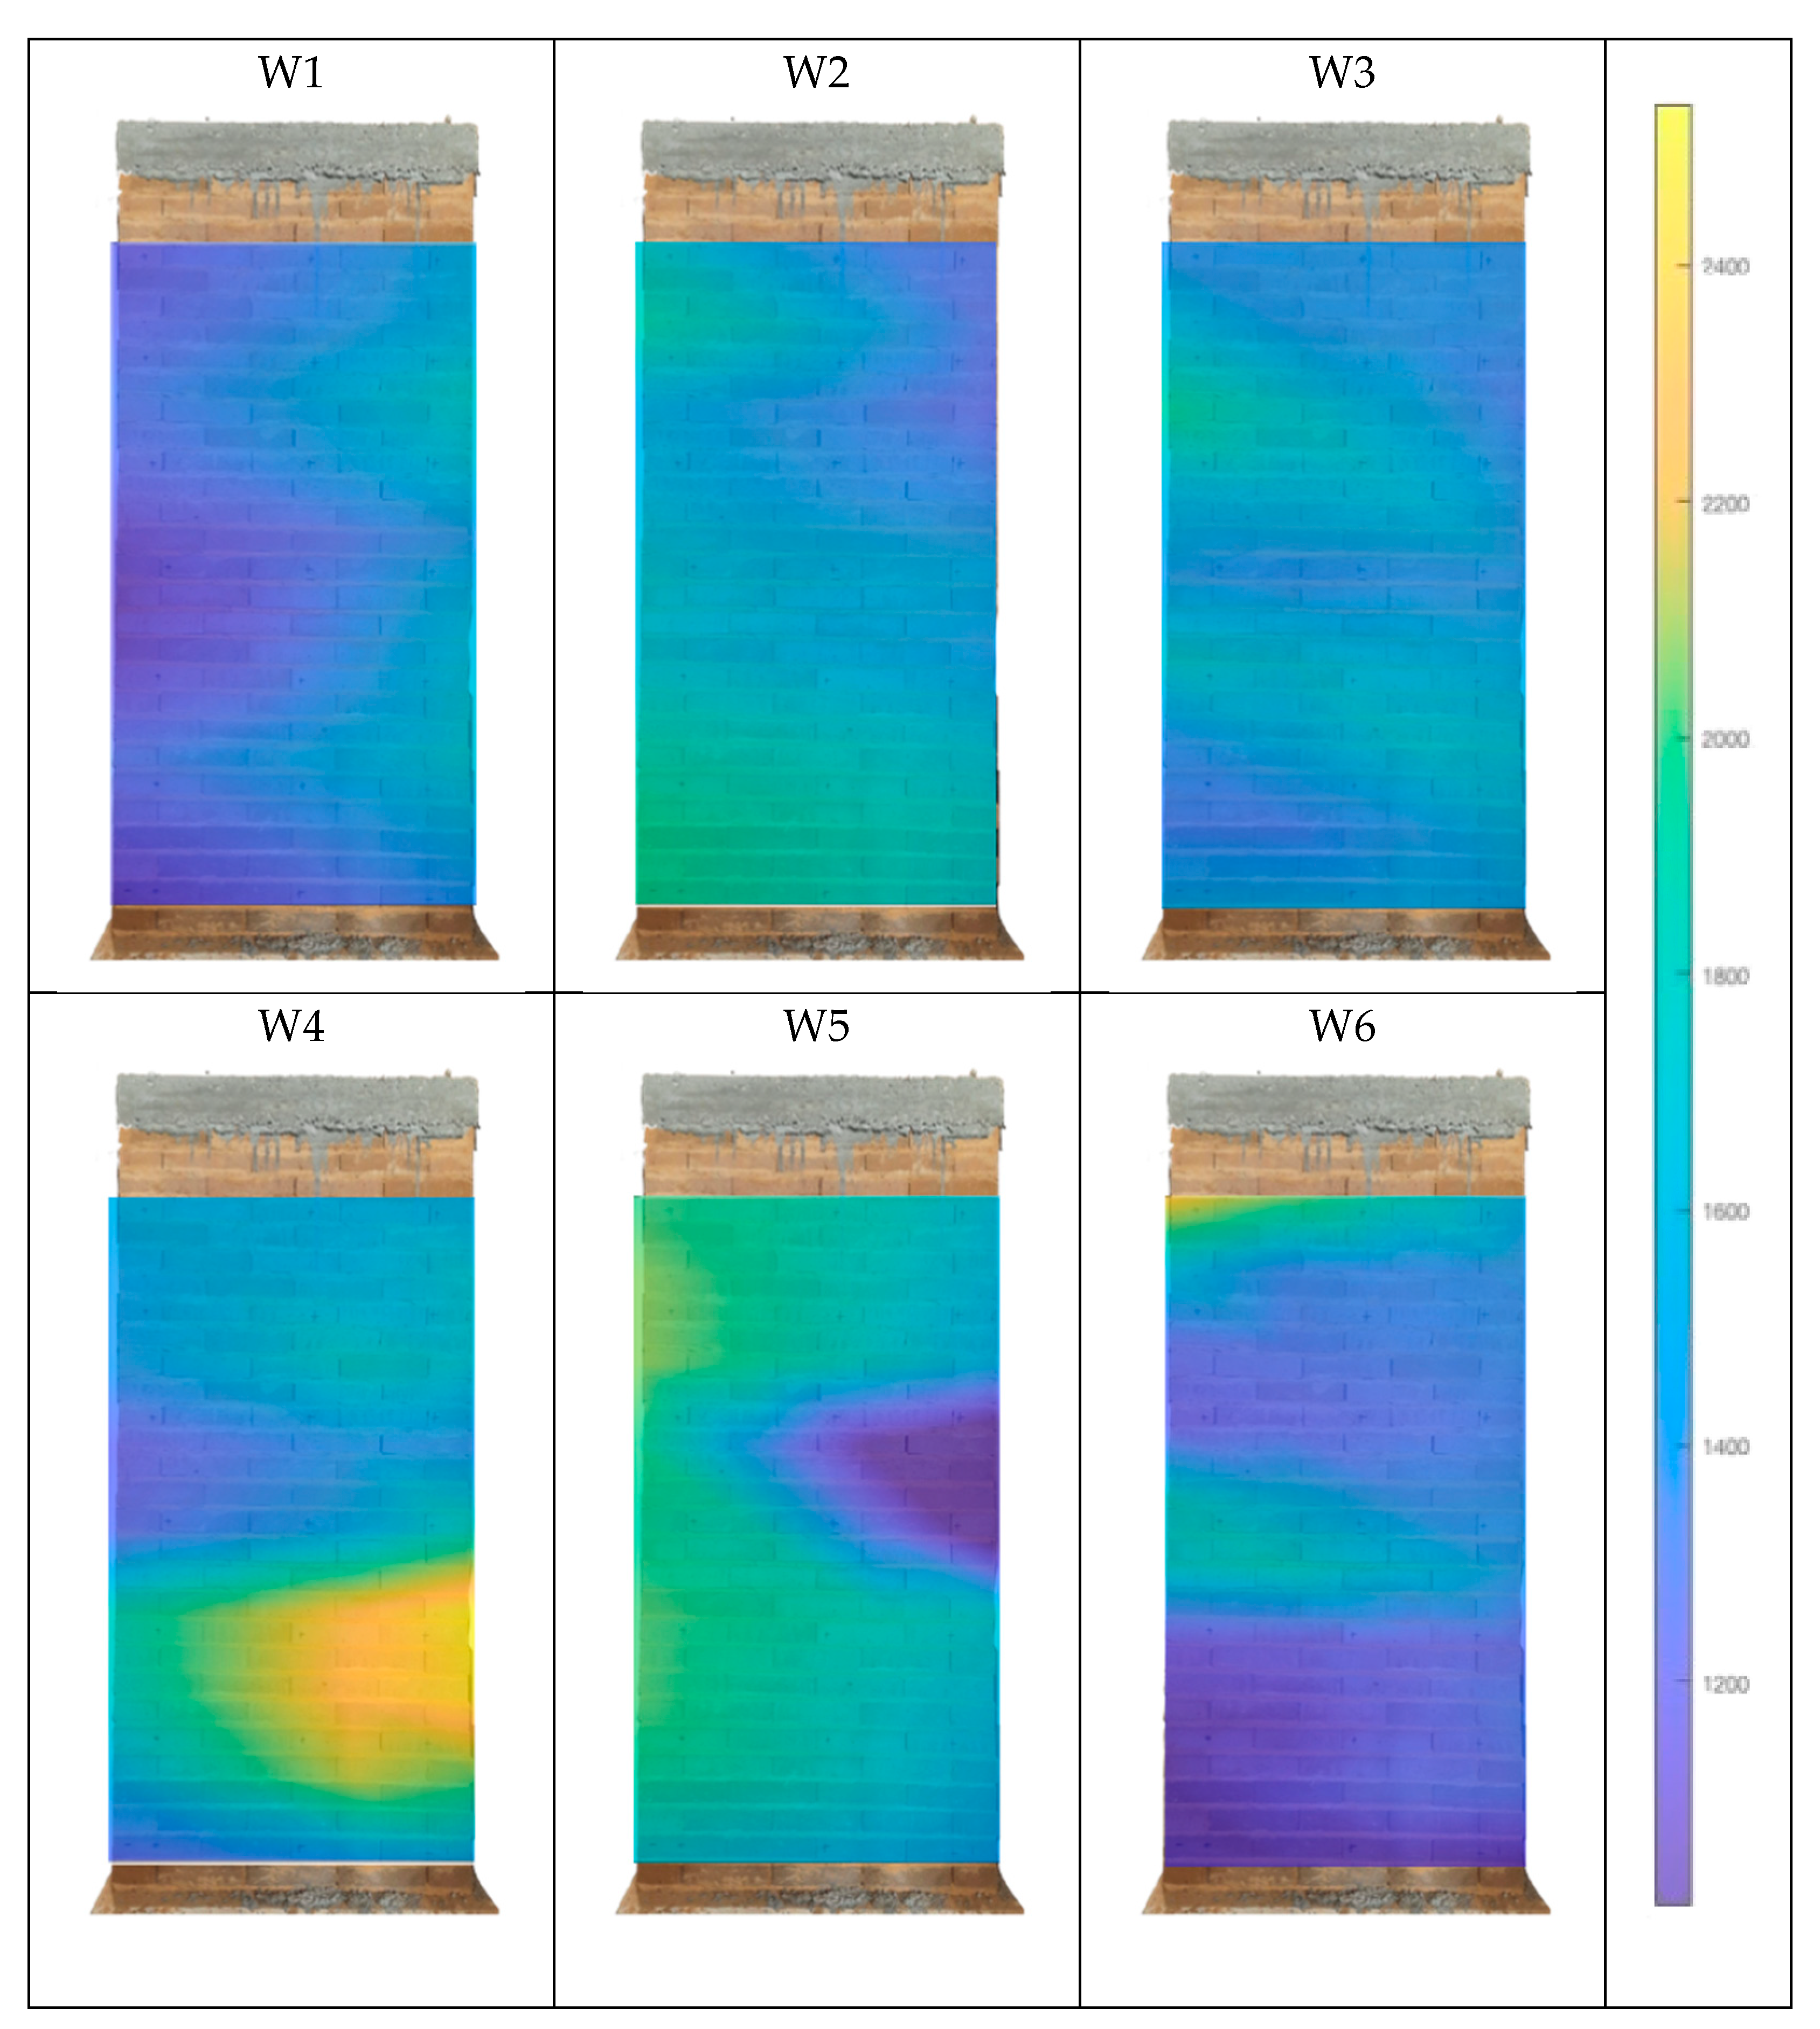
Table 1 presents the summary of the results obtained for the velocities of P-wave propagation for each wall, in each test.
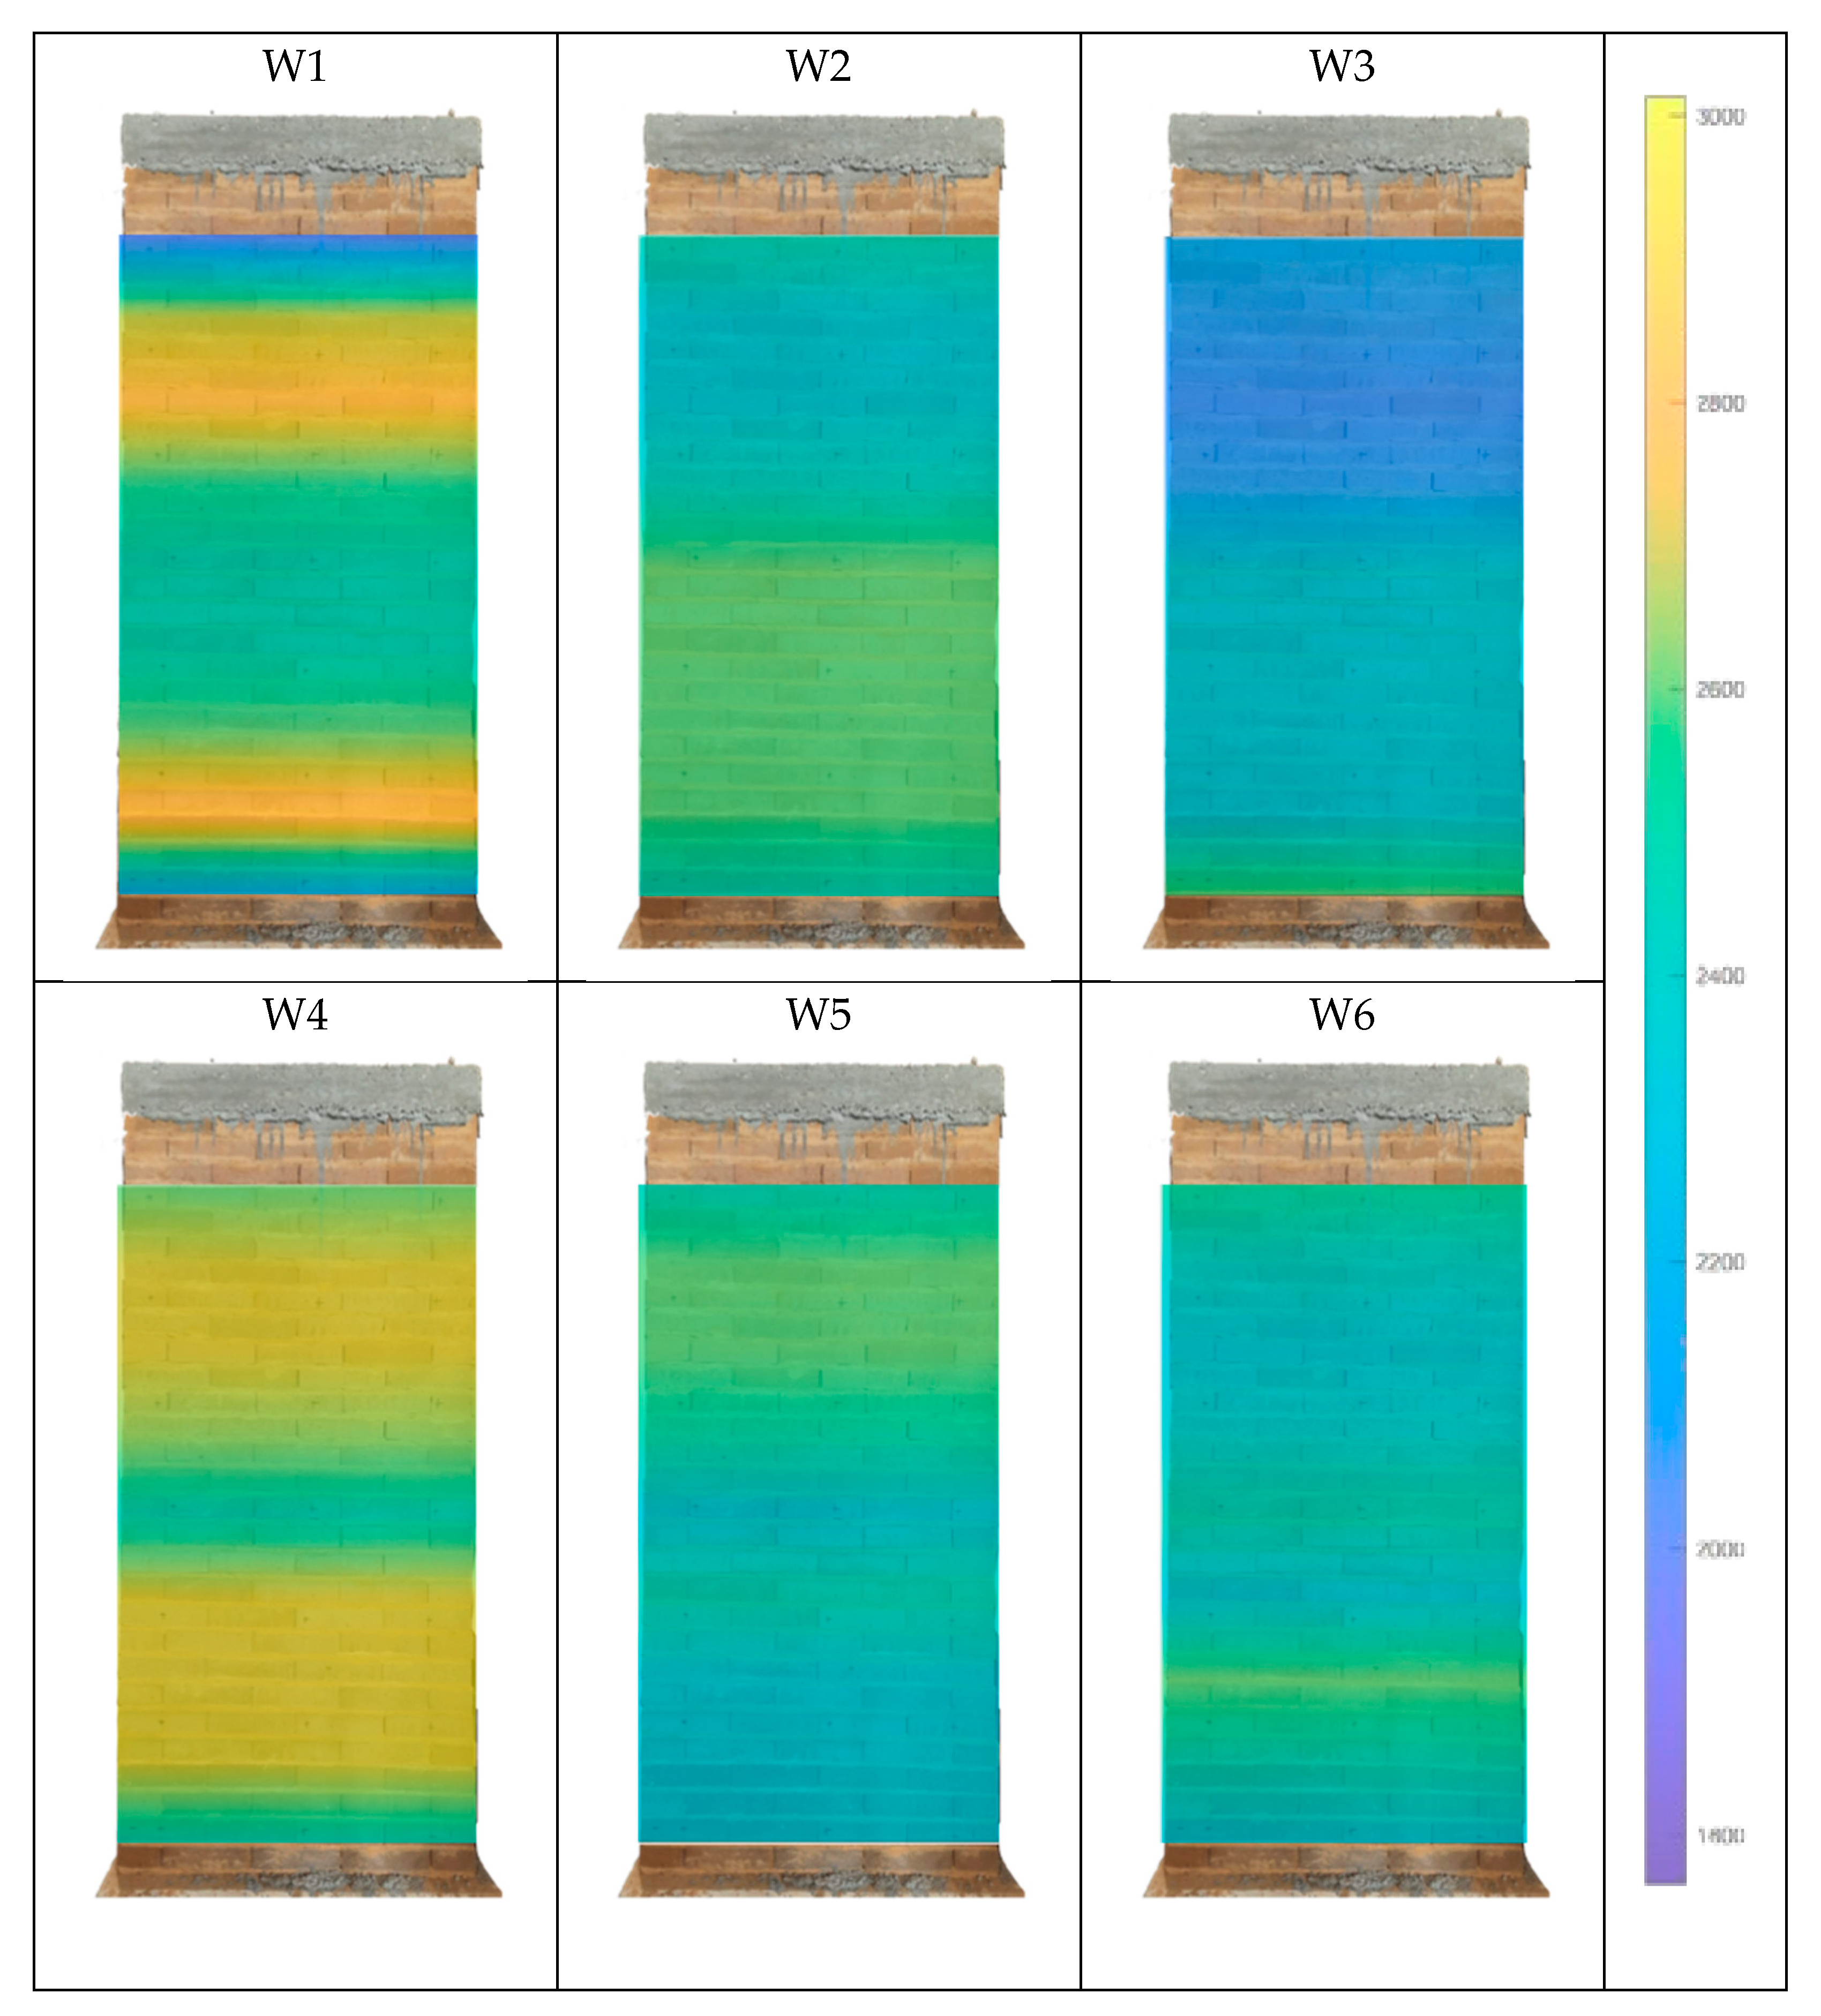
Figure 4,
Figure 5 and
Figure 6 represent the velocities of propagation by a surface graphic in the tested area.
From the surface analysis, it is possible to observe that, in most of the area tested, the walls present low variability (<15%), which reflects their material uniformity. Moreover, it is visible that the values obtained in the horizontal direction tests present higher values of velocities compared to the values obtained in the vertical tests, which indicates that there are less voids in the horizontal slope of the walls.
By applying Equation (2), it was possible to reach the masonry dynamic elasticity modulus, which are gathered in
Table 2. Considering the indirect tests values, the results obtained show that the dynamic elasticity modulus average varied between 3.03 and 4.52 GPa.
4. Environmental Vibration Tests and Modal Identification
Dynamic response is an intrinsic property of structures which depends mainly on the material properties, geometry, and support conditions, and it will remain constant unless there are any structural modifications or damages [
25]. As natural frequencies are sensitive indicators of structural integrity, an analysis of periodic frequency measurements can be used to obtain information on the global dynamic behavior of the structure, and to validate and update the numerical model of a structure [
9]. The environmental vibration test method is based on natural noise and low-frequency vibrations from the environment and can be applied without direct excitation of the structure [
26]. In order to apply the Environmental vibration test method, there is a need to make a careful choice of sensor positioning, that will enable to make correlations between natural frequencies and vibration modes of direct measurement. The assessment of the structure response in the time domain is performed by means of a combination network of high-frequency force-balance accelerometers. To assess the natural frequencies and modal shapes of the structure, it is possible to apply the frequency domain decomposition (FDD) technique in the frequency domain and the data-driven stochastic subspace identification (SSI) method in the time domain, which allows the modal parameters to be extracted from the environmental data [
27]. Modal identification provides reference values of modal parameters useful for the calibration of numerical models, based on the Young’s modulus of the masonry, so that the model can represent the actual dynamic behavior of the structure in its current state [
28].
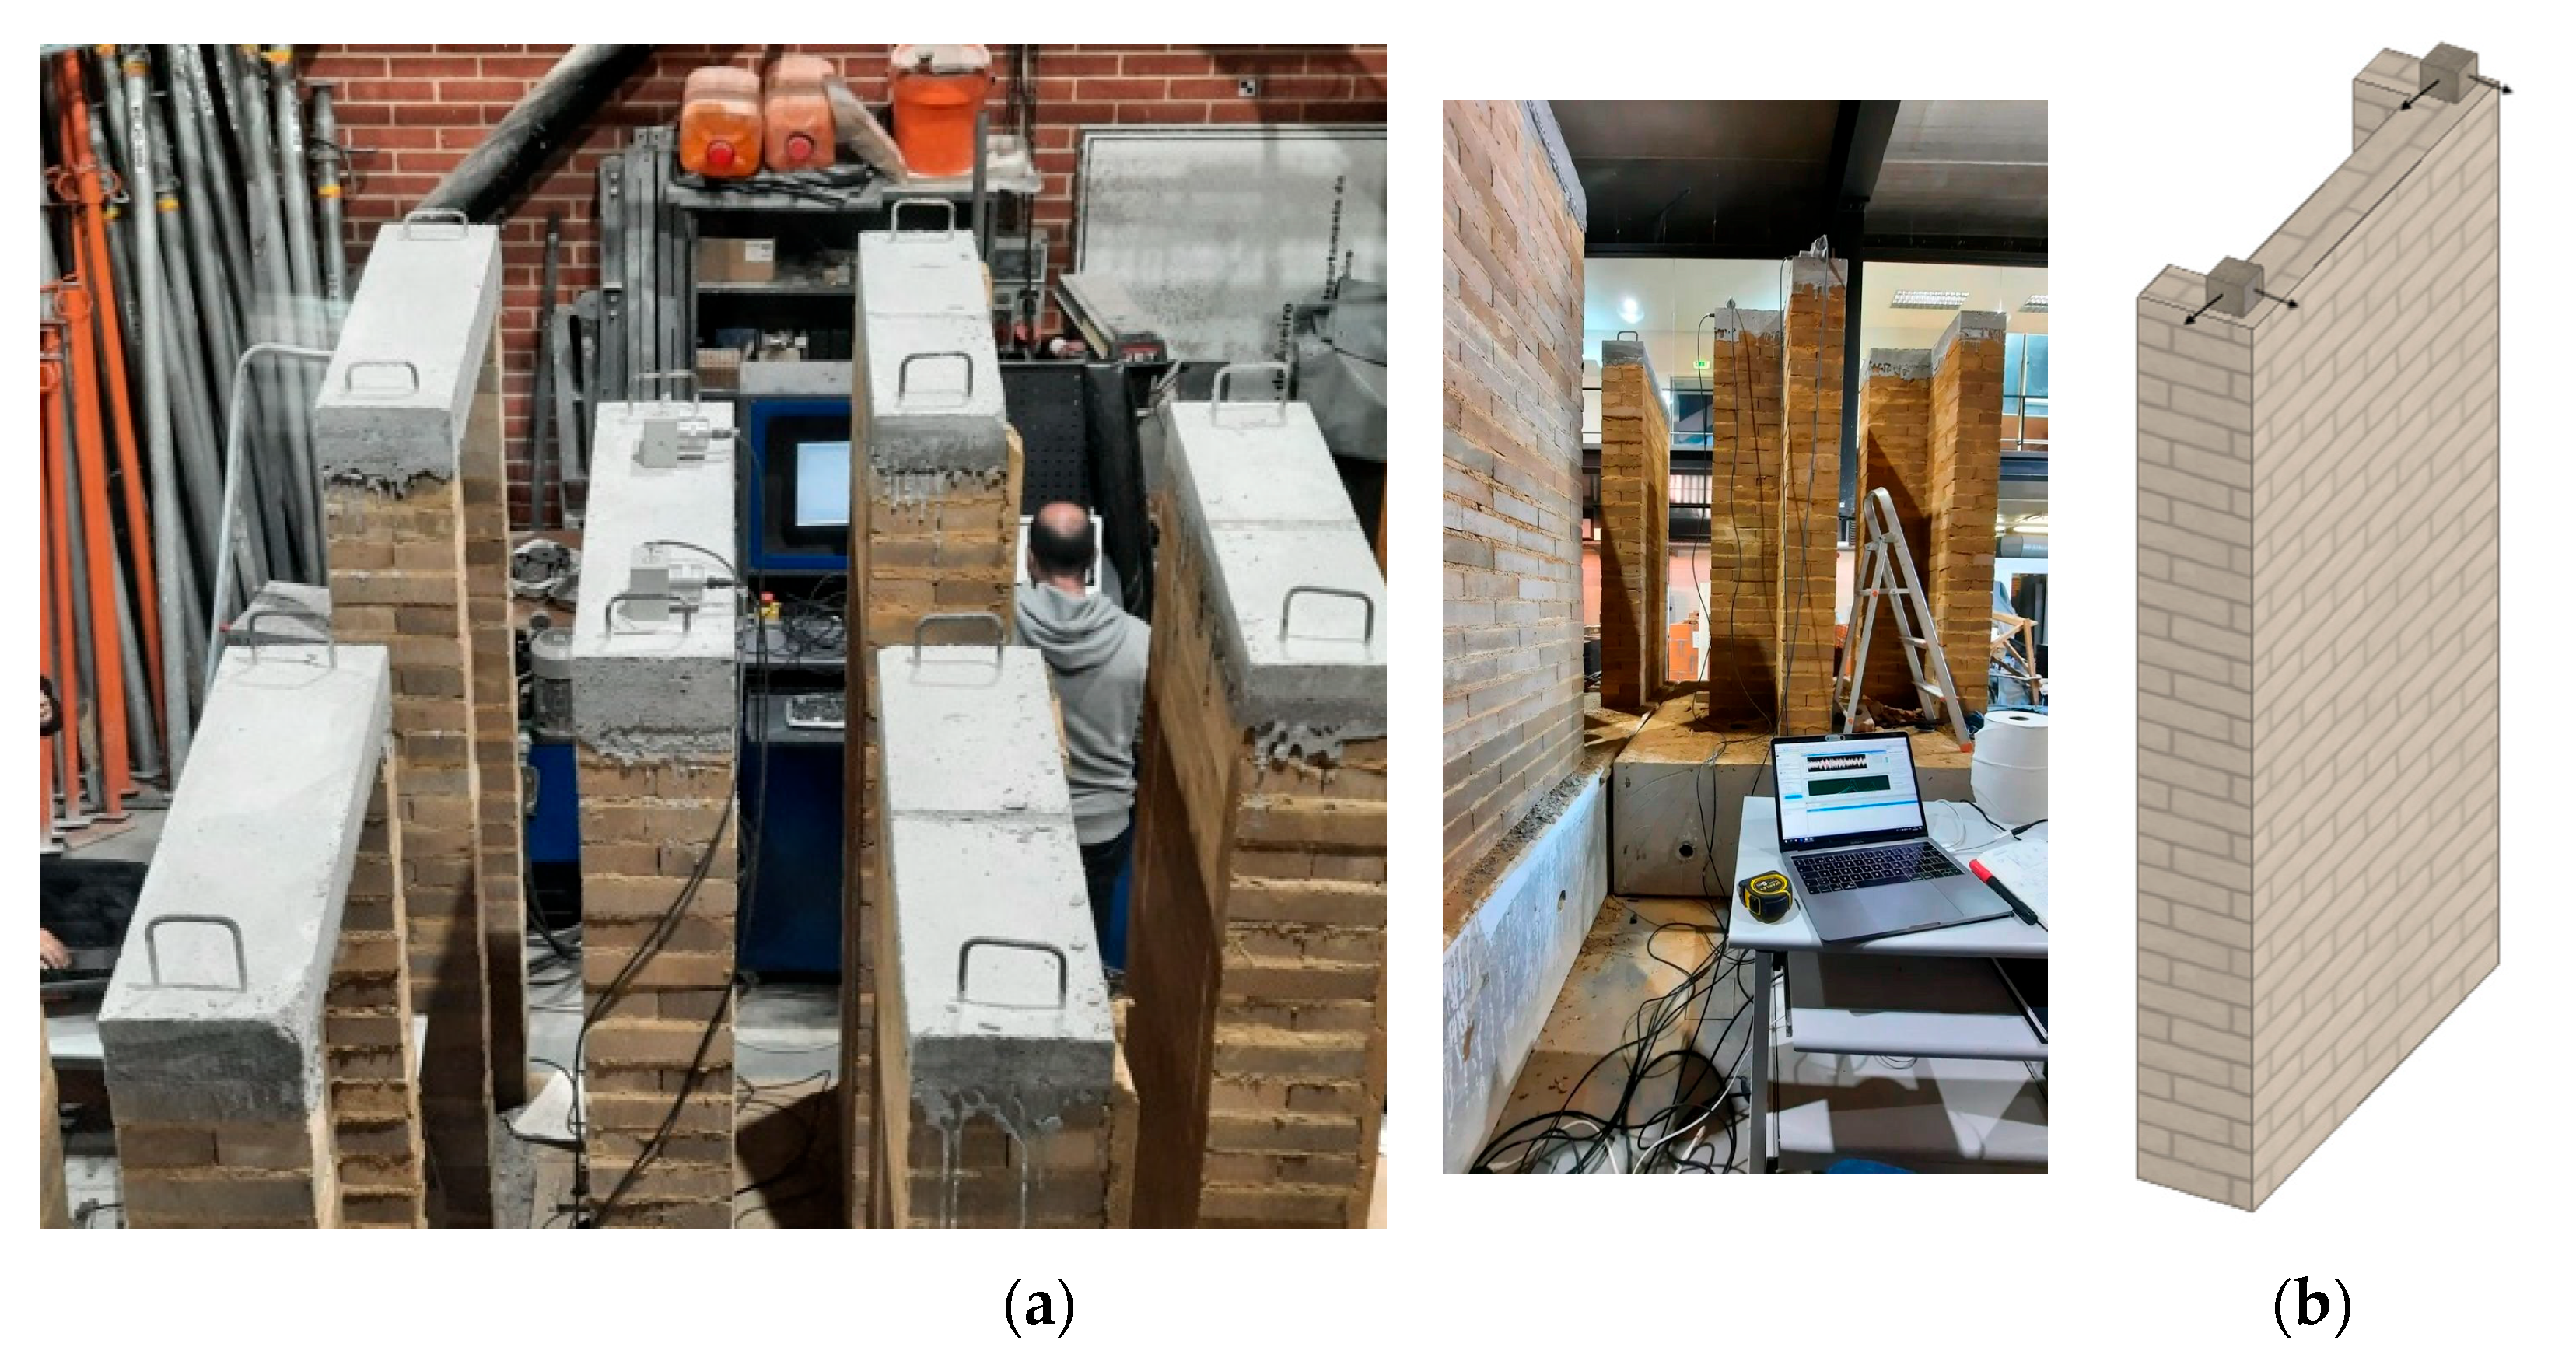
The dynamic characterization tests were performed to obtain the modal shapes and natural frequencies of the walls. The tests were done using four uniaxial accelerometers and the records were taken with one setup, acquiring 600 s with 1500 samples/s.
Figure 7a shows one setup at the time of the test, while the sensors layout is shown in
Figure 7b. Accelerations were measured in both directions at some locations in order to detect both possible in-plane and out-of-plane mode shapes.
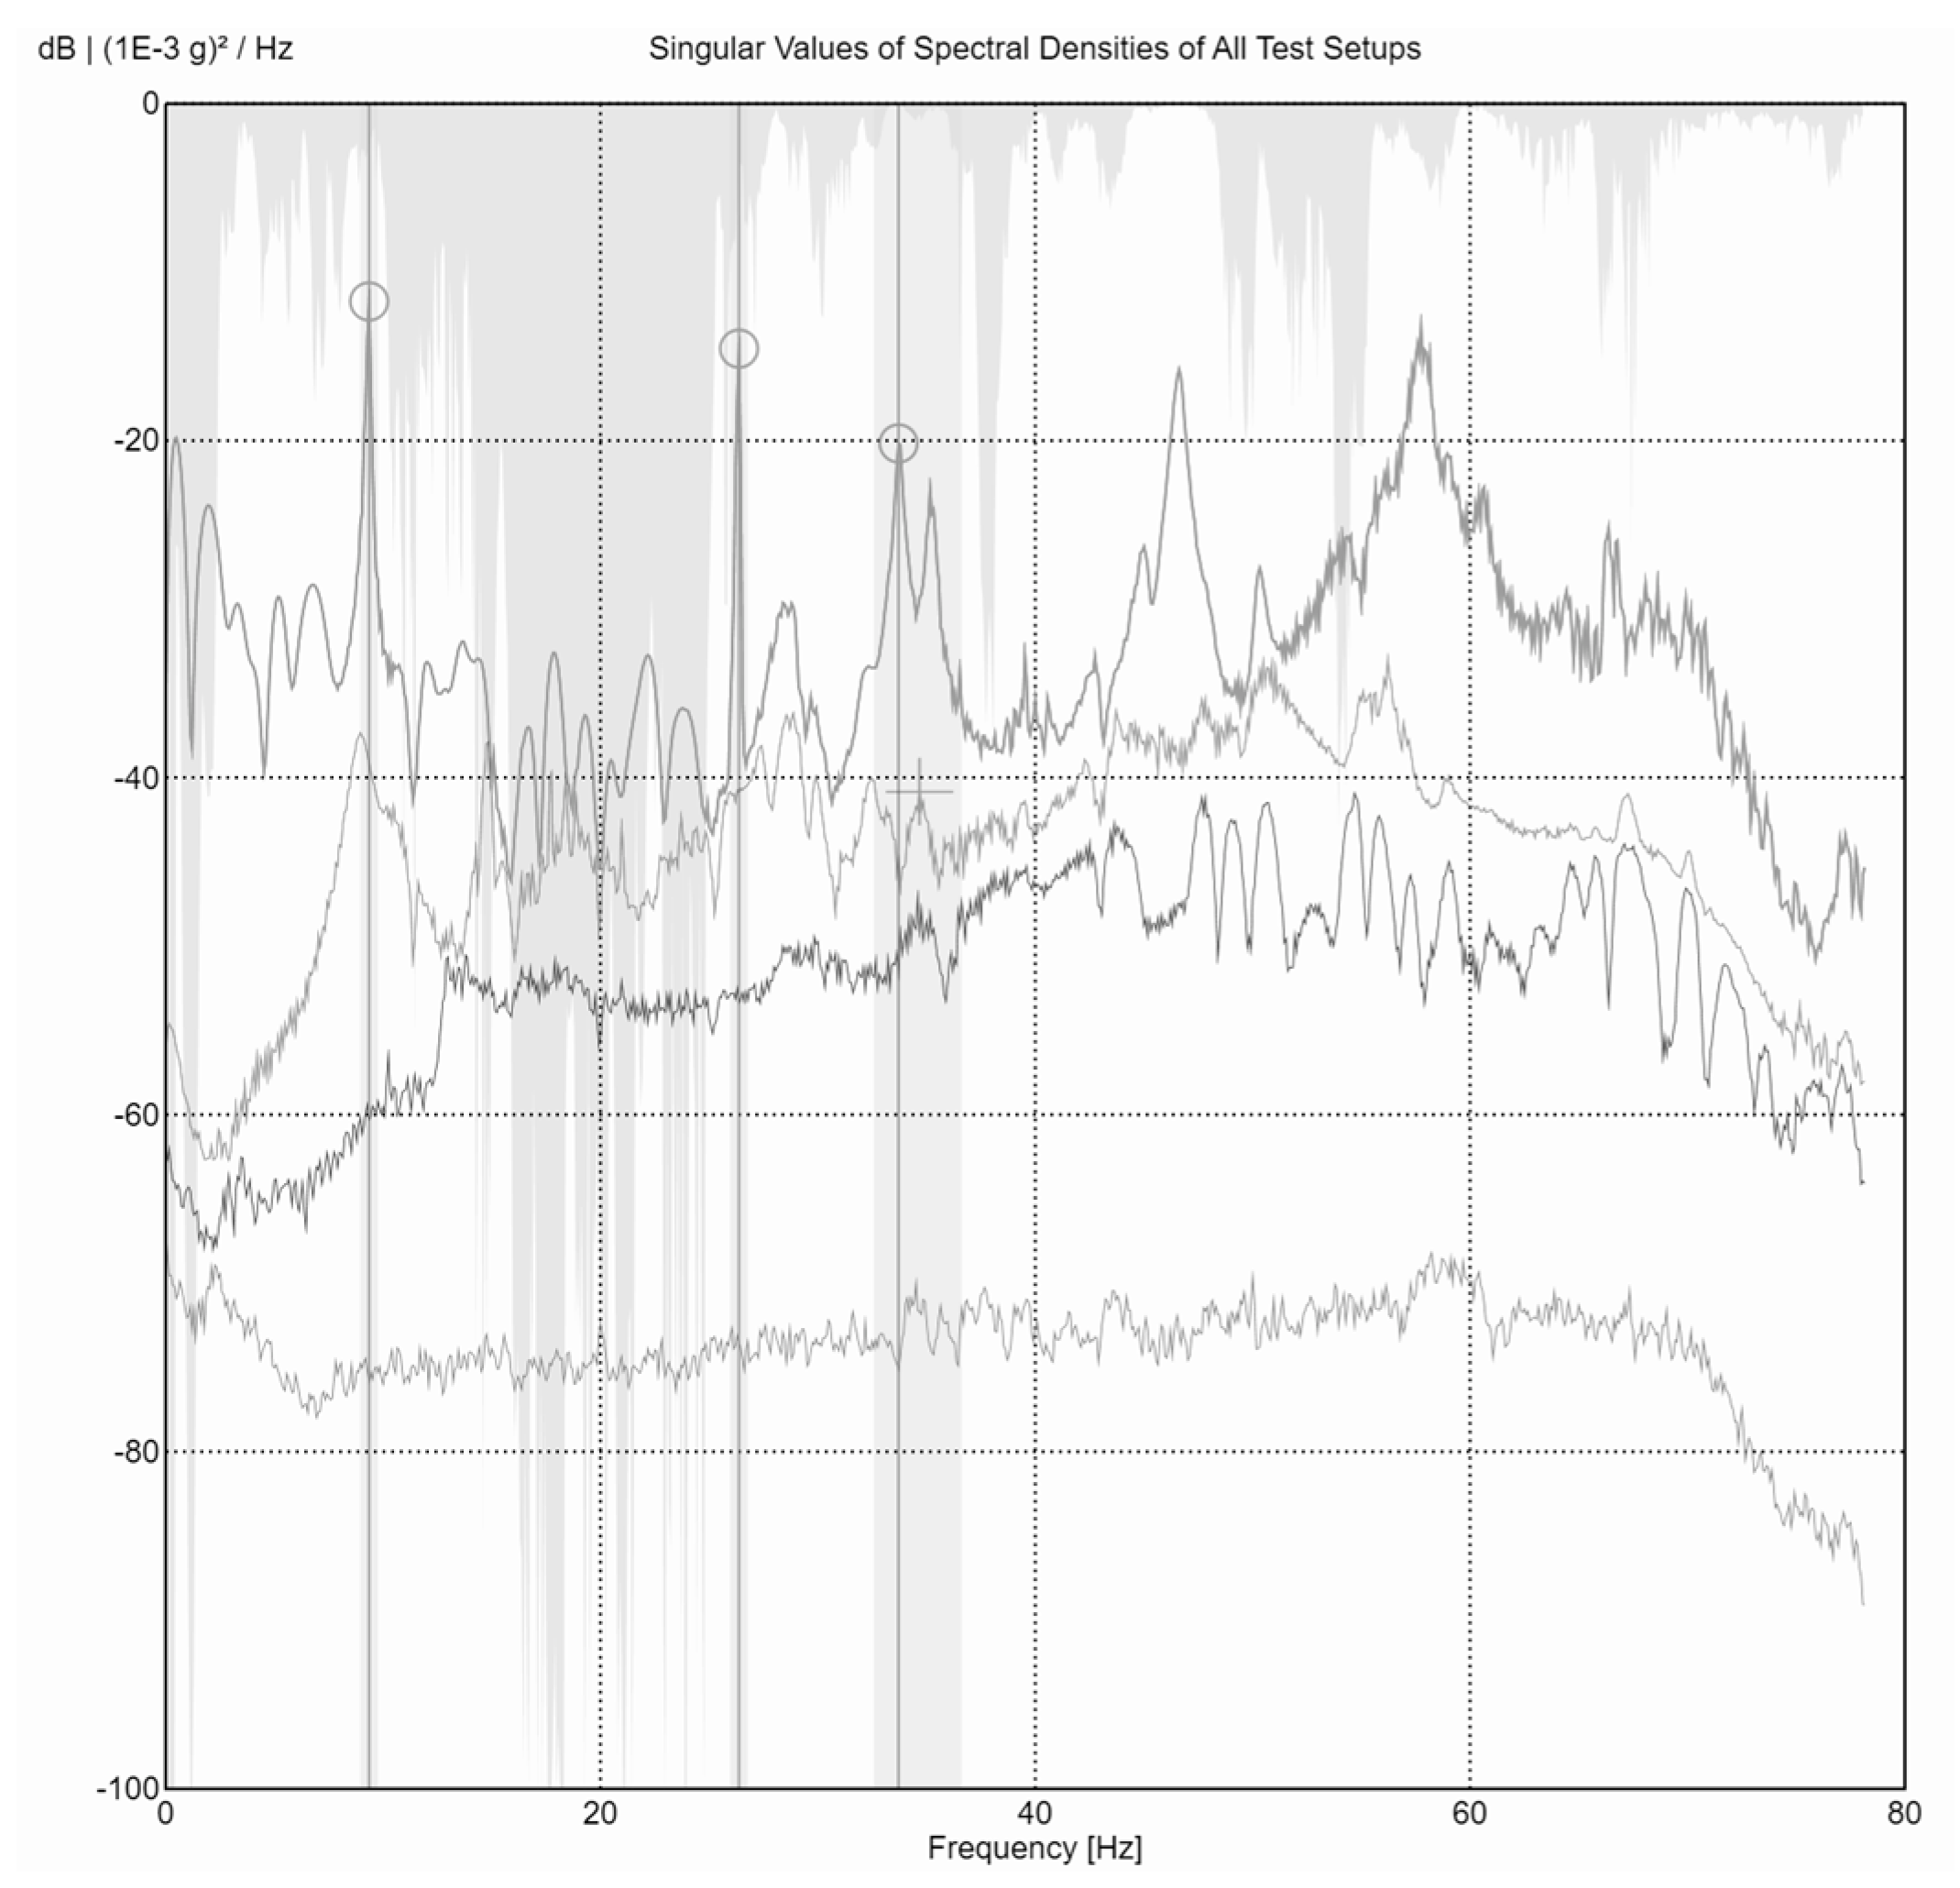
The modal estimation was carried out using ARTeMIS software, which allows analyzing the results from all test setups simultaneously, and the representative singular value plots provided by (traditional) FDD are shown in
Figure 8 with all picked modes. The peak values of frequency were selected using FDD analysis, to later compare the results and determine the natural frequencies of the wall obtained with the numerical model.
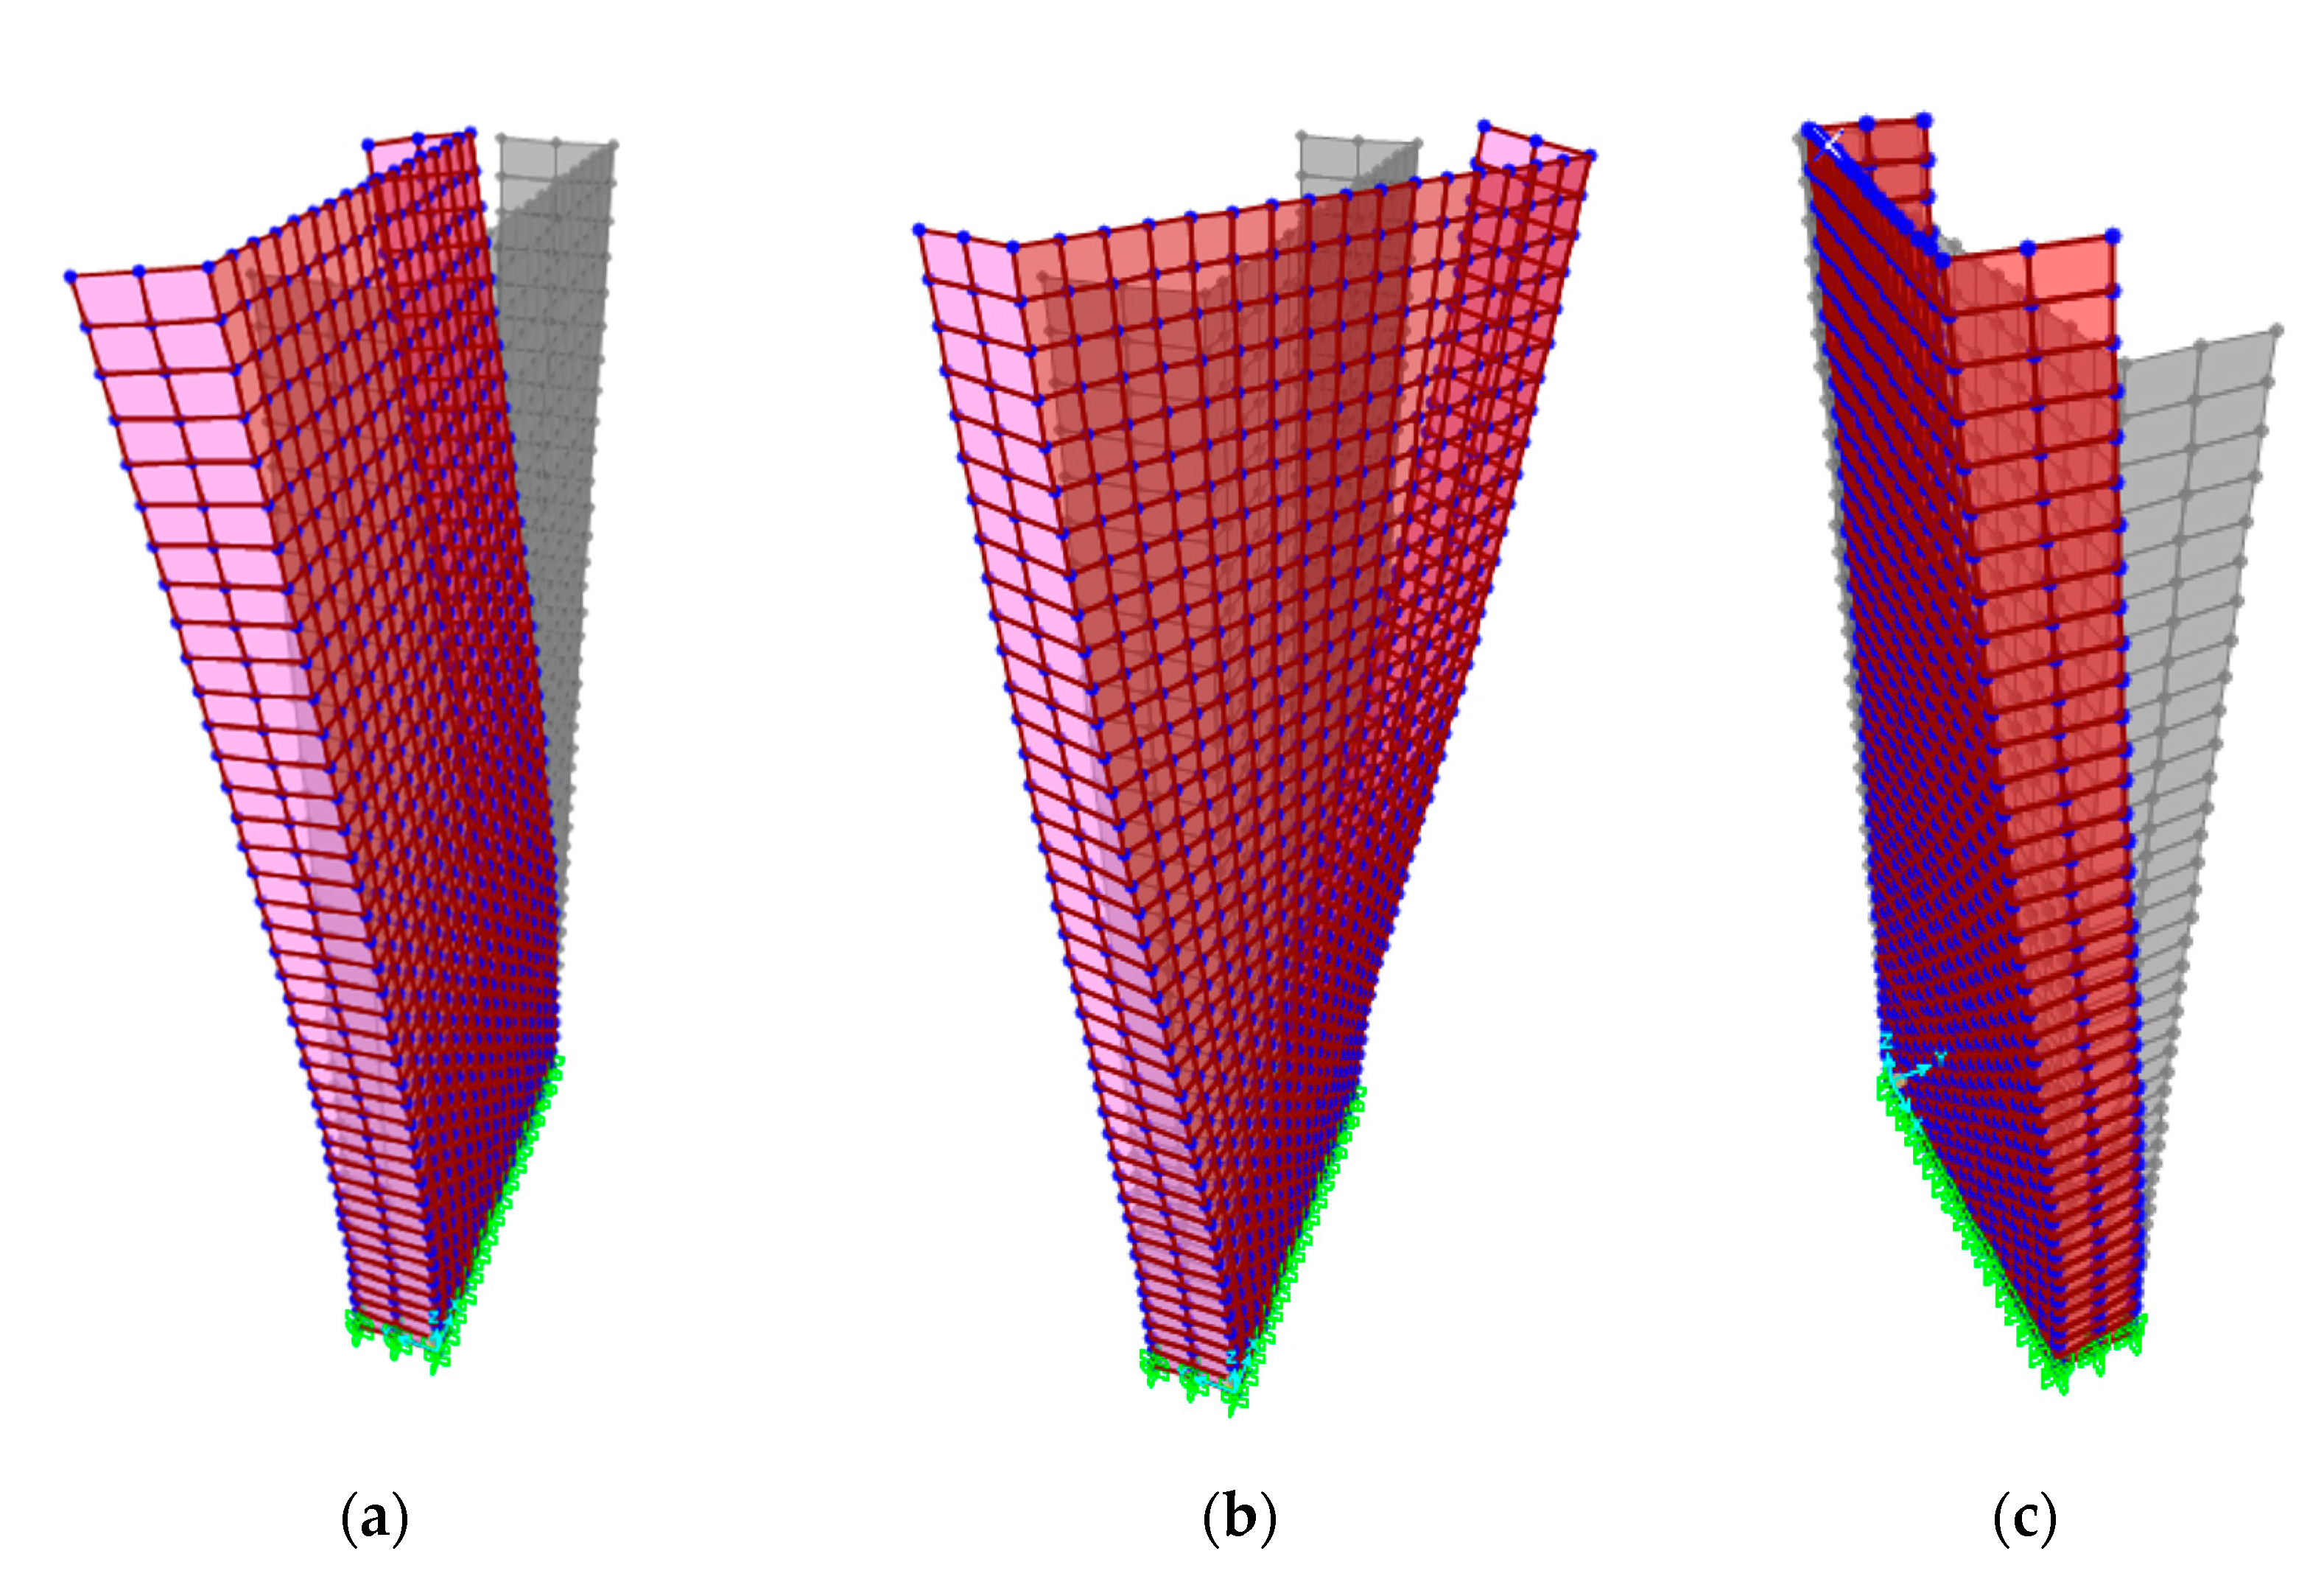
Figure 9 shows the first three identified modes of the walls in terms of mode shape and natural frequency. This first mode consists in the expected out-of-plane vibration of the façade and presents a slight difference in the walls, as seen in
Table 3. The second mode is a torsional mode, and the third mode is in the plane of the wall. The differences observed are most likely related to the construction issues; however, the third mode associated with the in-plane response of the wall was the one where most differences were observed; however, no apparent cause was identified.
5. Numerical Modeling of the Walls
Nowadays, one of the main aims of the non-destructive tests is the calibration/adjustment of the numerical models. The numerical models of the wall’s tests were developed in finite element software SAP2000 V24 using geometry of the wall using layered shell elements, modeled through 800 4-nodes square shell elements and 861 nodes. The mechanical properties of materials were adjusted to fit the experimental values, in terms of Young model, based on the sonic tests and compared with the results obtained in the dynamic identification tests. The model was developed using shell elements considering only the middle plan of the element. The goodness of the fitting based on the experimental values of the frequencies was based on the minimization of the errors in frequencies, which were numerically determined, and those resulting from the measurements performed, thus updating the model of finite elements. The Young modulus was the parameter selected to adjust this calibration, and the error was calculated based on Equation (3), where a
i is the modal mass ratio and n is the number of the experimental mode shapes, considering the first three modes (see
Figure 10). The starting point was the Young modulus obtained with the sonic tests in the vertical direction, and some adjustments were performed to minimize the error in frequencies, which were numerically determined, and those resulting from the measurements performed on site, thus updating the of finite element model.
In the numerical model, a Poisson coefficient of 0.25 was considered, and a density of 1937 kg/m
3 was considered in the sonic tests. A global agreement between the experimental (Exp) and numerical frequencies (Num) was found. The comparison between the natural frequencies from dynamic identification and those from numerical modeling is reported in
Table 4. It is also clear that the main differences observed are related with the third mode. When not considering the third mode, the errors (D
f) would be lower than 1% in all the walls (with exception of wall 3). The value presented in
Table 4 for the Young modulus was the value used in the numerical analysis.
Table 4 also presents the values of the average Young modulus obtained with the sonic tests in the vertical and horizontal directions for each wall. It can be seen that there exists an agreement between the Young modulus considered in the numerical analysis and the Young modulus obtained with the sonic tests in the vertical direction.
The agreement between the numerical and the experimental modal shapes was estimated through the Modal Assurance Criterion (MAC) [
29]. The numerical simulation better approximates the experimental measurements as the MAC approaches to 1.
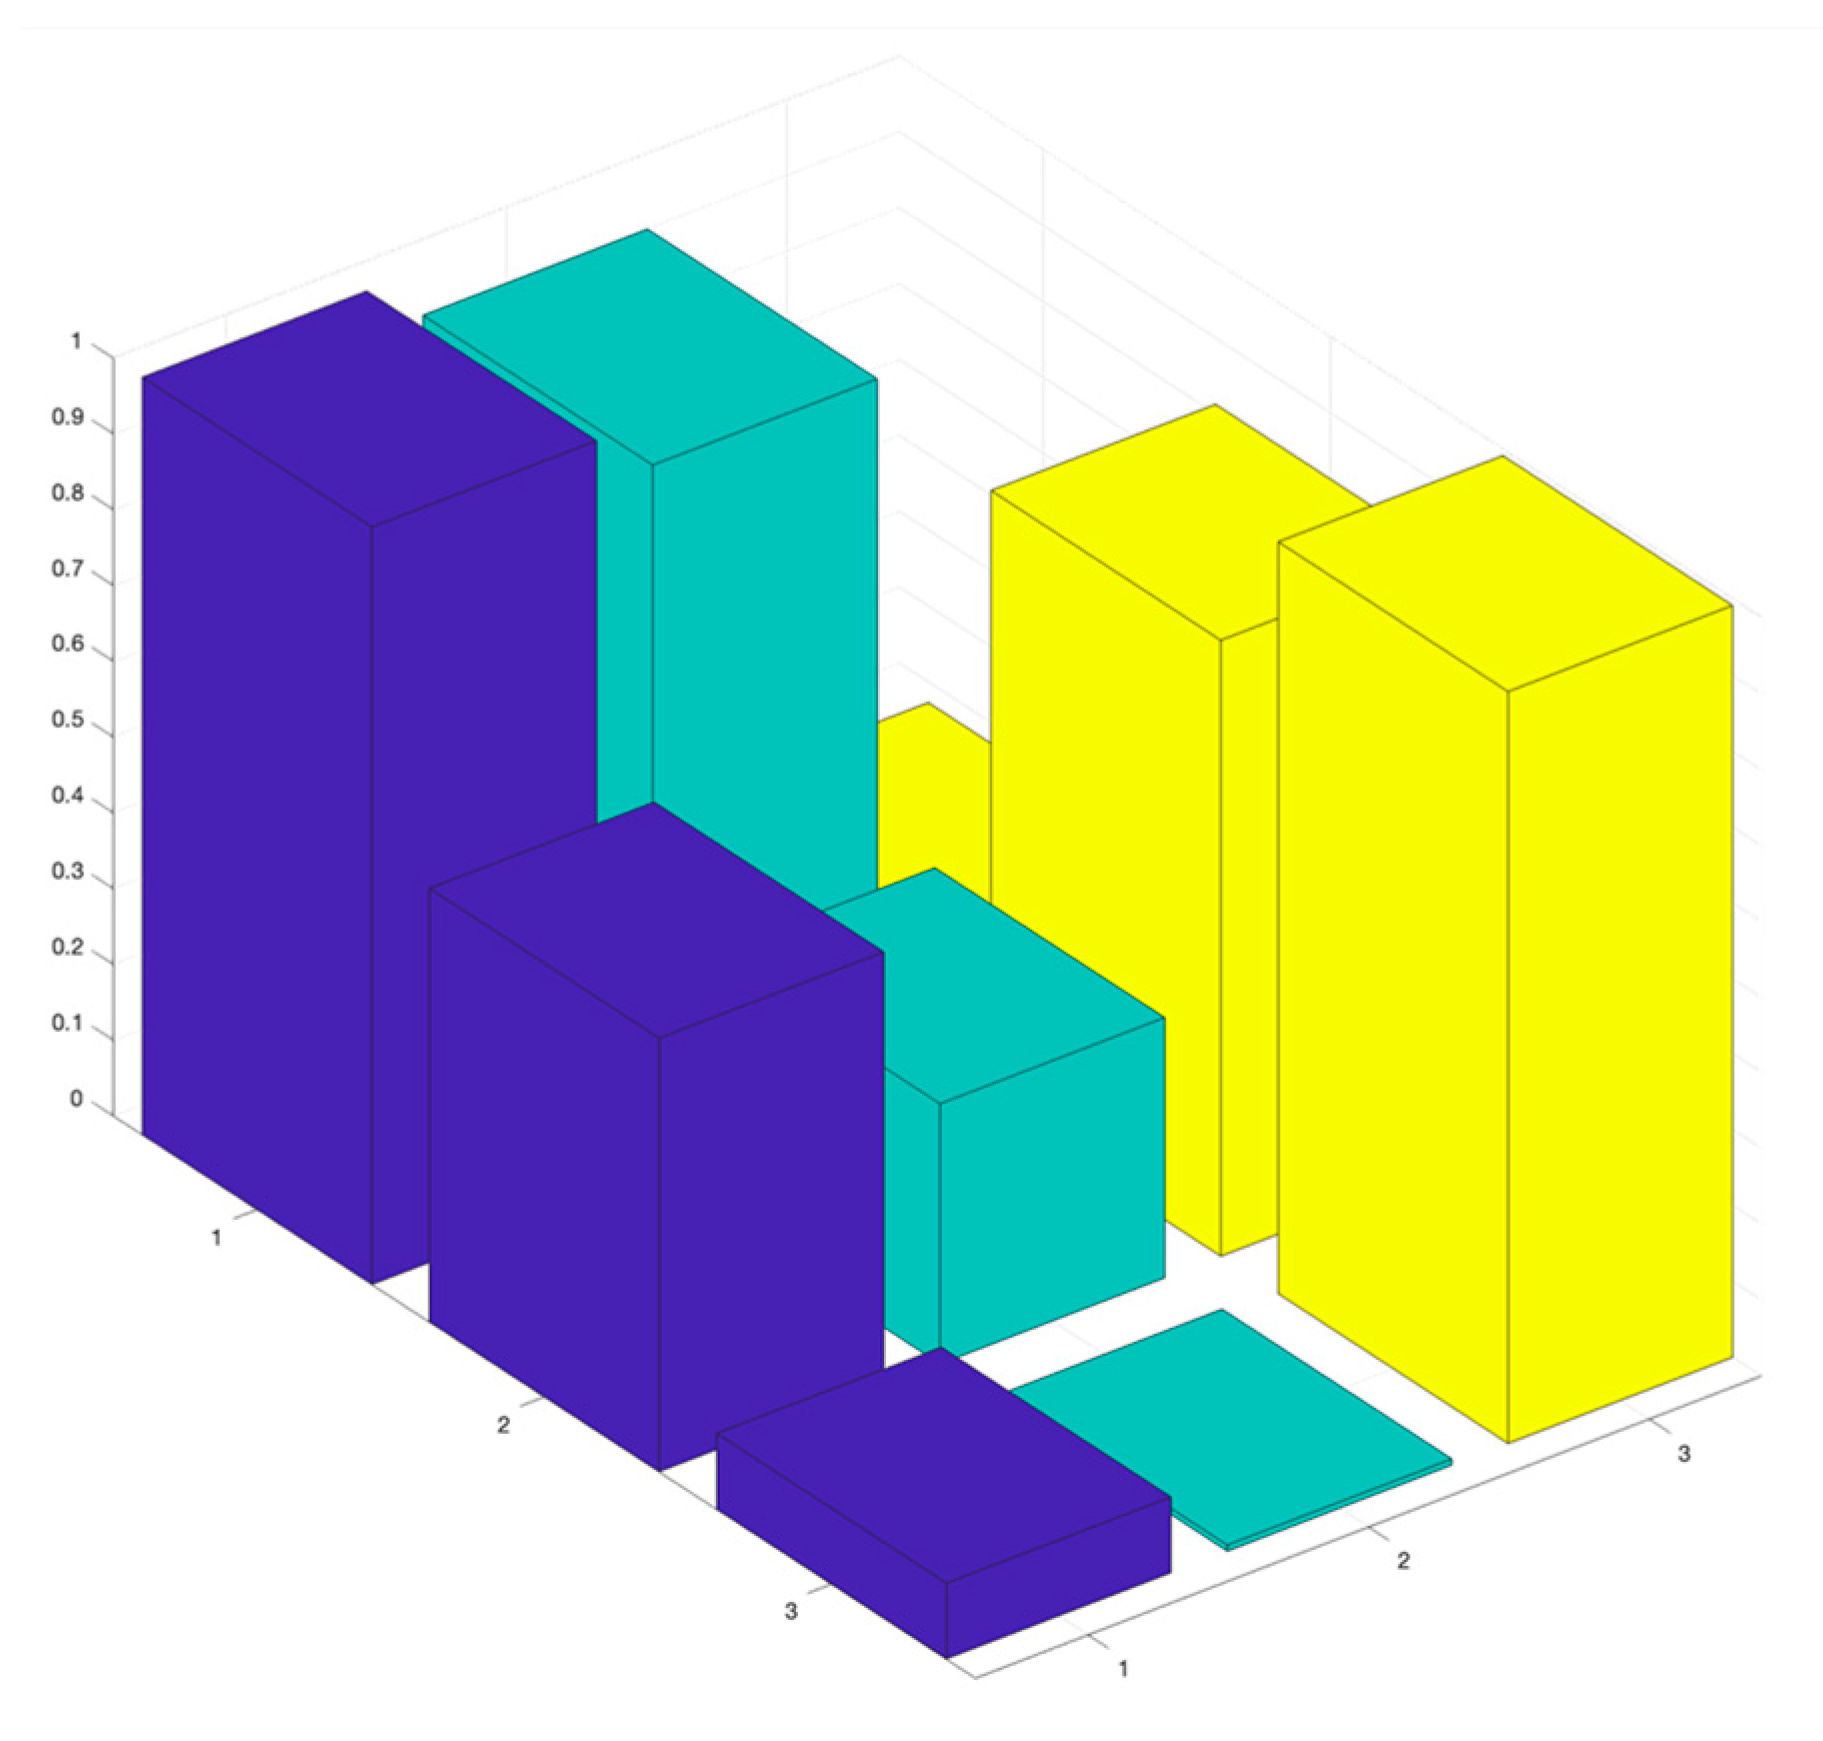
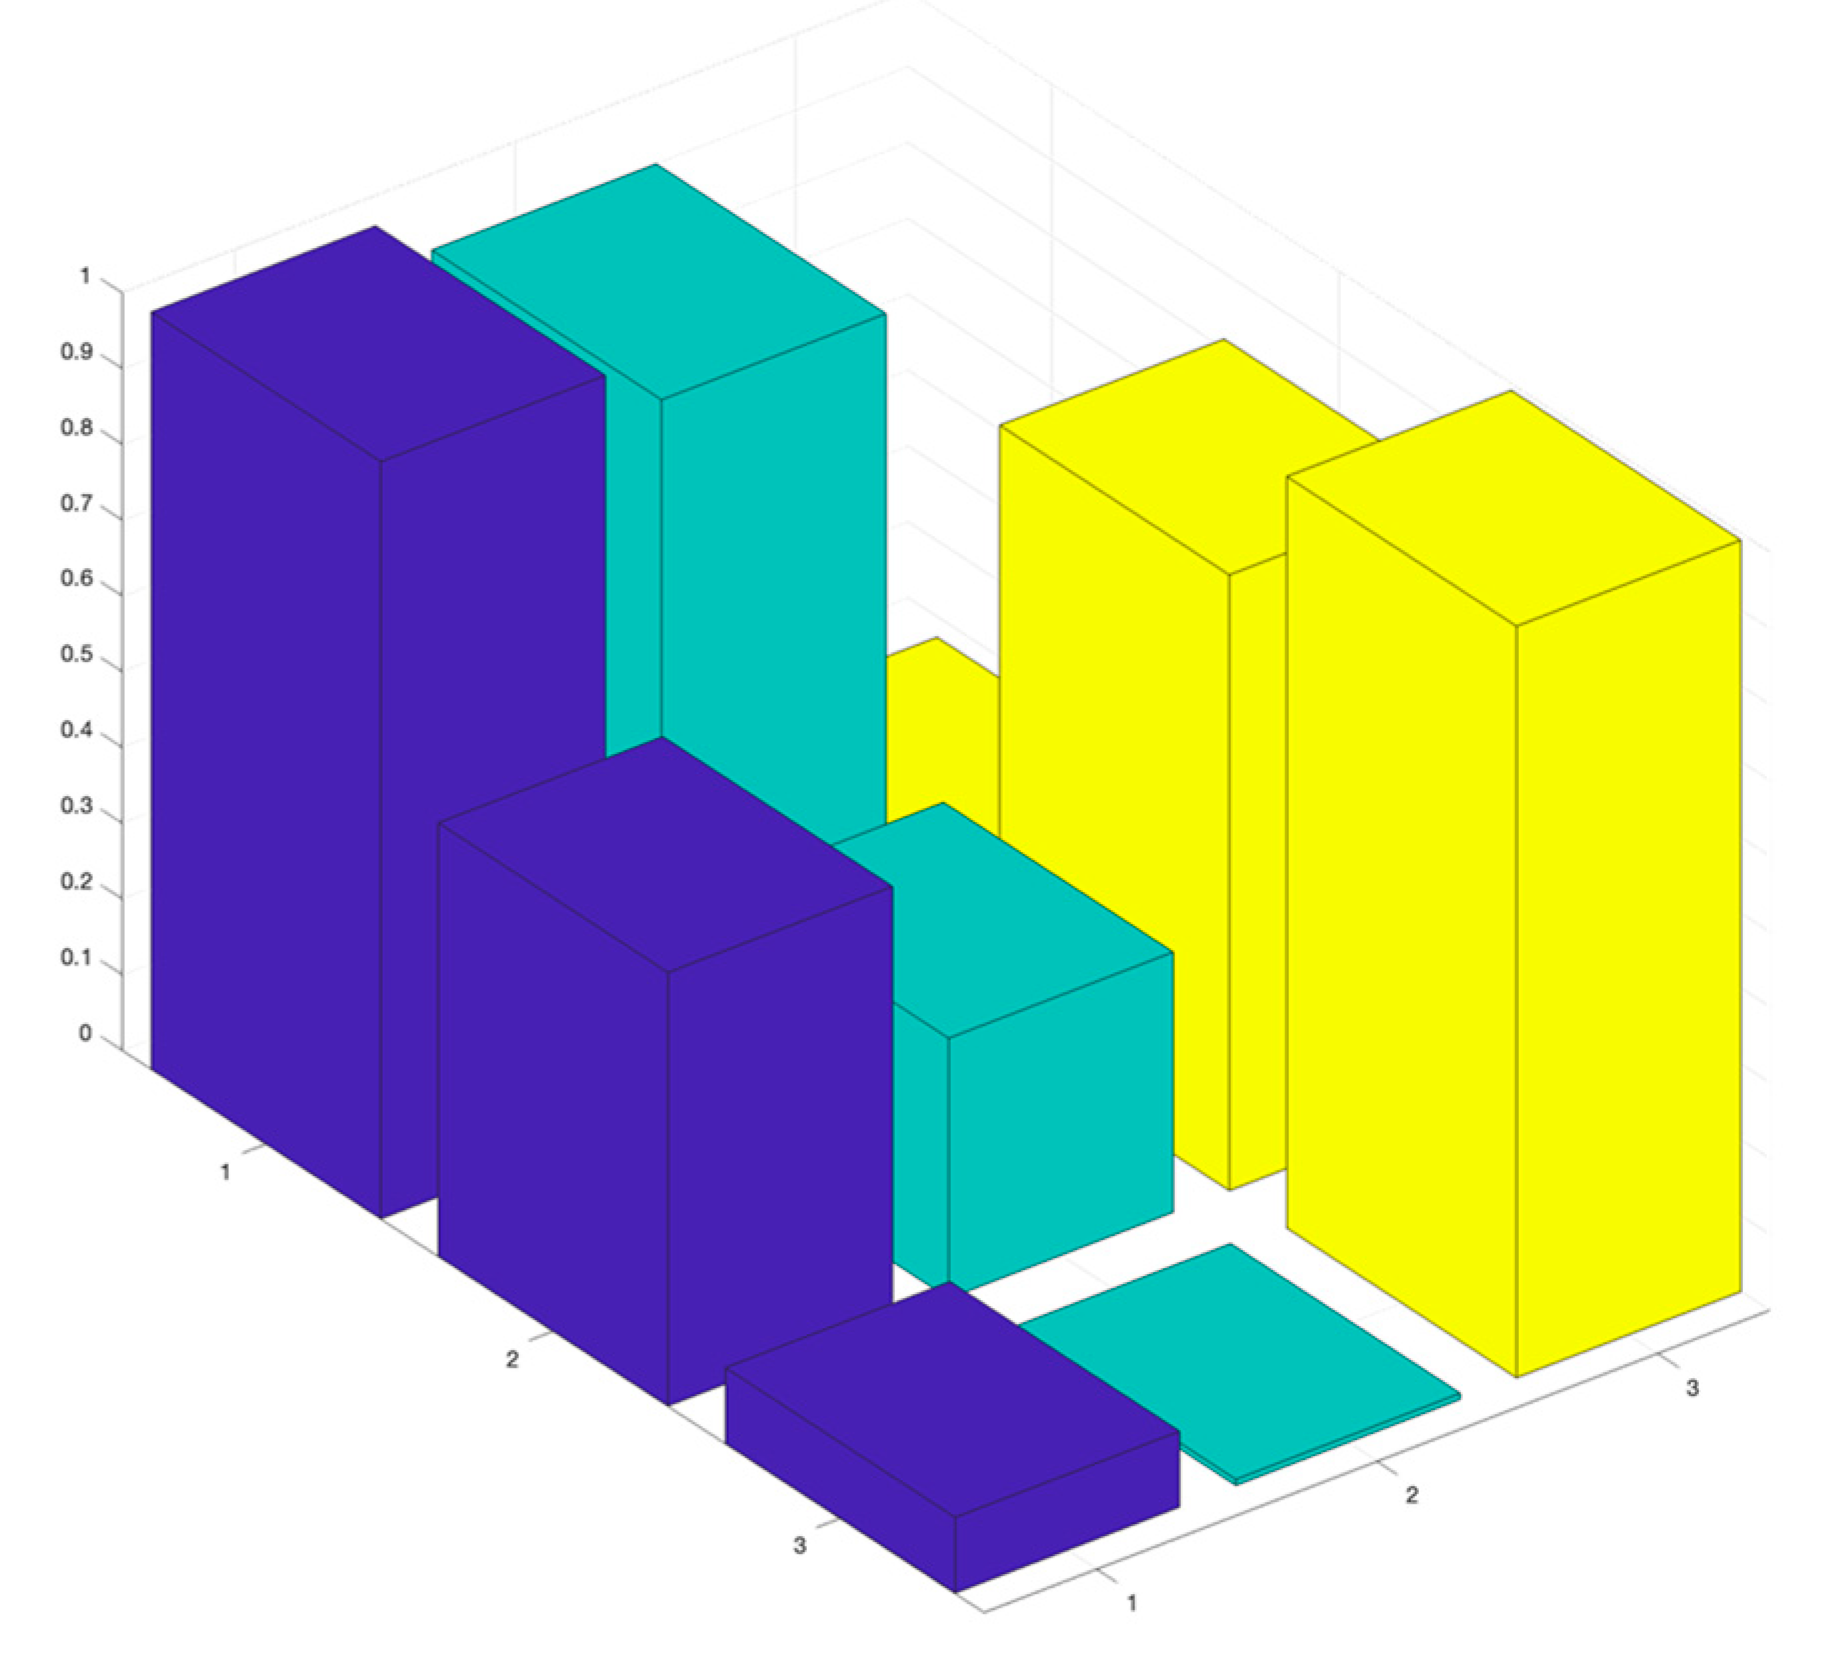
Figure 11 shows the MAC correlation matrix between the experimental and numerical modes. The results reveal that the MAC coefficient is greater than 0.8 for modes 1 and 3, and lower than 0.4 in mode 2, showing a poor correlation in the torsional mode.
6. Conclusions
To the best of the author’s understanding, in order to investigate the structural behavior of specimens of reinforced masonry walls of soil-cement compressed earth blocks, sonic tests were performed on six walls. The results of the tests enabled for the characterization of the walls as a regular and uniform masonry type, with an elasticity modulus that can vary between 3.03 and 3.35 GPa in the vertical direction and 3.14 and 4.84 GPa in the horizontal direction. The fact that the horizontal direction has higher values of elasticity modulus compared to the vertical indicates that it has lesser significant voids throughout the cross section.
A numerical model of each wall was developed, and their mechanical properties were calibrated with the data obtained from the sonic tests analysis. The frequencies obtained from the numerical models of the walls were compared with the frequencies obtained from the environmental vibration tests, using the modal assurance criterion, and it allowed a good correlation in terms of frequencies in modes 1 and 3. In turn, mode 2, which corresponds to the torsional mode, presented a poor correlation.
According to this correlation, it is possible to assume that the elasticity modulus obtained by the indirect tests in the vertical slope was the best approach. Nevertheless, the elasticity modulus obtained in the indirect tests in the horizontal slope has a 10–20% of overestimation.
From this study, it is possible to conclude that sonic tests provide reliable data that can be used to characterize masonry structures, and that the indirect tests configuration is the one that is most likely to be carried out on existing structures as the emitter and the receiver are on the same face of the structure. Furthermore, the combined methodology of using sonic and environmental vibration tests allows the calibration and validation of numerical models of masonry structures and for the assessment of the state of conservation and structural safety.
The approach for the indirect characterization of these materials has several limitations and the proposed relations seem to point to a good empirical relationship of some physical–mechanical properties, namely the Young modulus. The combination of several NDTs, namely sonic and dynamic tests, seem to have a great use once they are completely non-destructive; however, there are some factors that may influence the results, like moisture, damages, and cracks. Additional comparisons should be made with other types of techniques that are more destructive to be compared with Young modulus, which are obtained with different tests. Otherwise, future comparisons should be made to determine the correlation with other parameters and other mechanical properties.
Author Contributions
Conceptualization, H.R., L.T.D.G., A.T. and A.C.; methodology, H.R., I.B. and J.F.; formal analysis, I.B. and H.R.; investigation, L.T.D.G., I.B., H.R., J.F., A.T. and A.C.; resources, L.T.D.G. and A.C.; writing—original draft preparation, I.B.; writing—review and editing, H.R. and L.T.D.G.; supervision, H.R., L.T.D.G. and A.C.; project administration, L.T.D.G. and A.C. All authors have read and agreed to the published version of the manuscript.
Funding
Leandro Di Gregorio thanks the SHS Project’s team and to UFRJ for his postdoctoral work license. This work was also supported by the Foundation for Science and Technology (FCT)—Aveiro Research Centre for Risks and Sustainability in Construction (RISCO), Universidade de Aveiro, Portugal [FCT/UIDB/ECI/04450/2020]. Inês Bourgeois acknowledges Foundation for Science and Technology (FCT) for the PhD grant, with reference PRT/BD/152876/2021. Alice Tavares developed her part of the work within the scope of the project CICECO-Aveiro Institute of Materials, UIDB/50011/2020, UIDP/50011/2020 & LA/P/0006/2020 and 2021.03830. CEECIND financed by national funds through the FCT/MCTES (PIDDAC). Moreover, Jorge Fonseca acknowledges Foundation for Science and Technology (FCT) for the PhD grant, with reference 2022.13794.BD.
Institutional Review Board Statement
Not applicable.
Informed Consent Statement
Not applicable.
Data Availability Statement
The data presented in this study are available on request from the corresponding author.
Acknowledgments
The authors acknowledge the support of the Civil Construction Department of the Polytechnic School of UFRJ in the manufacture of the blocks and construction of the specimens. The authors also acknowledge Vagoinertes, LDA., that provided the soil, water, electricity, and storage.
Conflicts of Interest
The authors declare no conflict of interest.
References
- Lombillo, I.; Thomas, C.; Villegas, L.; Fernández-Álvarez, J.; Norambuena-Contreras, J. Mechanical characterization of rubble stone masonry walls using non and minor destructive tests. Constr. Build. Mater. 2013, 43, 266–277. [Google Scholar] [CrossRef]
- Martini, R.; Carvalho, J.; Barraca, N.; Arêde, A.; Varum, H. Advances on the use of non-destructive techniques for mechanical characterization of stone masonry: GPR and sonic tests. Procedia Struct. Integr. 2017, 5, 1108–1115. [Google Scholar] [CrossRef]
- Sadri, A. Application of impact-echo technique in diagnoses and repair of stone masonry structures. NDT E Int. 2003, 36, 195–202. [Google Scholar] [CrossRef]
- Valluzzi, M.R.; Cescatti, E.; Cardani, G.; Cantini, L.; Zanzi, L.; Colla, C.; Casarin, F. Calibration of sonic pulse velocity tests for detection of variable conditions in masonry walls. Constr. Build. Mater. 2018, 192, 272–286. [Google Scholar] [CrossRef]
- Ferreira, T.M.; Ortega, J.; Rodrigues, H. Geometrical, constructive, and mechanical characterization of the traditional masonry buildings in the historic city center of Leiria, Portugal. In Masonry Construction in Active Seismic Regions; Elsevier: Amsterdam, The Netherlands, 2021; pp. 147–174. [Google Scholar]
- Miranda, L.; Cantini, L.; Guedes, J.; Costa, A. Assessment of mechanical properties of full-scale masonry panels through sonic methods. Comparison with mechanical destructive tests. Struct Control Health Monit 2016, 23, 503–516. [Google Scholar] [CrossRef]
- Grazzini, A. Sonic and Impact Test for Structural Assessment of Historical Masonry. Appl. Sci. 2019, 9, 5148. [Google Scholar] [CrossRef] [Green Version]
- Miranda, L.; Cantini, L.; Guedes, J.; Binda, L.; Costa, A. Applications of Sonic Tests to Masonry Elements: Influence of Joints on the Propagation Velocity of Elastic Waves. J. Mater. Civ. Eng. 2013, 25, 667–682. [Google Scholar] [CrossRef]
- Pedroso, M.; Rodrigues, H.; Humberto, V.; Arêde, A. Dynamic Measurements as Support to the Assessment of the Monastery of Santa Maria Da Vitoria, Batalha. In Nondestructive Techniques for the Assessment of Historic Structures; CRC Press: Boca Raton, FL, USA, 2017; pp. 159–171. [Google Scholar]
- Peña, F.; Lourenco, P.B.; Mendes, N.; Oliveira, D.V. Numerical models for the seismic assessment of an old masonry tower. Eng. Struct. 2010, 32, 1466–1478. [Google Scholar] [CrossRef] [Green Version]
- Ivorra, S.; Pallarés, F.J. Dynamic investigations on a masonry bell tower. Eng. Struct. 2006, 28, 660–667. [Google Scholar] [CrossRef]
- Barkhordari, M.S.; Armaghani, D.J.; Asteris, P.G. Structural Damage Identification Using Ensemble Deep Convolutional Neural Network Models. Comput. Model. Eng. Sci. 2023, 134, 835–855. [Google Scholar] [CrossRef]
- He, Y.; Huang, Z.; Liu, D.; Zhang, L.; Liu, Y. A Novel Structural Damage Identification Method Using a Hybrid Deep Learning Framework. Buildings 2022, 12, 2130. [Google Scholar] [CrossRef]
- Yang, C.; Liang, K.; Zhang, X. Strategy for sensor number determination and placement optimization with incomplete information based on interval possibility model and clustering avoidance distribution index. Comput. Methods Appl. Mech. Eng. 2020, 366, 113042. [Google Scholar] [CrossRef]
- Khan, S.; Yairi, T. A review on the application of deep learning in system health management. Mech. Syst. Signal Process. 2018, 107, 241–265. [Google Scholar] [CrossRef]
- Feng, D.; Feng, M.Q. Computer vision for SHM of civil infrastructure: From dynamic response measurement to damage detection—A review. Eng. Struct. 2018, 156, 105–117. [Google Scholar] [CrossRef]
- Di Gregorio, L.; Guimarães, G.; Tenório, M.; Lima, D.; Haddad, A.; Danziger, F.; Jannuzzi, G.; Santos, S.; Lima, S. The Potential of CEB Reinforced Masonry Technology for (Re)construction in the Context of Disasters. Materials 2020, 13, 3861. [Google Scholar] [CrossRef]
- Associação Brasileira de Normas Técnicas—ABNT. NBR 8492: Tijolo Maciço de Solo-Cimento—Determinação da Resistência à Compressão e da Absorção D’água; ABNT: São Paulo, Brazil, 1984; Available online: https://www.abnt.org.br (accessed on 26 January 2023).
- BS EN1015-3:1999; Methods of Test for Mortar for Masonry. iTeh Standards: Toronto, ON, Canada, 1999.
- Filipe, L.; Miranda, B. Ensaios Acústicos e de Macacos Planos em Alvenarias Resistentes; FEUP: Porto, Portugal, 2011; Available online: http://hdl.handle.net/10216/65734 (accessed on 26 January 2023).
- Manning, E.C.; Ramos, L.F.; Fernandes, F.M. Direct Sonic and Ultrasonic Wave Velocity in Masonry under Compressive Stress; IMS: Hong Kong, China, 2014. [Google Scholar]
- Ai, H.A.; Ahrens, T.J. Effects of shock-induced cracks on the ultrasonic velocity and attenuation in granite. J. Geophys. Res. Atmos. 2007, 112. [Google Scholar] [CrossRef] [Green Version]
- Miranda, L.; Rio, J.; Guedes, J.M.; Costa, A. Sonic Impact Method—A new technique for characterization of stone masonry walls. Constr. Build. Mater. 2012, 36, 27–35. [Google Scholar] [CrossRef]
- Suits, L.D.; Sheahan, T.C.; Tallavó, F.; Cascante, G.; Pandey, M.D. New Methodology for Source Characterization in Pulse Velocity Testing. Geotech. Test. J. 2009, 32. [Google Scholar] [CrossRef]
- BHalling, W.M.; Muhammad, I.; Member, S.; Womack, K.C. Dynamic Field Testing for Condition Assessment of Bridge Bents. J. Struct. Eng. 2001, 127, 161–167. [Google Scholar] [CrossRef]
- Johnson, A.P.; Hannen, W.R. Vibration Limits for Historic Buildings and Art Collections. APT Bull. J. Preserv. Technol. 2015, 46, 66–74. [Google Scholar]
- Colapietro, D.; Fiore, A.; Netti, A.; Fatiguso, F.; Marano, G.; de Fino, M.; Cascella, D.; Ancona, A. Dynamic identification and evaluation of the seismic safety of a masonry bell tower in the south of Italy. In Proceedings of the ECCOMAS Thematic Conference—COMPDYN 2013: 4th International Conference on Computational Methods in Structural Dynamics and Earthquake Engineering, Proceedings—An IACM Special Interest Conference, Kos Island, Greece, 12–14 June 2013; pp. 3459–3470. [Google Scholar]
- Rainieri, C.; Fabbrocino, G.; Verderame, G. Non-destructive characterization and dynamic identification of a modern heritage building for serviceability seismic analyses. NDT E Int. 2013, 60, 17–31. [Google Scholar] [CrossRef]
- Pastor, M.; Binda, M.; Harčarik, T. Modal Assurance Criterion. Procedia Eng. 2012, 48, 543–548. [Google Scholar] [CrossRef]
| Disclaimer/Publisher’s Note: The statements, opinions and data contained in all publications are solely those of the individual author(s) and contributor(s) and not of MDPI and/or the editor(s). MDPI and/or the editor(s) disclaim responsibility for any injury to people or property resulting from any ideas, methods, instructions or products referred to in the content. |
© 2023 by the authors. Licensee MDPI, Basel, Switzerland. This article is an open access article distributed under the terms and conditions of the Creative Commons Attribution (CC BY) license (https://creativecommons.org/licenses/by/4.0/).


 ,
, 


