Biofouling Removal Using a Novel Electronic System for Driving an Array of High Power Marinised Transducers


1
Brunel Innovation Centre, Brunel University London, Uxbridge UB8 3PH, UK
2
TWI Ltd., Granta Park, Great Abignton, Cambridge CB21 6AL, UK
*
Authors to whom correspondence should be addressed.
Appl. Sci. 2023, 13(6), 3749; https://doi.org/10.3390/app13063749
Submission received: 10 January 2023
/
Revised: 8 February 2023
/
Accepted: 14 February 2023
/
Published: 15 March 2023
(This article belongs to the Section Mechanical Engineering)
Abstract
:This paper explains producing a novel ultrasonic system to remove/prevent biofouling growth from wind turbines’ access ladders by means of producing local ultrasound cavitation. Using bespoke hardware, an array of high-power ultrasound transducers (HPUTS) and optimally synthesized signal types to remove/prevent biofouling growth from the ladder without violating the standard noise level in the sea is explained. This is a non-toxic and non-invasive solution to detach biofouling and prevent biofilm initiation on offshore structures. It is shown that the marinisation of the HPUT slightly shifts the main resonance frequency from 28.1 to 27.5 kHz. The vibration output from the HPUTs with different mounting systems showed that the transducer with the horn could vibrate the plate at 20 cm from the excitation point, with 300 pm, six times higher than the vibration output from the marinised HPUT. A transducer array and attachment are proposed to make the ultrasound noise below the standard underwater noise limits. The produced sound pressure level (SPL) and sound equivalent level (SEL) from the proposed ultrasonic system was measured. It was specified that the SPL came below 120 dB at 25 m from the excitation point and the SEL value below the 173 dB limit. Finally, the effectiveness of the marinised HPUTS on biofouling removal has been demonstrated with an in-situ measurement, and it was indicated that local biofouling removal could be achieved.
1. Introduction
A layer of an organism called biofilm rapidly covers any surface submerged in the sea. They work as a foundation for biofouling growth. Biofouling is the accumulation of microorganisms, plant algae, or small marine animals that are not wanted on marine structure surfaces. Marine biofouling can be divided into two phases or types; micro and macro biofouling. Microfouling refers to biofilm formed on a material surface due to bacterial activity. Macrofouling refers to the adherence of organisms such as oysters, barnacles, soft corals, and seaweed to produce a fouling community (Figure 1a). It is estimated that 5.7 billion US dollars are spent by governments every year to remove biofouling. Biofouling occurs mainly in the shipping and offshore industry [1]. Traditional techniques to prevent fouling build-up include coating the offshore structure with Teflon and alloys [2,3,4], nanocomposites, plastics, fiber-reinforced polymers, and alloys. However, using chemicals or changing the water pH is not feasible due to environmental concerns. Therefore, water jets are predominately used in the marketplace for biofouling removal. However, as shown in Figure 1b, using such a technique is costly and requires a marine vessel. Furthermore, biofouling removal through a high-pressure water jet cleaning method might damage the coating and add chemicals to the water [5,6].
Exposing the structure to the magnetic and electric field can also remove biofouling [7,8]. In addition, removing biofouling through cavitation generated by ultrasonic waves has been studied by several researchers [9,10]. Cavitation can be defined as small vapor- filled bubbles or voids due to the reduction in the static pressure of the fluid below the liquid’s vapor pressure [11].
Two types of cavitation exist, inertial cavitation and non-inertial cavitation. Inertial cavitation is when a liquid bubble quickly collapses, producing a shock wave [12,13]. It occurs in nature in the strikes of mantis and pistol shrimps and the vascular tissues of plants. Non-inertial cavitation, on the other hand, is the process in which a bubble is forced to oscillate due to some form of input, such as an acoustic field. This type of cavitation is often employed in ultrasonic cleaning baths [14,15].
Inertial cavities collapse and generate shock waves when they enter higher-pressure regions or are exposed to pressure waves [16]. The shock waves are very strong, close to the imploding bubble but attenuate rapidly compared with a typical acoustic wave in the fluid. It is mainly the shock wave energy that removes biofouling from the marine structure [17]. The attenuation value from the shock wave is estimated by the inverse square of the distance until the wave becomes so weak that it follows the underwater acoustic law [18]. Due to such a quick reduction in the shock wave amplitude, Lais et al. [19] recommended using an array of transducers for biofouling removal. When microbubbles are exposed to even low-intensity ultra-sonification, a shock wave, and water jet can be produced. Such a phenomenon was used by Agarwal et al. [20] for biofouling removal. Therefore, to detach biofouling from marine structures, it is crucial to understand the interaction between the microbubbles and ultrasound waves.
High-power ultrasound transducers can be optimized to produce high amplitude vibration for different applications [21], namely in welding [22,23,24], sonochemistry [25], cutting [26], cleaning of different food fouling materials [27], and biofouling removal [17]. A detailed review of power ultrasound’s application has been studied by several researchers. For example, see [28,29]. Moreover, the generation of cavitation by these transducers is exploited in different applications [30]. The threshold for producing cavitation in the water is investigated by several researchers based on broadband noise level [31,32] and other techniques, which are well explained in reference work [33]. Heikkola et al. [34] used an interactive multi-objective optimization method combined with numerical simulation to suggest the transducer shape with the maximum output vibration.
Lais et al. [21] investigated the effect of different horn shapes; cylindrical, conical, exponential, and stepped were investigated to identify the one that could produce the higher vibration amplitude; it was suggested that using a conical shape can produce a higher vibration. A new configuration of the ultrasonic transducer is proposed by Lin et al. [35] to produce high amplitude vibration from the piezoelectric crystal in the longitudinal and radial directions for ultrasonic cleaning purposes.
Moreover, the use of ultrasonic excitation for emitting ultrasound cavitation and hence removing biofouling from the ship hull [36] and boat [37] was achieved by attaching the transducer to the inner part of the ship. Low-intensity ultrasound at 23 kHz was applied by Guo et al. [38] to remove barnacle cyprid. Scherba et al. [39] used a 26 kHz transducer to remove biofilms, such as bacteria, fungi, and viruses, in an ultrasonic bath. In addition, Lee et al. [40] suggested using 28 kHz as an optimal excitation frequency to remove cyanobacteria and algae in an ultrasonic reactor. For biofouling removal from marine structures, the ultrasound vibration produced from the HPUT in the ocean should pose no significant threat to marine animals [41,42].
In this paper, a novel electrical system to simultaneously run an array of marinised HPUTs is explained. The characterizations of the marinised transducer are discussed, and a solution was proposed to prevent transducer heating for its continuous operation. As shown in the literature, when HPUTs operate in the air, they can remove biofouling close to the excitation point [43]. Hence, to remove biofouling from the access ladder of wind turbines, an array of HPUTs are required. A specific transducer mounting and array were proposed to make the sound pressure level and sound exposure level below the limit Sullivan gave [44] and pose no significant threat to marine animals. Finally, an experimental investigation was conducted to illustrate the successful operation of the marinised ultrasonic system for removing local biofilm from a rectangular plate.
2. Electrical Equipment and Assembly to Power the Transducer
The components needed to make a system for biofouling prevention include power ultrasonic cleaning transducers (that are marinised so they can be used in a submerged environment), a power amplifier, a signal generator, firmware, and control software.
2.1. Marinised Power Ultrasonic Transducers
To perform biofouling prevention with ultrasonic, it is required to generate ultrasound cavitations using HPUTs that are marinised for underwater operation. This is necessary to prevent water from entering the internal of the transducer and prevent water from contacting the electrical transducer terminals. As the system is intended to be used underwater for extended periods, the marinisation process should last for a long time and be able to operate at depths of up to 10 m. Figure 2 shows the marinised and non-marinised transducers used in these experiments. The transducers are the 28 kHz 100 W piezoelectric ultrasonic transducers (PZT-4) provided by Beijing Ultrasonic Ltd. in Beijing, China [45], which are designed for ultrasonic cleaning applications and have a frequency of 28 kHz and a power output of 100 W (without marinisation). The “PZT-4” designation refers to the piezoelectric material used in the transducer, lead zirconate titanate (PZT). The transducer’s parts, frontal and back mass and piezoceramics are attached with a prestressed bolt. The frontal radiating surface has a diameter of 68 mm and involves a built-in 10 mm thread for horn attachment.
However, marinisation has one main disadvantage: the mechanical performance of the transducer is degraded. There are two parameters that show this performance loss. The electrical impedance of the transducer is affected by the marinisation, as shown in Figure 3 and Figure 4.
As shown in Figure 3 and Figure 4, at the resonance point of the transducer, electric impedance increases for the marinised transducers from 37.8 to 129 ohms. The effect of marinisation on the transducer is increased damping and a reduction in the effective Q value at resonance. The implication is that the transducers need to be driven with higher voltage to achieve the rated power and exhibit more heat losses.
Tests were performed to measure the mechanical performance of the marinised transducers. In addition, they were compared with a non-marinised version using a laser vibrometer to measure displacements on a plate driven by the transducer. The experimental rig and configuration are illustrated in Figure 5.
Three plain mount configurations were used magnetic holder for straight, straight with resonant horn, and straight screw mount. The Polytec 3D-CLV Vibrometer can measure two types of displacements: average (FFT method) and Peak to Peak (Time domain method).
The displacements were taken at 20, 30, 40, and 50 cm distances from the transducer mounting position. The displacement values in picometers obtained for different mount configurations can be seen in Figure 6.
This indicates that the screw mount configuration, on average, is best for maximizing mechanical power from the transducer to the plate, while the horn mount shows more power being delivered at a short distance.
The graph in Figure 7 shows the maximum averaged peak-to-peak displacements values obtained using a marinised and non-marinised version of the same transducer in different configurations. The measurement was done in by 16 times averaging to reduce the inclusion of the error.
These results show a loss in mechanical energy of the marinised transducers. To counter the effect of the mechanical losses, the electrical power to the transducer should be raised. As shown in Figure 4, the marinised transducer presents higher impedance at resonance. This means that the power used by the transducer is lower when driven with the same voltages used for the non-marinised transducer. The power can be raised by increasing the signal voltage accordingly for marinised transducers. Brunel Innovation Centre (BIC) in TWI in Cambridge has developed a second-generation power amplifier that can produce more power and fully drive marinised transducers. The power amplifier is coupled with a programmable signal generator that can generate signals to drive any ultrasonic power transducers (Figure 8).
Details of BIC system components specifications are presented below.
2.2. Power Generator Specification
- Fixed power generation, 160 Wrms (or over 1400 W peak), with 300 Vpp (100 Vrms), 4.5 App (1.6 Arms, fuse protection) transducer drive capability.
- High power gain bandwidth (200 kHz)
- Module provides two single channels or one Bridge mode channel.
- Supports a step-up transformer to further increase voltage drive and isolation for transducers that require ground isolation to operate safely.
- System can drive any UT (Ultrasonic Transducers) at frequencies between 20–200 kHz.
2.3. Signal Generator Specification
- Digital Signal Generators provide maximum flexibility like
- Dual independent signal output channels.
- Digitally synthesized waveforms for maximum flexibility.
- Uses 12-bit DACs running up to 2 MHz sampling frequency.
- Selection of any frequency (20–200 kHz)
- Sweep mode, any rate and frequency range.
- Pulse mode with duty cycle control for all signals generated.
- Arbitrary signal generation by importing synthesized signals from a file (useful for research purposes).
- Bespoke firmware supported by BIC and can be upgraded with new features and bug fixes.
2.4. Transducer Design Electrical Connection Precautions
One important aspect of this work is that the transducer vibration face is electrically connected to one of the electrically driven terminals. To avoid any power amplifier shorting scenarios, this terminal must be connected to the power amplifier ground. This constraint does not allow configuring the amplifier to run in bridge mode, which halves the effective amplifier voltage output. The effect of this constraint is that marinised transducers cannot be fully driven and will not generate enough mechanical power.
A solution for this is provided by using an output isolation transformer. With an isolation transformer, one terminal can always be safely grounded; hence the transducers can be driven at optimal power. The isolation transformers can be designed as a step-up transformer to further increase the transducer drive voltage, as shown in Figure 9.
3. Proposing a Sweep Sine to Cool down the Transducer Automatically
Narrow-band frequency sweeps allow the system to drive the transducers for an extended period without any tuning or adjustments. The resonant frequency of the transducers varies in small increments, within +/−500 Hz of its designed frequency, because of its surroundings: mounting mechanism, water, and attachment onto the structure. To accommodate for the small adjustments in its resonance, a frequency sweep will excite between a range of expected frequencies of the deployed transducer.
There are also some practical advantages of using a frequency sweep. Firstly, an array of transducers can be driven with the same sweep as the resonance frequency of the transducers. It is not the same between transducers, but their resonance is always covered by the sweep. Second, the transducers at resonance frequency provide a particularly challenging reactive load to the power generator, causing strain on the generator and the transducer, which can start to overheat and get damaged. Using a frequency sweep indirectly protects the transducer and power generator from damage. A typical sweep signal can be synthesized using a configuration tool, as seen in Figure 10.
Other signal parameters that can be configured for the sweep signal are amplitude, sampling frequency, and the number of samples used for creating the core sweep signal. The signal generator will then output the core sweep signal in a repeat signal to generate a continuous sweep.
4. Noise Levels in the Ocean Generated by Horn and Non-Horn Marinised Transducers
The objective of this section is to evaluate the noise level produced by the steel and aluminum marinised transducers with and without a horn. As the cavitation produced by the transducers is local to the transducer position [46,47], the ladder should be instrumented with a number of HPUTs to cover the whole ladder for biofouling prevention. Hence, the noise produced by a different number of sensors is assessed in the measurements described in this section.
The test rig consisted of a ladder attached to a number of transducers. The transducer location and the grid of measurement points are illustrated in Figure 11. Transducer 1 has an aluminum horn, and Transducer 2 has a steel horn; both are rear-mounted to the front face of the ladder. Transducers 4–6 have no horns and are front-mounted to the ladder. Transducer 4 is the only transducer that is attached to the rear face of the ladder. As shown in Figure 11c, the ladders were suspended into the dock from a telehandler on the dock side.
The experimental rig consists of an 80 × 20 × 3 m deck. During the measurements, all HPUTS were fully submerged in the water, and the ladder was positioned approximately 1 m away from the quay walls. The measurement grid consists of five rows spaced 14 m apart and four columns spaced 4 m apart, shown in Figure 12a. A hydrophone survey was undertaken in the following stages; stage 1—running just transducer 1, stage 2—running transducer 2, stage 3—running transducer 3, stage 4—running transducer 4, stage 5—running transducers 3 and 4, stage 6—running transducers 5 and 6, stage 7—running transducers 3, 4, 5, and 6.
The produced noise from each stage is recorded through a Porpoise hydrophone. The standard porpoise hydrophone sensitivity is −204 dB. A Porpoise automatically adds approximately 10.62 dB gain (Gain 0 = 10.62 dB). This would make the sensitivity −193.38 dB without adding any gain (Gain 1, Gain 2, Gain 3). The highest gain setting is approximately Gain 3 = 45.74 dB. Therefore, the sensitivity would be approximately −158.26 dB using Gain 3.
To estimate the impact of the produced noise on marine life, the vibration outputs from the HPUTs’ arrays are analyzed based on power spectrum density and the sound equivalent value. The PSD can be estimated by
where is the time histories of the signals and E[] is the mathematical expectation in the interval of [0, T].
Sound exposure level (SEL) is the integration of squared sound pressure over a period of time, T, and is estimated by
Table 1 gives the minima and maxima associated with the noise produced by the transducers for each stage. It includes the sound exposure level (SEL) and sound pressure level (SPL) values associated with each step. As shown in Table 1, the noise was reduced by approximately 5 (dB) in SEL and SPL for the front mount without a horn compared with the rear mount with a horn. The aluminum horn transducer was not vibrating at its resonance frequency; hence, a lower noise level was expected. There is a minor difference between the noise level at stage 7 compared with stage 6. Therefore, noise cancellation works. The measurement field is highly reverberant, and the presented maximum value contains reflections of signal from the rear walls.
The background noise, called noise level, and the noise produced by the transducers at each stage are presented in Figure 13 and Figure 14. The peaks in the noise level plot are associated with the sudden operating external sound source close to the pool. From most of the data demonstrated in stages 1 to 7, a reduction in the SEL can be seen from grid numbers 1 to 4. However, owing to the reflection of the pressure wave from the other end of the pool, the SEL increases in most measurements compared with the SEL at grid number 4.
The PSDs of the signals for grid 1a at stages 1–7, including the ambient noise, are plotted in Figure 15. In Figure 15, the maximum sound pressure level is associated with the one at stage 7, where four transducers are vibrating the ladder. Some other peaks appeared at very low frequencies, between 20 to 100 Hz. These peaks could be associated with the resonance frequency of the measurement pool.
To prevent any harm to marine life, an estimation of the sound pressure level is carried out. To find an approximate attenuation value, free field measurements are recommended. The attenuation estimated by Fisher, F.H., and Simmons [48] is used for received level estimations. As illustrated in Figure 16a, the sound pressure level goes below the 120 dB limit recommended by Sullivan [44] for non-impulsive sounds at approximately 25 m from the excitation point. Driving eight transducers simultaneously increases the noise level by 6 dB; hence, the distance at which the sound pressure level falls below the standard limit is approximately 125 m. It is stated in [44] that if the sound source is in a significant location for cetaceans, it is not a great concern when the sound source exceeds the threshold to a range of hundreds of meters. The plotted data in Figure 16b shows that the SEL produced by the transducer is well below the 173 dB limit recommended by Sullivan [44] for non-impulsive sounds. Doubling the time will add 3 dB to the SEL value.
5. The Effect of HPUT Vibration on Removing Biofouling from a Plate
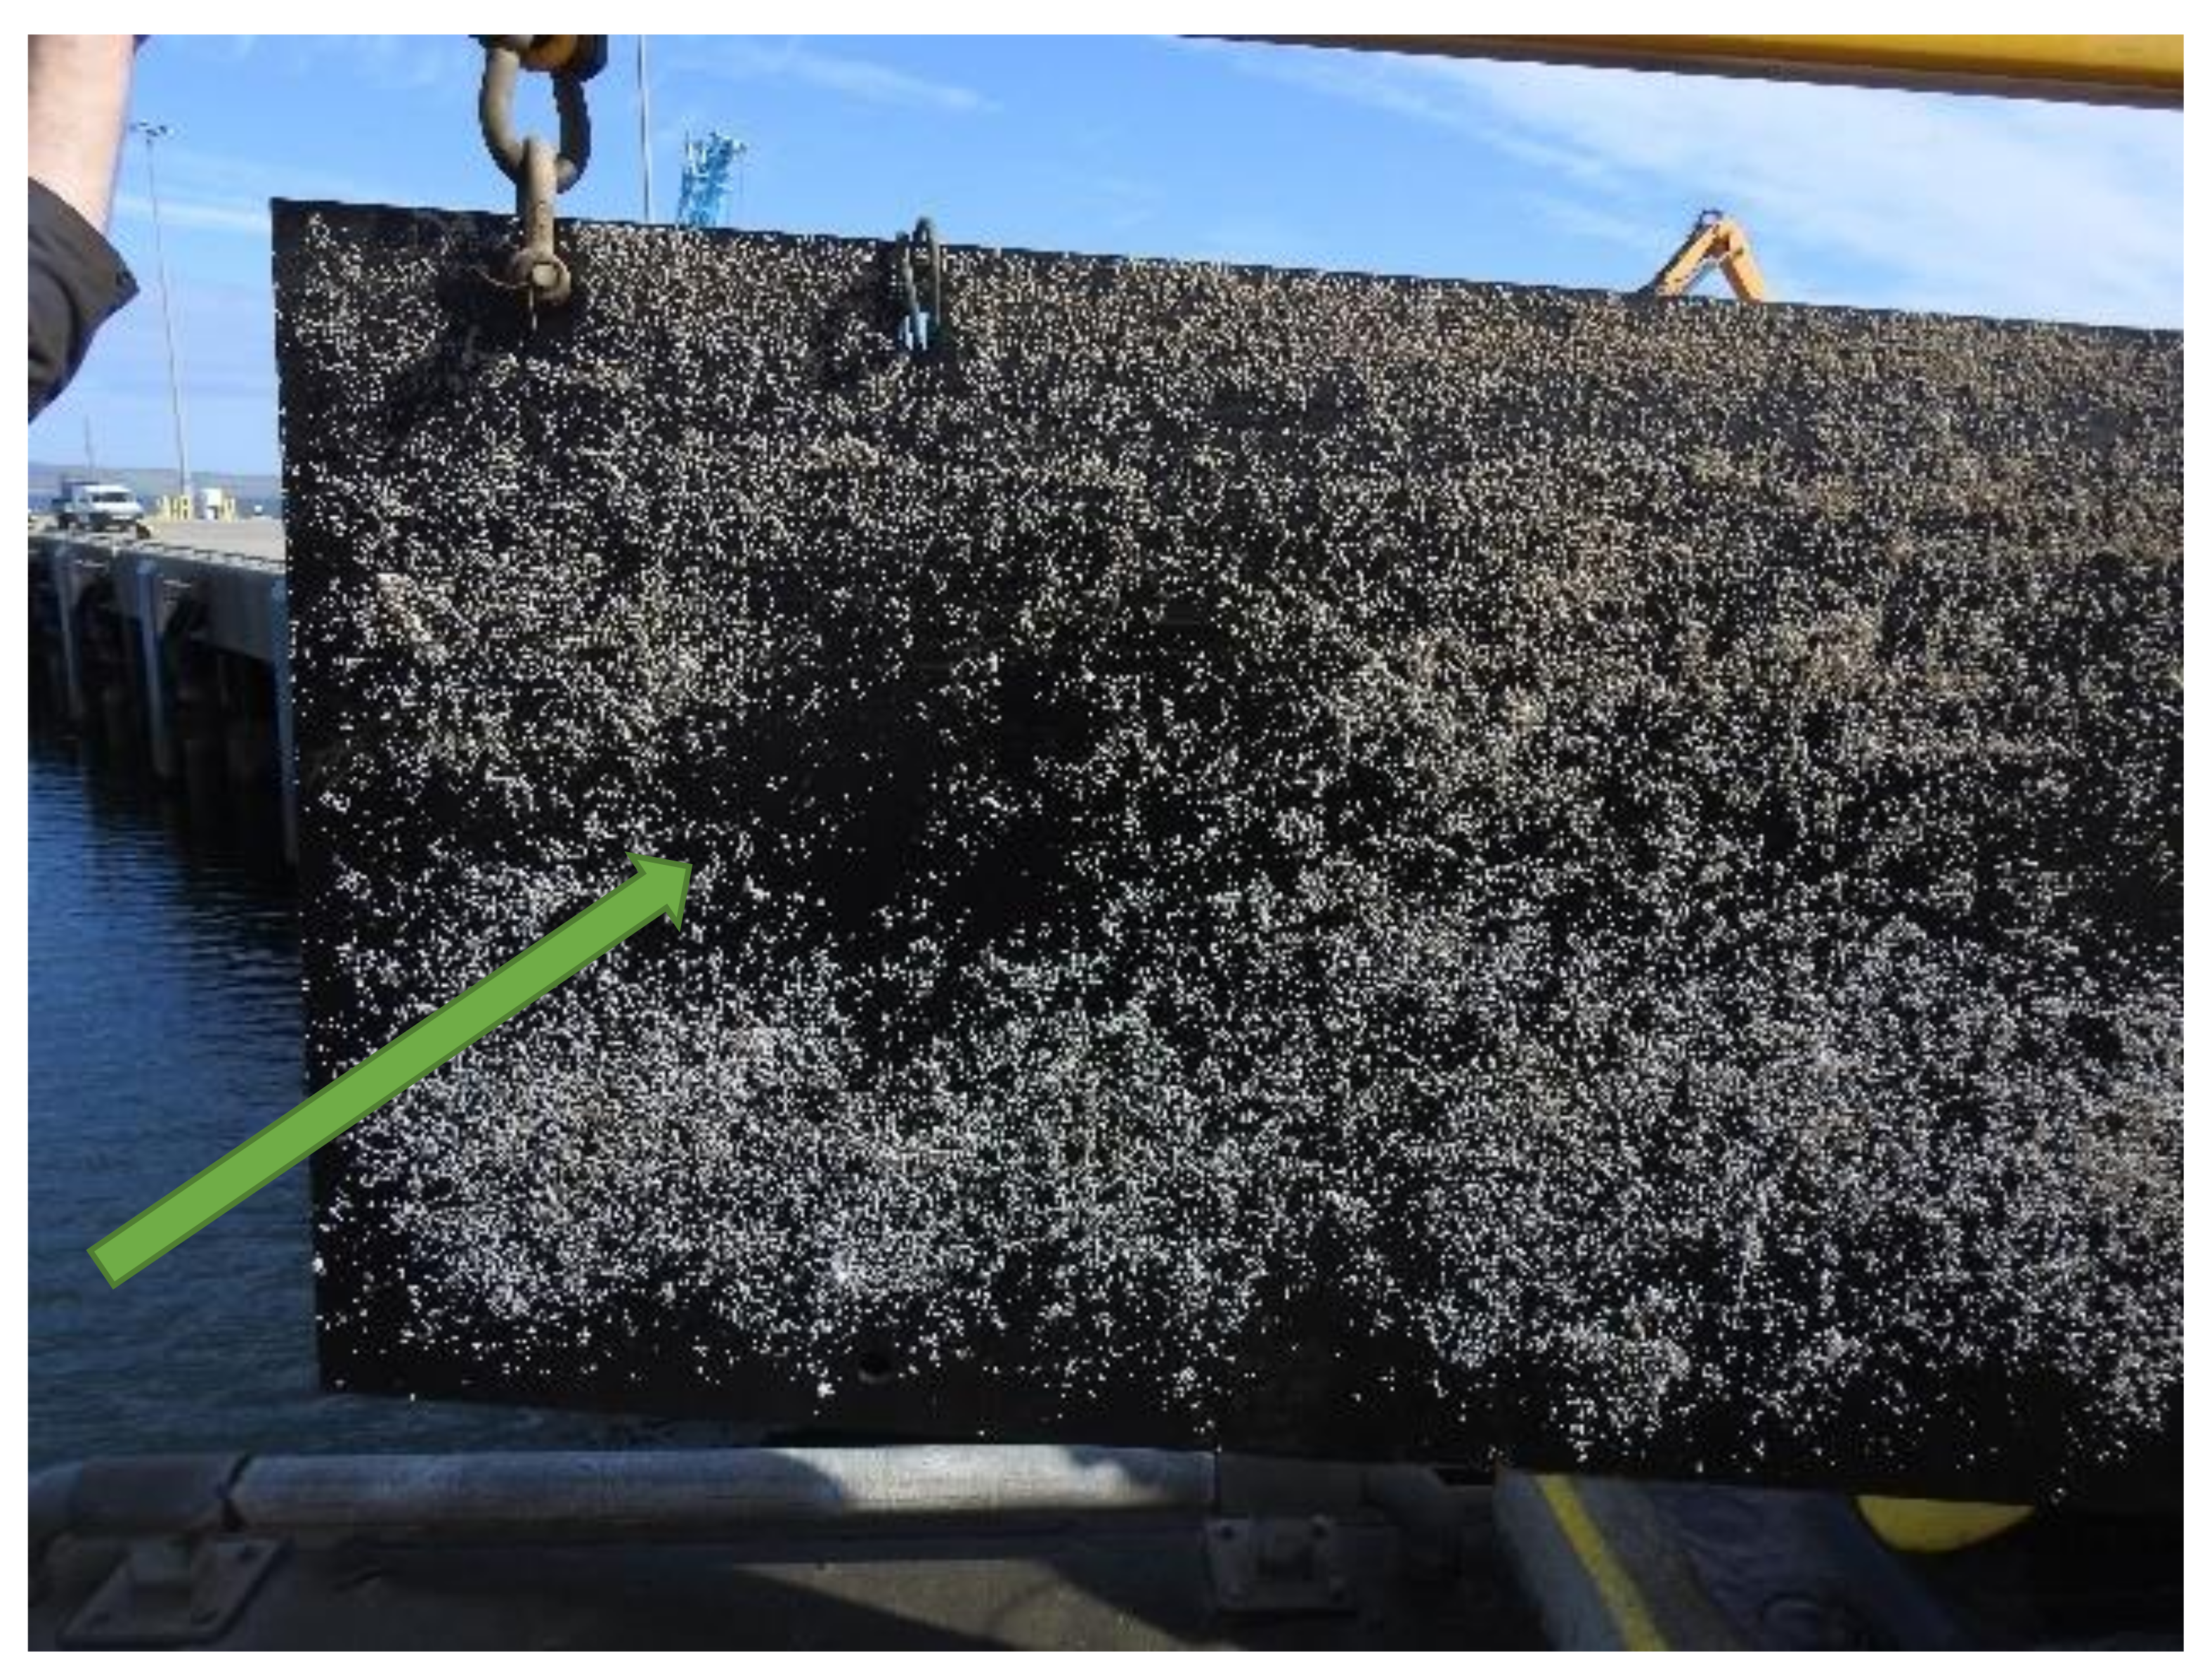
To check the effect of ultrasound vibration from a marinised 28 kHz HPUT on removing biofouling, a rectangular plate was instrumented with it and submerged into a deck at Hatston Pier, Kirkwall, on 19th March 2021 and removed from the water after approximately 3 months. The electronic system used for this measurement was industrial and therefore was not matched with the marinised transducer. Hence a lower vibration output from the transducer, approximately five times, compared to those shown in Figure 15a for stage 2 was expected. The reduction in the vibration output is associated with a shift to the resonance frequency due to the marinisation of the HPUT, shown in Figure 3 and Figure 4.
As seen in Figure 17, using a single HPUT with a very low amplitude can prevent biofouling from attaching to the plate local to the transducer location. The 28 kHz vibration frequency is nominated by Lee et al. [40] as an optimal excitation frequency to remove biofilm. However, owing to the reduction of the plate vibration level at a further distance from the transducer, biofouling formation occurred. Furthermore, the biofouling removal can be seen at the boundaries of the plate. This is due to the reflection of the waves at the boundaries and hence a higher vibration level at such areas [49].
6. Conclusions
In this paper, the design and instrumentation for detaching biofouling from marine structures using an array of marinised HPUTs have been described. It was indicated that ultrasound transducers had reduced mechanical efficiency when submerged in the sea. The marinisation process to protect the transducers from exposure to water is the main contributor to this mechanical loss. Additionally, the electrical equipment designed for the typical HPUTs is unsuitable for effectively driving marinised ones, resulting in further reduced performance. Therefore, an electronic system that delivers better performance and can drive marinised HPUTs was demonstrated. The developed bespoke signal generator allows the generation of optimal signals, including the increase in voltage needed to drive the marinised HPUTs.
A number of experimental studies were carried out to identify the noise level from different HPUT arrays attached to a ladder. Based on the results, a specific HPUT array and attachment were proposed to reduce the noise level in the sea. The sound pressure level and sound equivalent level from the proposed HPUT array are below the 120 dB limit, at 25 m from the excitation point, and at the 173 dB limit, respectively. Limited biofouling removal achieved in this study is attributed to the fact that the manufacturer’s amplification is matched to non-marinised transducers. Nevertheless, the results and discussions presented in this study suggest that future work could progress on deploying the system again in the coming summer to test its performance in removing biofouling from a ladder.
Author Contributions
T.-H.G. and E.E.M. developed the concept for this study; Formal analysis was performed by M.S., M.L. and A.T.; the original draft was written by M.S., M.L. and A.T. and reviewed and edited by T.-H.G. and E.E.M.; E.E.M. and T.-H.G. were responsible for the supervision, investigation, and project administration; T.-H.G. and. E.E.M. contributed to funding acquisition and resources deployment. All authors have read and agreed to the published version of the manuscript.
Funding
This research was funded by Innovate UK, grant number: 104218. The APC was funded by Brunel University London.
Institutional Review Board Statement
Not applicable.
Informed Consent Statement
Not applicable.
Data Availability Statement
Not applicable.
Conflicts of Interest
The authors declare no conflict of interest.
References
- Alternative Methods for Environmentally Friendly Fouling Control. Available online: https://eurofishmagazine.com/sections/technology/item/676-alternative-methods-for-environmentally-friendly-fouling-control (accessed on 20 December 2022).
- Seo, E.; Lee, J.W.; Lee, D.; Seong, M.R.; Kim, G.H.; Hwang, D.S.; Lee, S.J. Eco-Friendly Erucamide–Polydimethylsiloxane Coatings for Marine Anti-Biofouling. Colloids Surf. B Biointerfaces 2021, 207, 112003. [Google Scholar] [CrossRef] [PubMed]
- Swain, G.W.; Nelson, W.G.; Preedeekanit, S. The Influence of Biofouling Adhesion and Biotic Disturbance on the Development of Fouling Communities on Non-toxic Surfaces. Biofouling 1998, 12, 257–269. [Google Scholar] [CrossRef]
- Hao, H.-H.; Liu, P.; Su, P.; Chen, T.; Zhu, M.; Jiang, Z.-B.; Li, J.-P.; Feng, D.-Q. Sea-Trial Research on Natural Product-Based Antifouling Paint Applied to Different Underwater Sensor Housing Materials. Int. Biodeterior. Biodegrad. 2022, 170, 105400. [Google Scholar] [CrossRef]
- Kalumuck, K.M.; Chahine, G.L.; Frederick, G.S.; Aley, P.D. Development of a DYNAJET Cavitating Water Jet Cleaning Tool for Underwater Marine Fouling Removal. In Proceedings of the 9th American Waterjet Conference, Dearborn, MI, USA, 23–26 August 1997. [Google Scholar]
- Ning, D.; Wang, Q.; Tian, J.; Gong, Y.; Du, H.; Chen, S.; Hou, J. Experimental Study on the Coating Removing Characteristics of High-Pressure Water Jet by Micro Jet Flow. Micromachines 2021, 12, 173. [Google Scholar] [CrossRef] [PubMed]
- Xiao, Y.; Liu, Y.; Ma, C.; Muhammad, T.; Zhou, B.; Zhou, Y.; Song, P.; Li, Y. Using Electromagnetic Fields to Inhibit Biofouling and Scaling in Biogas Slurry Drip Irrigation Emitters. J. Hazard. Mater. 2021, 401, 123265. [Google Scholar] [CrossRef] [PubMed]
- Xiao, Y.; Seo, Y.; Lin, Y.; Li, L.; Muhammad, T.; Ma, C.; Li, Y. Electromagnetic Fields for Biofouling Mitigation in Reclaimed Water Distribution Systems. Water Res. 2020, 173, 115562. [Google Scholar] [CrossRef]
- Guo, S.; Khoo, B.C.; Teo, S.L.M.; Lee, H.P. The Effect of Cavitation Bubbles on the Removal of Juvenile Barnacles. Colloids Surf. B Biointerfaces 2013, 109, 219–227. [Google Scholar] [CrossRef] [PubMed]
- Vyas, N.; Manmi, K.; Wang, Q.; Jadhav, A.J.; Barigou, M.; Sammons, R.L.; Kuehne, S.A.; Walmsley, A.D. Which Parameters Affect Biofilm Removal with Acoustic Cavitation? A Review. Ultrasound Med. Biol. 2019, 45, 1044–1055. [Google Scholar] [CrossRef]
- Louisnard, O.; González-García, J. Acoustic Cavitation. In Ultrasound Technologies for Food and Bioprocessing; Springer: Berlin/Heidelberg, Germany, 2011; pp. 13–64. [Google Scholar]
- Miller, M.W.; Miller, D.L.; Brayman, A.A. A Review of in vitro Bioeffects of Inertial Ultrasonic Cavitation from a Mechanistic Perspective. Ultrasound Med. Biol. 1996, 22, 1131–1154. [Google Scholar] [CrossRef]
- Ashokkumar, M. The Characterization of Acoustic Cavitation Bubbles–An Overview. Ultrason. Sonochem. 2011, 18, 864–872. [Google Scholar] [CrossRef]
- Mustonen, J.; Tommiska, O.; Holmström, A.; Rauhala, T.; Moilanen, P.; Gritsevich, M.; Salmi, A.; Hæggström, E. FEM-Based Time-Reversal Enhanced Ultrasonic Cleaning. Ultrason. Sonochem. 2021, 79, 105798. [Google Scholar] [CrossRef]
- Church, C.C.; Carstensen, E.L. “Stable” Inertial Cavitation. Ultrasound Med. Biol. 2001, 27, 1435–1437. [Google Scholar] [CrossRef] [PubMed]
- Fuchs, F.J. 19-Ultrasonic Cleaning and Washing of Surfaces. In Power Ultrasonics; Gallego-Juárez, J.A., Graff, K.F., Eds.; Woodhead Publishing: Oxford, UK, 2015; pp. 577–609. ISBN 978-1-78242-028-6. [Google Scholar]
- Aktij, S.A.; Taghipour, A.; Rahimpour, A.; Mollahosseini, A.; Tiraferri, A. A Critical Review on Ultrasonic-Assisted Fouling Control and Cleaning of Fouled Membranes. Ultrasonics 2020, 108, 106228. [Google Scholar] [CrossRef] [PubMed]
- Rassweiler, J.J.; Knoll, T.; Köhrmann, K.-U.; McAteer, J.A.; Lingeman, J.E.; Cleveland, R.O.; Bailey, M.R.; Chaussy, C. Shock Wave Technology and Application: An Update. Eur. Urol. 2011, 59, 784–796. [Google Scholar] [CrossRef] [Green Version]
- Lais, H.; Lowe, P.S.; Gan, T.-H.; Wrobel, L.C. Numerical Investigation of Design Parameters for Optimization of the In-Situ Ultrasonic Fouling Removal Technique for Pipelines. Ultrason. Sonochem. 2019, 56, 94–104. [Google Scholar] [CrossRef]
- Agarwal, A.; Jern Ng, W.; Liu, Y. Removal of Biofilms by Intermittent Low-Intensity Ultrasonication Triggered Bursting of Microbubbles. Biofouling 2014, 30, 359–365. [Google Scholar] [CrossRef] [PubMed]
- Lais, H.; Lowe, P.S.; Wrobel, L.C.; Gan, T.-H. Investigation of Ultrasonic Sonotrode Design to Improve the Performance of Ultrasonic Fouling Removal. IEEE Access 2019, 7, 148897–148912. [Google Scholar] [CrossRef]
- da Cunha, T.V.; Bohórquez, C.E.N. Ultrasound in Arc Welding: A Review. Ultrasonics 2015, 56, 201–209. [Google Scholar] [CrossRef]
- Teyeb, A.; Silva, J.; Kanfoud, J.; Carr, P.; Gan, T.-H.; Balachandran, W. Improvements in the Microstructure and Mechanical Properties of Aluminium Alloys Using Ultrasonic-Assisted Laser Welding. Metals 2022, 12, 1041. [Google Scholar] [CrossRef]
- Teyeb, A.; Salimi, M.; el Masri, E.; Balachandran, W.; Gan, T.-H. Analytical Simulation of the Microbubble Collapsing in a Welding Fusion Pool. Materials 2023, 16, 410. [Google Scholar] [CrossRef]
- Mason, T.J. Industrial Sonochemistry: Potential and Practicality. Ultrasonics 1992, 30, 192–196. [Google Scholar] [CrossRef]
- Harvey, G.; Gachagan, A.; Mutasa, T. Review of High-Power Ultrasound-Industrial Applications and Measurement Methods. IEEE Trans. Ultrason. Ferroelectr. Freq. Control 2014, 61, 481–495. [Google Scholar] [CrossRef] [Green Version]
- Escrig, J.; Woolley, E.; Rangappa, S.; Simeone, A.; Watson, N.J. Clean-in-Place Monitoring of Different Food Fouling Materials Using Ultrasonic Measurements. Food Control 2019, 104, 358–366. [Google Scholar] [CrossRef]
- Kumar, S.; Wu, C.S.; Padhy, G.K.; Ding, W. Application of Ultrasonic Vibrations in Welding and Metal Processing: A Status Review. J. Manuf. Process. 2017, 26, 295–322. [Google Scholar] [CrossRef]
- Gallego-Juarez, J.A. High-Power Ultrasonic Processing: Recent Developments and Prospective Advances. Phys. Procedia 2010, 3, 35–47. [Google Scholar] [CrossRef] [Green Version]
- Saalbach, K.-A.; Twiefel, J.; Wallaschek, J. Self-Sensing Cavitation Detection in Ultrasound-Induced Acoustic Cavitation. Ultrasonics 2019, 94, 401–410. [Google Scholar] [CrossRef]
- Uchida, T.; Sato, H.; Takeuchi, S.; Kikuchi, T. Investigation of Output Signal from Cavitation Sensor by Dissolved Oxygen Level and Sonochemical Luminescence. Jpn. J. Appl. Phys. 2010, 49, 07HE03. [Google Scholar] [CrossRef]
- Uchida, T.; Takeuchi, S.; Kikuchi, T. Measurement of Amount of Generated Acoustic Cavitation: Investigation of Spatial Distribution of Acoustic Cavitation Generation Using Broadband Integrated Voltage. Jpn. J. Appl. Phys. 2011, 50, 07HE01. [Google Scholar] [CrossRef]
- Nguyen, T.T.; Asakura, Y.; Koda, S.; Yasuda, K. Dependence of Cavitation, Chemical Effect, and Mechanical Effect Thresholds on Ultrasonic Frequency. Ultrason. Sonochem. 2017, 39, 301–306. [Google Scholar] [CrossRef]
- Heikkola, E.; Miettinen, K.; Nieminen, P. Multiobjective Optimization of an Ultrasonic Transducer Using NIMBUS. Ultrasonics 2006, 44, 368–380. [Google Scholar] [CrossRef]
- Lin, S.; Xu, L.; Wenxu, H. A New Type of High Power Composite Ultrasonic Transducer. J. Sound Vib. 2011, 330, 1419–1431. [Google Scholar] [CrossRef]
- Zhong, X.; Dong, J.; Liu, M.; Meng, R.; Li, S.; Pan, X. Experimental Study on Ship Fouling Cleaning by Ultrasonic-Enhanced Submerged Cavitation Jet: A Preliminary Study. Ocean Eng. 2022, 258, 111844. [Google Scholar] [CrossRef]
- Mazue, G.; Viennet, R.; Hihn, J.Y.; Carpentier, L.; Devidal, P.; Albaïna, I. Large-Scale Ultrasonic Cleaning System: Design of a Multi-Transducer Device for Boat Cleaning (20 KHz). Ultrason. Sonochem. 2011, 18, 895–900. [Google Scholar] [CrossRef]
- Guo, S.; Lee, H.P.; Teo, S.L.M.; Khoo, B.C. Inhibition of Barnacle Cyprid Settlement Using Low Frequency and Intensity Ultrasound. Biofouling 2012, 28, 131–141. [Google Scholar] [CrossRef] [PubMed]
- Scherba, G.; Weigel, R.M.; O’Brien Jr, W.D. Quantitative Assessment of the Germicidal Efficacy of Ultrasonic Energy. Appl. Environ. Microbiol. 1991, 57, 2079–2084. [Google Scholar] [CrossRef] [PubMed] [Green Version]
- Lee, T.J.; Nakano, K.; Matsumara, M. Ultrasonic Irradiation for Blue-Green Algae Bloom Control. Environ. Technol. 2001, 22, 383–390. [Google Scholar] [CrossRef] [PubMed]
- McKenna, M.F.; Gabriele, C.; Kipple, B. Effects of Marine Vessel Management on the Underwater Acoustic Environment of Glacier Bay National Park, AK. Ocean Coast Manag. 2017, 139, 102–112. [Google Scholar] [CrossRef]
- Tyack, P.L. Implications for Marine Mammals of Large-Scale Changes in the Marine Acoustic Environment. J. Mammal. 2008, 89, 549–558. [Google Scholar] [CrossRef] [Green Version]
- Lais, H.; Lowe, P.S.; Kanfoud, J.; Gan, T.-H. Application of High Power Ultrasonics for Fouling Removal in Submerged Structures. In Proceedings of the OCEANS 2017, Aberdeen, UK, 19–22 June 2017; pp. 1–8. [Google Scholar]
- Sullivan, K.D. Technical Guidance for Assessing the Effects of Anthropogenic Sound on Marine Mammal Hearing: Underwater Acoustic Thresholds for Onset of Permanent and Temporary Threshold Shifts. National Marine Fisheries Service, Office of Protected Resources: Washington, DC, USA,, 2016; Volume 178. [Google Scholar] [CrossRef]
- Available online: https://www.bjultrasonic.com/category/ultrasonic-transducer/ (accessed on 9 January 2023).
- Legg, M.; Yücel, M.K.; de Carellan, I.G.; Kappatos, V.; Selcuk, C.; Gan, T.H. Acoustic Methods for Biofouling Control: A Review. Ocean Eng. 2015, 103, 237–247. [Google Scholar] [CrossRef]
- Aganin, A.A.; Ilgamov, M.A.; Kosolapova, L.A.; Malakhov, V.G. Dynamics of a Cavitation Bubble near a Solid Wall. Thermophys. Aeromech. 2016, 23, 211–220. [Google Scholar] [CrossRef]
- Fisher, F.H.; Simmons, V.P. Sound Absorption in Sea Water. J. Acoust. Soc. Am. 1977, 62, 558–564. [Google Scholar] [CrossRef]
- Warburton, G.B. The Vibration of Rectangular Plates. Proc. Inst. Mech. Eng. 1954, 168, 371–384. [Google Scholar] [CrossRef]
Figure 1.
The accumulation of (a) biofouling on the ladder and (b) access to the turbines for maintenance (Source Windcat Workboats B.V.).
Figure 1.
The accumulation of (a) biofouling on the ladder and (b) access to the turbines for maintenance (Source Windcat Workboats B.V.).

Figure 2.
Transducers used in tests: (a) plain and (b) marinised transducer.

Figure 3.
Non-marinised transducer, main resonance frequency is 28.1 kHz and 33.4 Ohms.

Figure 4.
Marinised transducer, main resonance frequency is 27.5 and 119.8 Ohms.

Figure 5.
Experimental set-up plate and transducer with horn and magnetic mounting system.

Figure 6.
Maximum averaged displacements for different transducer configurations.

Figure 7.
Maximum averaged peak-to-peak displacements for plain and marinised transducer configurations.
Figure 7.
Maximum averaged peak-to-peak displacements for plain and marinised transducer configurations.

Figure 8.
Multi-channel power/signal generator for power ultrasonic applications.

Figure 9.
Step up 300 W transformer with isolation with 1 input channel to 2 output channels split.

Figure 10.
kHz sweep centered at 28 kHz for driving ultrasonic transducers.

Figure 11.
Preparing the test rig, (a) attached transducer to the ladder with (b) their corresponding number and (c) suspending the ladder into a pool—courtesy of Offshore Renewable Energy, Catapult.
Figure 11.
Preparing the test rig, (a) attached transducer to the ladder with (b) their corresponding number and (c) suspending the ladder into a pool—courtesy of Offshore Renewable Energy, Catapult.

Figure 12.
Measurement configuration, (a) the grid of measurement points (b) placing the hydrophone into the pool for the measurement and (c) the hydrophone type used to collect the pressure wave emitted at each stage—courtesy of Offshore Renewable Energy, Catapult.
Figure 12.
Measurement configuration, (a) the grid of measurement points (b) placing the hydrophone into the pool for the measurement and (c) the hydrophone type used to collect the pressure wave emitted at each stage—courtesy of Offshore Renewable Energy, Catapult.

Figure 13.
Sound exposure levels (SELs) calculated for (a) noise level, (b) stage 1, (c) stage 2, and (d) stage 3.
Figure 13.
Sound exposure levels (SELs) calculated for (a) noise level, (b) stage 1, (c) stage 2, and (d) stage 3.

Figure 14.
Sound exposure levels (SELs) calculated for (a) stage 4, (b) stage 5, (c) stage 6, and (d) stage 7.
Figure 14.
Sound exposure levels (SELs) calculated for (a) stage 4, (b) stage 5, (c) stage 6, and (d) stage 7.

Figure 15.
Power spectral density values for (a) stages 0 to 3 and (b) stages 4 to 7 at grid point 1a.
Figure 15.
Power spectral density values for (a) stages 0 to 3 and (b) stages 4 to 7 at grid point 1a.

Figure 16.
Received levels in terms of (a) sound pressure level (SPL) and (b) sound exposure level (SEL) produced by arrays of transducers.
Figure 16.
Received levels in terms of (a) sound pressure level (SPL) and (b) sound exposure level (SEL) produced by arrays of transducers.

Figure 17.
Biofouling removal using an HPUT. The green arrow shows the location of the HPUT at the back of the plate.
Figure 17.
Biofouling removal using an HPUT. The green arrow shows the location of the HPUT at the back of the plate.


Table 1.
Minima and maxima sound exposure level (SEL) and sound pressure level (SPL).
| Stage Number | Max SEL (dB) ref 1 μPa | Min SEL (dB) ref 1 μPa | Max SPL (dB) ref 1 μPa | Min SPL (dB) ref 1 μPa |
|---|---|---|---|---|
| 1 | 160.3 (dB)—grid point 1 c | 148.9 (dB)—grid point 5d | 142.5 (dB)—grid 1c | 131.1—grid point 5d |
| 2 | 163.9 (dB)—grid point 1a | 155.1 (dB)—grid point 5c | 146.7 (dB)—grid 1 a | 137.4 (dB)—grid point 5c |
| 3 | 162.3 (dB)—grid point 1d | 149.2 (dB)—grid point 4c | 144.5 (dB)—grid 1 d | 131.4 (dB)—grid point 4c |
| 4 | 163.4 (dB)—grid point 1a and 1c | 152.4 (dB)—grid point 4a | 145.6 (dB)—grid 1 a and c | 134.7 (dB)—grid point 4a |
| 5 | 167.7 (dB)—grid point 1d | 158.7 (dB)—grid point 5a | 149.9 (dB)—grid 1 d | 140.9 (dB)—grid point 5a |
| 6 | SEL: 166.1 (dB)—grid point 1c | 153.4 (dB)—grid point 5a | 148.3 (dB)—grid 1c | 135.6 (dB)—grid point 5a |
| 7 | SEL: 169.4 (dB)—grid point 1d | 159 (dB)—grid point 4a and 5a | 151.6 (dB)—grid 1 d | 141.2 (dB)—grid point 4a and 5a |
Disclaimer/Publisher’s Note: The statements, opinions and data contained in all publications are solely those of the individual author(s) and contributor(s) and not of MDPI and/or the editor(s). MDPI and/or the editor(s) disclaim responsibility for any injury to people or property resulting from any ideas, methods, instructions or products referred to in the content. |
© 2023 by the authors. Licensee MDPI, Basel, Switzerland. This article is an open access article distributed under the terms and conditions of the Creative Commons Attribution (CC BY) license (https://creativecommons.org/licenses/by/4.0/).
Share and Cite
MDPI and ACS Style
Salimi, M.; Livadas, M.; Teyeb, A.; El Masri, E.; Gan, T.-H. Biofouling Removal Using a Novel Electronic System for Driving an Array of High Power Marinised Transducers. Appl. Sci. 2023, 13, 3749. https://doi.org/10.3390/app13063749
AMA Style
Salimi M, Livadas M, Teyeb A, El Masri E, Gan T-H. Biofouling Removal Using a Novel Electronic System for Driving an Array of High Power Marinised Transducers. Applied Sciences. 2023; 13(6):3749. https://doi.org/10.3390/app13063749
Chicago/Turabian StyleSalimi, Mohamad, Makis Livadas, Ahmed Teyeb, Evelyne El Masri, and Tat-Hean Gan. 2023. "Biofouling Removal Using a Novel Electronic System for Driving an Array of High Power Marinised Transducers" Applied Sciences 13, no. 6: 3749. https://doi.org/10.3390/app13063749
Note that from the first issue of 2016, this journal uses article numbers instead of page numbers. See further details here.