Article

Characterization and Applicability of a Bone Spheroid Model for the Evaluation of Cytocompatibility of Bone Substitutes

by
Ana Carolina Batista Brochado
1,
Daniela Costa Silva
1,2,
Joice Correa da Silva
3,
Adam Lowenstein
4,
Vinicius Schott Gameiro
3,
Elena Mavropoulos
5,
Carlos F. Mourão
6,* and
Gutemberg Gomes Alves
3
1
Post-Graduation Program in Science and Biotechnology, Fluminense Federal University, Rio de Janeiro 24033-900, Brazil
2
Universidade Estácio de Sá, Rio de Janeiro 20261-060, Brazil
3
Clinical Research Unit, Antonio Pedro Hospital, Fluminense Federal University, Niterói 24033-900, Brazil
4
Department of Pediatric Dentistry, Division of Dental Research Administration, Tufts University School of Dental Medicine, Boston, MA 02111, USA
5
Brazilian Center for Physics Research, Rio de Janeiro 13560-970, Brazil
6
Department of Periodontology, Division of Dental Research Administration, Tufts University School of Dental Medicine, Boston, MA 02111, USA
*
Author to whom correspondence should be addressed.
Appl. Sci. 2023, 13(3), 1602; https://doi.org/10.3390/app13031602
Submission received: 15 December 2022 / Revised: 15 January 2023 / Accepted: 18 January 2023 / Published: 27 January 2023
(This article belongs to the Special Issue Oral and Implant Health)

Abstract

:
In vitro cell-based tests are an important preclinical step for the safety assessment of biomaterials and drugs. Three-dimensional cell culture models (3D) may improve the limitations of the usual 2D models, as they better simulate a physiological environment. This work describes the characterization of a 3D spheroid model of MC3T3-E1 murine preosteoblasts for the testing of bone-substitute materials and investigates its adequacy to some of the most employed cell viability tests. The spheroids presented structural stability for 28 days in culture, with a regular spheroidal aspect, compact surface, and dense inner structure, with high potential for mineralization, but a time-dependent reduction in size. The use of colorimetric tests (MTT, XTT, and NRU) did not achieve satisfactory optical densities and did not correlate with cell density in the 3D model, as the aggregates remain strongly stained even after dye extraction steps. On the other hand, the LDH test achieved appropriate optical density and a high correlation with cell density (r2 = 0.77) and identified a dose–response for a well-known cytotoxic polymer (latex), while no toxicity was identified for biocompatible PLA wires. These results indicate that material testing with 3D bone cell models requires a careful choice of test methods and parameters.

1. Introduction

Risk assessment is of paramount importance during the development of novel biomaterials, ensuring human health and their safest clinical use [1]. In this context, the first screening to assess the toxicological risk is performed using in vitro models with cell culture, as an important step prior to in vivo preclinical and clinical assessments. Bidimensional (2D) monolaminar models represent the main cell culture methodology and have provided, for decades, important data on the cytotoxicity of several compounds and materials, being the scope of international standards for material testing (ISO 10993-5:2018). However, several inherent limitations of in vitro assays have reduced their predictability and applicability. Regarding tests employing monolaminar culture, cells are devoid of a consistent extracellular matrix (ECM), and the reduced cell–cell interactions and mechanical stimuli interfere with cell behavior, morphology, and phenotype [2], increasing the distance with expected clinical outcomes. The high rate of failure of materials during clinical test phases demonstrates the need for more predictive models.
Technologies involving cell culture have continually improved throughout the 20th century [3]. Concerning Toxicity Testing for the 21st Century, organotypic culture techniques such as 3D models have considered as promising models to fill the gap between the in vitro and in vivo or clinical results [4]. This model allows cells to further interact with each other and with ECM, mimicking some of the physiological responses that occur in a tissue, permitting cells to make complex interactions with adjacent cells, receiving and transmitting signals [5]. Furthermore, 3D models provide gradients of oxygen, nutrients, metabolites, soluble signals, with increased heterogeneity of cells, and the expression of cell-signaling factors and responses to drugs and materials more similar to in vivo conditions [6]. Several studies have investigated 3D models, which includes spheroidal organoids or spheroids, which may be produced by the liquid overlay technique [7].
Osteoblast and osteoblast-like cells lines are important for toxicology evaluation and risk assessment of drugs related to bone diseases such as osteoporosis, osteosarcoma, and nanoparticles [8] and implantable biomaterials [9], including the use of international standards for materials testing (ISO 10993-5:2009). Different osteoblast and osteoblast-like-based 3D models are being developed nowadays [10,11,12,13,14]. However, there is a lack of further characterization of these 3D models. Moreover, there is a gap in the evidence of the suitability of spheres of osteoblastic lines to standardized cytotoxicity assessments. As long as these factors are not fully approached, the confidence in these tests will remain limited. In this context, this work aimed to (i) characterize the stability, integrity, and uniformity of a 3D model, composed of aggregates of preosteoblastic cells, intended for the in vitro evaluation of biocompatibility of bone-substitute biomaterials, and (ii) to investigate the suitability of the 3D model as a substitute of monolaminar culture in the performance of some of the most widely used in vitro cytotoxicity tests for the evaluation of biomaterials.

2. Materials and Methods

2.1. Cell Culture

We obtained the MC3T3-E1 preosteoblastic murine cells from the collection of the Clinical Research Unit of the University Hospital Antônio Pedro-UFF (UPC-HUAP-UFF). The cells were maintained in Minimum Essential Medium Eagle (MEM) with Alpha Modification (α-MEM) containing 10% fetal bovine serum (FBS) and 1% penicillin/streptomycin at 37 °C in a 5% carbon dioxide environment.

2.2. Production of the 3D Model

Spheroids were produced by the liquid overlay technique. We seeded the cells in a density of 20,000 cells per well in 96-well round-bottom plates covered by 1% sterile agar. Subsequently, we added 200 µL of culture medium and incubated the plates for 4 or 7 days, depending on the experiment, at 37 °C in a 5% carbon dioxide environment.

2.3. Spheroid Diameter and Aspect Measurement

We performed the assessment of spheroid diameter and aspect by observing 100 spheroids through weekly follow ups for 4 weeks using a photomicroscope (Zeiss Axio A1). The mean diameter and aspect were measured using the Image-Pro Plus 6.0 image analysis program, where the measurement is made at intervals of two degrees joining two contour points, and the aspect was evaluated by the ratio between the major and smallest axis of the ellipse.

2.4. Cell Viability Analysis

To evaluate cell viability, aggregates from day 1 to day 5 were disaggregated using 60 µL Tryple Select (TrypLE Select, Gibco, Thermo Fisher Scientific, Boston, MA, USA), then incubated for 240 min at 37 °C in a 5% carbon dioxide atmosphere. After the incubation, each aggregate was disaggregated with a micropipette and observed in the optical microscope to confirm the complete disaggregation. Subsequently, 20 µL of the cells were mixed with 20 µL of 0.4% Trypan Blue (Sigma-Aldrich, Waltham, MA, USA), and the cells were counted in a hemocytometer.

2.5. Apoptosis and Necrosis Analysis

We evaluated the spheroids for the presence of apoptosis using a Caspase 3/7 fluorescent kit (Life Technologies, Thermo Fisher Scientific, Boston, MA, USA) and 4% Hoechst 33342 for nucleus staining. Aggregates were incubated for 30 min with the reagent at room temperature, then they were washed 3 times with phosphate-buffered saline (PBS) and fixed in 4% paraformaldehyde. Cells were exposed to 4% Hoechst 33342 for 5 min, then washed 2 times with PBS and observed in a confocal microscope (Leica, DMI 6000, Wetzlar, Germany).

2.6. Scanning Electron Microscopy (SEM)

For the SEM analysis, we fixed the spheroids in Karnovsky solution for 30 min, followed by three 5 min washes in sodium cacodylate buffer. The samples were dehydrated in a series of ethanol solutions (15–100%), treated with 1: 1 ethanol and hexamethyldisilazane (HDMS) for 10 min, followed by pure HMDS for 10 min. After that, they were coated with a gold layer of 20 nm thickness. We examined the samples using a scanning electron microscope (EVO MA15, Zeiss, Aalen, Germany), with the acceleration voltage adjusted to 15 kV. The working distance was 33.5 mm. SEM images were recorded at magnifications ranging from 864× to 6260×.

2.7. Histological Analyzes

We fixed the spheroids in 4% paraformaldehyde, followed by submersion in 30% sucrose, then placed the samples in gelatin capsules for medicine (Pipingrock, 8021) with Optimal Cutting Temperature (OCT) medium for freezing (EasyPath Killik OCT). Those capsules were submitted to a dry ice bath (−78 °C) for quick freezing. We cut the blocks with a cryomicrotome (Leica CM1850 UV) in sections of 7 μm thickness. The sections were stained with Hematoxylin-Eosin (HE), or 2% Alizarin Red (Alizarin Red S, Sigma-Aldrich, São Paulo, Brazil). We evaluated qualitatively the calcium accumulation through optical microscopy (Zeiss Axio A1, Aalen, Germany).

2.8. MTT Assay

To assess the cell viability, spheroids with 4 and 7 days of formation and three different cell densities (20, 30, 40 × 10³ cells) were washed once with PBS and then exposed to 0,5 mg/mL MTT (3-(4,5-dimethyl-thiazoyl-2yl) 2,5-diphenyltetrazolium bromide, Sigma-Aldrich, Brazil) for 2 h at 37 °C. After complete solubilization of formazan crystals in Dimethyl sulfoxide (DMSO), we measured the optical density (O.D.) with a spectrophotometer (Sinergy II, Biotek Inst., Winooski, VT, USA) at 540 nm, testing the extraction three times with DMSO (10 min, 1 h, and overnight).

2.9. XTT Assay

After spheroid formation (4 and 7 days), we washed the samples once with PBS, then added 200 µL/well of α-MEM without SFB and 50 µL/well of 1:100 XTT ((2,3-Bis-(2-Methoxy-4-Nitro-5-Sulfophenyl)-2H-Tetrazolium-5-Carboxanilide, Sigma-Aldrich, São Paulo, Brazil). The plate was incubated for 4 h at 37 °C and 5% CO2. We accessed the optical density with a spectrophotometer (Sinergy II, Biotek Inst., Santa Clara, CA, USA) at 480 nm.

2.10. Neutral Red Uptake (NRU) Assay

We washed the spheroids with the Wash solution NR I (In Cytotox, Xenometrix, Germany). After that, we added 200 µL/well of 1:100 Identification solution NR II and then incubated the plates for 4 h at 37 °C. The NR II solution was discarded, and the spheroids were exposed to Fixation solution NR III for 1 min. For the dye solubilization, the aggregates were submitted to the Solubilization solution NR IV for 15 min at room temperature. We measured the optical density with a spectrophotometer (Sinergy II, Biotek Inst., Winooski, VT, USA) at 540 nm.

2.11. Lactate Dehydrogenase (LDH) Assay

The ability of the LDH test to detect a dose–response of positive controls was assessed by the exposure to different dilutions of extracts of fragments of commercial latex tubes (DentalCremer, Sao Paulo, Brazil), a well-known cytotoxic polymer, or the white filaments of the biocompatible polymer polylactic acid (PLA) (3D Procer, São Paulo, Brazil). The extracts were prepared according to ISO 10993-12:2018, by incubation of 200 mg/mL in culture media for 24 h at 37 °C and 5% CO2, and the dose–response was evaluated with the preparation of extracts with seven other concentrations, ranging from 100 to 3.12 mg/mL. Cell aggregates were exposed in quintuplicates to these extracts and incubated for 24 h, followed by the LDH test. We transferred a volume of 20 µL of each well to another plate and added 240 μL of LDH II and LDH III solution (16 mL of LDH II and 3.4 mL of LDH III) (In Cytotox, Xenometrix, Allschwil, Switzerland). We measured the optical density with a spectrophotometer (Sinergy II, Biotek Inst., EUA) at 540 nm for 25 min at 37 °C. To determine the total release of LDH corresponding to 100% cytotoxicity, aggregates (n = 5) were also exposed to 200 µL medium mixed with 1% Triton X-100 and incubated for 24 h prior to the test.

2.12. Statistical Analysis

Statistical differences were analyzed using a two-way analysis of variance (ANOVA) followed by Tukey’s post-test for comparison between the pairs of the groups, with a significance level of p < 0.05. The IC50 (concentration for the inhibition of 50% of cells) for the Latex and PLA extracts was calculated by the equation produced by applying linear regression to the results of the LDH assay. The statistical analyses were performed using Graph Pad Prism 8.0 software (GraphPad, San Diego, CA, USA).

3. Results

3.1. Diameter and Aspect

Figure 1 shows that the liquid overlay protocol produces spheroidal bone cell aggregates that decreased their diameter with time, as they become more compact. On the seventh day, the mean diameter was 409.9 ± 53.4, while by the fourteenth day, this value decreased to 353.1 ± 40.8 (n = 100 spheroids). On the other hand, the spheroids did not present considerable variation in the aspect value, as in the seven and fourteen days the aspect remained 1.1 ± 0.1, indicating a consistent sphericity. Despite the compaction process, the spheroids were still intact and regular even after 28 days.

3.2. Cell Viability Analysis

We assessed the cell viability of the aggregates by the Trypan Blue exclusion method, normalizing the amount of live cells relative to the total cell density counted. The relative proportion of viable cells during the first 5 days of formation slightly increased, reaching 96% on the 5th day (Figure 2A). After the fifth day, we could not estimate the cell density because it was not possible to achieve spheroid disintegration by the conventional method with proteolytic enzyme activity. The analysis of the presence of apoptosis was evaluated by immunofluorescence in a confocal microscope (Figure 2B). Fluorescent staining with 3/7 caspase probes indicated the presence of well-distributed apoptotic cells on the spheroid core, surrounded by viable cells.

3.3. Structural Analysis

Analyzing the ultrastructure of spheroids by SEM, most intact spheroids present regular and compact surfaces with 1 day and 28 days in culture with osteogenic medium (Figure 3A,B). These spheroids presented extensions with characteristic filopodia (Figure 3C,D). After 28 days, cells on the aggregate surface showed the presence of small vesicles sprouting from the cell membrane, with typical dimensions of matrix vesicles (Figure 3E,F).

3.4. Histological Analyzes

In order to evaluate the cell organization within the spheroids, we obtained photomicrographs of sections stained with Hematoxylin and Eosin (HE) five times (1st, 7th, 14th, 21st, and 28th days) of groups treated and untreated with induction medium after the formation time. In the photomicrographs of HE, one can observe visible cell nuclei in all regions. It was possible to verify more evident morphological differences in the images up to 14 days between the cells from the periphery to the ones of the center. The peripheral cells were more fusiform and elongated (Figure 4), while the central areas present cuboidal morphology typical of active osteoblasts.
To analyze the presence of calcium accumulation in the spheroids (formation of mineralized matrix), we also obtained photomicrographs of sections stained with Alizarin Red in five different periods of formation (1st, 7th, 14th, 21st, and 28th day) of aggregates treated or not with an osteogenic medium. Figure 4 shows that, after 7 days of induction, the aggregates already presented a high presence of calcium nodules. The 3D environment may exert a positive effect on the mineralized phenotype, since mineralization nodules are also evident in spheroids maintained with anuntreated medium.

3.5. Assessing the Adequacy to the MTT Test

To observe the performance of the spheroids on a MTT test, we evaluated the variation in cell density, incubation time, and formazan extraction time as technical factors affecting the assay. To assess if the incubation time would influence the results, we tested two times of incubation (2 and 4 h) with 20,000 cells spheroids. No significant difference can be seen between both times (p > 0.05) (Figure 5A). With the aim to improve the extraction of formazan, different times were also tested. Figure 5B shows that the time of extraction is an important factor since the optical density (OD) of 1 h was greater than 10 min (p < 0.05), but the results remained unsatisfactory, as readings remained rather low. There is no significant difference between the densities, and all of them are significantly smaller (p < 0.05) than the 2D model in all tests (Figure 5C).
We produced histological sections to analyze the interior of the spheroids after the time of exposure to tetrazolium and after the extraction step with DSMO for 1 h. Figure 5D shows that an incorporation of tetrazolium occurs, with its conversion into formazan up to the innermost layers of the spheroid. The section produced after the extraction step (5E) shows a decrease in the dye, but it is still present. Therefore, we can observe that there is not a reduction in cell metabolism, but a decrease in the ability of the dye to leave the cell aggregate during the extraction steps.

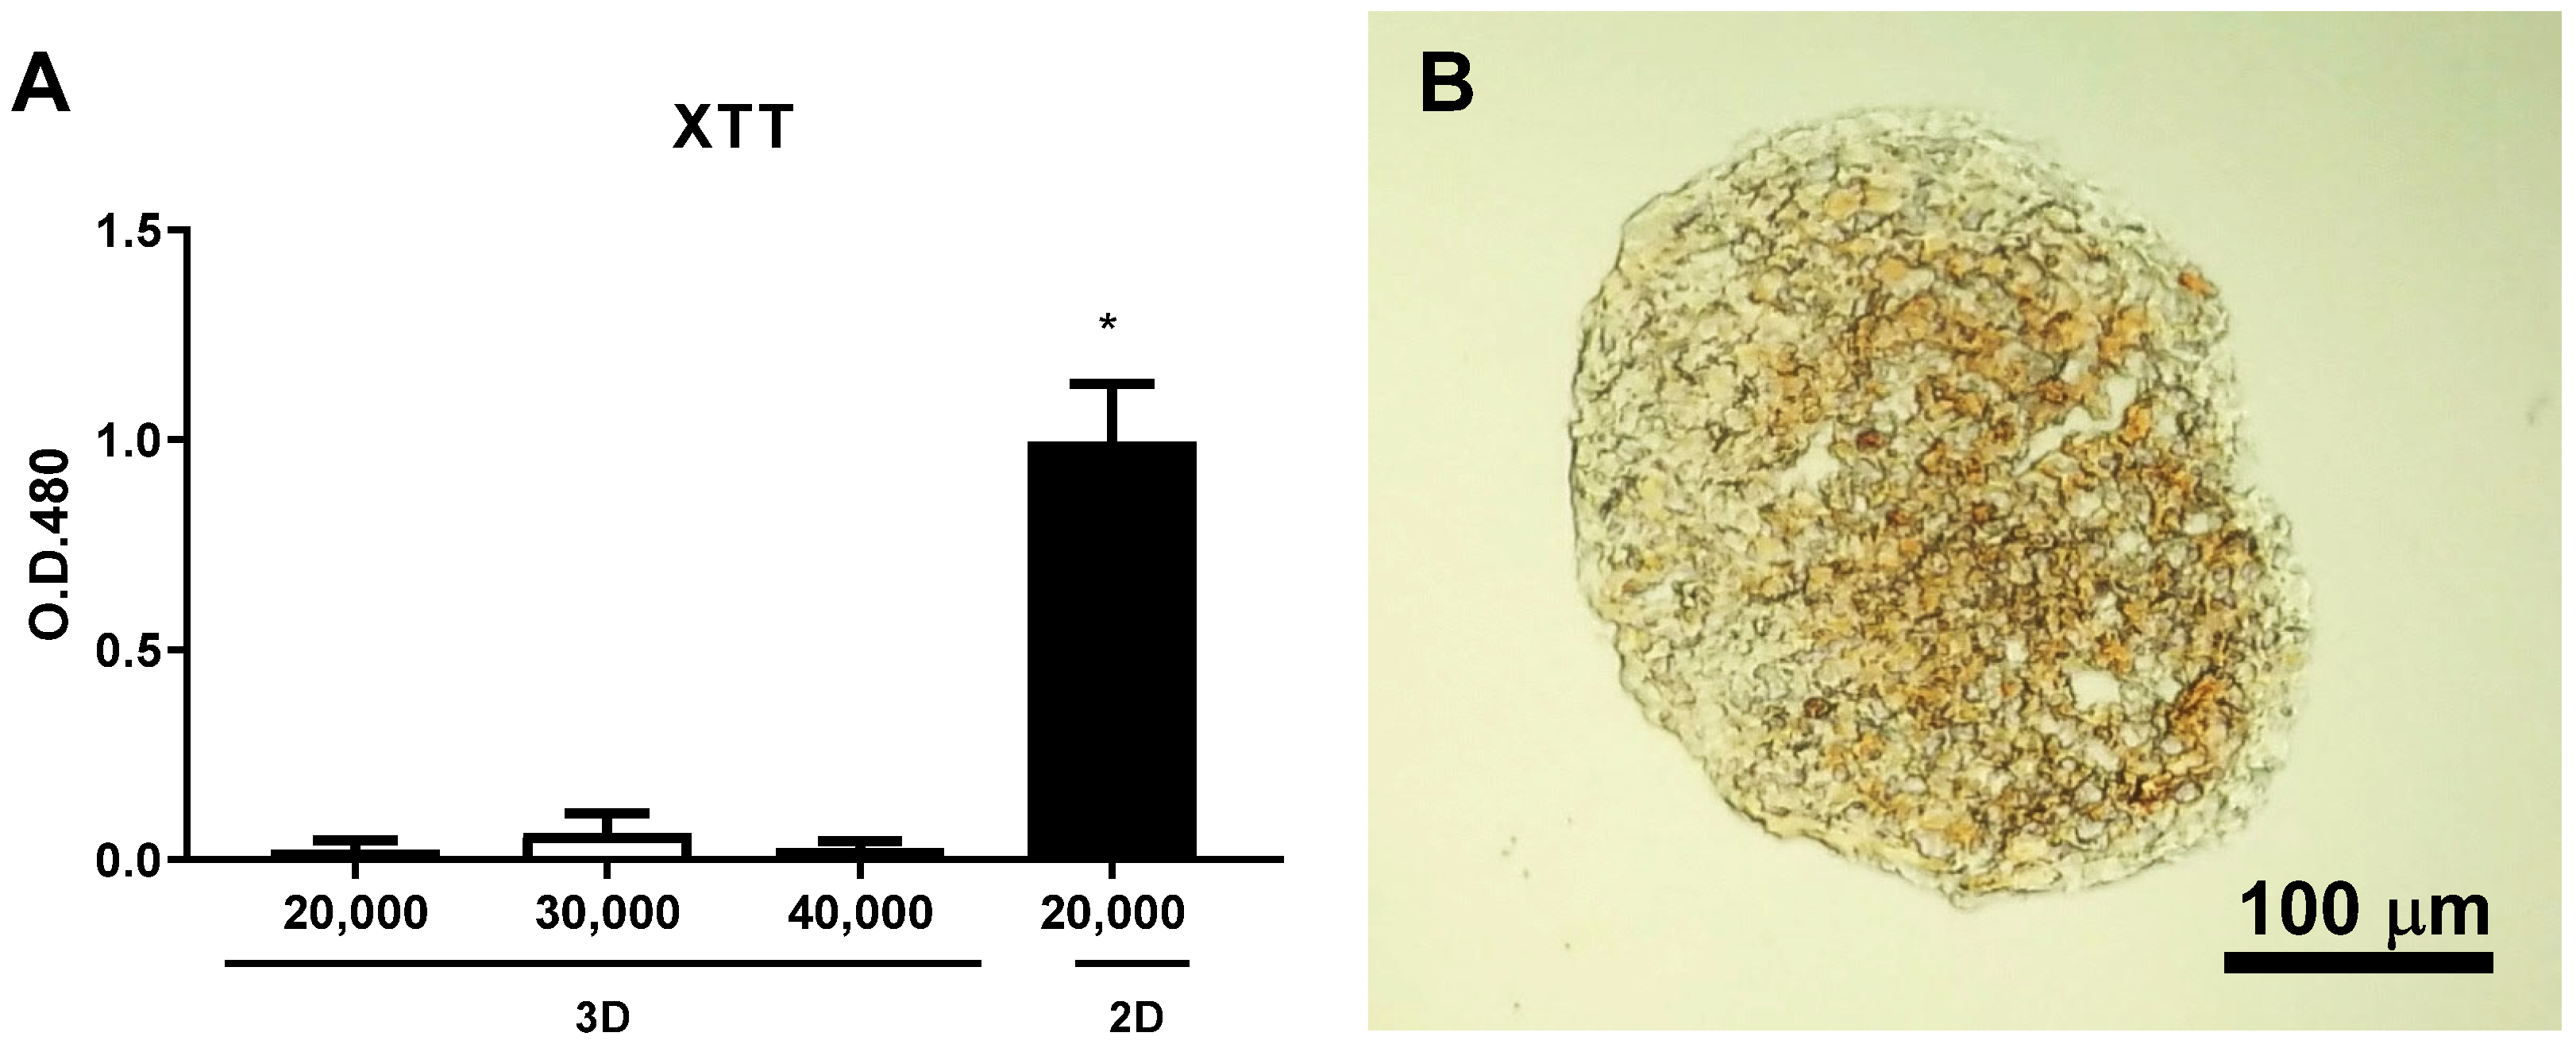
3.6. Evaluating the Adequacy of the XTT Assay

Although XTT is a soluble version of the tretazolium-based assay, optical densities remained as low as those observed for MTT (Figure 6A). Tests with longer incubation times were not feasible, since the reading was equalized to blank (data not shown). Histological sectioning of a spheroid after the incubation time of XTT (Figure 6B) shows that the dye was released in the outermost layers, but not the inner portion of the spheroid, providing an explanation of the reduced O.D. in the experiment.

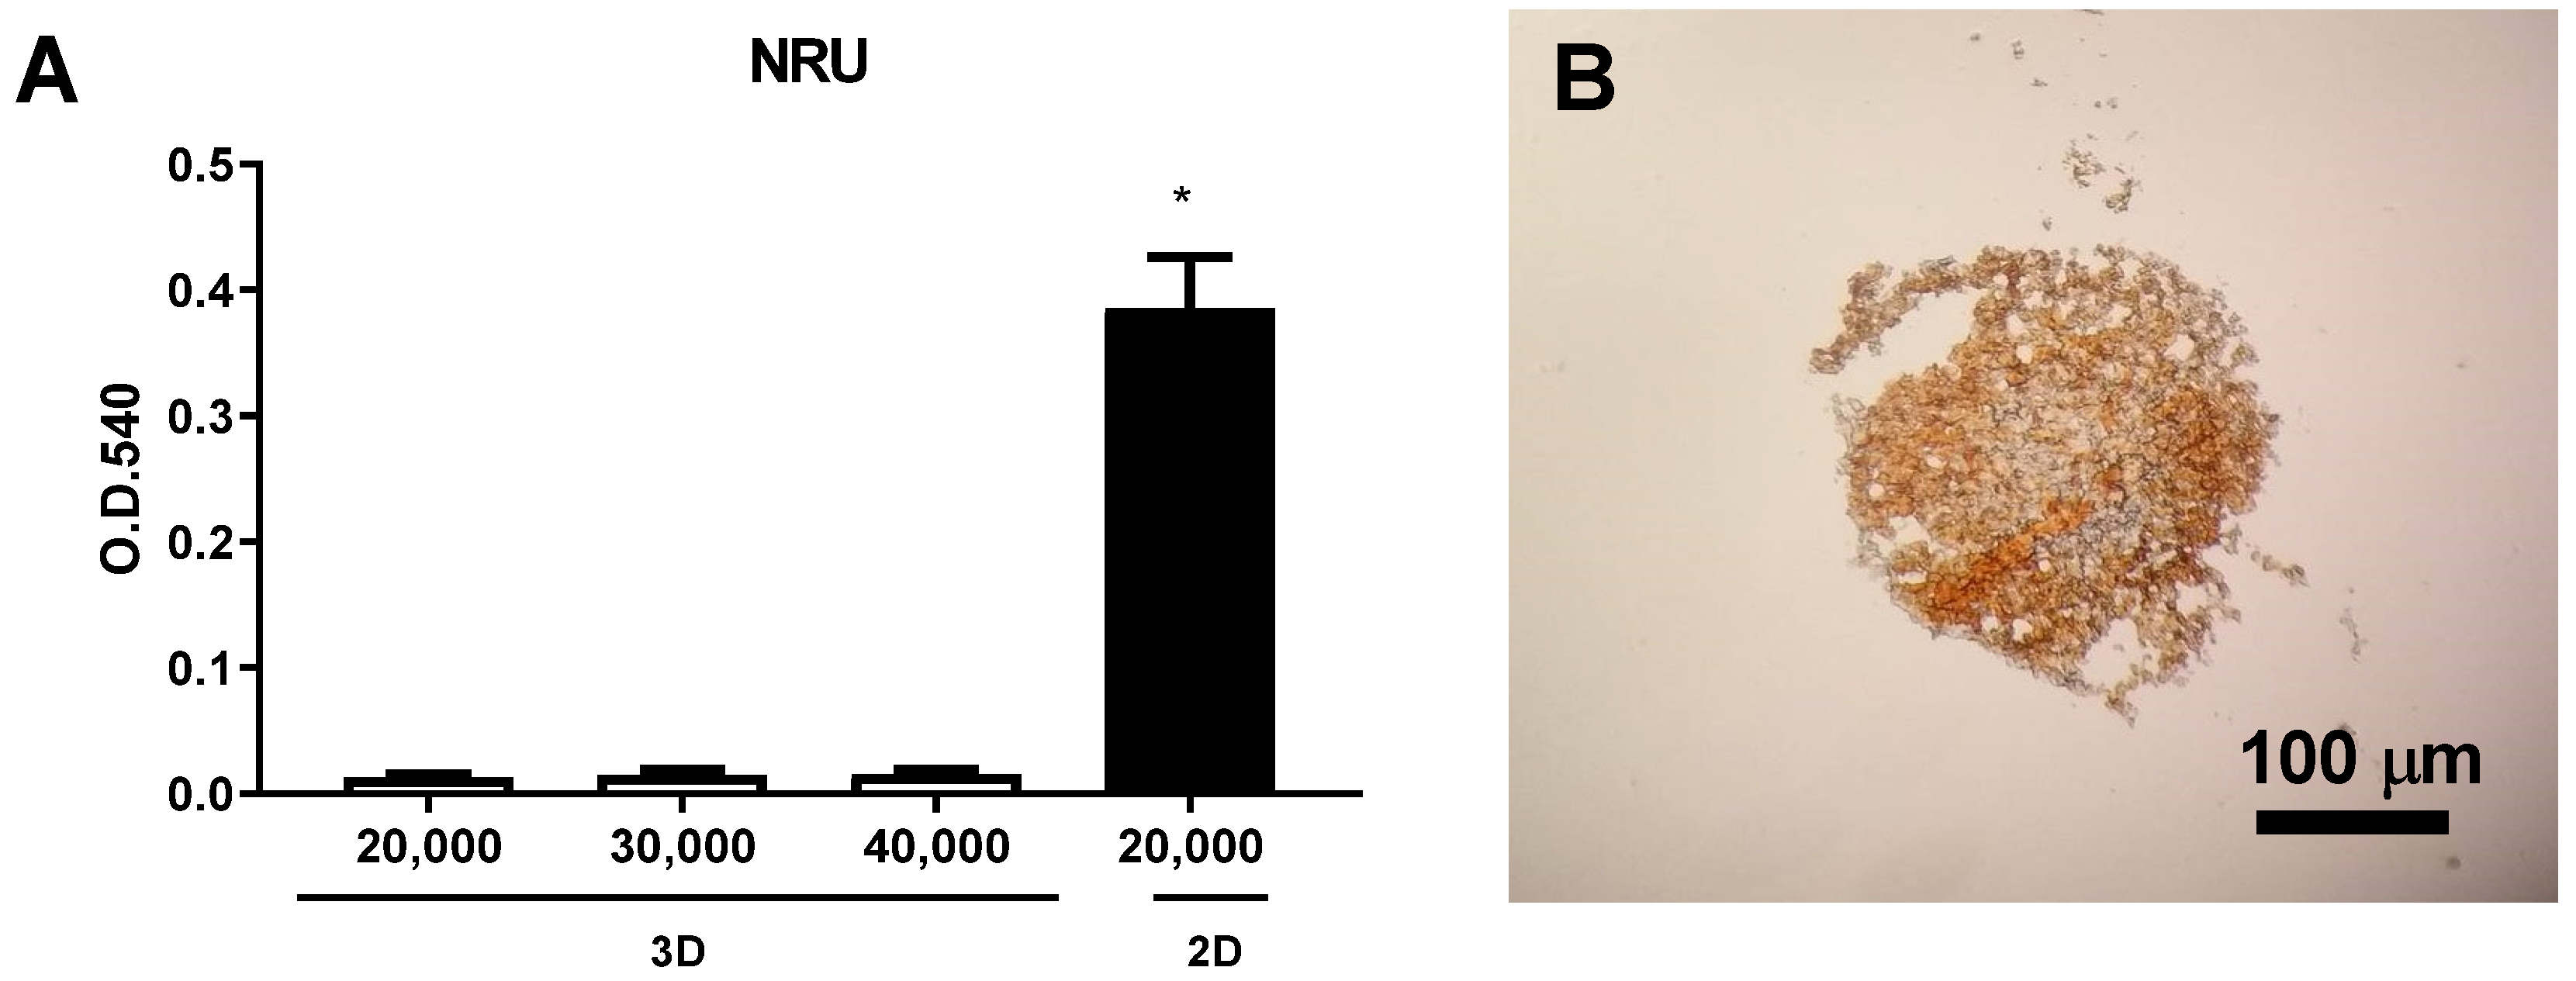
3.7. Analysis of the Adequacy to the NR Assay

There is no distinction between the result of cell densities (Figure 7A) and the result in the three-dimensional model remains the same as in the previous tests, with an O.D. inferior to the ideal. The histological evaluation of the produced sections shows that the dye remains inside the spheroids (Figure 7B).

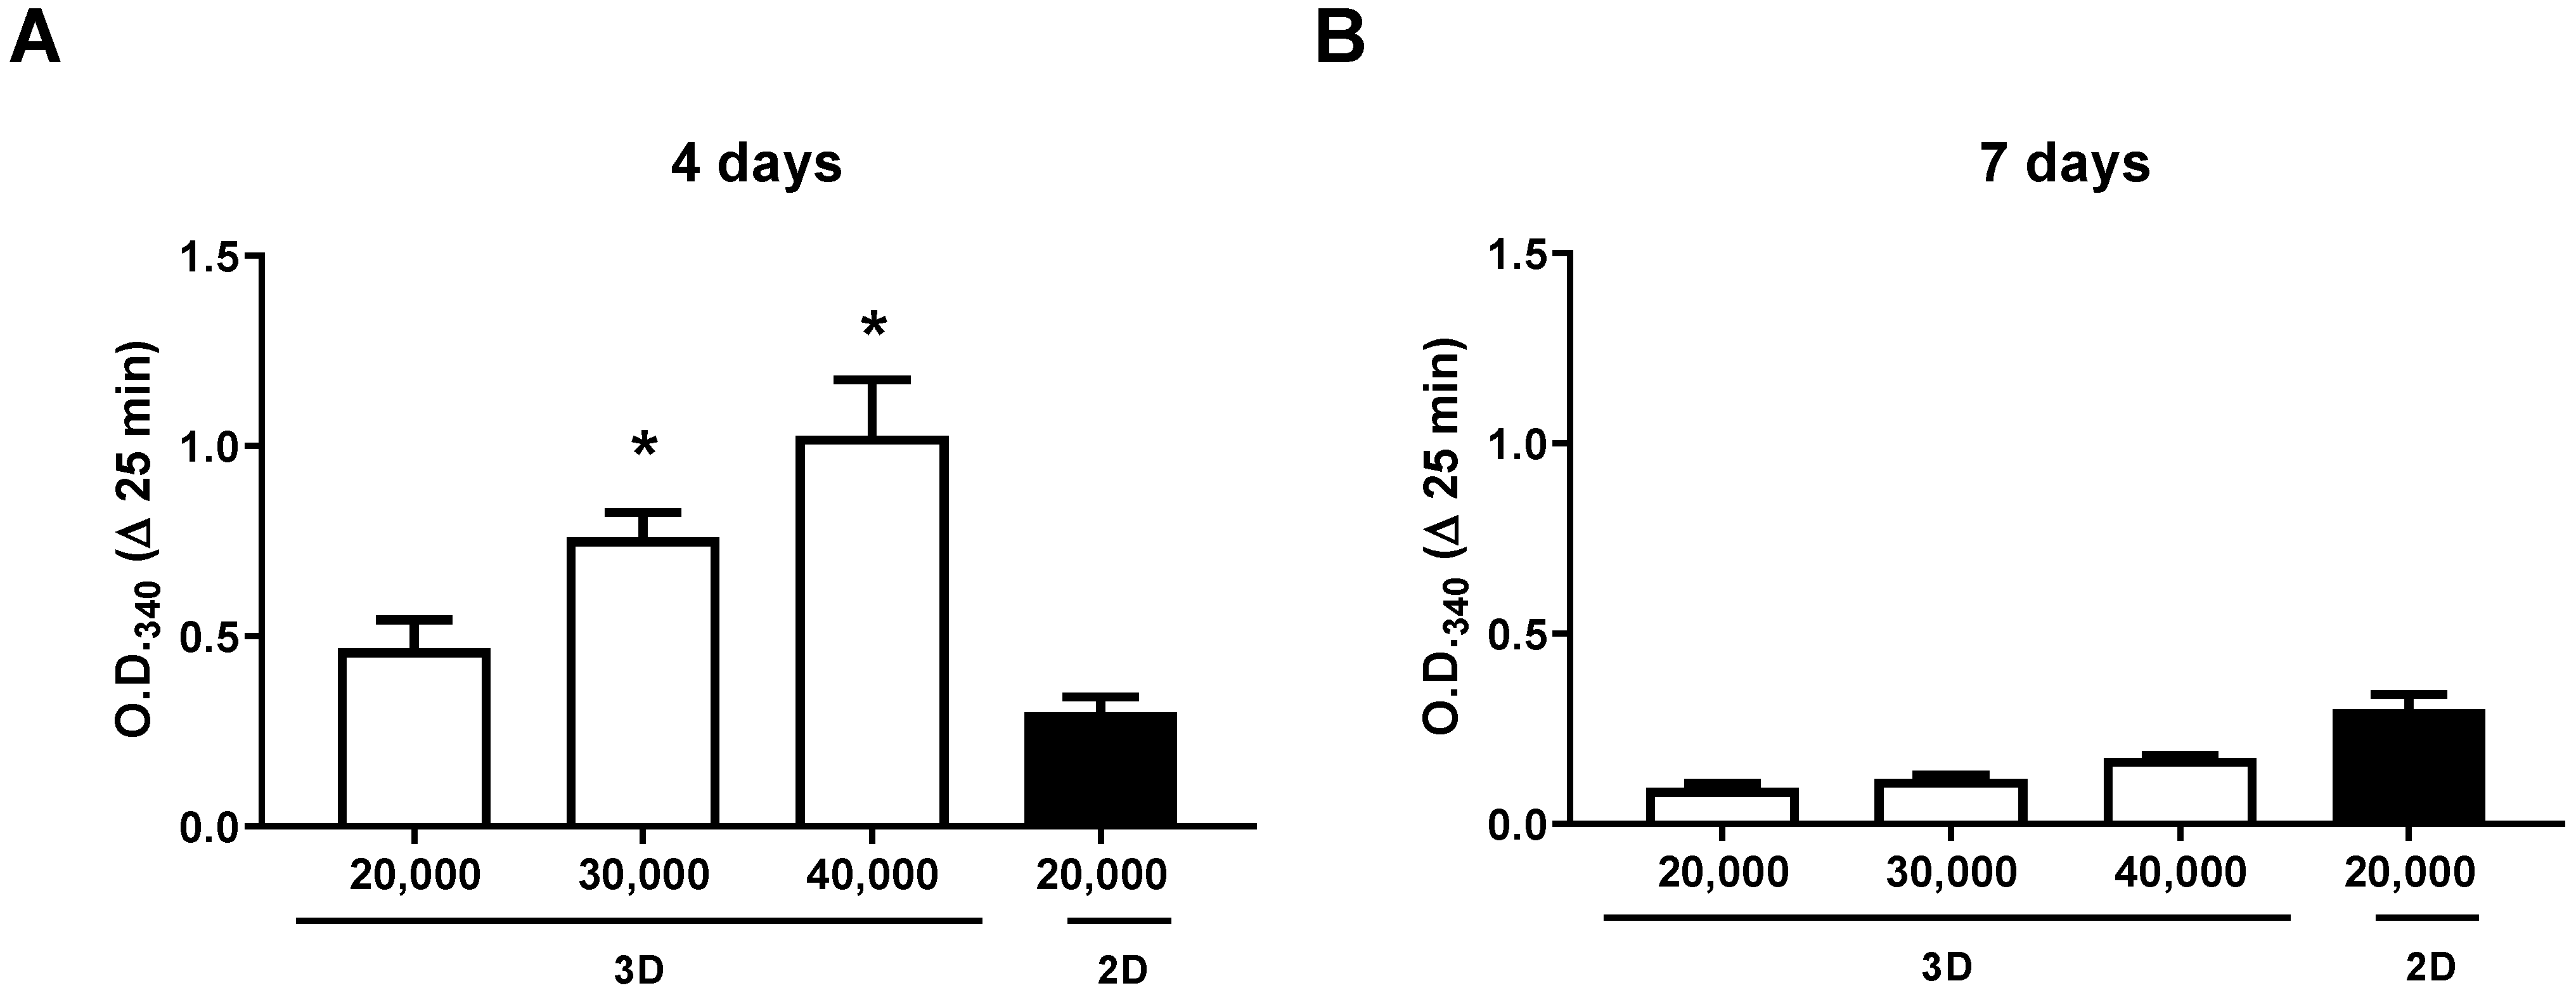
3.8. Assessing the Adequacy to the LDH Enzymatic Test

Observing that the tested colorimetric methods have limitations regarding the release of the dyes, we verified an enzymatic method using the cytosolic enzyme lactate dehydrogenase (LDH) for the determination of viable cells in the spheroids. The results of the optical density of aggregates with 4 days of formation presented adequate O.D. readings between 0.4 and 1.2 and were sensitive to differing cellular densities, with significant differences between 20,000, 30,000, and 40,000 cell spheroids (p < 0.05). The time of formation of the aggregates seems to interfere with the O.D., since the readings obtained with spheroids on the 7th day are lower than with spheroids on the 4th day (p < 0.05) (Figure 8).
To evaluate the behavior of the bone cell aggregates in a cytotoxicity test, we also performed a dose–response assessment by exposing 4-day spheroids to different concentrations of extracts of two commercial polymers, namely latex and PLA. Figure 9A shows that the LDH test employing the 3D model was sensitive to the latex extract, being capable of measuring cell death with a high level of correlation with the concentration of the extracts, in the best linear fit (R2 = 0.77), allowing the determination of an IC50 of 175 mg/mL for the latex extract. On the other hand, the biocompatible PLA did not cause significant cytotoxicity, regardless of the concentration employed (Figure 9B).

4. Discussion

In the present work, we developed and characterized a preosteoblast cell spheroid model, aiming to provide a simple, low-cost, easy reproduction tool to achieve one further step towards the simulation of bone microtissue, and improve the predictivity of cytotoxicity assessments of bone-substitute biomaterials and pharmaceuticals related to bone treatment. For this, we verified the applicability of the model for common cytotoxicity tests employed in the scientific literature and recommended in international standards (ISO10993-5:2009), including the colorimetric assays MTT, XTT, and NR, as well as the enzymatic LDH method. Our results indicate that the methods and parameters used for the 2D models are not directly applicable to the wide use of this type of 3D models, and that adaptations must be developed for these systems to achieve their full potential.
The choice of the cell type used in an in vitro biological assessment is an important feature that must balance its advantages and limitations. While primary cells have the benefit of a closer response to that observed in vivo, since they retain most characteristics of the tissue of origin, obtaining these cells is usually difficult, and limited by ethical approval and availability of donors. A limited number of passages and high variability among donors are other interfering factors that restrict the use of primary cells in several studies [15]. Immortalized cell lines, on the other hand, have the accumulation of mutations and metabolic alterations as their main disadvantages, but have important advantages in their commercial availability, uniformity, unlimited growth, and being well-characterized in the scientific literature, therefore, contributing to achieving standardized and reproducible tests [15]. In this context, MC3T3-E1 is a well-established non-transformed cell line derived from mouse calvaria bone, often used in materials research and osteogenesis studies, accumulating a large amount of data in the literature [16]. While its animal origin requires interspecies extrapolation for human hazard purposes [17], MC3T3 cells have close similarities to human osteoblast behavior and phenotype [17,18].
Regardless of the cell origin, the characterization of a 3D model is an important step to enable its safe and reproducible use in different experimental scenarios. In the present study, the proposed MC3T3-E1 spheroids presented a pattern of reduction in diameter over time. This phenomenon has already been observed in other works with spheroids of other cell types [19,20,21,22]. Possible explanations for this phenomenon may reside in differences in Extracellular Matrix (ECM) secretion and reorganization [19], or an increase in interdigital connections between the cells, increasing the expression of tight junctional proteins such as E-cadherin [22]. Another possibility is cell death in the spheroid core, due to the lack of oxygen and nutrients in their central areas. It is interesting to observe that the MC3T3 spheroids were stabilized on an average diameter a little under 400 μm considering that oxygen and nutrient diffusion rarely exceeds 200 μm, which is the maximum distance between a cell and the nearest capillary [23]. Furthermore, the initial aggregated presented apoptotic cells in the core, while the histological evaluation did not evidence the presence of a necrotic core. In conjunction, this characterization points out important cytotoxicity assessments with this model to ensure the use of spheroids with similar time of formation and diameter to generate comparable results.
The time for the complete formation of a 3D model varies according to the cell type. Some studies indicate that the best time for spheroid use is around day 7, as described for human mesenchymal stem cell spheroids [24] and primary human hepatocyte spheroids [25]. Other works show that the first day of the formation may be already adequate for aggregates composed of tumor cells, such as glioma spheroids [26]. In the present work, MC3T3-E1 spheroids were uniform and stable from day 4. The aggregates present a regular and compact surface when observed by SEM, remaining intact in the course of 28 days, as revealed by histological observation, even though no cell viability assessment had been performed yet for such a long culture time. They also presented small vesicles sprouting from the cell membrane, with typical dimensions of matrix vesicles. It is possible to observe a morphological modification in the spheroid cells cultured for 28 days in an osteogenic medium. This morphological modification and high numbers of filopodia can be due to the differentiation of osteoblasts, which when involved with the mineralized matrix, become osteocytes, which have dendritic characteristics [27].
Usually, MC3T3 cells in a bidimensional, monolaminar culture show mineralization only when cultivated in the presence of the induction medium and, in most studies, evidence of mineralization begins after 14 days of cultivation [28,29]. The proposed MC3T3 spheroids, on the other hand, presented mineralized matrix formation in 21 days of cultivation even without treatment with induction medium, while aggregates that were treated with osteogenic medium presented a strong deposition of calcium already on the 7th day of culture. It is possible that the close cell–cell and cell–interactions promoted by 3D models improve cell signaling and increase the local concentration of self-secreted induction factors, such as growth factors, stimulating osteoblasts to differentiate and produce mineralized matrix regardless of medium supplementation [30,31]. This is a feature that may increase the similarity of the model with bone microtissue during medical materials testing.
We tested this 3D model with different colorimetric cytotoxicity assays. Among those, MTT is a metabolic method and, therefore, both the number of viable cells and interferences cell metabolism can influence the result. However, the testing with the MC3T3 model did not identify a relationship between the number of cells on an aggregate unexposed to toxicants and the resulting Optical Density at 540 nm, indicating the lack of sensitivity of the regular protocol of MTT for this model.
In contrast to our results, the literature presents different studies using MTT with 3D models, that have an apparent success investigating drug cytotoxicity using human colorectal cancer cells spheroids [6], scaffold evaluation using human osteosarcoma MG63 cells [32] and dental biomaterials biocompatibility with mesenchymal stem-cell spheroids [33]. However, other authors suggest that colorimetric assays using the reduction in tetrazolium are not applicable to three-dimensional models and micro-tissues with the collagen matrix, since the dense matrix can affect the absorption and kinetic diffusion of the dye, which impacts OD readings [34,35]. The high production of junction proteins such as N-cadherins and E-cadherins during the development of the spheroids, which do not occur in the two-dimensional model, can be another source of interference [36]. It is interesting to note that the MTT and XTT have negative and positive charges, respectively [37] that maybe interacts with collagen charges that can be more negative or more positive depending on the pH [38]. It is possible that the formazan resulting from the tetrazolium conversion by cells would not be able to leave the inner layers of the spheroid due to the dense collagen matrix Type I collagen production that increases with time in osteoblasts and osteoblast-like cells [39]. Indeed, the sections of the spheroids after staining seem to corroborate this hypothesis as it is possible to observe that the tetrazolium is transformed to formazan even in the inner layers, and even after the extraction step with an organic solvent, the aggregates remained stained. Other protocol adaptations, such as increased incubation and extraction times, were not effective in this study, indicating that further strategies might be tested, such as the use of other solvents, in order to enable the adequate use of this method with bone cell spheroids.
Although XTT is a soluble version of the tetrazolium test, therefore not requiring an extraction step, it presented similar results as the MTT for the 3D model. Analyzing the histological sections, it is possible to observe that the dye left the cells of the outer layers, but remained trapped inside the spheroid, which was strongly stained. A similar result was observed for the third colorimetric assay tested, using the Neutral Red dye, which also failed to leave the inner layers of the aggregates during extraction, as revealed by the histological analysis. It is important to note that although the XTT, MTT, and NR tests did not perform adequately for the spectrophotometric analysis, the formazan labeling is still present after the cryosections, indicating the viability of the cells throughout the spheroid. Thus, those reagents/dyes can still be used in the 3D model as a qualitative histochemical analysis of cell viability, including the assessment of the penetration of the effects of a given toxicant or material, reinforcing the usefulness of 3D models for histological approaches.
Many authors employ the enzymatic LDH assay to determine cell viability of 3D models [40,41]. In the present study, LDH was the assay with best performance in the detection of different cell densities inside the MC3T3 spheroids. The test was sensible to differentiate different densities and showed a dose–response when the spheroids were exposed to latex, resulting in an IC50 estimated at 175 mg/mL. Curiously, a previous study employing monolaminar bidimensional MC3T3-E1 culture was able to identify a much higher sensitivity of these cells to latex samples of the same origin as this study, with an IC50 value approximately ten times lower (16 mg/mL) [42]. This expected pattern of lower sensitivity of 3D models to toxicants is often reported in the literature and is most probably related to the strong cell–cell and cell-–CM connections that alter the drug/toxicant penetration [43], in a manner that is more relatable to the in vivo response to these molecules.
An important observation was made regarding the response of the LDH test to aggregates with different times of cultivation, as the optical density observed for spheroids at 4 days was higher than that observed for those on the 7th day. In this study, we were not able to experimentally identify if this reduced signal could be attributed to a smaller proportion of cells at day seven, as the mineralized spheroids at this experiment could not be disaggregated for cell counting with trypan blue. On the other hand, it is also possible that the spheroids become more difficult to be quantified over time, most probably, due to the mineralization and strengthening of the matrix. This hypothesis remains untested and should be assessed by further studies but is a possibility of great relevance for researchers that intend to investigate cell density during studies of the osteogenic potential of drugs and materials, that usually employ longer experimental times, demanding further refinement of the available quantification methods.
In summary, the results of the present study describe a reproductive model, with characteristics more similar to the bone tissue in vivo, presenting mineralized matrix production even without induction, but that demands the development of particular methodologies for cytotoxicity assessments, with special issues related to colorimetric assays. Methods that are very dependent on dye extraction may not be suitable for quantitative analysis of the three-dimensional bone model but can be used qualitatively on histological sections. On the other hand, the LDH method is capable of detecting cell viability similarly to the 2D model and is capable of generating a satisfactory dose response for a well-known cytotoxic material, proving to be a suitable method for the evaluation of the cytotoxicity of biomaterials through the use bone cell three-dimensional models.

5. Conclusions

The MC3T3-E1 spheroids presented good uniformity, structural stability, and cell viability, evidencing cellular differentiation and a mineralized matrix even in the absence of osteogenic stimuli, but with a time-dependent reduction in size during 28 days of culture. The application of this model in the standard protocols of the colorimetric assays MTT, XTT, and NRU is impaired due to the difficult extraction of the dyes from the inner layers of the aggregates, reducing the expected measures of optical density. On the other hand, the LDH test was able to identify a direct correlation between O.D. and aggregate cell density, enabling the detection of the dose–response to a well-known cytotoxic material. These results suggest that LDH is the most adequate cytotoxicity test for the use of this bone spheroid model as a promising predictive tool for the in vitro evaluation of the biocompatibility of biomaterials.

Author Contributions

Conceptualization, A.C.B.B., D.C.S. and G.G.A., Methodology, A.C.B.B., D.C.S., J.C.d.S., V.S.G. and E.M.; Validation, G.G.A., C.F.M. and A.L.; Formal analysis, G.G.A., A.C.B.B., C.F.M. and A.L.; Investigation, A.C.B.B., D.C.S., J.C.d.S., E.M. and G.G.A.; Resources, C.F.M., G.G.A. and A.L.; Data curation, C.F.M. and G.G.A.; Writing—original draft preparation, A.C.B.B., J.C.d.S.; Writing—review and editing, G.G.A., C.F.M. and A.L.; Supervision, C.F.M. and G.G.A.; Funding acquisition, C.F.M., A.L. and G.G.A. All authors have read and agreed to the published version of the manuscript.

Funding

The work was supported by CAPES, CNPq, and FAPERJ.

Institutional Review Board Statement

Not applicable.

Informed Consent Statement

Not applicable.

Data Availability Statement

Not applicable.

Conflicts of Interest

The authors declare no conflict of interest.

References

  1. Gupta, R.; Polaka, S.; Rajpoot, K.; Tekade, M.; Sharma, M.C.; Tekade, R.K. Importance of toxicity testing in drug discovery and research. In Pharmacokinetics and Toxicokinetic Considerations; Elsevier: Amsterdam, The Netherlands, 2022; pp. 117–144. [Google Scholar]
  2. Wnorowski, A.; Yang, H.; Wu, J.C. Progress, obstacles, and limitations in the use of stem cells in organ-on-a-chip models. Adv. Drug Deliv. Rev. 2019, 140, 3–11. [Google Scholar] [CrossRef] [PubMed]
  3. Pamies, D.; Hartung, T. 21st century cell culture for 21st century toxicology. Chem. Res. Toxicol. 2017, 30, 43–52. [Google Scholar] [CrossRef] [PubMed] [Green Version]
  4. Hartung, T. Perspectives on in vitro to in vivo extrapolations. Appl. Vitr. Toxicol. 2018, 4, 305–316. [Google Scholar] [CrossRef] [PubMed]
  5. Charwat, V.; Egger, D. The third dimension in cell culture: From 2D to 3D culture formats. In Cell Culture Technology; Springer: Berlin/Heidelberg, Germany, 2018; pp. 75–90. [Google Scholar]
  6. Weng, Q.; Zhou, L.; Xia, L.; Zheng, Y.; Zhang, X.; Li, F.; Li, Q. In vitro evaluation of FL118 and 9-Q20 cytotoxicity and cellular uptake in 2D and 3D different cell models. Cancer Chemother. Pharmacol. 2019, 84, 527–537. [Google Scholar] [CrossRef]
  7. Achilli, T.-M.; Meyer, J.; Morgan, J.R. Advances in the formation, use and understanding of multi-cellular spheroids. Expert Opin. Biol. Ther. 2012, 12, 1347–1360. [Google Scholar] [CrossRef] [Green Version]
  8. Borsani, E.; Bonazza, V.; Buffoli, B.; Nocini, P.F.; Albanese, M.; Zotti, F.; Inchingolo, F.; Rezzani, R.; Rodella, L.F. Beneficial effects of concentrated growth factors and resveratrol on human osteoblasts in vitro treated with bisphosphonates. BioMed Res. Int. 2018, 2018, 4597321. [Google Scholar] [CrossRef] [Green Version]
  9. Matinfar, M.; Mesgar, A.S.; Mohammadi, Z. Evaluation of physicochemical, mechanical and biological properties of chitosan/carboxymethyl cellulose reinforced with multiphasic calcium phosphate whisker-like fibers for bone tissue engineering. Mater. Sci. Eng. C 2019, 100, 341–353. [Google Scholar] [CrossRef]
  10. Futrega, K.; Mosaad, E.; Chambers, K.; Lott, W.; Clements, J.; Doran, M. Bone marrow-derived stem/stromal cells (BMSC) 3D microtissues cultured in BMP-2 supplemented osteogenic induction medium are prone to adipogenesis. Cell Tissue Res. 2018, 374, 541–553. [Google Scholar] [CrossRef] [Green Version]
  11. Lee, H.; Lee, H.; Na, C.-B.; Park, J.-B. The effects of simvastatin on cellular viability, stemness and osteogenic differentiation using 3-dimensional cultures of stem cells and osteoblast-like cells. Adv. Clin. Exp. Med. 2019, 28, 699–706. [Google Scholar] [CrossRef]
  12. Souza, W.; Piperni, S.; Laviola, P.; Rossi, A.; Rossi, M.I.D.; Archanjo, B.S.; Leite, P.; Fernandes, M.; Rocha, L.; Granjeiro, J. The two faces of titanium dioxide nanoparticles bio-camouflage in 3D bone spheroids. Sci. Rep. 2019, 9, 1–14. [Google Scholar] [CrossRef]
  13. Wang, L.; Wang, Y.; Chen, A.; Jalali, A.; Liu, S.; Guo, Y.; Na, S.; Nakshatri, H.; Li, B.-Y.; Yokota, H. Effects of a checkpoint kinase inhibitor, AZD7762, on tumor suppression and bone remodeling. Int. J. Oncol. 2018, 53, 1001–1012. [Google Scholar] [CrossRef] [Green Version]
  14. Brochado, A.C.B.; de Souza, V.H.; Correa, J.; Dos Anjos, S.A.; de Almeida Barros Mourão, C.F.; Cardarelli, A.; Montemezzi, P.; Gameiro, V.S.; Pereira, M.R.; Mavropoulos, E. Osteosphere Model to Evaluate Cell–Surface Interactions of Implantable Biomaterials. Materials 2021, 14, 5858. [Google Scholar] [CrossRef]
  15. Kaur, G.; Dufour, J.M. Cell Lines: Valuable Tools or Useless Artifacts; Taylor & Francis: Abingdon, UK, 2012; Volume 2, pp. 1–5. [Google Scholar]
  16. Izumiya, M.; Haniu, M.; Ueda, K.; Ishida, H.; Ma, C.; Ideta, H.; Sobajima, A.; Ueshiba, K.; Uemura, T.; Saito, N. Evaluation of MC3T3-E1 Cell Osteogenesis in Different Cell Culture Media. Int. J. Mol. Sci. 2021, 22, 7752. [Google Scholar] [CrossRef]
  17. Czekanska, E.; Stoddart, M.; Richards, R.; Hayes, J. In search of an osteoblast cell model for in vitro research. Eur. Cells Mater. 2012, 24, 1–17. [Google Scholar] [CrossRef]
  18. Towler, D.A.; Arnaud, R.S. Use of cultured osteoblastic cells to identify and characterize transcriptional regulatory complexes. In Principles of Bone Biology; Elsevier: Amsterdam, The Netherlands, 2002; pp. 1503–1527. [Google Scholar]
  19. Gong, X.; Lin, C.; Cheng, J.; Su, J.; Zhao, H.; Liu, T.; Wen, X.; Zhao, P. Generation of multicellular tumor spheroids with microwell-based agarose scaffolds for drug testing. PLoS ONE 2015, 10, e0130348. [Google Scholar] [CrossRef] [Green Version]
  20. Jörg, N.; Sascha, H.; Hans, P.W. 3-D osteoblast culture for biomaterials testing. J. Dev. Biol. Tissue Eng. 2013, 5, 7–12. [Google Scholar]
  21. Kyffin, J.A.; Sharma, P.; Leedale, J.; Colley, H.E.; Murdoch, C.; Harding, A.L.; Mistry, P.; Webb, S.D. Characterisation of a functional rat hepatocyte spheroid model. Toxicol. Vitr. 2019, 55, 160–172. [Google Scholar] [CrossRef]
  22. Langan, L.M.; Owen, S.F.; Trznadel, M.; Dodd, N.J.; Jackson, S.K.; Purcell, W.M.; Jha, A.N. Spheroid size does not impact metabolism of the β-blocker propranolol in 3D intestinal fish model. Front. Pharmacol. 2018, 9, 947. [Google Scholar] [CrossRef] [Green Version]
  23. Place, T.L.; Domann, F.E.; Case, A.J. Limitations of oxygen delivery to cells in culture: An underappreciated problem in basic and translational research. Free Radic. Biol. Med. 2017, 113, 311–322. [Google Scholar] [CrossRef]
  24. Tsai, A.-C.; Liu, Y.; Yuan, X.; Ma, T. Compaction, fusion, and functional activation of three-dimensional human mesenchymal stem cell aggregate. Tissue Eng. Part A 2015, 21, 1705–1719. [Google Scholar] [CrossRef] [Green Version]
  25. Bell, C.C.; Hendriks, D.F.; Moro, S.M.; Ellis, E.; Walsh, J.; Renblom, A.; Fredriksson Puigvert, L.; Dankers, A.C.; Jacobs, F.; Snoeys, J. Characterization of primary human hepatocyte spheroids as a model system for drug-induced liver injury, liver function and disease. Sci. Rep. 2016, 6, 1–13. [Google Scholar] [CrossRef] [PubMed]
  26. Mirab, F.; Kang, Y.J.; Majd, S. Preparation and characterization of size-controlled glioma spheroids using agarose hydrogel microwells. PLoS ONE 2019, 14, e0211078. [Google Scholar] [CrossRef]
  27. Mc Garrigle, M.; Mullen, C.A.; Haugh, M.G.; Voisin, M.C.; McNamara, L.M. Osteocyte differentiation and the formation of an interconnected cellular network in vitro. Eur. Cells Mater. 2016, 31, 323–340. [Google Scholar] [CrossRef] [PubMed]
  28. Suzuki, H.; Tatei, K.; Ohshima, N.; Sato, S.; Izumi, T. Regulation of MC3T3-E1 differentiation by actin cytoskeleton through lipid mediators reflecting the cell differentiation stage. Biochem. Biophys. Res. Commun. 2019, 514, 393–400. [Google Scholar] [CrossRef] [PubMed]
  29. Tasadduq, R.; Gordon, J.; Al-Ghanim, K.A.; Lian, J.B.; Van Wijnen, A.J.; Stein, J.L.; Stein, G.S.; Shakoori, A.R. Ethanol extract of Cissus quadrangularis enhances osteoblast differentiation and mineralization of murine pre-osteoblastic MC3T3-E1 cells. J. Cell. Physiol. 2017, 232, 540–547. [Google Scholar] [CrossRef] [Green Version]
  30. Knight, E.; Przyborski, S. Advances in 3D cell culture technologies enabling tissue-like structures to be created in vitro. J. Anat. 2015, 227, 746–756. [Google Scholar] [CrossRef] [Green Version]
  31. Koledova, Z. 3D Cell Culture: An Introduction. Methods Mol. Biol. 2017, 1612, 1–11. [Google Scholar] [CrossRef]
  32. Jiang, T.; Xu, G.; Chen, X.; Huang, X.; Zhao, J.; Zheng, L. Impact of hydrogel elasticity and adherence on osteosarcoma cells and osteoblasts. Adv. Healthc. Mater. 2019, 8, 1801587. [Google Scholar] [CrossRef]
  33. Naddeo, P.; Laino, L.; La Noce, M.; Piattelli, A.; De Rosa, A.; Iezzi, G.; Laino, G.; Paino, F.; Papaccio, G.; Tirino, V. Surface biocompatibility of differently textured titanium implants with mesenchymal stem cells. Dent. Mater. 2015, 31, 235–243. [Google Scholar] [CrossRef]
  34. Kijanska, M.; Kelm, J. In Vitro 3D Spheroids and Microtissues: ATP-based Cell Viability and Toxicity Assays Assay Guidance Manual; Eli Lilly & Company and the National Center for Advancing Translational Sciences: Bethesda, MD, USA, 2004; p. NBK343426. [Google Scholar]
  35. Mittler, F.; Obeïd, P.; Rulina, A.V.; Haguet, V.; Gidrol, X.; Balakirev, M.Y. High-content monitoring of drug effects in a 3D spheroid model. Front. Oncol. 2017, 7, 293. [Google Scholar] [CrossRef] [Green Version]
  36. Walzl, A.; Unger, C.; Kramer, N.; Unterleuthner, D.; Scherzer, M.; Hengstschläger, M.; Schwanzer-Pfeiffer, D.; Dolznig, H. The resazurin reduction assay can distinguish cytotoxic from cytostatic compounds in spheroid screening assays. J. Biomol. Screen. 2014, 19, 1047–1059. [Google Scholar] [CrossRef]
  37. Riss, T.; Moravec, R.; Niles, A.; Duellman, S.; Benink, H.; Worzella, T.; Minor, L. Cell viability assays. In Assay Guidance Manual; 2016; p. NBK144065. Available online: https://www.ncbi.nlm.nih.gov/books/NBK144065/ (accessed on 13 December 2022).
  38. Mesquida, P.; Kohl, D.; Andriotis, O.G.; Thurner, P.J.; Duer, M.; Bansode, S.; Schitter, G. Evaluation of surface charge shift of collagen fibrils exposed to glutaraldehyde. Sci. Rep. 2018, 8, 1–7. [Google Scholar] [CrossRef] [Green Version]
  39. Sato, K.; Matsubara, O.; Hase, E.; Minamikawa, T.; Yasui, T. Quantitative in situ time-series evaluation of osteoblastic collagen synthesis under cyclic strain using second-harmonic-generation microscopy. J. Biomed. Opt. 2019, 24, 031019. [Google Scholar] [CrossRef]
  40. Mishra, A.; Mukhopadhyay, S.K.; Dey, S. Evaluation of cyclosaplin efficacy using a silk based 3D tumor model. Biomolecules 2019, 9, 123. [Google Scholar] [CrossRef] [Green Version]
  41. Ogihara, T.; Arakawa, H.; Jomura, T.; Idota, Y.; Koyama, S.; Yano, K.; Kojima, H. Utility of human hepatocyte spheroids without feeder cells for evaluation of hepatotoxicity. J. Toxicol. Sci. 2017, 42, 499–507. [Google Scholar] [CrossRef] [Green Version]
  42. Lourenço, E.S.; Côrtes, J.; Costa, J.; Linhares, A.; Alves, G. Evaluation of commercial latex as a positive control for in vitro testing of bioceramics. Key Eng. Mater. 2015, 631, 357–362. [Google Scholar] [CrossRef]
  43. Ruiz, M.C.; Kljun, J.; Turel, I.; Di Virgilio, A.L.; León, I.E. Comparative antitumor studies of organoruthenium complexes with 8-hydroxyquinolines on 2D and 3D cell models of bone, lung and breast cancer. Metallomics 2019, 11, 666–675. [Google Scholar] [CrossRef]
Figure 1. Representative images by optical microscopy of MC3T3-E1 spheroids of 20,000 cells during the first 7 days and at the 14th, 21st, and 28th days of formation. Images obtained with a 20× objective. Scale bars indicate 100 μm.
Applsci 13 01602 g001
Figure 2. (A) Percentage of viable cells among the total cells measured by the Trypan Blue exclusion test during the first 5 days of aggregate formation. (B) Confocal microscopy imaging of the central section of a 20,000-cell aggregate, labeled for viable cell DNA through Hoechst 33342 (blue) and for caspases 3/7 (green) indicating apoptosis. The scale bar indicates 50 µm.
Applsci 13 01602 g002
Figure 3. Electron micrographs of MC3T3-E1 cell spheroids. (A) Spheroid on day 0 of treatment with osteogenic medium; (B) Spheroid treated with osteogenic medium for 28 days; (C) Cells of a spheroid on the day 0 and (D) on the 28th day; (E) cells aggregated in a spheroid on the 14th day in culture (F) enlarged image of the area (*) with possible cell matrix vesicles.
Applsci 13 01602 g003
Figure 4. Photomicrographs of spheroids maintained in culture with untreated medium and treated for osteogenic induction. (A) 7 μm thick sections stained with HE and (B) 7 μm thick sections stained with Alizarin Red (aggregates collected at 1, 7, 14, 21, and 28 days counted after the formation time of 4 days and after the first day of exposure to the induction medium). Images obtained with a 20× objective. Scale bars indicate 100 µm.
Applsci 13 01602 g004
Figure 5. (A) Optical density of the MTT assay for two different times of incubation (2 h and 4 h; (B)) Optical density for two different times of extraction (15 min and 1 h). Bars represent the mean ± SD (n = 5) optical density at 540 nm; (C) Comparison of the optical density obtained by a MTT assay performed with different cell densities for the 3D model, and the seeding of 20,000 cells for the 2D model. Black bars indicate the results obtained with monolaminar cell culture of MC3T3-E1 cells form the same origin as those used in the aggregates. (D) 7 µm section of spheroid with 20,000 cells after the incubation with Formazan for 2 h; (E) 7 µm section of spheroid with 20,000 cells after the extraction with DMSO for 1 h. All experiments were performed with spheroids at the 4th day after formation.
Applsci 13 01602 g005
Figure 6. (A) Optical density of the XTT assay, with different cell densities incubated for 4 h. Bars represent the mean ± SD (n = 5) optical density at 480 nm. The black bar indicates the result obtained with monolaminar cell culture of MC3T3-E1 cells form the same origin as those used in the aggregates. (B) 7 µm section of spheroid with 20,000 cells after incubation with XTT. An asterisk indicates significative difference from other groups (p < 0.05). All experiments were performed with spheroids at the 4th day after formation.
Applsci 13 01602 g006
Figure 7. (A) NRU assay performed with spheroids of three densities (20,000, 30,000 and 40,000 cells); Bars represent the mean ± SD (n = 5) optical density at 540 nm after 25 min reaction. The Black bar indicates the results obtained with monolaminar cell culture of MC3T3-E1 cells form the same origin as those used in the aggregates. (B) Histological section (7 µm) of a spheroid after the extraction step, showing the remaining dye inside cell aggregate. An asterisk indicates significative difference from other groups (p < 0.05). All experiments were performed with spheroids at the 4th day after formation.
Applsci 13 01602 g007
Figure 8. LDH test of aggregates with 4 days (A) and 7 days (B) of formation. All groups were significantly different in the same experimental time. Bars represent the mean ± SD (n = 5) reduction in optical density at 340 nm after 25 min reaction. Black bars indicate the results obtained with monolaminar cell culture of MC3T3-E1 cells form the same origin as those used in the aggregates. An asterisk indicates significant differences from other groups in the same experimental time (p < 0.05).
Applsci 13 01602 g008
Figure 9. LDH test of aggregates at 4 days after seeding (30,000 cells), submitted to extracts of different proportions of commercial latex (A) or polylactic acid (PLA) (B). Results represent mean ± SD survival, as a % of the control (unexposed cells) of two independent experiments in quintuplicates.
Applsci 13 01602 g009
Disclaimer/Publisher’s Note: The statements, opinions and data contained in all publications are solely those of the individual author(s) and contributor(s) and not of MDPI and/or the editor(s). MDPI and/or the editor(s) disclaim responsibility for any injury to people or property resulting from any ideas, methods, instructions or products referred to in the content.

