Article

Enhanced Anti-Skin Aging Effects of Fermented Black Ginseng (Panax ginseng C.A. Meyer) by Aspergillus niger KHNT-1

1
Department of Pharmaceutical Biology, Faculty of Pharmacy, Padjadjaran University, Sumedang 45363, West Java, Indonesia
2
Graduate School of Biotechnology, College of Life Sciences, Kyung Hee University, Yongin-si 17104, Gyeonggi-do, Republic of Korea
3
Department of Oriental Medicinal Biotechnology, College of Life Sciences, Kyung Hee University, Yongin-si 17104, Gyeonggi-do, Republic of Korea
4
Nature Bio Pharma Co., Ltd., Seoul 06241, Republic of Korea
*
Authors to whom correspondence should be addressed.
These authors contributed equally to this work.
Appl. Sci. 2023, 13(1), 550; https://doi.org/10.3390/app13010550
Submission received: 7 December 2022 / Revised: 24 December 2022 / Accepted: 24 December 2022 / Published: 30 December 2022

Abstract

:
Functional foods to prevent aging, particularly skin aging, have grown in popularity as society ages and science uncovers the pathological mechanisms of aging. In this study, we used processed ginseng, one of the famous functional foods, along with fermentation utilizing the novel Aspergillus niger strain KHNT-1 to enhance its value and efficacy. We successfully produced fermented black ginseng (FBG) and investigated its anti-skin aging properties, such as anti-melanogenic, anti-wrinkle, and antioxidant activities. The results showed that FBG at 100 μg/mL inhibited tyrosinase and melanin production in IBMX-stimulated B16F10 cells. FBG significantly reduced tyrosinase, TYRP-1, and MITF mRNA expression. Moreover, FBG stimulated anti-wrinkle effects in UVB-irradiated human dermal fibroblast (FBG) cells by inhibiting elastase activity, and decreasing MMP-1 and MMP-9 while increasing COL-1 mRNA expression. Furthermore, FBG showed antioxidant activity by reducing ROS levels in H2O2-induced HaCat cells. All tests showed that FBG had better anti-melanogenic, anti-wrinkle, and antioxidant activities than black ginseng (BG) and white ginseng (WG). Interestingly, FBG had lower toxicity in B16F10, HDF, and HaCat cells compared with BG. Thus, this study discovers the underlying mechanism of FBG as a functional material with anti-skin-aging properties.

1. Introduction

The skin as a barrier has a critical function in protecting the body from extrinsic factors and water loss, which can cause skin aging. Aged skin is especially intriguing because it represents the most visible aspect of the aging process and is an indicator of human health. It appears useful in predicting clinical manifestations and diagnosis [1]. UV light and environmental pollution, including ozone and particulate matter, can produce reactive oxygen species (ROS) [2,3]. Various pathogenetic conditions, including aging and cancer, have been linked to mitochondrial ROS production-induced oxidative damage [4]. ROS induces keratinocytes to secrete an α-melanocyte-stimulating hormone (α-MSH) to bind with melanocortin 1 receptor (MC1R), leading to the expression of microphthalmia-associated transcription factor (MITF) and tyrosinase protein regulation and resulting in melanin synthesis (melanogenesis) [5,6]. Moreover, accumulated ROS can indirectly activate the mitogen-activated protein kinase (MAPK) pathway and increase matrix metalloproteinase (MMP) production which can induce inflammation, as well as degrade collagen and elastin which collectively impair the retention of skin structure resulting in skin wrinkling [7,8,9].
Wrinkles, dry skin, shrinking, sagging skin, laxity, and hyperpigmentation are all signs of skin aging that can affect health and appearance. People’s social behavior and reproductive status may be influenced positively by their health and beautiful appearance. Since natural products cause fewer adverse reactions, using functional food, natural beauty supplements, and cosmetic ingredients from plants has gained attention and become a target for research [10,11,12].
Ginseng (Panax ginseng C.A. Mayer) is well-known for its pharmacological properties and is a notable functional food, medicine, and cosmetic ingredient [13,14]. The primary commercially valuable part of ginseng is the main root [15] and ginsenosides—key bioactive compounds for their therapeutical effects [16,17,18]. Furthermore, the ginseng plant contains a number of important secondary metabolites, including phenolic acid (gallic acid, salicylic acid, p-coumaric acid, ferulic acid, maltol, cinnamic acid, caffeic acid, and syringic acid), flavonoid, ginseng oils, phytosterol, carbohydrates, amino acids, peptides, vitamins, minerals, and certain enzymes [19,20]. Various processing methods have been developed to improve the health benefits of ginseng and associated products while minimizing adverse effects or toxicity. Since processing conditions (physical, chemical, and biological) cause varieties in ginsenosides and other constituents, the particular processing method used may be critical in applying and utilizing ginseng [21]. There are several processing methods for ginseng, such as white ginseng (WG), red ginseng (RG), black ginseng (BG), and fermented ginseng. WG is formed by drying fresh ginseng with sunlight and RG is produced by steaming fresh ginseng for a sufficient period at 95–100 °C, while BG can be generated by steaming WG nine times at 95–100 °C for 3 h [22]. The studies concluded that BG has a higher pharmacological activity than WG or RG due to changes in ginsenoside constituents and quantity [23,24]. In addition, ginseng fermentation with microorganisms has been shown to enhance the health benefits of ginseng attributable to the transformation of glycosides to aglycones and/or the production of their metabolites, such as Compound K (CK). CK is a special bioactive ginsenoside that results from the biotransformation of Rb1 and Rb2 by gut microbes [25,26]. CK is reported to have a hepatoprotective effect and anti-cancer, anti-atherosclerosis, anti-diabetic, and anti-inflammatory activities [27].
Aspergillus niger was originally isolated from fermented soybean and is included in the GRAS (generally recognized as safe) fungi by the FDA, now being widely used as a host for food enzyme production [28]. In a previous study, we successfully produced fermented black ginseng using a new strain of Aspergillus niger KHNT-1 with a shortened steaming cycle (seven cycles) to increase the values of black ginseng (FBG). Compositions such as Rg3, Rg5, and Rk1 were abundant during the process. CK, in particular, was obtained [29]. The ginsenosides Rg3, Rg5, and Rk1 were shown to have anti-oxidative, anticancer, anti-melanogenesis, and anti-photoaging effects [30,31,32]. Furthermore, CK was reported to have anti-aging and skin-protective properties [27,33]. Additionally, benzopyrene, a chemical carcinogen that could present during the drying and steaming of black ginseng, was not detected in FBG by HPLC analysis [34]. Therefore, this material is considered safe and beneficial for medicinal or cosmetic products.
In a few studies, fermented ginseng by Saccharomyces cerevisiae was reported to have anti-wrinkle and anti-melanogenic effects [35,36,37]. However, there is no research on the anti-skin aging effect of fermented black ginseng by strains of Aspergillus niger. Thus, we investigated the anti-melanogenic, anti-wrinkle, and antioxidative effects of FBG and compared it with BG and WG to better understand their anti-skin aging potential.

2. Materials and Methods

2.1. Biology Materials

Fresh ginseng was obtained from KeumSan, Republic of Korea. The Aspergillus niger KHNT-1 strain (NCBI Accession number: MT804610) was isolated from fermented soybean (Meju), Gyeonggi, Republic of Korea.

2.2. Chemicals and Reagents

Penicillin–streptomycin (100×) and fetal bovine serum (FBS) were purchased from GenDEPOT (Katy, TX, USA). Dulbecco’s modified Eagle medium (DMEM) culture medium was purchased from Welgene Inc., (Gyeongsan-si, Republic of Korea). The reagent 3-isobutyl-1-methylxanthine (IBMX) was purchased from Wako (Osaka, Japan). Folin–Ciocalteu, sodium carbonate, aluminum chloride, potassium acetate, DPPH (2,2-diphenyl-1-picryl-hydrazyl), potassium ferricyanide, trichloroacetic acid, ferric chloride, mushroom tyrosinase, elastase from porcine pancreas, 2′,7′-dichlorofluorescein diacetate (DCFH-DA), N-succinyl-Ala-Ala-Ala-p-nitroanilide (STANA), and ursolic acid were purchased from Sigma-Aldrich (Osaka, Japan; Saint Louis, MO, USA). Both 3,4-dihydroxy-L-phenylalanine (L-DOPA) and arbutin were purchased from Abcam (Cambridge, UK).

2.3. Preparation of WG, BG, and FBG Extract

The WG, BG, and FBG were provided by Nature Bio Pharma Co., Ltd. The WG was prepared by drying fresh ginseng roots. BG was generated by steaming and drying white ginseng nine times at 95–100 °C for three hours. FBG was prepared as described previously [29]. Before the fermentation process, white ginseng roots were steamed three times. The steamed ginseng was then dipped for one minute in a cell suspension of KHNT-1 (A. niger) and fermented at room temperature for three days before being repeated seven times to complete the fermentation. During the process, the samples eventually turned black (FBG). Finally, 80% methanol was used to extract the WG, BG, and FBG samples, which were then evaporated to remove the solvent residue and used in the subsequent experiments.

2.4. Cell Cultures

The murine melanoma B16F10, immortalized human epidermal keratinocyte (HaCat), and human dermal fibroblast (HDF) cells were provided by the Korean Cell Line Bank (KCLB, Seoul, Republic of Korea). The cells were cultured in DMEM complete media supplemented with 10% FBS and 1% penicillin–streptomycin and incubated at 37 °C with 5% CO2.

2.5. Cytotoxicity Assay

FBG, BG, and WG cytotoxicities in B16F10, HDF, and HaCat cells were assessed using a 3-(4,5-dimethylthiazol-2-2yl)-2,5-diphenyltetrazolium bromide (MTT) colorimetric assay. In a 96-well plate, B16F10 cells were seeded at a density of 2 × 10⁴ cells per well. The cells for HaCat and HDF were seeded at 1 × 10⁵ cells/well and incubated for 24 h at 37 °C in a humidified atmosphere of 5% CO2. The cells were incubated for 24 or 72 h with various concentrations (50, 100, 200, and 400 μg/mL) of FBG, BG, and WG in serum-free media. Then, cells were added to 20 µL of MTT (5 mg/mL in PBS, Life Technologies, Carlsbad, OR, USA) for 3 h at 37 °C. In each well, 100 μL DMSO was used to dissolve the insoluble formazan. At 570 nm, absorbance was measured using a microplate reader (Bio-Tek, Instruments, Inc., Winooski, VT, USA).

2.6. Anti-Melanogenic Activity Measurements

2.6.1. Determination of Mushroom Tyrosinase Inhibition

With minor modifications, mushroom tyrosinase inhibition (%) was determined as described by Qu et al. [38]. The reaction mixture contained 2 mM of L-DOPA as a substrate, 0.1 M phosphate buffer (pH 6.8), samples (FBG, BG, and WG), and mushroom tyrosinase enzyme (125 U/mL), which were added sequentially into 96-well microplates numbered A, B, C, and D as shown in Table 1.
After 30 min of incubation at 37 °C, the level of dopachrome in the reaction mixture was examined by measuring the absorbance at 475 nm with a microplate reader (Bio-Tek, Instruments, Inc., Winooski, VT, USA). The following formula was used to calculate the inhibition of tyrosinase activity (I%):
I % = ( A B ) ( C D ) ( A B ) × 100 %
The absorbance at 475 nm of the reaction solution: A: tyrosinase without sample; B: no sample and no tyrosinase; C: sample and tyrosinase; D: sample without tyrosinase.

2.6.2. Determination of Intracellular Tyrosinase Activity in B16F10 Cells

The rate of oxidation of L-DOPA was used to determine the intracellular tyrosinase inhibitory activity [39]. In 6-well plates, cells were seeded at a density of 2 × 10⁴ cells/well and incubated overnight. The cells were then treated for 72 h with FBG, BG, or WG (100 µg/mL) with co-treatment of 100 µM IBMX. Treatment with 100 µM of arbutin was used as a positive control. The cells were washed in PBS before being lysed in 1% Triton X-100 solution. For 1 h, the cell lysates were placed at −80 °C. The cellular extracts were purified by centrifugation at 12,000 rpm for 30 min at 4 °C after defrosting the cell lysates. After 1 h, 80 µL (40 µg) of supernatant and 20 µL of L-DOPA (2 mM) were added to a 96-well plate, and absorbance at 475 nm was measured using a microplate reader. Total protein content was determined using the Bradford protein assay (Bio-Rad, Hercules, CA, USA).

2.6.3. Determination of Melanin Content

Cellular melanin content was calculated as demonstrated [39]. Cells were seeded in 6-well culture plates at 2 × 10⁴ cells/well for 24 h. In order to determine the inhibitory effect of samples on melanogenesis, the cells were then treated for 72 h with FBG, BG, or WG (100 µg/mL) with co-treatment of 100 µM IBMX. Treatment with 100 µM of arbutin was used as a positive control. The absorbance at 475 nm in a microplate reader was used to determine the extracellular melanin content in the cell culture media. PBS was used to wash the cells twice. After that, the cells were trypsinized and centrifuged at 10,000 rpm for 3 min. Cell pellets containing intracellular melanin were solubilized in 300 µL of 1 N NaOH containing 10% DMSO and incubated for 1 h at 60 °C. At 405 nm, the absorbances were measured. The synthetic melanin standard curve (31.25–500 µg/mL) was designed, with melanin content values expressed as percentage changes from the control value.

2.7. Anti-Wrinkle Activity Measurements

2.7.1. Determination of Elastase Inhibition

The elastase inhibition of FBG, BG, and WG were evaluated as described previously [40]. A total of 55 µL of 0.5 U/mL elastase in 0.2 mM Tris-HCl buffer (pH 8.0) was mixed with a 20 µL sample (0.5, 1, 2, and 4 mg/mL). Afterward, 125 µL of 1.6 mM STANA was added, and the mixture was incubated for 30 min at 37 °C. The yellow color change was measured with a microplate reader at 410 nm and expressed as elastase inhibition (%).

2.7.2. Determination of Elastase Activity in HDF Cells

Intracellular elastase activity was determined using STANA with minor modifications [41,42]. We inspected the elastase activity of UVB-induced dermal damage in HDF cells. Each cell group: non-irradiated HDF cells (control group), UVB-irradiated HDF cells (negative control group), UVB-irradiated HDF treated with FBG, BG, or WG (100 and 200 µg/mL) or ursolic acid (500 µM) for 24 h after being exposed to 30 mJ/cm2 UVB irradiation. After incubation, the cells were lysed with 0.1% Triton X-100 in 0.2 M Tris-HCl buffer (pH 8.0). The cells were then frozen and defrosted, and the cell suspension was purified by centrifugation (3000 rpm, 20 min, 4 °C). The protein-containing supernatant was used. After adding 100 μg of protein sample in each 96-well plate, the volume of each well was adjusted to 98 μL with 0.2 M Tris-HCl. Following this, 2 μL of 400 µM STANA solution was added to each well of the plate, which was then incubated at 37 °C for 90 min. Elastase activity was determined using a microplate reader to measure the absorbance at 410 nm. The Bradford protein assay (Bio-Rad, Hercules, CA, USA) was used to determine the total protein content.

2.8. Quantitative Reverse Transcription-Polymerase Chain Reaction (qRT-PCR)

QIAzol lysis reagents (QIAGEN, Germantown, MD, USA) were used to isolate total RNA. Then, 1 µg of total RNA was used in the 20 µL reaction buffer of the amfiRivert reverse transcription kit (GenDepot, Barker, TX, USA) following the manufacturer’s instructions. The process was performed under the following conditions: 25 °C for 5 min, 42 °C for 60 min, and 70 °C for 15 min. qRT-PCR was performed using SYBR TOPreal qPCR 2X Premix (Enzynomics, Daejeon, Republic of Korea). In brief, the reactions were performed in triplicate containing 2x Master Mix, 1 µL of template cDNA, and 1µL of forward and reverse primers in a final 10 µL. All real-time measurements were performed using a CFX Connect Real-Time PCR (Bio Rad, Hercules, CA, USA). Reactions were amplified under the following conditions: 95 °C for 10 min, followed by 40 cycles of 95 °C for 20 s and 55~60 °C for 30 s, and 72 °C for 15 s. The relative quantities of mRNAs were obtained using the comparative 2−∆∆Ct method and normalized using the GAPDH gene. The primer sequences (GenoTech, Daejeon, Republic of Korea) are shown in Table 2.

2.9. Total Phenolic Content (TPC) Measurement

The TPC was measured based on the methods described in the previous study, with some modifications [43]. In the corresponding wells of a 96-well microplate, 30 µL of the extract solution was added to 150 µL of 10% 2 N Folin–Ciocalteu reagent. After thoroughly shaking for 5 min, 160 µL of 7.5% (w/v) sodium carbonate solution was added. The mixture was then placed away from the light for 30 min. Eventually, the absorbance was measured at 715 nm. The total phenolic content was calculated from a standard curve using gallic acid as the standard. The results were expressed as μg gallic acid equivalent per mg of extract (μg GAE/mg extract).

2.10. Total Flavonoid Content (TFC) Measurement

TFC was detected using the aluminum chloride colorimetric method with minor modifications [43]. Briefly, 50 µL of the extract was mixed with 430 µL of distilled water, followed by 10 µL 1 M potassium acetate, and 10 µL of 10% aluminum chloride was added and vortexed thoroughly. After spinning down, the mixture was incubated for 30 min. The absorbance was measured at 415 nm. TPC was calculated using the calibration curve and rutin as a standard. The results were expressed as μg rutin equivalent per mg of extract (μg RE/mg extract).

2.11. Antioxidant Properties Measurements

2.11.1. DPPH (2,2-Diphenyl-1-picryl-hydrazyl) Assay

The DPPH method was used with minor modifications to determine the antioxidant activity of samples [43]. Briefly, 20 µL of extract and 180 µL of DPPH in ethanol (0.2 mM) were mixed into a 96-well plate, then incubated for 30 min at 25 °C in the dark. The absorbance was measured at 517 nm. Gallic acid was used to make a standard curve. The percentage inhibition of a sample was calculated as follows:
Inhibition (%) = [(Acontrol − Asample)/Acontrol] × 100

2.11.2. Reducing Power

Potential antioxidant activity can be measured by a compound’s reductant capability [43]. For this method, 250 µL of 1% potassium ferricyanide and 250 µL of 0.2 mM phosphate buffer (pH 6.6) were mixed with 100 µL of a sample. The mixture was incubated at 50° for 20 min, before 250 µL of 10% trichloroacetic acid was added to the mixture, then centrifuged at 3000 rpm for 10 min. Afterward, in a 96-well plate, 50 µL of the upper layer of the mixture solution was mixed with 50 µL of distilled water and 10 µL of 0.1% ferric chloride solution. The absorbance was measured at 700 nm in a UV spectrometer. Gallic acid was used as a standard. Moreover, the results were expressed in µg gallic acid equivalent per gram (µg GAE/mg extract) of sample.

2.11.3. ROS Generation

To assess the generation of ROS, dichloro-dihydro-fluorescein diacetate (DCFH-DA) probes were used. In a 96-well plate, HaCaT cells (5 × 10⁴ cells/well) were seeded and incubated for 24 h at 37 °C and 5% CO2. After seeding, the cells were treated with FBG, BG, or WG at a concentration of 100 μg/mL in serum-free media for 24 h. The cells were then washed three times with PBS before being exposed to 20 µM DCFH-DA for 30 min at 37 °C under dark conditions. After incubation, the cells were washed thrice with PBS, then incubated for 2 h with H2O2 (500 µM) in serum-free media. Lastly, the cells were thoroughly washed with PBS. A microplate reader was used to measure the ROS levels at an excitation/emission of 485/520 nm. The fluorescence of DCFH-DA was visualized by fluorescence microscopy (Optinity-MDM Instrument, Suwon, Republic of Korea).

2.12. Statistical Analysis

GraphPad 8.0 was used to analyze the data (GraphPad Software, San Diego, CA, USA). For TPC, TFC, DPPH, and reducing power assays, the significance of differences between samples was determined by the Tukey (HSD) test at a 0.05 significance level. For in vitro experiments, the mean values were compared by a one-way analysis of variance (ANOVA) with Dunnett’s test. All experiments were repeated at least three times independently unless stated otherwise, and differences were considered significant at * p < 0.05, ** p < 0.01, and *** p < 0.001, and # p < 0.05, ## p < 0.01, and ### p < 0.001.

3. Results

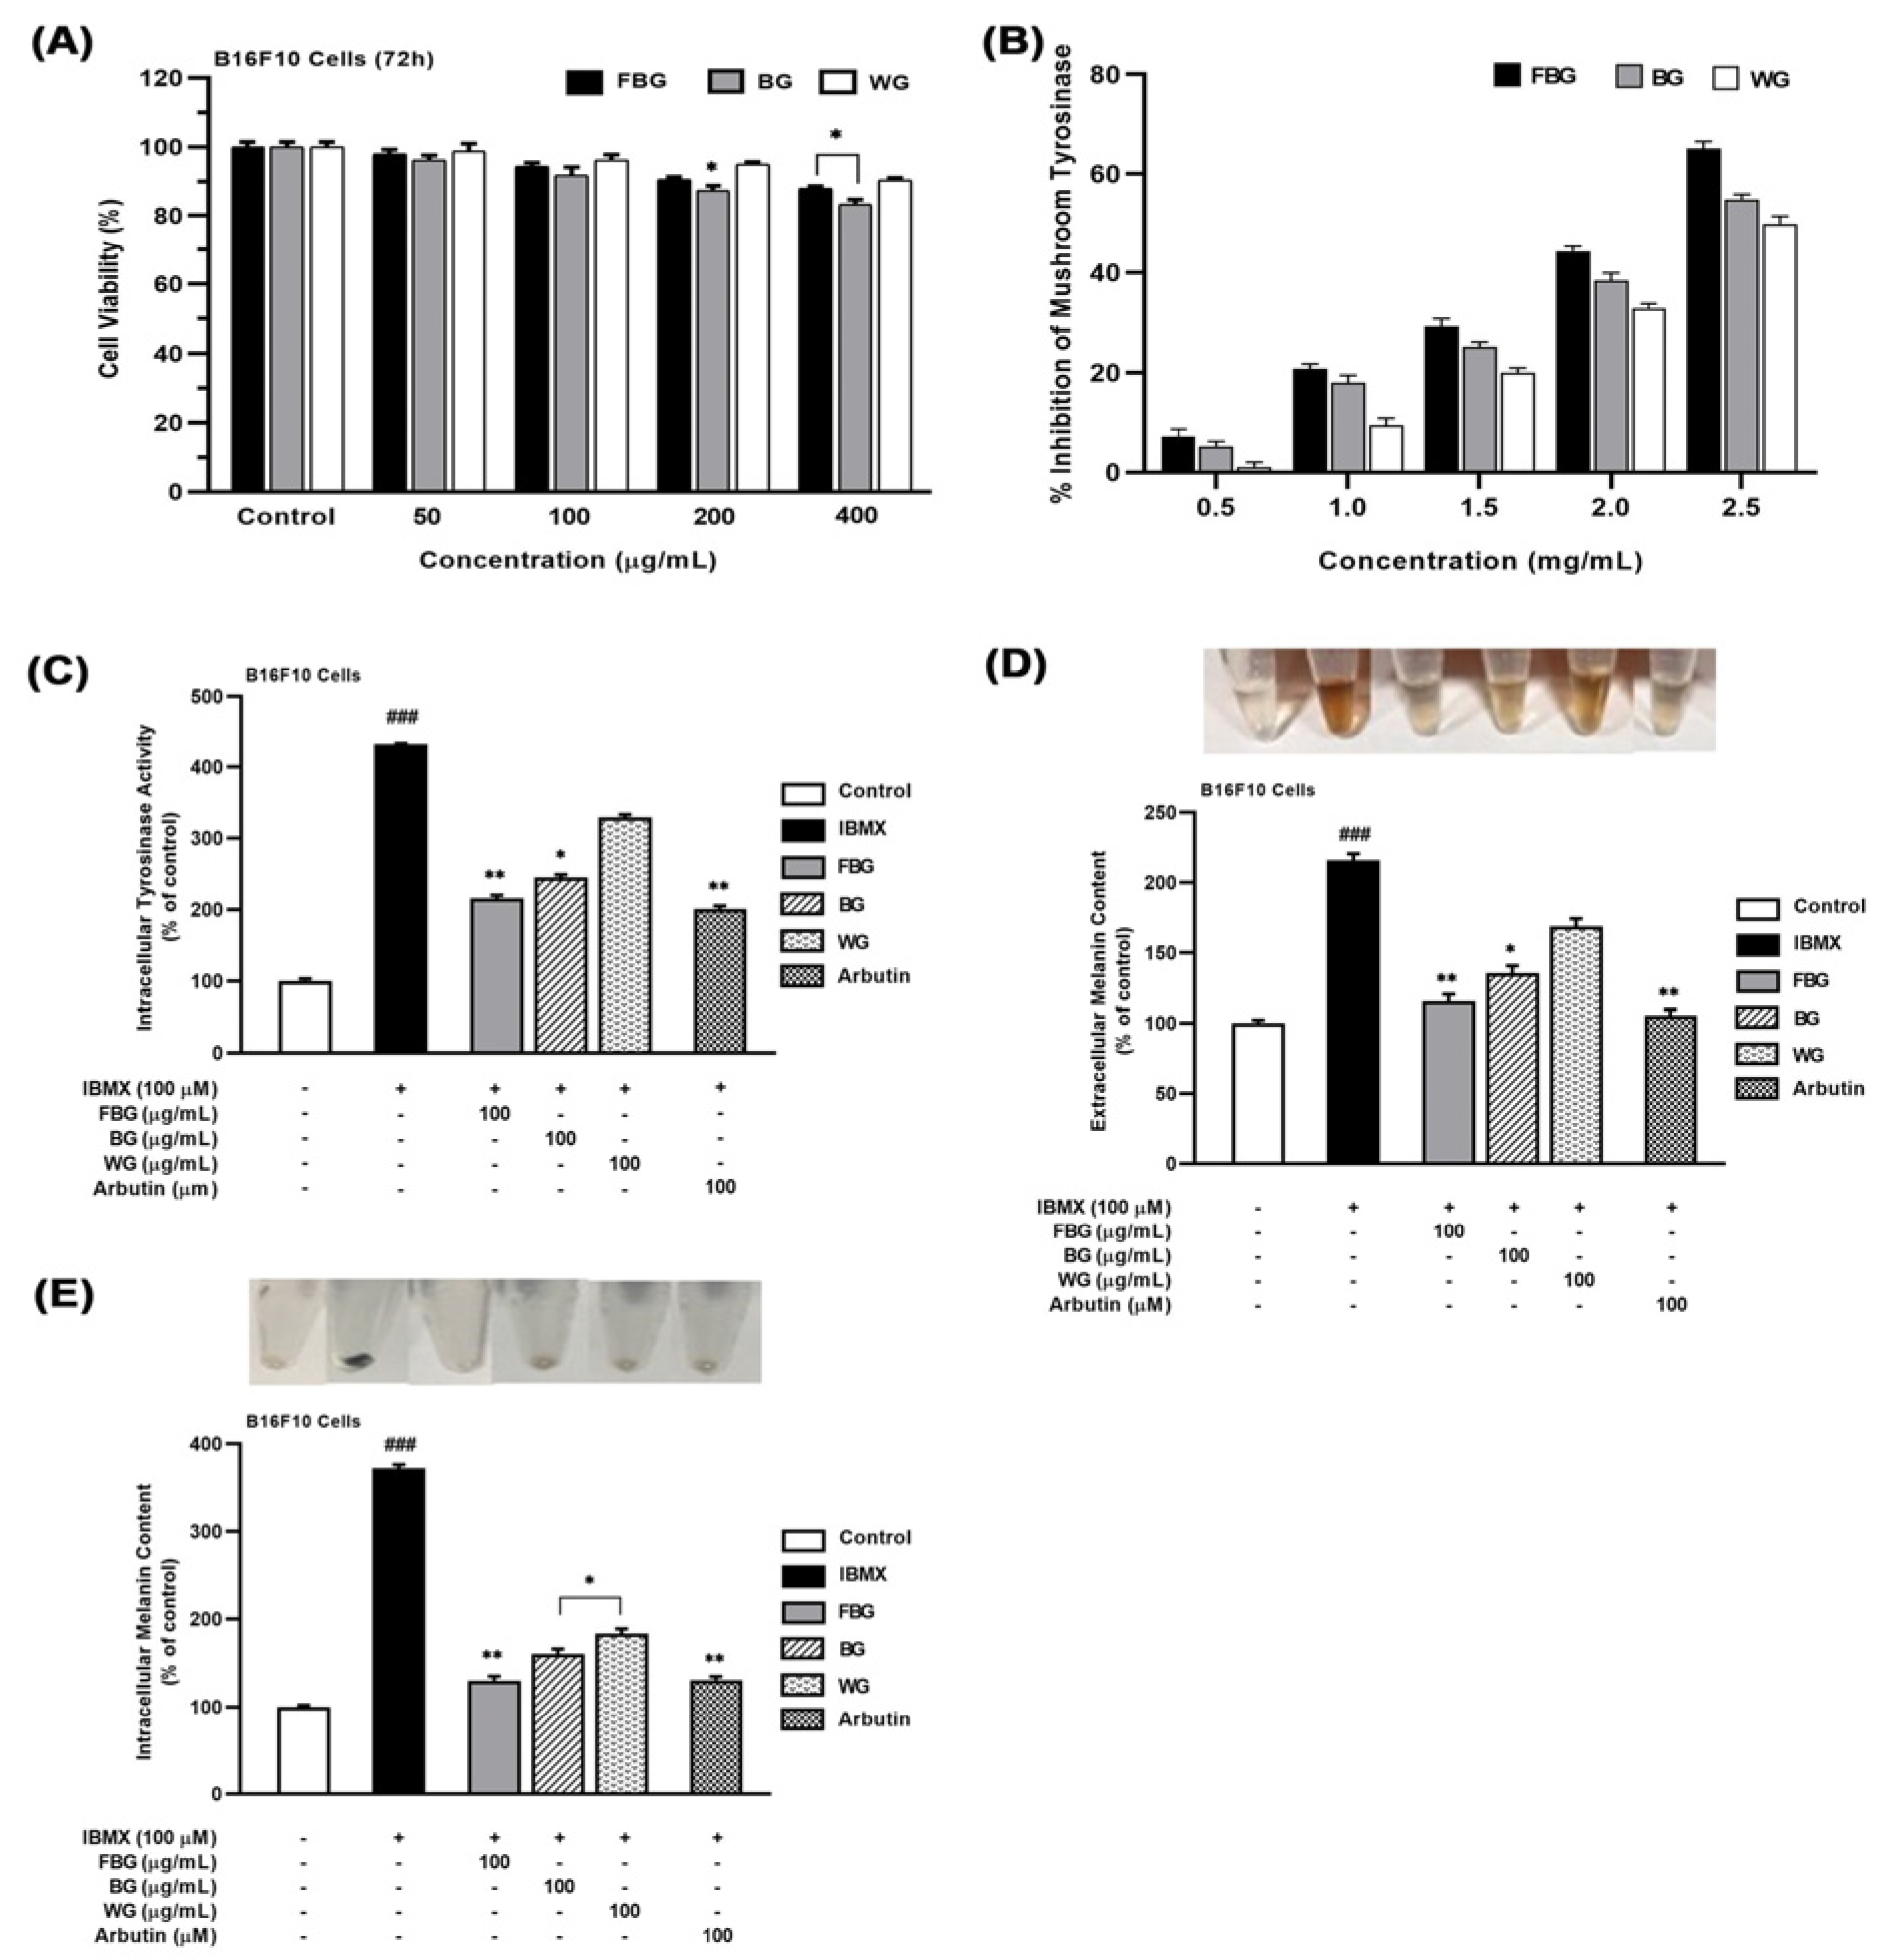
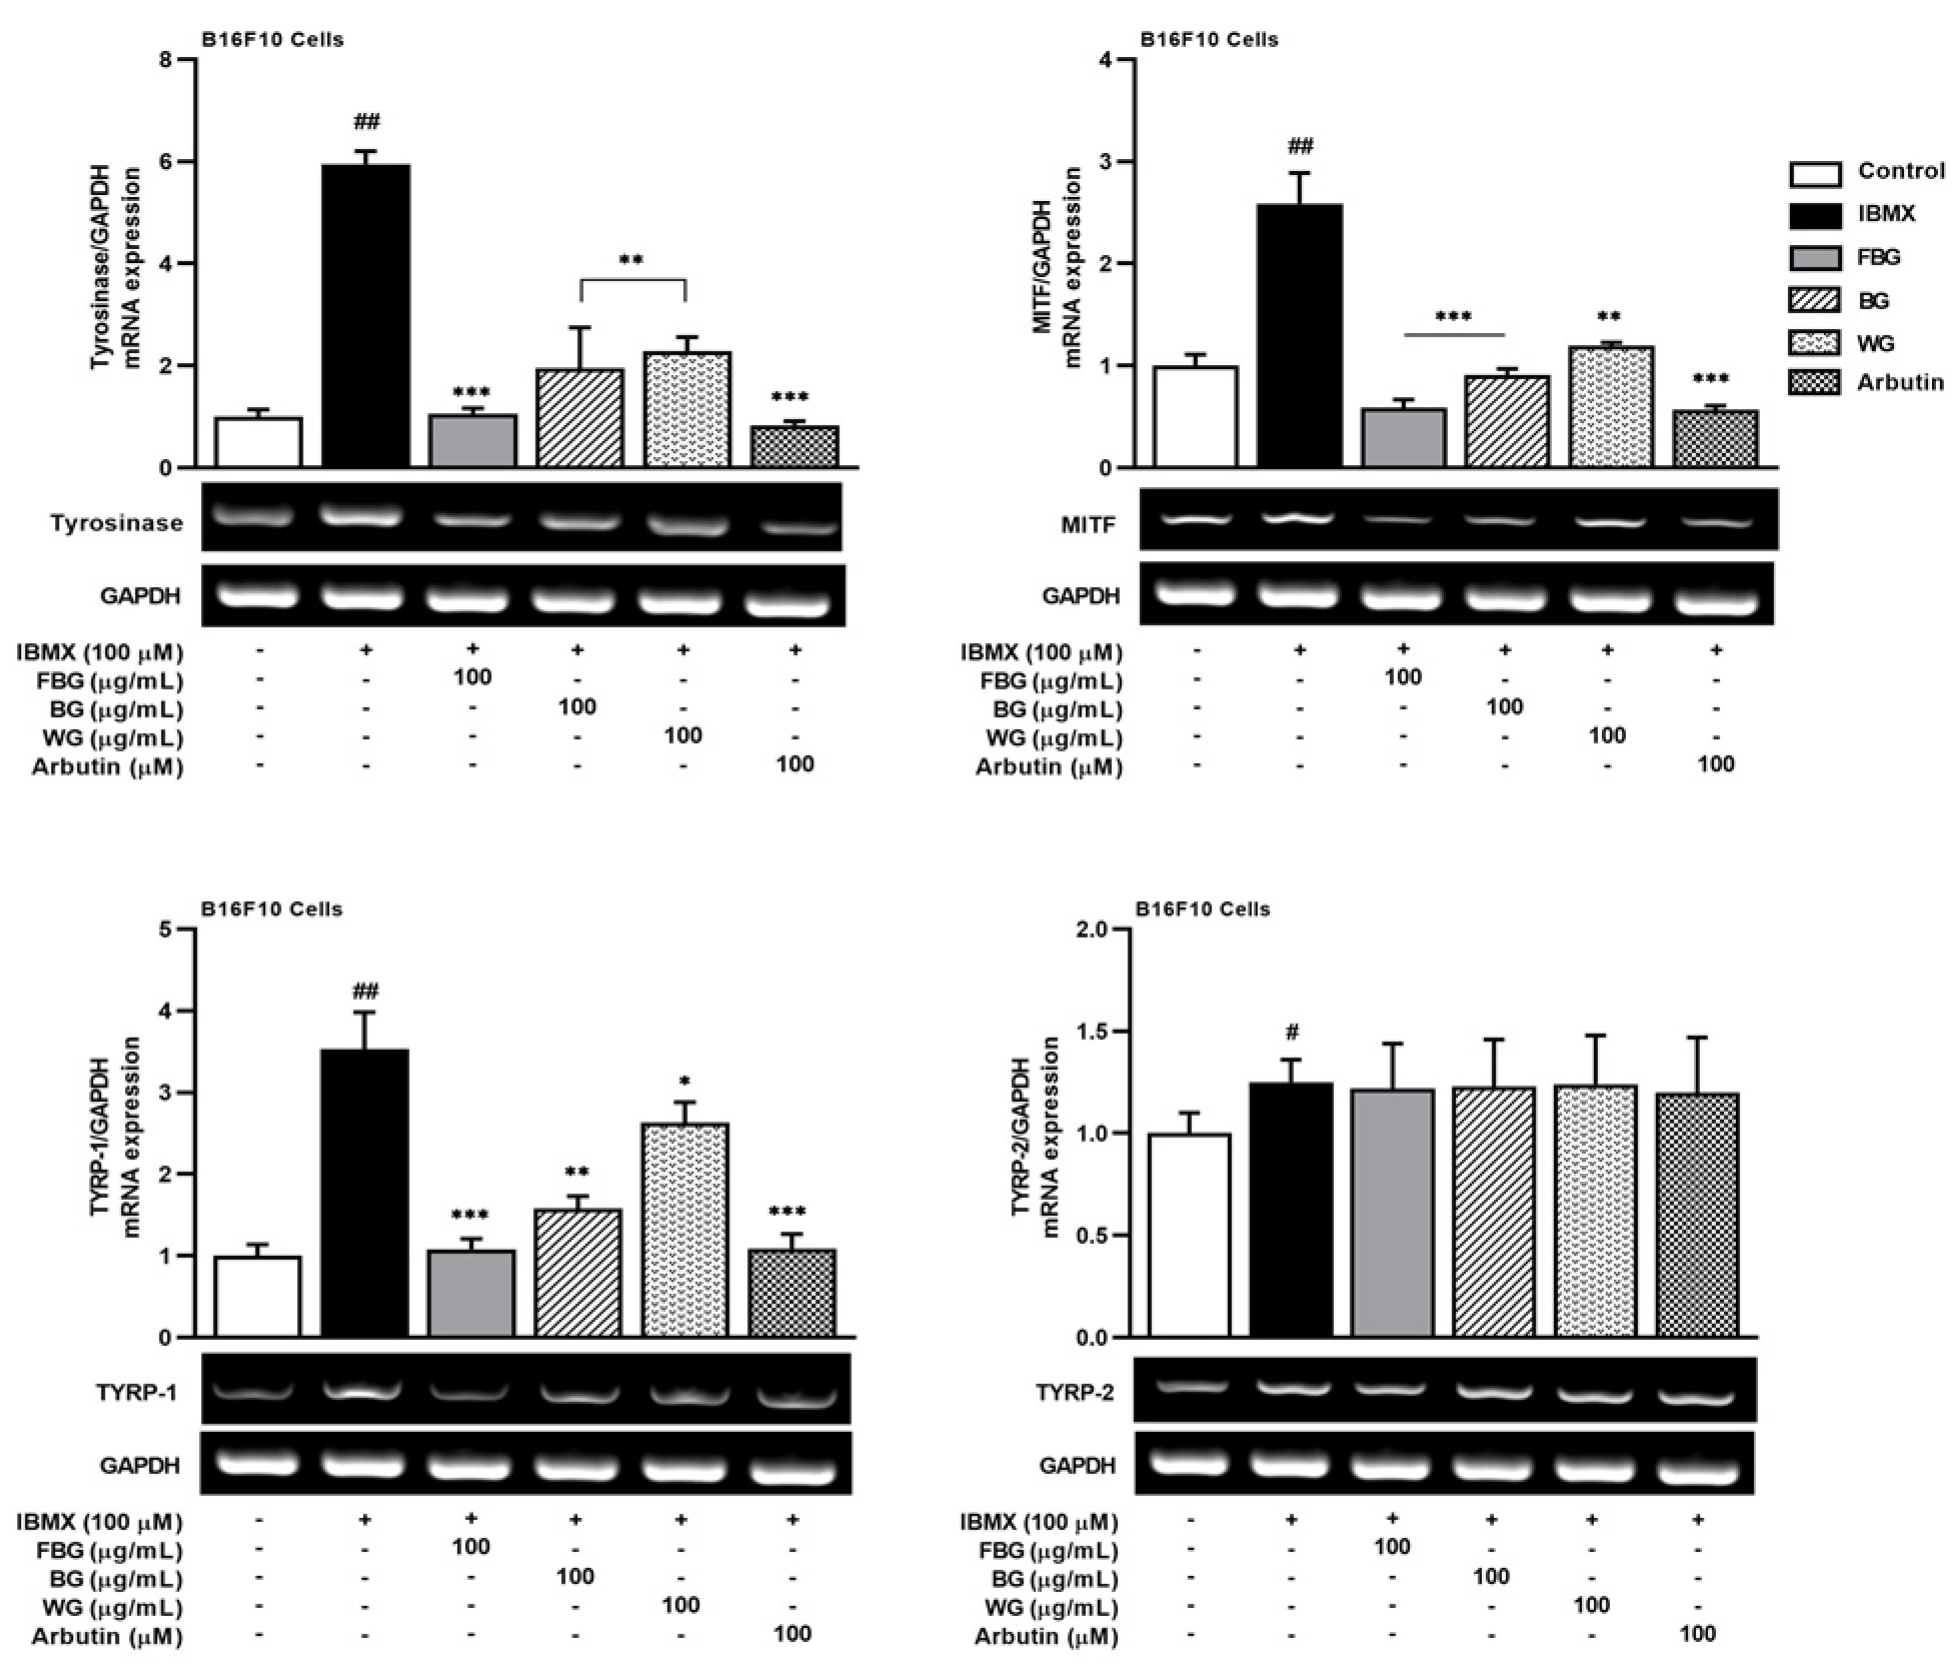
3.1. Anti-Melanogenic Effects of FBG in B16F10 Cells

The cytotoxicity effects of FBG, BG, and WG in B16F10 cells were measured by MTT assay. As shown in Figure 1A, FBG and WG showed lower toxicity at concentrations below 400 µg/mL than BG. Therefore, a 100 μg/mL concentration was selected for further experiments for FBG, BG, and WG.
We investigated the tyrosinase activity of FBG, BG, and WG on mushroom-tyrosinase and IBMX-stimulated B16F10 cells. The oxidation of L-DOPA was measured with mushroom-tyrosinase at 0.5, 1, 1.5, 2, and 2.5 mg/mL of FBG, BG, and WG, respectively. As shown in Figure 1B, FBG inhibited mushroom tyrosinase activity better than BG and WG in a concentration-dependent manner. At a 2.5 mg/mL concentration, FBG inhibited mushroom tyrosinase by 60.10%, whereas BG and WG inhibited the enzyme by 54.93% and 49.97%, respectively.
Isobutylmethylxanthine (IBMX) can induce melanogenesis by increasing cellular cAMP levels. As shown in Figure 1C, tyrosinase activity in IBMX-stimulated B16F10 cells was significantly increased by 4.3-fold (431.4%) compared with unstimulated cells. The tyrosinase activity of FBG, BG, and WG at a concentration of 100 μg/mL was reduced by 215.7%, 186.8%, and 102.5%, respectively, compared with IBMX-stimulated cells. Arbutin (100 μM) significantly reduced cellular tyrosinase activity by 230.5%.
Furthermore, their effects on melanin production were evaluated in B16F10 cells. The B16F10 cells were co-treated with 100 μM of IBMX and FBG, BG, or WG for 72 h. The results showed that the extracellular (Figure 1D) and intracellular (Figure 1E) melanin content of IBMX-stimulated cells increased by approximately 2.1 and 3.7-fold, respectively, compared with untreated cells (216% and 372%). In contrast, FBG at 100 μg/mL significantly decreased extracellular and intracellular melanin content by 110.5% and 129.5%, respectively, whereas 100 μg/mL of BG decreased extracellular and intracellular melanin content by 135.2% and 160.3%, respectively. Moreover, WG decreased extracellular and intracellular melanin content by 168.9% and 182.6%, respectively. In addition, arbutin at 100 μM reduced extracellular and intracellular melanin production by 105.5% and 130.11%, respectively. These results suggest that FBG at 100 μg/mL more strongly inhibited melanin production compared with BG and WG.
In order to investigate the molecular mechanisms of FBG, BG, and WG in melanogenesis, we examined the changes in the expression of tyrosinase, TYRP-1, TYRP-2, and MITF. As shown in Figure 2, the mRNA expression of tyrosinase, TYRP-1, TYRP-2, and MITF was increased by IBMX stimulation. FBG, BG, and WG suppressed the mRNA expression of tyrosinase, TYRP-1, and MITF, whereas TYRP-2 was unregulated. However, FBG better downregulated the expressions of the tyrosinase, TYRP-1, and MITF genes compared with BG and WG.

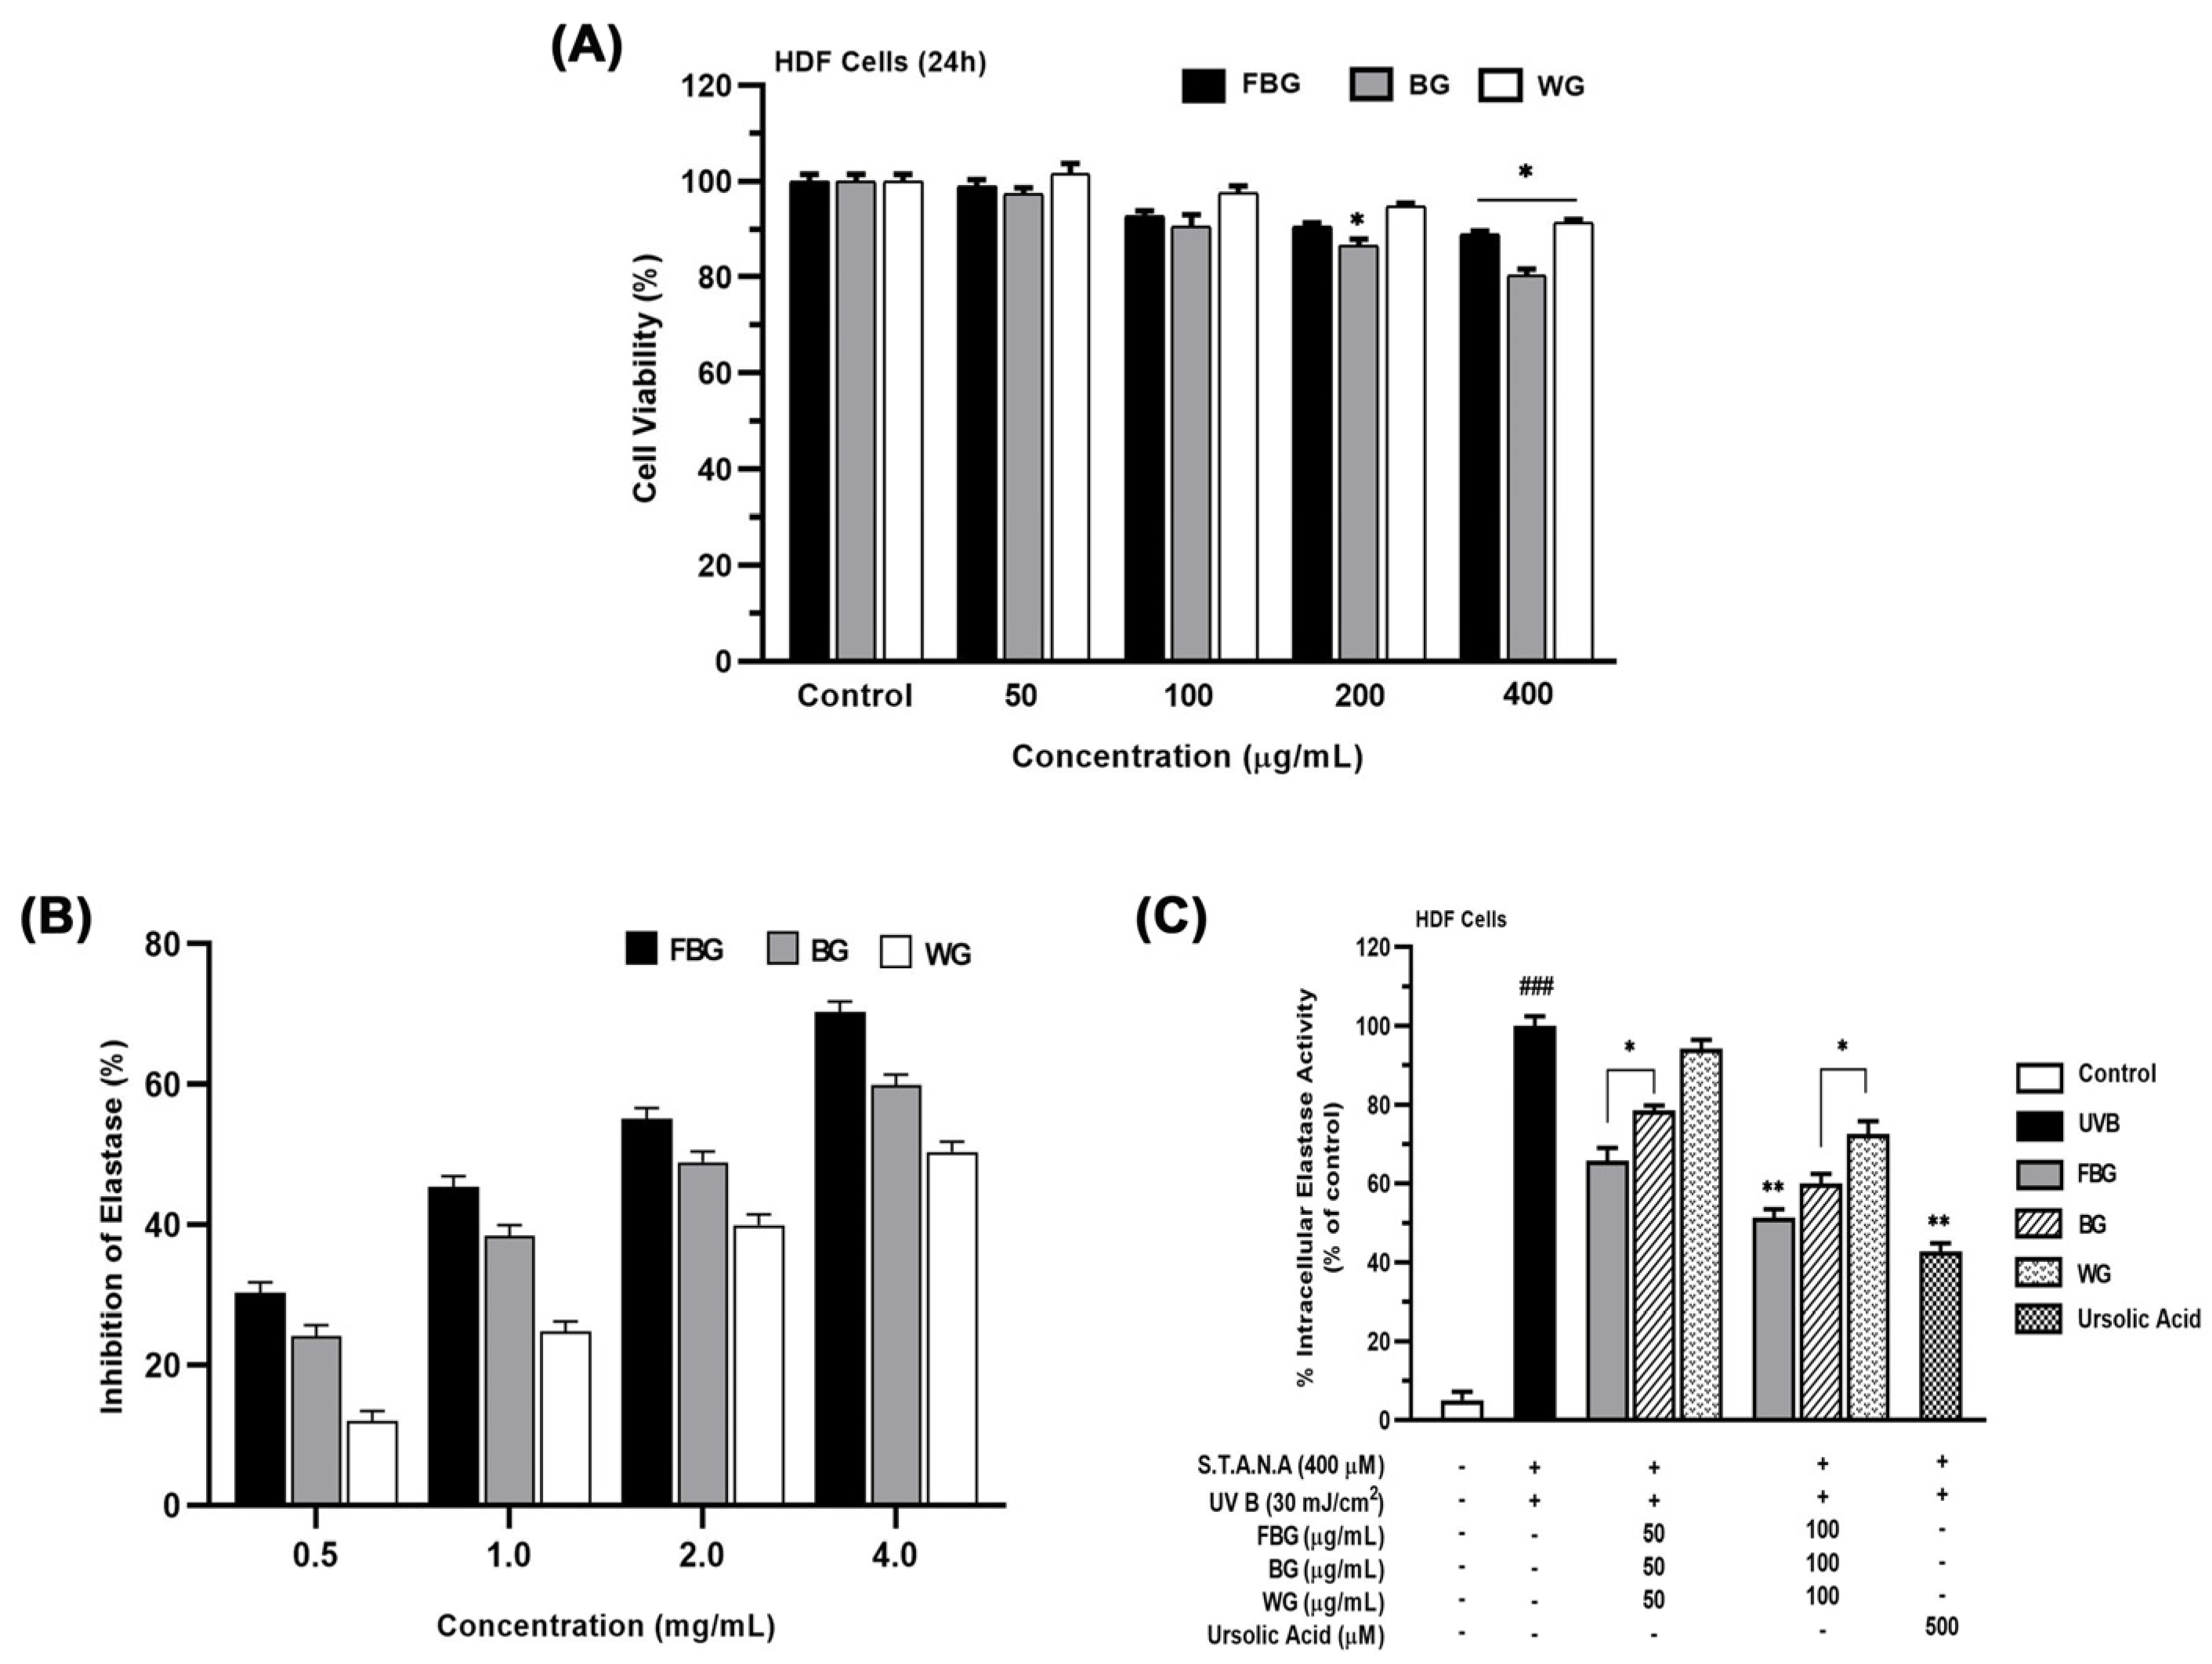
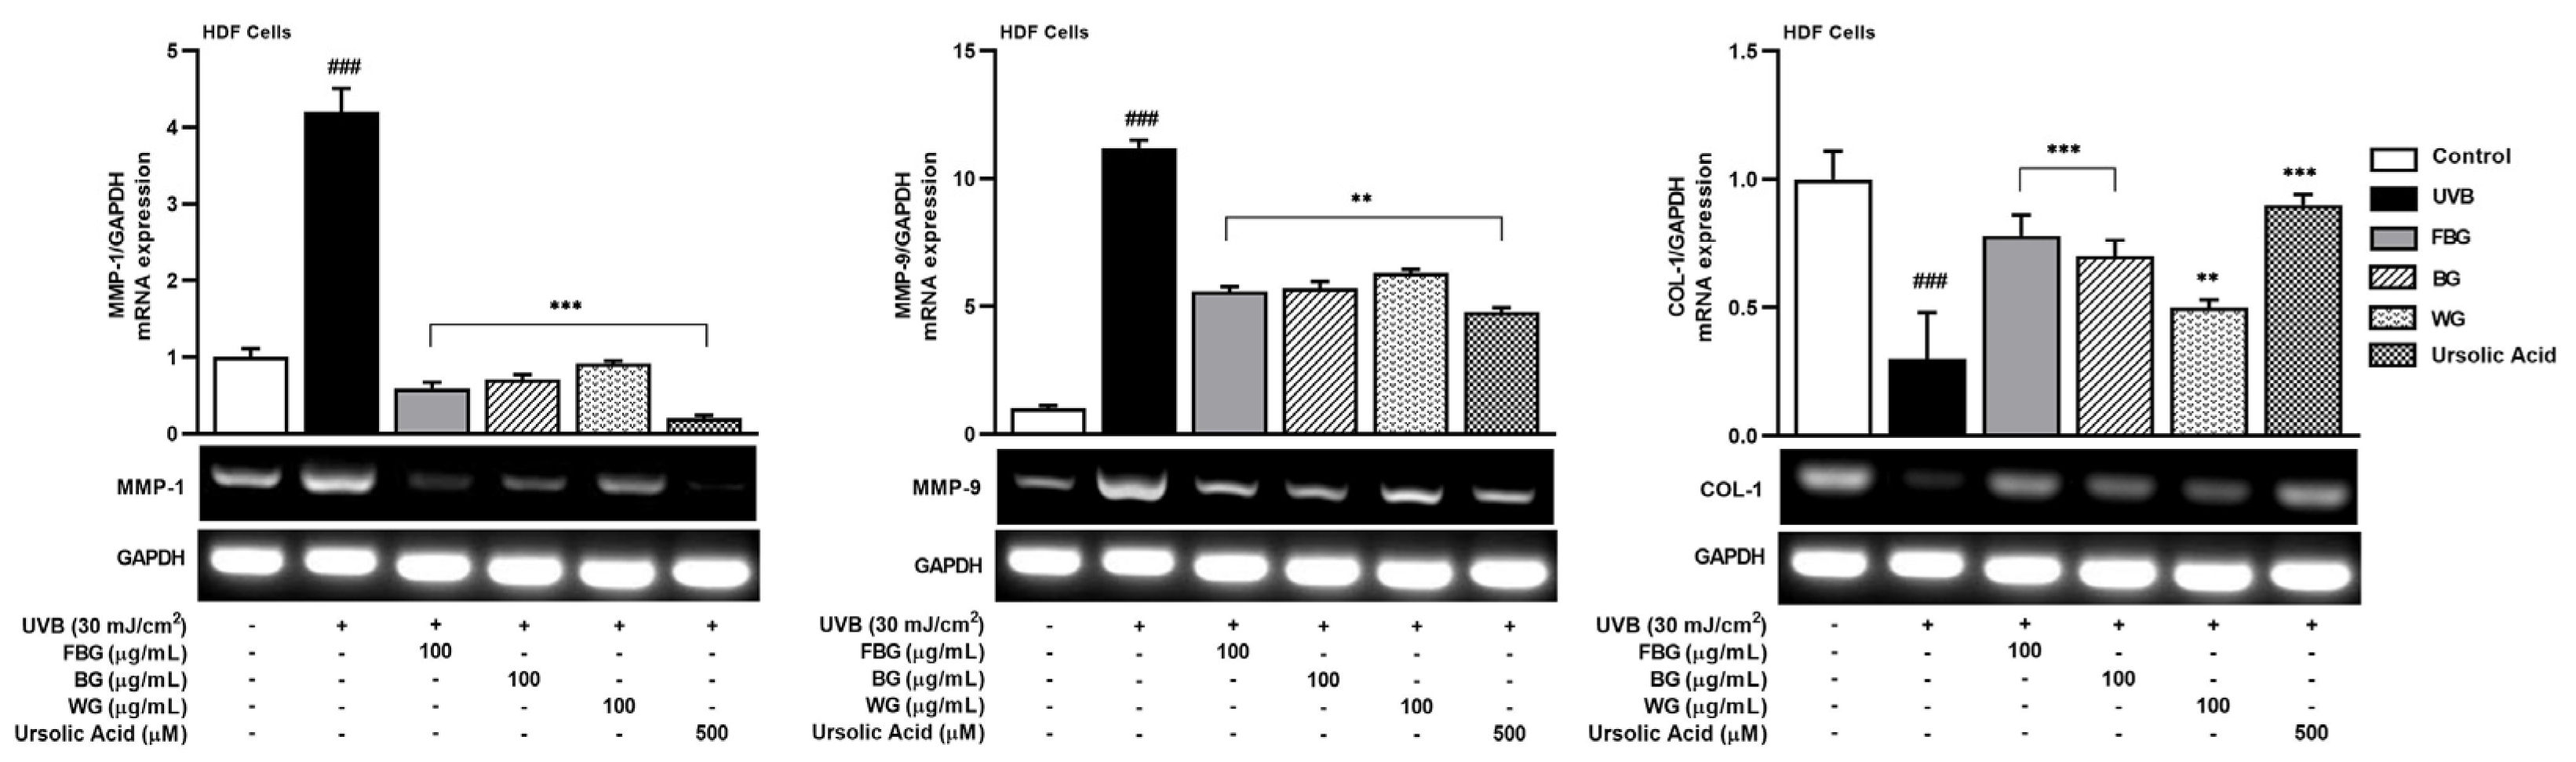
3.2. Anti-Wrinkle Effects of FBG in HDF Cells

The cytotoxicity effect of FBG, BG, and WG in HDF cells was determined by MTT assay. For 24 h, the cells were incubated in varying concentrations of all samples. As shown in Figure 3A, FBG and WG had no appreciable toxicity in HDF cells up to 400 µg/mL, whereas BG reduced the cell viability to 86% at a 200 µg/mL concentration. Overall, FBG and WG had a lower toxicity compared with BG.
Various concentrations (0.5 to 4 mg/mL) were utilized in elastase inhibition (elastase from the porcine pancreas). FBG inhibited elastase to a greater degree than BG and WG in a concentration-dependent manner. At a 2 mg/mL concentration, FBG inhibited elastase by 55.10%, whereas BG and WG inhibited by 48.93% and 39.97%, respectively (Figure 3B).
Since FBG, BG, and WG modulate elastase activity, we examined the effects of FBG, BG, and WG in HDF cells upon UVB irradiation in vitro. As a positive control, ursolic acid (100 μM) was used. As shown in Figure 3C, elastase activity in UVB-irradiated HDF cells was significantly increased by 3.5-fold (351.8%) compared with unstimulated cells. In comparison with the UVB-irradiated group, FBG at 100 μg/mL reduced elastase activity to a greater degree, by 180.5%, compared with BG (210.7%) and WG (258.7%).
We clarified the effects of FBG, BG, and WG on the expression of anti-wrinkle-related genes using qRT-PCR analysis. As shown in Figure 4, the mRNA expression of MMP-1 and MMP-9 were increased contrarily, and type 1 pro-collagen (COL-1) was decreased by UVB irradiation. The results showed that FBG suppressed MMP-1 and MMP-9 and conversely induced COL-1, resulting in more significant anti-wrinkle effects than BG and WG.

3.3. Antioxidant Effects of FBG

3.3.1. TPC, TFC, and Antioxidant Activities

Folin–Ciocalteu and aluminum chloride colorimetric methods were used to determine the total phenolic and flavonoid contents. Table 3 summarizes the total phenolic contents of all samples which varied widely, ranging from 7.4 ± 0.50 to 48.7 ± 0.83 µg/mg expressed as gallic acid equivalents (GAE), and the total flavonoid contents, which varied from 6.2 ± 0.15 to 30.24 ± 0.80 µg/mg expressed as rutin equivalents (RE). FBG had the highest phenolic and flavonoid contents among all the samples.
According to the DPPH results, the antioxidant activity of all samples ranged from 1.4 ± 1.21 to 7.25 ± 1.10 µg GAE/mg extract, and FBG showed a better antioxidant activity than BG and WG. Likewise, the reducing power assay results showed that the antioxidant-reducing power of all samples ranged from 5.82 ± 0.81 to 22.34 ± 0.54 µg GAE/mg extract. FBG showed an increase in antioxidant capacity compared with BG and WG.

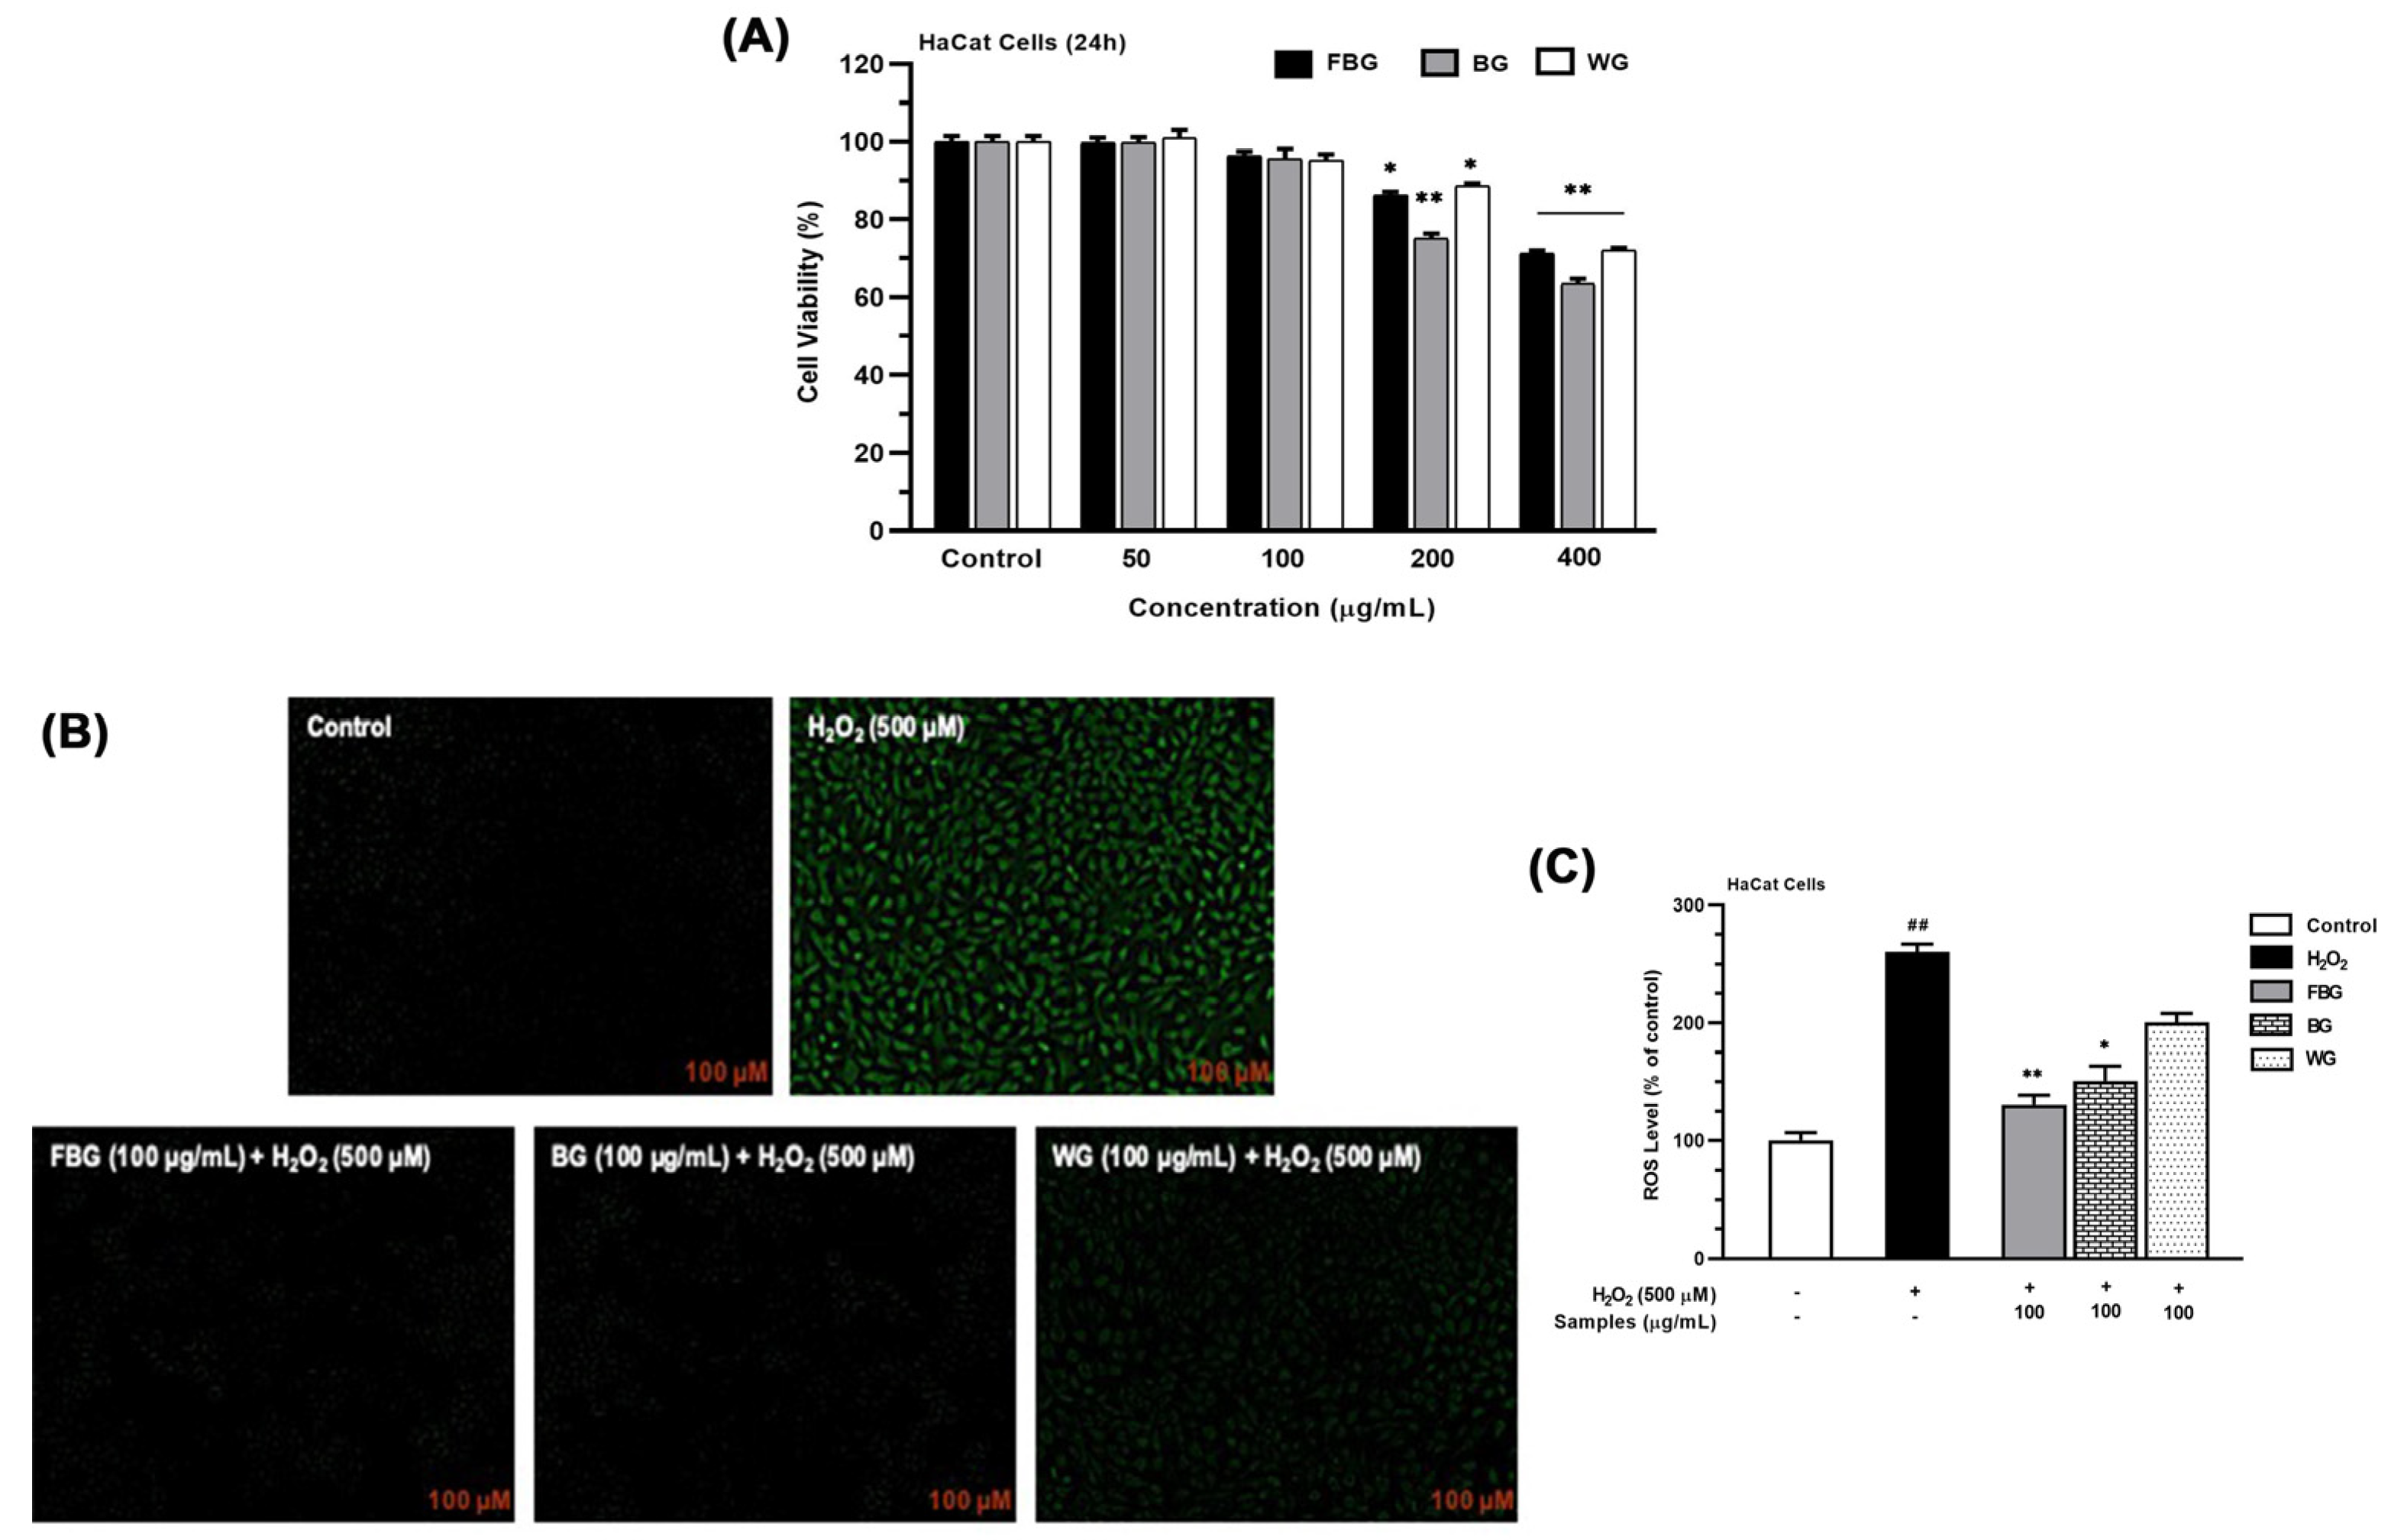
3.3.2. ROS Generation of FBG in HaCat Cells

In the HaCat cells, the FBG and WG showed a lower toxicity compared with BG in the concentration range of 50–200 μg/mL (Figure 5A). Therefore, a 100 μg/mL concentration was selected for further experiments.
DCFH-DA probes were used to assess ROS generation. Figure 5B,C shows that the ROS level of H2O2-induced oxidative of HaCat cells increased by 2.7-fold compared with untreated cells (270%). We found that FBG at a concentration of 100 μg/mL could act against the H2O2-induced oxidative stress of HaCaT cells by reducing the ROS level (130.7%) more effectively than BG (150.7%) and WG (200.3%).

4. Discussion

Ginsenosides are the primary bioactive compounds found in ginseng. However, because ginsenosides are mostly in glycoside form, they are not entirely absorbed by the body [43,44,45]. To overcome this limitation, ginseng can be fermented with bio-transforming microorganisms to convert the existing saponins into saponin metabolites ingested in the body [35]. In a previous study, we discovered that Aspergillus niger KHNT-1 proficiently converts the ginsenoside Rb1 by β-glucosidase hydrolysis into the primary active constituent, which is not present in WG. FBG contained a substantial amount of CK, Rg3, Rg5, and Rk1, with contents of 38.13, 19,926.07, 15,217.9, and 9193.77 mg/kg DW, respectively [29]. Apart from ginsenosides, phenolic and flavonoid compounds are also found in ginseng; these compounds are well known to have antioxidant and anticancer activities. Among the phenolic compounds found in ginseng are gallic acid, vanillic acid, p-hydroxybenzoic acid, gentisic acid, caffeic acid, ferulic acid, and p-coumaric acid [20]. In the present study, FBG phenolic and flavonoid contents were significantly higher than BG and WG (Table 3). Previous studies also reported that TPC and TFC are increased by fermentation [46,47]. Along with an increase in TPC and TFC, as well as the biotransformation of ginsenosides, the antioxidant activities in DPPH and reducing power assays were increased, indicating that FBG has a better antioxidant effect than BG and WG.
Skin aging has remained a critical dermatologic concern in society, and theoretical concepts have been proposed to investigate the cause and effects. Excessive melanin biosynthesis causes hyperpigmentation, leading to various dermatological conditions such as freckles, age spots, melasma, and even skin cancer. Hyperpigmentation, wrinkles, and sagging skin are all signs of skin aging [48]. Various intracellular and extracellular stimuli, including UV light and chemicals such as α-MSH and IBMX can stimulate melanogenesis [49,50,51]. IBMX can increase cellular cAMP levels by inhibiting phosphodiesterase, this response activates the PKA signaling pathway, which regulates MITF as a transcription factor and element-binding protein of cAMP-responsive; this process is involved in the regulation of melanogenic vital enzymes such as tyrosinase, TRYP-1, and TYRP-2 [49,52]. Tyrosinase is the primary target for melanin inhibition. Therefore, tyrosinase inhibitors are found in most commercial cosmetics and skin-lightening agents [53,54,55,56]. FBG inhibited MITF, tyrosinase, and TYRP-1 mRNA expression but did not regulate TYRP-2 (Figure 2). Consequently, these results suggest that the anti-melanogenic effect of FBG is not directly affected by tyrosinase activity but through downregulated MITF levels (cAMP signaling pathway).
UVB radiation can up-regulate activator protein (AP-1) and stimulate the expression of MMPs, induce inflammation, and activate dermal enzymes such as collagenase and elastase. Excessive levels of these enzymes can degrade collagen and elastin, causing premature skin aging [57]. Aside from collagen degradation in the skin, increased elastase levels trigger the loss of the skin’s elasticity and internal structure [58]. Moreover, MMPs, particularly MMP-1, can break down type I and type III collagen, which modulates the skin tissue’s structure. MMP-9 has been recognized as a crucial protein in extracellular matrix (ECM) degradation [59]. Our findings indicate that FBG has anti-wrinkle effects by inhibiting elastase, decreasing MMP-1 and MMP-9 while increasing COL-1 (Figure 3 and Figure 4).
Hydrogen peroxide (H2O2) can induce ROS generation in the cells, resulting in oxidative stress and activation of multiple signaling pathways. Furthermore, the toxic effects of ROS on cell organelles can regulate melanogenesis and skin aging [60,61]. FBG (100 μg/mL) significantly reduced the ROS level, indicating anti-oxidant potential, which is an important component in anti-aging properties (Figure 5).
As a result, FBG is a valuable material to improve ginseng’s anti-aging properties with multiple signaling pathways (Figure 6). Interestingly, FBG had lower toxicity in B16F10, HDF, and HaCat cells compared with BG. In agreement with the previous study, the fermentation process of red ginseng could enhance its safety, although the mechanism has remained unclear [62], and further study is needed.
Finally, our findings showed that the anti-melanogenic, anti-wrinkle, and antioxidant effects of FBG were enhanced compared with BG and WG. This result could be attributed to changes in the composition and amount of ginsenosides and, moreover, the increased phenolic and flavonoid compounds. Hence, this study suggests that FBG can be used as a functional food or natural product with anti-skin aging effects.

Author Contributions

Conceptualization, D.U.Y. and D.C.Y.; data curation, Y.H.; formal analysis, Z.M.R., J.K.P. and E.J.R.; funding acquisition, S.J.L.; methodology, Z.M.R.; resources, S.J.L.; supervision, M.M., D.C.Y. and S.C.K.; validation, Z.M.R. and S.C.K.; visualization, Z.M.R. and Y.H.; writing—original draft, Z.M.R. All authors have read and agreed to the published version of the manuscript.

Funding

The APC was funded by the Directorate of Research and Community Service, Padjadjaran University, Indonesia.

Data Availability Statement

The data are contained within the article.

Acknowledgments

We would like to thank Nature Bio Pharma Co., Ltd., for supporting the relevant resources and technology.

Conflicts of Interest

The authors declare no conflict of interest.

References

  1. Buranasirin, P.; Pongpirul, K.; Meephansan, J. Development of a global subjective skin aging assessment score from the perspective of dermatologists. BMC Res. Notes 2019, 12, 1–6. [Google Scholar] [CrossRef] [PubMed]
  2. Chen, J.; Liu, Y.; Zhao, Z.; Qiu, J. Oxidative stress in the skin: Impact and related protection. Int. J. Cosmet. Sci. 2021, 43, 495–509. [Google Scholar] [CrossRef] [PubMed]
  3. Davó, A.P.; Truchuelo, M.T.; Vitale, M.; Gonzalez-Castro, J. Efficacy of an antiaging treatment against environmental factors: Deschampsia antarctica extract and high-tolerance retinoids combination. J. Clin. Aesthetic Dermatol. 2019, 12, E65. [Google Scholar]
  4. Sreedhar, A.; Aguilera-Aguirre, L.; Singh, K.K. Mitochondria in skin health, aging, and disease. Cell Death Dis. 2020, 11, 1–14. [Google Scholar] [CrossRef] [PubMed]
  5. Swope, V.B.; Abdel-Malek, Z.A. MC1R: Front and center in the bright side of dark eumelanin and DNA repair. Int. J. Mol. Sci. 2018, 19, 2667. [Google Scholar] [CrossRef] [Green Version]
  6. Yardman-Frank, J.M.; Fisher, D.E. Skin pigmentation and its control: From ultraviolet radiation to stem cells. Exp. Dermatol. 2021, 30, 560–571. [Google Scholar] [CrossRef] [PubMed]
  7. Yadav, T.; Mishra, S.; Das, S.; Aggarwal, S.; Rani, V. Anticedants and natural prevention of environmental toxicants induced accelerated aging of skin. Environ. Toxicol. Pharmacol. 2015, 39, 384–391. [Google Scholar] [CrossRef] [PubMed]
  8. Imokawa, G.; Ishida, K. Biological mechanisms underlying the ultraviolet radiation-induced formation of skin wrinkling and sagging I: Reduced skin elasticity, highly associated with enhanced dermal elastase activity, triggers wrinkling and sagging. Int. J. Mol. Sci. 2015, 16, 7753–7775. [Google Scholar] [CrossRef] [PubMed] [Green Version]
  9. Krutmann, J.; Schikowski, T.; Morita, A.; Berneburg, M. Environmentally-induced (extrinsic) skin aging: Exposomal factors and underlying mechanisms. J. Investig. Dermatol. 2021, 141, 1096–1103. [Google Scholar] [CrossRef] [PubMed]
  10. Amaro-Ortiz, A.; Yan, B.; D’Orazio, J.A. Ultraviolet radiation, aging and the skin: Prevention of damage by topical cAMP manipulation. Molecules 2014, 19, 6202–6219. [Google Scholar] [CrossRef]
  11. Zhang, S.; Duan, E. Fighting against skin aging: The way from bench to bedside. Cell Transplant. 2018, 27, 729–738. [Google Scholar] [CrossRef]
  12. Desam, N.R.; Al-Rajab, A.J. The importance of natural products in cosmetics. In Bioactive Natural Products for Pharmaceutical Applications; Springer: Berlin/Heidelberg, Germany, 2021; pp. 643–685. [Google Scholar]
  13. Ratan, Z.A.; Haidere, M.F.; Hong, Y.H.; Park, S.H.; Lee, J.-O.; Lee, J.; Cho, J.Y. Pharmacological potential of ginseng and its major component ginsenosides. J. Ginseng Res. 2021, 45, 199–210. [Google Scholar] [CrossRef] [PubMed]
  14. Choi, J.; Kim, T.-H.; Choi, T.-Y.; Lee, M.S. Ginseng for health care: A systematic review of randomized controlled trials in Korean literature. PLoS ONE 2013, 8, e59978. [Google Scholar] [CrossRef] [PubMed] [Green Version]
  15. Kang, O.-J.; Kim, J.-S. Comparison of ginsenoside contents in different parts of Korean ginseng (Panax ginseng CA Meyer). Prev. Nutr. Food Sci. 2016, 21, 389. [Google Scholar] [CrossRef] [PubMed] [Green Version]
  16. Becker, L.C.; Bergfeld, W.F.; Belsito, D.V.; Hill, R.A.; Klaassen, C.D.; Liebler, D.C.; Marks Jr, J.G.; Shank, R.C.; Slaga, T.J.; Snyder, P.W. Safety assessment of Panax spp root-derived ingredients as used in cosmetics. Int. J. Toxicol. 2015, 34, 5S–42S. [Google Scholar] [CrossRef] [PubMed] [Green Version]
  17. Kim, J.H.; Yi, Y.-S.; Kim, M.-Y.; Cho, J.Y. Role of ginsenosides, the main active components of Panax ginseng, in inflammatory responses and diseases. J. Ginseng Res. 2017, 41, 435–443. [Google Scholar] [CrossRef] [Green Version]
  18. Razgonova, M.P.; Veselov, V.V.; Zakharenko, A.M.; Golokhvast, K.S.; Nosyrev, A.E.; Cravotto, G.; Tsatsakis, A.; Spandidos, D.A. Panax ginseng components and the pathogenesis of Alzheimer’s disease. Mol. Med. Rep. 2019, 19, 2975–2998. [Google Scholar] [CrossRef] [Green Version]
  19. Metwaly, A.M.; Lianlian, Z.; Luqi, H.; Deqiang, D. Black ginseng and its saponins: Preparation, phytochemistry and pharmacological effects. Molecules 2019, 24, 1856. [Google Scholar] [CrossRef] [Green Version]
  20. Chung, I.-M.; Lim, J.-J.; Ahn, M.-S.; Jeong, H.-N.; An, T.-J.; Kim, S.-H. Comparative phenolic compound profiles and antioxidative activity of the fruit, leaves, and roots of Korean ginseng (Panax ginseng Meyer) according to cultivation years. J. Ginseng Res. 2016, 40, 68–75. [Google Scholar] [CrossRef] [Green Version]
  21. Piao, X.M.; Huo, Y.; Kang, J.P.; Mathiyalagan, R.; Zhang, H.; Yang, D.U.; Kim, M.; Yang, D.C.; Kang, S.C.; Wang, Y.P. Diversity of ginsenoside profiles produced by various processing technologies. Molecules 2020, 25, 4390. [Google Scholar] [CrossRef]
  22. Jin, Y.; Kim, Y.-J.; Jeon, J.-N.; Wang, C.; Min, J.-W.; Noh, H.-Y.; Yang, D.-C. Effect of white, red and black ginseng on physicochemical properties and ginsenosides. Plant Foods Hum. Nutr. 2015, 70, 141–145. [Google Scholar] [CrossRef] [PubMed]
  23. Guo, N.; Zhu, L.; Song, J.; Dou, D. A new simple and fast approach to analyze chemical composition on white, red, and black ginseng. Ind. Crops Prod. 2019, 134, 185–194. [Google Scholar] [CrossRef]
  24. Lee, J.W.; Ji, S.-H.; Choi, B.-R.; Choi, D.J.; Lee, Y.-G.; Kim, H.-G.; Kim, G.-S.; Kim, K.; Lee, Y.-H.; Baek, N.-I. UPLC-QTOF/MS-based metabolomics applied for the quality evaluation of four processed Panax ginseng products. Molecules 2018, 23, 2062. [Google Scholar] [CrossRef] [PubMed] [Green Version]
  25. Akao, T.; Kanaoka, M.; Kobashi, K. Appearance of compound K, a major metabolite of ginsenoside Rb1 by intestinal bacteria, in rat plasma after oral administration: Measurement of compound K by enzyme immunoassay. Biol. Pharm. Bull. 1998, 21, 245–249. [Google Scholar] [CrossRef] [Green Version]
  26. Kim, D.-H. Metabolism of ginsenosides to bioactive compounds by intestinal microflora and its industrial application. J. Ginseng Res. 2009, 33, 165–176. [Google Scholar]
  27. Sharma, A.; Lee, H.-J. Ginsenoside compound K: Insights into recent studies on pharmacokinetics and health-promoting activities. Biomolecules 2020, 10, 1028. [Google Scholar] [CrossRef]
  28. Jeong, E.-B.; Kim, S.-A.; Shin, K.-C.; Oh, D.-K. Biotransformation of protopanaxadiol-type ginsenosides in Korean ginseng extract into food-available compound K by an extracellular enzyme from Aspergillus niger. J. Microbiol. Biotechnol. 2020, 30, 1560–1567. [Google Scholar] [CrossRef]
  29. Park, J.K.; Yang, D.U.; Arunkumar, L.; Han, Y.; Lee, S.J.; Arif, M.H.; Li, J.F.; Huo, Y.; Kang, J.P.; Hoang, V.A. Cumulative Production of Bioactive Rg3, Rg5, Rk1, and CK from Fermented Black Ginseng Using Novel Aspergillus niger KHNT-1 Strain Isolated from Korean Traditional Food. Processes 2021, 9, 227. [Google Scholar] [CrossRef]
  30. Lim, C.-J.; Choi, W.-Y.; Jung, H.-J. Stereoselective Skin Anti-Photoaging Properties of Ginsenoside Rg3 in UV-B–Irradiated Keratinocytes. Biol. Pharm. Bull. 2014, 37, 1583–1590. [Google Scholar] [CrossRef] [Green Version]
  31. Lee, S.J.; Lee, W.J.; Chang, S.E.; Lee, G.-Y. Antimelanogenic effect of ginsenoside Rg3 through extracellular signal-regulated kinase-mediated inhibition of microphthalmia-associated transcription factor. J. Ginseng Res. 2015, 39, 238–242. [Google Scholar] [CrossRef] [Green Version]
  32. Jin, Y.; Kim, J.H.; Hong, H.-D.; Kwon, J.; Lee, E.J.; Jang, M.; Lee, S.-Y.; Han, A.-R.; Nam, T.G.; Hong, S.K. Ginsenosides Rg5 and Rk1, the skin-whitening agents in black ginseng. J. Funct. Foods 2018, 45, 67–74. [Google Scholar] [CrossRef]
  33. Kim, E.; Kim, D.; Yoo, S.; Hong, Y.H.; Han, S.Y.; Jeong, S.; Jeong, D.; Kim, J.-H.; Cho, J.Y.; Park, J. The skin protective effects of compound K, a metabolite of ginsenoside Rb1 from Panax ginseng. J. Ginseng Res. 2018, 42, 218–224. [Google Scholar] [CrossRef] [PubMed]
  34. Han, Y.; Yang, D.-U.; Huo, Y.; Pu, J.; Lee, S.-J.; Yang, D.-C.; Kang, S.C. In vitro evaluation of anti-lung cancer and anti-COVID-19 effects using fermented black color ginseng extract. Nat. Prod. Commun. 2021, 16, 1934578X211034387. [Google Scholar] [CrossRef]
  35. Pham, Q.L.; Jang, H.J.; Kim, K.B. Anti-wrinkle effect of fermented black ginseng on human fibroblasts. Int. J. Mol. Med. 2017, 39, 681–686. [Google Scholar] [CrossRef] [Green Version]
  36. Park, J.J.; An, J.; Lee, J.D.; Kim, H.Y.; Im, J.E.; Lee, E.; Ha, J.; Cho, C.H.; Seo, D.-W.; Kim, K.-B. Effects of anti-wrinkle and skin-whitening fermented black ginseng on human subjects and underlying mechanism of action. J. Toxicol. Environ. Health Part A 2020, 83, 470–484. [Google Scholar] [CrossRef] [PubMed]
  37. Park, J.Y.; Lee, D.-S.; Kim, C.-E.; Shin, M.-S.; Seo, C.-S.; Shin, H.-K.; Hwang, G.S.; An, J.M.; Kim, S.-N.; Kang, K.S. Effects of fermented black ginseng on wound healing mediated by angiogenesis through the mitogen-activated protein kinase pathway in human umbilical vein endothelial cells. J. Ginseng Res. 2018, 42, 524–531. [Google Scholar] [CrossRef] [PubMed]
  38. Qu, L.; Song, K.; Zhang, Q.; Guo, J.; Huang, J. Simultaneous determination of six isoflavones from puerariae lobatae radix by cpe-hplc and effect of puerarin on tyrosinase activity. Molecules 2020, 25, 344. [Google Scholar] [CrossRef] [Green Version]
  39. Kim, C.S.; Noh, S.G.; Park, Y.; Kang, D.; Chun, P.; Chung, H.Y.; Jung, H.J.; Moon, H.R. A potent tyrosinase inhibitor,(E)-3-(2, 4-Dihydroxyphenyl)-1-(thiophen-2-yl) prop-2-en-1-one, with anti-melanogenesis properties in α-MSH and IBMX-induced B16F10 melanoma cells. Molecules 2018, 23, 2725. [Google Scholar] [CrossRef] [Green Version]
  40. Kim, T.H.; Kim, W.J.; Park, S.Y.; Kim, H.; Chung, D.K. In vitro anti-wrinkle and skin-moisturizing effects of evening primrose (Oenothera biennis) sprout and identification of its active components. Processes 2021, 9, 145. [Google Scholar] [CrossRef]
  41. Kim, W.S.; Seo, J.H.; Lee, J.-I.; Ko, E.-S.; Cho, S.-M.; Kang, J.-R.; Jeong, J.-H.; Jeong, Y.J.; Kim, C.Y.; Cha, J.-D. The Metabolite Profile in Culture Supernatant of Aster yomena Callus and Its Anti-Photoaging Effect in Skin Cells Exposed to UVB. Plants 2021, 10, 659. [Google Scholar] [CrossRef]
  42. Lim, H.Y.; Jeong, D.; Park, S.H.; Shin, K.K.; Hong, Y.H.; Kim, E.; Yu, Y.-G.; Kim, T.-R.; Kim, H.; Lee, J. Antiwrinkle and antimelanogenesis effects of tyndallized Lactobacillus acidophilus KCCM12625P. Int. J. Mol. Sci. 2020, 21, 1620. [Google Scholar] [CrossRef] [PubMed] [Green Version]
  43. Pu, J.Y.; Ramadhania, Z.M.; Mathiyalagan, R.; Huo, Y.; Han, Y.; Li, J.F.; Ahn, J.C.; Xu, F.J.; Lee, D.W.; Zeng, X.H. Ginsenosides Conversion and Anti-Oxidant Activities in Puffed Cultured Roots of Mountain Ginseng. Processes 2021, 9, 2271. [Google Scholar] [CrossRef]
  44. Shin, J.-H.; Park, Y.J.; Kim, W.; Kim, D.-O.; Kim, B.-Y.; Lee, H.; Baik, M.-Y. Change of ginsenoside profiles in processed ginseng by drying, steaming, and puffing. . Microbiol. Biotechnol. 2019, 29, 222–229. [Google Scholar] [CrossRef] [Green Version]
  45. Ryu, J.S.; Lee, H.J.; Bae, S.H.; Kim, S.Y.; Park, Y.; Suh, H.J.; Jeong, Y.H. The bioavailability of red ginseng extract fermented by Phellinus linteus. J. Ginseng Res. 2013, 37, 108. [Google Scholar] [CrossRef] [PubMed] [Green Version]
  46. Rochín-Medina, J.J.; Ramírez, K.; Rangel-Peraza, J.G.; Bustos-Terrones, Y.A. Increase of content and bioactivity of total phenolic compounds from spent coffee grounds through solid state fermentation by Bacillus clausii. J. Food Sci. Technol. 2018, 55, 915–923. [Google Scholar] [CrossRef] [PubMed]
  47. Adebo, O.A.; Gabriela Medina-Meza, I. Impact of fermentation on the phenolic compounds and antioxidant activity of whole cereal grains: A mini review. Molecules 2020, 25, 927. [Google Scholar] [CrossRef] [Green Version]
  48. Farage, M.A.; Miller, K.W.; Elsner, P.; Maibach, H.I. Characteristics of the aging skin. Adv. Wound Care 2013, 2, 5–10. [Google Scholar] [CrossRef] [Green Version]
  49. Han, H.J.; Park, S.K.; Kang, J.Y.; Kim, J.M.; Yoo, S.K.; Heo, H.J. Anti-melanogenic effect of ethanolic extract of Sorghum bicolor on IBMX–induced melanogenesis in B16/F10 melanoma cells. Nutrients 2020, 12, 832. [Google Scholar] [CrossRef] [Green Version]
  50. Koo, J.-H.; Kim, H.T.; Yoon, H.-Y.; Kwon, K.-B.; Choi, I.-W.; Jung, S.H.; Kim, H.-U.; Park, B.-H.; Park, J.-W. Effect of xanthohumol on melanogenesis in B16 melanoma cells. Exp. Mol. Med. 2008, 40, 313–319. [Google Scholar] [CrossRef] [Green Version]
  51. Brown, D.A. Skin pigmentation enhancers. Compr. Ser. Photosciences 2001, 3, 637–675. [Google Scholar]
  52. Jeon, N.-J.; Kim, Y.-S.; Kim, E.-K.; Dong, X.; Lee, J.-W.; Park, J.-S.; Shin, W.-B.; Moon, S.-H.; Jeon, B.-T.; Park, P.-J. Inhibitory effect of carvacrol on melanin synthesis via suppression of tyrosinase expression. J. Funct. Foods 2018, 45, 199–205. [Google Scholar] [CrossRef]
  53. Pillaiyar, T.; Manickam, M.; Namasivayam, V. Skin whitening agents: Medicinal chemistry perspective of tyrosinase inhibitors. J. Enzym. Inhib. Med. Chem. 2017, 32, 403–425. [Google Scholar] [CrossRef] [PubMed] [Green Version]
  54. Lee, J.Y.; Lee, J.; Min, D.; Kim, J.; Kim, H.-J.; No, K.T. Tyrosinase-targeting gallacetophenone inhibits melanogenesis in melanocytes and human skin-equivalents. Int. J. Mol. Sci. 2020, 21, 3144. [Google Scholar] [CrossRef] [PubMed]
  55. D’Mello, S.A.; Finlay, G.J.; Baguley, B.C.; Askarian-Amiri, M.E. Signaling pathways in melanogenesis. Int. J. Mol. Sci. 2016, 17, 1144. [Google Scholar] [CrossRef] [PubMed] [Green Version]
  56. Hushcha, Y.; Blo, I.; Oton-Gonzalez, L.; Mauro, G.D.; Martini, F.; Tognon, M.; Mattei, M.D. microRNAs in the Regulation of Melanogenesis. Int. J. Mol. Sci. 2021, 22, 6104. [Google Scholar] [CrossRef] [PubMed]
  57. Kumar, J.P.; Mandal, B.B. Inhibitory role of silk cocoon extract against elastase, hyaluronidase and UV radiation-induced matrix metalloproteinase expression in human dermal fibroblasts and keratinocytes. Photochem. Photobiol. Sci. 2019, 18, 1259–1274. [Google Scholar] [CrossRef] [PubMed]
  58. Pittayapruek, P.; Meephansan, J.; Prapapan, O.; Komine, M.; Ohtsuki, M. Role of matrix metalloproteinases in photoaging and photocarcinogenesis. Int. J. Mol. Sci. 2016, 17, 868. [Google Scholar] [CrossRef] [PubMed] [Green Version]
  59. Wang, L.; Lee, W.; Oh, J.Y.; Cui, Y.R.; Ryu, B.; Jeon, Y.-J. Protective effect of sulfated polysaccharides from celluclast-assisted extract of Hizikia fusiforme against ultraviolet B-Induced skin damage by regulating NF-κB, AP-1, and MAPKs signaling pathways in vitro in human dermal fibroblasts. Mar. Drugs 2018, 16, 239. [Google Scholar] [CrossRef] [Green Version]
  60. Kamiński, K.; Kazimierczak, U.; Kolenda, T. Oxidative stress in melanogenesis and melanoma development. Contemp. Oncol. /Współczesna Onkol. 2022, 26, 1–7. [Google Scholar] [CrossRef]
  61. Rinnerthaler, M.; Bischof, J.; Streubel, M.K.; Trost, A.; Richter, K. Oxidative stress in aging human skin. Biomolecules 2015, 5, 545–589. [Google Scholar] [CrossRef] [Green Version]
  62. Lee, H.-S.; Kim, M.-R.; Park, Y.; Park, H.J.; Chang, U.J.; Kim, S.Y.; Suh, H.J. Fermenting red ginseng enhances its safety and efficacy as a novel skin care anti-aging ingredient: In vitro and animal study. J. Med. Food 2012, 15, 1015–1023. [Google Scholar] [CrossRef] [PubMed]
Figure 1. Anti-melanogenic effects of FBG, BG, and WG in B16F10 cells. (A) Cytotoxicity effect of FBG, BG, and WG in B16F10 cells for 72 h. The cells were treated with each sample at the indicated concentrations (50, 100, 200, and 400 μg/mL) for 72 h. The cytotoxicity effect was then determined with MTT assays. (B) Inhibition of mushroom tyrosinase was determined in response to the indicated concentration of FBG, BG, and WG (0.5–2.5 mg/mL). (C) Intracellular tyrosinase activity in IBMX-stimulated B16F10 cells was measured in response to the concentration of 100 μg/mL of FBG, BG, WG, or arbutin (100 μM) for 72 h. The IBMX-stimulated B16F10 cells were treated with a concentration of 100 μg/mL of FBG, BG, or WG, or arbutin (100 μM) for 72 h, and (D) the extracellular and (E) the intracellular melanin contents were measured at 475 and 405 nm, respectively. The graph shows mean ± SD values of three replicates. ### p < 0.001, as compared with the control group; * p < 0.05, ** p < 0.01, as compared with the IBM- induced group.
Applsci 13 00550 g001
Figure 2. Effect of FBG, BG, and WG on anti-melanogenic mechanism. The B16F10 cells were treated with 100 μg/mL of FBG, BG, or WG for 72 h. The expression of tyrosinase, TYRP-1, TYRP-2, and MITF at the mRNA level was determined using qRT-PCR. Arbutin (100 μM) was used as a positive control. The graph shows mean ± SD values of three replicates. # p < 0.05, ## p < 0.01, as compared with control group; * p < 0.05, ** p < 0.01, *** p < 0.001, as compared with the IBMX-induced group.
Applsci 13 00550 g002
Figure 3. Anti-wrinkle effect of FBG, BG, and WG in HDF cells. (A) Cytotoxicity effect of FBG, BG, and WG in HDF cells for 24 h. The cells were treated with each sample at the indicated concentrations (50, 100, 200, and 400 μg/mL) for 24 h. The cytotoxicity effect was then determined with MTT assays. (B) Inhibition of elastase was determined in response to the indicated concentration of FBG, BG, and WG (0.5, 1, 2, and 4 mg/mL). (C) Intracellular elastase activity in UVB-irradiated HDF cells was measured in response to the concentration of 100 μg/mL of FBG, BG, or WG, or ursolic acid (500 μM). The graph shows mean ± SD values of at least three replicates. ### p < 0.001, as compared with the control group; * p < 0.05, ** p < 0.01, as compared with the UVB-irradiated group.
Applsci 13 00550 g003
Figure 4. Effect of FBG, BG, and WG on anti-wrinkle mechanism. The HDF cells were treated with 100 μg/mL of FBG, BG, or WG for 24 h. The expression of MMP-1, MMP-9, and COL-1 at the mRNA level was determined using qRT-PCR. Ursolic acid (500 μM) was used as a positive control. The graph shows mean ± SD values of three replicates. ### p < 0.001, as compared with the control group; ** p < 0.01, *** p < 0.001, as compared with the UVB-irradiated group.
Applsci 13 00550 g004
Figure 5. The antioxidant effects of FBG, BG, and WG on H2O2-induced ROS levels in HaCat cells. (A) Cytotoxicity effect of FBG, BG, and WG in HaCat cells for 24 h. The cytotoxicity effect was then determined with MTT assays. (B) HaCat cells were treated with FBG, BG, or WG (100 μg/mL) for 24 h before exposure to H2O2 (500 μM) for 2 h. ROS level was detected by DCFH-DA and examined with a 10x fluorescence microscope. Scale bar: 100 μM. (C) Intracellular ROS level (% of control). The graph shows mean ± SD values of four replicates. ## p < 0.01, as compared with the control group; * p < 0.05, ** p < 0.01, as compared with the H2O2 stimulation group.
Applsci 13 00550 g005
Figure 6. Anti-skin aging mechanism: anti-melanogenic, anti-wrinkle and antioxidant effects of FBG.
Applsci 13 00550 g006
Table 1. The proportion of reactant solutions.
SolutionABCD
Phosphate buffer (µL)4080040
L-DOPA (µL)40404040
Sample (µL)004040
Tyrosinase (µL)400400
Table 2. Sequences of primers used for mRNA gene expression analysis by qRT-PCR.
GenePrimer Sequence (5′-3′)
TyrosinaseF: TTG CCA CTT CATGTC ATC ATA GAA
R: TTT ATC AAA GGT GTG ACT GCT ATA
TYRP-1F: GCT GCA GGA GCC TTC TTT CTC
R: AAG ACG CTG CAC TGC TGG TCT
TYRP-2F: GGA TGA CCG TGA GCA ATG GCC
R: CGG TTG TGA CCA ATG GGT GCC
MITFF: CGC CTG ATC TGG TGA ATC G
R: CCT GGC TGC AGT TCT CAA GAA
MMP-1F: ATT CTA CTG ATA TCG GGG CTT TGA
R: ATG TCC TTG GGG TAT CCG TGT AG
MMP-9F: CGT CGT GAT CCC CAC TTA CT
R: AGA GTA CTG CTT GCC CAG GA
COL-1F: TGA CGA GAC CAA GAA CTG
R: TAC CAG GGT TTG AGC TCA GC
GAPDHF: CAA GGT CAT CCA TGA CAA CTT TG
R: GTC CAC CAC CCT GTT GCT GTA G
Table 3. Total phenolic content, total flavonoid content, and antioxidant activities of FBG, BG, and WG.
SamplesTPC
(µg GAE/mg Extract *)
TFC
(µg RE/mg Extract **)
Antioxidant Activities
DPPHReducing Power
(µg GAE/mg Extract)(µg GAE/mg Extract)
FBG48.7 ± 0.83 a30.24 ± 0.80 a7.25 ± 1.10 a22.34 ± 0.54 a
BG39.8 ± 0.65 b24.40 ± 0.29 b6.01 ± 0.73 b18.14 ± 0.76 b
WG7.4 ± 0.50 c6.20 ± 0.15 c1.4 ± 1.21 c5.82 ± 0.81 c
The results are shown as means ± standard deviation (n = 3). Values in the same column separated by a different letter (a–c) differ significantly. p < 0.05 by Tukey (HSD) test. * µg GAE/mg extract: µg gallic acid equivalents (µg GAE)/mg extract. ** µg RE/mg extract: µg rutin equivalents (µg RE)/mg extract.
Disclaimer/Publisher’s Note: The statements, opinions and data contained in all publications are solely those of the individual author(s) and contributor(s) and not of MDPI and/or the editor(s). MDPI and/or the editor(s) disclaim responsibility for any injury to people or property resulting from any ideas, methods, instructions or products referred to in the content.

