Article

Phenolic Compounds, Antioxidant Activity, Ascorbic Acid, and Sugars in Honey from Ingenious Hail Province of Saudi Arabia

by
Ghedeir Muslem Alshammari
,
Mohammed Asif Ahmed
*,
Tawfiq Alsulami
,
Mohammed Jamal Hakeem
,
Mohamed Abdrabo Ibraheem
and
Doha M. Al-Nouri
Food Science and Nutrition Department, Food and Agriculture Science College, King Saud University, P.O. Box 2460, Riyadh 11451, Saudi Arabia
*
Author to whom correspondence should be addressed.
Appl. Sci. 2022, 12(16), 8334; https://doi.org/10.3390/app12168334
Submission received: 13 July 2022 / Revised: 10 August 2022 / Accepted: 17 August 2022 / Published: 20 August 2022

Abstract

:
Bioactive compounds are responsible for biological activities in honey. The botanical and regional sources of honey contribute to the variable concentration of bioactive compounds. This paper reports the analysis of bioactive compounds such as phenolic compounds, vitamin C, total phenolic contents (TPC), radical scavenging activity (RSA), and sugars of five honey samples (Talh, Athel, Sidr, Spring flower, and Langnese) from the ingenious Hail region (Saudi Arabia) using HPLC-RID and DAD. Talh has the highest TPC level of 26.9 mg GAE/100 g, whereas Spring flower has the lowest level of 8.2 mg GAE/100 g. Quercetin levels in all samples ranged from 0.28 to 2.68 mg GAE/100 g. Gallic acid, a phenolic compound, was found in three samples of honey at concentrations ranging from 0.81–1.08 mg/100 g. DPPH radical scavenging activity (RSA) of Talh and Sidr honey sample are found to be high as compared to other samples. The Sidr honey sample had the highest vitamin C content, 2.59 mg/100 g. Fructose and glucose sugar concentrations ranged from 28.35–37.81 g/100 g and 20.21–32.28 g/100 g, respectively, with a higher fructose ratio. Sucrose was not found in any of the five samples. These findings point to the high quality of honey produced in Saudi Arabia’s ingenious Hail province, and therefore may contribute in therapeutic use of these types of honey, such as in complementary and alternative medicine.

1. Introduction

Honey bees gather nectar from flowers by foraging and convert it into floral honey. Honey is a natural sweet and viscid food product produced by honey bees with a variable composition composing of at least 181 components [1]. Honey is the only concentrated and ready-to-use sweetener produced by nature. For hundreds of years, humans have been consuming honey, and it was the most important sweetener until sugar production started during the first industrial revolution in the 19th century. Most ancient cultures used honey not only as a food but also as medication [2,3,4]. It was described more than 1400 years ago as a healing source in the Holy Quran, in a chapter named “Honeybees” (Surah Al-Nahl) [5]. The benefits of honey are still important in modern days, and scientists have identified that consumers generally trust natural materials such as honey more than synthetic substances [6]. In addition, the analyses and characterizations of honey compounds with modern techniques can potentially open the door for the discovery of active components. The chemical composition as well as the therapeutical applications of various types of honey varies due to their geological area and botanical sources [7]. Honey’s bioactive composition depends on the geographical origin, floral type, climatic conditions, beekeeping conditions, storage conditions, processing, and honey ripeness [8,9,10,11].
The global honey production exceeds 1.1 million tons per annum and is increasing [12]; per capita, the honey consumption in the US for 2018 was 1.7 pounds per person. Therefore, it is always important to study new sources of honey (especially wild) in order to identify their chemical composition and their best therapeutical applications. One study found that vitamin C can improve honey’s antibacterial activity against planktonic and biofilm bacterial cells [13]. However, antioxidant combinations of polyphenols, minerals, and vitamin C may increase the generation of intracellular free radicals in bacterial cells and lead to their death.
Honey is primarily composed of sugars and water as well as other many compositions (at least 181 components) [1], such as flavonoids, proteins, free amino acids, colorants, organic acids, phytochemicals, minerals, pollens, vitamins, waxes, and scent compounds [14,15,16,17]. Natural honey also contains many antioxidant compounds, including glucose oxidase, catalase from enzymes category and non-enzyme category such as organic acid, phenolic compounds, Maillard reaction products, proteins, amino acid, ascorbic acid, and carotenoid derivatives [18,19]. Various chemical compounds in honey exist due to the climate conditions and the plants on which the bee feeds [1,20]. For example, bees feeding on the tree Leptospermum scoparium produce high-phenolic monofloral Manuka honey, which is widely used for its therapeutic effect worldwide [21]. Burkina Faso honey of Acacia had more flavonoid compounds than French honey, as reported by [19]. The European Union regulation draft mentions that honey should possess organoleptic features (aroma, color, consistency and flavor, etc.) and physicochemical characteristics (water, sugar, vitamins, minerals, acidity, amino acids, organic acid, enzymes activity and proteins, etc.) [22].
Phenolic contents are found in every type of honey and mostly accountable for the antioxidant properties of honey and human health welfare. The secondary metabolism of plants produces phenolic compounds, and their composition mainly depends on the plant source; the types of these compounds are flavonoids (e.g., catechin and quercetin) or phenolic acids (e.g., gallic and chlorogenic acids, etc.) [23]. Most polyphenols with other bioactive compounds are preservatives retarding deterioration, rancidity, or discoloration and act synergistically to provide antibacterial, antioxidant, hepatoprotective, and anti-fungicidal effects of honey [18]. In Saudi Arabia, extensive research was conducted on honey samples primarily from the south-western region, Asir province, to determine the physical properties, floral origin, antioxidants, and vitamins [24]. Physicochemical properties and vitamins have been reported in Saudi honey [25,26], and mineral contents, antimicrobial activity, and antioxidants were investigated [27]. There was no literature found on the phenolic compounds, vitamin, and sugars of the Talh (Acacia gerrardii Benth), Athel (Tamarix aphylla), Sidr (Ziziphus spina-christi L.) honey samples from the Hail province of Saudi Arabia. Therefore, we studied the important bioactive compounds (total phenolic content, phenolic compounds, antioxidant activity, vitamin C, and sugars) of these honey samples.

2. Materials and Methods

2.1. Chemicals

All the chemicals—fructose, glucose, sucrose, acetonitrile, ortho-phosphoric acid, (HPLC grade), ascorbic acid, tannic acid, chlorogenic acid, catechin, salicylic acid, quercetin, gallic acid, and Folin Ciocalteu (FC) reagent—were purchased from Sigma Aldrich (St. Louis, MO, USA). Water was treated in a Milli-Q water purification system (Millipore, Molsheim, France) to get the HPLC grade water.

2.2. Samples

Five honey samples—Talh (Acacia gerrardii Benth), Athel (Tamarix aphylla) and Sidr (Ziziphus spina-christi L.)—were collected directly from the beekeepers of Hail province, in the north-western region of Saudi Arabia. Botanical origin was used to classify them according to the method of [2]. Spring flower and Langnese natural honey were procured from the local market of Hail city. These samples were stored in dark at 4 °C till further analysis.

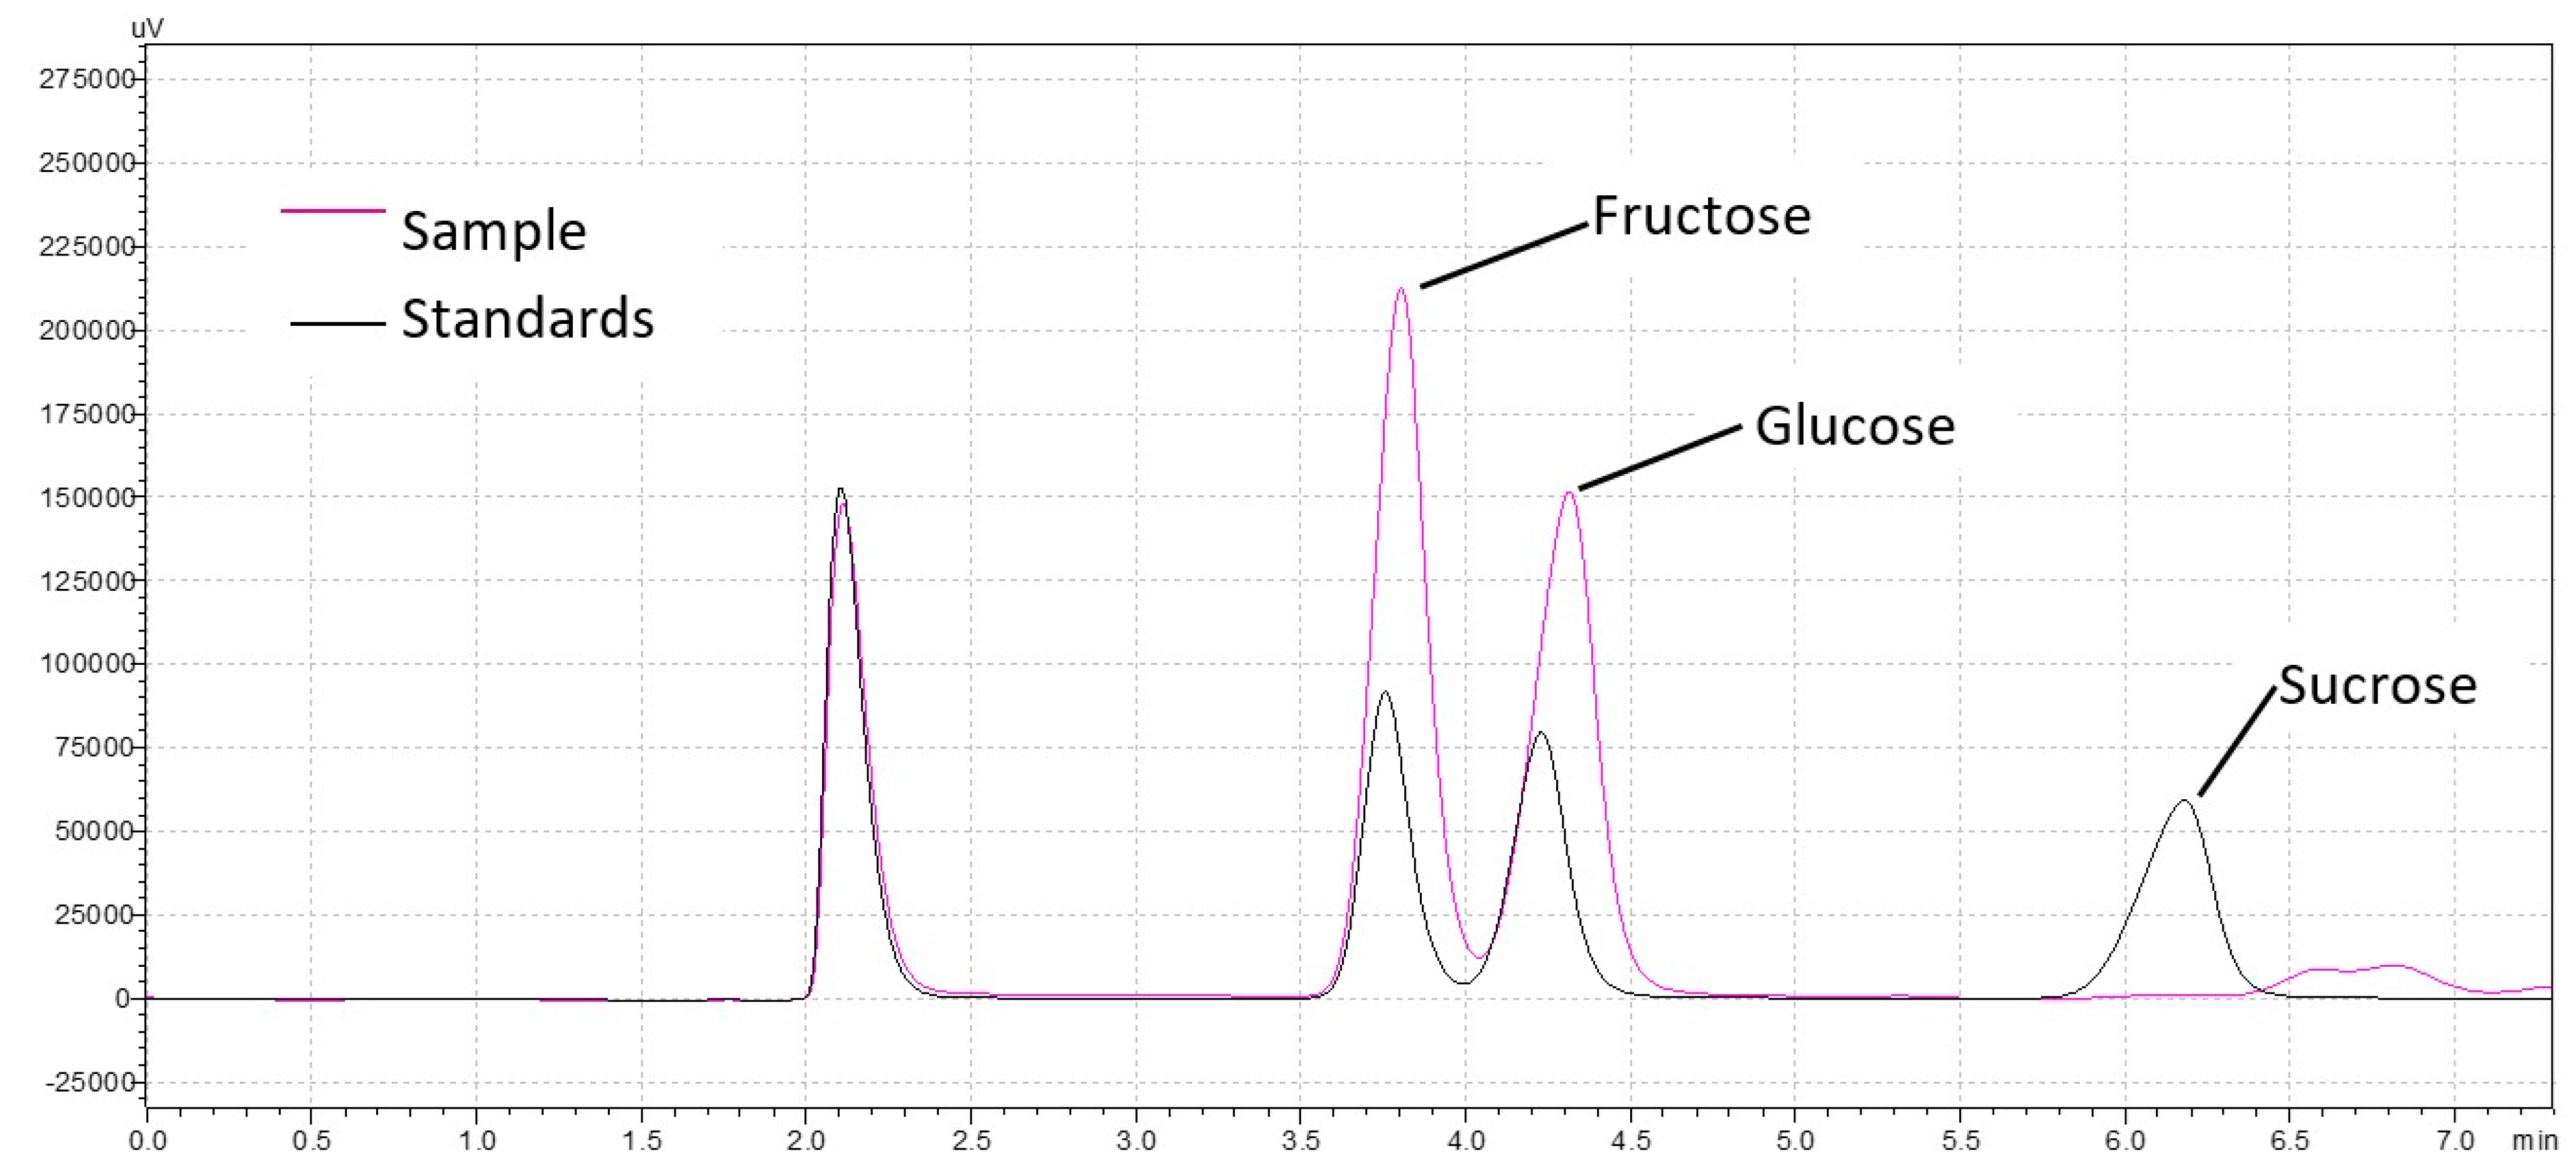
2.3. Sugar Analysis by HPLC-Refractive Index Detector (RID)

Sugars were extracted according to the method of AOAC [28]. 500 mg of honey samples were dissolved in 5 mL of acetonitrile, water (HPLC grade) 50:50 (v/v), vortexed and filtered using 0.45 µm syringe filters before injection to HPLC. Fructose, glucose, and sucrose were analyzed with Shimadzu HPLC system equipped with prominence LC-10AB binary pump, autosampler SIL-20A (Kyoto, Japan), using the mobile phase of 85% aqueous acetonitrile (HPLC grade) at an isocratic flow rate of 1 mL/min. Fructose, glucose, and sucrose were separated with a Shimadzu LC-NH2 column (150 × 4.6 mm, 5 µm) and identified with refractive index RID-10A Shimadzu detector (Kyoto, Japan). A 10 µL sample was injected to HPLC. Peak retention times of fructose, glucose, and sucrose were compared with those of standards and processed using Shimadzu LabSolutions, Lcsolution workstation V 1.22 (Kyoto, Japan). Quantification was done using the calibration curve of the corresponding external standards. All the samples were analyzed in duplicates.

2.4. Total Phenolic Content (TPC)

The quantification of total phenolic contents was performed using the Folin–Ciocalteu (FC) procedure as described by Silici et al., (2010) with slight modification [29]. Methanol 4 mL was used to dissolve 1 g of honey sample using vortex, then this solution was filtered through Whatman No.1 filter paper. 200 µL of Folin–Ciocalteu reagent was mixed with 5 mL Milli-Q water and 100 µL honey solution, then 3 mL of sodium carbonate (Na2CO3) 20% solution was added and incubated for 2 h at room temperature in the dark. The intensity of absorbance was recorded at 765 nm with methanol as a blank. Gallic acid standard (0–1.5 mg/mL) was used to obtain the standard curve for the calculation of total phenolic contents and results were reported as milligram gallic acid equivalent (GAE) per 100 g of honey.

2.5. Phenolic Compound Analysis by HPLC-DAD

Phenolic compounds (quercetin, chlorogenic acid, tannic acid, gallic acid, salicylic acid, and catechin) in honey samples were analyzed using the HPLC (Agilent Technologies, Santa Clara, CA, USA, 1260 infinity) with binary pump (G1312B) and DAD-1260 VL detector, as described by [30]. Zorbax SB-C18 (250 × 4.6 mm, 5 µm; Agilent, Santa Clara, CA, USA) column at 30 °C and mobile phase (A) Milli Q water with 4% acetic acid (HPLC grade) and (B) MeOH (HPLC grade) was used. Gradient program used for the binary solvent was 0–10 min 5–20% B; 10–15 min 20–40% B; 15–20 min 40–60% B; 20–25 min 60% B with 1.0 mL/min flow rate. A 10 µL sample was injected to HPLC, and the DAD was set at 280 nm. Peak retention time of phenolic compounds in honey samples were compared with those of standards. Quantification was done using the calibration curve of the corresponding external standards. All samples were analyzed in duplicate.

2.6. HPLC Analysis of Vitamin C

Sample preparation for HPLC analysis was carried out according to the procedure of [31]. About 3 g of honey was dissolved in 5 mL Milli-Q (HPLC grade) water. The flask was sonicated for 10 min at 25 °C, then samples were homogenized and filtered through 0.45 µm syringe filter before injecting to HPLC.
HPLC analysis of vitamin C was performed according to the method of [32] using the HPLC (Agilent Technologies, 1260 infinity) with binary pump (G1312B) and diode array detector (DAD-1260 VL). The column used was Zorbax SB-C18 (250 × 4.6 mm, 5 µm; Agilent, Santa Clara, CA, USA). Stock mobile phase solution was produced using HPLC grade Milli-Q water, 13 mL of 85% ortho-phosphoric acid (HPLC grade) diluted to 1 L, then 100 mL of the above solution was made up to 1 L with Milli-Q water (HPLC grade). A 10 µL sample was injected to HPLC and the DAD was set at 254 nm. Peak retention time of honey vitamin C were compared with those of standards. Quantification was done using the calibration curve of the corresponding external standards. All samples were analyzed in duplicate.

2.7. DPPH Radical Scavenging Assay

The DPPH (1,1-diphenyl-2-picrylhydrazil, SIGMA, St. Louis, MO, USA) radical scavenging activity was determined in this study using the method of [33] with some modification. Briefly, 0.75 mL of the honey solution (0.1 g/mL) in warm water was mixed with 1.5 mL of DPPH (0.09 mg/mL) in methanol. The mixture was then incubated at 25 °C in a water bath for 5 min. The absorbance was measured at 517 nm against a blank sample consisting of honey solution with distilled water. The absorbance of a radical blank was also measured using 0.75 mL of distilled water.
The radical scavenging activity (RSA) of honey was expressed in terms of percentage inhibition of DPPH radical by honey and was calculated as follows:
RSA (DPPH, Inhibition, %) = [(AB − AT)/AB] × 100
where
AB = Absorbance of radical blank (DPPH, without honey)
AT = Absorbance of test sample (DPPH, with honey)

2.8. Statistical Analysis

Statistical calculation of data was carried out using Microsoft Excel, 2019 (Microsoft, Seattle, WA, USA). The experiments were independently replicated 2 times (n = 2). The results are presented here as the arithmetical mean ± standard error [34]. One-way ANOVA analysis of variance was performed in order to assess the significant differences between honey samples using Excel software.

3. Results and Discussion

3.1. Sugar Analysis by HPLC-Refractive Index Detector (RID)

The results of the sugar (fructose, glucose, and sucrose) analysis in Talh, Athel, Sidr, Spring flower, and Langnese honey samples by HPLC-RID are shown in Figure 1 and reported in Table 1. The results showed that fructose and glucose (monosaccharides) are the major components in all honey samples; however, none of the samples contained sucrose. Honey samples generally contain <1% of sucrose concentration, but this may increase if the bees are overfed by the beekeepers using sugar solutions during spring. Quantitatively, fructose is the predominant sugar after glucose [35]. Fructose and glucose concentrations in the honey samples of the Hail province ranged between 28.35–37.81 g/100 g and 20.21–32.28 g/100 g, respectively. Fructose (37.81 g/100 g) was the highest sugar in Sidr (Ziziphus spina-christi L.) honey, whereas glucose (32.2 g/100 g) was the highest in Athel (Tamarix aphylla) honey in comparison with other samples of honey. Total sugar content was the highest in Langnese honey (68.9 g/100 g), and Talh (Acacia gerrardii Benth) honey had the lowest total sugar content (48.56 g/100 g). The range of sugars in the honey samples were between 48.56–68.9 g/100 g, and these results are similar to those obtained for honey samples from Australia [36]. The Asir province (Saudi Arabia) honey samples contained 33.1–44.8% fructose and 26.7–37.9% glucose [24]. Sugar composition in honey depends on the bee consumption of plant secretions or flowers (nectar sources) [37], therefore, the sugar contents are sometime used to identify the geographical origin of honey. Honey’s phenolics, proteins, and sugars can combine to form high molecular weight melanoidins, multi-component polymers with antioxidant properties [38]. The results of this study on Hail province honey samples indicates their high quality, as they are free from sucrose adulteration.

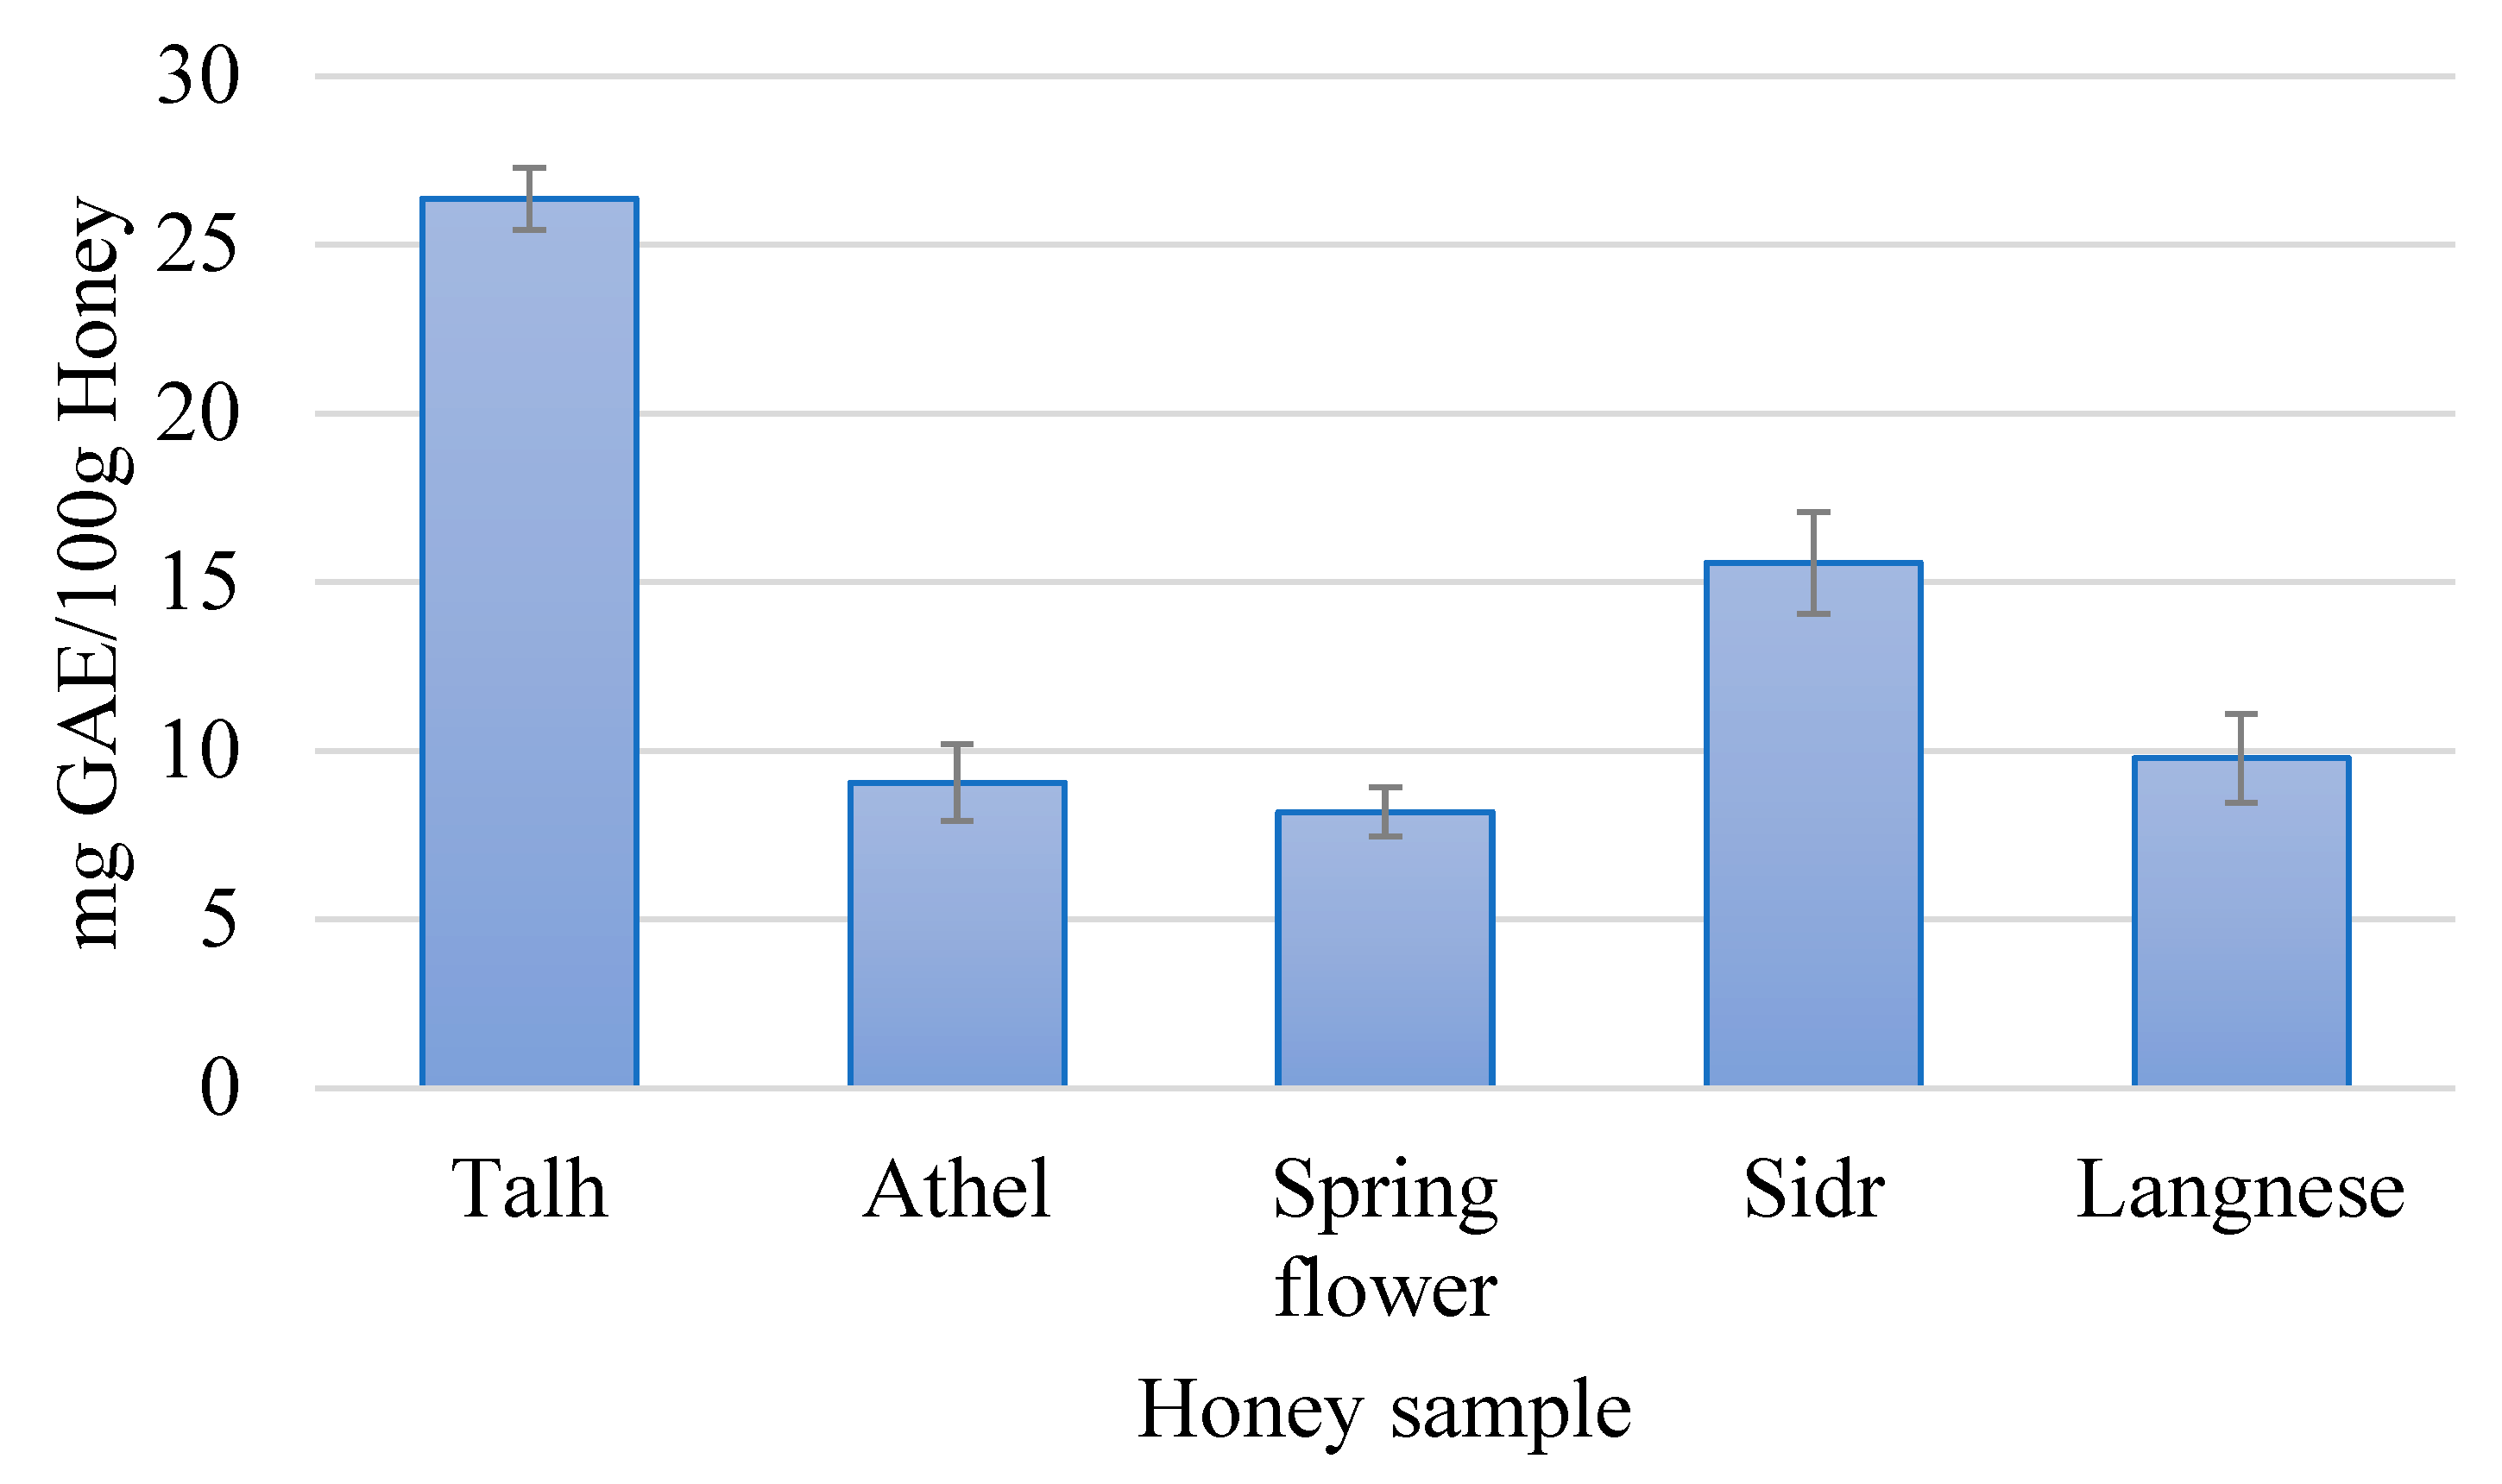
3.2. Total Phenolic Content (TPC)

Phenolic contents are considered to be health beneficial but the actual effective interest for honey phenolic content quantification has been recently addressed [39]. Samples of mono and heterofloral honey were analyzed using Folin Ciocalteu (FC) method of assay for total phenolic contents, the average concentration with standard error are reported in Figure 2. Total phenolic content varied between the samples, Talh (Acacia gerrardii Benth) honey had the highest (26.4 mg GAE/100 g), whereas Spring flower had the lowest (8.2 mg GAE 100 g−1). Sidr (Ziziphus spina-christi L.) (15.5 mg GAE/100 g) was the second highest TPC in the current study followed by Langnese (9.8 mg GAE/100 g) and Athel (Tamarix aphylla) (9.1 mg GAE/100 g) honey samples, this difference can be seen in phenolic compounds of these samples, where most of the phenolic compounds are detected in Talh honey. Similar results are reported by [40] for honey samples from Italy 6.05–27.6 mg GAE/100 g for Sulla and honey dew samples respectively. Lower values of TPC in nordic honey 0.94–5.52 mg GAE/100 g for heather and willow honey respectively were reported [41]. Total phenols of Acacia gerrardii honey from three location of Saudi Arabia were in the range of 0.74–0.84 mg/g [42]. Honey produced in Hail province contains moderate level of total phenolic contents.

3.3. Phenolic Compounds Analysis by HPLC-DAD

Phenolic substances type and concentration is responsible for the biological activities and rely on the flower source of the honey [43]. Due to the botanical and regional source, phenolic compounds differ between the various honey samples. Results of phenolic compound analysis for honey samples are reported in Table 2. Quercetin is present in all honey samples, whereas gallic acid is found in only three samples. The concentration of gallic acid in Talh (Acacia gerrardii Benth) is 1.08 mg/100 g, whereas in Athel (Tamarix aphylla) and Sidr (Ziziphus spina-christi L.) is 0.81 mg/100 g, 0.97 mg/100 g respectively. The range of quercetin is 0.28–2.68 mg/100 g, gallic acid 0.81–1.08 mg/100 g. Catechin 1.14 mg/100 g found in Talh (Acacia gerrardii Benth) honey sample only. HPLC analysis revealed high total phenolic compounds 6.75 mg/100 g is found in Spring flower honey, followed by Sidr (Ziziphus spina-christi L.) honey 5.91 mg/100 g, whereas the low total phenolic compounds 1.09 mg/100 g was found in Athel (Tamarix aphylla) honey. Similar results are reported for phenolic compounds in Australian honey samples 1.58 mg/100 g [36]. The content of gallic acid in present study 0.81–1.08 mg/100 g are lower than previously described by [44] in lavender honey samples up to 237.20 mg/100 g. Salicylic acid 1.44–4.19 mg/100 g is greater as compared to the reported values 4 mg/kg in chestnut honey samples [45]. Quercetin content 0.28–0.46 mg/100 g in all honey samples except Spring flower honey 2.68 mg/100 g. The outcome of this study is comparable to the study of [46], they revealed quercetin 0.33 mg/100 g in Australian eucalyptus honey. Chlorogenic acid is one of the common phenolic acids in honey samples but it was not found in honey samples of the current study and comparable to the results of [47] for Langnese honey sample.

3.4. Vitamin C Analysis by HPLC

The results of HPLC analysis for vitamin C are shown in Table 3. Vitamin C content in all honey samples was between 0.25–2.59 mg/100 g. Sidr (Ziziphus spina-christi L.) had the highest vitamin C content of 2.59 mg/100 g, whereas Spring flower honey had the lowest vitamin C quantity of 0.25 mg/100 g. Talh (Acacia gerrardii Benth) and Langnese vitamin C content were in the moderate range of 1.4 and 1.35 mg/100 g, respectively. Previous studies showed that vitamin C content varied in honey due to the geographical and plant sources [31]. For instance, Vitamin C in echium honey, lavender honey, and honeydew are 2.18, 2.11, and 0.77 mg/100 g, respectively [35]. Furthermore, the content of Vitamin C in Sulla honey was 0.84–1.5 mg/kg, and in citrus honey it was found to be 1.6–3.0 mg/kg [48]. Vitamin C content ranged between 88–457 mg/100 g in the honey produced from different altitudes in the south-western part of Saudi Arabia [25]. Vitamin C in various floral sources honey could not be detected by Ghedolf et al. [49]. Vitamin C was detected at a very low level in rape, acacia, and multiflora honey [50].

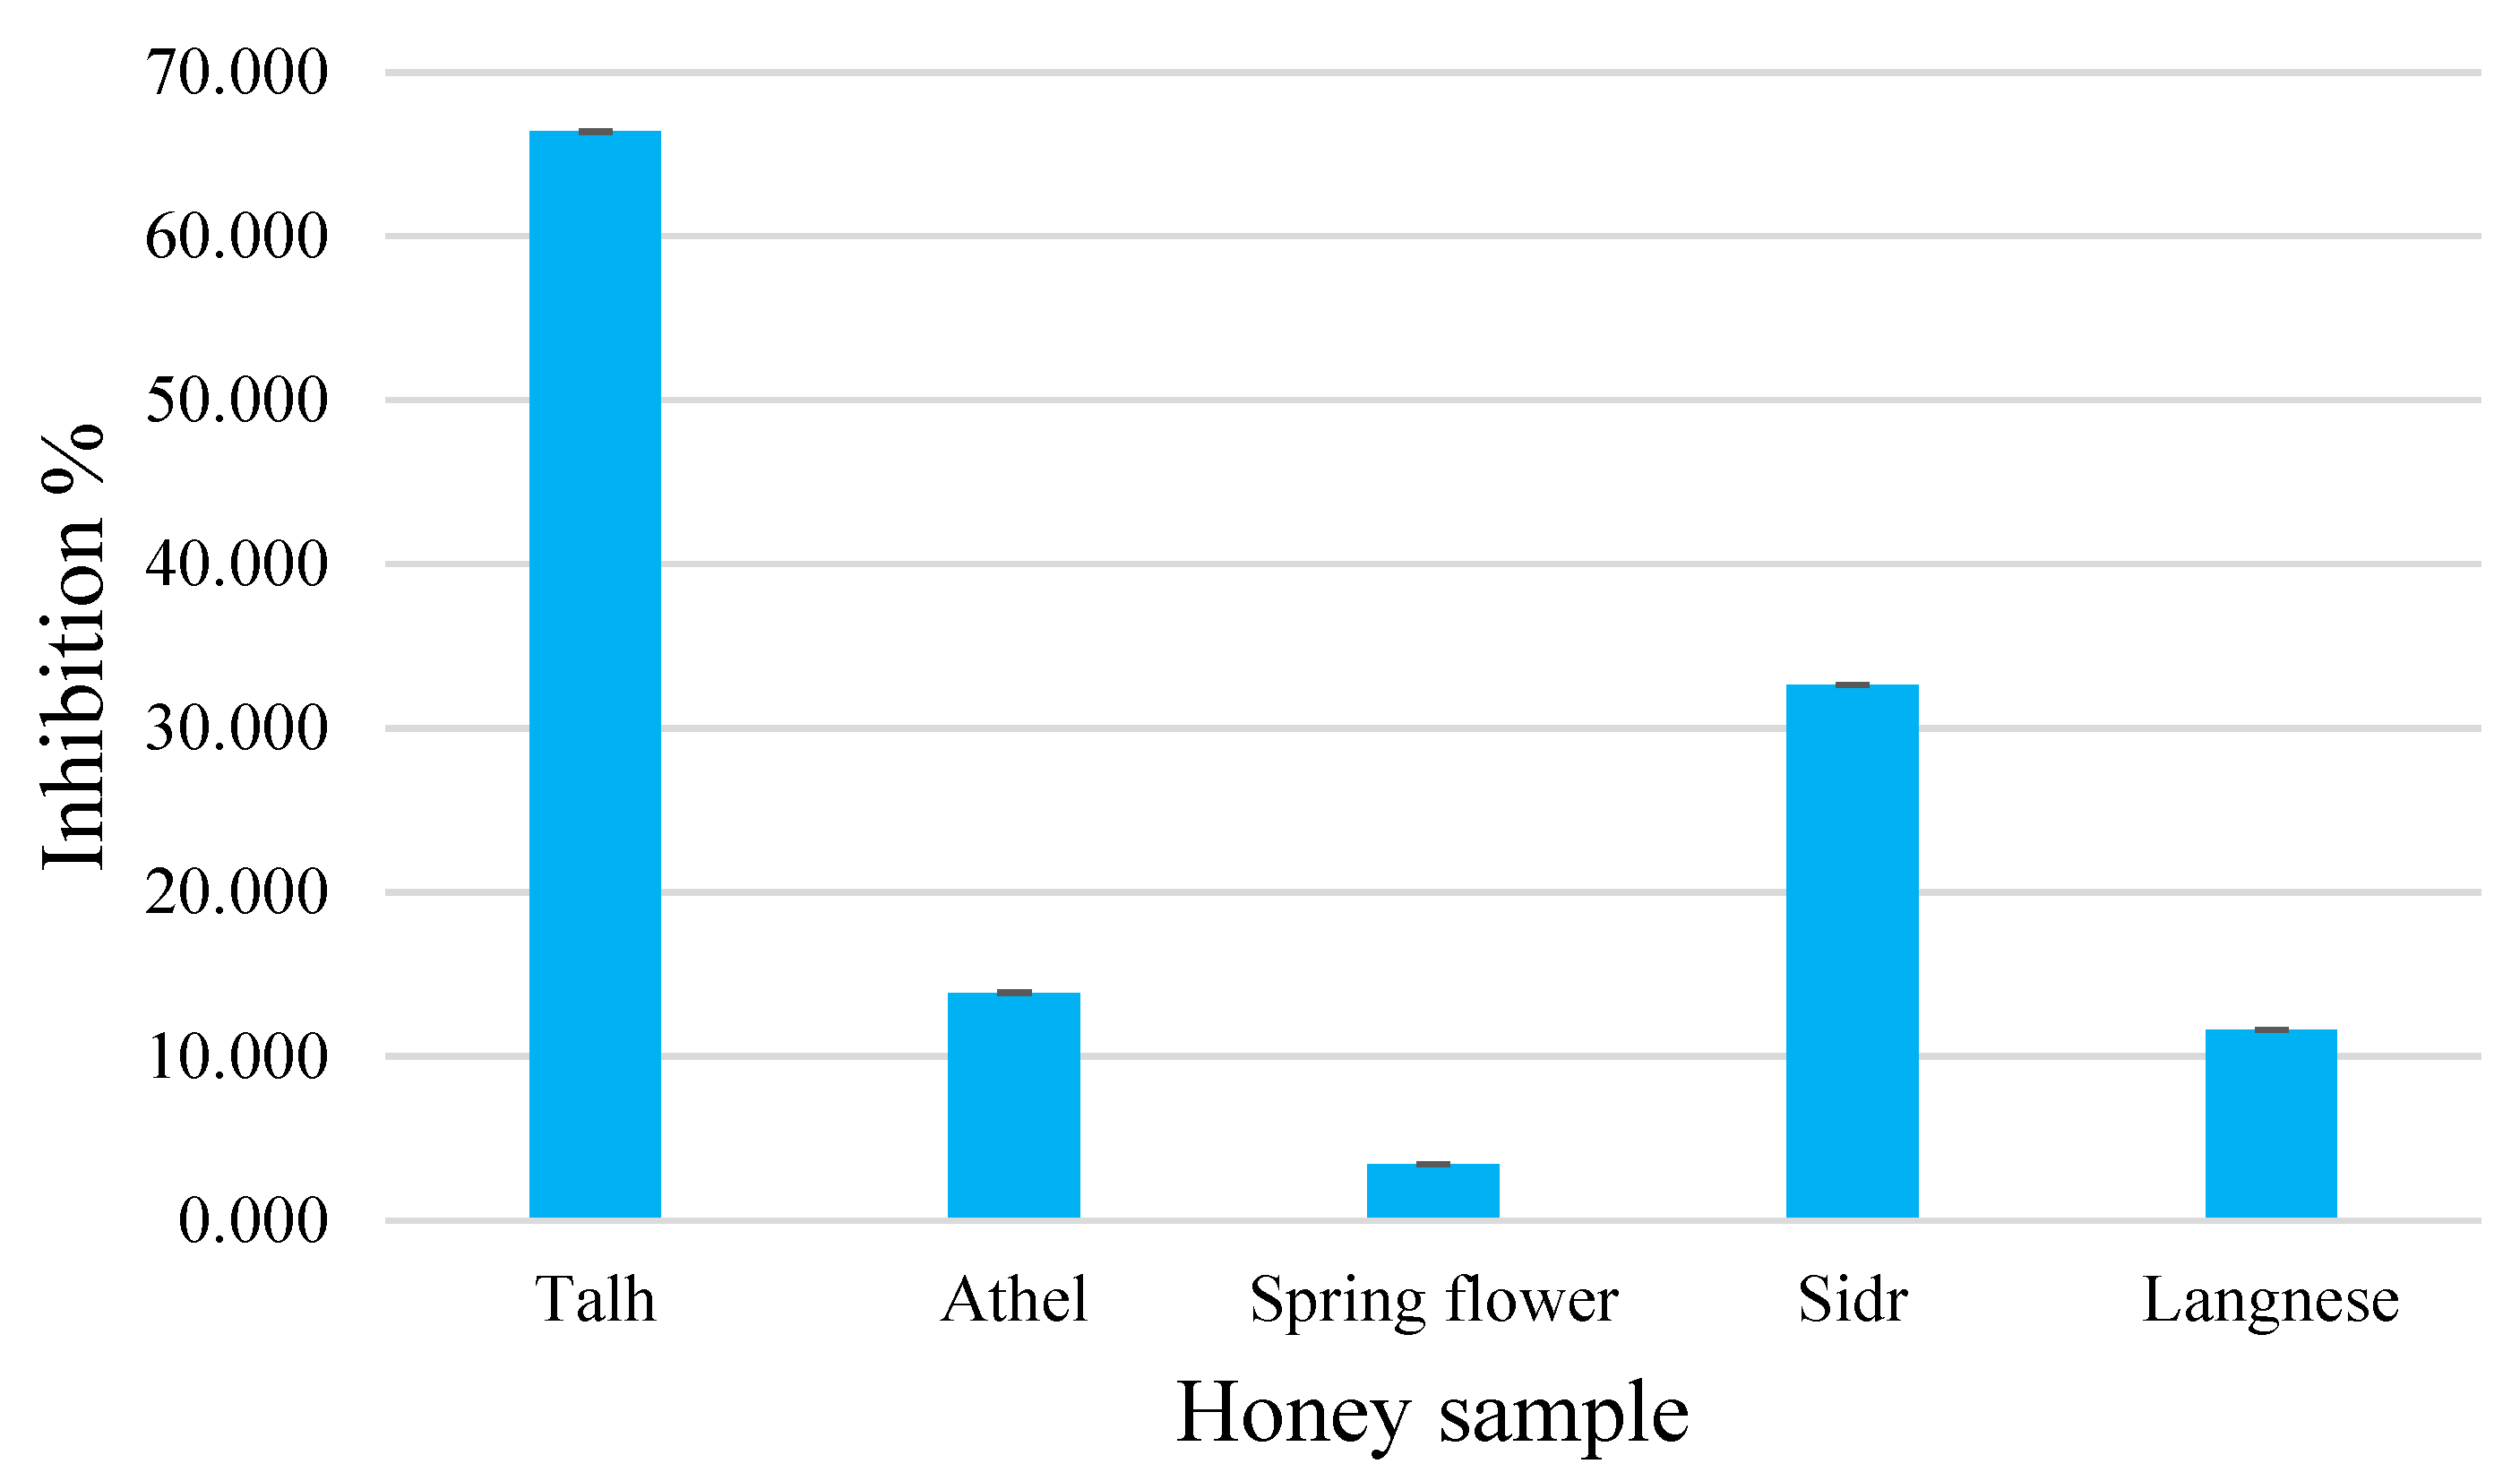
3.5. DPPH Radical Scavenging Assay

Honey is a good source of natural antioxidants, which protect against oxidizing agents’ effects on food preservation and human health, lowering the risk of heart disease, cancer, immune system deterioration, cataracts, and various inflammatory processes [51]. The overall hydrogen/electron donating activity of dietary antioxidant supplements, like honey, can be obtained through the DPPH radical scavenging effect. A common technique for assessing antioxidant activity is scavenging the stable DPPH radical method. The differences in antioxidant activity between the tested samples are most likely due to the floral source of honey. However, it is well known that plant species and a variety of other factors in plants influence phytochemical composition, including the presence of antioxidant-active molecules, and [21,43,52,53,54] may be responsible. The radical scavenging activity (RSA) results were presented in Figure 3, as DPPH inhibition (%) compared to the blank control. In general, the DPPH inhibition of the tested honey samples ranged between 3.4–66.4%. The Talh sample demonstrated the highest inhibition (66.4%), followed by Sidr honey (32.6%), then Athel (13.9%) and Langnese (11.6%) honey. Spring flower honey has the lowest inhibition. The RSA of these samples very much correlated with the total phenolic content (TPC) (Figure 2) and phenolic compounds (Table 2). The antioxidant activity of these honey samples supported earlier studies that indicated phenolic chemicals are powerful antioxidants [55,56].
Talh honey had a higher percentage inhibition than the Malaysian honey (tualang) inhibition (59.89%), and Indian (57.5%) and Algerian honey samples (44.55%), again indicating that it has the highest antioxidant potential [57]. Serbian polyfloral honeys’ RSA ranged between 1.31–25.61% [58]. Vitamins, even in small amounts, do not contribute to a sample’s antioxidant activity. Furthermore, many studies found no link between vitamin content and antioxidant activity [59].

4. Conclusions

In this study, important bioactive components, sugars, vitamin C, TPC, DPPH radical scavenging activity, and phenolic compounds in honey were evaluated in five samples obtained from the ingenious Hail province of the Kingdom of Saudi Arabia. This province is located in the north-western part of the Kingdom of Saudi Arabia and is presently the focus for the honey production in the Kingdom. The results indicated that Talh (Acacia gerrardii Benth) and Sidr (Ziziphus spina-christi L.) honey contain all the bioactive compounds and high RSA compared to other honey samples. Talh honey has the higher percentage inhibition, indicating that it has the highest antioxidant potential. Furthermore, many studies found no link between vitamin content and antioxidant activity. Hail honey samples indicate their high quality, as they are free from sucrose adulteration, moderate TPC, DPPH, and phenolic compounds. The literature on the Talh (Acacia gerrardii Benth), Athel (Tamarix aphylla), and Sidr (Ziziphus spina-christi L.) honey samples of ingenious Hail province is very limited, therefore, the data presented here may help researchers with future studies. Further studies are required to ascertain the different parameters of these honey samples to correlate them with health benefits.

Author Contributions

Conceptualization, G.M.A.; data curation, M.A.A.; formal analysis, M.A.I.; funding acquisition, G.M.A.; methodology, M.A.A. and M.A.I.; project administration, T.A. and M.J.H.; resources, M.A.A.; supervision, M.J.H.; writing—original draft, D.M.A.-N.; Writing—review & editing, M.A.A. All authors have read and agreed to the published version of the manuscript.

Funding

This research received no external funding.

Institutional Review Board Statement

Not applicable.

Informed Consent Statement

Not applicable.

Data Availability Statement

The data presented in this study are available on request from the corresponding author.

Acknowledgments

The authors would like to extend their sincere appreciation to the ‘Researchers Supporting Project’ number (RSP-2021/84), King Saud University, Riyadh, Saudi Arabia.

Conflicts of Interest

The authors declare no conflict of interest.

References

  1. Viuda-Martos, M.; Ruiz-Navajas, Y.; Fernández-López, J.; Pérez-Álvarez, J.A. Functional properties of honey, propolis, and royal jelly. J. Food Sci. 2008, 73, 117–124. [Google Scholar] [CrossRef] [PubMed]
  2. Crane, E. Honey: A Comprehensive Survey; (No. SF 539. H66); Morrison and Gibb Ltd.: London, UK, 1975. [Google Scholar]
  3. Crane, E. The World History of Beekeeping and Honey Hunting, 1st ed.; Routledge: New York, NY, USA, 1999. [Google Scholar] [CrossRef]
  4. Jones, R. Honey and healing through the ages. J. ApiProd. ApiMed. Sci. 2001, 1, 2–5. [Google Scholar] [CrossRef]
  5. Purbafrani, A.; Ghazizade Hashemi, S.A.; Bayyenat, S.; Taghizade Moghaddam, H.; Saeidi, M. The benefits of honey in Holy Quran. Int. J. Pediatr. 2014, 2, 67–73. [Google Scholar]
  6. Sepehr, S. The most important medicinal uses of honey, and its side effects in the book of the Canon by Avicenna, and in the modern medical literature: A comparative study. J. ApiProd. ApiMed. Sci. 2010, 2, 43. [Google Scholar]
  7. Oddo, L.P.; Piro, R.; Bruneau, É.; Guyot-Declerck, C.; Ivanov, T.; Piskulová, J.; Flamini, C.; Lheritier, J.; Morlot, M.; Russmann, H.; et al. Main European unifloral honeys: Descriptive sheets. Apidologie 2004, 35 (Suppl. S1), S38–S81. [Google Scholar] [CrossRef]
  8. Almeida, A.M.M.; Oliveira, M.B.S.; da Costa, J.G.; Valentim, I.B.; Goulart, M.O. Antioxidant capacity, physicochemical and floral characterization of honeys from the northeast of Brazil. Rev. Virtua Quim. 2016, 8, 57–77. [Google Scholar] [CrossRef]
  9. Kukurova, K.; Karovièová, J.; Kohajdova, Z.; Bilikova, K. Authentication of honey by multivariate analysis of its physico—Chemical parameters. J. Food Nutr. Res. 2008, 47, 170–180. [Google Scholar]
  10. El Sohaimy, S.A.; Masry, S.H.D.; Shehata, M.G. Physicochemical characteristics of honey from different origins. Ann. Agric. Sci. 2015, 60, 279–287. [Google Scholar] [CrossRef] [Green Version]
  11. Ansari, M.J.; Al-Ghamdi, A.; Nuru, A.; Khan, K.A.; Alattal, Y. Geographical distribution and molecular detection of Nosema ceranae from indigenous honey bees of Saudi Arabia. Saudi J. Biol. Sci. 2017, 24, 983–991. [Google Scholar] [CrossRef]
  12. FAOSTAT-Food and Agriculture Data. Available online: http://www.fao.org/faostat/en/#data (accessed on 9 April 2022).
  13. Majtan, J.; Sojka, M.; Palenikova, H.; Bucekova, M.; Majtan, V. Vitamin C enhances the antibacterial activity of honey against planktonic and biofilm-embedded bacteria. Molecules 2020, 25, 992. [Google Scholar] [CrossRef] [Green Version]
  14. Uran, H.; Aksu, F.; Dülger Altiner, D. A research on the chemical and microbiological qualities of honeys sold in Istanbul. Food Sci. Technol. 2017, 37, 30–33. [Google Scholar] [CrossRef] [Green Version]
  15. Amiry, S.; Esmaiili, M.; Alizadeh, M. Classification of adulterated honeys by multivariate analysis. Food Chem. 2017, 224, 390–397. [Google Scholar] [CrossRef] [PubMed]
  16. Nayik, G.A.; Nanda, V. Physico-chemical, enzymatic, mineral and colour characterization of three different varieties of honeys from Kashmir valley of India with a multivariate approach. Pol. J. Food Nutr. Sci. 2015, 65, 101–108. [Google Scholar] [CrossRef] [Green Version]
  17. Almeida-Muradian, L.B.; Stramm, K.M.; Horita, A.; Barth, O.M.; da Silva de Freitas, A.; Estevinho, L.M. Comparative study of the physicochemical and palynological characteristics of honey from M elipona subnitida and A pis mellifera. Int. J. Food Sci. Technol. 2013, 48, 1698–1706. [Google Scholar] [CrossRef] [Green Version]
  18. Al-Ghamdi, A.A.; Ansari, M.J. Biological and therapeutic roles of Saudi Arabian honey: A comparative review. J. King Saud Univ.—Sci. 2021, 33, 101329. [Google Scholar] [CrossRef]
  19. Meda, A.; Lamien, C.E.; Romito, M.; Millogo, J.; Nacoulma, O.G. Determination of the total phenolic, flavonoid and proline contents in Burkina Fasan honey, as well as their radical scavenging activity. Food Chem. 2005, 91, 571–577. [Google Scholar] [CrossRef]
  20. Eteraf-Oskouei, T.; Najafi, M. Traditional and modern uses of natural honey in human diseases: A review. Iran. J. Basic Med. Sci. 2013, 16, 731–742. [Google Scholar]
  21. Alzahrani, H.A.; Boukraa, L.; Bellik, Y.; Abdellah, F.; Bakhotmah, B.A.; Kolayli, S.; Sahin, H. Evaluation of the antioxidant activity of three varieties of honey from different botanical and geographical origins. Glob. J. Health Sci. 2012, 4, 191–196. [Google Scholar] [CrossRef] [Green Version]
  22. Council-European. Council Directive 2001/110/EC of 20 December 2001 relating to honey. Off. J. Eur. Communities L 2002, 10, 47–52. [Google Scholar]
  23. Cianciosi, D.; Forbes-Hernández, T.Y.; Afrin, S.; Gasparrini, M.; Reboredo-Rodriguez, P.; Manna, P.P.; Battino, M. Phenolic compounds in honey and their associated health benefits: A review. Molecules 2018, 23, 2322. [Google Scholar] [CrossRef] [Green Version]
  24. Ghramh, H.A.; Khan, K.A.; Ahmed, Z.; Ansari, M.J. Quality evaluation of Saudi honey harvested from the Asir province by using high-performance liquid chromatography (HPLC). Saudi J. Biol. Sci. 2020, 27, 2097–2105. [Google Scholar] [CrossRef] [PubMed]
  25. Al-Mosa, A.A.A.; Brima, E.I.; Mohammed, M.E.A. Antioxidant vitamins in honey samples from different floral origins and altitudes in Asir Region at the South-Western Part of Saudi Arabia. Curr. Nutr. Food Sci. 2019, 15, 296–304. [Google Scholar] [CrossRef]
  26. Ahamed, M.M.E.; Alaergani, W.; Suleiman, M.H.A.; Al-Gramah, H.A. Hydrogen peroxide and dicarbonyl compounds concentration in honey samples from different botanical origins and altitudes in the South of Saudi Arabia. Curr. Res. Nutr. Food Sci. J. 2019, 1, 150–160. [Google Scholar]
  27. Al-Hindi Rashad, R.; Shehata, A. Evaluation of antioxidant and antibacterial activities and essential elements content of locally produced honey in Saudi Arabia. Life Sci. J. 2014, 11, 175–185. [Google Scholar]
  28. AOAC. Official Methods of Analysis, 19th ed.; Association of Official Analytical Chemists: Washington, DC, USA, 2012. [Google Scholar]
  29. Silici, S.; Sagdic, O.; Ekici, L. Total phenolic content, antiradical, antioxidant and antimicrobial activities of Rhododendron honeys. Food Chem. 2010, 121, 238–243. [Google Scholar] [CrossRef]
  30. Liang, Y.; Cao, W.; Chen, W.-J.; Xiao, X.-H.; Zheng, J.-B. Simultaneous determination of four phenolic components in citrus honey by high performance liquid chromatography using electrochemical detection. Food Chem. 2009, 114, 1537–1541. [Google Scholar] [CrossRef]
  31. Perna, A.; Intaglietta, I.; Simonetti, A.; Gambacorta, E. A comparative study on phenolic profile, vitamin C content and antioxidant activity of Italian honeys of different botanical origin. Int. J. Food Sci. Technol. 2013, 48, 1899–1908. [Google Scholar] [CrossRef]
  32. Rizzolo, A.; Brambilla, A.; Valsecchi, S.; Eccher-Zerbini, P. Evaluation of sampling and extraction procedures for the analysis of ascorbic acid from pear fruit tissue. Food Chem. 2002, 77, 257–262. [Google Scholar] [CrossRef]
  33. Aljadi, A.M.; Kamaruddin, M.Y. Evaluation of the phenolic contents and antioxidant capacities of two Malaysian floral honeys. Food Chem. 2004, 85, 513–518. [Google Scholar] [CrossRef]
  34. Sokal, R.R.; Rohlf, J.B. Biometry. In The Principles and Practice of Statistics in Biological Research; W.H. Freeman and Company: San Francisco, CA, USA, 2000. [Google Scholar]
  35. León-Ruiz, V.; Vera, S.; González-Porto, A.V.; Andrés, M.P.S. Vitamin C and sugar levels as simple markers for discriminating Spanish honey sources. J. Food Sci. 2011, 76, C356–C361. [Google Scholar] [CrossRef]
  36. Yaoa, L.; Jiang, Y.; Singanusong, R.; Datta, N.; Raymont, K. Phenolic acids in Australian Melaleuca, Guioa, Lophostemon, Banksia and Helianthus honeys and their potential for floral authentication. Food Res. Int. 2005, 38, 651–658. [Google Scholar] [CrossRef]
  37. Sobrino-Gregorio, L.; Vargas, M.; Chiralt, A.; Escriche, I. Thermal properties of honey as affected by the addition of sugar syrup. J. Food Eng. 2017, 213, 69–75. [Google Scholar] [CrossRef]
  38. Kuś, P.M.; Congiu, F.; Teper, D.; Sroka, Z.; Jerković, I.; Tuberoso, C.I.G. Antioxidant activity, color characteristics, total phenol content and general HPLC fingerprints of six Polish unifloral honey types. LWT—Food Sci. Technol. 2014, 55, 124–130. [Google Scholar] [CrossRef]
  39. Alvarez-Suarez, J.M.; Tulipani, S.; Díaz, D.; Estevez, Y.; Romandini, S.; Giampieri, F.; Damiani, E.; Astolfi, P.; Bompadre, S.; Battino, M. Antioxidant and antimicrobial capacity of several monofloral Cuban honeys and their correlation with color, polyphenol content and other chemical compounds. Food Chem. Toxicol. 2010, 48, 2490–2499. [Google Scholar] [CrossRef] [PubMed]
  40. Pichichero, E.; Canuti, L.; Canini, A. Characterisation of the phenolic and flavonoid fractions and antioxidant power of Italian honeys of different botanical origin. J. Sci. Food Agric. 2009, 89, 609–616. [Google Scholar] [CrossRef]
  41. Salonen, A.; Virjamo, V.; Tammela, P.; Fauch, L.; Julkunen-Tiitto, R. Screening bioactivity and bioactive constituents of Nordic unifloral honeys. Food Chem. 2017, 237, 214–224. [Google Scholar] [CrossRef] [Green Version]
  42. Alqarni Abdulaziz, S.; Owayss, A.A.; Mahmoud, A.A. Physicochemical characteristics, total phenols and pigments of national and international honeys in Saudi Arabia. Arab. J. Chem. 2016, 9, 114–120. [Google Scholar] [CrossRef] [Green Version]
  43. Al-Mamary, M.; Al-Meeri, A.; Al-Habori, M. Antioxidant activities and total phenolics of different types of honey. Nutr. Res. 2002, 22, 1041–1047. [Google Scholar] [CrossRef]
  44. Andrade, P.; Ferreres, F.; Amaral, M.T. Analysis of honey phenolic acids by HPLC, its application to honey botanical characterization. J. Liq. Chromatogr. Relat. Technol. 1997, 20, 2281–2288. [Google Scholar] [CrossRef]
  45. Burya, D.; Gevrenova, R.; Ankla, E.M. Analysis of phenolic acids in honeys of different floral origin by solidphase extraction and high performance liquid chromatography. Phytochem. Anal. Int. J. Plant Chem. Biochem. Tech. 2007, 18, 24–32. [Google Scholar]
  46. Yao, L.; Jiang, Y.; Singanusong, R.; Datta, N.; Raymont, K. Phenolic acids and abscisic acid in Australian Eucalyptus honeys and their potential for floral authentication. Food Chem. 2004, 86, 169–177. [Google Scholar] [CrossRef]
  47. Cheung, Y.; Meenu, M.; Yu, X.; Xu, B. Phenolic acids and flavonoids profiles of commercial honey from different floral sources and geographic sources. Int. J. Food Prop. 2019, 22, 290–308. [Google Scholar] [CrossRef]
  48. Ciulu, M.; Solinas, S.; Floris, I. RP-HPLC determination of water-soluble vitamins in honey. Talanta 2011, 83, 924–929. [Google Scholar] [CrossRef]
  49. Ghedolf, N.; Wang, X.H.; Engeseth, N.J. Identification and quantification of antioxidant components of honey from various floral sources. J. Agric. Food Chem. 2002, 50, 5870–5877. [Google Scholar]
  50. Bonta, V.; Al Marghitas, L.; Bobis, O.; Margaoan, R.; Barnutiu Land Dezmirean, D.S. Quantitative determination of vitamin C in honey and bee pollen using HPLC-DAD method. Bull. UASVM Anim. Sci. Biotechnol. 2013, 70, 31–36. [Google Scholar]
  51. Dżugan, M.; Tomczyk, M.; Sowa, P.; Grabek-Lejko, D. Antioxidant activity as biomarker of honey variety. Molecules 2018, 23, 2069. [Google Scholar] [CrossRef] [PubMed] [Green Version]
  52. Oryan, A.; Alemzadeh, E.; Moshiri, A. Biological properties and therapeutic activities of honey in wound healing: A narrative review and meta-analysis. J. Tissue Viability 2016, 25, 98–118. [Google Scholar] [CrossRef] [PubMed]
  53. De Sousa, J.M.B.; de Souza, E.L.; Marques, G.; Benassi, M.T.; Gullón, B.; Pintado, M.M.; Magnani, M. Sugar profile, physicochemical and sensory aspects of monofloral honeys produced by different stingless bee species in Brazilian semi-arid region. LWT—Food Sci. Technol. 2016, 65, 645–651. [Google Scholar] [CrossRef] [Green Version]
  54. Biluca, F.C.; Braghini, F.; Gonzaga, L.V.; Costa, A.C.O.; Fett, R. Physicochemical profiles, minerals and bioactive compounds of stingless bee honey (Meliponinae). J. Food Compos. Anal. 2016, 50, 61–69. [Google Scholar] [CrossRef]
  55. Das, A.; Datta, S.; Mukherjee, S.; Bose, S.; Ghosh, S.; Dhar, P. Evaluation of antioxidative, antibacterial and probiotic growth stimulatory activities of Sesamum indicum honey containing phenolic compounds and lignans. Food Sci. Technol. 2015, 61, 244–250. [Google Scholar] [CrossRef]
  56. Bueno-Costa, F.M.; Zambiazi, R.C.; Bohmer, B.W.; Chaves, F.C.; Silva, W.P. Antibacterial and antioxidant activity of honeys from the state of Rio Grande do Sul, Brazil. Food Sci. Technol. 2016, 65, 333–340. [Google Scholar] [CrossRef] [Green Version]
  57. Moniruzzaman, M.; Khalil, M.I.; Sulaiman, S.A.; Gan, S.H. Physicochemical and antioxidant properties of Malaysian honeys produced by Apis cerana, Apis dorsata and Apis mellifera. BMC Complement. Altern. Med. 2013, 13, 43. [Google Scholar] [CrossRef] [PubMed] [Green Version]
  58. Gašić, U.; Kečkeš, S.; Dabić, D.; Trifković, J.; Milojković-Opsenica, D.; Natić, M.; Tešić, Ž. Phenolic profile and antioxidant activity of Serbian polyfloral honeys. Food Chem. 2014, 145, 599–607. [Google Scholar] [CrossRef] [PubMed]
  59. Zawawi, N.; Chong, P.J.; Mohd Tom, N.N.; Saiful Anuar, N.S.; Mohammad, S.M.; Ismail, N.; Jusoh, A.Z. Establishing relationship between vitamins, total phenolic and total flavonoid content and antioxidant activities in various honey types. Molecules 2021, 26, 4399. [Google Scholar] [CrossRef]
Figure 1. HPLC chromatogram of sugar standards and spring flower honey sample.
Applsci 12 08334 g001
Figure 2. Total phenolic contents (TPC) assay of honey samples.
Applsci 12 08334 g002
Figure 3. DPPH scavenging activity of honey samples.
Applsci 12 08334 g003
Table 1. HPLC analysis of sugars in honey samples.
Sample/SugarsFructose (g/100 g)Glucose (g/100 g)Sucrose (g/100 g)
Talh28.35 ± 0.87 a20.21 ± 0.2 bND
Athel35.93 ± 0.94 a32.28 ± 0.58 bND
Spring flower36.40 ± 1.92 a27.15 ± 1.57 bND
Sidr37.81 ± 2.45 a25.41 ± 1.2 bND
Langnese37.41 ± 1.46 a31.49 ± 1.34 bND
ND = Not detected. Means sharing the same superscript (a, b) in the column are not significantly different from each other (p > 0.05).
Table 2. Phenolic compounds (mg/100 g) in honey samples analyzed by HPLC.
Phenolic Compounds/SamplesTalhAthelSpring FlowerSidrLangnese
Gallic acid1.08 ± 0.67 a0.81 ± 0.65 a0.97 ± 0.61 aNDND
Catechin1.14 ± 0.93NDNDNDND
Chlorogenic acidNDNDNDNDND
Tannic acid1.09 ± 0.53 bNDND1.26 ± 0.35 bND
Salicylic acidNDND3.1 ± 0.91 c4.19 ± 0.17 c1.44 ± 0.13 c
Quercetin0.34 ± 0.14 d0.28 ± 0.05 d2.68 ± 1.17 d0.46 ± 0.11 d0.31 ± 0.02 d
ND = Not detected. Means sharing the same superscript (a–d) in the row are not significantly different from each other (p > 0.05).
Table 3. Analysis of vitamin C in honey samples.
Honey SampleVitamin C (mg/100 g)
Talh1.4 ± 0.11 a
Athel0.32 ± 0.05 a
Spring flower0.25 ± 0.11 a
Sidr2.59 ± 1.03 a
Langnese1.35 ± 0.31 a
Means sharing the same superscript (a) in the column are not significantly different from each other (p > 0.05).
Publisher’s Note: MDPI stays neutral with regard to jurisdictional claims in published maps and institutional affiliations.

