
Differential Sensitivity of Two Leukemia Cell Lines towards Two Major Gas Plasma Products Hydrogen Peroxide and Hypochlorous Acid


ZIK plasmatis, Leibniz Institute for Plasma Science and Technology (INP), Felix-Hausdorff-Str. 2, 17489 Greifswald, Germany
*
Author to whom correspondence should be addressed.
Appl. Sci. 2022, 12(15), 7429; https://doi.org/10.3390/app12157429
Submission received: 21 June 2022
/
Revised: 19 July 2022
/
Accepted: 22 July 2022
/
Published: 24 July 2022
(This article belongs to the Special Issue Gas Plasma Technology in Biology and Medicine)
Abstract
:Oxidative stress has major implications for health and disease. At the same time, the term collectively describes the reactions to different types of reactive oxygen species (ROS) and oxidants, including hydrogen peroxide (H2O2) and hypochlorous acid (HOCl). However, how both compare in terms of cytotoxicity and mechanism of action is less known. Using two leukemia cell lines, Jurkat and THP-1, as model systems at similar cell concentrations, we found an 8-fold greater sensitivity of the former over the latter for H2O2 exposure. Unexpectantly, this was not the case with HOCl exposure. Jurkat cells were 2-fold more resistant to HOCl-induced cytotoxicity than THP-1 cells. In each cell type, the relatively more toxic oxidant also induced activation of caspases 3 and 7 at earlier time points, as time-lapse fluorescence microscopy revealed. The effects observed did not markedly correlate with changes in intracellular GSH and GSSG levels. In addition, siRNA-mediated knockdown of the Nrf2 target HMOX-1 encoding for HO-1 protein and the growth and survival factor IL-8 revealed Jurkat cells to become more sensitive to HOCl, while HO-1 and IL-8 siRNA-mediated knockdown in THP-1 cells produced greater sensitivity towards H2O2. siRNA-mediated knockdown of catalase increased oxidant sensitivity only negligibly. Collectively, the data suggest striking HOCl-resistance of Jurkat and H2O2 resistance of THP-1 cells, showing similar protective roles of HO-1 and IL-8, while caspase activation kinetics differ.
1. Introduction
Reactive oxygen species (ROS) play pivotal roles in health and disease. This superordinate term describes an array of molecular oxygen derivatives that can cause lethal oxidative distress when applied at supraphysiological levels while mediating pleiotropic physiological signaling pathways per se [1]. Two main types of ROS produced by body cells are hydrogen peroxide (H2O2) and hypochlorous acid (HOCl). The former either spontaneously or enzymatically dismutates from superoxide that leaks the electron transport chain of mitochondria. Alternatively, superoxide is intentionally produced during inflammation and infection via NADPH and dual oxidases (NOX, DUOX) [2]. Persistently high H2O2 levels are associated with several pathologies, such as chronic kidney and liver disease, cancer, and lung and neurodegenerative disease [3,4,5,6,7,8]. Besides the induced oxidative stress in cells exposed to H2O2, the molecule is also used for antimicrobial defense, as evident in wound healing [9]. The enzyme myeloperoxidase (MPO) catalyzes a reaction with H2O2 to form HOCl, a dismutase’s potent antimicrobial type of ROS [10]. MPO is expressed mainly by professional phagocytes and activated upon inflammatory stimuli. Chlorinated proteins testify aberrant MPO-activity in chronically inflamed tissues [11].
Despite endogenous ROS generation in cellular respiration, metabolism, or by cells in antimicrobial defense [12], ROS can come from exogenous sources such as radiation, photodynamic therapy, various chemotherapeutics, and also medical gas plasmas. This innovative technology exploits the feature of partially ionized gases to generate vast amounts of ROS/RNS and has emerged as a promising tool for treating cancers in recent years [13,14]. Emphasizing results have been reported from preclinical studies in various tumor models, including leukemia in vitro [15,16], in vivo [17,18], and the palliation of head and neck cancer patients in clinical dermato-oncology [19,20]. Intriguingly, species chemistries can be influenced, e.g., by operating devices with different feed gases or feed gas admixtures [21]. Due to the high reactivity of short-lived species in the gas phase, biological effects in vitro, where cells are surrounded by liquids, are mainly mediated by secondary, long-lived species. Hereof, H2O2 plays a major role in argon feed gas conditions [22,23], while helium–oxygen (HeO2) plasmas generate vast amounts of HOCl during treatment [24,25].
Oxidative stress implies a somewhat collective action of oxidants, leading to impaired redox signaling and molecular damage [26]. Irreversible damage to biomolecules such as nucleic acids, lipids, or proteins can cause ROS-induced cell death, often linked to characteristics of apoptotic signaling [27,28]. To protect themselves from such potential damage, the cells set up a series of defense mechanisms including detoxification of the ROS by enzymes such as superoxide dismutases (SODs), glutathione peroxidases (GPOXs), and catalases (CATs) [29]. Albeit several activities can be attributed to different types of ROS and the enzymes controlling subsequent biological programs [30], an often subliminal assumption is that overall oxidative stress sensitivity or resistance is similar among different cell lines for different types of ROS, although only H2O2 induced stress is mainly investigated [31,32,33,34]. Little is known about differential effects, especially between H2O2 and HOCl, which are both likely to act in concert during inflammation and play a crucial role in the therapeutic efficacy of ROS/RNS-based therapy approaches, such as gas plasmas.
2. Materials and Methods
2.1. Gas Plasma Treatment and ROS Profiling
Plasma-derived deposition of hydrogen peroxide (H2O2) and hypochlorous acid (HOCl) was characterized for the kINPen plasma jet (neoplas, Greifswald, Germany) in the present study. Its generation of H2O2 was assessed in 50 mL of sodium chloride solution exposed to argon gas (99.999% purity; Air Liquide, Paris, France) plasma for 135 min at a flow rate of 5 standard liters per minute (slm). Quantification of HOCl was performed after 1 min exposure of 200 µL PBS to a helium–oxygen (HeO2; 99.999% purity; Air Liquide, France) plasma generated at a flow rate of 1 slm. Evaporated volume was supplemented with equal amounts of deionized water to maintain iso-osmolarity in both treatments. Liquid analysis was performed immediately after. H2O2 deposition was quantified using the titanyl sulfate assay. Briefly, 50 µL of the sample were mixed with 100 µL of titanyl sulfate, forming pertitanic acid upon reaction with H2O2. Its absorbance can be measured at 407 nm using a microplate reader (M200; Tecan, Männedorf, Switzerland). Argon gas plasma regimes generate high amounts of H2O2 but fail to produce HOCl. Generation of the latter was measured in samples exposed to an HeO2 plasma jet, and absolute concentrations were assessed using the taurine chloramine assay, as previously described [37]. Samples were mixed at 1:10 with taurine buffer. Immediately after, a developer was added consistent of sodium acetate, sodium iodide, and tetramethylbenzidine in dimethylformamide. Absorbance was measured at 645 nm using a microplate reader (M200; Tecan, Switzerland). Absolute concentrations were calculated against a standard curve, respectively.
2.2. Cell Culture and Oxidant Exposure
Two human leukemia cell lines were used in this study. Jurkat lymphocytes (ATCC: TIB-152) and THP-1 monocytes (ATCC: TIB-202) were cultured in RPMI 1640 cell culture medium supplemented with 1% penicillin/streptomycin, 1% L-glutamine, and 10% fetal bovine serum under standard conditions (37 °C, 5% CO2, 95% humidity). For exposure to oxidants, 2.5 × 10⁴ cells in 100 µL fully-supplemented cell culture medium were added to 96-well plates and treated with concentrations ranging from 0.2 µM to 3000 µM for H2O2 (Merck-Millipore, Darmstadt, Germany) and 100 µM to 5000 µM for HOCl (Sigma-Aldrich, Darmstadt, Germany).
2.3. Metabolic Activity and Viability
Eighteen hours after oxidant exposure, resazurin (100 µM) was added to the cells and incubated at 37 °C for 4 h. Resazurin (blue) is reduced to its fluorescent form resorufin (pink) by metabolically active cells, and fluorescence was quantified using the Infinite F200 plate reader (Tecan, Switzerland) at λex 535 nm and λem 590 nm. The concentration that reduces the metabolic activity by 20% (IC20) of H2O2 and HOCl was determined. In addition to metabolic activity, the cell viability was investigated using flow cytometry. One day after treatment, the cells were stained with 4′,6-diamidino-2-phenylindole (DAPI; BioLegend, San Diego, CA, USA) and measured using the CytoFLEX S flow cytometer equipped with a 405 nm laser and appropriate fluorescence filters (Beckman Coulter, Krefeld, Germany). Data were subsequently analyzed using Kaluza 2.1.1 (Beckman Coulter, Brea, CA, USA) analysis software.
2.4. Live-Cell Time-Lapse Fluorescence Microscopy
Live-cell imaging of apoptosis initiation was performed in Jurkat and THP-1 cells in a time course measurement over 12 h after treatment with respective IC20-inducing concentrations of H2O2 or HOCl in 96-well plates. To identify apoptotic cells, CellEvent caspase 3/7 detection reagent (ThermoFisher, Dreieich, Germany) was added to the wells 2 h after oxidant exposure. The plate was then placed in a high-content imaging device (Operetta CLS; PerkinElmer, Rodgau, Germany) pre-heated to 37 °C and set to 5% CO2 to provide optimal cultivation conditions for the cells during the measurement period. Images were acquired hourly with a 20× (NA: 0.4) air objective (Zeiss, Jena, Germany) using brightfield channel, digital phase contrast, and the λex 475 nm λem 525 ± 25 nm channel to detect activated caspases 3/7 via fluorescence of a DNA-binding dye. Image analysis was performed using the software Harmony 4.9 (PerkinElmer, Germany).
2.5. Glutathione Content
The determination of glutathione content of its reduced (GSH) and oxidized (GSSG) form was performed for untreated Jurkat and THP-1 cells and cells exposed to the respective IC20 of H2O2 or HOCl using the GSH/GSSG-Glo Assay kit (Promega, Walldorf, Germany) according to the manufacturer’s protocol in cell lysates. The resulting luminescence was quantified using the Infinite F200 plate reader (Tecan, Switzerland). With this assay, total glutathione and the amount of GSSG were quantified, based on which the reduced GSH was calculated. In addition, GSH/GSSG ratios were calculated as follows:
2.6. siRNA-Mediated Protein Knockdown
Jurkat and THP-1 cells were transfected with siRNAs by electroporation using the Amaxa nucleofector device in combination with the Cell Line Nucleofector Kit V (both Lonza, Germany). First, 1 × 10⁶ cells were suspended in 100 µL of specific transfection buffer and then 1 µg of respective siRNA was added. The mixture containing either no siRNA (mock), a non-targeting control (luciferase), or a targeting siRNA (catalase, HMOX-1, or IL-8; all Sigma-Aldrich, Germany) was transferred to a special electroporation cuvette and treated with program G-010 in the Amaxa nucleofector instrument. Subsequently, the transfected cell solution was transferred to a fresh, pre-warmed cell culture medium in a 96-well plate and incubated for 24 h. Subsequently, the cells were exposed to the respective IC20 concentrations of H2O2 or HOCl or left untreated. After 18 h of incubation, metabolic activity was determined and normalized to untreated controls of the respective transfection condition. Protein knockdown was validated by Western blot analysis. For this, transfected cells were pelleted and lysed. Proteins were degraded in 100 µL NuPAGE LDS Sample Buffer (ThermoFisher, Germany) containing 10% Dithiothreitol (DTT) for 5 min at 96 °C. Then, 40 µL were transferred to agarose gels, with proteins separated according to their mass by electrophoresis. Subsequently, the proteins were blotted on a membrane which was then blocked using Roti-Block solution (Carl Roth, Karlsruhe, Germany) and incubated overnight with primary murine monoclonal antibodies against β-actin and the target proteins (catalase, HO-1, and IL-8; all SantaCruz, Cloppenburg, Germany). This was followed by washing and incubation with secondary anti-mouse antibodies conjugated with horseradish peroxidase (HRP; SantaCruz, Germany). By adding a detection reagent containing luminol/enhancer and stable peroxide SuperSignal (both ThermoFisher, Germany), the HRP-mediated luminescence was imaged (ImageQuant LAS 4000; GE Healthcare, Glattbrugg, Switzerland).
3. Results
3.1. Jurkat and THP-1 Cells Differ in Their Sensitivity to H2O2 and HOCl Exposure
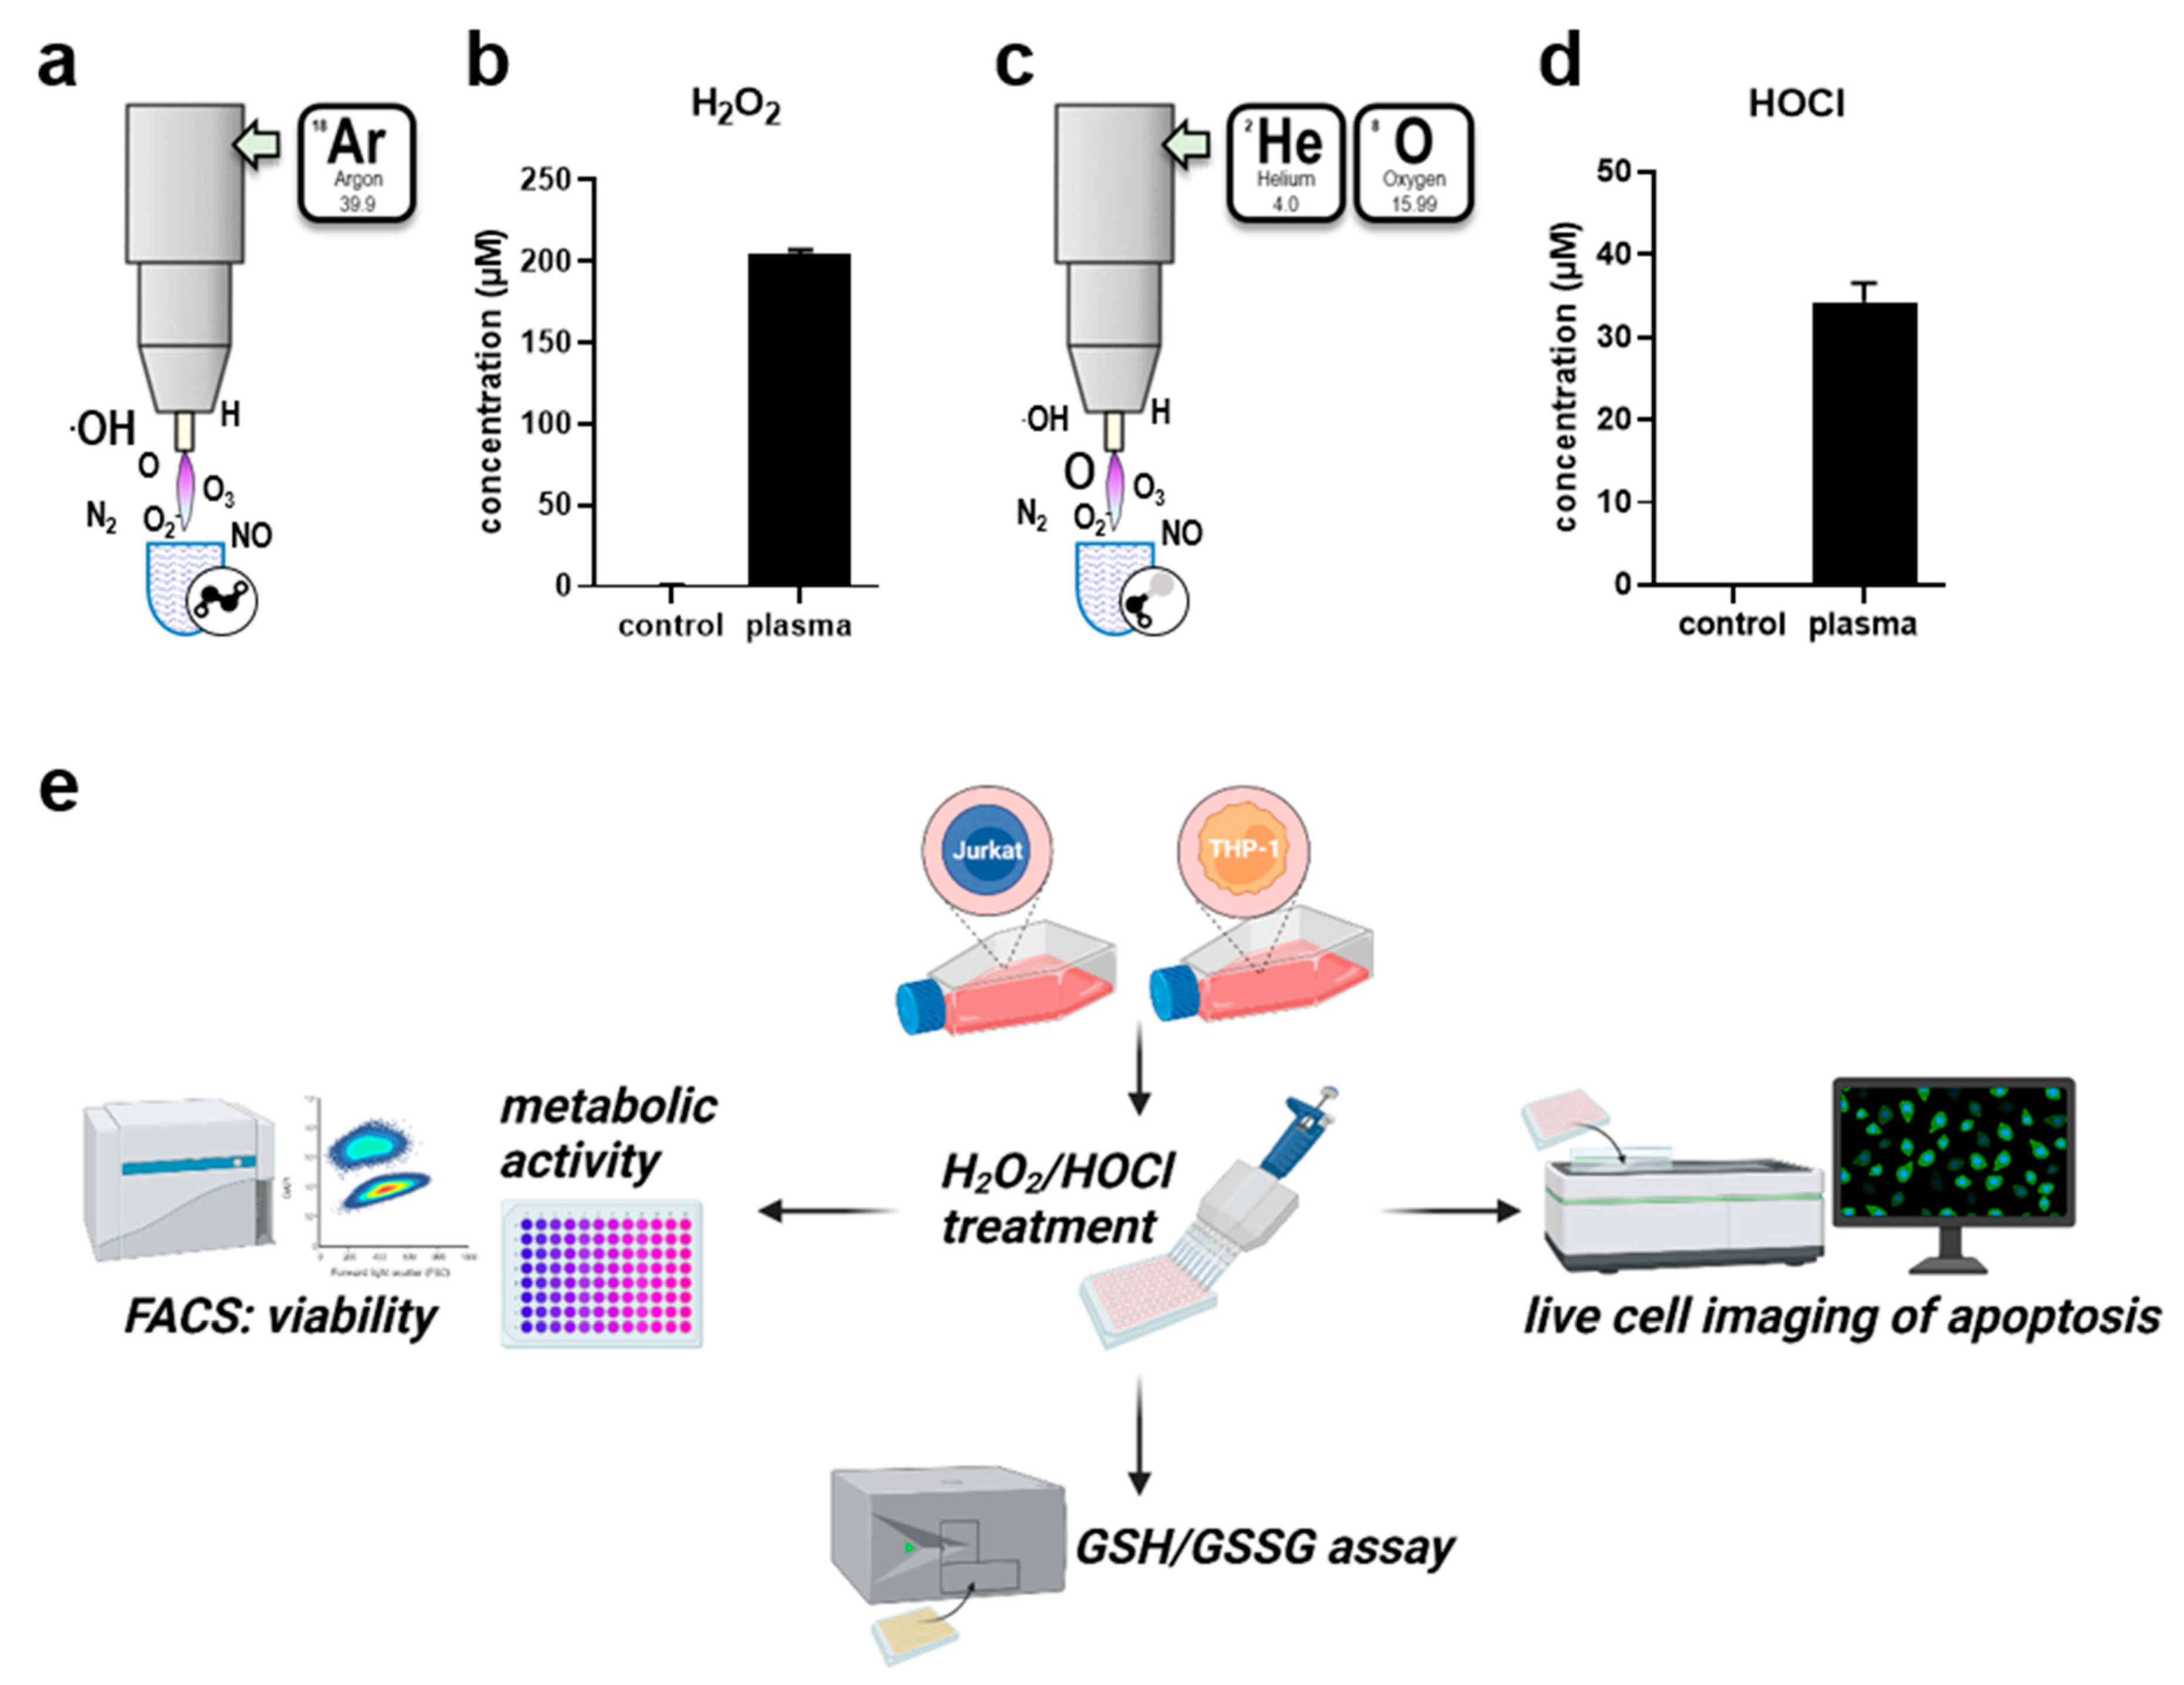
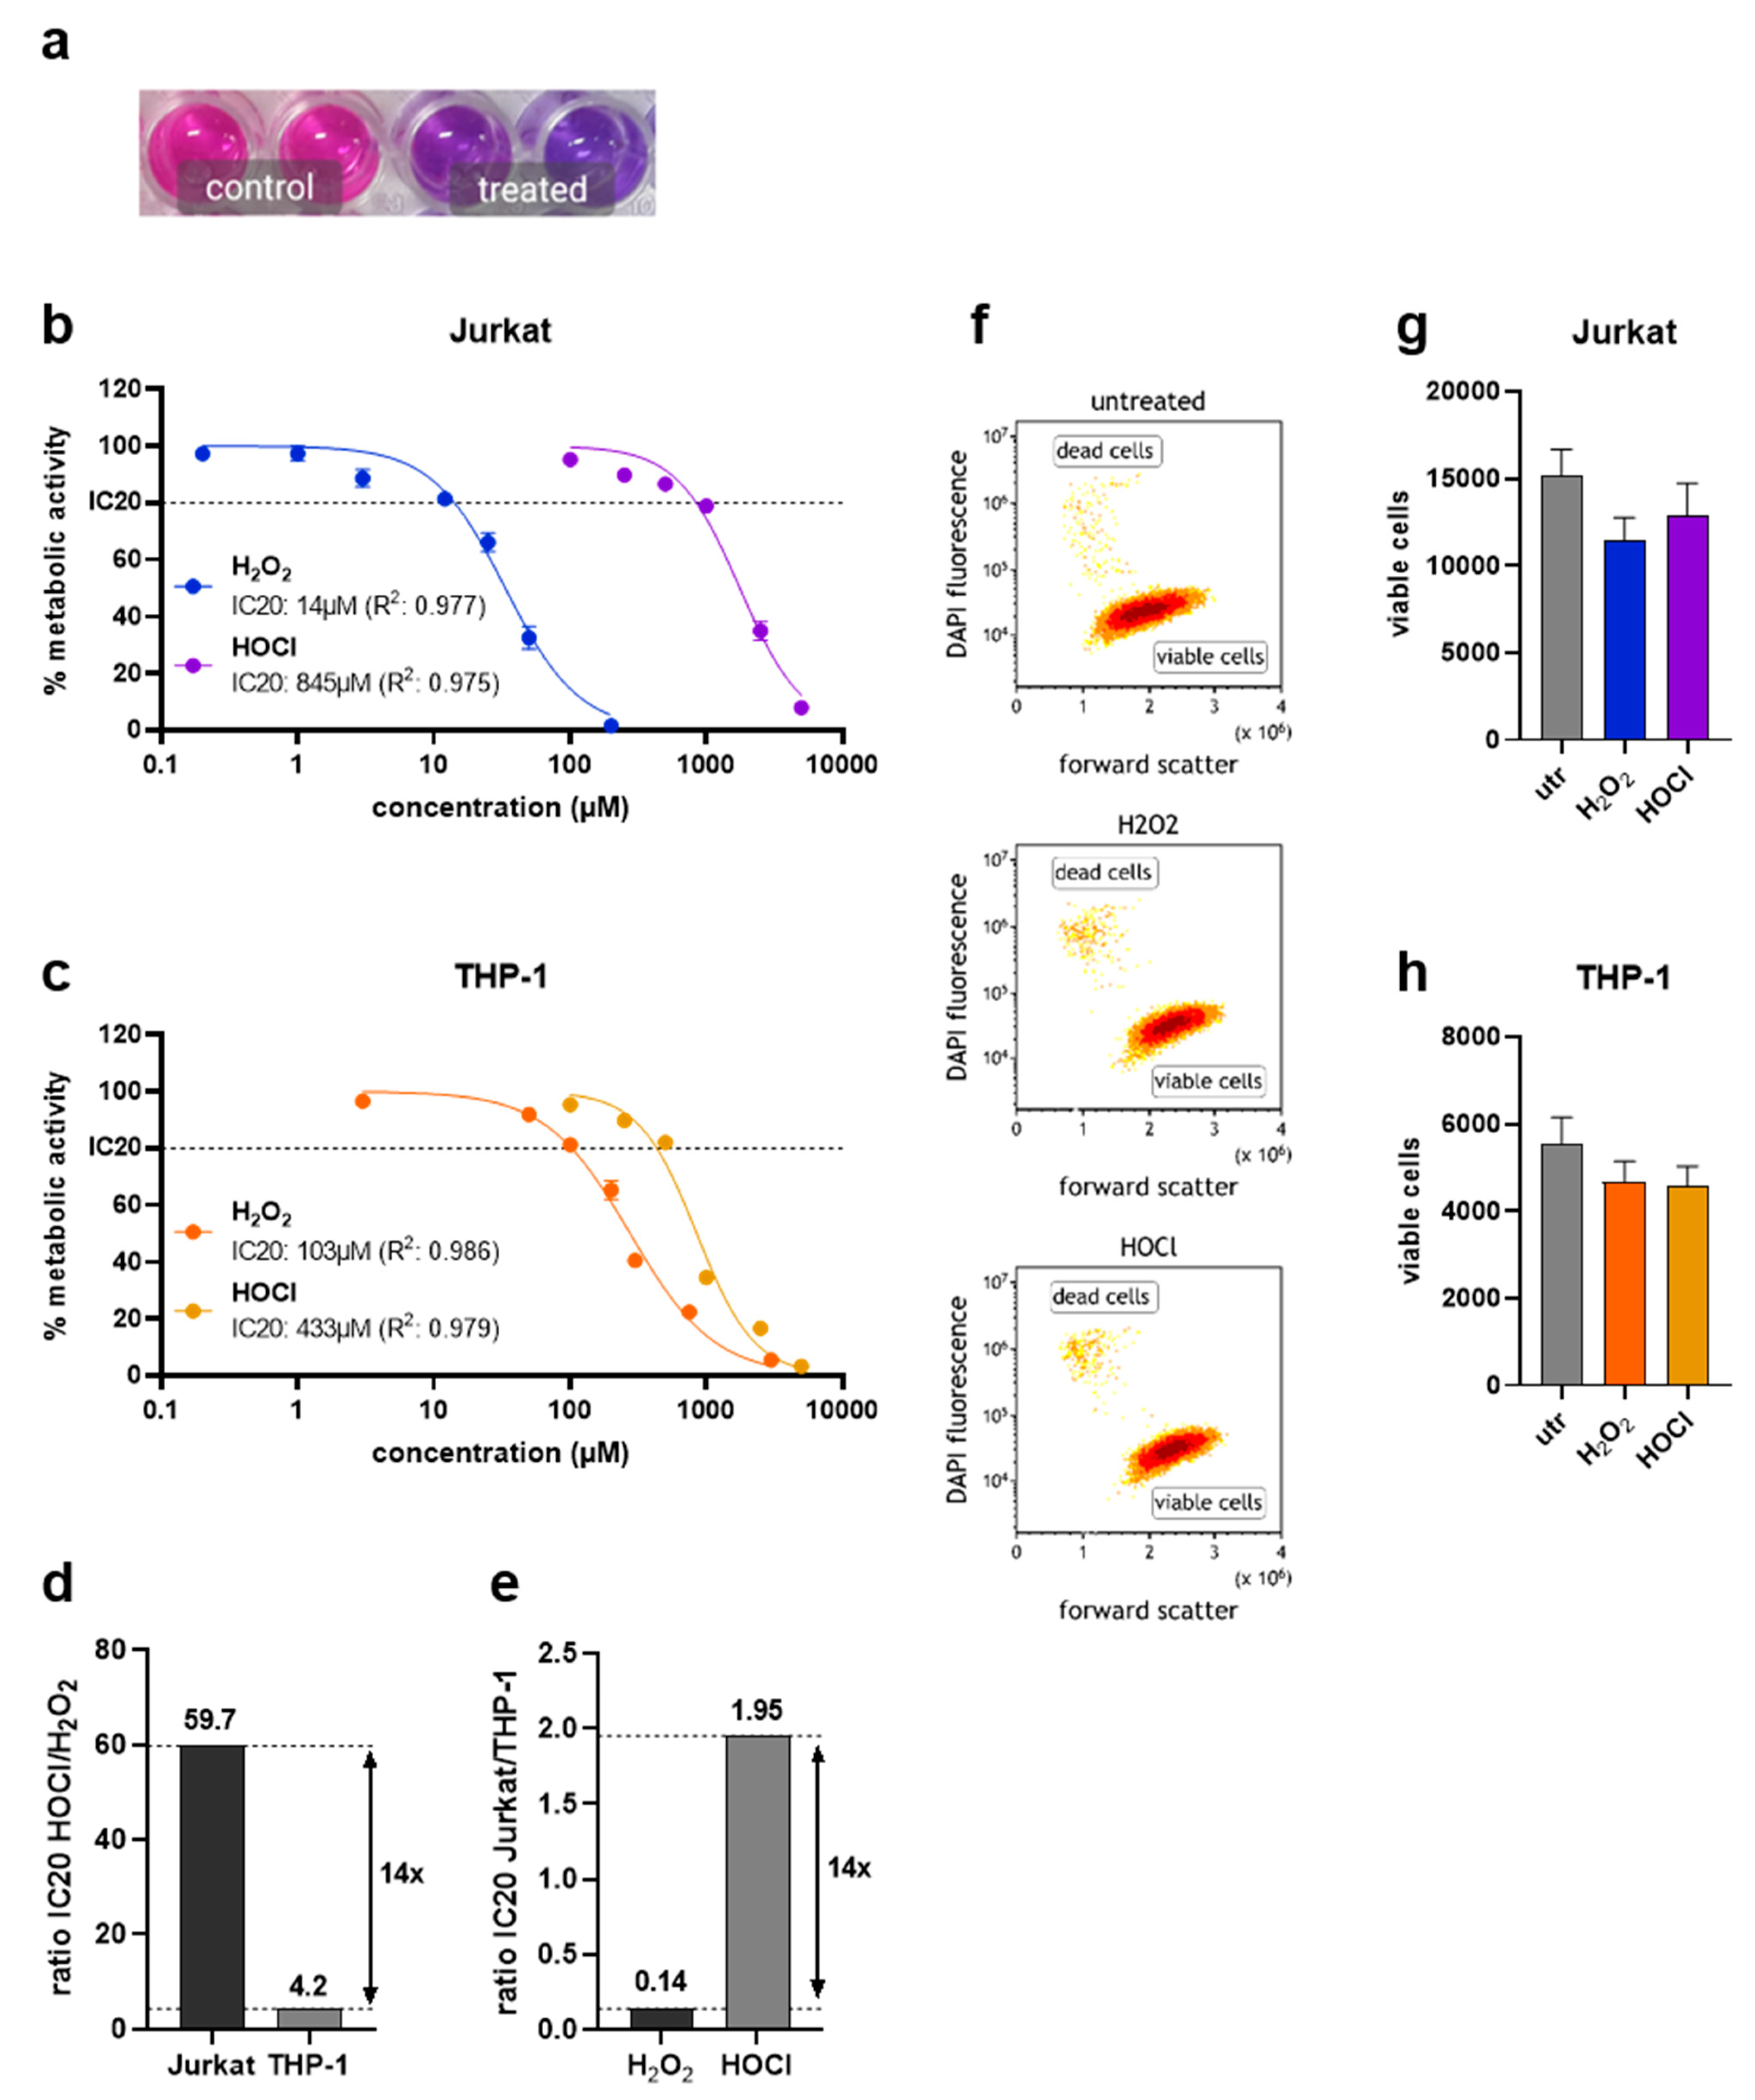
Besides their roles in inflammation and involvement in the pathology of several diseases, H2O2 and HOCl can be generated by gas plasmas for therapeutic purposes which are investigated and applied in dermatological and oncological treatment regimes. Plasmas generate a variety of short-lived species, including hydroxyl radicals or singlet oxygen, in the gas phase. Their high reactivity leads to quick deterioration and formation of secondary long-lived species in liquids. The profile of species generated in the liquid can partially be influenced by providing different feed gases. As such, the liquid chemistry can be tuned between an H2O2- or HOCl-rich regime, which are considered as main biological effectors, if bulk liquids surround cells. Exposure of sodium chloride solutions to an argon gas plasma (Figure 1a) resulted in the deposition of 200 µM H2O2 in sodium chloride solutions (Figure 1b). In contrast, the usage of helium–oxygen as feed gas (Figure 1c) generated HOCl in treated liquids (Figure 1d). The present study investigated differences in the responses to isolated H2O2 and HOCl-induced oxidative stress in Jurkat and THP-1 cells using various methods (Figure 1e). To assess the difference in metabolic activity, a resazurin-based assay was used (Figure 2a) and employed to calculate the IC20 to compare the toxicity of both oxidants investigated. Jurkat cells showed relatively high sensitivity to H2O2 and relatively low sensitivity to HOCl (Figure 2b). In contrast, THP-1 cells were somewhat less sensitive to H2O2 but more susceptible to HOCl than Jurkat cells (Figure 2c). Interestingly, the cell lines differed in their absolute and relational sensitivity to H2O2 or HOCl. This was shown by calculating the ratios of H2O2 to HOCl IC20 values (Figure 2d) and the ratios of IC20 values identified in Jurkat to THP-1 cells, respectively (Figure 2e). To verify that the reduced metabolic activity came with a certain degree of cytotoxicity, flow cytometry was employed using DAPI to discriminate viable from dead cells (Figure 2f). In both cell lines, the number of viable cells was reduced one day after treatment with respective IC20 concentrations of H2O2 or HOCl (Figure 2g,h).
3.2. Apoptosis Onset Differs between Cell Types, and H2O2 and HOCl Exposure
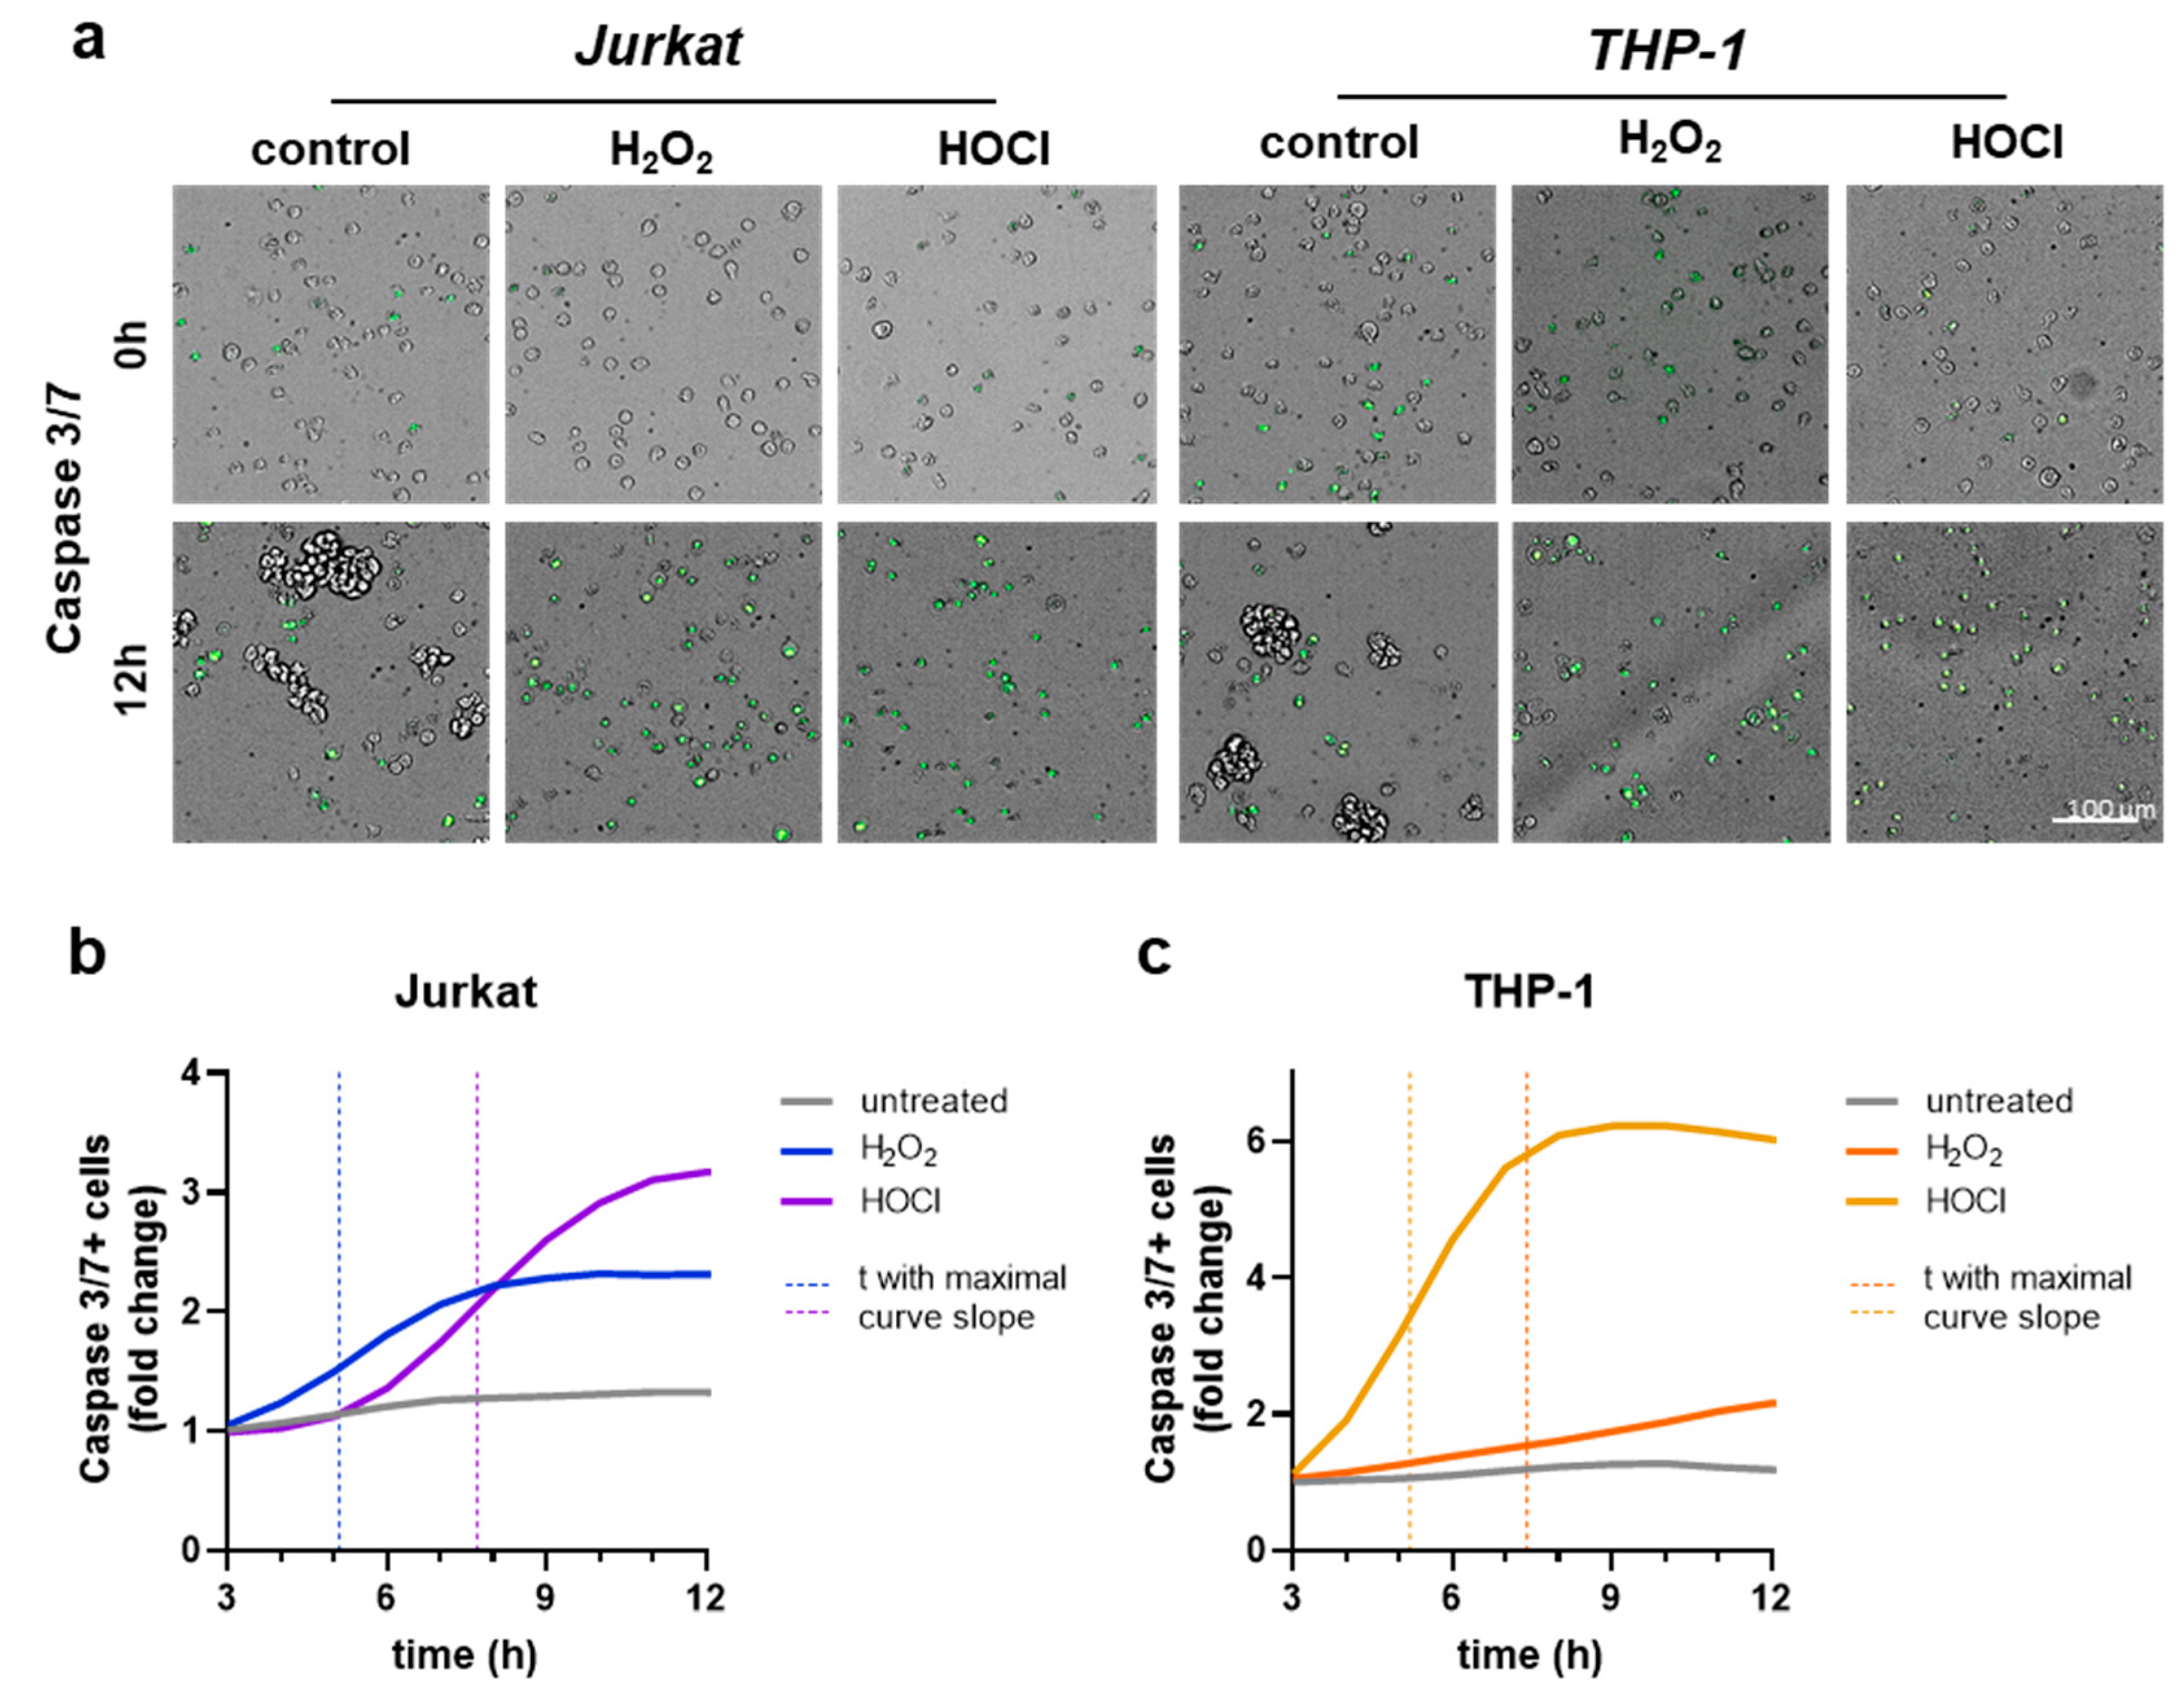
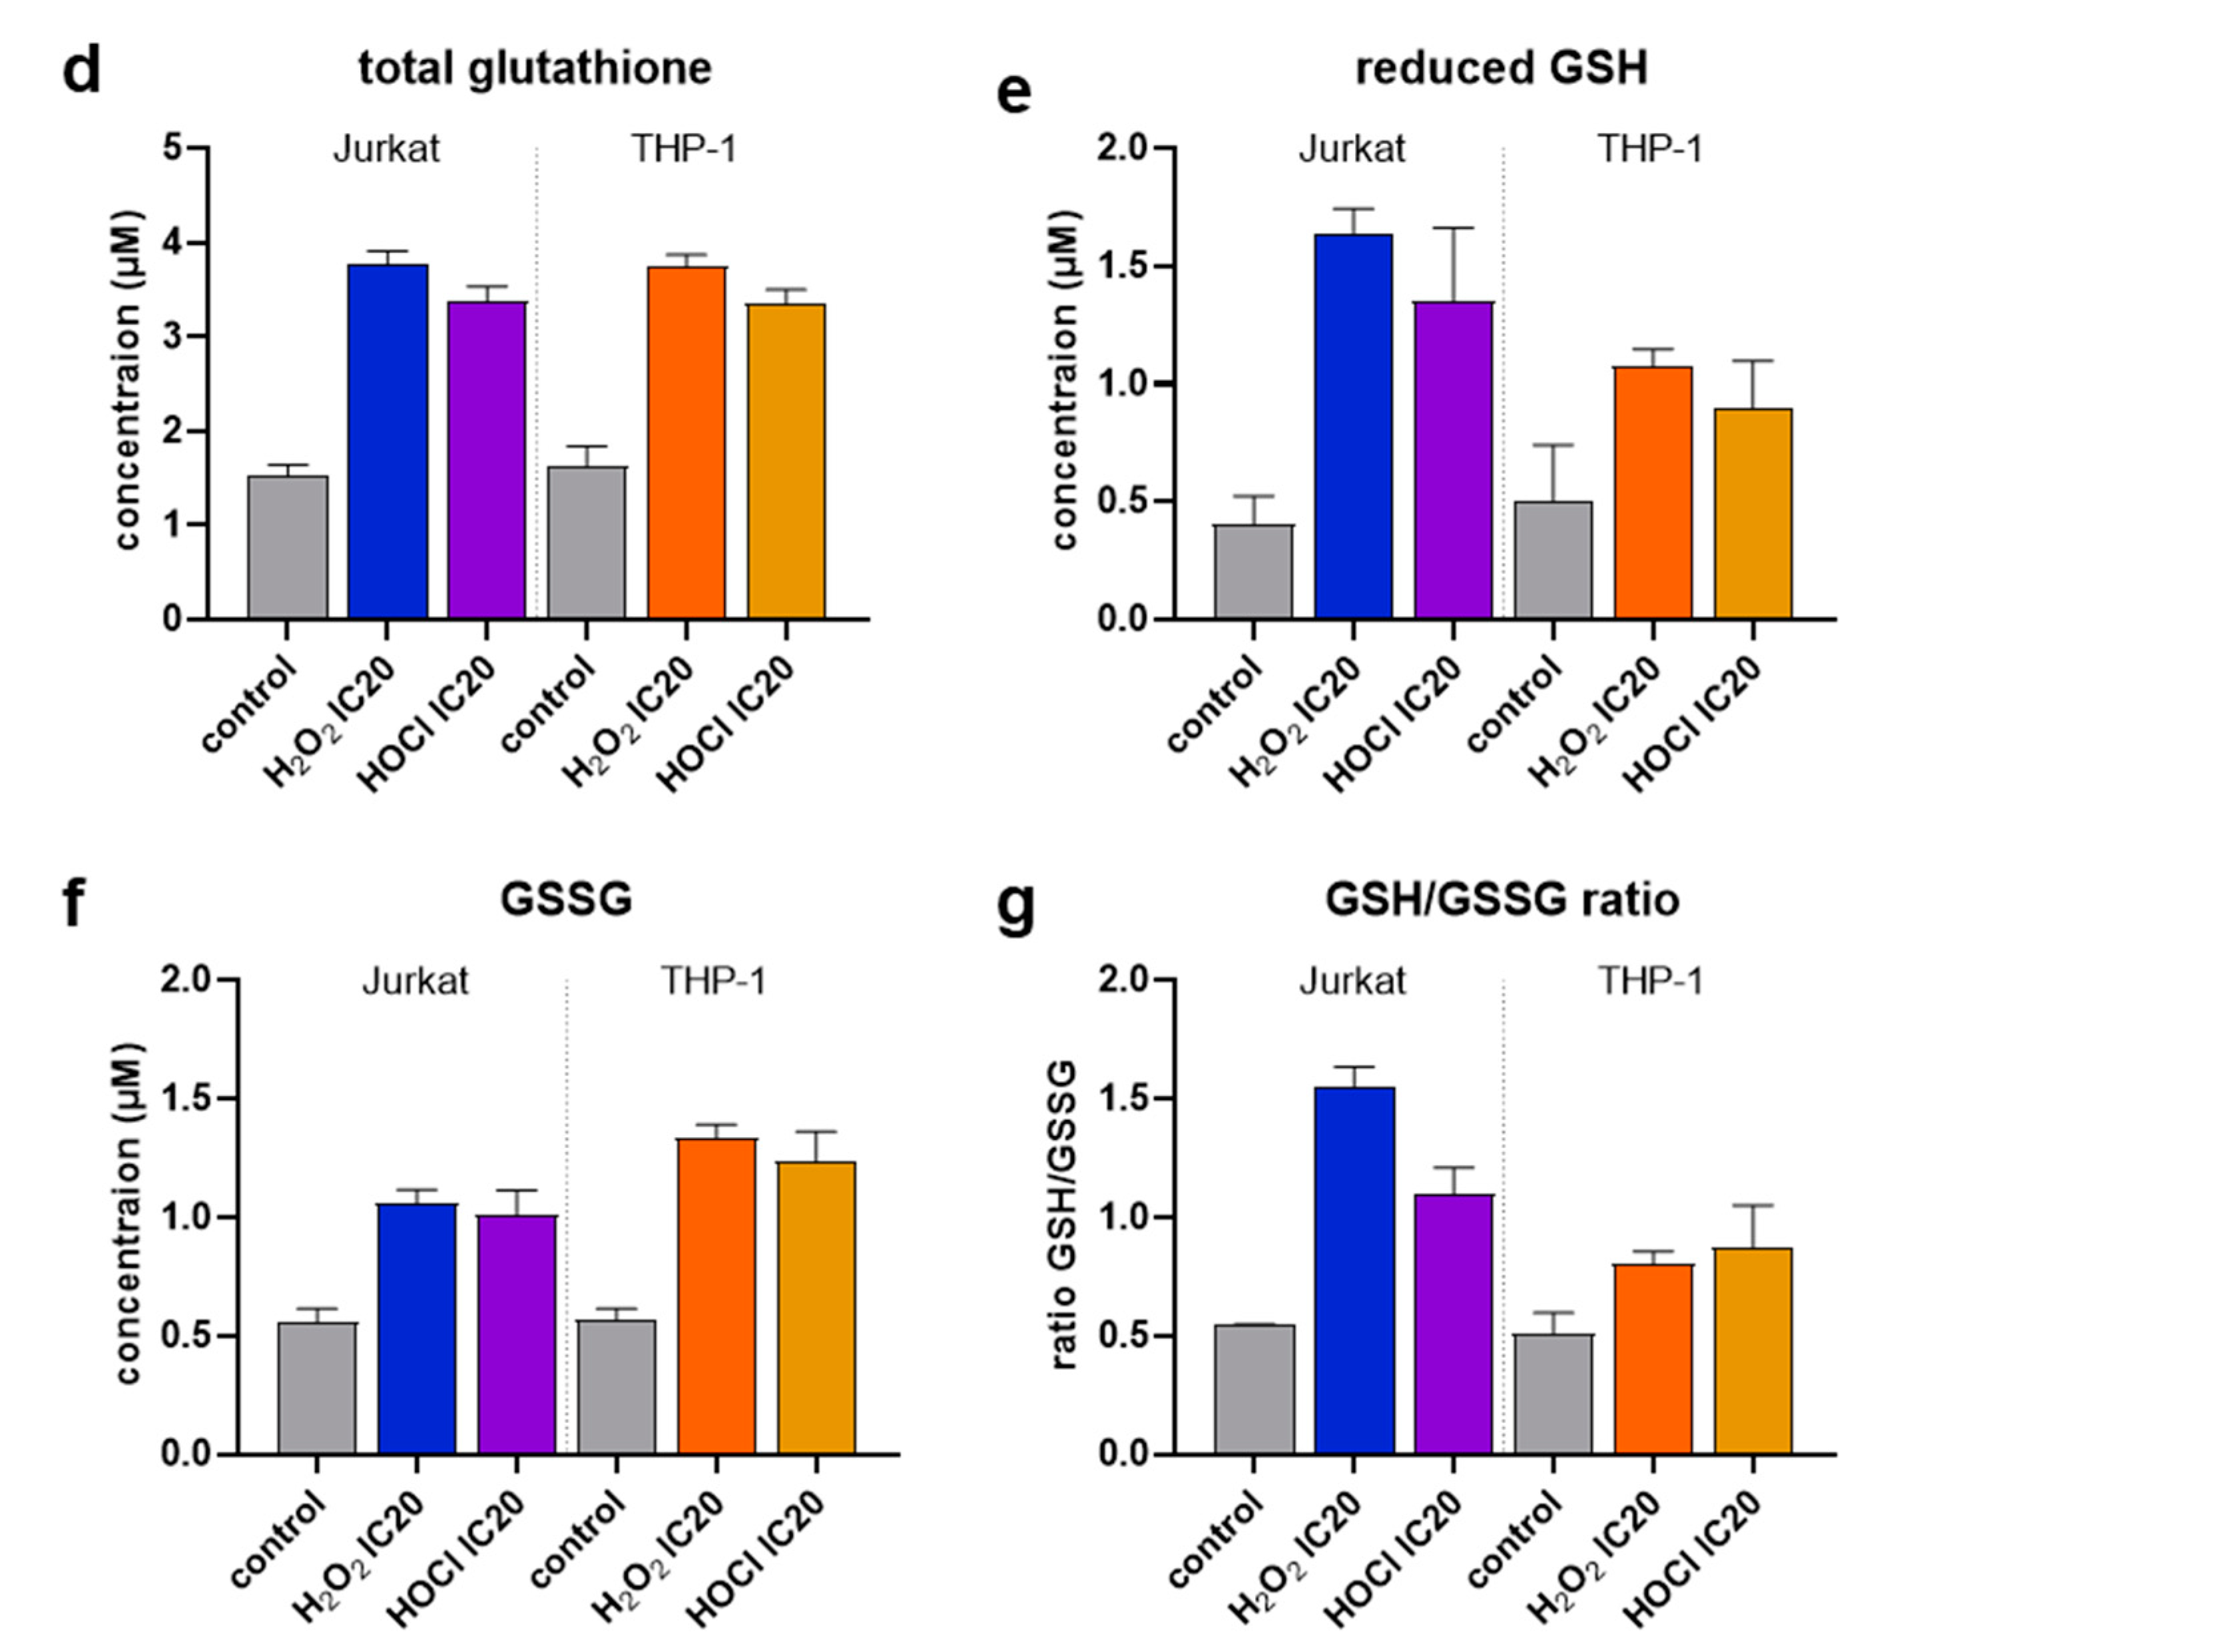
To dynamically investigate the potential differences in the timing of cellular demise in both cell lines and oxidants, we used live-cell time-lapse fluorescence microscopy and kinetic apoptosis assessment. As expected, the data indicated apoptotic cells in both Jurkat and THP-1 cells (Figure 3a). Kinetically, in Jurkat cells, the H2O2 treatment led to an earlier onset (maximal curve slope: 5.1 h) of apoptosis compared to HOCl (maximal curve slope: 7.7 h) treatment (Figure 3b). In THP-1 cells, the H2O2 treatment showed a slower (maximal curve slope: 7.4 h) and less pronounced increase in apoptosis (Figure 3c). In contrast, the HOCl treatment induced a fast (maximal curve slope: 5.2 h) and substantial increase in apoptosis (Figure 3c). For direct comparison, the time point with a maximum increase of apoptosis (maximal slope of the curve) was determined. These results reiterated the above findings (Figure 3b), suggesting greater sensitivity of Jurkat cells to H2O2. In contrast, THP-1 cells were more sensitive to HOCl when considering the maximal curve slopes in response to the oxidants. To investigate other differences between Jurkat and THP-1 cells in their reaction to oxidative stress caused by H2O2 or HOCl, changes in glutathione content of the cells were measured after treatment with respective IC20 concentrations. The glutathione content was also evaluated separately for the reduced (GSH) and the oxidized form (GSSG), with the ratio of both calculated. In untreated controls, there seemed to be no differences in the basal total glutathione content between the two cell lines investigated (Figure 3d). Both H2O2 and HOCl treatment resulted in an increase to a similar extent in total glutathione content in both cell lines, independent of the oxidant in question. Jurkat cells reacted to IC20 H2O2 or HOCl exposure with a drastically increased generation of reduced GSH, while this was less pronounced in THP-1 cells (Figure 3e). Reversely, the presence of GSSG in exposed Jurkat cells was markedly enhanced, while this was even more the case in THP-1 cells (Figure 3f). With regard to the often-shown GSH to GSSG ratio (GSH/GSSG), there was a 3-fold amplification for H2O2 treatment and 2-fold for HOCl exposure in Jurkat cells (Figure 3g). The GSH/GSSG ratio in THP-1 cells was less increased in response to oxidant exposure but still noticeably elevated.
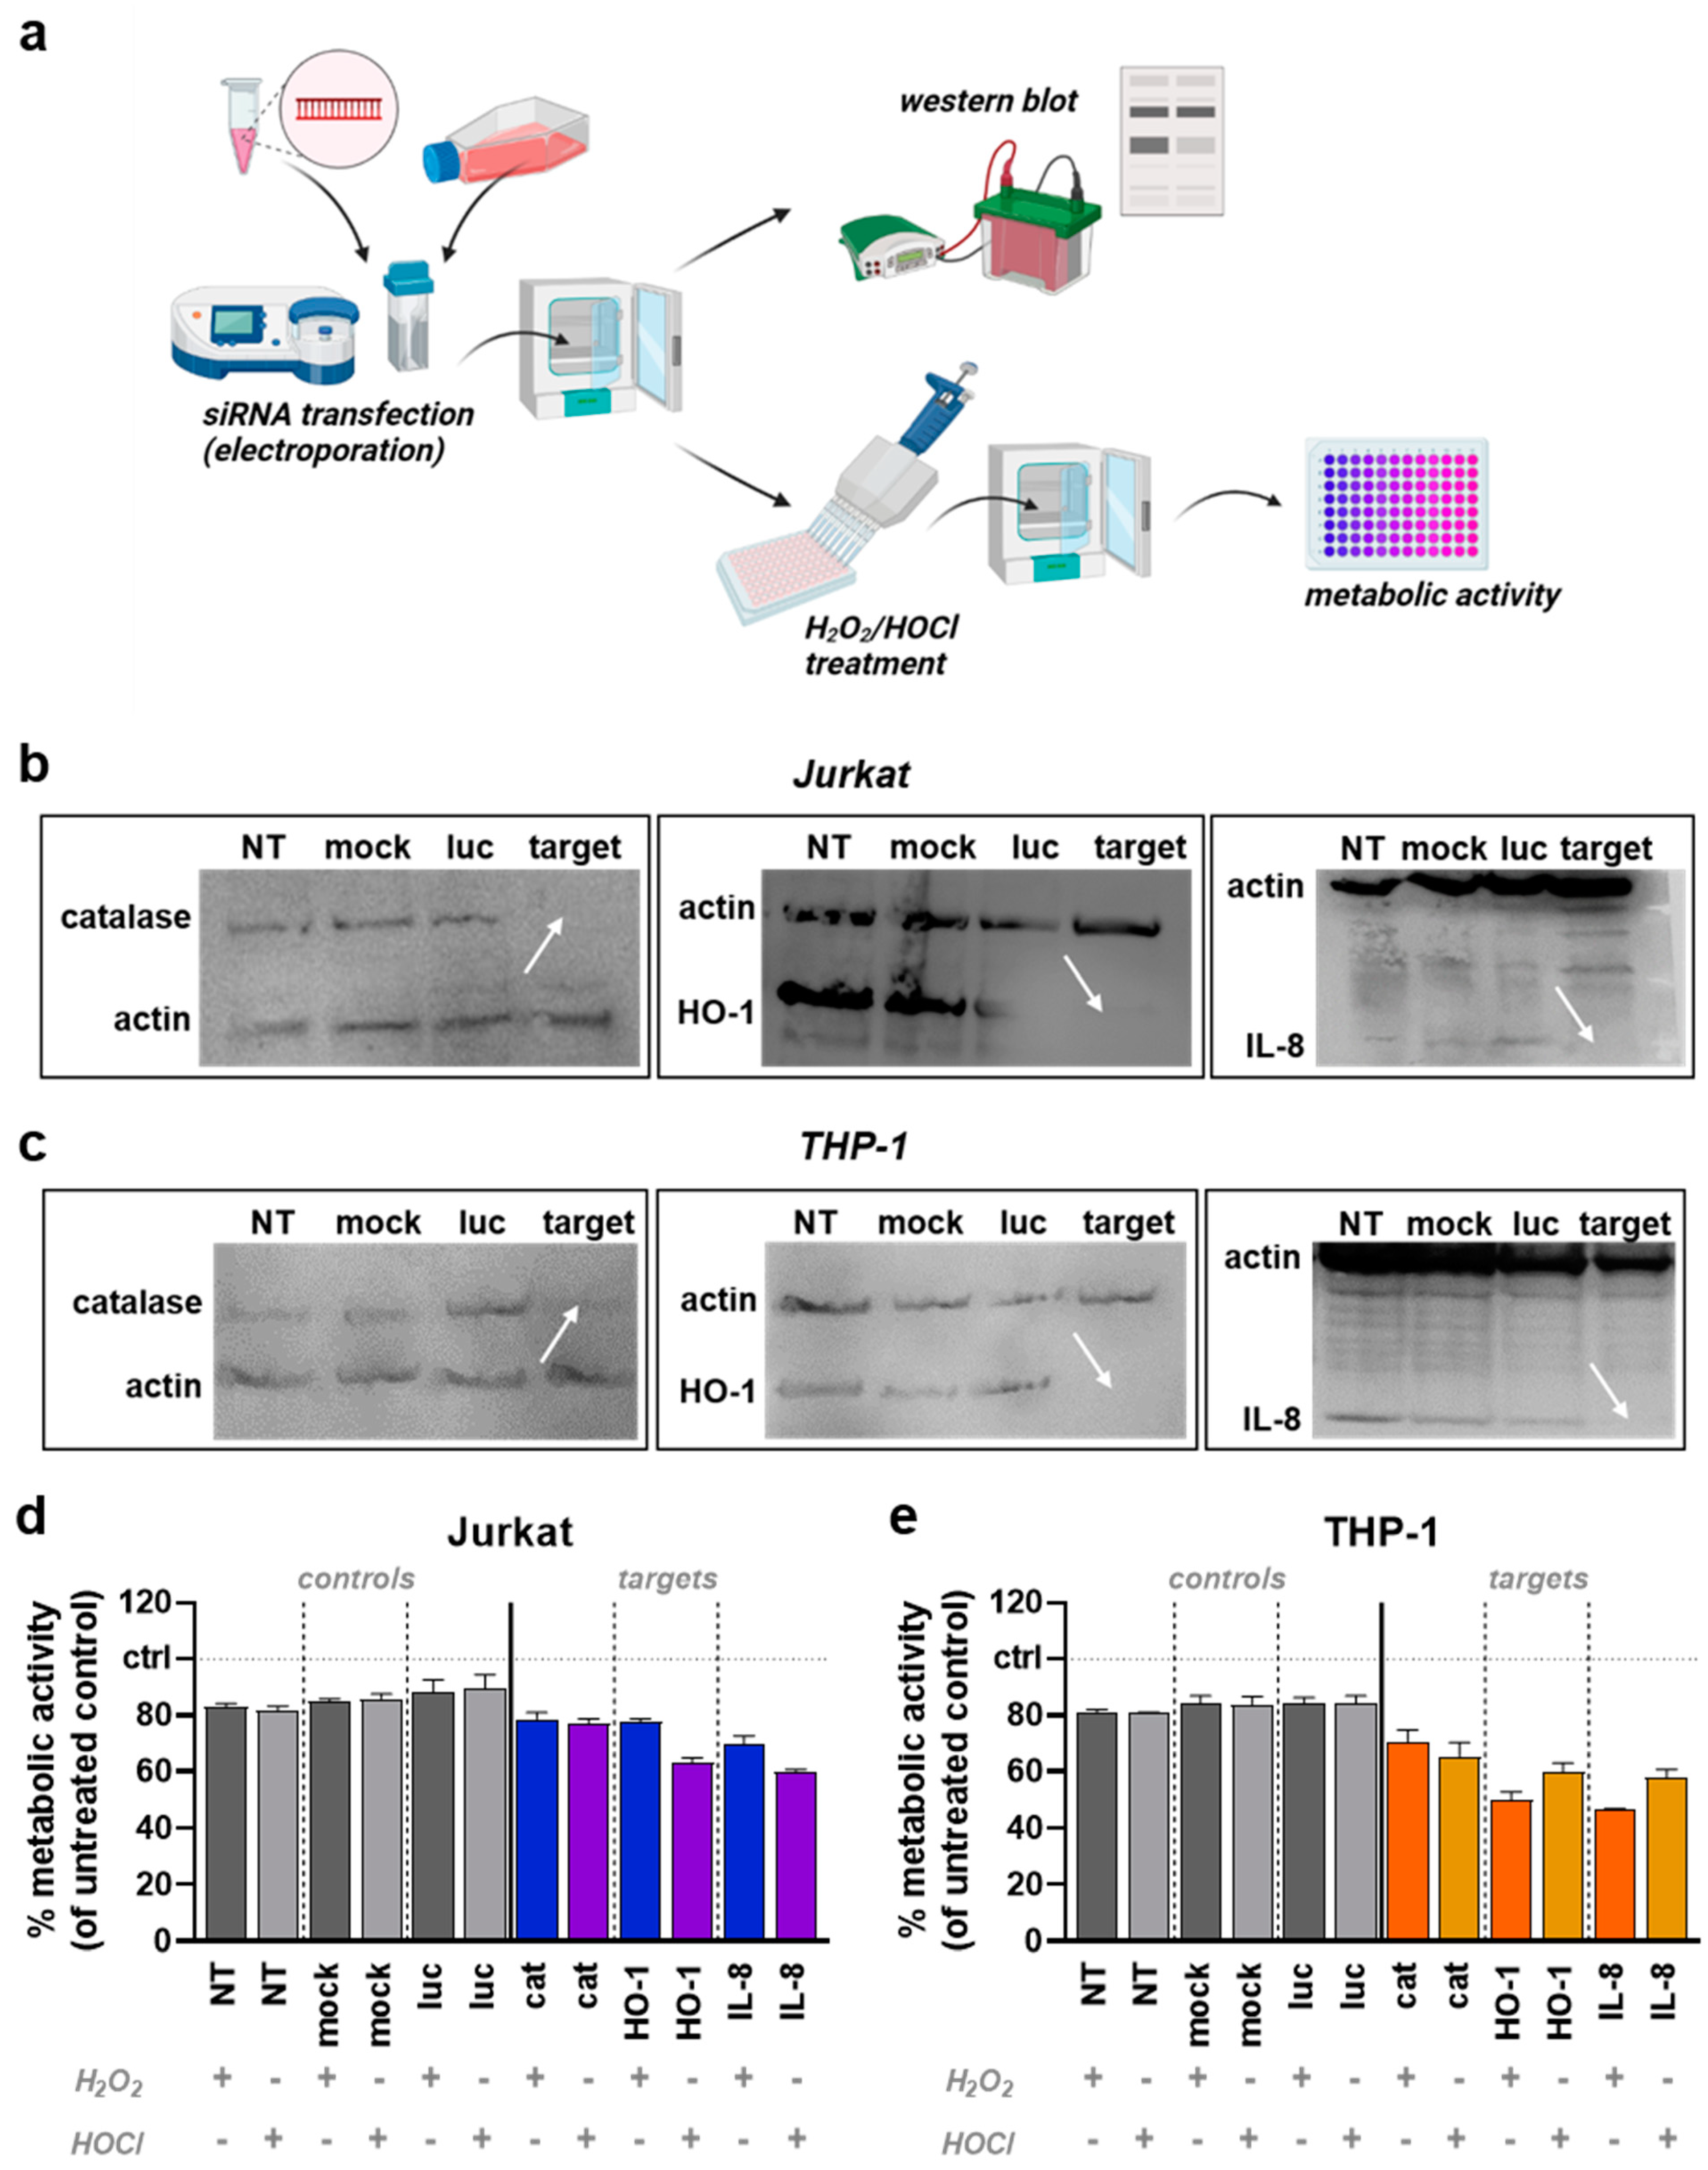
3.3. HO-1 and IL-8 Knockdown Modify Jurkat and THP-1 Cell Oxidant Sensitivity
A previous study compared the baseline expression of genes relevant for redox regulation and antioxidant detoxification between Jurkat and THP-1 cells [38]. Catalase (CAT), heme oxygenase 1 (HMOX-1), and interleukin (IL)-8 gene expression were found to be markedly elevated in THP-1. Therefore, the role of the three corresponding proteins in the different responses to oxidative stress of Jurkat and THP-1 cells was investigated by siRNA-mediated transient protein knockdown (Figure 4a). Knockdown efficiency was validated 24 h after transfection in Jurkat (Figure 4b) and THP-1 cells (Figure 4c) by Western blotting. The day after siRNA-mediated protein knockdown, the cells were exposed to H2O2 or HOCl at the respective IC20 concentrations, and the metabolic activity of the cells was assessed. For comparison and excluding cytotoxic effects of the transfection process, metabolic activity was normalized to the untreated controls of the respective transfection condition. Since IC20 oxidant concentrations were used for treatment, the metabolic activity of the different controls was at approximately 80%. In Jurkat cells (Figure 4d), knockdown of catalase caused no visible additive effect with both H2O2 and HOCl treatment. The knockdown of HO-1 showed no effect regarding H2O2 exposure but an increased cytotoxic effect with HOCl treatment. Knockdown of IL-8 resulted in slightly increased cytotoxicity after H2O2 treatment and an even more pronounced effect with HOCl. In contrast, there were elevated cytotoxic effects for all three knockdown targets in THP-1 cells (Figure 4e). Catalase knockdown had only modest effects. For knockdown of HO-1 and IL-8, the cytotoxic effect was more potent than for catalase and, in contrast to Jurkat cells, more pronounced for H2O2 than for HOCl treatment.
4. Discussion
Until now, little is known about the molecular mechanisms and preconditions crucial for sensitivity or resistance towards diverse ROS types. Herein, we aimed to characterize further the different sensitivities of Jurkat and THP-1 cells towards the oxidants H2O2 and HOCl.
Generally, Jurkat cells were more sensitive to H2O2 than THP-1, whereas the THP-1 cells were more sensitive to HOCl than Jurkat. Furthermore, the Jurkats had a more pronounced difference between IC20 concentrations of HOCl and H2O2 than the THP-1 cells. Cytotoxic effects of ROS, such as H2O2 and HOCl, can be caused by direct oxidation of cellular proteins, lipids, and nucleic acids [39], as well as through modification of signaling molecules inducing downstream apoptotic pathways [40,41]. Regarding the mode of cell death, we showed that H2O2 and HOCl-activated caspase 3 and 7 mediated apoptosis in both cell lines at different rates and to different extents. HOCl is known to react with superoxide anion to form the apoptosis-inducing hydroxyl radical [42]. Differences in apoptosis activation in different cell lines might be due to the divergent availability of superoxide anions mediated either through the formation by NADPH oxidases (NOX) or through scavenging by superoxide dismutase (SOD).
Moreover, Jurkat and THP-1 had similar basal GSH/GSSG ratios, and both treatments disturbed the GSH/GSSG ratio in both cell lines. However, THP-1 had a more substantial increase in GSSG than Jurkat cells for both treatments, which was the reverse of GSH levels. In general, the GSH/GSSG ratio is regarded as a vital indicator of the cells’ redox state [43,44]. Detoxification of H2O2 can be achieved via glutathione peroxidases (GPx), catalyzing the oxidation of reduced glutathione (GSH) with H2O2 to glutathione disulfide (GSSG) [45,46]. Our findings that THP-1 cells show higher GSSG levels after H2O2 exposure while being less susceptible to H2O2-induced toxicity indicate that this cell line uses the GPx-mediated ROS scavenging more effectively than Jurkat cells.
In Jurkat cells, HO-1 and IL-8 protein knockdown augmented ROS-mediated toxicity stronger with HOCl treatment, whereas in THP-1 cells, the toxicity increase was more pronounced with H2O2. A knockdown of catalase could only slightly augment ROS cytotoxicity in THP-1 cells. The enzyme heme oxygenase 1 (HO-1) was shown to have a cytoprotective effect by reducing oxidative stress and inflammation processes [47]. HO-1 mainly degrades free heme to iron (Fe), carbon monoxide (CO), and biliverdin [48]. The induction of HO-1, transcriptionally regulated by Nrf2, by oxidative stress is associated with ferritin induction [49]. Ferritin is an iron sequestrant associated with protection from oxidative stress-induced cellular damage [50,51]. However, since free heme does not appear to occur in cell cultures, the mechanisms of its protective role in vitro remain unclear.
The pro-inflammatory cytokine interleukin 8 (IL-8) is produced by several cell types, such as immune cells, fibroblasts, and endothelial cells, leading to neutrophil recruitment [52]. IL-8 secretion is known to be increased by oxidative stress [53] transcriptionally regulated by nuclear factor-kappaB (NF-κB) [54], but little is known about its detailed role in mediating resistance towards ROS-induced stress. A retrospective correlation analysis of oxidatively stressed cells of previous studies further revealed a good correlation of relative IL-8 concentrations with the release of IL-1β and IL-6 after plasma treatment (Supplementary Figure S1) which might serve as additional targets in future studies.
Our data suggest that both HO-1 and IL-8 have important protective roles in mediating HOCl resistance in Jurkat, as well as H2O2 resistance in THP-1 cells. Given their pivotal role in inflammation and disease, this finding is of major importance in redox biology research. Furthermore, the present study might spur novel research lines, shedding light on mechanisms that decide whether and how tumor cells succumb to plasma-mediated oxidative stress in response to different feed gas regimes.
5. Conclusions
In this study, we used two leukemia cell lines, Jurkat and THP-1, as a model to examine the differential effects of two different ROS types depending on the cell type. We showed that the cells’ sensitivity towards H2O2 and HOCl, as well as caspase activation kinetics, behave divergently in these cell lines. Matching this, our findings indicate differential effects of heme oxygenase 1 and interleukin 8, with both mediating oxidant protection but to different extents depending on cell and ROS type. Further investigation of other factors and the precise signaling pathways that mediate differential ROS sensitivity is needed to fully understand these results, indicating that sensitivity or resistance to oxidative stress of one cell line cannot be assumed to be the same for all ROS types.
Supplementary Materials
The following supporting information can be downloaded at: https://www.mdpi.com/article/10.3390/app12157429/s1, Figure S1: Plasma-induced IL-8 release correlates with release of IL-1β and IL-6. Pearson’s correlation analysis of plasma-induced interleukin (IL-)8 release with IFNγ, IL-1β, IL-6, IL-10, and TNFα.
Author Contributions
Conceptualization, S.B.; methodology, L.M. and S.B.; software, D.S. and L.M.; formal analysis, D.S.; resources, S.B.; data curation, D.S. and L.M.; writing—original draft preparation, D.S. and S.B.; writing—review and editing, L.M.; visualization, D.S., L.M., and S.B.; supervision, S.B.; project administration, S.B.; funding acquisition, S.B. All authors have read and agreed to the published version of the manuscript.
Funding
This work was funded by the Federal German Ministry of Education and Research (BMBF), grant numbers 03Z22DN11 and 03Z22Di1.
Institutional Review Board Statement
Not applicable.
Informed Consent Statement
Not applicable.
Data Availability Statement
Data are available from the corresponding author upon reasonable request.
Acknowledgments
The authors acknowledge Felix Niessner and Maxi Lippert for technical assistance.
Conflicts of Interest
The authors declare no conflict of interest regarding the publication of this paper.
References
- Sies, H.; Jones, D.P. Reactive oxygen species (ros) as pleiotropic physiological signalling agents. Nat. Rev. Mol. Cell Biol. 2020, 21, 363–383. [Google Scholar] [CrossRef] [PubMed]
- Bedard, K.; Krause, K.H. The nox family of ros-generating nadph oxidases: Physiology and pathophysiology. Physiol. Rev. 2007, 87, 245–313. [Google Scholar] [CrossRef] [PubMed]
- Aruoma, O.I. Free radicals, oxidative stress, and antioxidants in human health and disease. J. Am. Oil Chem. Soc. 1998, 75, 199–212. [Google Scholar] [CrossRef] [PubMed]
- Sharma, K. Obesity and diabetic kidney disease: Role of oxidant stress and redox balance. Antioxid. Redox Signal. 2016, 25, 208–216. [Google Scholar] [CrossRef]
- Jiang, J.X.; Torok, N.J. Nadph oxidases in chronic liver diseases. Adv. Hepatol. 2014, 2014, 742931. [Google Scholar] [CrossRef] [Green Version]
- Nogueira, V.; Hay, N. Molecular pathways: Reactive oxygen species homeostasis in cancer cells and implications for cancer therapy. Clin. Cancer Res. 2013, 19, 4309–4314. [Google Scholar] [CrossRef] [Green Version]
- Boukhenouna, S.; Wilson, M.A.; Bahmed, K.; Kosmider, B. Reactive oxygen species in chronic obstructive pulmonary disease. Oxid. Med. Cell. Longev. 2018, 2018, 5730395. [Google Scholar] [CrossRef] [Green Version]
- Cenini, G.; Lloret, A.; Cascella, R. Oxidative stress in neurodegenerative diseases: From a mitochondrial point of view. Oxid. Med. Cell. Longev. 2019, 2019, 2105607. [Google Scholar] [CrossRef] [Green Version]
- De Deken, X.; Corvilain, B.; Dumont, J.E.; Miot, F. Roles of duox-mediated hydrogen peroxide in metabolism, host defense, and signaling. Antioxid. Redox Signal. 2014, 20, 2776–2793. [Google Scholar] [CrossRef]
- Winterbourn, C.C.; Kettle, A.J. Redox reactions and microbial killing in the neutrophil phagosome. Antioxid. Redox Signal. 2013, 18, 642–660. [Google Scholar] [CrossRef]
- Hawkins, C.L. Hypochlorous acid-mediated modification of proteins and its consequences. Essays Biochem. 2020, 64, 75–86. [Google Scholar] [CrossRef] [PubMed]
- Zhang, C.; Wang, X.; Du, J.; Gu, Z.; Zhao, Y. Reactive oxygen species-regulating strategies based on nanomaterials for disease treatment. Adv. Sci. 2021, 8, 2002797. [Google Scholar] [CrossRef] [PubMed]
- Brany, D.; Dvorska, D.; Halasova, E.; Skovierova, H. Cold atmospheric plasma: A powerful tool for modern medicine. Int. J. Mol. Sci. 2020, 21, 2932. [Google Scholar] [CrossRef] [Green Version]
- Dai, X.; Wang, D.; Zhang, J. Programmed cell death, redox imbalance, and cancer therapeutics. Apoptosis 2021, 26, 385–414. [Google Scholar] [CrossRef] [PubMed]
- Bundscherer, L.; Bekeschus, S.; Tresp, H.; Hasse, S.; Reuter, S.; Weltmann, K.-D.; Lindequist, U.; Masur, K. Viability of human blood leukocytes compared with their respective cell lines after plasma treatment. Plasma Med. 2013, 3, 71–80. [Google Scholar] [CrossRef]
- Bekeschus, S.; Wende, K.; Hefny, M.M.; Rodder, K.; Jablonowski, H.; Schmidt, A.; Woedtke, T.V.; Weltmann, K.D.; Benedikt, J. Oxygen atoms are critical in rendering thp-1 leukaemia cells susceptible to cold physical plasma-induced apoptosis. Sci. Rep. 2017, 7, 2791. [Google Scholar] [CrossRef] [Green Version]
- Pasqual-Melo, G.; Nascimento, T.; Sanches, L.J.; Blegniski, F.P.; Bianchi, J.K.; Sagwal, S.K.; Berner, J.; Schmidt, A.; Emmert, S.; Weltmann, K.D.; et al. Plasma treatment limits cutaneous squamous cell carcinoma development in vitro and in vivo. Cancers 2020, 12, 1993. [Google Scholar] [CrossRef]
- Binenbaum, Y.; Ben-David, G.; Gil, Z.; Slutsker, Y.Z.; Ryzhkov, M.A.; Felsteiner, J.; Krasik, Y.E.; Cohen, J.T. Cold atmospheric plasma, created at the tip of an elongated flexible capillary using low electric current, can slow the progression of melanoma. PLoS ONE 2017, 12, e0169457. [Google Scholar] [CrossRef] [Green Version]
- Metelmann, H.-R.; Nedrelow, D.S.; Seebauer, C.; Schuster, M.; von Woedtke, T.; Weltmann, K.-D.; Kindler, S.; Metelmann, P.H.; Finkelstein, S.E.; Von Hoff, D.D.; et al. Head and neck cancer treatment and physical plasma. Clin. Plasma Med. 2015, 3, 17–23. [Google Scholar] [CrossRef]
- Metelmann, H.-R.; Seebauer, C.; Miller, V.; Fridman, A.; Bauer, G.; Graves, D.B.; Pouvesle, J.-M.; Rutkowski, R.; Schuster, M.; Bekeschus, S.; et al. Clinical experience with cold plasma in the treatment of locally advanced head and neck cancer. Clin. Plasma Med. 2018, 9, 6–13. [Google Scholar] [CrossRef]
- Schmidt-Bleker, A.; Winter, J.; Bosel, A.; Reuter, S.; Weltmann, K.D. On the plasma chemistry of a cold atmospheric argon plasma jet with shielding gas device. Plasma Sources Sci. Technol. 2016, 25, 015005. [Google Scholar] [CrossRef]
- Bekeschus, S.; Kolata, J.; Winterbourn, C.; Kramer, A.; Turner, R.; Weltmann, K.D.; Broker, B.; Masur, K. Hydrogen peroxide: A central player in physical plasma-induced oxidative stress in human blood cells. Free Radic. Res. 2014, 48, 542–549. [Google Scholar] [CrossRef] [PubMed]
- Wende, K.; von Woedtke, T.; Weltmann, K.D.; Bekeschus, S. Chemistry and biochemistry of cold physical plasma derived reactive species in liquids. Biol. Chem. 2018, 400, 19–38. [Google Scholar] [CrossRef] [PubMed]
- Wende, K.; Williams, P.; Dalluge, J.; Gaens, W.V.; Aboubakr, H.; Bischof, J.; von Woedtke, T.; Goyal, S.M.; Weltmann, K.D.; Bogaerts, A.; et al. Identification of the biologically active liquid chemistry induced by a nonthermal atmospheric pressure plasma jet. Biointerphases 2015, 10, 029518. [Google Scholar] [CrossRef] [Green Version]
- Bekeschus, S.; Clemen, R.; Niessner, F.; Sagwal, S.K.; Freund, E.; Schmidt, A. Medical gas plasma jet technology targets murine melanoma in an immunogenic fashion. Adv. Sci. 2020, 7, 1903438. [Google Scholar] [CrossRef] [Green Version]
- Sies, H. Oxidative stress: A concept in redox biology and medicine. Redox Biol. 2015, 4, 180–183. [Google Scholar] [CrossRef] [Green Version]
- Simon, H.U.; Haj-Yehia, A.; Levi-Schaffer, F. Role of reactive oxygen species (ros) in apoptosis induction. Apoptosis 2000, 5, 415–418. [Google Scholar] [CrossRef]
- Redza-Dutordoir, M.; Averill-Bates, D.A. Activation of apoptosis signalling pathways by reactive oxygen species. Biochim. Biophys. Acta (BBA)-Mol. Cell Res. 2016, 1863, 2977–2992. [Google Scholar] [CrossRef]
- Cadenas, E. Mechanisms of oxygen activation and reactive oxygen species detoxification. In Oxidative Stress and Antioxidant Defenses in Biology; Springer: Berlin/Heidelberg, Germany, 1995; pp. 1–61. [Google Scholar]
- Lorenzen, I.; Mullen, L.; Bekeschus, S.; Hanschmann, E.M. Redox regulation of inflammatory processes is enzymatically controlled. Oxid. Med. Cell. Longev. 2017, 2017, 8459402. [Google Scholar] [CrossRef] [Green Version]
- Cipak Gasparovic, A.; Milkovic, L.; Rodrigues, C.; Mlinaric, M.; Soveral, G. Peroxiporins are induced upon oxidative stress insult and are associated with oxidative stress resistance in colon cancer cell lines. Antioxidants 2021, 10, 1856. [Google Scholar] [CrossRef]
- Keightley, J.A.; Shang, L.; Kinter, M. Proteomic analysis of oxidative stress-resistant cells: A specific role for aldose reductase overexpression in cytoprotection. Mol. Cell. Proteom. 2004, 3, 167–175. [Google Scholar] [CrossRef] [PubMed] [Green Version]
- Hegge, B.; Sjottem, E.; Mikkola, I. Generation of a pax6 knockout glioblastoma cell line with changes in cell cycle distribution and sensitivity to oxidative stress. BMC Cancer 2018, 18, 496. [Google Scholar] [CrossRef] [PubMed] [Green Version]
- Lipiński, P.; Drapier, J.-C.; Oliveira, L.; Retmańska, H.; Sochanowicz, B.; Kruszewski, M. Intracellular iron status as a hallmark of mammalian cell susceptibility to oxidative stress: A study of l5178y mouse lymphoma cell lines differentially sensitive to H2O2. Blood 2000, 95, 2960–2966. [Google Scholar] [CrossRef] [PubMed]
- Pace, P.E.; Peskin, A.V.; Han, M.H.; Hampton, M.B.; Winterbourn, C.C. Hyperoxidized peroxiredoxin 2 interacts with the protein disulfide-isomerase erp46. Biochem. J. 2013, 453, 475–485. [Google Scholar] [CrossRef] [Green Version]
- Lara-Guzman, O.J.; Gil-Izquierdo, A.; Medina, S.; Osorio, E.; Alvarez-Quintero, R.; Zuluaga, N.; Oger, C.; Galano, J.M.; Durand, T.; Munoz-Durango, K. Oxidized ldl triggers changes in oxidative stress and inflammatory biomarkers in human macrophages. Redox Biol. 2018, 15, 1–11. [Google Scholar] [CrossRef]
- Clemen, R.; Freund, E.; Mrochen, D.; Miebach, L.; Schmidt, A.; Rauch, B.H.; Lackmann, J.W.; Martens, U.; Wende, K.; Lalk, M.; et al. Gas plasma technology augments ovalbumin immunogenicity and ot-ii t cell activation conferring tumor protection in mice. Adv. Sci. 2021, 8, 2003395. [Google Scholar] [CrossRef]
- Schmidt, A.; Rödder, K.; Hasse, S.; Masur, K.; Toups, L.; Lillig, C.H.; von Woedtke, T.; Wende, K.; Bekeschus, S. Redox-regulation of activator protein 1 family members in blood cancer cell lines exposed to cold physical plasma-treated medium. Plasma Process. Polym. 2016, 13, 1179–1188. [Google Scholar] [CrossRef]
- Waris, G.; Ahsan, H. Reactive oxygen species: Role in the development of cancer and various chronic conditions. J. Carcinog. 2006, 5, 14. [Google Scholar] [CrossRef]
- Zhang, J.; Wang, X.; Vikash, V.; Ye, Q.; Wu, D.; Liu, Y.; Dong, W. Ros and ros-mediated cellular signaling. Oxid. Med. Cell. Longev. 2016, 2016, 4350965. [Google Scholar] [CrossRef] [Green Version]
- Bauer, G. Central signaling elements of intercellular reactive oxygen/nitrogen species-dependent induction of apoptosis in malignant cells. Anticancer Res. 2017, 37, 499–513. [Google Scholar] [CrossRef] [Green Version]
- Heinzelmann, S.; Bauer, G. Multiple protective functions of catalase against intercellular apoptosis-inducing ros signaling of human tumor cells. Biol. Chem. 2010, 391, 675–693. [Google Scholar] [CrossRef] [PubMed]
- Schafer, F.Q.; Buettner, G.R. Redox environment of the cell as viewed through the redox state of the glutathione disulfide/glutathione couple. Free Radic. Biol. Med. 2001, 30, 1191–1212. [Google Scholar] [CrossRef]
- Townsend, D.M.; Tew, K.D.; Tapiero, H. The importance of glutathione in human disease. Biomed. Pharmacother. 2003, 57, 145–155. [Google Scholar] [CrossRef]
- Meister, A. Glutathione metabolism and its selective modification. J. Biol. Chem. 1988, 263, 17205–17208. [Google Scholar] [CrossRef]
- Narayanan, D.; Ma, S.; Ozcelik, D. Targeting the redox landscape in cancer therapy. Cancers 2020, 12, 1706. [Google Scholar] [CrossRef] [PubMed]
- Chiang, S.K.; Chen, S.E.; Chang, L.C. The role of ho-1 and its crosstalk with oxidative stress in cancer cell survival. Cells 2021, 10, 2401. [Google Scholar] [CrossRef]
- Gozzelino, R.; Jeney, V.; Soares, M.P. Mechanisms of cell protection by heme oxygenase-1. Annu. Rev. Pharm. Toxicol. 2010, 50, 323–354. [Google Scholar] [CrossRef] [Green Version]
- Loboda, A.; Damulewicz, M.; Pyza, E.; Jozkowicz, A.; Dulak, J. Role of nrf2/ho-1 system in development, oxidative stress response and diseases: An evolutionarily conserved mechanism. Cell. Mol. Life Sci. 2016, 73, 3221–3247. [Google Scholar] [CrossRef] [Green Version]
- Balla, G.; Jacob, H.S.; Balla, J.; Rosenberg, M.; Nath, K.; Apple, F.; Eaton, J.W.; Vercellotti, G.M. Ferritin: A cytoprotective antioxidant strategem of endothelium. J. Biol. Chem. 1992, 267, 18148–18153. [Google Scholar] [CrossRef]
- Cheng, H.T.; Yen, C.J.; Chang, C.C.; Huang, K.T.; Chen, K.H.; Zhang, R.Y.; Lee, P.Y.; Miaw, S.C.; Huang, J.W.; Chiang, C.K.; et al. Ferritin heavy chain mediates the protective effect of heme oxygenase-1 against oxidative stress. Biochim. Biophys. Acta 2015, 1850, 2506–2517. [Google Scholar] [CrossRef]
- Hebert, C.A.; Baker, J.B. Interleukin-8: A review. Cancer Investig. 1993, 11, 743–750. [Google Scholar] [CrossRef] [PubMed]
- DeForge, L.E.; Preston, A.M.; Takeuchi, E.; Kenney, J.; Boxer, L.A.; Remick, D.G. Regulation of interleukin 8 gene expression by oxidant stress. J. Biol. Chem. 1993, 268, 25568–25576. [Google Scholar] [CrossRef]
- Son, D.O.; Satsu, H.; Shimizu, M. Histidine inhibits oxidative stress- and tnf-alpha-induced interleukin-8 secretion in intestinal epithelial cells. FEBS Lett. 2005, 579, 4671–4677. [Google Scholar] [CrossRef] [PubMed] [Green Version]
Figure 1.
Gas plasma-derived H2O2 and HOCl and study scheme. (a) Schematic overview of argon gas plasma treatment; (b) formation of H2O2 in argon gas plasma-treated liquids; (c) schematic overview of helium–oxygen gas plasma treatment; (d) formation of HOCl in helium–oxygen gas plasma-treated liquids; (e) Jurkat and THP-1 cells were seeded under similar conditions, and their IC20 was determined for H2O2 and HOCl by analyzing metabolic activity. Cell death was verified using flow cytometry, and GSH and GSSG levels were measured. Time-lapse fluorescence microscopy was performed to identify the time point of the maximal slope of caspase 3/7 activation in both cell types.

Figure 2.
Metabolic activity and viability. (a) Representative photograph of the resazurin-based metabolic activity assay in Jurkat cells; (b) IC20 calculations for H2O2 and HOCl in Jurkat cells; (c) IC20 calculations for H2O2 and HOCl in THP-1 cells; (d) IC20 ratio of HOCl over H2O2 for Jurkat and THP-1 cells; (e) IC20 ratio of Jurkat over THP-1 cells for H2O2 and HOCl; (f) representative flow cytometry dot plots of untreated, H2O2-treated (IC20), and HOCl-treated (IC20) THP-1 cells; (g,h) number of viable Jurkat (g) and THP-1 (h) cells as determined via flow cytometry. Results are representative of three experiments.

Figure 3.
Caspase 3/7 activation and glutathione levels. (a) Representative microscopy overlay images of brightfield and green fluorescence (caspase 3/7); (b,c) fold-change increase of caspase activation in untreated, H2O2-treated (IC20), and HOCl-treated (IC20) Jurkat (b) and THP-1 (c) cells followed by time-lapse fluorescence microscopy up to 12 h; (d–g) total glutathione (d), reduced GSH (e), GSSG (f), and GSH/GSSG (g) ratio in Jurkat and THP-1 cells that had remained untreated or were exposed to H2O2 (IC20) or HOCl (IC20). Results are representative of three experiments.


Figure 4.
siRNA mediated knockdown of catalase, HO-1, and IL-8. (a) Workflow of the siRNA electroporation followed by Western blotting and cell line testing; (b,c) representative Western blots in Jurkat (b) and THP-1 (c) cells, with white arrows indicating protein knockdown of catalase, HO-1, or IL-8; (d,e) normalized metabolic activity of Jurkat (d) and THP-1 (e) cells following exposure to H2O2 (IC20) or HOCl (IC20) after being subjected to mock or siRNA-mediated transfection. NT = non-transfected; luc = luciferase.

Publisher’s Note: MDPI stays neutral with regard to jurisdictional claims in published maps and institutional affiliations. |
© 2022 by the authors. Licensee MDPI, Basel, Switzerland. This article is an open access article distributed under the terms and conditions of the Creative Commons Attribution (CC BY) license (https://creativecommons.org/licenses/by/4.0/).
Share and Cite
MDPI and ACS Style
Singer, D.; Miebach, L.; Bekeschus, S. Differential Sensitivity of Two Leukemia Cell Lines towards Two Major Gas Plasma Products Hydrogen Peroxide and Hypochlorous Acid. Appl. Sci. 2022, 12, 7429. https://doi.org/10.3390/app12157429
AMA Style
Singer D, Miebach L, Bekeschus S. Differential Sensitivity of Two Leukemia Cell Lines towards Two Major Gas Plasma Products Hydrogen Peroxide and Hypochlorous Acid. Applied Sciences. 2022; 12(15):7429. https://doi.org/10.3390/app12157429
Chicago/Turabian StyleSinger, Debora, Lea Miebach, and Sander Bekeschus. 2022. "Differential Sensitivity of Two Leukemia Cell Lines towards Two Major Gas Plasma Products Hydrogen Peroxide and Hypochlorous Acid" Applied Sciences 12, no. 15: 7429. https://doi.org/10.3390/app12157429
Note that from the first issue of 2016, this journal uses article numbers instead of page numbers. See further details here.