1. Introduction
Grouting is a technique for sealing fissures in the rock, concrete, and masonry structures. Several studies have used a wide range of grout materials, including cement substituted by a silica fume (SF), metakaolin (MK), and fly ash (FA), as well as cement treated with polymers [
1,
2,
3,
4]. The main purpose of the grouting process is to cover the sand particles with a high flowable grout material. The component’s compressive and bonding strengths will be greatly improved as a result [
5]. Water reducer polymers are widely used in the cement grout (CG), cementitious materials (CM), and concrete industries to reduce the content of water and improve the physical and structural properties of cement [
6,
7,
8].
Coarse sand, probably due to its high grain size, permitted better particle interlocking, enhancing σ
f. Several parameters, including cement to sand ratios, w/c, raw materials utilized, sand grading, and sand particle morphology, influence the strength properties of CM [
9,
10].
No study in the literature observed that two separate standards were used to measure the CS of CG modified with water reducer polymer to provide high flowable and high strength cement grout.
To the best of the authors’ knowledge, formulation of a computational model in terms of an analytical function for estimating the compressive strength of cementitious materials as a function of the parameters involved in the problem, has not been proposed before in the literature. This can be attributed mainly to the complex and highly non-linear behavior exhibited by the compressive strength in relation to the parameters involved, such as the water-to-cement ratio, the polymer content (P), and the testing age (t) of samples. Based on the above, the salient objectives of the work presented herein can be summarized as follows:
- (i).
Assess the effect of different water reducer polymer additive surfaces on CG characteristics using scanning electron microscopy testing (SEM).
- (ii).
Investigate the effect of five grains of sand with various sizes on the flowability of CG modified with water reducer polymer.
- (iii).
Calculate the maximum compression and flexural stress of self-compacting CG using linear and nonlinear techniques.
- (iv).
Correlating prismatic compressive strength to cylindrical compressive strength followed by the American Society for Testing and Materials and British Standards, and prismatic compressive strength to the flexural strength of a CG.
2. Materials and Methods
This section presents in depth the procedure followed to investigate the mechanical behavior of cementitious materials together with the materials used, as well as the corresponding standards and specifications used to perform the respective experimental tests. The computational technique used to estimate the compressive strength is also presented in detail. It is worth noting that the majority of researchers pay particular attention to the computational technique to be used, without giving adequate attention to the data to be used for training and development of mathematical simulations to assess the compressive strength of cementitious materials Based on the above, in the present work, special emphasis was placed on the creation of reliable and suitable data which were produced through experimental data following the international standards for conducting experimental tests as well as for the preparation and storage of the specimens in appropriate environmental conditions. In addition to the fact that the database must be reliable, it must also consist of a sufficient number of data covering all possible value ranges of the parameters involved in the problem, such as the water-to-cement ratio, the polymer content (P), and the testing age (curing time).
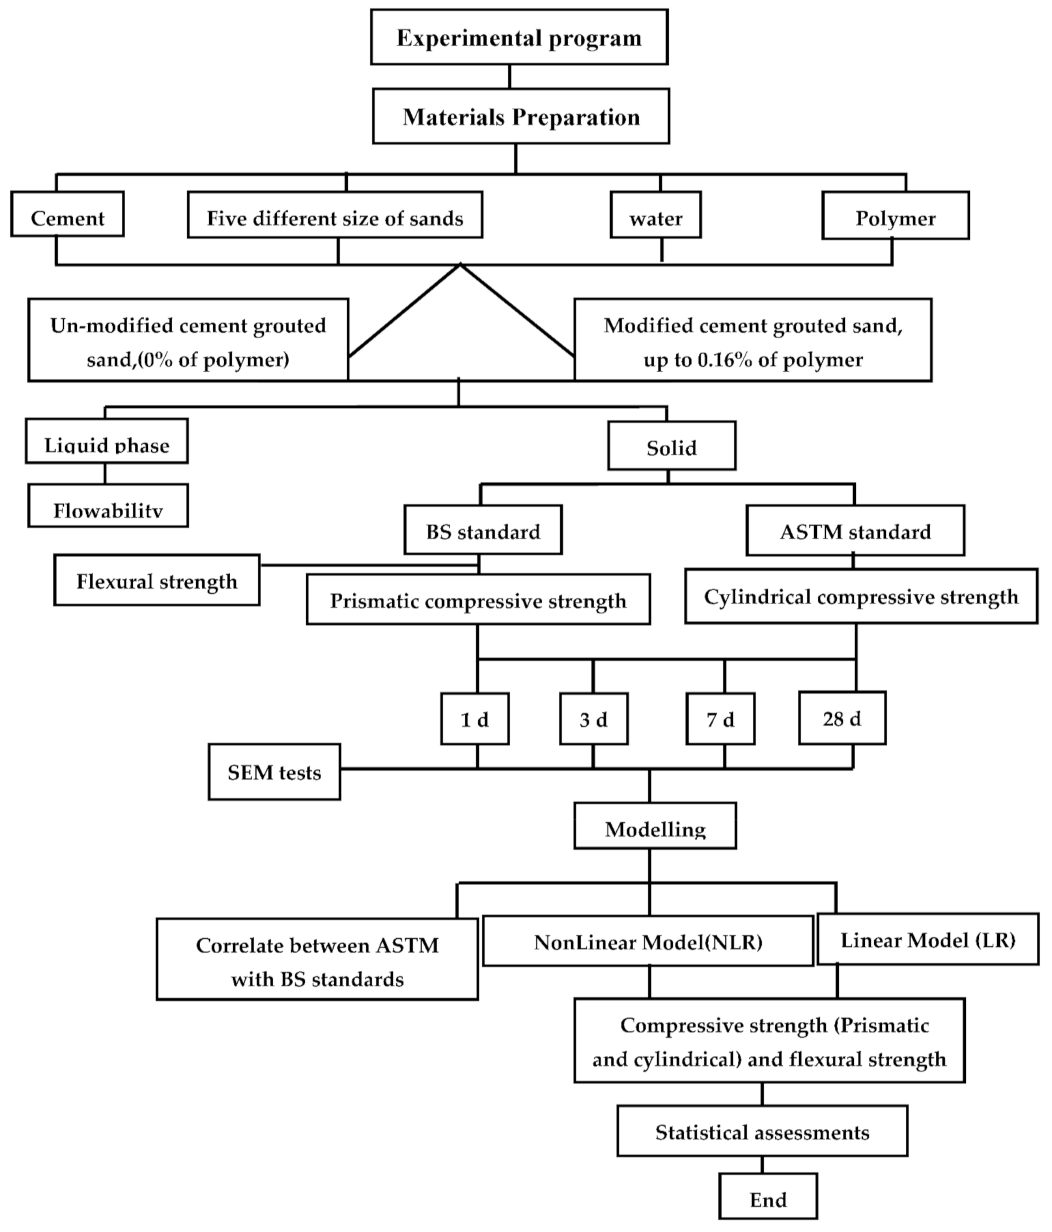
Figure 1 illustrates the approach for the experimental and modeling research. The experiments used an average of at least three specimens:
Step 1: The shape and size of the water reducer polymer and cement powder particles were first determined.
Step 2: Five different local grains of sand were selected and characterized based on the grain size distribution test.
Step 3: The cement—and different amounts of water reducer polymer were mixed very well.
Step 4: The cement was modified with different percentages of water reducer polymer and mixed with different sands, and the mixes were cast into two different shapes of the model (ASTM & BS).
Step 5: The cement grouted sands were cured and tested up to 28 days of water curing.
Step 6: Modeling was conducted to interpret the results.
2.1. Materials
2.1.1. Polymer
In this study, a water reducer polymer with one linear backbone consists of side groups of carboxylates (polycarboxylate ether-based polymer). The water reducer polymer is used to treat and change the behavior of cement using carboxylate groups as anchoring groups [
10,
11,
12,
13,
14]. With a pH of 10, the solid content of the water reducer polymer is larger than 97% (data provided from the supplier). The polymer was employed at a concentration of 0 to 0.16 percent (percent weight).
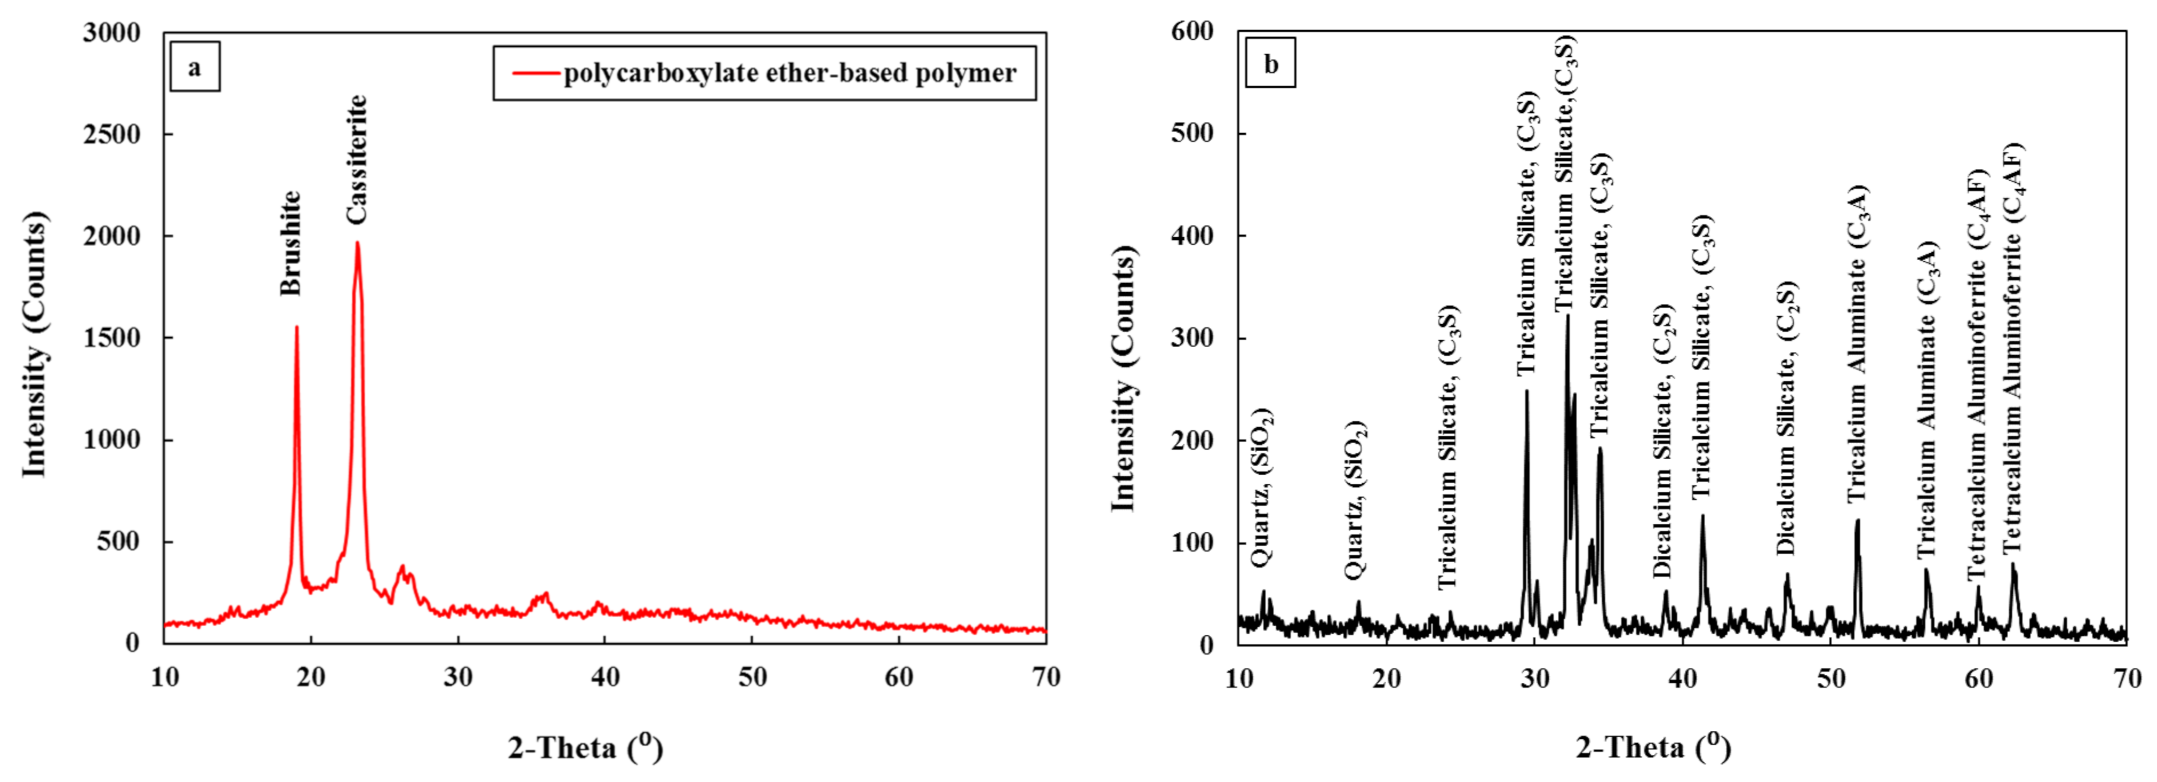
Figure 2a shows the X-ray Diffraction (XRD) test results on the cement and water reducer polymer that are utilized in this research.
2.1.2. Cement
Portland cement (PC) was utilized to manufacture self-compacted cement grout.
Figure 2b shows the XRD test of OPC.
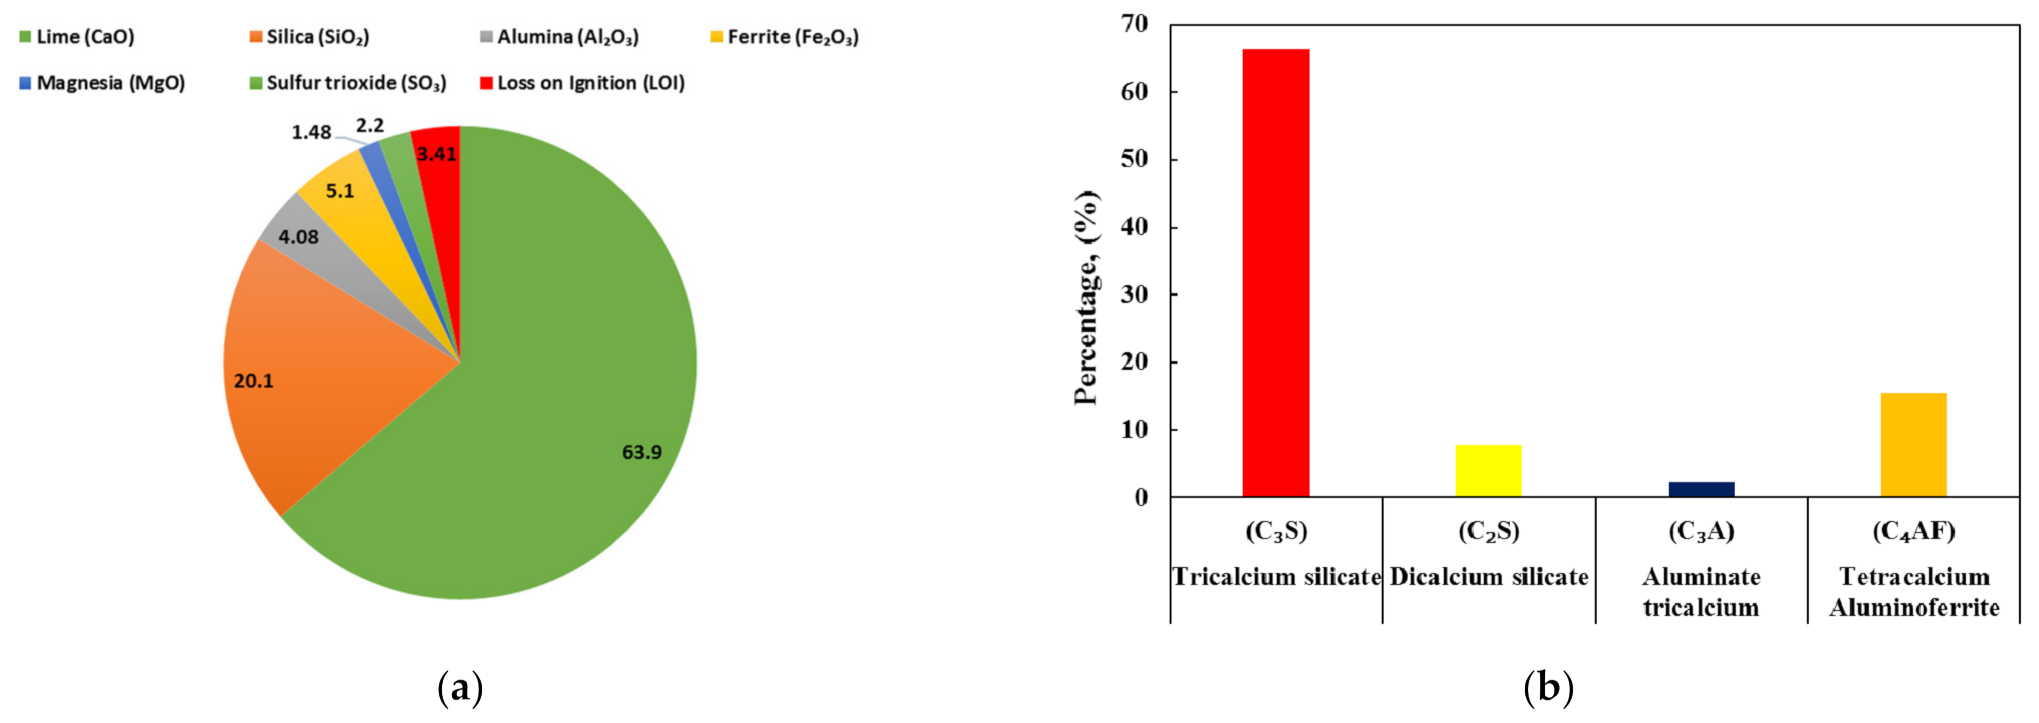
Figure 3 shows the mineralogical and chemical compositions of the cement. The peak intensity of the water reducer polymer is between 1500 and 2000, according to
Figure 2b, but the cement’s peak intensity is about 300, as shown in
Figure 2b.
2.1.3. Sands
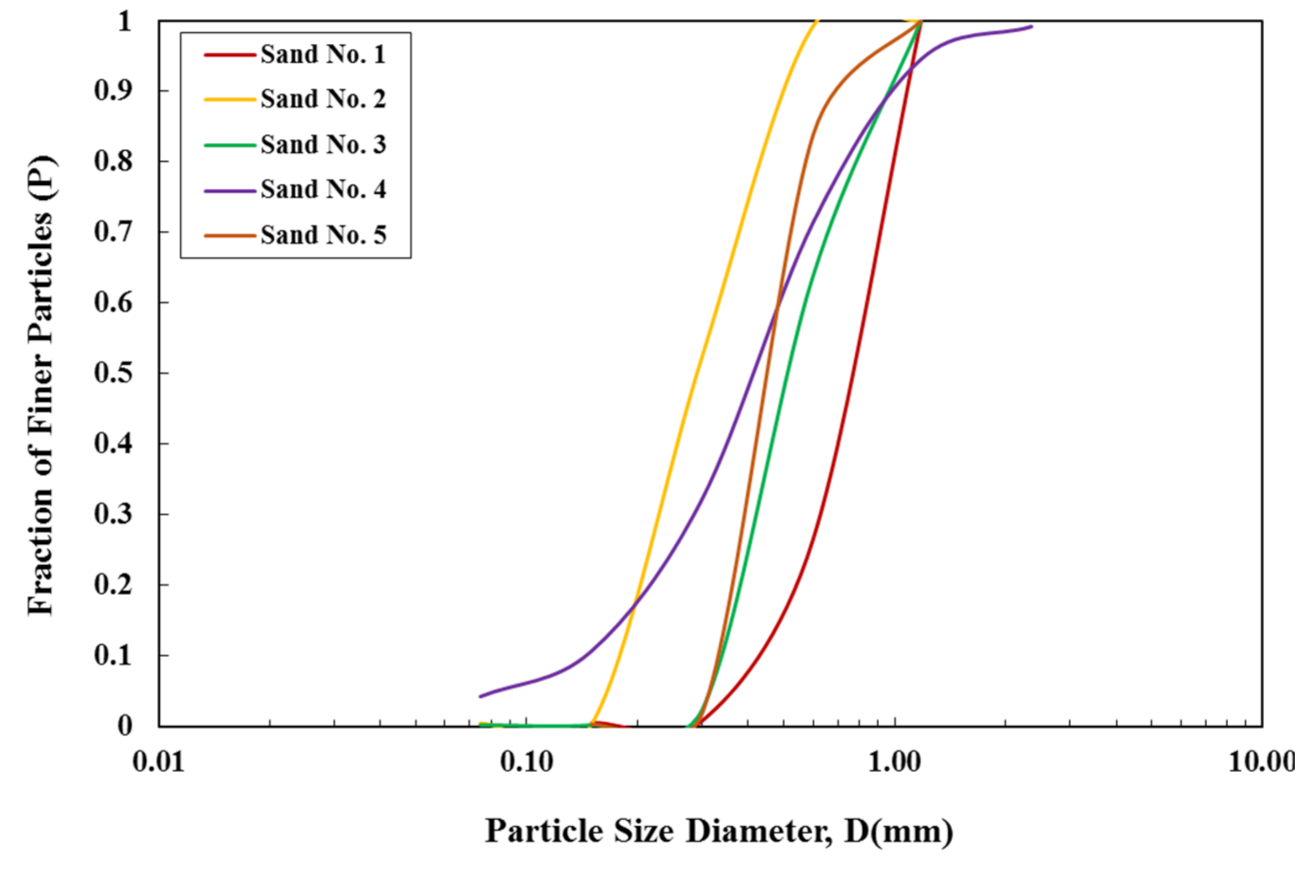
In this research, five sand with different grading were used.
Figure 4 shows the particle size distribution (PSD) and specific gravity (Gs) of the sands utilized, which are also shown in
Table 1.
2.2. Methods
2.2.1. XRD Analysis
At a temperature of 25 °C, the chemical composition of a water reducer polymer and cement was determined. The test was conducted at a rate of 5 sec. each stage and two thetas (°). The test models (Cu-K radiation) were obtained using the ADX-2700 diffractometer, an Angstrom Advanced XRD platform fitted with a graphite monochromator. Two grams of PC and water reducer polymer powder were placed in a sample holder with a 0.3 cm depth. The reflections (2th) were examined from 0 to 70° in 0.02° increments with a two-second counting interval between each stage, as shown in
Figure 2.
2.2.2. Scanning Electron Microscopy (SEM)
SEM quanta 400 microscopes were used to evaluate the effect of water reducer polymer on the properties of cement.
Figure 5 and
Figure 6. illustrate the surface topography information and component of the Portland cement (PC), polycarboxylate polymer, and CG.
2.2.3. Mix Proportions
Firstly, water reducer polymer was added to the cement powder in amounts of 0%, 0.08%, 0.12%, and 0.16%. In order to get a uniform dry mix, the Portland cement and water reducer polymer were mixed very well with five type of sands with different PSD. Tests were done in the lab for various CG mixtures made with the five sand grain recommended by [
15]. To get the right amount of water and cement in the CG, lab tests were done that led to the best CS without changing the flowability of the mix. The w/c for the different mixtures were 0.5–0.60, as summarized in
Table 2.
2.2.4. Flow
The flow rate of CG was determined by using a flow cone method (ASTM C939). Fresh CG with a short flow period has a high fluidity/workability. The cement-to-sand ratio (c/s) was kept constant at one. Firstly, the PC is treated with a water reducer polymer of up to 016%. The PC, polymer, and water were carefully mixed with five different sand particle sizes to achieve a uniform dry mix. The cement grout flow time should be kept between 19 and 23 seconds to achieve a constant and uniform mix.
2.2.5. Compressive Strength
According to the BS standard, the CG was placed in 40 × 40 × 160 mm and 100 × 200 mm molds according to the ASTM standard. Before being covered in a plastic bag and stored at room temperature, the molds were leveled. After one day of curing, the samples were removed from the mold and cured in water at 25 °C 1 °C and 95 percent RH until testing time. A series of cylindrical specimens were prepared using uniaxial compression machines to study the effects of water reducer polymer on the CS of CG. ASTM C 39 [
16] tested the cylindrical CS using a 0.15 MPa/s loading speed hydraulic compression testing equipment. 2.2.6. Flexural Strength
The flexural speed of the machine for the 40 × 40 × 160 mm samples was 50 N/s. The compression machine with a rate of 2400 ± 100 N per sec was used.
2.3. Data Analysis
2.3.1. Linear Model
The linear model (LR) (Equations (1)–(3)) was utilized to determine the
,
, and
of cement grout, as simply explained in the followings:
where
, and = prismatic, cylindrical compression strength and flexural strength of compressive strength (MPa). P = polymer content (%).
= LR parameters.
2.3.2. Nonlinear Model
The influence of mix proportions of cement grout on the σ
pc, σ
cc, and σ
f, including the w/c and polymer dosage, d
10, and testing age (t), is also evaluated using Equations (4)–(6) [
17,
18,
19,
20,
21,
22,
23,
24].
3. Result and Analysis
3.1. Selection of w/c
The CG flow time decreased when the w/c increased from 0.5 to 0.6. The w/c was raised when fine-grained sand was utilized to obtain equivalent CG flowability. When the w/c was between 0.57 and 0.6, the CG made with fine-grained sand (Sand # 2) had the highest CS after 28 days, but when the w/c was between 0.5 and 0.53, the CG made with coarse-grained sand (Sand # 5) had the highest CS after 28 days. The impact of the w/c on the CG and CS flow is summarized in
Table 2. Due to its smaller surface area than coarser-grained sand at high w/c, finer-grained sand produces a more homogeneous CG mixture than coarser-grained sand. Increased fluidity can cause more bleeding and the dispersion of particles of various sizes. ASTM C 938 recommends applying the CG for 19 to 23 s [
15]. This is an important step in minimizing segregation and bleeding in CG specimens and improving their microstructure. Based on the findings in
Table 2, a w/c of 0.6 was determined to be the best value for creating a CG modified with a polymer.
3.2. Flow and w/c
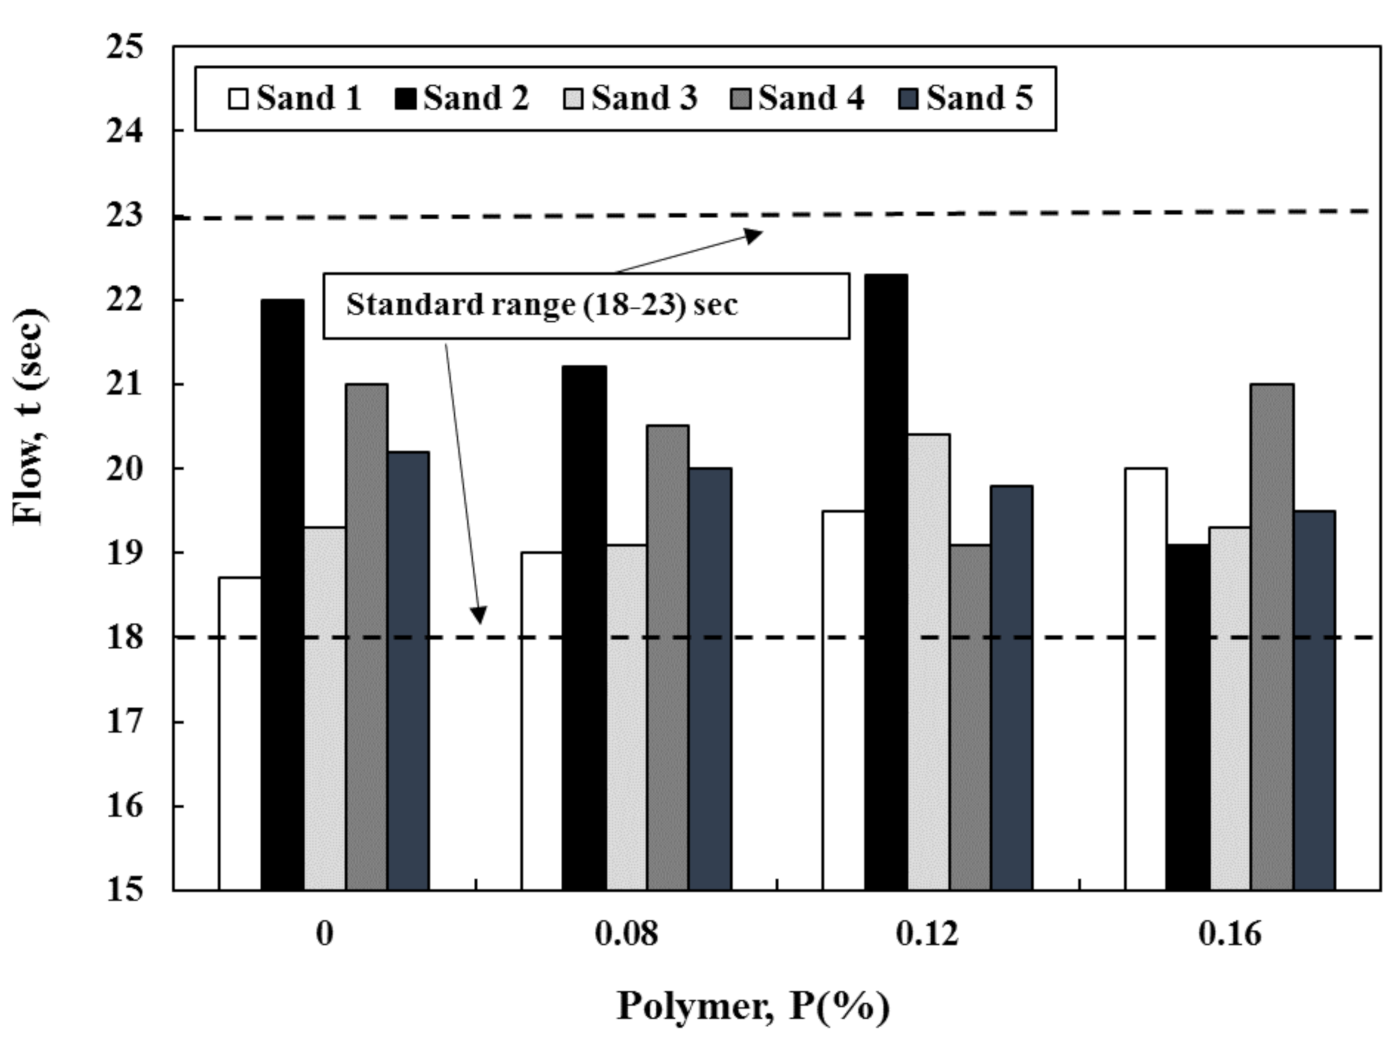
The flow of self-compacting cement grouts is a primary design function [
6]. Adding water-reducing polymer reduced required water content while maintaining flowability in the 21 ± 2 s range (
Figure 7). Adding water-reducing polymer reduced the water content of CG by 20% to 54% to achieve the desired flowability based on the mix proportions, as shown in
Figure 7. Adding 0.12% of water reducer polymer reduced the w/c of CG by 23% to 50%, depending on the mix proportions.
3.3. Microstructure Tests
Brushite and cassiterite characteristic peaks at 25° are visible at 2θ = 19° and 23.15° for the water reducer polymer (
Figure 2a). The main composition of the cement is shown in
Figure 2b.
Figure 3 depicts the percentage of the cement composition used in this study.
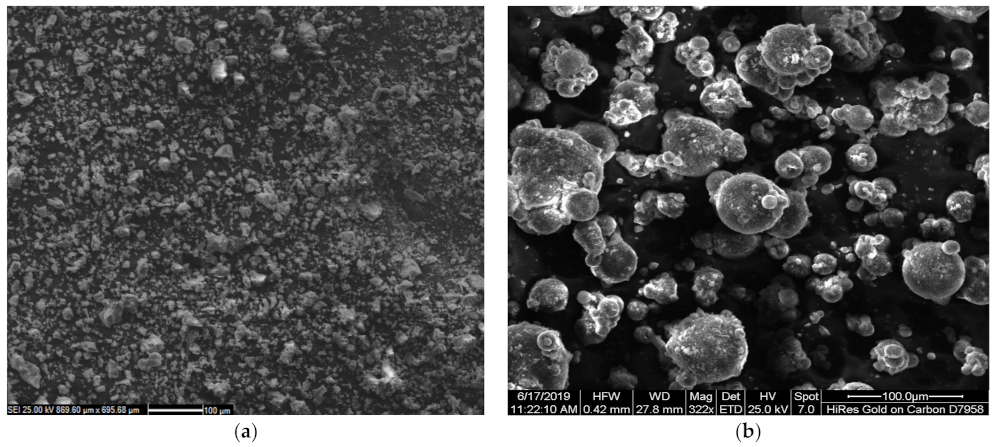
Figure 5a illustrates that the cement particle size ranges between 14.4 m and 42 m. According to the SEM test results, the water reducer polymer particles did not have a crystalline shape and were amorphous.
The particles of the water reducer polymer and the cement sand particles are attracted to each other.
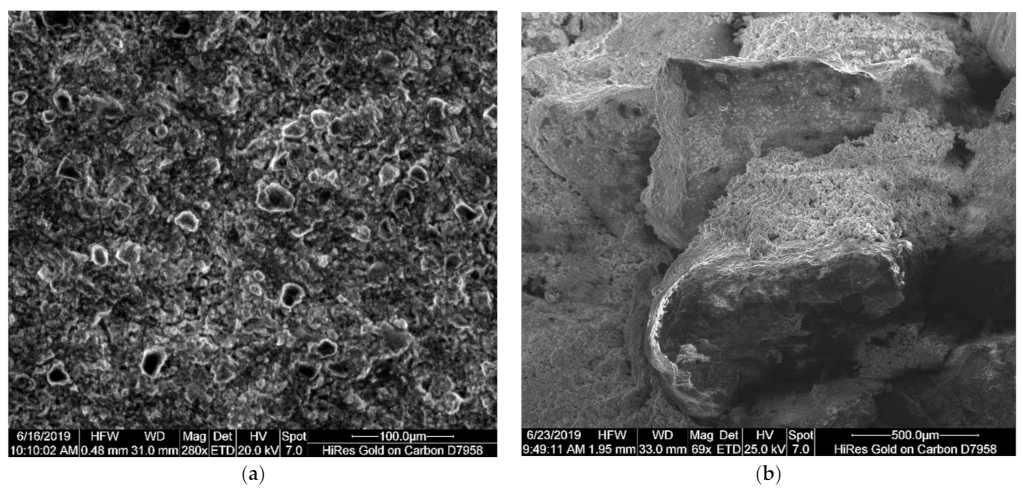
Figure 6 shows SEM observations of CG modified with water reducer polymer. The particles were not well-positioned in the matrix after 7 days of testing, as shown in
Figure 6a. The microstructure of CG modified by water reducer polymer showed that the polymer creates an ephemeral silicone that fills the space between cement and sand particles after one week of curing; thus, the CS of the CG will be increased (
Figure 6b).
3.4. Stress at Failure
3.4.1. ASTM Standard
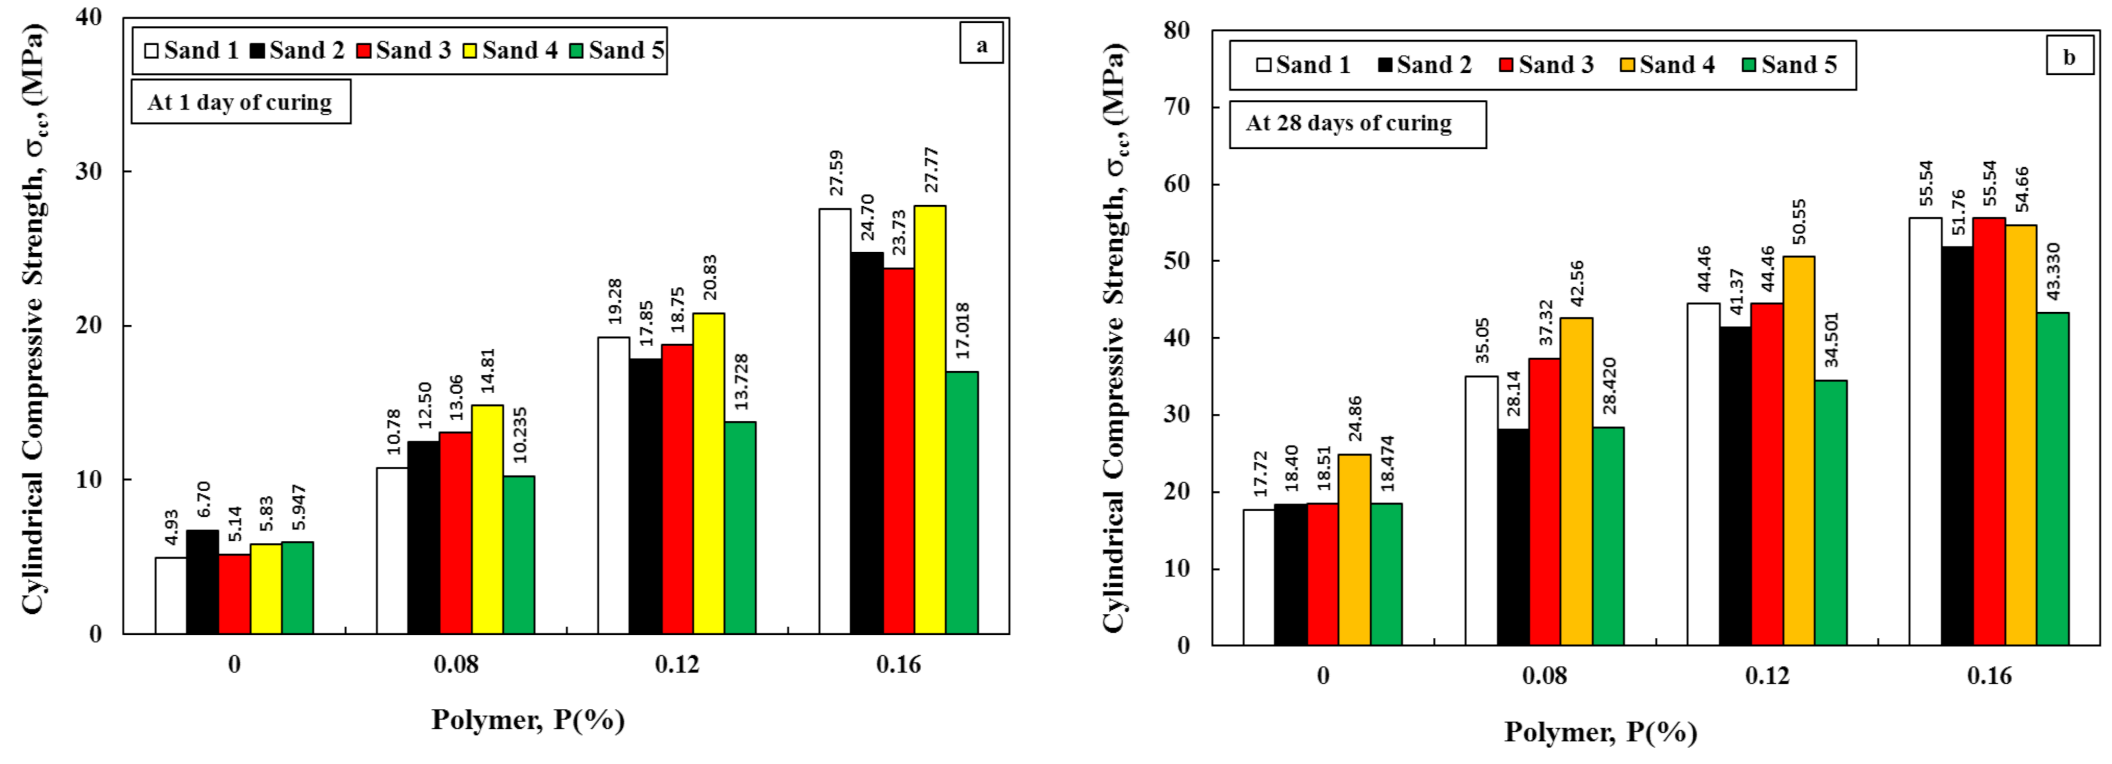
The compressive strength is increased by 53 to 459 percent when a water reducer polymer is added to the CG (
Figure 8). The cc of the CG treated with 0.16 percent polymer using Sand # 1 improved from 4.33 to 27.59 MPa after one day of testing (
Figure 8a). After 28 days of testing, the CG’s cc increased from 24.86 to 54.66 MPa after being treated with 0.16 percent of the water reducer polymer (
Figure 8b).
According to the model parameters (LR), adding polymer to cement grout increases compression strength (Equation (7)).
In accordance to the equation variables, the polymer dosage with the model parameter of (73.7) is impacted on increasing the CS more than other variables (Equation (7)).
Figure 9a,c also shows the performance of the LR model with residual errors ranging from +12 to −16 MPa. The performance of the models was examined by comparing the linear relationships with nonlinear regression analysis, as illustrated in
Figure 9a,b.
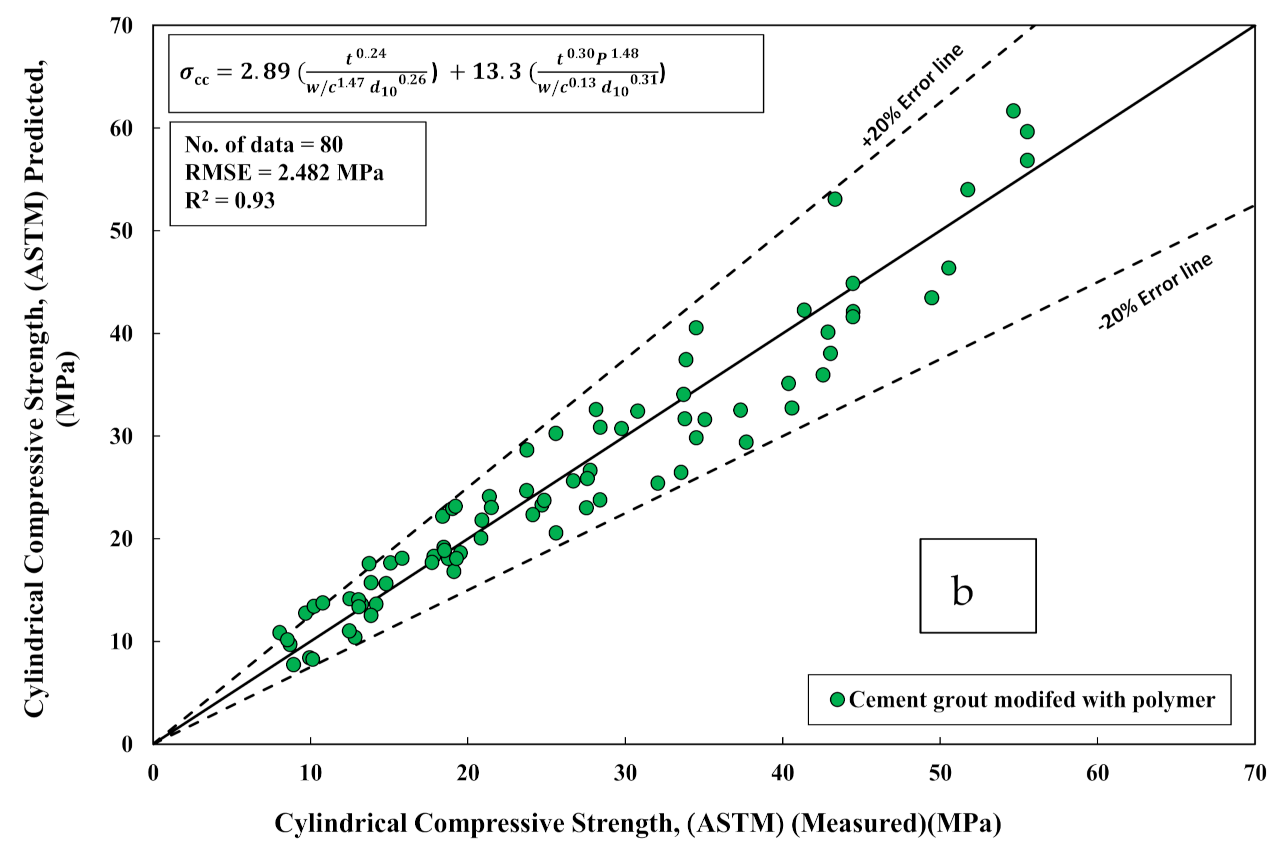
The polymer has a greater influence on improving the cylindrical CS than the w/c, testing age, and d
10, according to the model parameters in Equations (7) and (8). The NLR model predicted the σ
cc stronger than the LR model, as shown in
Figure 9a,b. The residual error was ranged between +12 to −16 MPa (
Figure 9a,b).
3.4.2. BS Standard
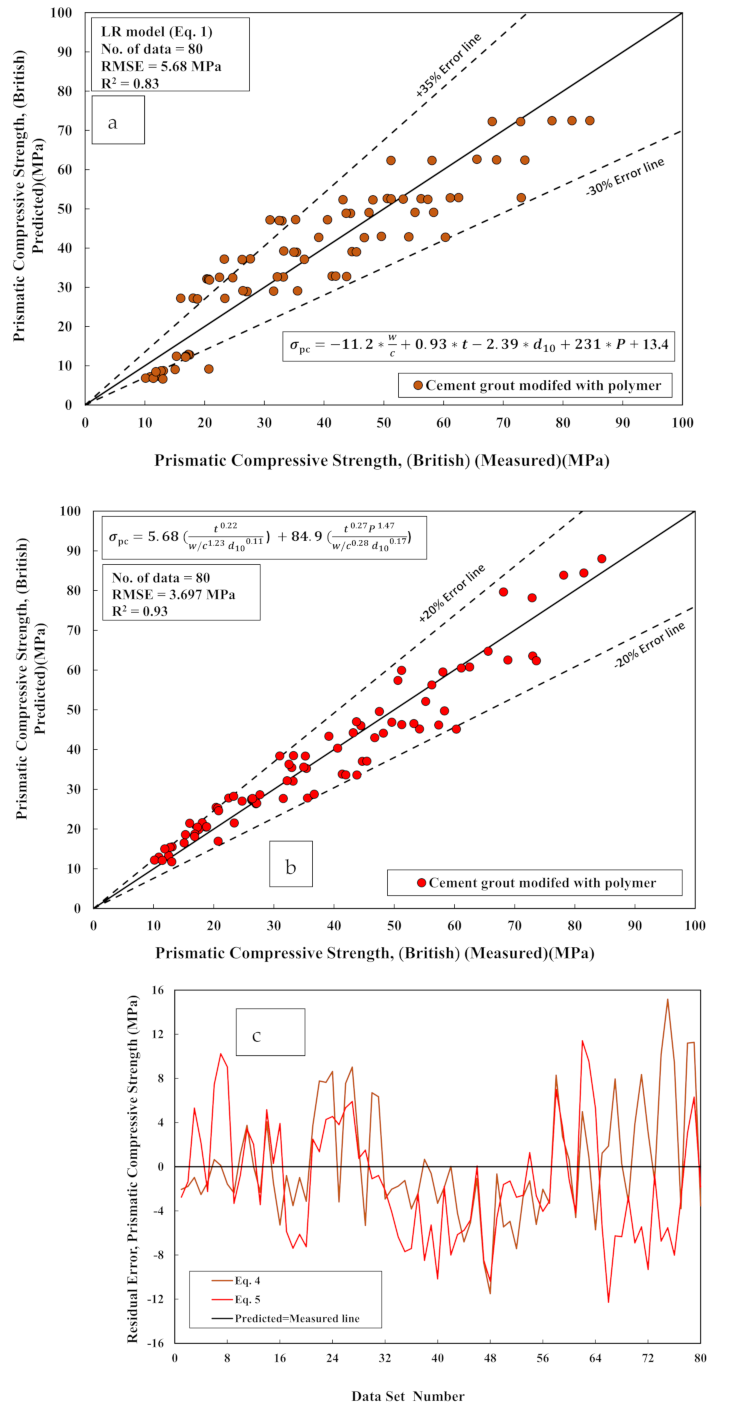
The prismatic CS increased by 200 to 575 % (
Figure 10). When the CG was modified with 0.16 % of the polymer after 28 days of testing, the prismatic CS of CG Sand #1 and Sand #5 raised by 200% and by 240% (
Figure 10b). To predict the prismatic CS of CG at various w/c, curing ages, polymer amounts, and sand grain sizes, a linear equation (Equation (8)) and a nonlinear equation (Equation (9)) were developed. The nonlinear technique (NLR) predicts the prismatic CS of CG more accurately than the linear technique (LR) based on statistical assessment tools, as shown in
Figure 11.
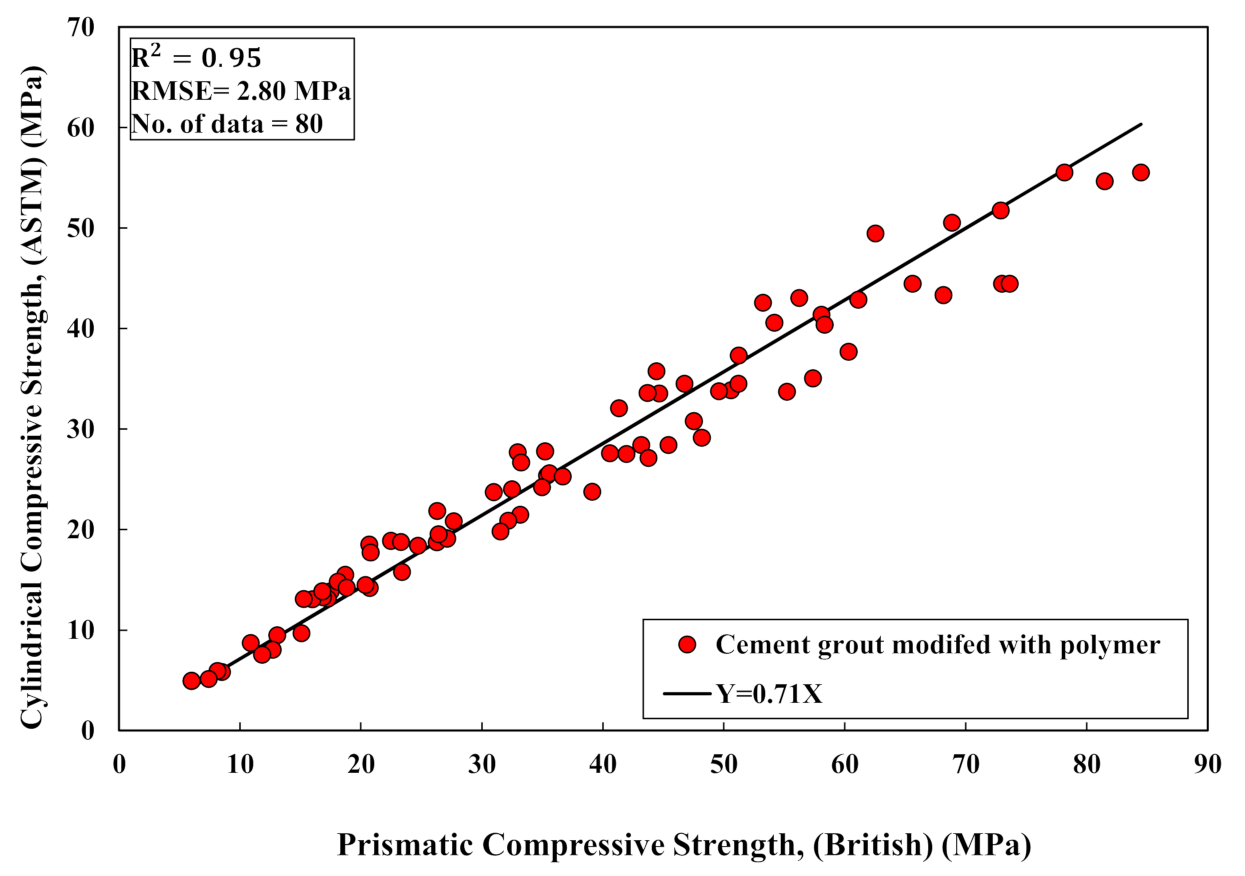
3.4.3. ASTM Standard and BS Standard conversion factor
Depending on the 80 tested data, the ratio of the
of cement grout using a cylinder mold to the
was 0.71 with R
2 of 0.95 and RMSE of 2.8 MPa (
Figure 12).
When samples are subjected to uniaxial compression, a recessed zone forms, establishing a triaxial compression zone [
23,
24].
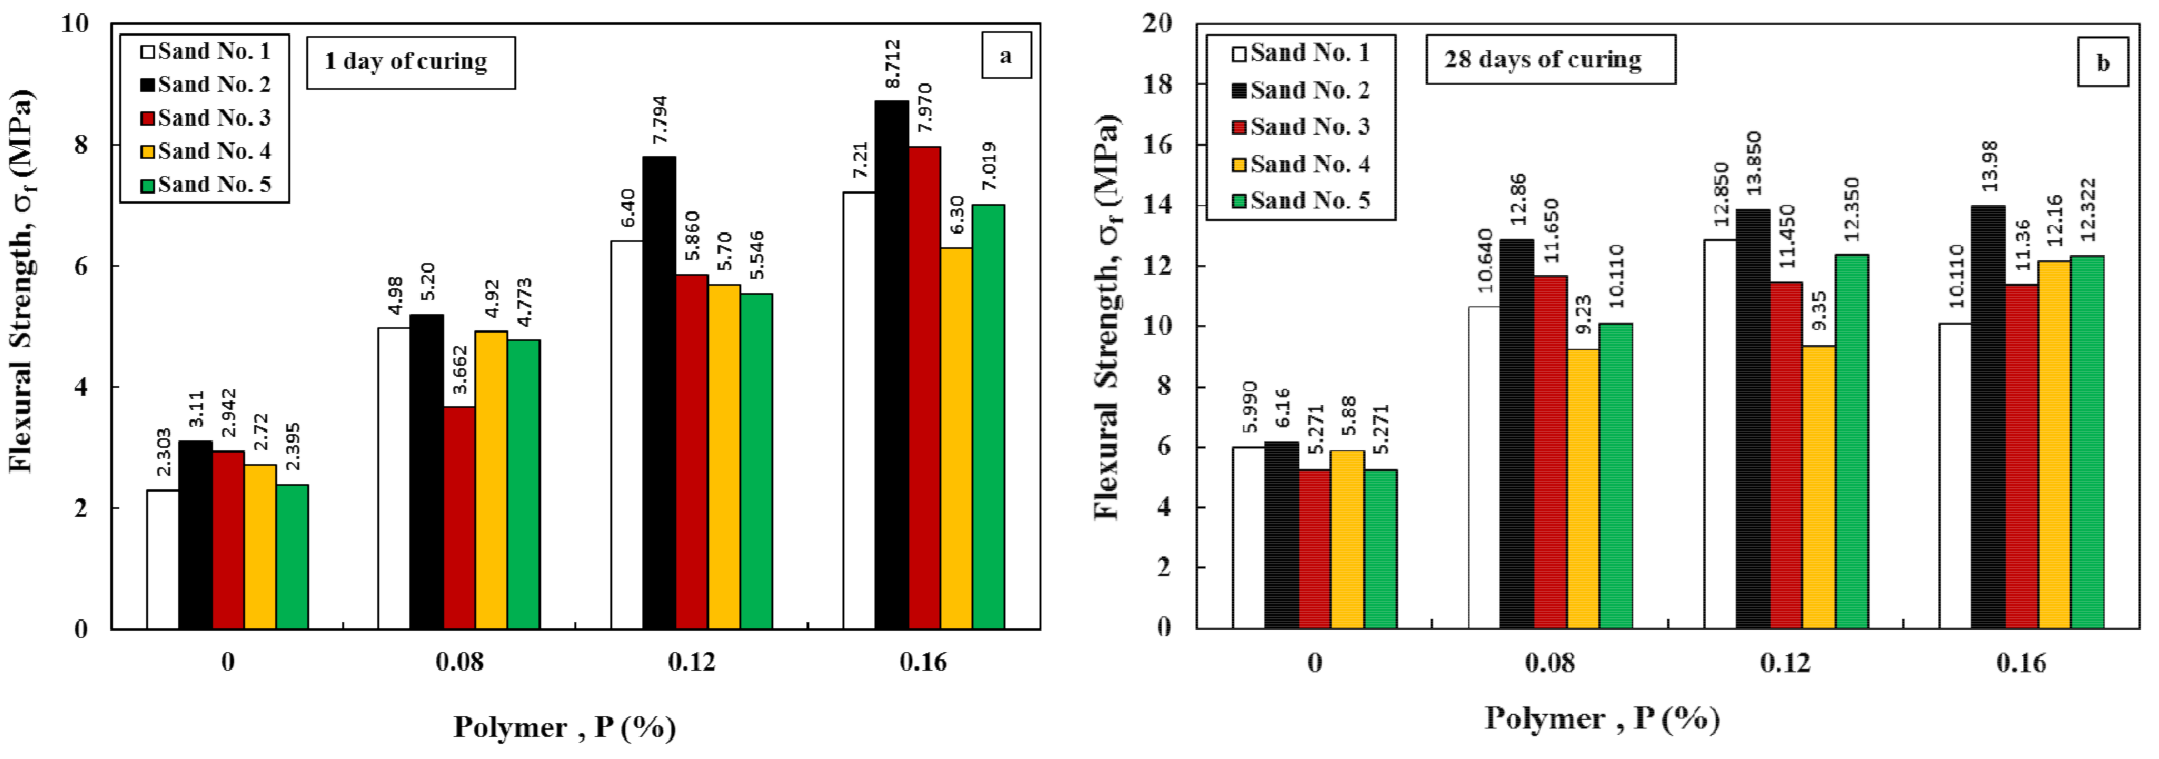
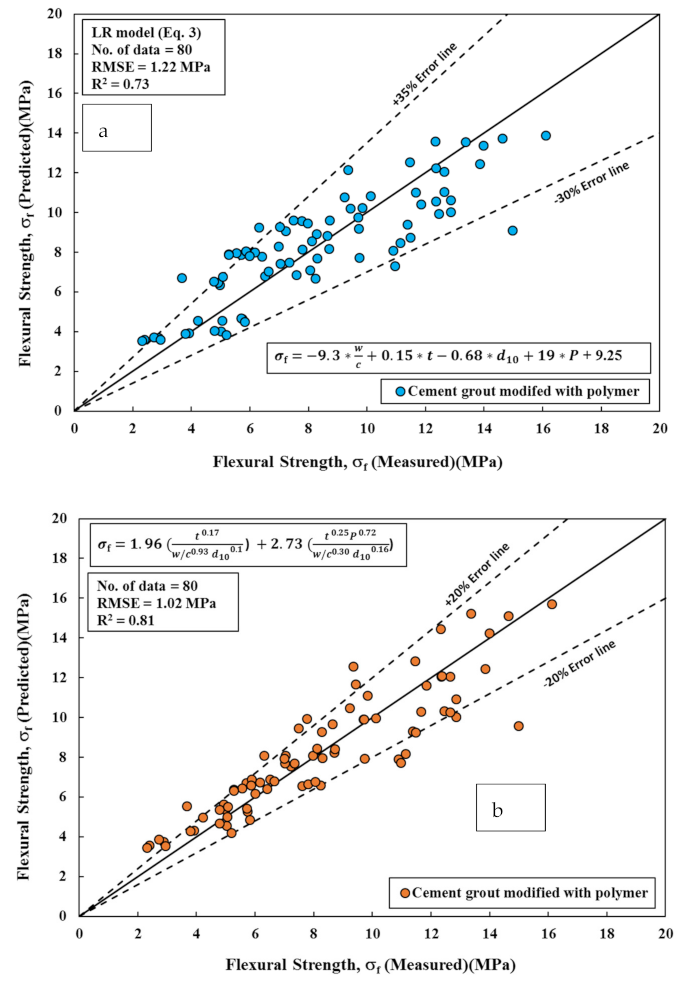
Figure 13 shows a typical flexural strength for a CG modified with water reducer polymer. Adding polymer to CG increases its flexural strength and its CS. Compared to the other sands, the cement grout made with finer sand grading (Sand #2) had the maximum σ
f at all testing ages.
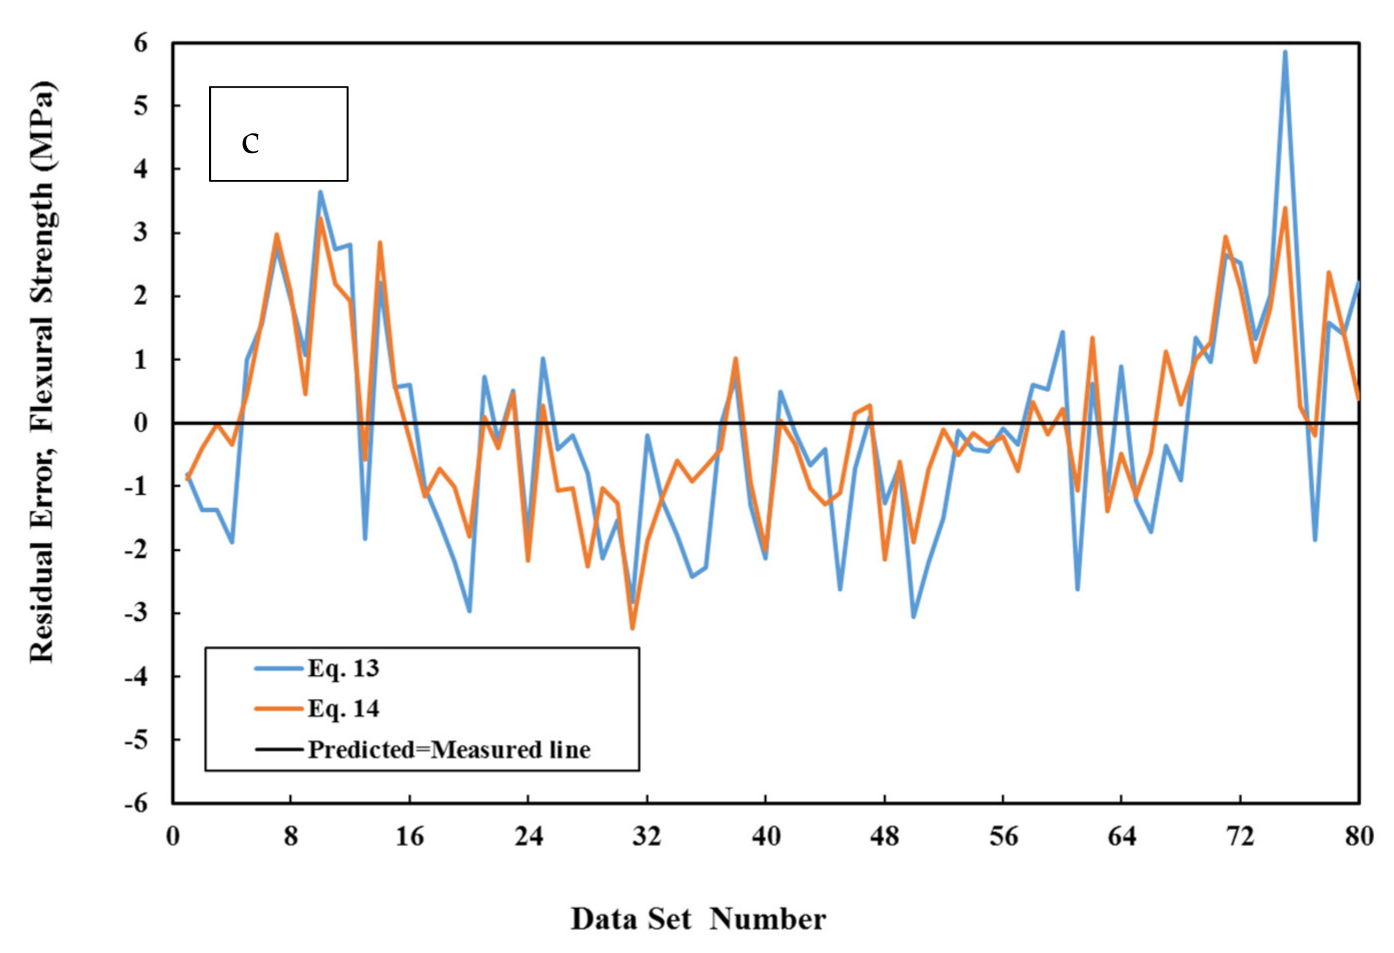
The LR model parameters (Equation (12)) and NLR model parameters (Equation (13)) concluded that increasing the polymer content (P%) significantly raises the σ
f of cement grout (
Figure 14a,b).
Because the NLR model has a lower residual error (3 MPa), an RMSE, and a higher R
2 than the LR model, it can be seen that the NLR model predicts a higher σ
f (
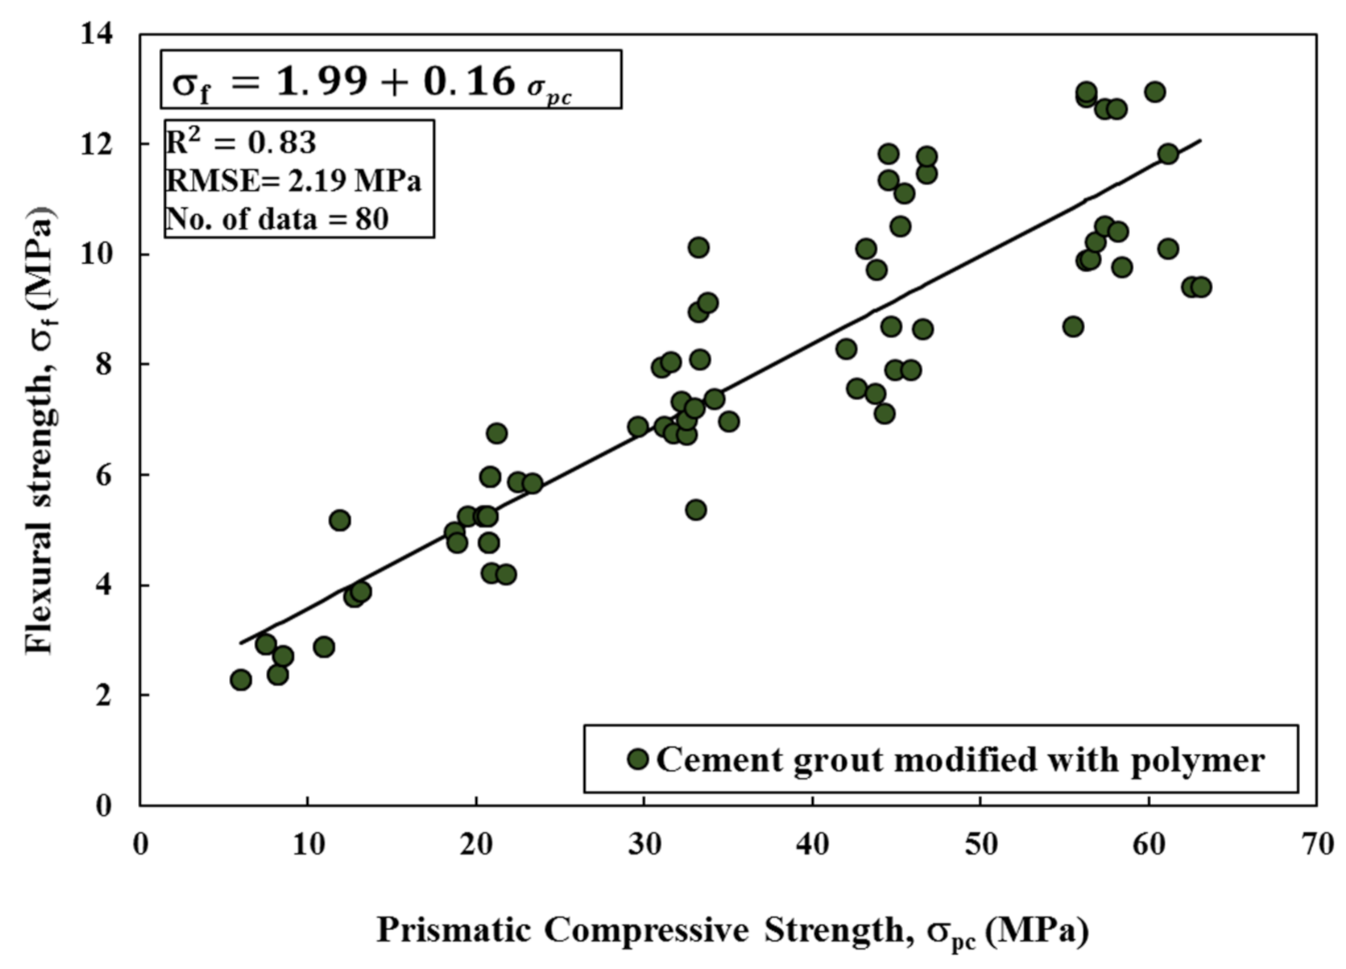
Figure 14c). σ
f increased from 4 to 11 MPa while σ
PC improved from 20 to 60 MPa (
Figure 15).
4. Limitations and Recommendations for Future Works
Detailed investigations on lime-modified cement-based grout’s fresh and mechanical properties should be conducted in different environmental conditions. However, studies that are focused on other properties such as bonding and tensile strengths of this cement-based grout are still limited. For this composite to be acceptable by the construction industry, some durability properties (more than 28 days of curing) such as water permeability, chloride resistance, fatigue performance, and freeze-thaw resistance should be examined comprehensively. Different soft computing models should be used to predict the compressive strength of cement-based grout and cement grouted sands with high accuracy of predictions.
5. Conclusions
Several conclusions can be taken depending on the modeling and tested results.
At a lower water/cement ratio, cement-basedgrout used with coarse-grained sand had higher compression strength than fine-grained sand. At a high water/cement ratio, cement-based grout prepared with fine-grained sand had higher strengths efficiency than coarse-grained sand.
In parallel with the addition of water reducer polymer, a reduction by 21.9% to 54.1 % was observed in the water/cement ratio depending on the proportion of polymers, and the cement grout flow was maintained between 18 and 23 s.
According to the electronic microscopy scanning test, the cement particles were coated by a mesh fiber created by the water reducer polymer, causing a decrease in porosity and an increase in density, increasing the cement grout’s compressive strength.
According to the linear and nonlinear model parameters, the polymer has the greatest impact on improving the compression strength of cement grout compared to the other mix proportions.
According to statistical analyses, the nonlinear technique performed better than the linear technique for predicting the cement-grouted sand compressive strength.
The cement grout compression strength was determined using a cylinder and prismatic molds following ASTM and BS standards. The conversion factor was 0.71.
In comparison to the other sands, the cement grout prepared with finer sand had the maximum flexural strength at all testing ages.
Author Contributions
Conceptualization W.M. and A.S.M.; methodology, R.K., P.G.A. and D.J.A.; modeling and formal analysis, W.M. and A.S.M.; writing—original draft preparation, P.G.A.; writing—review and editing, P.G.A., W.M. and A.S.M.; supervision. All authors have read and agreed to the published version of the manuscript.
Funding
No fund was received.
Institutional Review Board Statement
Not applicable.
Data Availability Statement
The data are available upon request.
Acknowledgments
The authors of this study would like to thank the University of Sulaimani for their support in making this study possible.
Conflicts of Interest
The authors declare no conflict of interest.
References
- Shiotani, T.; Momoki, S.; Chai, H.; Aggelis, D.G. Elastic wave validation of large concrete structures repaired by means of cement grouting. Constr. Build. Mater. 2009, 23, 2647–2652. [Google Scholar] [CrossRef] [Green Version]
- Faramarzi, L.; Rasti, A.; Abtahi, S.M. An experimental study of the effect of cement and chemical grouting on the improvement of the mechanical and hydraulic properties of alluvial formations. Constr. Build. Mater. 2016, 126, 32–43. [Google Scholar] [CrossRef]
- Mohammed, M.H.; Pusch, R.; Knutsson, S.; Hellstr, G. Rheological properties of cement-based grouts determined by different techniques. Engineering 2014, 6, 217–229. [Google Scholar] [CrossRef] [Green Version]
- Du, X.; Fang, H.; Wang, S.; Xue, B.; Wang, F. Experimental and practical investigation of the sealing efficiency of cement grouting in tortuous fractures with flowing water. Tunn. Undergr. Space Technol. 2021, 108, 103693. [Google Scholar] [CrossRef]
- Cao, J.; Gao, J.; Rad, H.N.; Mohammed, A.S.; Hasanipanah, M.; Zhou, J. A novel systematic and evolved approach based on XGBoost-firefly algorithm to predict Young’s modulus and unconfined compressive strength of rock. Eng. Comput. 2021, 1–17. [Google Scholar] [CrossRef]
- Mohammed, A.; Burhan, L.; Ghafor, K.; Sarwar, W.; Mahmood, W. Artificial neural network (ANN), M5P-tree, and regression analyses to predict the early age compression strength of concrete modified with DBC-21 and VK-98 polymers. Neural Comput. Appl. 2021, 33, 7851–7873. [Google Scholar] [CrossRef]
- Burhan, L.; Ghafor, K.; Mohammed, A. Testing and evaluation of flowability, viscosity and long-term compressive strength of cement modified with polymeric admixture WR superplasticizer. IOP Conf. Ser. Mater. Sci. Eng. 2020, 737, 012066. [Google Scholar] [CrossRef]
- Mohammed, A.; Mahmood, W.; Ghafor, K. Shear stress limit, rheological properties and compressive strength of cement-based grout modified with polymers. J. Build. Pathol. Rehabil. 2020, 5, 3. [Google Scholar] [CrossRef]
- Emad, W.; Salih, A.; Kurda, R.; Hassan, A.M.T. Multivariable models to forecast the mechanical properties of polymerized cement paste. J. Mater. Res. Technol. 2021, 14, 2677–2699. [Google Scholar] [CrossRef]
- Thanaraj, M.S. Investigations on Improving the Compressive Strength of Sand Column with Cement Grout and Chemical Admixture. Turk. J. Comput. Math. Educ. 2021, 12, 1841–1847. [Google Scholar]
- Mahmood, W.; Mohammed, A.S.; Sihag, P.; Asteris, P.G.; Ahmed, H. Interpreting the experimental results of compressive strength of hand-mixed cement-grouted sands using various mathematical approaches. Arch. Civil Mech. Eng. 2022, 22, 1–25. [Google Scholar] [CrossRef]
- Sarwar, W.; Ghafor, K.; Mohammed, A. Regression analysis and Vipulanandan model to quantify the effect of polymers on the plastic and hardened properties with the tensile bonding strength of the cement mortar. Results Mater. 2019, 1, 100011. [Google Scholar] [CrossRef]
- Avci, E.; Deveci, E.; Gokce, A. Effect of Sodium Silicate on the Strength and Permeability Properties of Ultrafine Cement Grouted Sands. J. Mater. Civ. Eng. 2021, 33, 04021203. [Google Scholar] [CrossRef]
- Cai, M.; Hocine, O.; Mohammed, A.S.; Chen, X.; Amar, M.N.; Hasanipanah, M. Integrating the LSSVM and RBFNN models with three optimization algorithms to predict the soil liquefaction potential. Eng. Comput. 2021, 1–13. [Google Scholar] [CrossRef]
- Murlidhar, B.R.; Bejarbaneh, B.Y.; Armaghani, D.J.; Mohammed, A.S.; Mohamad, E.T. Application of tree-based predictive models to forecast air overpressure induced by mine blasting. Nat. Resour. Res. 2021, 30, 1865–1887. [Google Scholar] [CrossRef]
- Yu, C.; Koopialipoor, M.; Murlidhar, B.R.; Mohammed, A.S.; Armaghani, D.J.; Mohamad, E.T.; Wang, Z. Optimal ELM–Harris Hawks optimization and ELM–Grasshopper optimization models to forecast peak particle velocity resulting from mine blasting. Nat. Resour. Res. 2021, 30, 2647–2662. [Google Scholar] [CrossRef]
- Zeng, J.; Asteris, P.G.; Mamou, A.P.; Mohammed, A.S.; Golias, E.A.; Armaghani, D.J.; Faizi, K.; Hasanipanah, M. The effectiveness of ensemble-neural network techniques to predict peak uplift resistance of buried pipes in reinforced sand. Appl. Sci. 2021, 11, 908. [Google Scholar] [CrossRef]
- Huang, J.; Asteris, P.G.; Pasha, S.M.K.; Mohammed, A.S.; Hasanipanah, M. A new auto-tuning model for predicting the rock fragmentation: A cat swarm optimization algorithm. Eng. Comput. 2020, 1–12. [Google Scholar] [CrossRef]
- Vipulanandan, C.; Ali, M.; Basirat, B.; Reddy, A.; Amin, N.; Mohammed, A.; Dighe, S.; Farzam, H. Field test for real time monitoring of piezoresistive smart cement to verify the cementing operations. In Proceedings of the Offshore Technology Conference, Houston, TX, USA, 2–5 May 2016; OnePetro, 2016. [Google Scholar]
- Avci, E. The effect of different curing temperatures on the strength of microfine cement grouted sands. Rom. J. Mater. 2021, 51, 272–280. [Google Scholar]
- Emad, W.; Salih, A.; Kurda, R. Forecasting the mechanical properties of soilcrete using various simulation approaches. In Structures; Elsevier: Amsterdam, The Netherlands, 2021; Volume 34, pp. 653–665. [Google Scholar]
- Puertas, F.; Santos, H.; Palacios, M.; Martínez-Ramírez, S. Polycarboxylate superplasticiser admixtures: Effect on hydration, microstructure and rheological behaviour in cement pastes. Adv. Cem. Res. 2005, 17, 77–89. [Google Scholar] [CrossRef]
- Hamad, A.J. Size and shape effect of specimen on the compressive strength of HPLWFC reinforced with glass fibres. J. King Saud Univ. Eng. Sci. 2017, 29, 373–380. [Google Scholar] [CrossRef] [Green Version]
- Malaikah, A.S. Effect of specimen size and shape on the compressive strength of high strength concrete. Pertanika J. Sci. Technol. 2005, 13, 87–96. [Google Scholar]
Figure 1.
Flowchart of methodology.
Figure 1.
Flowchart of methodology.
Figure 2.
XRD test result for (a) Water reducer polymer and (b) OPC.
Figure 2.
XRD test result for (a) Water reducer polymer and (b) OPC.
Figure 3.
Portland cement (a) chemical, and (b) phase composition.
Figure 3.
Portland cement (a) chemical, and (b) phase composition.
Figure 4.
The particale size distribuation (PSD) of sands.
Figure 4.
The particale size distribuation (PSD) of sands.
Figure 5.
SEM (a) PC and (b) water-reducer polymer.
Figure 5.
SEM (a) PC and (b) water-reducer polymer.
Figure 6.
SEM test for (a) cement grout and (b) cement grout treated with water-reducer polymer.
Figure 6.
SEM test for (a) cement grout and (b) cement grout treated with water-reducer polymer.
Figure 7.
The flow of cement grout with different dosages water reducer polymer.
Figure 7.
The flow of cement grout with different dosages water reducer polymer.
Figure 8.
Typical cylindrical CS of CG modified with water reducer polymer at (a) one day of curing and (b) 28 days of curing.
Figure 8.
Typical cylindrical CS of CG modified with water reducer polymer at (a) one day of curing and (b) 28 days of curing.
Figure 9.
Measured and predicted relationship for the cylindrical CS of CG (a) LR model, and (b) NLR model.
Figure 9.
Measured and predicted relationship for the cylindrical CS of CG (a) LR model, and (b) NLR model.
Figure 10.
Typical variation of prismatic CS of CG modified with water reducer polymer-polymer at (a) one d and (b) 28 d of curing.
Figure 10.
Typical variation of prismatic CS of CG modified with water reducer polymer-polymer at (a) one d and (b) 28 d of curing.
Figure 11.
Measured and predicted relationship for the Prismatic CS of CG (a) LR model, (b) NLR model, and (c) residual error.
Figure 11.
Measured and predicted relationship for the Prismatic CS of CG (a) LR model, (b) NLR model, and (c) residual error.
Figure 12.
Prismatic and cylindrical CS correlation of CG modified with water reducer polymer 3.5. Flexural Strength.
Figure 12.
Prismatic and cylindrical CS correlation of CG modified with water reducer polymer 3.5. Flexural Strength.
Figure 13.
Typical variation of σf for CG modified with water reducer polymer at (a) 1 day of curing, and (b) 28 days of curing.
Figure 13.
Typical variation of σf for CG modified with water reducer polymer at (a) 1 day of curing, and (b) 28 days of curing.
Figure 14.
Measured and predicted relationship for the flexural strength of CG (a) LR model, (b) NLR model, and (c) residual error.
Figure 14.
Measured and predicted relationship for the flexural strength of CG (a) LR model, (b) NLR model, and (c) residual error.
Figure 15.
Correlation between compressive and flexural strengths of CG modified with water reducer polymer.
Figure 15.
Correlation between compressive and flexural strengths of CG modified with water reducer polymer.
Table 1.
Properties of the sands which were used in this study.
Table 1.
Properties of the sands which were used in this study.
| Sand No. | d10 (mm) | d30 (mm) | d50 (mm) | Gs |
|---|
| 1 | 0.42 | 0.62 | 0.75 | 2.62 |
| 2 | 0.18 | 0.22 | 0.29 | 2.59 |
| 3 | 0.33 | 0.42 | 0.51 | 2.65 |
| 4 | 0.14 | 0.28 | 0.41 | 2.64 |
| 5 | 0.31 | 0.36 | 0.42 | 2.66 |
Table 2.
Flow time and CS tests summary for the CG.
Table 2.
Flow time and CS tests summary for the CG.
| Sand | Water/Cement Ratio | Flow Time (s) | Axial Strength (7 Days) (MPa) | Compressive Strength (28 Days) (MPa) |
|---|
| 1 | 0.5 | 31.2 | 31.2 | 37.2 |
| 0.53 | 26.5 | 28.1 | 34.5 |
| 0.57 | 24.2 | 16.1 | 22.2 |
| 0.6 | 18.7 | 16.8 | 20.8 |
| 2 | 0.5 | 30.6 | 25.4 | 32.7 |
| 0.53 | 28.1 | 23 | 29.6 |
| 0.57 | 27.3 | 20.4 | 26.2 |
| 0.6 | 19.3 | 15.2 | 20.6 |
| 3 | 0.5 | 29.2 | 29 | 36.8 |
| 0.53 | 27.0 | 28 | 32.7 |
| 0.57 | 23.6 | 16 | 21.8 |
| 0.6 | 19.3 | 15.2 | 20.6 |
| 4 | 0.5 | 30.1 | 25.3 | 33.8 |
| 0.53 | 27.8 | 24.6 | 31.1 |
| 0.57 | 25.4 | 19.2 | 24.9 |
| 0.6 | 21.0 | 17.3 | 22.5 |
| 5 | 0.5 | 28.22 | 28.9 | 34.5 |
| 0.53 | 27.3 | 27.4 | 31.9 |
| 0.57 | 23.8 | 17.8 | 23.3 |
| 0.6 | 20.2 | 16.2 | 21.6 |
| Publisher’s Note: MDPI stays neutral with regard to jurisdictional claims in published maps and institutional affiliations. |
© 2022 by the authors. Licensee MDPI, Basel, Switzerland. This article is an open access article distributed under the terms and conditions of the Creative Commons Attribution (CC BY) license (https://creativecommons.org/licenses/by/4.0/).


 ,
, 


