
Ecological Conditions of the Lower Dniester and Some Indicators for Assessment of the Hydropower Impact


 ,
, 
Abstract
:1. Introduction
- -
- Upper-Carpathian (from the source to the Nizhnee village, the mouth of the river Tlumach, length 296 km).
- -
- Middle-Mohyliv-Podilskyi (from the Nizhnee village to Dubossary, length 715 km).
- -
- Lower (from the dam of Dubossary Hydro Power Plant (HPP) to the mouth, length 351 km) [2].
- -
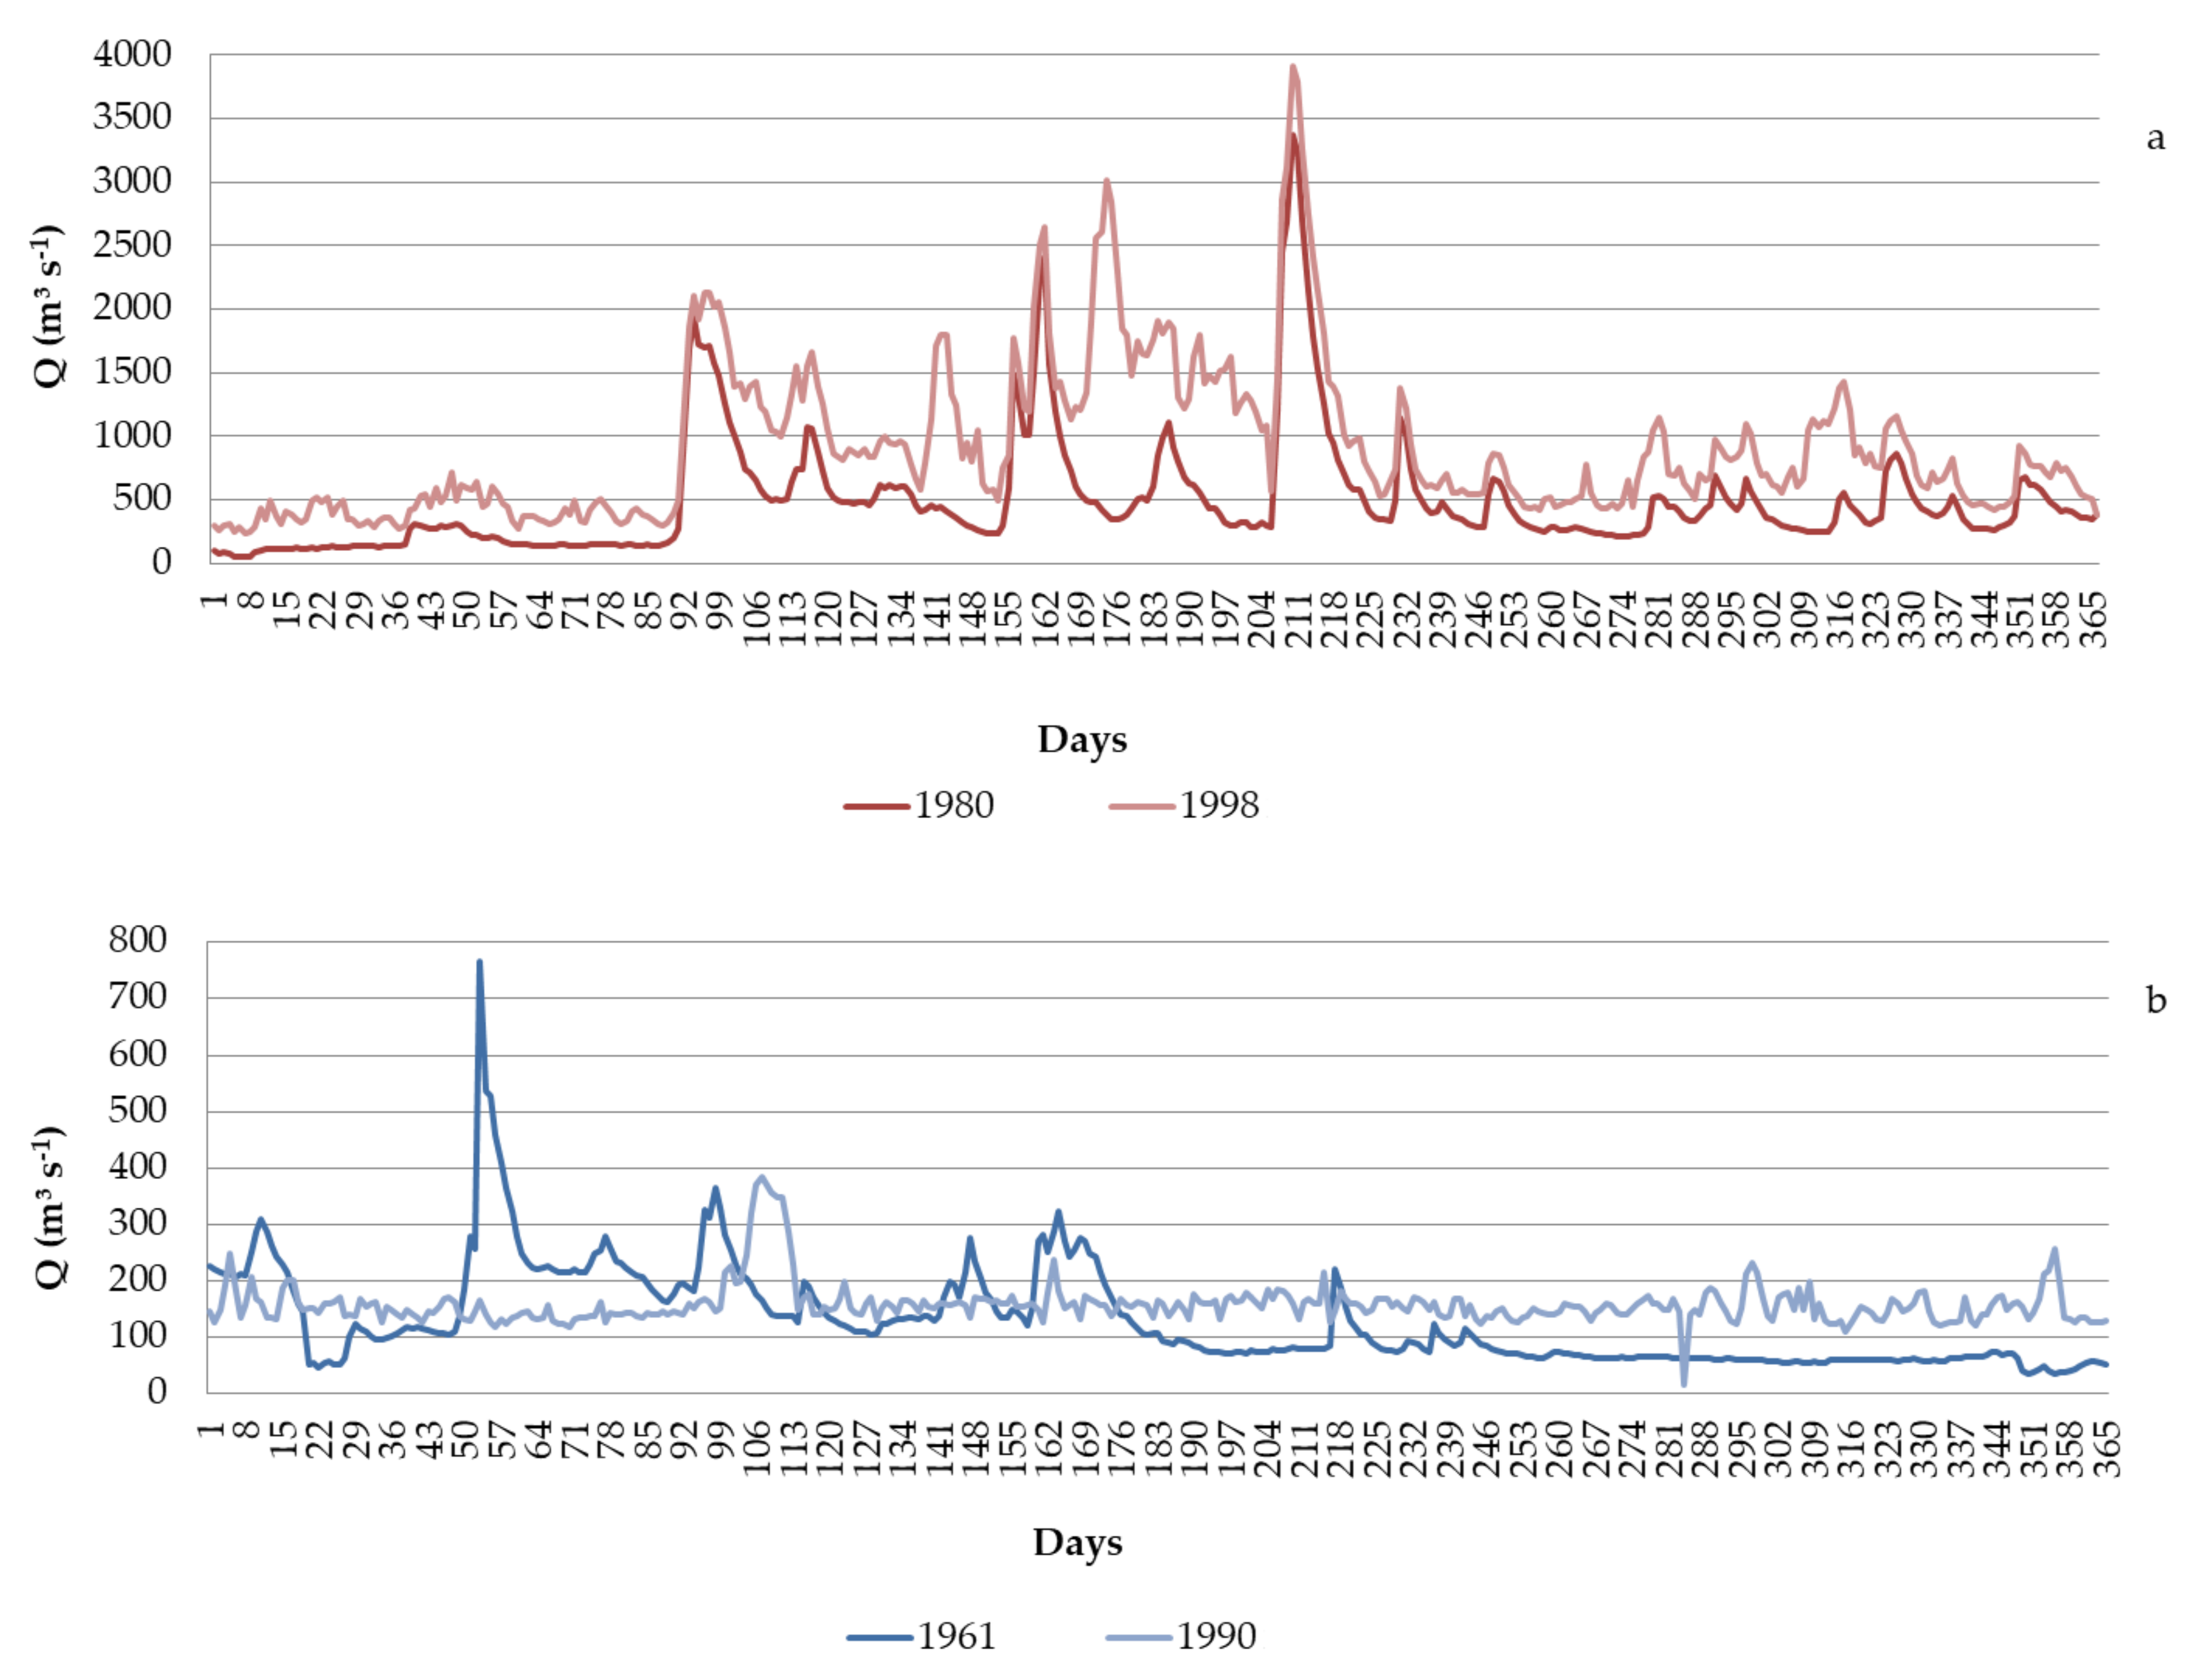
- prior to 1954, the natural period without flow regulation and without significant eutrophication, when the hydrological and hydrochemical regimes were formed only under the influence of natural factors. During this period, significant fluctuations in water flow were associated with snow melting and frequent storm floods in the catchment area. Also, there was a time when significant anthropogenic eutrophication was absent.
- -
- 1954–1987, the period of partial flow regulation. This period began while the Dubossary reservoir and the Dubossary hydropower plant (HPP) were put into operation, which led to a decrease in the flow rate and water turbidity. In the 1960s, the process of anthropogenic eutrophication began, and the 1970s were the time of the strong eutrophication impact.
- -
- 1987–2009, when the Dniester reservoir and the Dniester hydroelectric (Dniester HES-1) power station were put into operation. During this period, the hydrological regime of the Dniester middle part was considered fully regulated. As well, the 1980s were a period of extremely high eutrophication levels. The collapse of the Soviet Union in 1991 triggered an economic downturn, followed by a decline in anthropogenic eutrophication.
- -
- Since 2009, when the first hydroelectric unit of the pumped-storage power plant (PSPP) was put into operation, the reservoir is used as the lower reservoir of the PSPP. The morphometric characteristics of the buffer reservoir and the flow regime underwent some changes. Thus, the time since 2009 can be considered as a sub-period of the third (fully regulated) period.
2. Materials and Methods
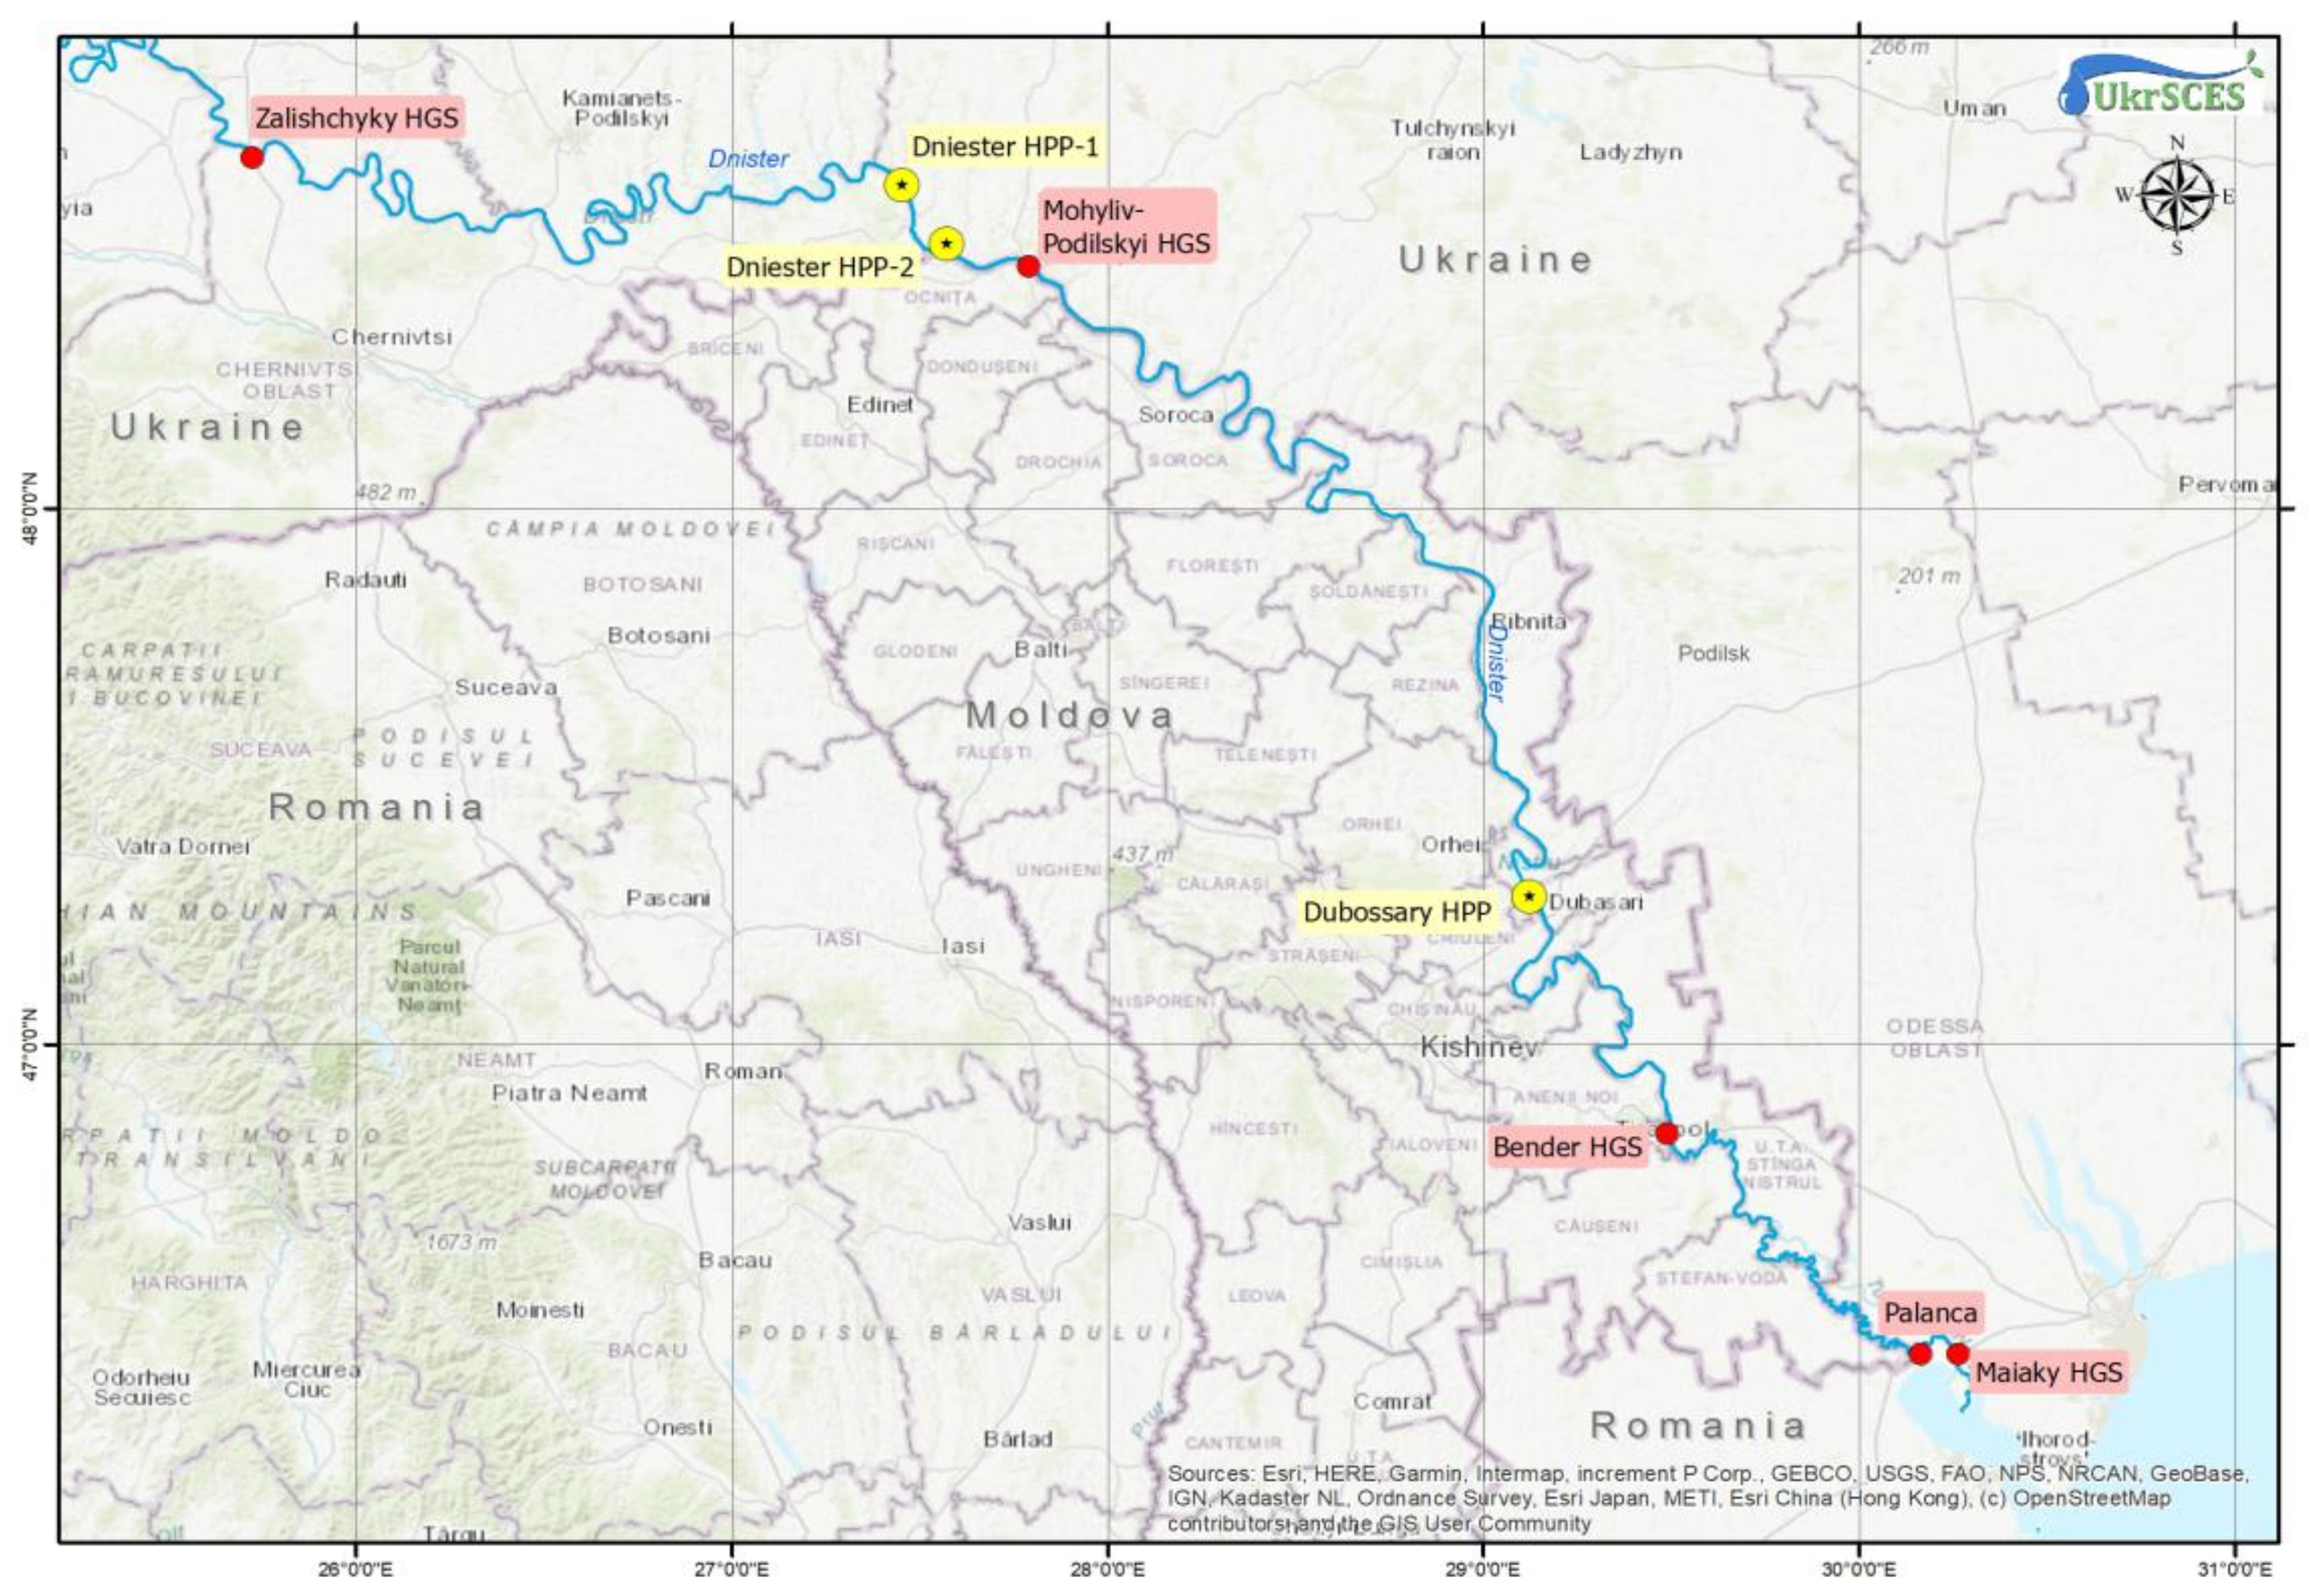
2.1. Study Area and Sampling Sites
2.2. Hydrological Analysis
- -
- Zalishchyky HGS, catchment area 24,600 km2, the upper part of the Dniester basin.
- -
- Mohyliv-Podilskyi HGS, catchment area 43,000 km2, middle part of the basin.
- -
- Bender HGS, catchment area 66,100 km2, the lower part of the basin.
2.3. Chemical Methods
2.4. Biological Methods
2.5. Data Analysis
3. Results
3.1. Runoff State of the Lower Dniester
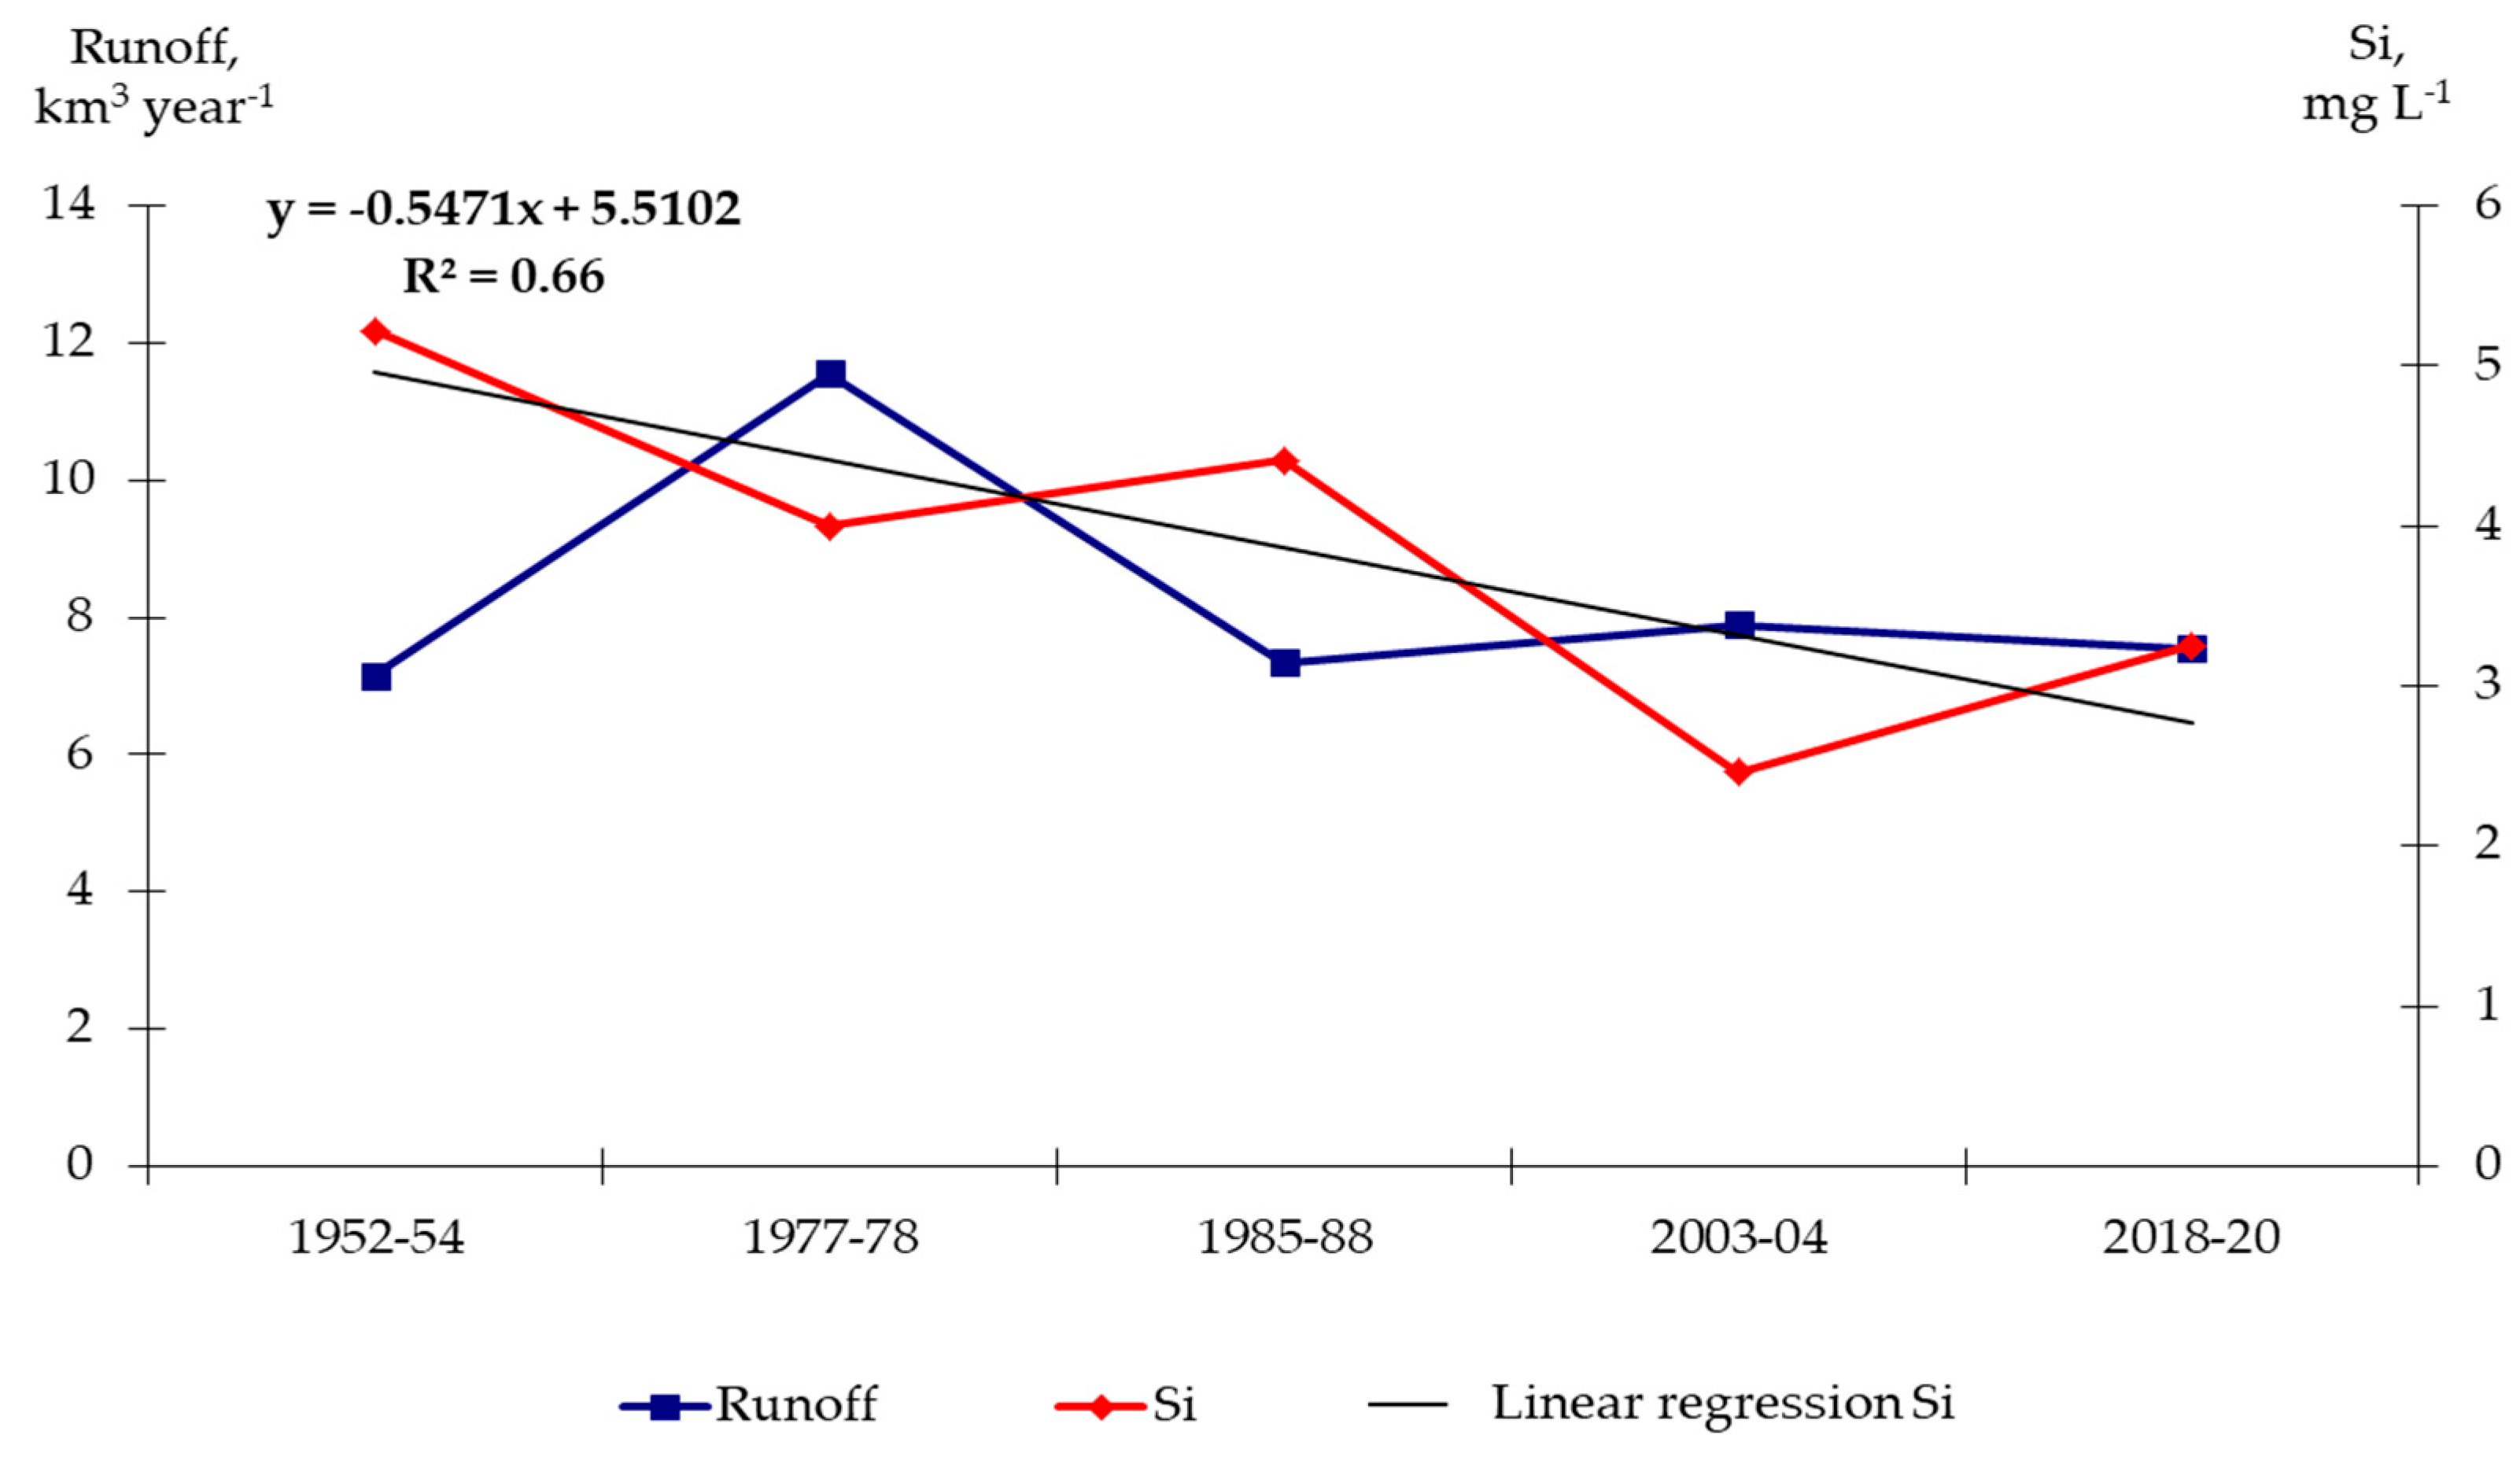
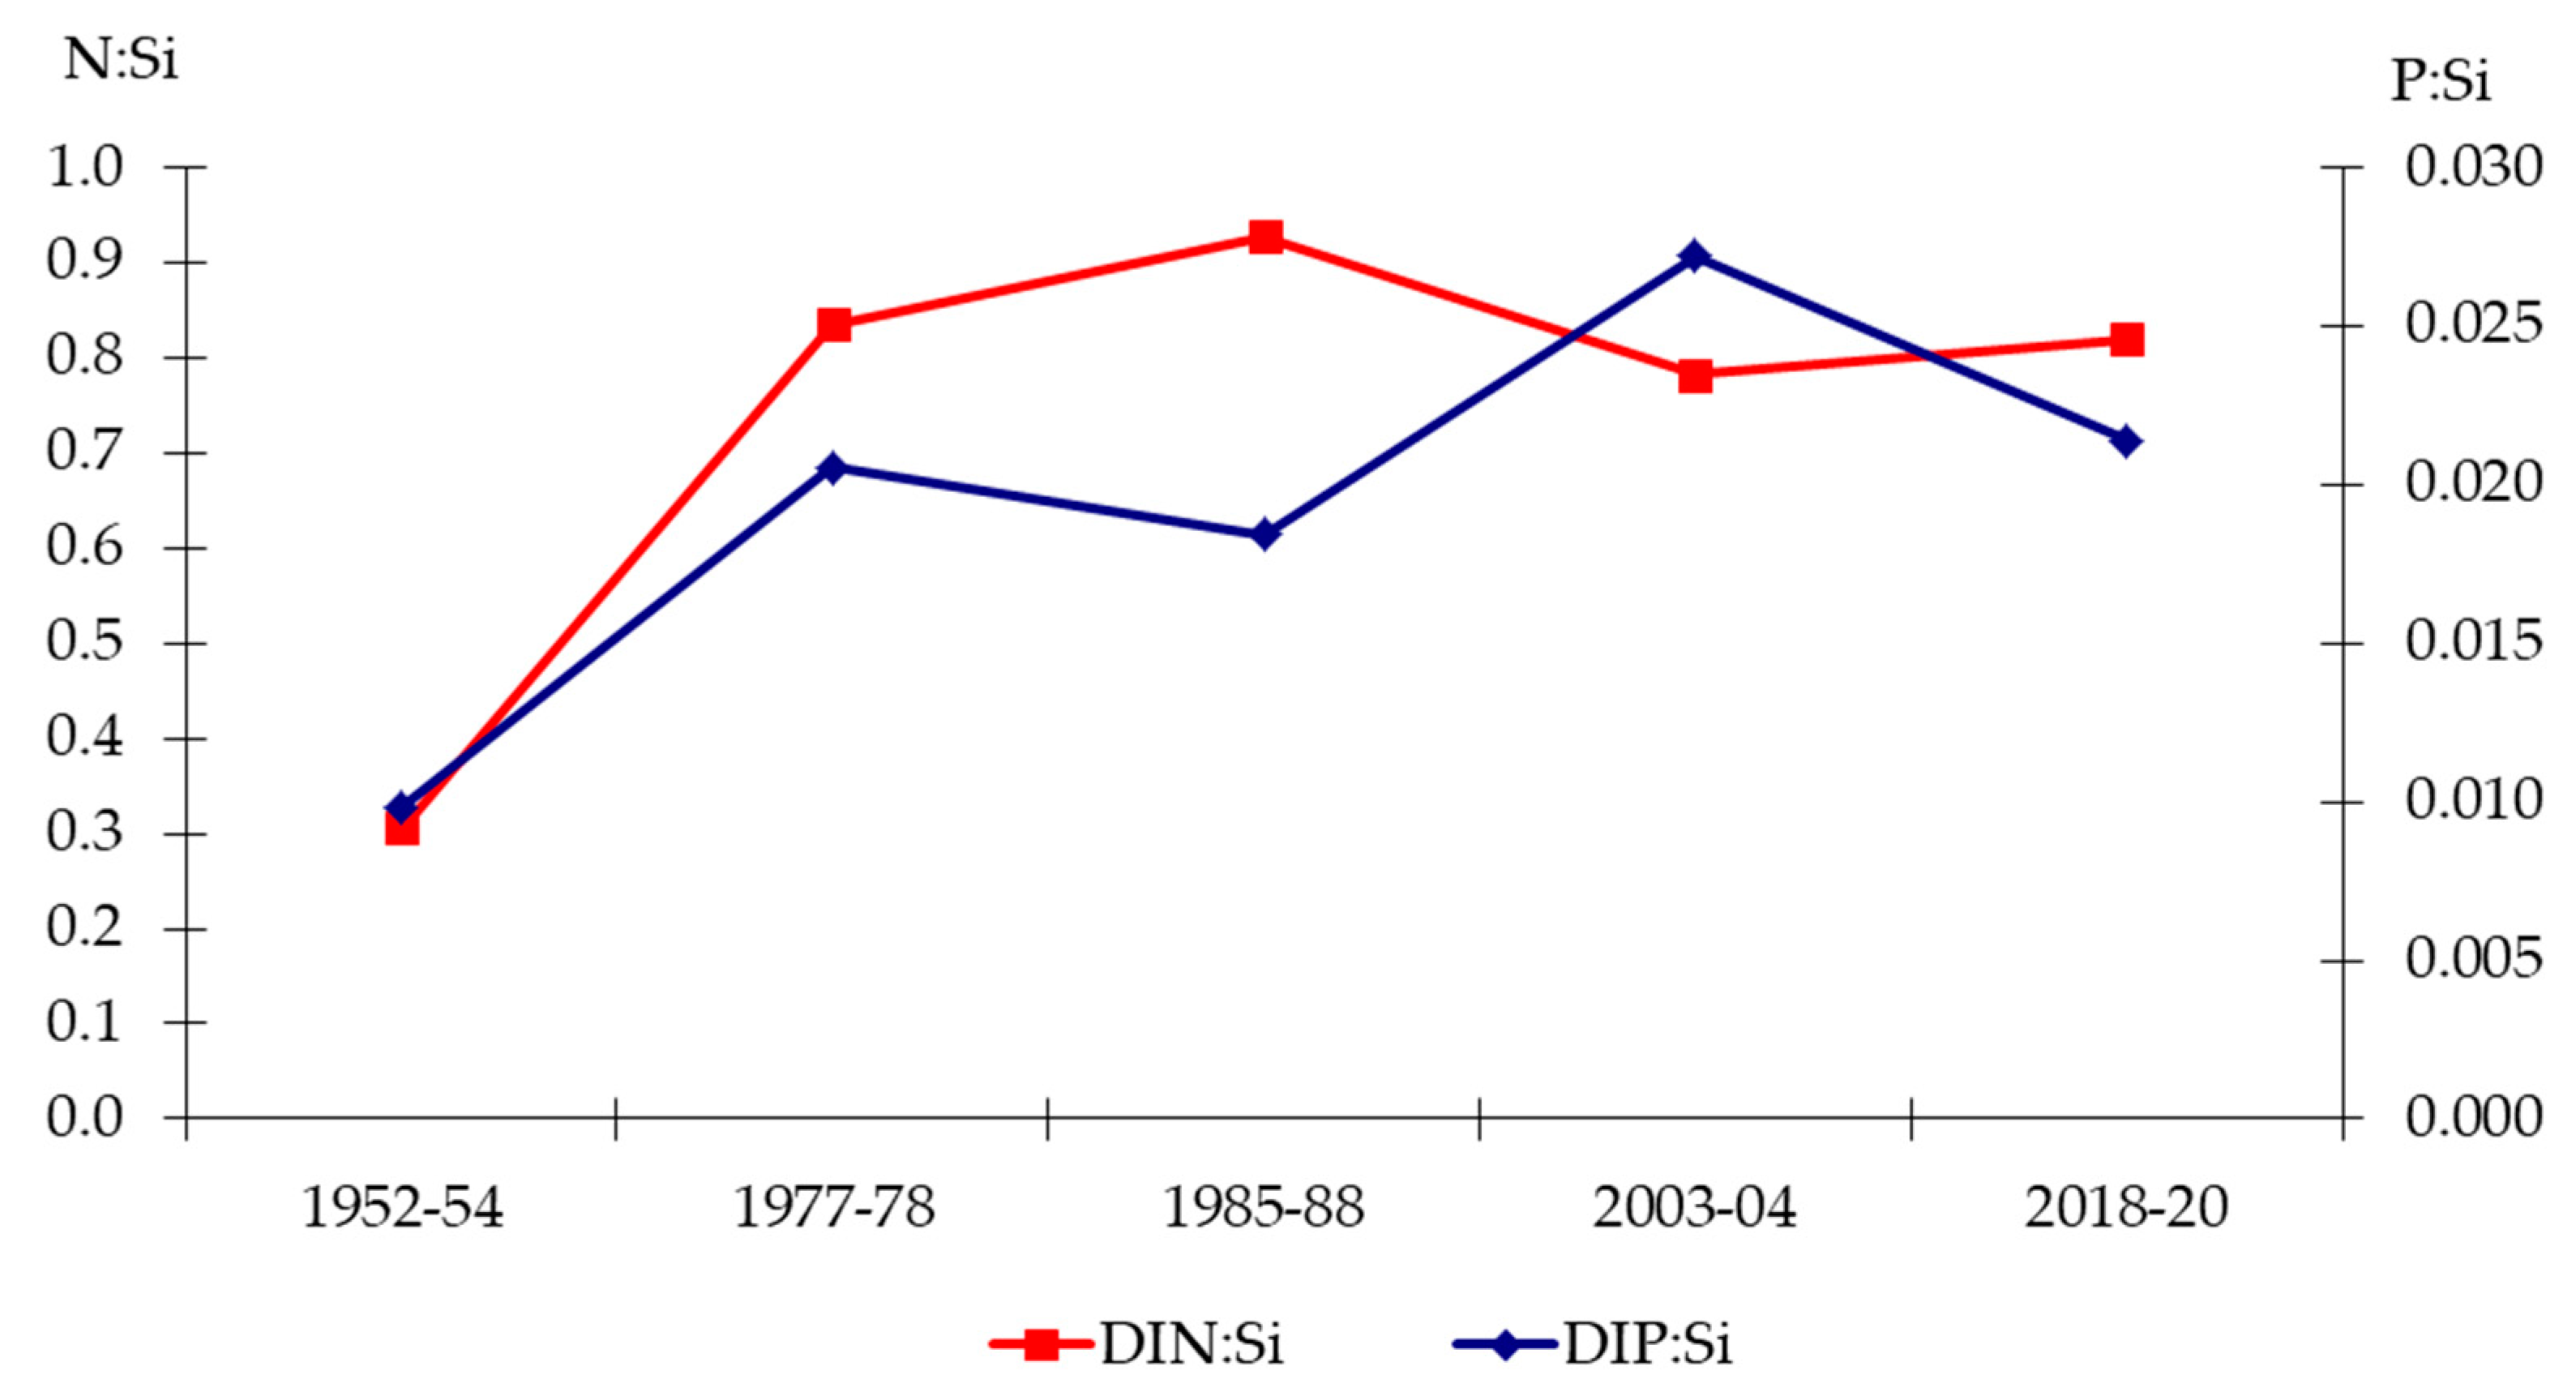
3.2. Hydrochemistry of the Lower Dniester
- (1)
- Stabilization of nutrient runoff by reducing the use of fertilizers in the catchment area.
- (2)
- Smoothing flow variability, as a result of the system of reservoirs.
- (3)
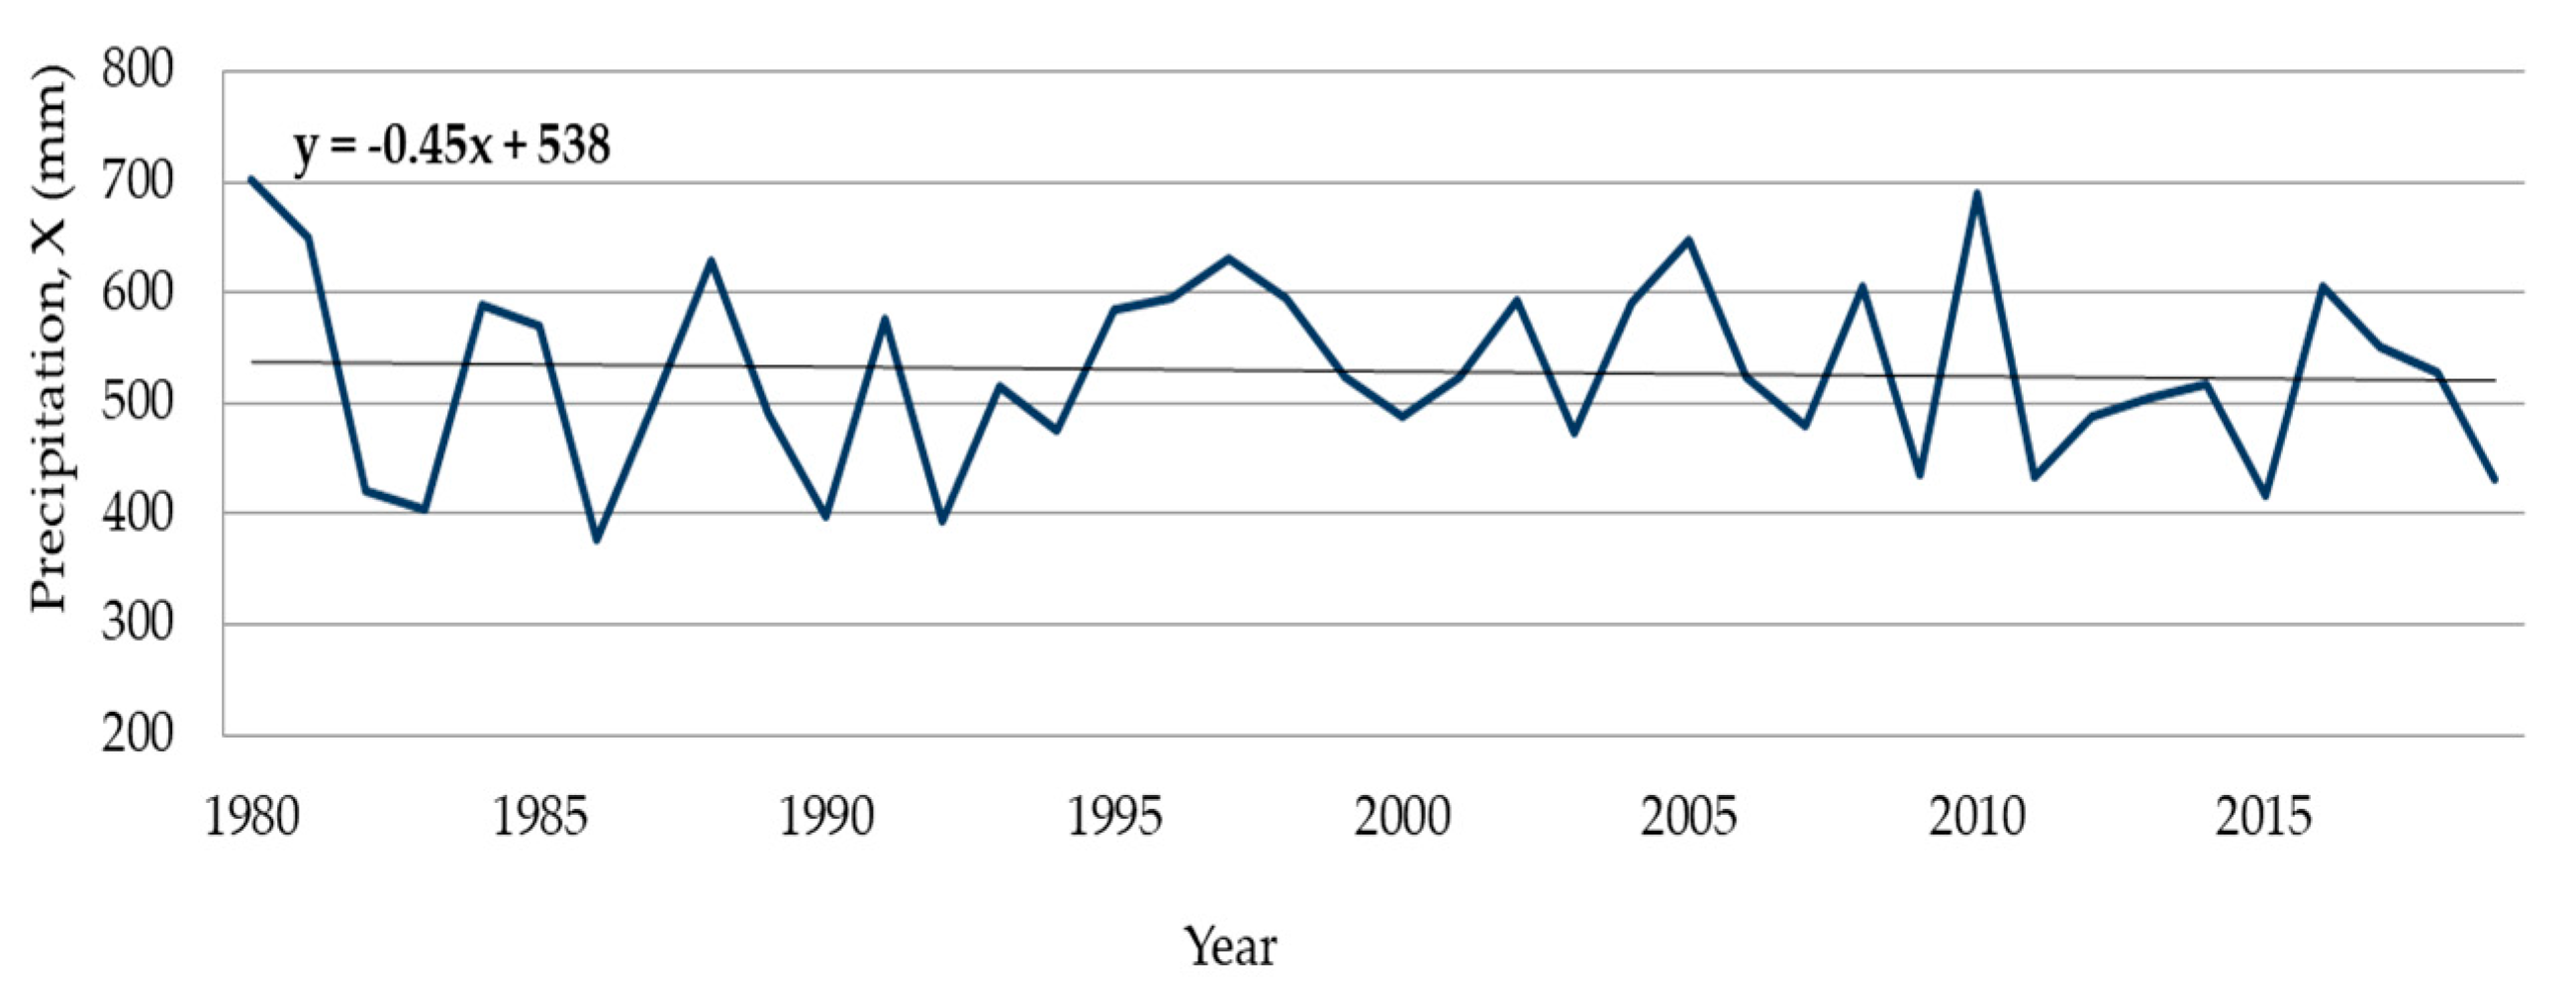
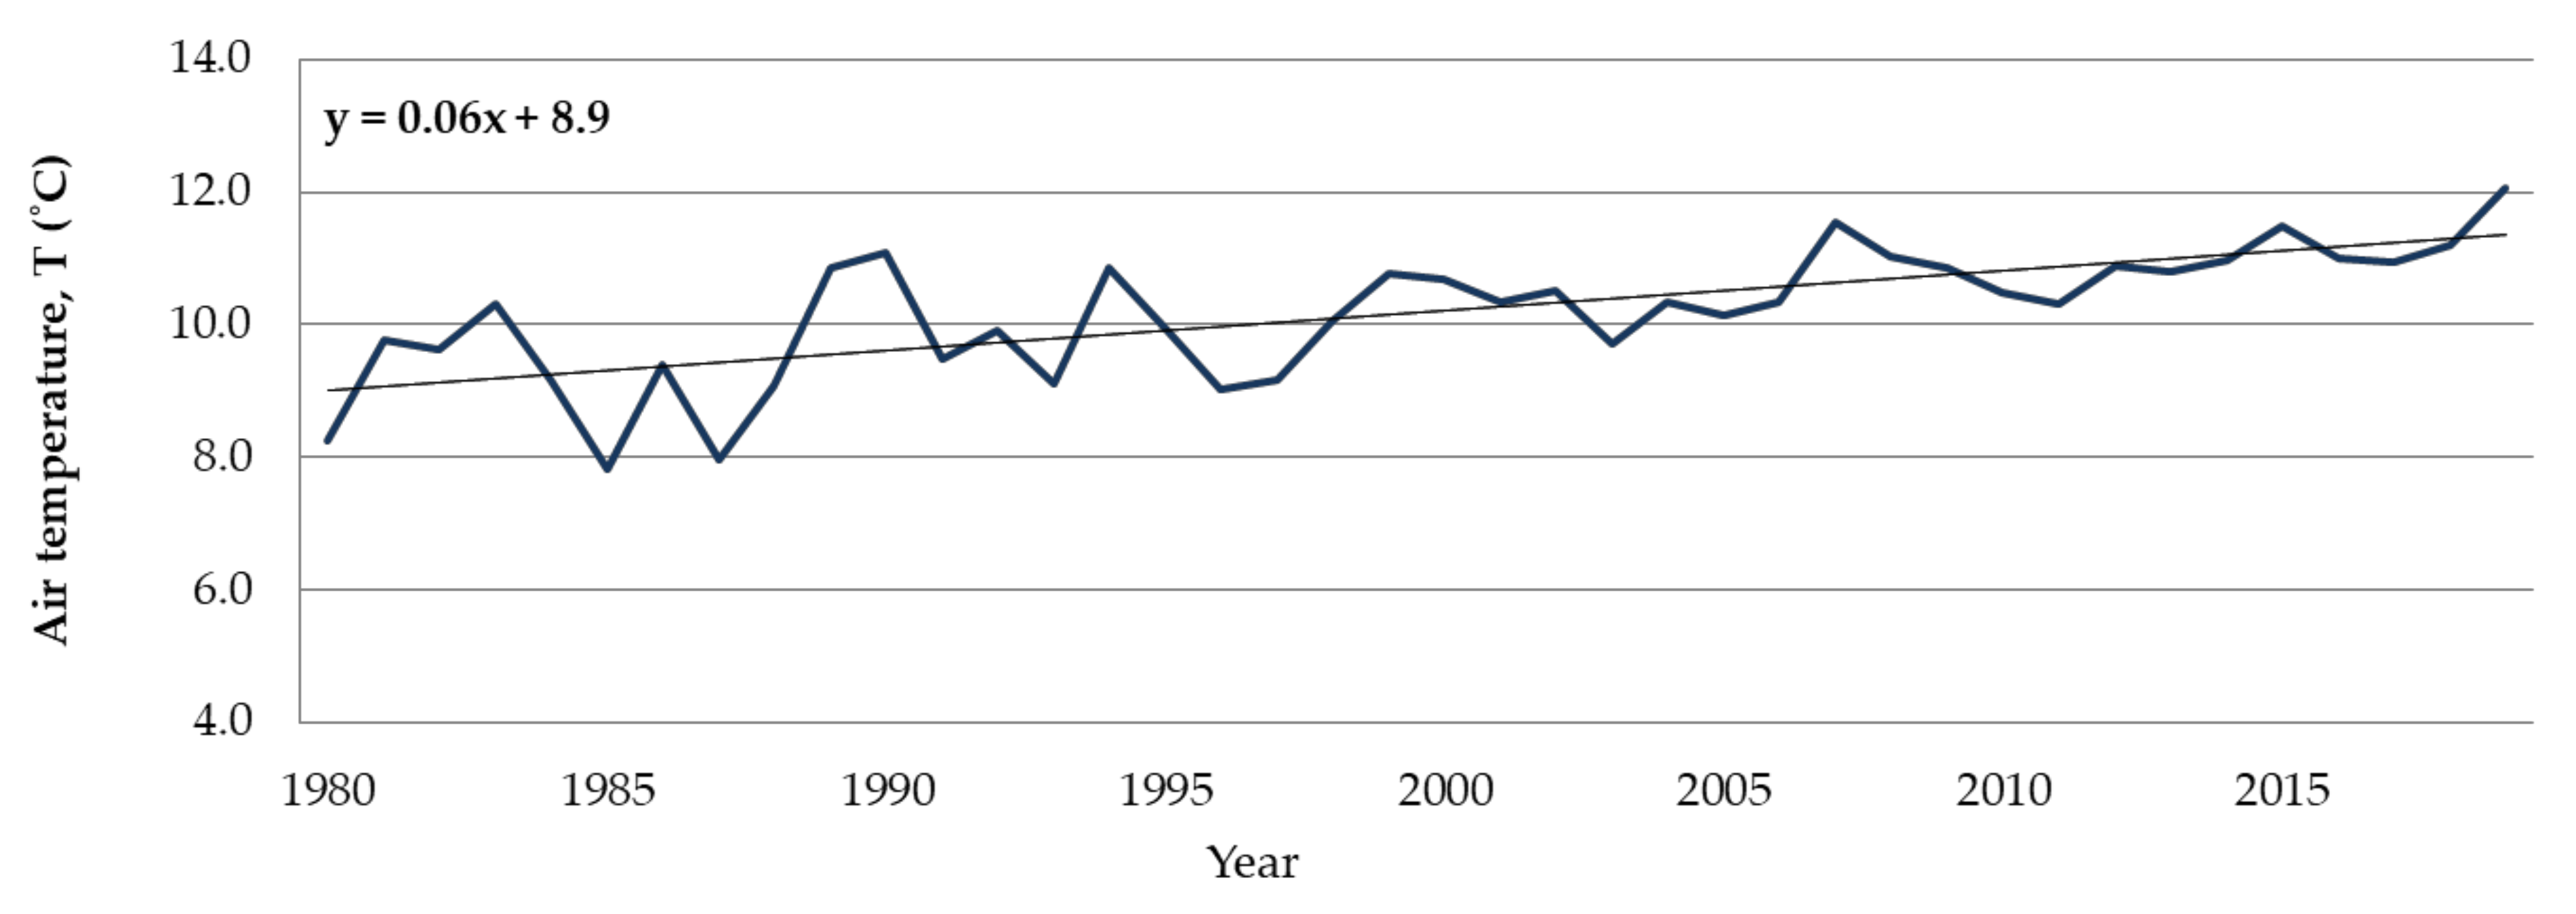
- Transformation of river runoff because of climate change, as well as massive deforestation in the upper catchment, where the bulk of the runoff originates.
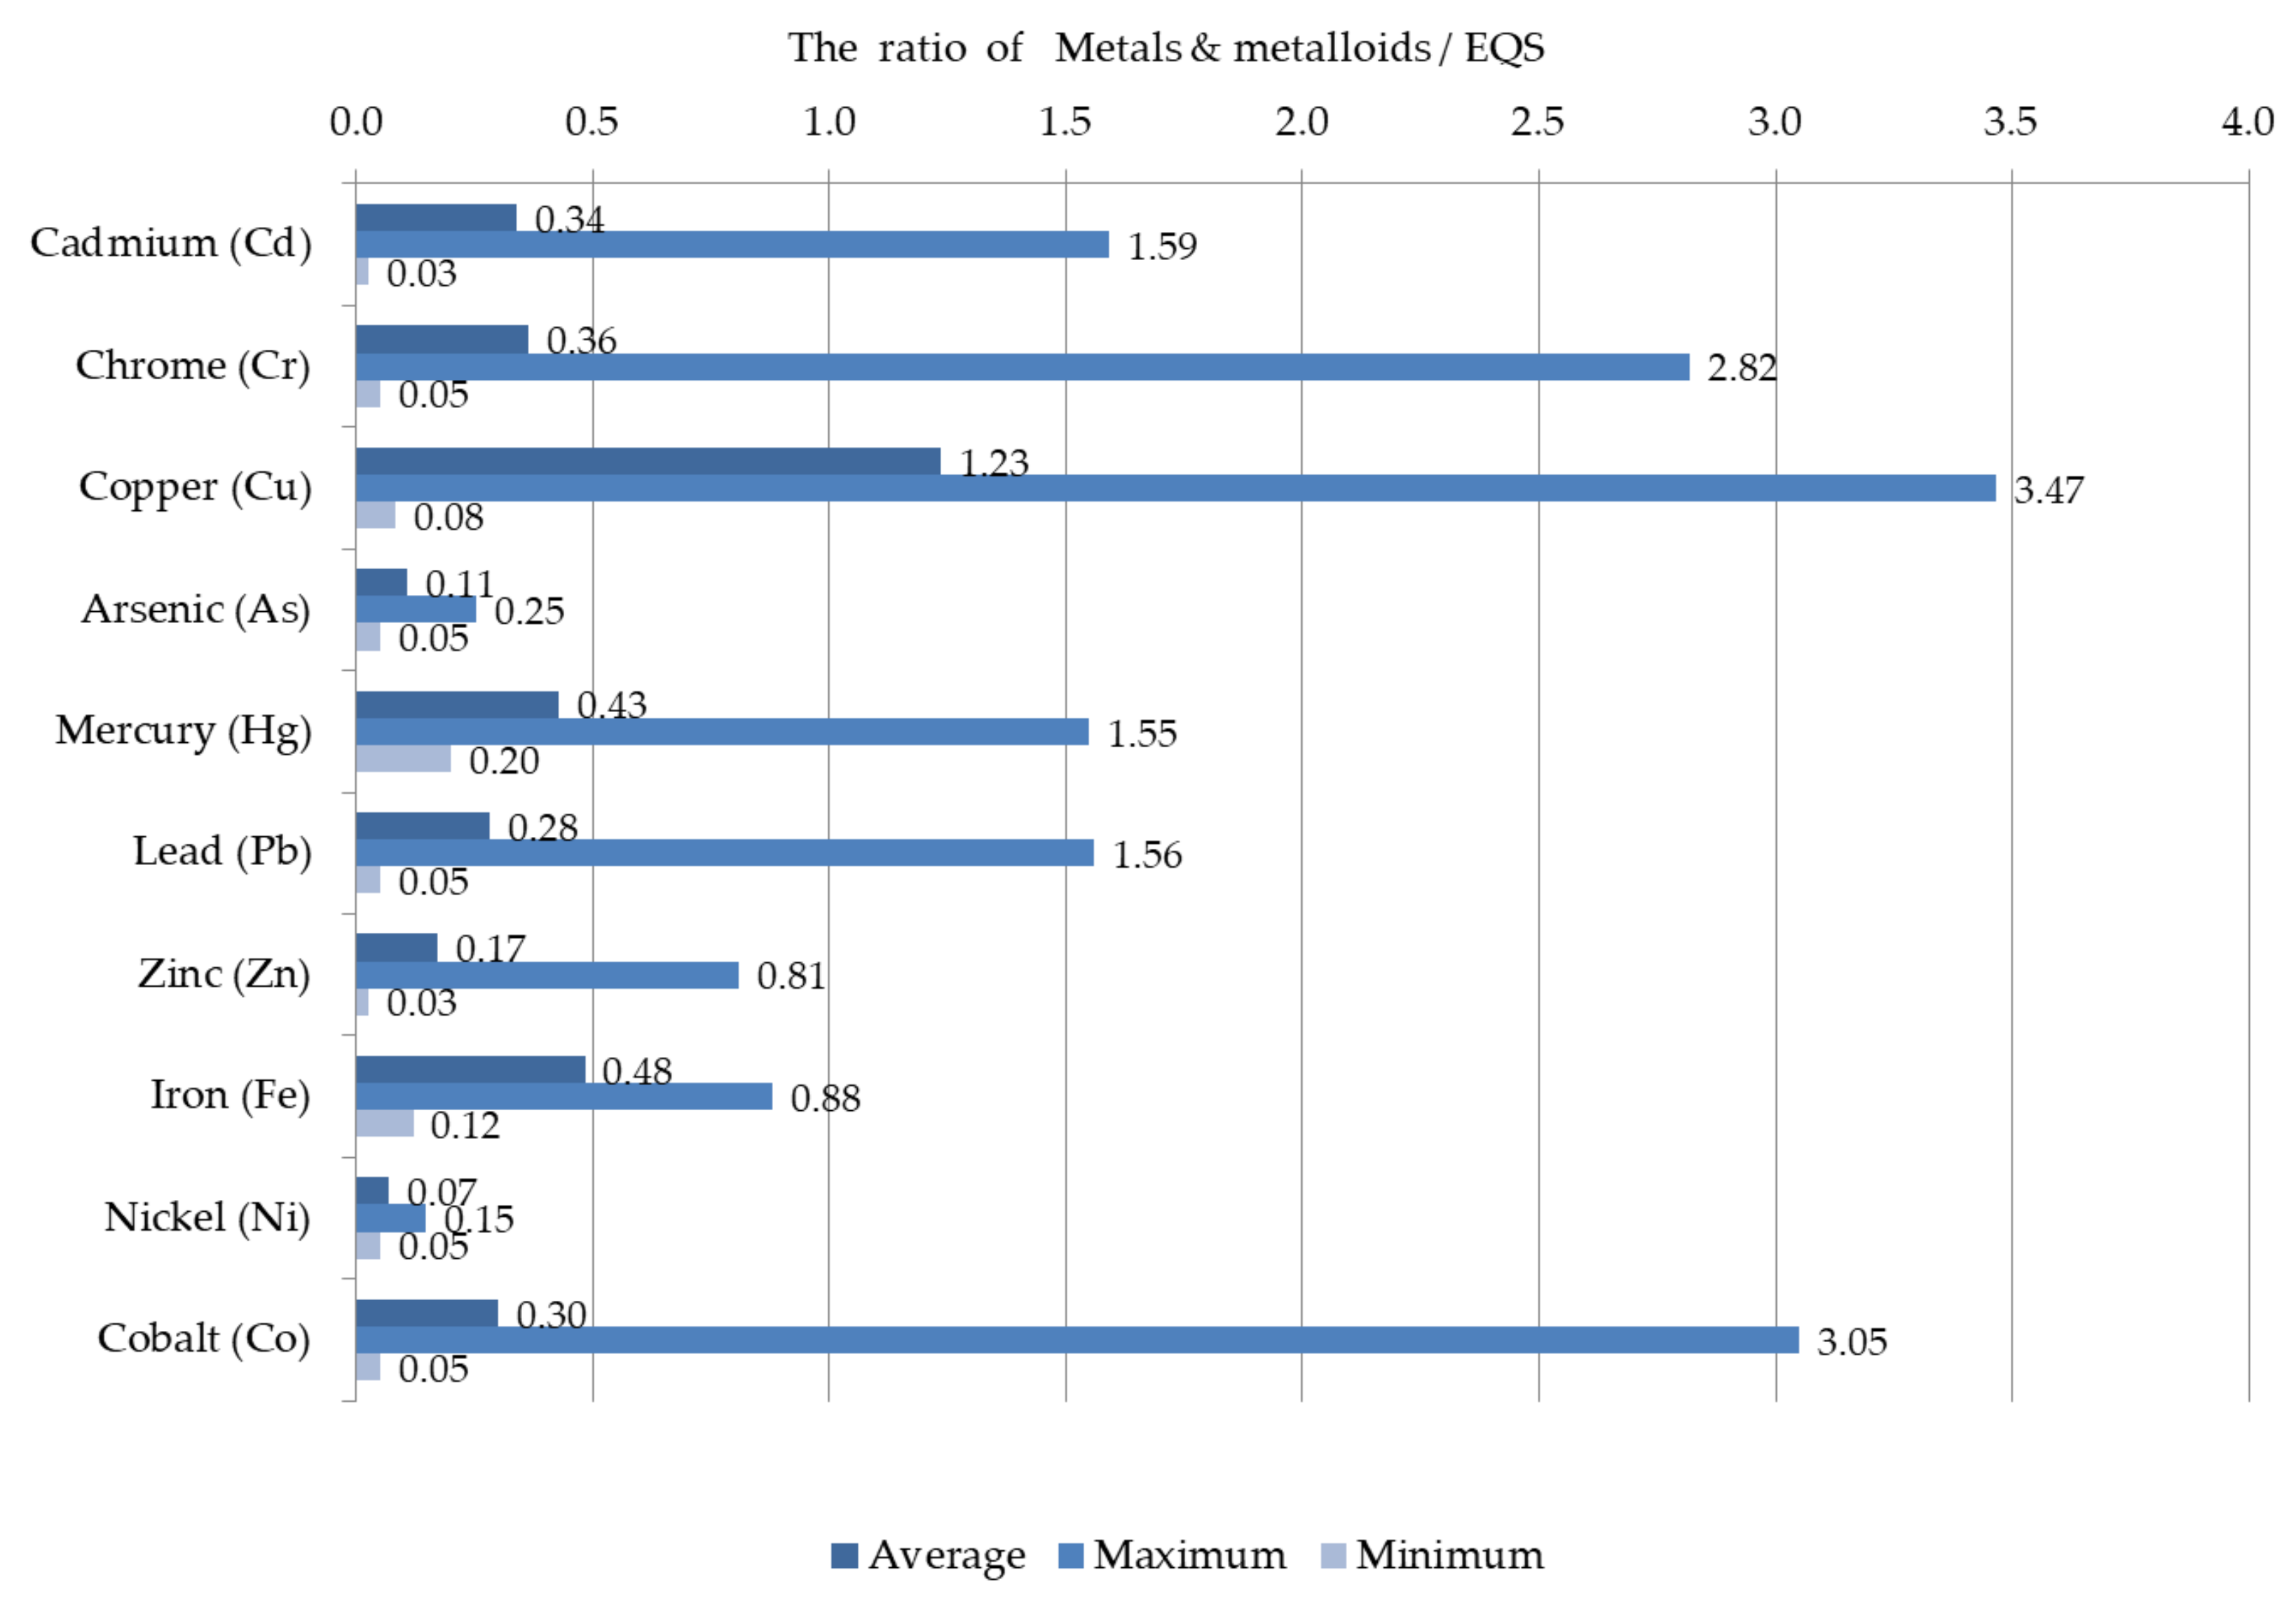
- −
- in winter, chromium in 2.8 times (EQS = 5.0 µg L−1), cadmium in 1.6 times (EQS = 1.0 µg L−1), mercury in 1.6 times (EQS = 0.1 µg L−1).
- −
- in spring, lead in 1.6 times (EQS = 10.0 µg L−1).
- −
- in summer, cobalt in 3.0 times (EQS = 5.0 µg L−1).
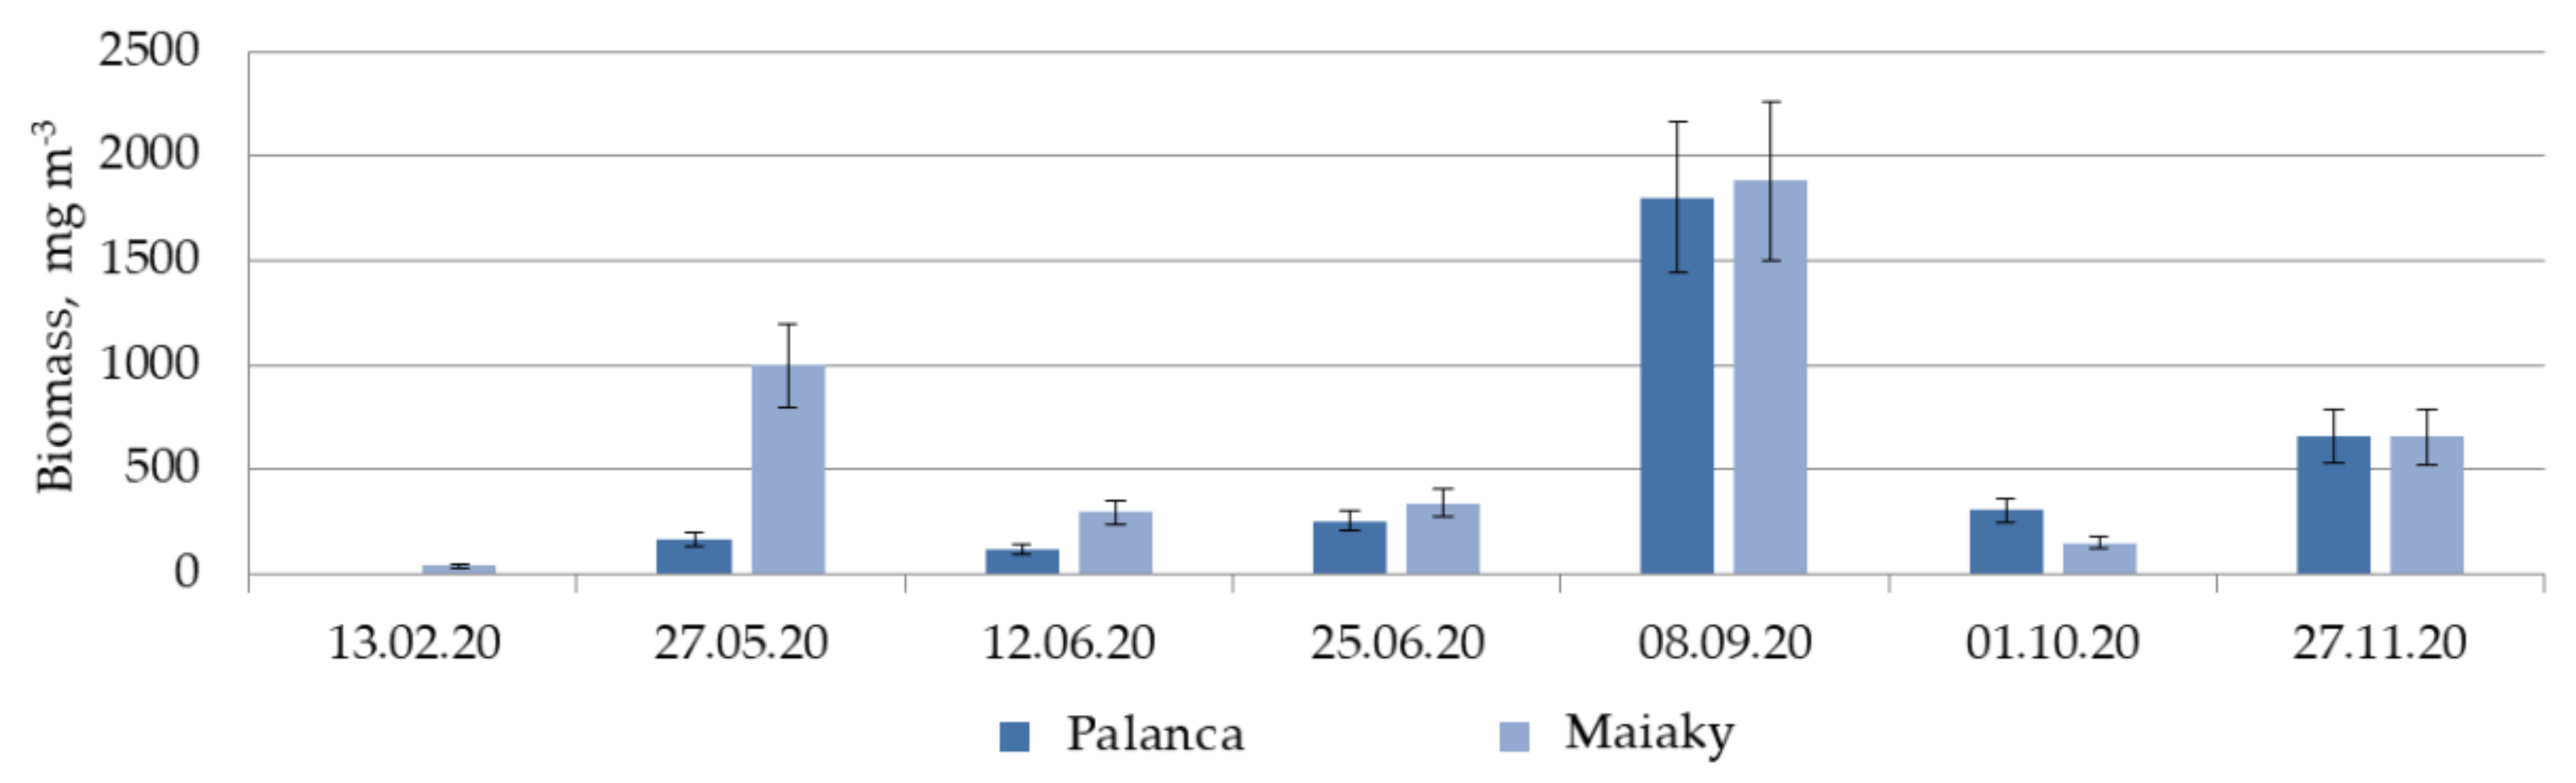
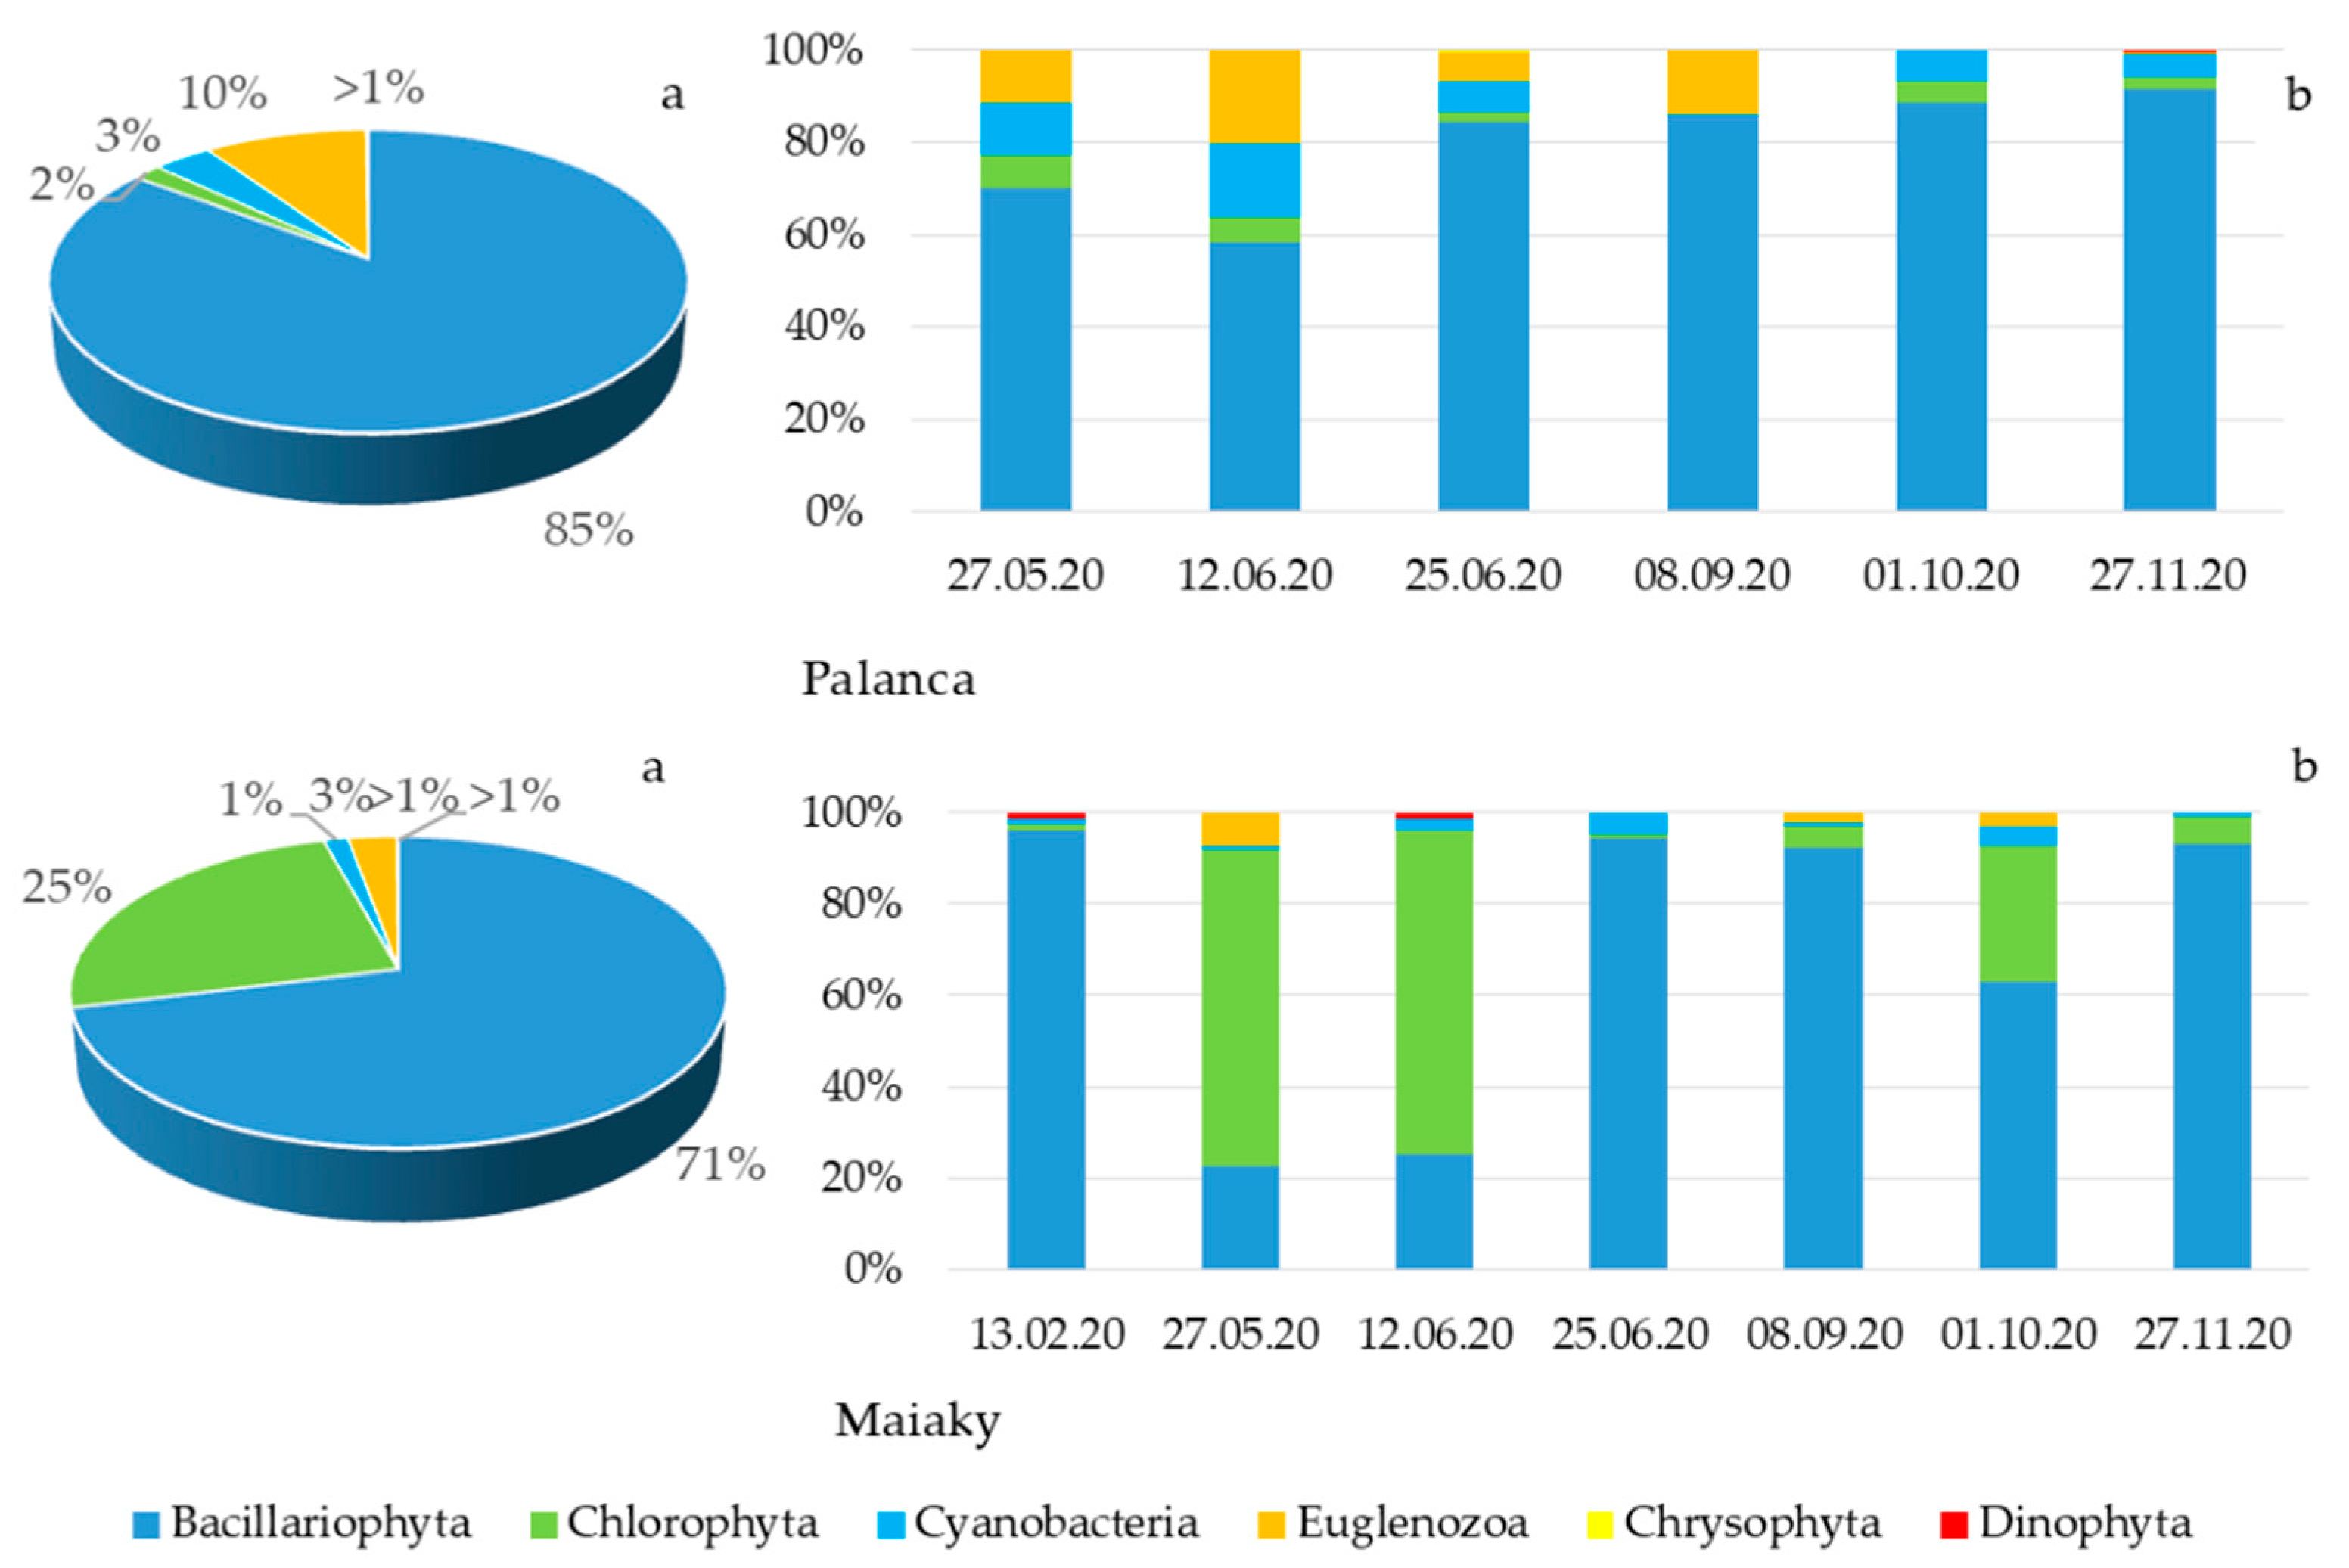
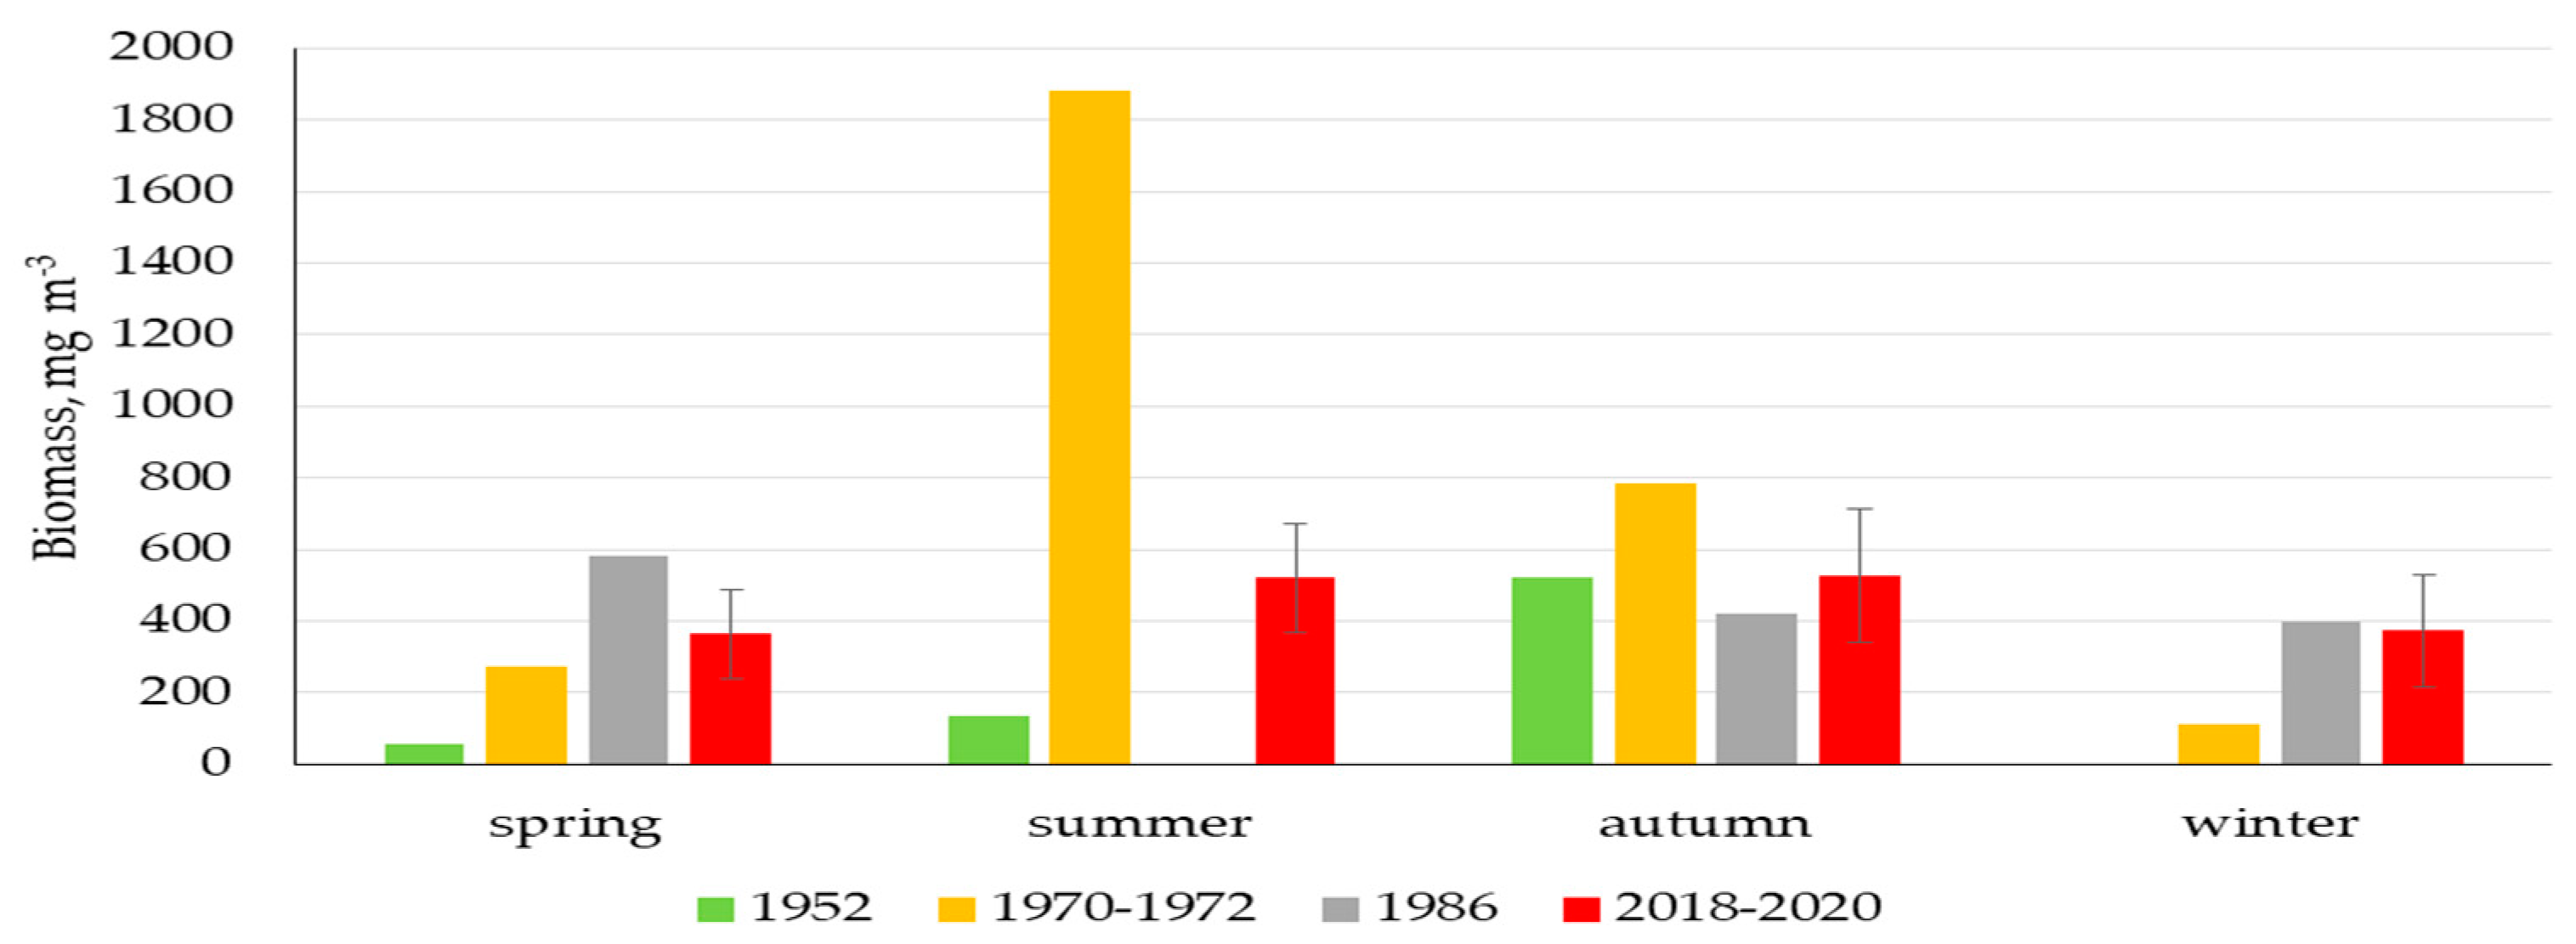
3.3. Phytoplankton
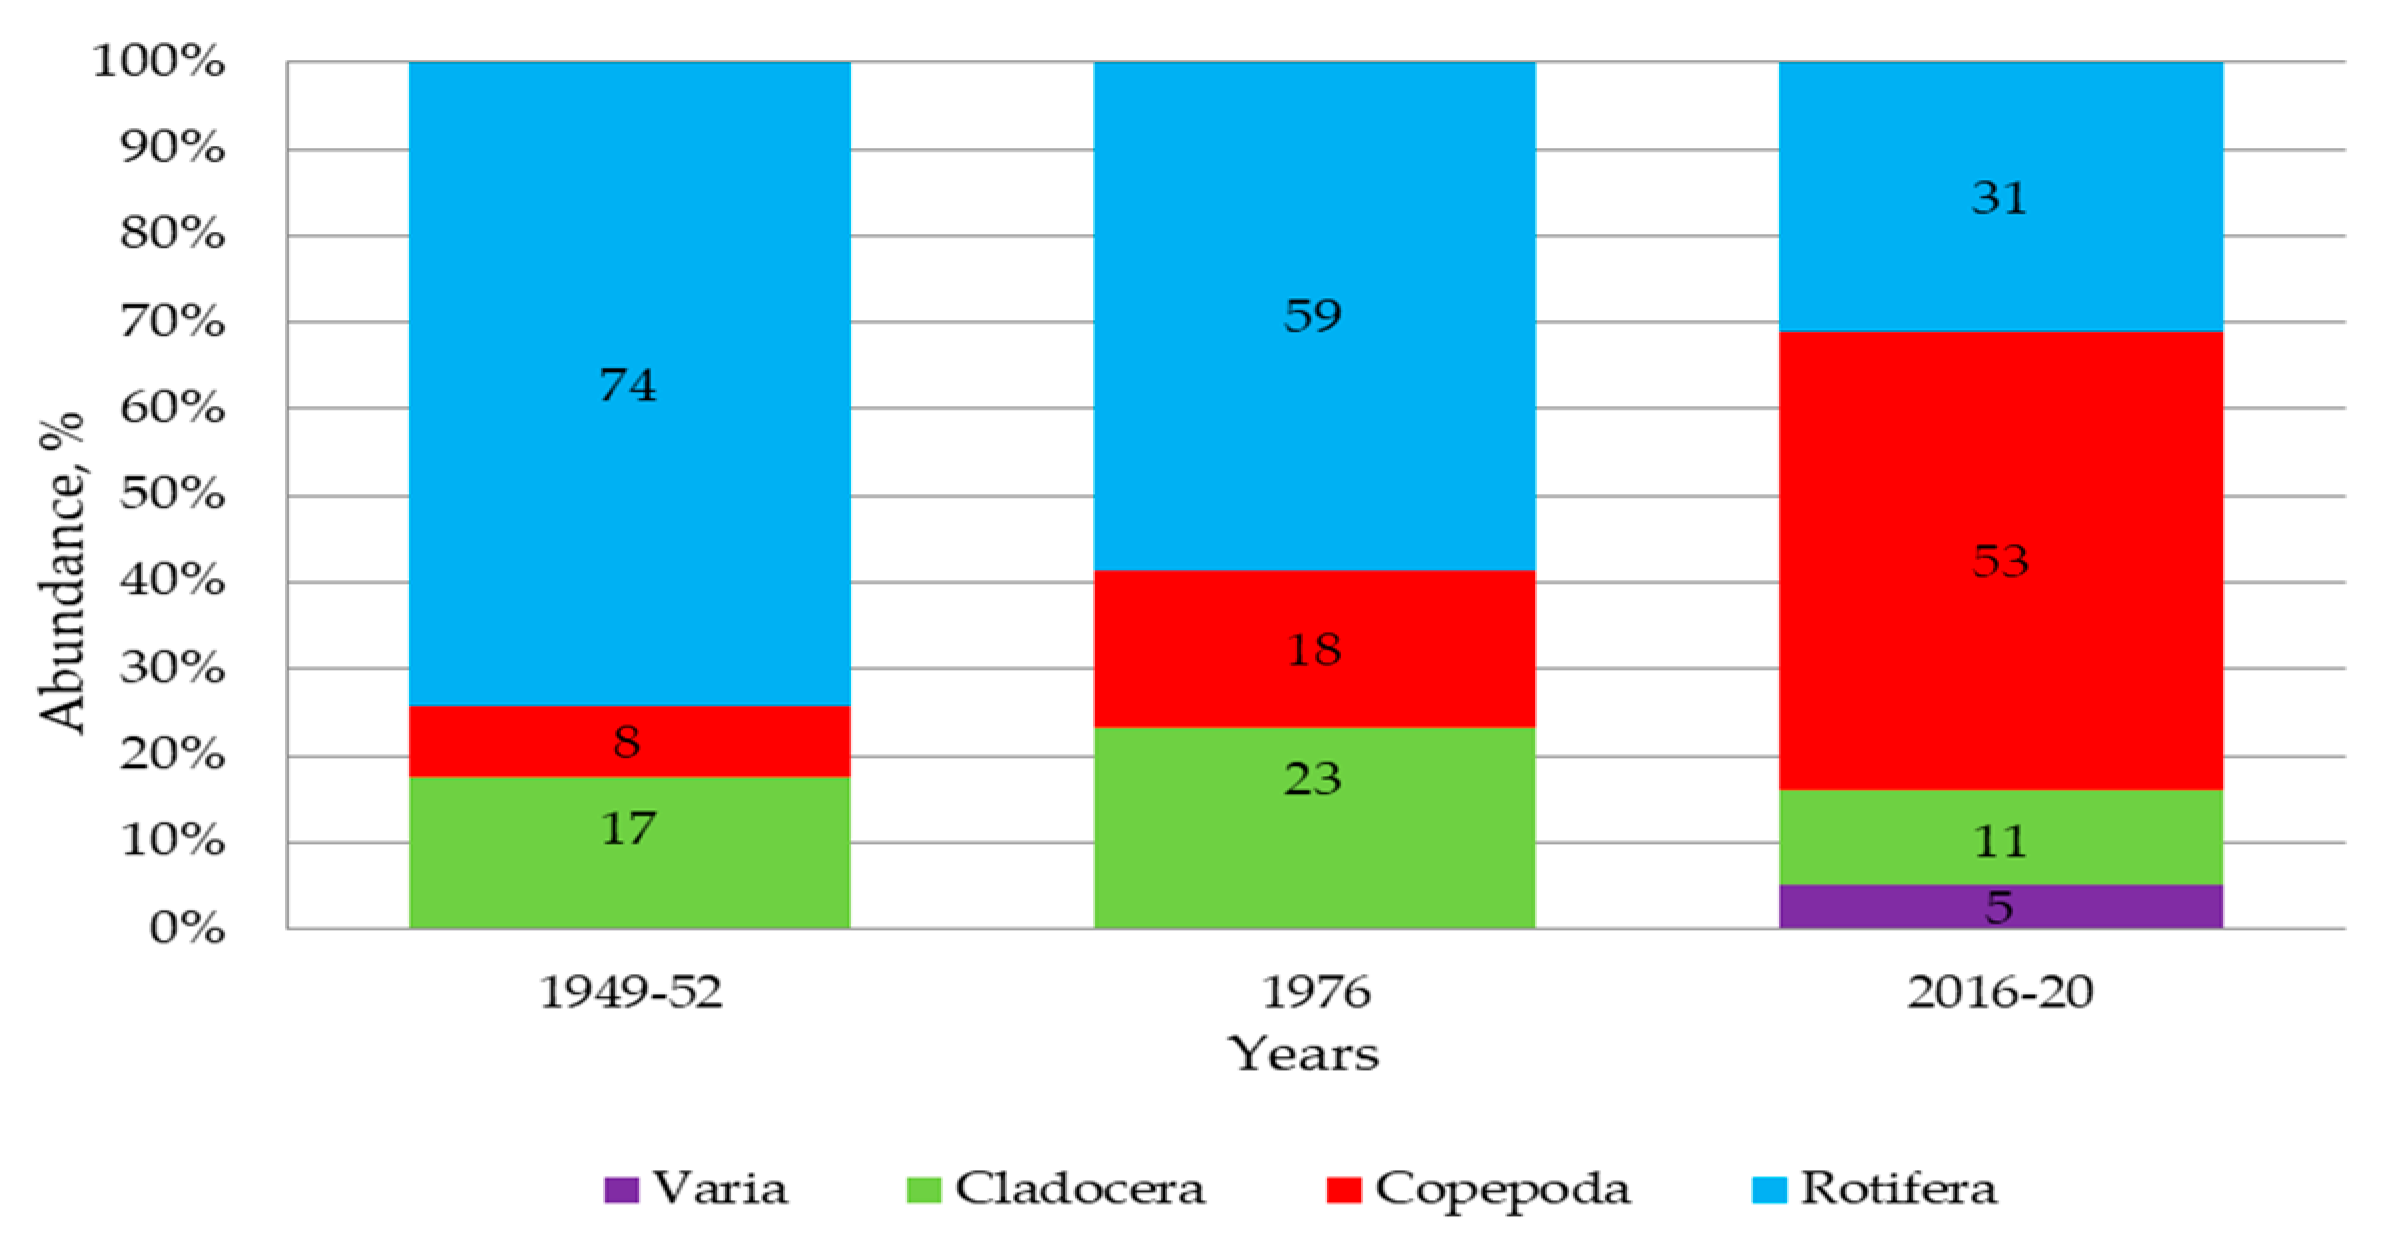
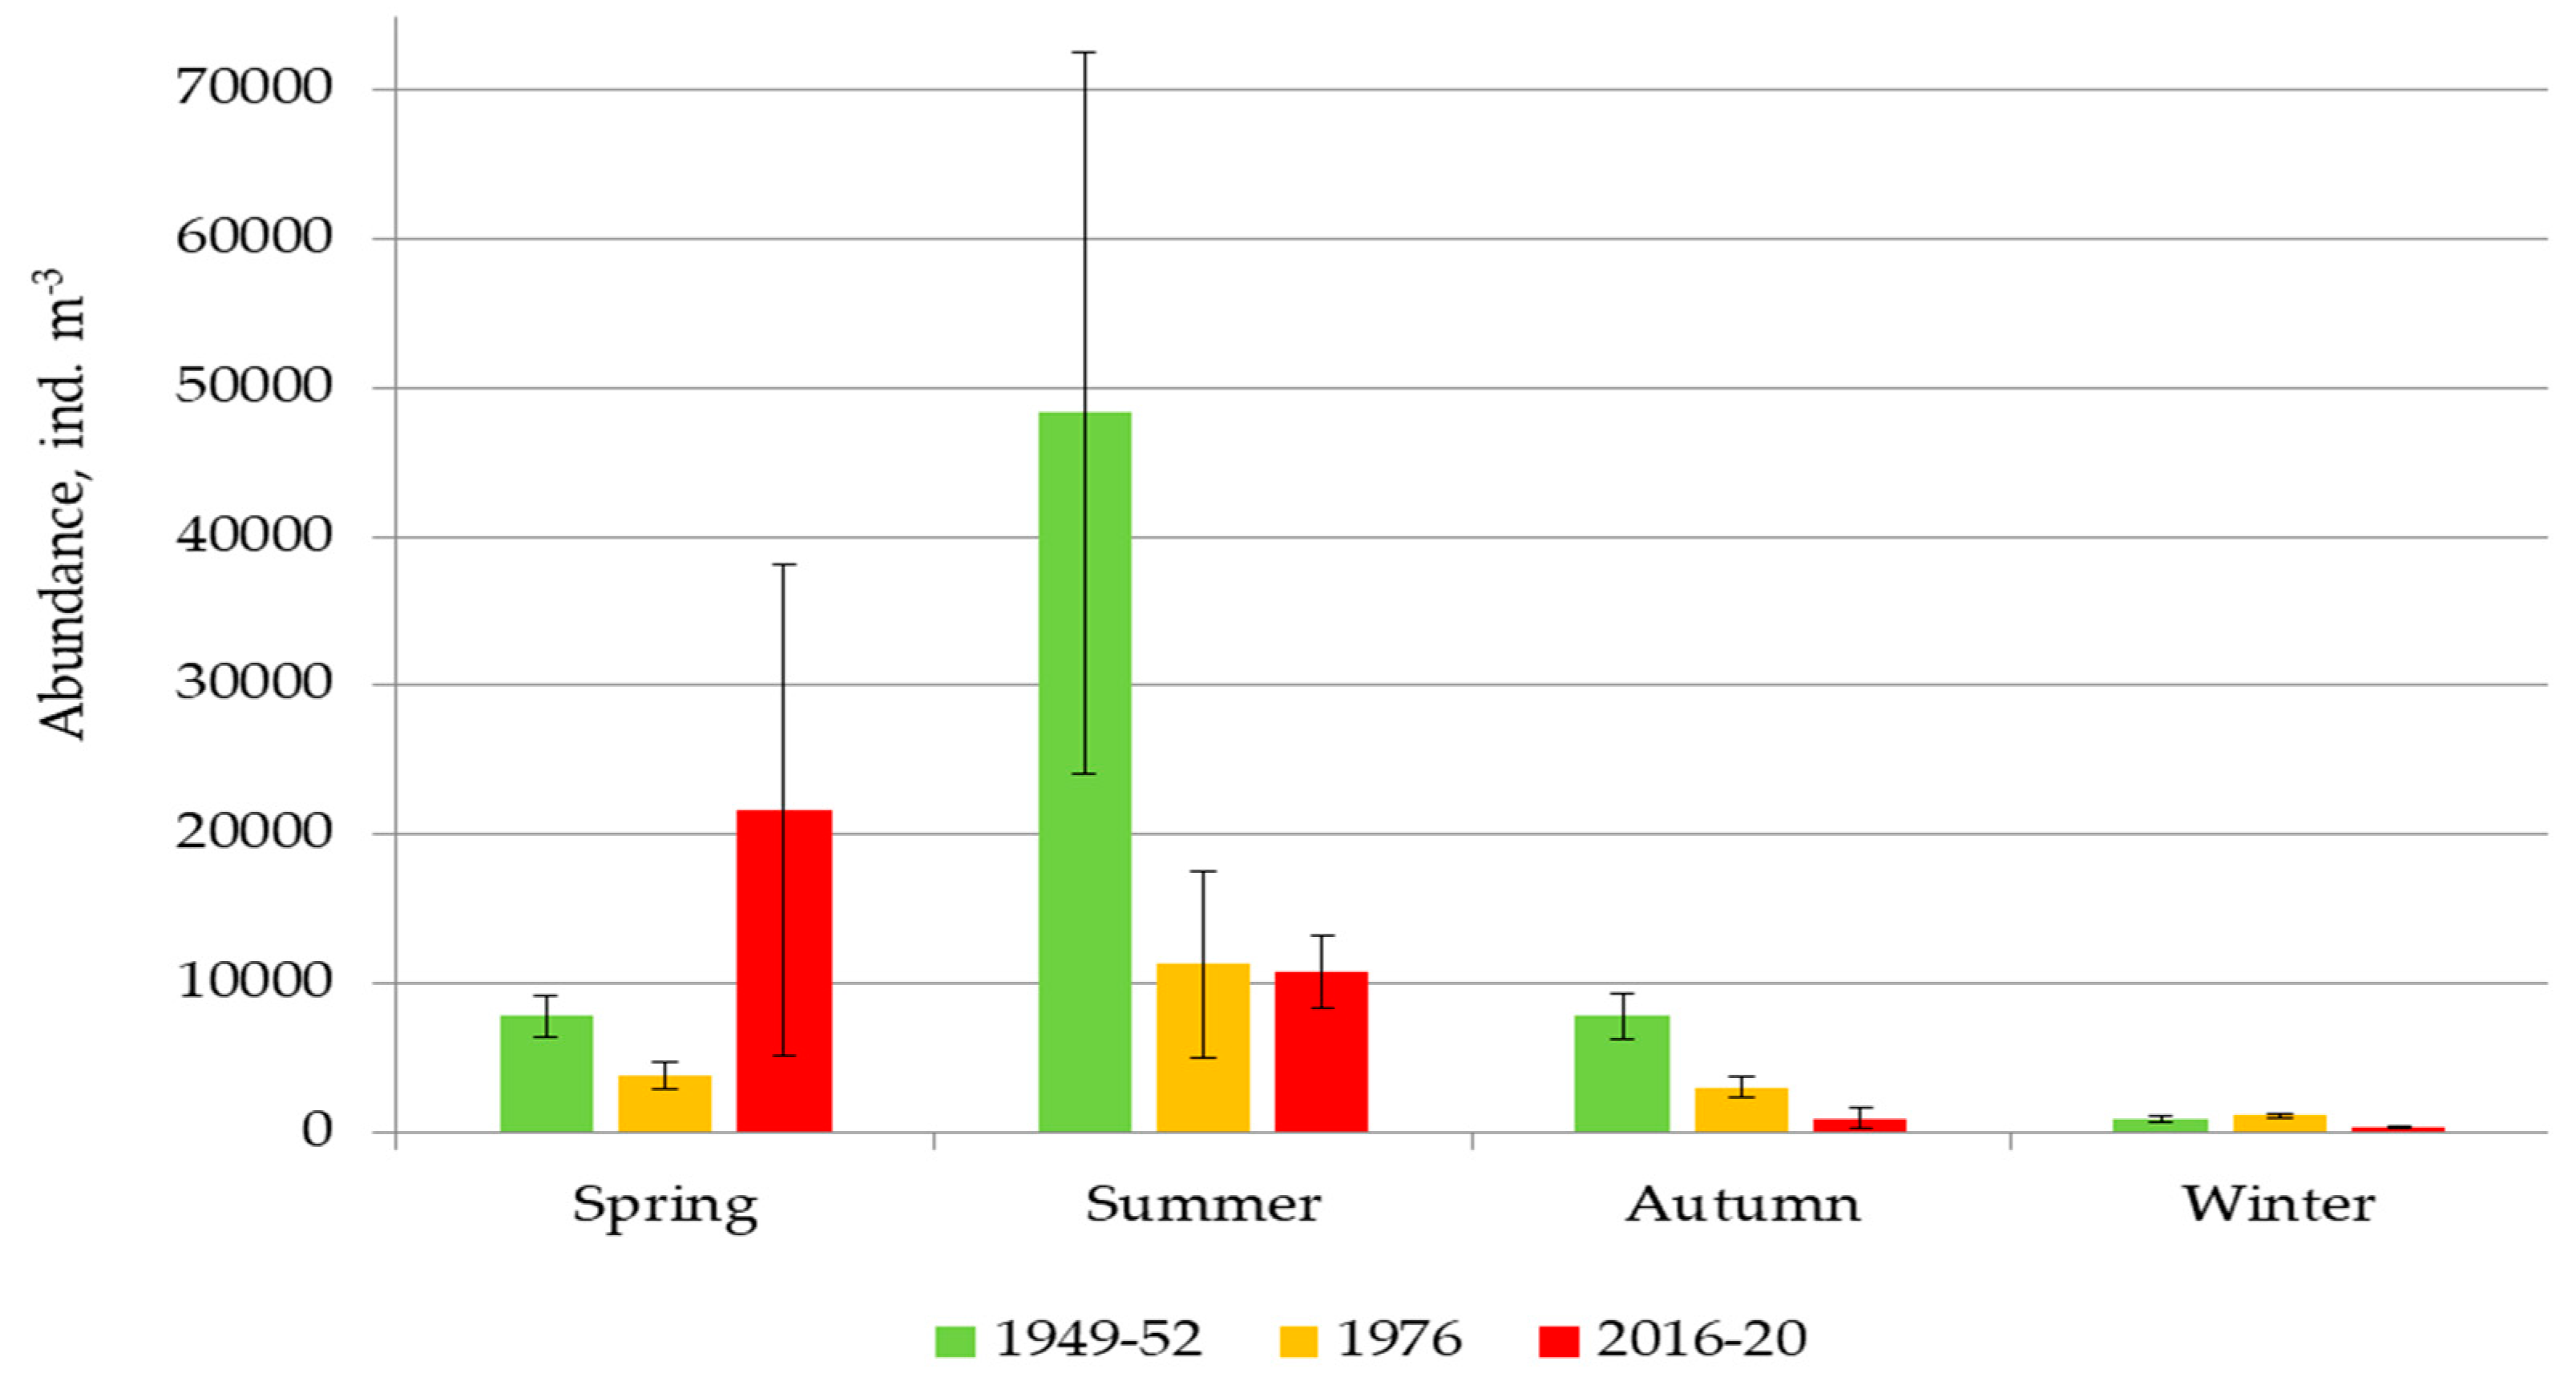
3.4. Zooplankton
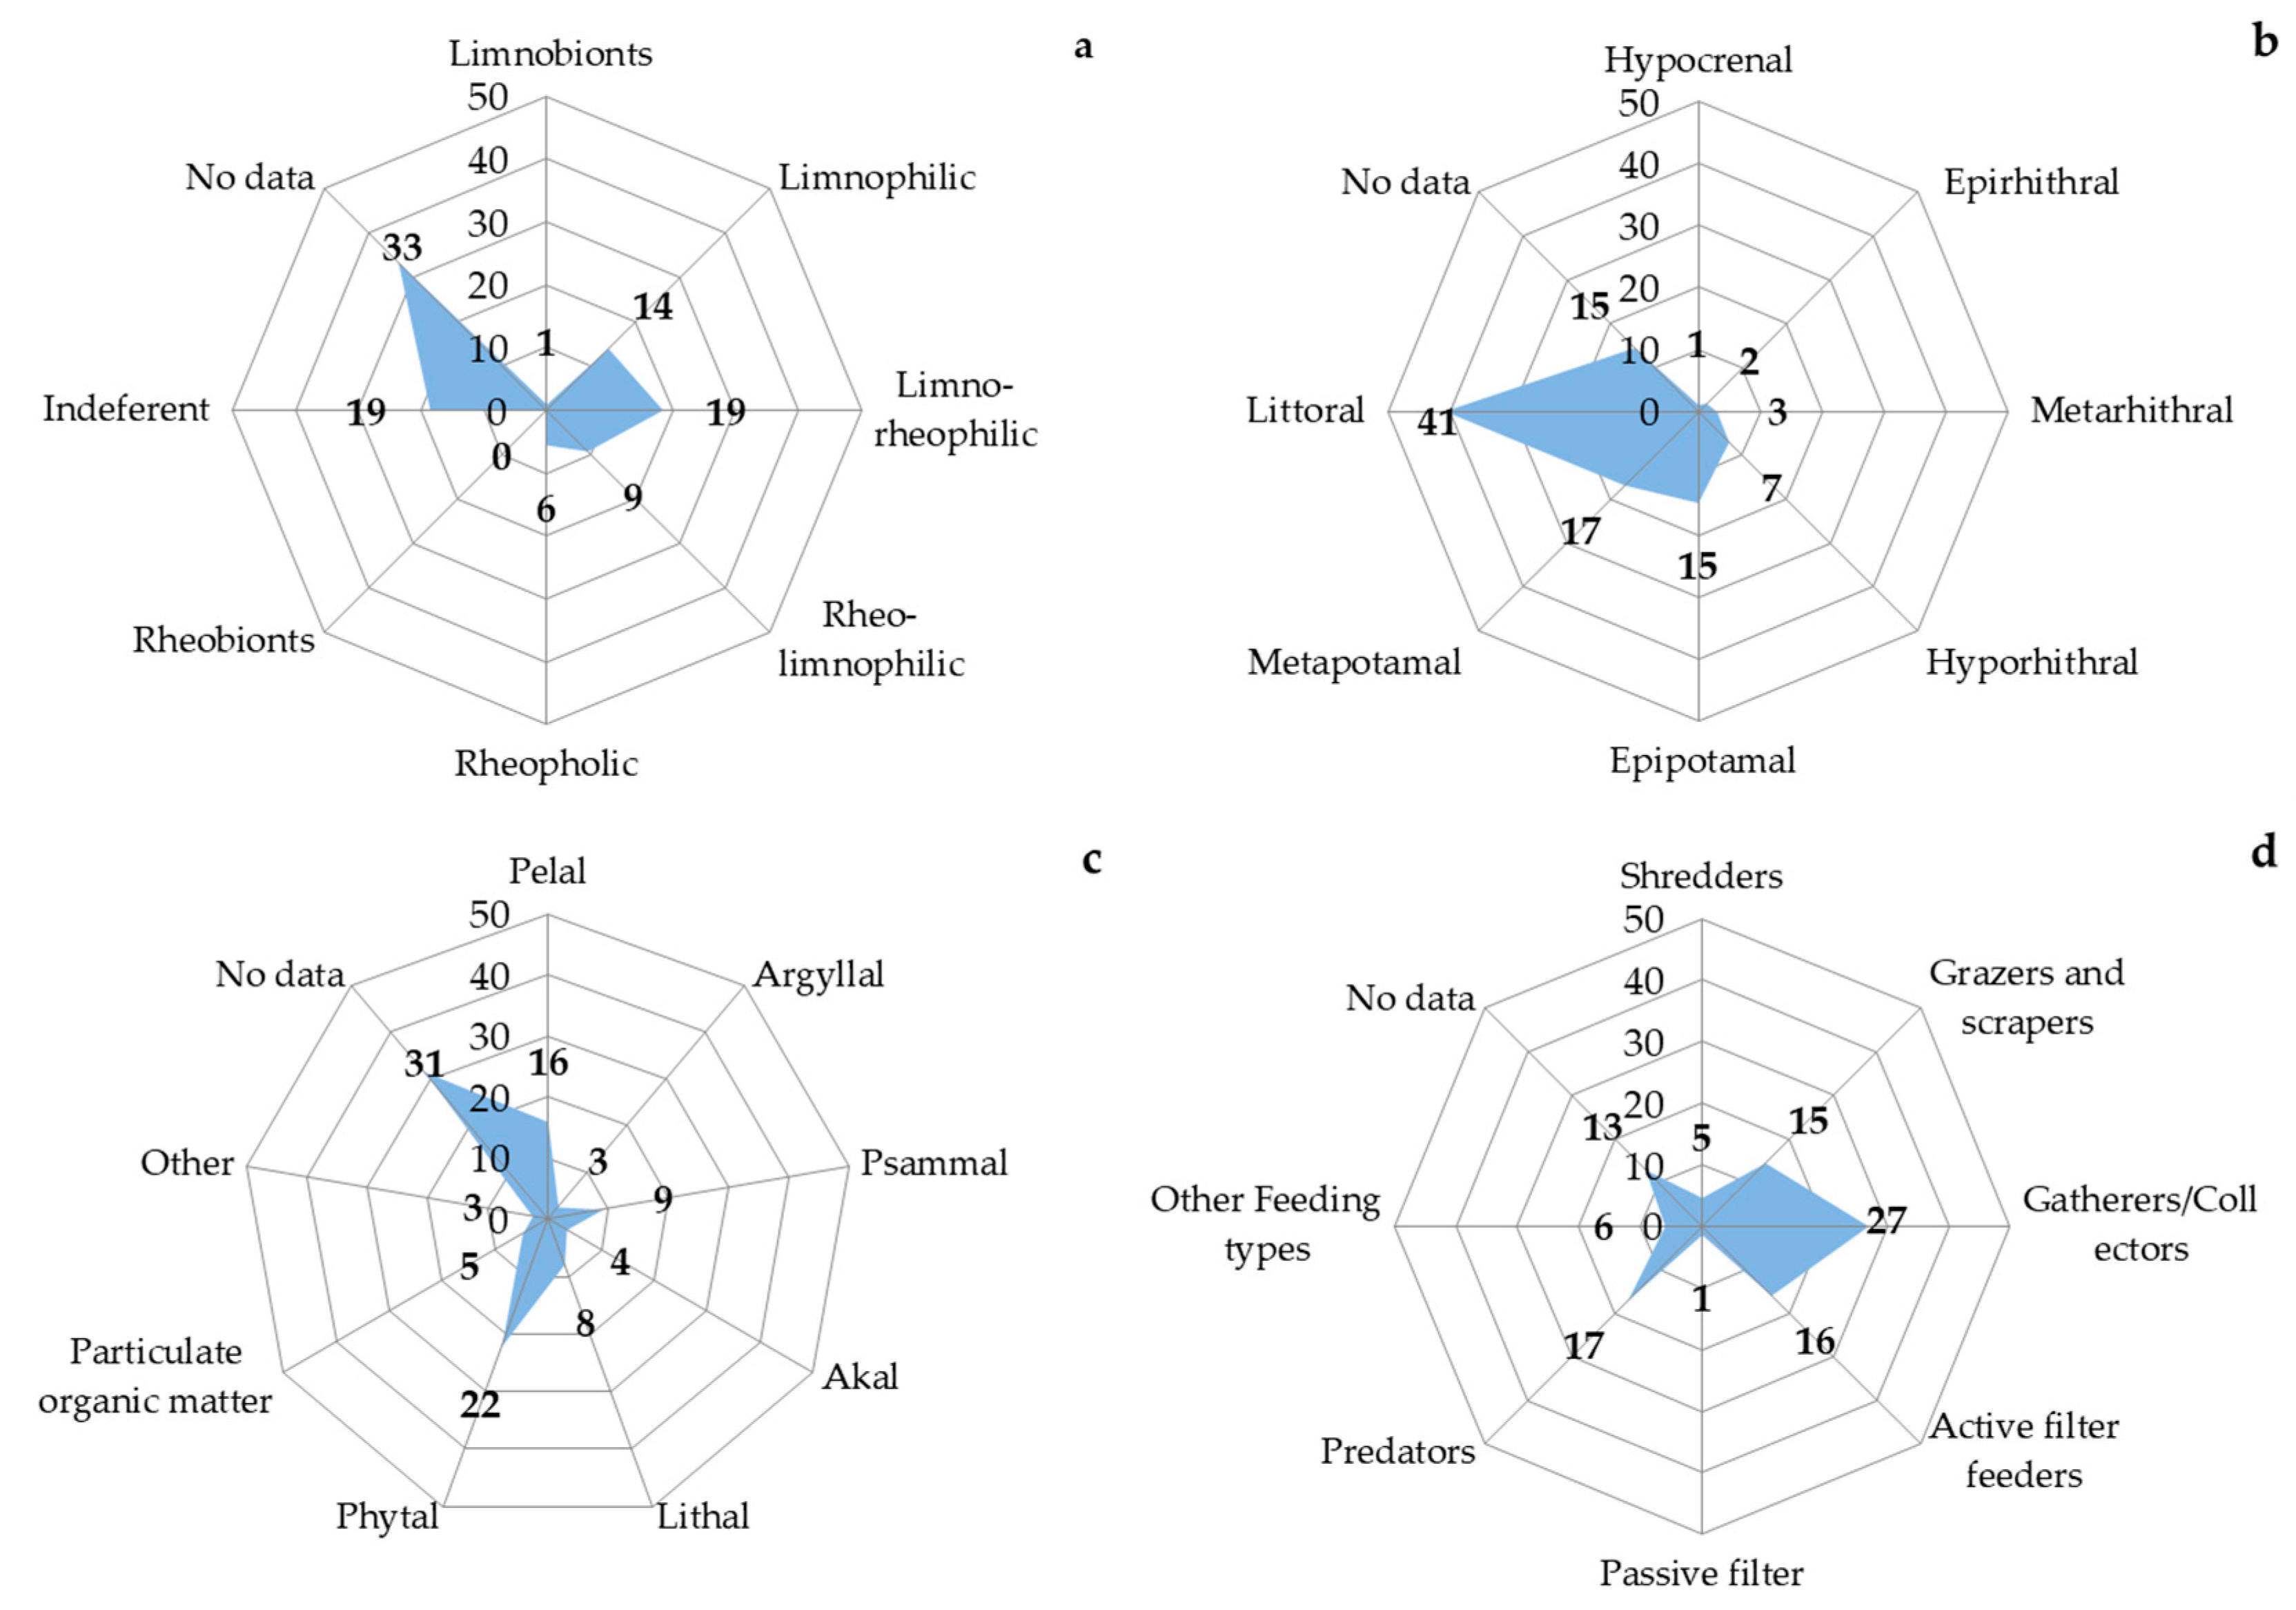
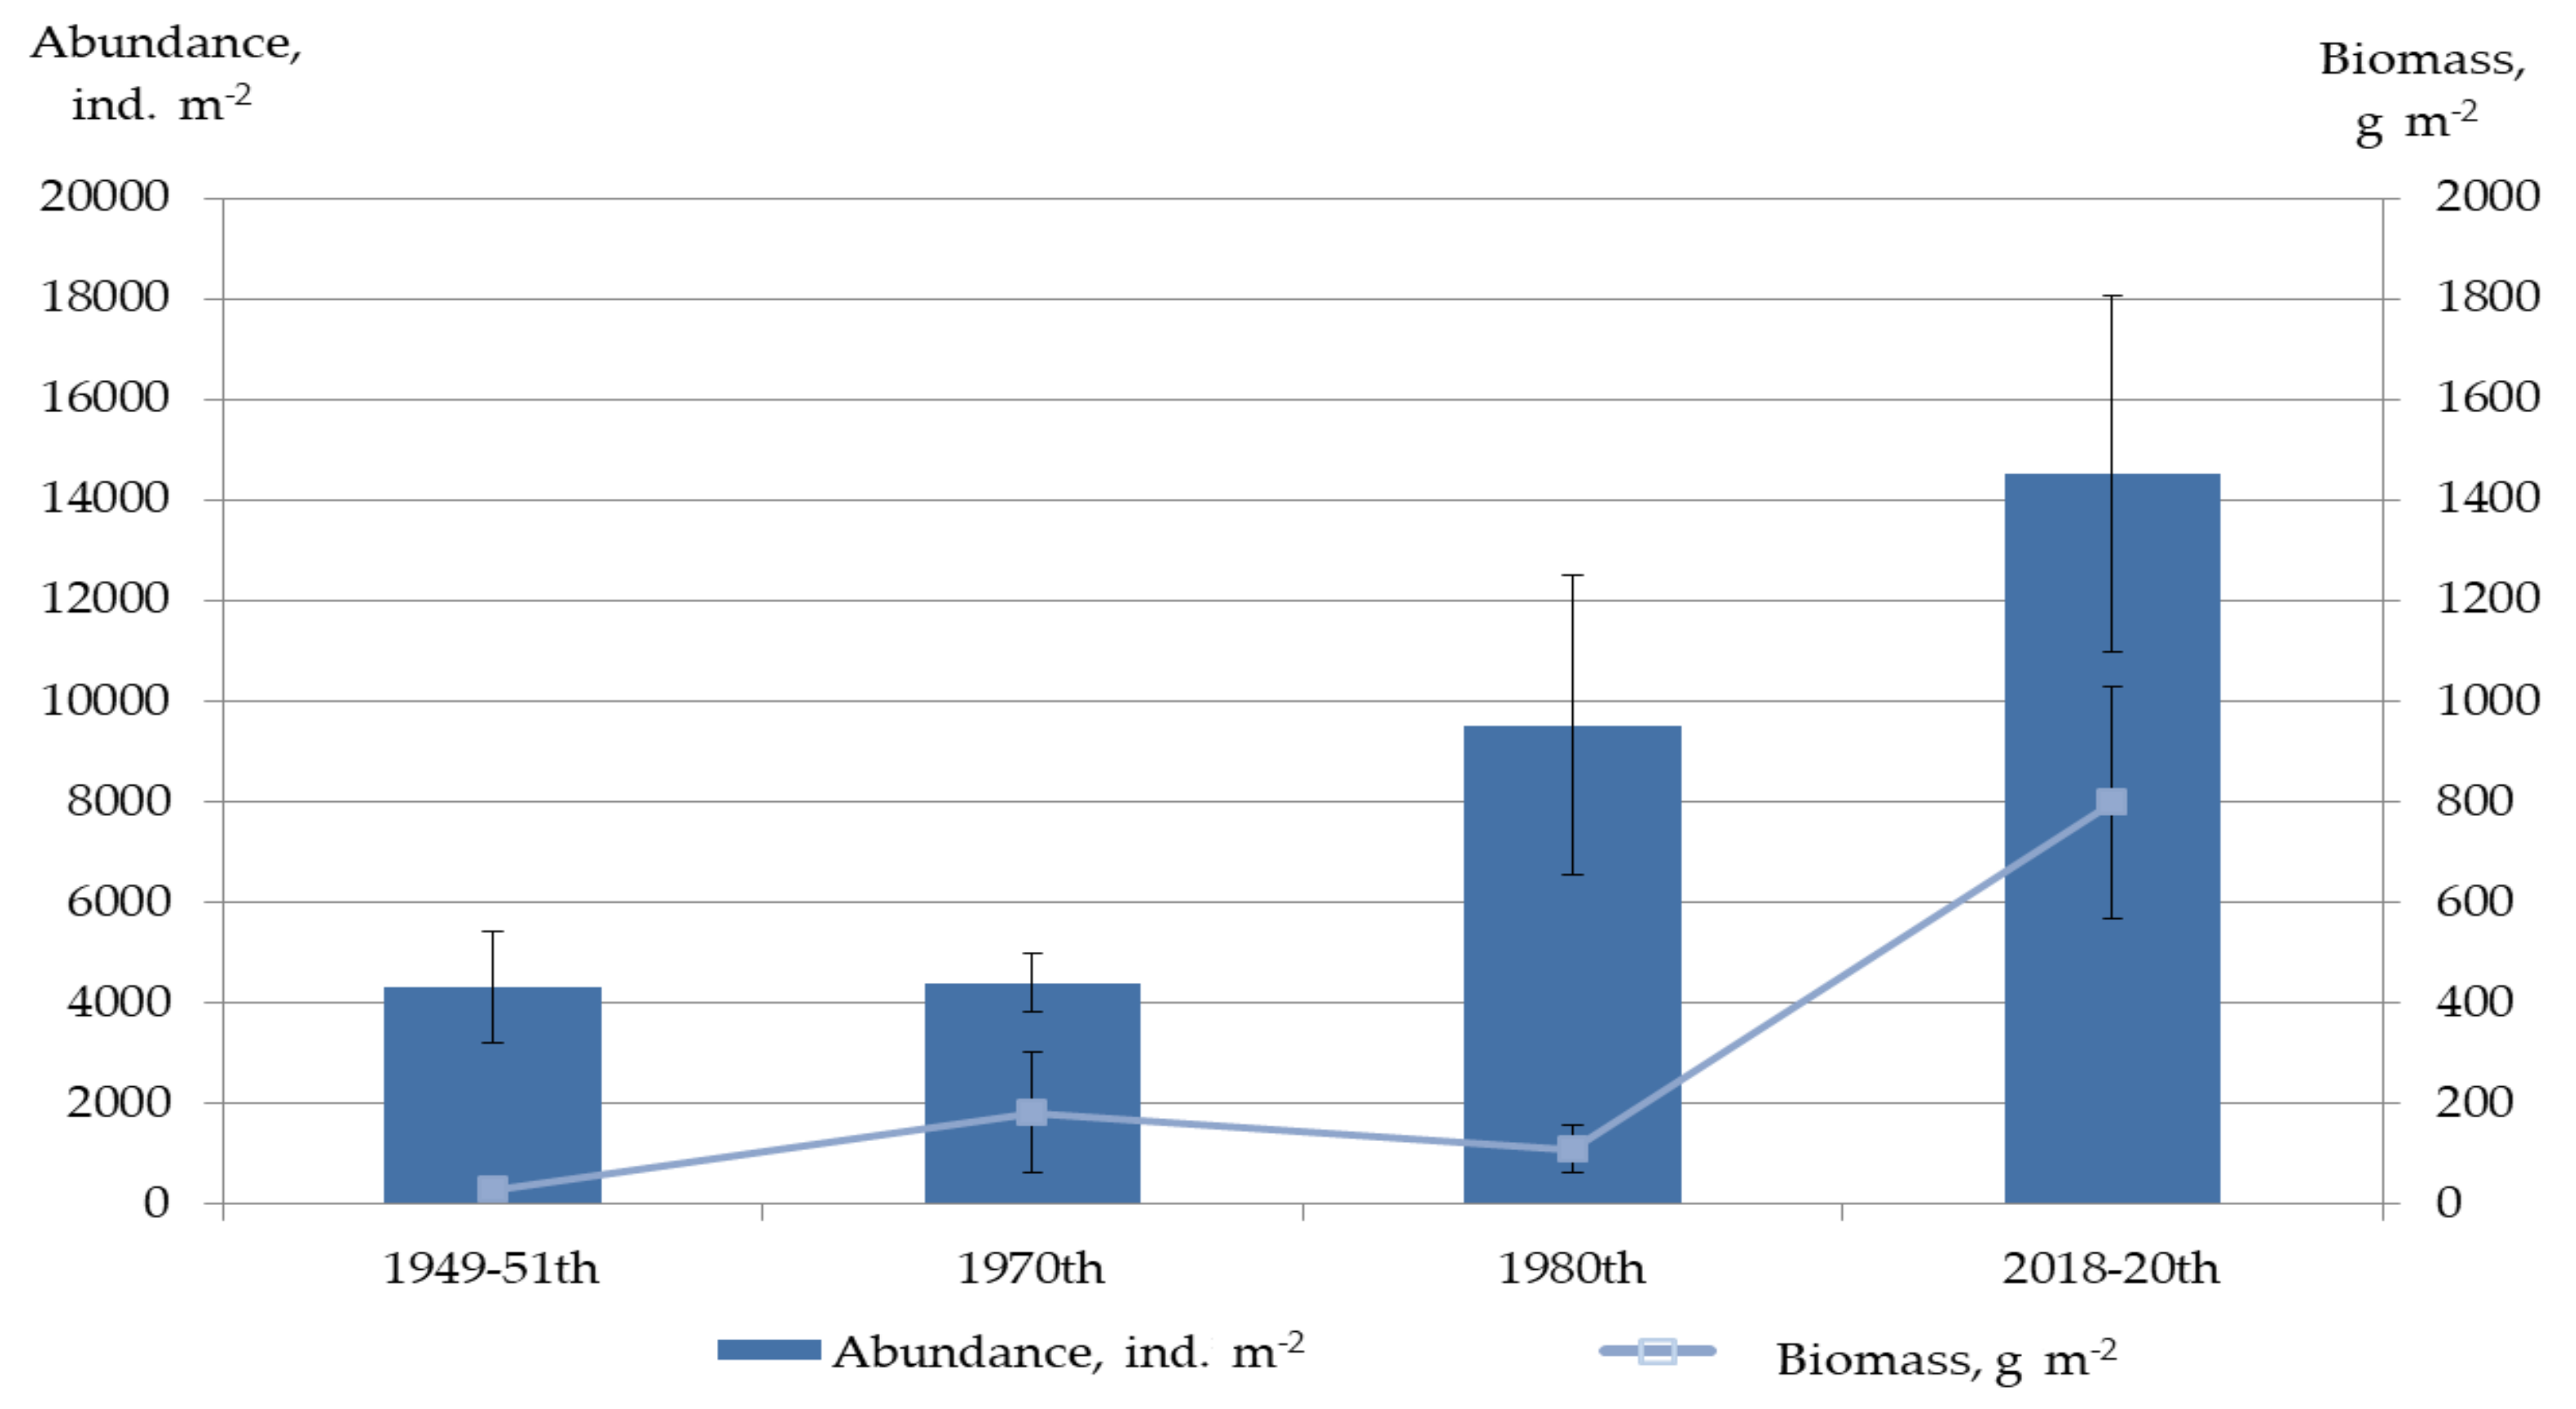
3.5. Macrozoobenthos
4. Discussion
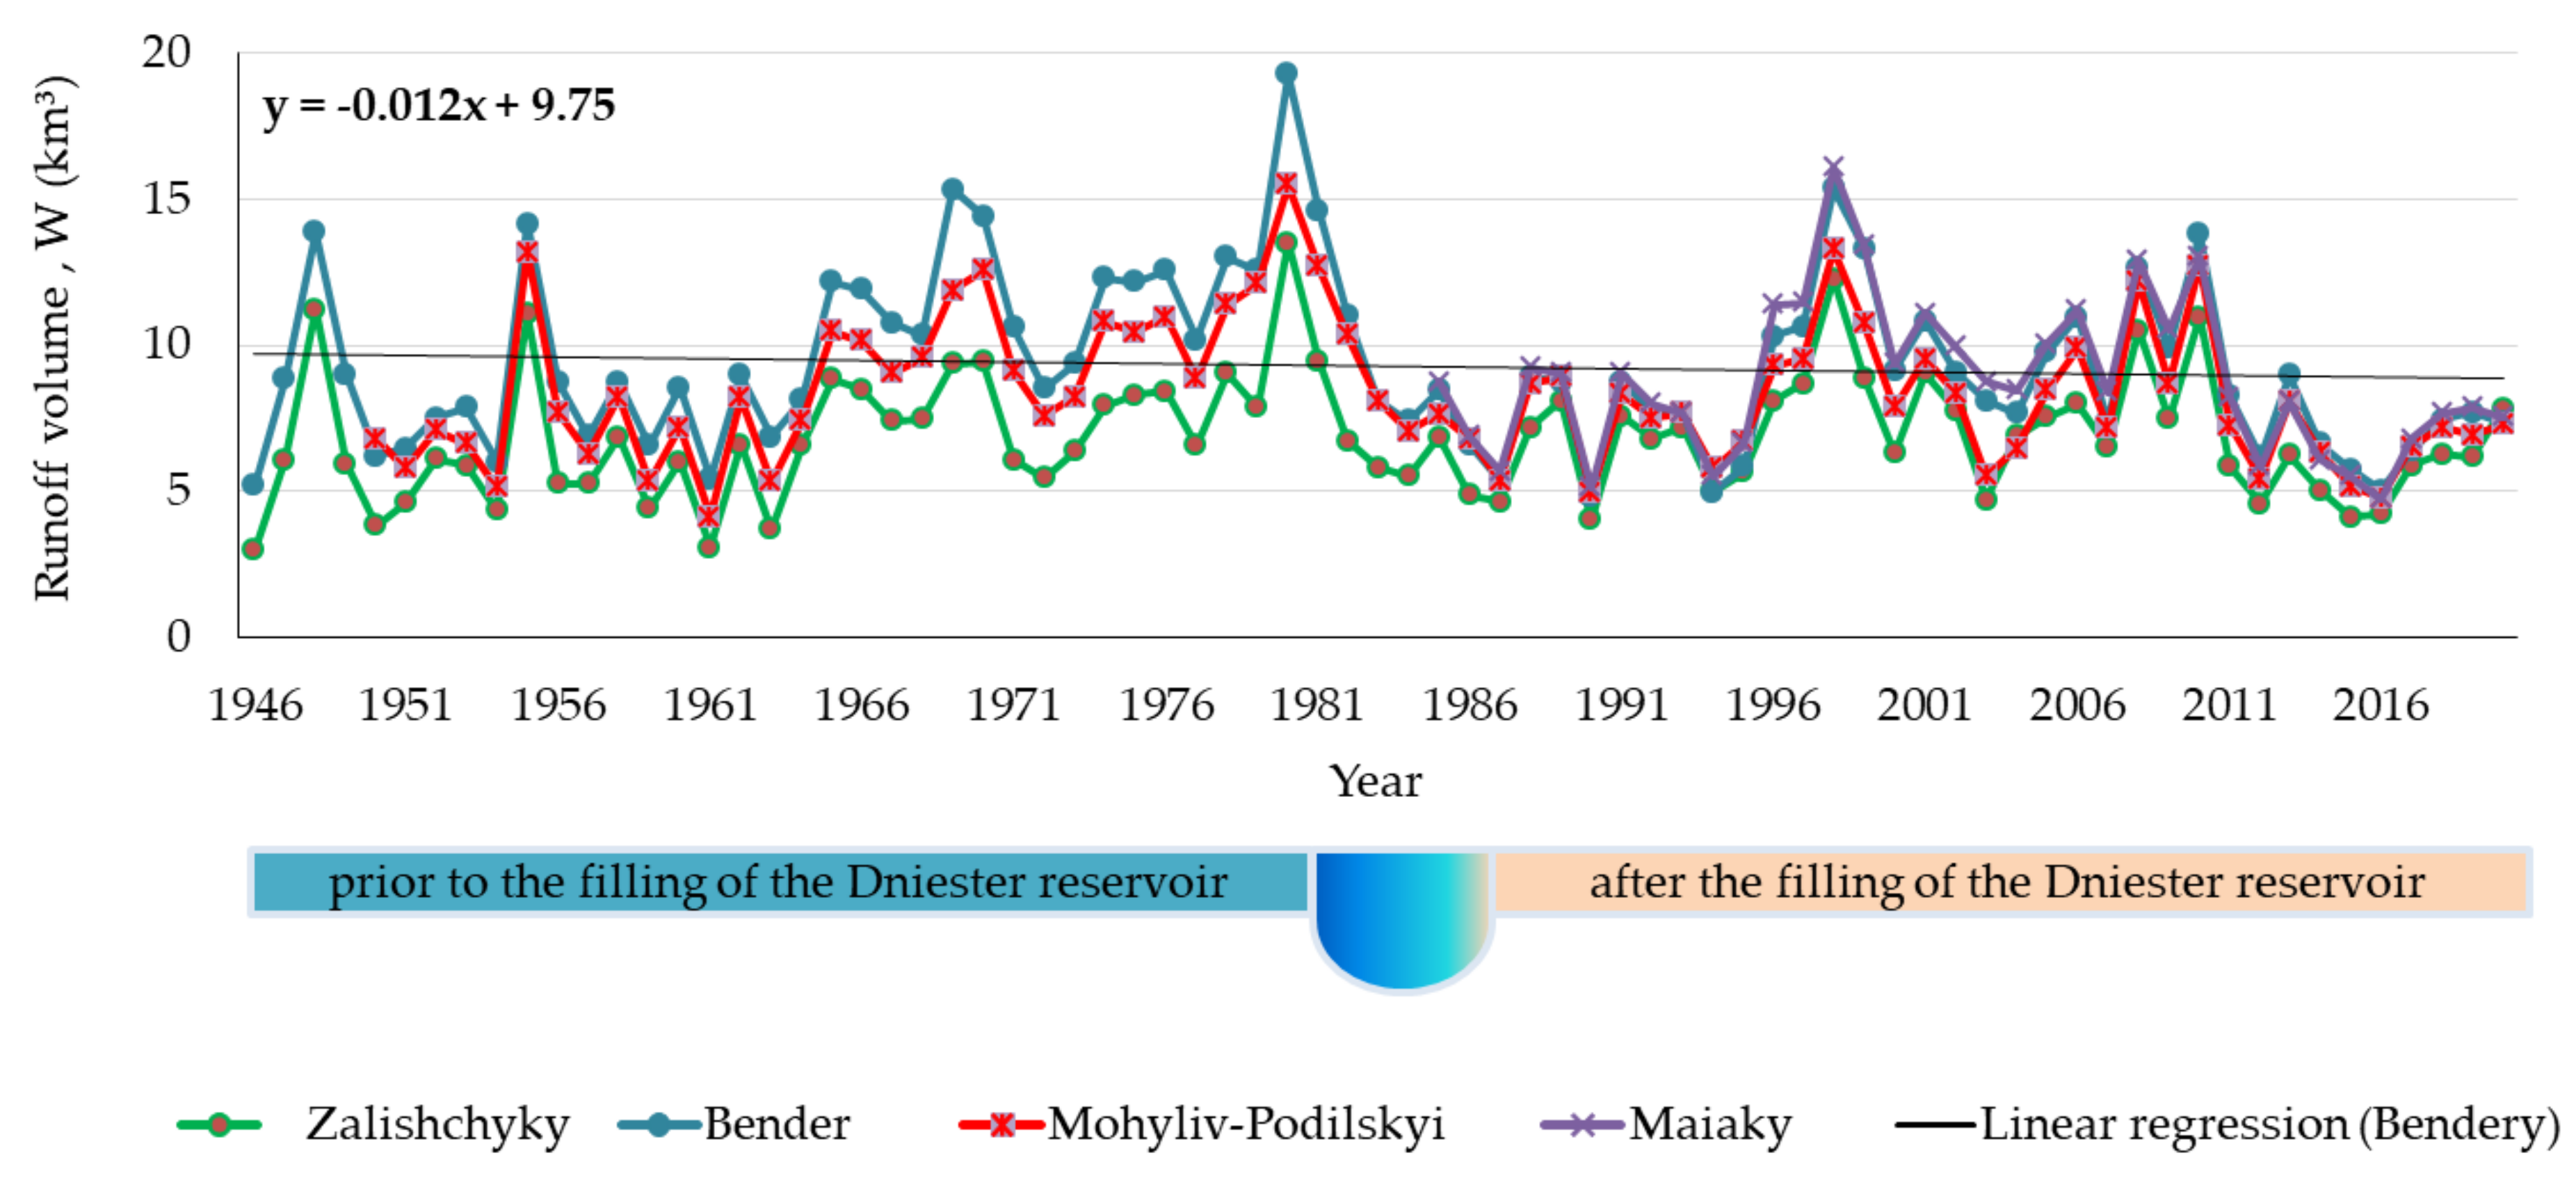
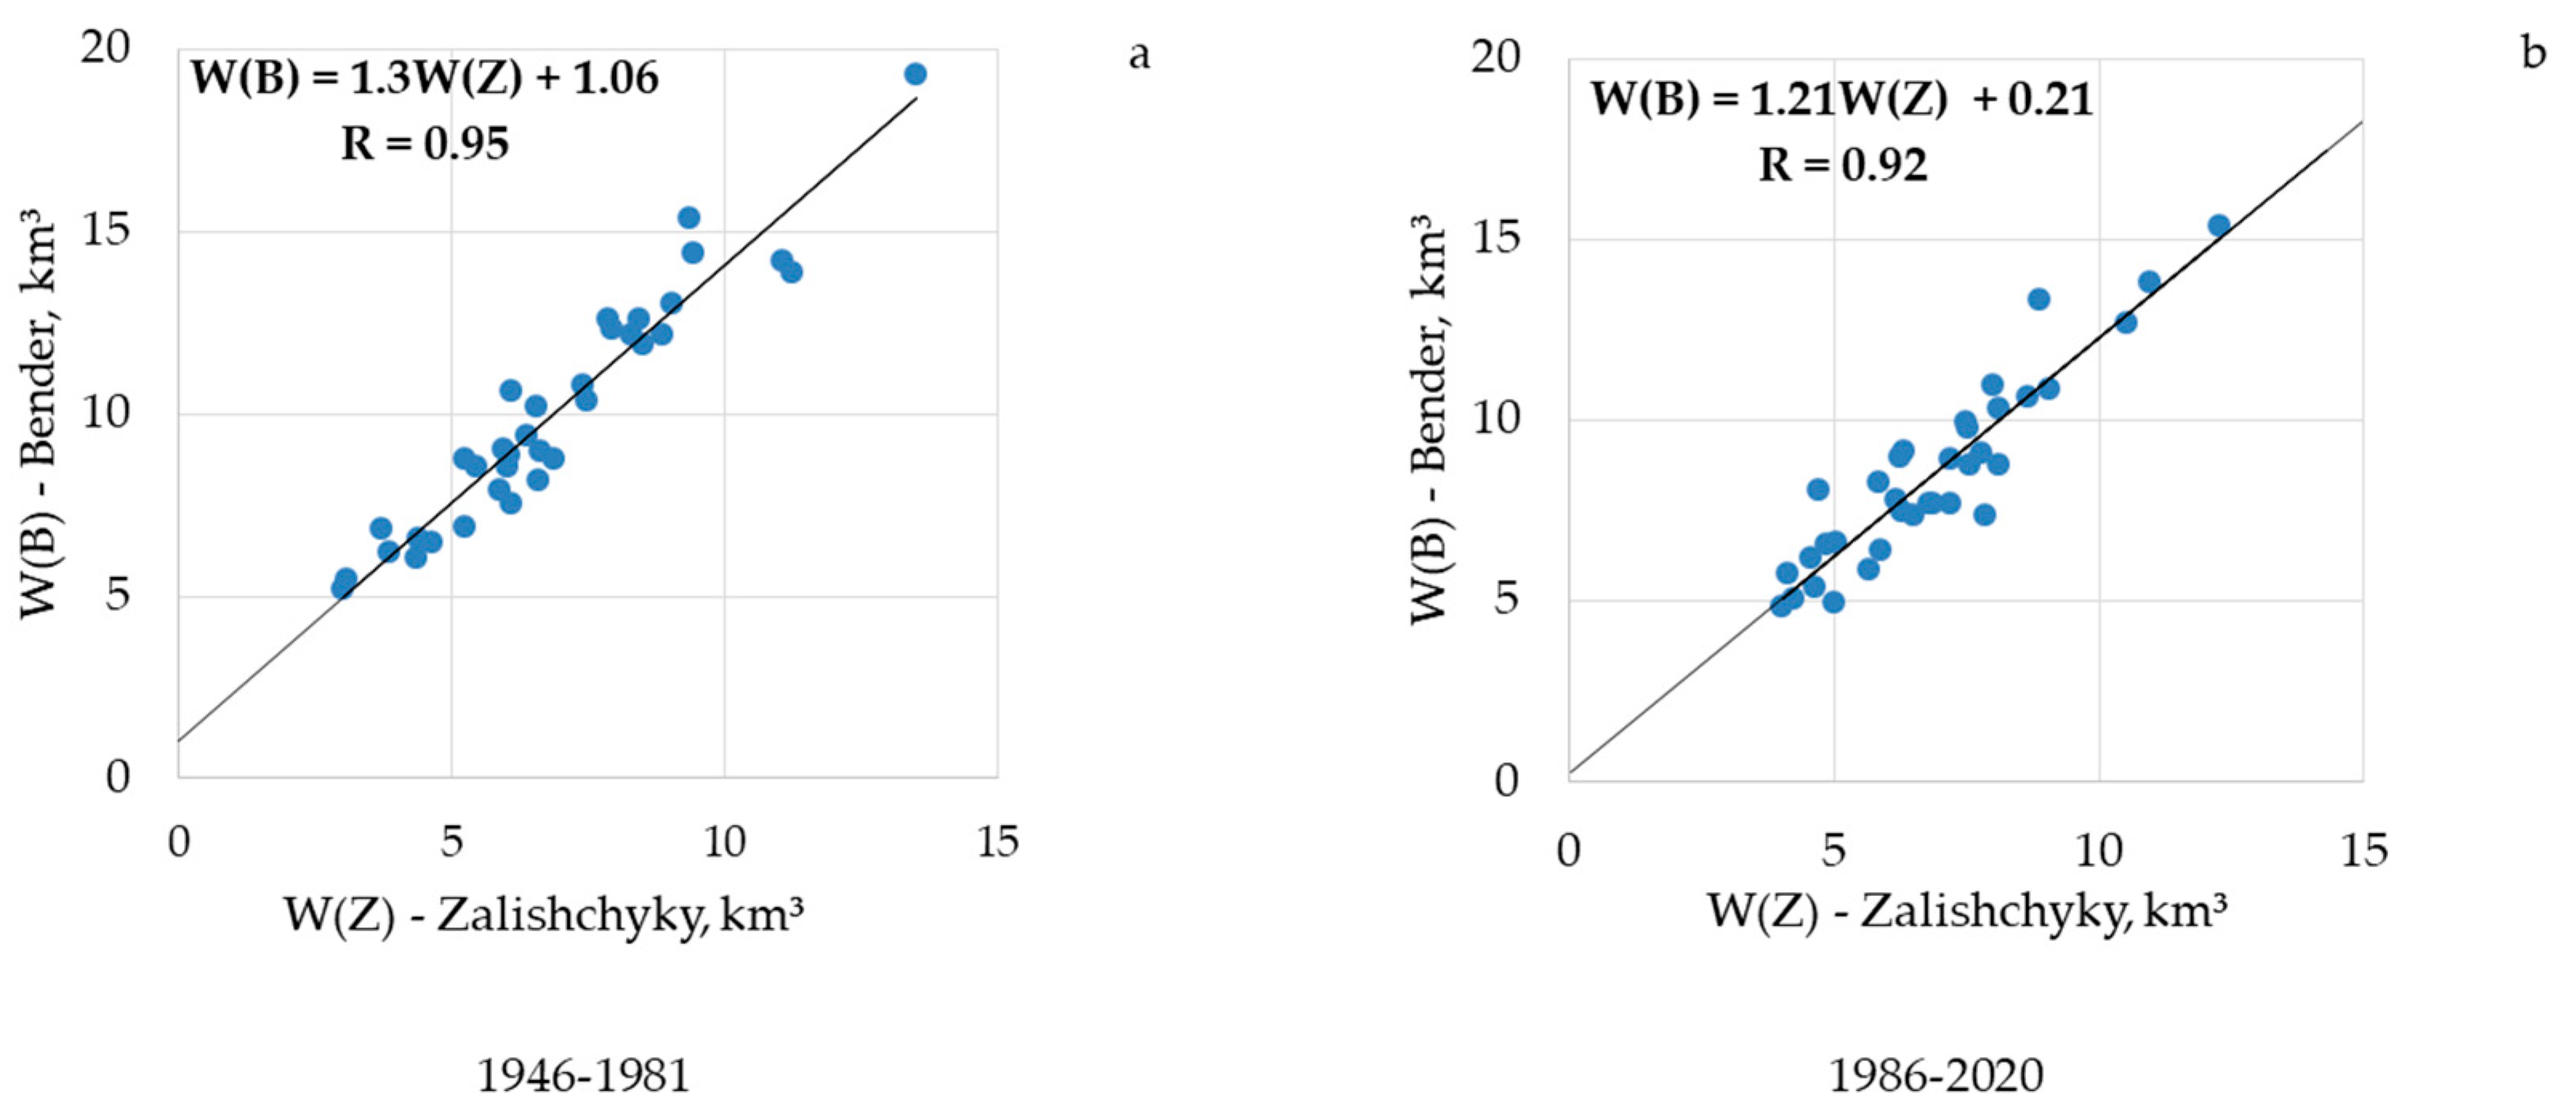
4.1. Long-Term Dynamics of the Runoff
- (1)
- 1946–1981, the period prior to the filling of the Dniester reservoir (Supplementary Materials Figure S10). The linear regression equation is:
- (2)
- 1987–2020, the period after the filling of the Dniester reservoir (Supplementary Materials Figure S11). The linear regression equation is:
4.2. Chemical Conditions
4.3. Biological Conditions
4.4. Biological Indicators of HPP Influence in the Lower Dniester
5. Conclusions
Supplementary Materials
Author Contributions
Funding
Institutional Review Board Statement
Informed Consent Statement
Data Availability Statement
Acknowledgments
Conflicts of Interest
References
- Marushevskaia, O.; Melian, R.; Yaroshevich, A. (Eds.) Transboundary River Basin Management Plan” Part 1 “General Characteristics and State Assessment; The Dniester Commission: Kishinev, Moldova; Kiev, Ukraine, 2019. [Google Scholar]
- Ganya, I.M. (Ed.) Ekosistema Nizhnego Dnestra v Usloviyakh Usilennogo Antropogennogo Vozdeystviya [Ecosystem of the Lower Dniester under conditions of increased anthropogenic impact]; Shtiintsa: Kishinev, Moldova, 1990; ISBN 5376007049. (In Russian) [Google Scholar]
- Markovsky, Y.M. Fauna Bespozvonochnykh Nizov’yev Rek Ukrainy Usloviya yeye Sushchestvovaniya i Puti Ispol’zovaniya [Fauna of Invertebrates in the Lower Reaches of the Rivers of Ukraine Conditions of Its Existence and Ways of Use]; Izdatel’stvo Akademii Nauk Ukrainskoy SSSR: Moscow, Russia, 1953; Volume 3. (In Russian) [Google Scholar]
- Nabokin, M.V. Zooplankton Delʹty Dnistra [Zooplankton of the Dniester Delta]. In Proceedings of the Suchasna Hidroekolohiya: Mistse Naukovykh Doslidzhen’ u Vyrisheni Aktualʹnykh Problem: Zbirnyk Materialiv III Naukovo-Praktychnoyi Konferentsiyi Dlya Molodykh Vchenykh [Modern hydroecology: The place of scientific research in solving current problems III], Kiev, Ukraine, 6–7 October 2016; pp. 42–43. (In Ukranian). [Google Scholar]
- Nabokin, M.V. Rezul’taty Hidrobiolohichnykh Sposterezhen’ ta Saprobiolohichna Otsinka delʹty Dnistra [Results of Hydrobiological Observations and Saprobiological Assessment of the Dniester Delta]. In Proceedings of the Ekolohiya—Filosofiya Isnuvannya Lyudstva: Zb. Nauk. Prats’ Uchasnykiv IV Mizhnarodnoyi Naukovo-Praktychnoyi Konferentsiyi [Ecology—Philosophy of Human Existence: Collection. Science. Proceedings of the IV International Scientific and Practical Conference], Kharkiv, Ukraine, 10–13 October 2017; LLC ‘Color Print’: Melitopol, Ukraine, 2017; pp. 132–135. (In Ukranian). [Google Scholar]
- Vladimirov, M.Z. Zoomakrobentos Nizhnego Dnestra v usloviyakh vozdeystviya kompleksa antropogennykh faktorov [Zoomacrobenthos of the Lower Dniester under the influence of a complex of anthropogenic factors]. In Biogidroresursy Basseyna Dnestra, ikh Okhrana i Ratsional’noye Ispol’zovaniye [Biohydraulic Resources of the Dniester Basin, Their Protection and Rational Use]; Ganya, I.M., Ed.; Shtiintsa: Kishinev, Moldova, 1980; pp. 143–152. (In Russian) [Google Scholar]
- Grimal’sky, V.L. Plankton reki Dnestr [Plankton of Dniester river]. Tr. Kishinevskogo Sel`Sko-Khozyajstvennogoinst: Kishinev, Moldova, 1957; pp. 3–86. (In Russian) [Google Scholar]
- Kostikova, L.E.; Ivanov, A.I. Fitoplankton nizhnego Dnestra i Dnestrovskogo limana [Phytoplankton of the Lower Dniester and Dniester estuary]. In Gidrobiologicheskiy Rezhim Dnestra i Yego Vodoyemov/Hydrobiological Regime of the Dniester and Its Water Bodies; Braginsky, L.P., Ed.; Naukova Dumka: Kiev, Ukraine, 1992; pp. 90–134. (In Russian) [Google Scholar]
- Yaroshenko, F.M. Gidrofauna Dnestra [Hydrobionts’ Fauna of the River Dniester]; Izd-vo Akademii nauk SSSR: Moscow, Russia, 1957. (In Russian) [Google Scholar]
- Nedostup, A.T. Zoobentos reki Dnester [Zoobenthos of the river Dniester]. Hydrobiol. J. 1988, 24, 88–95. (In Russian) [Google Scholar]
- Braginsky, L.P. (Ed.) Gidrobiologicheskyj Rezhim Dnestra i ego Vodoemov [Hydrobiologic Regime of The river Dniester and Its Water Bodies]; Naukova Dumka: Kiev, Ukraine, 1992. (In Russian) [Google Scholar]
- Naberezhny, A.I. Zooplankton nizhnego Dnestra v usloviyakh antropogennogo vozdejstviya [Zooplankton of the Lower Dniester under anthropogenic impact]. In Biogidroresursy’ Bassejna Dnestra, ikh Okhrana i Raczional’noe Ispol`zovanie [Biohydraulic Resources of the Dniester Basin, Their Protection and Rational Use]; Shtiintsa: Kishinev, Moldova, 1980; pp. 87–103. (In Russian) [Google Scholar]
- Zhuravlova, L.A. Gidrokhimicheskiy Rezhim Nizhnego Dnestra/Hydrochemical Regime of the Lower Dniester. In Gidrobiologicheskiy Rezhim Dnestra i Yego Vodoyemov/Hydrobiological Regime of the Dniester and Its Water Bodies; Naukova Dumka: Kiev, Ukraine, 1992; pp. 52–54. (In Russian) [Google Scholar]
- Garkavaya, G.P.; Bogatova, Y.I.; Berlinskii, N.A.; Bol’shakov, V.N.; Goncharov, A.Y. Long-term variations in the biogenic matter runoff of the Dnestr River. Water Resour. 2008, 35, 708–715. [Google Scholar] [CrossRef]
- Ivanov, A.I. Fitoplankton Ust’yevykh Oblastey Rek Severo-Zapadnogo Prichernomor’ya [Phytoplankton of Estuarine Areas of Rivers in the North-Western Black Sea Region]; Naukova Dumka: Kiev, Ukraine, 1982. (In Russian) [Google Scholar]
- Grandova, M.A.; Nabokin, M.V.; Terenko, G.V.; Kovalishina, S.P. The changes in plankton community of Lower Dniester in autumn-winter season comparing with the period of eutrophication maximum (1970th). In Proceedings of the «Hydropower Impact on River Ecosystem Functioning», International Conference, Tiraspol, Moldova, 8–9 October 2019; pp. 59–64. [Google Scholar]
- Onishchenko, E.; Matygin, A.; Kolvenko, V. Calculation of the annual flow volumes of the Dniester River in the mouth part for the period 1985–2018 yy. In Proceedings of the «Hydropower Impact on River Ecosystem Functioning» International Conference, Tiraspol, Moldova, 8–9 October 2019; pp. 266–270. [Google Scholar]
- Grasshoff, K.; Kremling, K.; Ehrhardt, M. Methods of Seawater Analysis; John Wiley & Sons: Hoboken, NJ, USA, 2009; ISBN 3527613994. [Google Scholar]
- Hauer, F.R.; Lamberti, G.A. Methods in Stream Ecology; John Wiley & Sons: Hoboken, NJ, USA, 2017; ISBN 9780124165588. [Google Scholar] [CrossRef]
- RD 52.24.377-95 Metodicheskie Ukazania. Atomno-Absorbcionnoe Opredelenie Metallov v Poverchnostnyh Vodah Sushi s Priamoj Elekrotermicheskoy Atomizatsiey Prob [Methodology Guide. Atomic Absorption Determination of Metals in Surface Land Waters with Direct; State Budgetary Institution “Hydrochemical Institute”: Rostov-on-Don, Russia, 1995.
- ISO. ISO 16772:2004 Soil Quality—Determination of Mercury in Aqua Regia Soil Extracts with Cold-Vapour Atomic Spectrometry or Cold-Vapour Atomic Fluorescence Spectrometry; ISO: Geneva, Switzerland, 2004; p. 8. [Google Scholar]
- ISO. ISO 17378-2:2014 Water Quality—Determination of Arsenic and Antimony—Part 2: Method Using Hydride Generation Atomic Absorption Spectrometry (HG-AAS); ISO: Geneva, Switzerland, 2014; p. 22. [Google Scholar]
- ISO. ISO 8288:1986 Water Quality—Determination of Cobalt, Nickel, Copper, Zinc, Cadmium and Lead—Flame Atomic Absorption Spectrometric Methods; ISO: Geneva, Switzerland, 1986; p. 11. [Google Scholar]
- ISO. DSTU ISO 16772:2005 Kachestvo Grunta. Opredelenie rtuti v Gruntovyh Ekstraktah Tsarskoi Vodki Metodom Atomnoi Specrometrii Holodnogo para i Atomno-Fluoristsentnoi Specrometrii Holodnogo para [DSTU ISO 16772:2005 Soil Quality. Determination of Hg in Soil e; ISO: Geneva, Switzerland, 2005. [Google Scholar]
- ISO. ISO 20280:2007 Soil Quality—Determination of Arsenic, Antimony and Selenium in Aqua Regia Soil Extracts with Electrothermal or Hydride-Generation Atomic Absorption Spectrometry; ISO: Geneva, Switzerland, 2007; p. 15. [Google Scholar]
- ISO. ISO 11047:1998 Soil Quality—Determination of Cadmium, Chromium, Cobalt, Copper, Lead, Manganese, Nickel and Zinc—Flame and Electrothermal Atomic Absorption Spectrometric Methods; ISO: Geneva, Switzerland, 1998; p. 18. [Google Scholar]
- Radley-Gardner, O.; Beale, H.; Zimmermann, R. (Eds.) Directive 2013/11/EU of the European Parliament and of the Council of 12 August 2013 amending Directives 2000/60/EC and 2008/105/EC as regards priority substances in the field of water policy. Off. J. Eur. Union. Fundam. Texts Eur. Priv. Law. 2013, 1–17. [Google Scholar] [CrossRef]
- Tsyiban, A.V. (Ed.) Rukovodstvo po Metodam Biologicheskogo Analiza Morskoy Vodyi i Donnyih Otlozheniy. [Guide to Biological Analysis Methods for Seawater and Bottom Sediments]; Gidrometeoizdat: Saint Petersburg, Russia, 1980. [Google Scholar]
- Hötzel, G.; Croome, R. A Phytoplankton Methods Manual for Australian Freshwaters; Land and Water Resources Research and Development Corporation Canberra: Canberra, Australia, 1999. [Google Scholar]
- Tsarenko, P.M. Brief Identification Manual of Chlorococcal Algae of Ukrainian SSR; Naukova Dumka: Kiev, Ukraine, 1990. [Google Scholar]
- Gollerbach, M.M.; Savich, V.P. (Eds.) Opredelitel’ Presnovodnyh Vodorosley SSSR [Key to Freshwater Algae of the USSR]; Nauka: Moscow, Russia; Saint Petersburg, Russia, 1986; Volume 1–11. (In Russian) [Google Scholar]
- Krakhmalny, A.F. Dinophyta of Ukraine (Illustrated Book for Identification); National Academy of Sciences of Ukraine: Kiev, Ukraine, 2011. [Google Scholar]
- Tevyashova, O.E. Sbor i Obrabotka Zooplanktona v Rybovodnykh Vodoyomakh. Metodicheskoe Rukovodstvo (s Opredelitelem Osnovnykh Presnovodnykh Vidov) [Collection and Processing of Zooplankton Samples in Fish Farm Ponds. A Guide (with a Key to Main Freashwater Species)]; FGUP ‘AzNIIRKH’ Publishing: Rostov-on-Don, Russia, 2009. [Google Scholar]
- Alekseev, V.R.; Tsalolikhin, S.Y. (Eds.) Opredelitel` Zooplanktona i Zoobentosa Presny`kh Vod Evropejskoj Rossii [Keys to Zooplankton and Zoobenthos of Fresh Waters in European Russia]; Tovarishhestvo nauchnykh izdanij KMK: Moscow, Russia, 2010; Volume 1. (In Russian) [Google Scholar]
- Mordukhai-Boltovsky, F.D. (Ed.) Opredelitel’fauny Chernogo i Azovskogo Morey: Svobodnozhivuschie Bespozvonochnyie. Rakoobraznye [Key to the Fauna of the Black and Azov Seas: Free-Living Invertebrates. Crustaceans]; Naukova Dumka: Kiev, Ukraine, 1969; Volume 2. (In Russian) [Google Scholar]
- Mordukhai-Boltovsky, F.D. (Ed.) Opredelitel’ Fauny Chernogo i Azovskogo Morey: Svobodnozhivuschie Bespozvonochnyie. Prosteyshie, Gubki, Kishechnopolostnyie, Chervi, Schupaltsevyie. [Key to the Fauna of the Black and Azov Seas: Free-Living Invertebrates. Protozoa, Porifera, Cnidaria, Verm; Naukova Dumka: Kiev, Ukraine, 1968; Volume 1. [Google Scholar]
- Pantle, K.; Buck, H. Die biologische Überwachung der Gewässer und die Darstellung der Ergebnisse. Gas- Wasserfach 1955, 96, 609–620. [Google Scholar]
- Opredelitel’ Presnovodnykh Bespozvonochnykh Rossii i Sopredel’nykh Territoriy. Vysshiye Nasekomyye: Dvukrylyye [Keys to Freshwater Invertebrates in Russia and Adjacent Territories. Higher Insects: Diptera]; Nauka: Saint Petersburg, Russia, 1999; Volume 4. (In Russian)
- Tsalolikhin, S.Y. (Ed.) Opredelitel’ Presnovodnykh Bespozvonochnykh Rossii i Sopredel’nykh Territoriy. Paukoobraznyye. Nizshiye Nasekomyye [Keys to Freshwater Invertebrates in Russia and Adjacent Territories. Arachnids. Lower Insects]; Nauka: Saint Petersburg, Russia, 1997; Volume 3. (In Russian) [Google Scholar]
- Tsalolikhin, S.Y. (Ed.) Opredelitel’ Presnovodnykh Bespozvonochnykh Rossii i Sopredel’nykh Territoriy. Nizshiye Bespozvonochnyye. [Keys to Freshwater Invertebrates in Russia and Adjacent Territories. Lower Invertebrates]; Nauka: Saint Petersburg, Russia, 1994; Volume 1. (In Russian) [Google Scholar]
- Tsalolikhin, S.Y. (Ed.) Opredelitel’ Presnovodnykh Bespozvonochnykh Rossii i Sopredel’nykh Territoriy. Vysshiye Nasekomyye: Rucheyniki, Cheshuyekrylyye, Zhestkokrylyye, Setchatokrylyye, Bol’shekrylyye, Pereponchatokrylyye [Keys to Freshwater Invertebrates in Russia in Russia and Adjacent Territories: Trichoptera, Lepidoptera, Coleoptera, Neuroptera, Megaloptera, Hymenoptera]; Nauka: Saint Petersburg, Russia, 2001; Volume 5. [Google Scholar]
- Lawrence, J.E.; Lunde, K.B.; Mazor, R.D.; Bêche, L.A.; McElravy, E.P.; Resh, V.H. Long-term macroinvertebrate responses to climate change: Implications for biological assessment in mediterranean-climate streams. J. N. Am. Benthol. Soc. 2010, 29, 1424–1440. [Google Scholar] [CrossRef] [Green Version]
- Hering, D.; Haidekker, A.; Schmidt-Kloiber, A.; Barker, T.; Buisson, L.; Graf, W.; Grenouillet, G.; Lorenz, A.; Sandin, L.; Stendera, S. Monitoring the Responses of Freshwater Ecosystems to Climate Change; John Wiley & Sons: Hoboken, NJ, USA, 2010; ISBN 9781405179133. [Google Scholar] [CrossRef]
- Feld, C.C.K.; Dahm, V.; Ude, A.L.; Delmas, F.; Pont, D.; Melcher, A.; Boku, A.Z.; Fvb-igb, C.W.; Verdonschot, P.F.M.; Michels, H.; et al. WISER Deliverable D5.1-2: Driver-Pressure-Impact and Response-Recovery chains in European rivers: Observed and Predicted Effects on BQEs; University of Duisburg-Essen: Duisburg, Germany, 2012; p. 227. [Google Scholar]
- Arkansas Game and Fish Commission. Arkansas Aquatic Nuisance Species Management Plan; Arkansas Game and Fish Commission: Little Rock, AR, USA, 2013; pp. 1–266. [Google Scholar]
- Xiaocheng, F.; Tao, T.; Wanxiang, J.; Fengqing, L.; Naicheng, W.; Shuchan, Z.; Qinghua, C. Impacts of small hydropower plants on macroinvertebrate communities. Acta Ecol. Sin. 2008, 28, 45–52. [Google Scholar] [CrossRef]
- Li, F.; Cai, Q.; Jiang, W.; Qu, X. The response of benthic macroinvertebrate communities to climate change: Evidence from subtropical mountain streams in Central China. Int. Rev. Hydrobiol. 2012, 97, 200–214. [Google Scholar] [CrossRef]
- Woznicki, S.A.; Nejadhashemi, A.P.; Tang, Y.; Wang, L. Large-scale climate change vulnerability assessment of stream health. Ecol. Indic. 2016, 69, 578–594. [Google Scholar] [CrossRef] [Green Version]
- Hershkovitz, Y.; Dahm, V.; Lorenz, A.W.; Hering, D. A multi-trait approach for the identification and protection of European freshwater species that are potentially vulnerable to the impacts of climate change. Ecol. Indic. 2015, 50, 150–160. [Google Scholar] [CrossRef]
- ASTERICS (=AQEM/STAR Ecological River Classification), Version 4.04, Desktop-Software. Department of Applied Zoology/Hydrobiology, University Duisburg-Essen: Essen, Germany, 2014. Available online: http://www.aqem.de/mains/products.php (accessed on 20 October 2021).
- Pozdnyakova, A. Some aspects of heavy metals rating in soils based on foreign experience. In Proceedings of the Materials of the 17th International Scientific Conference «Sakharov Readings 2017: Environmental Problems of the XXI Century», Minsk, Belarus, 18–19 May 2017; pp. 167–168. [Google Scholar]
- Ukrainskiy, V.V.; Kovalyshyna, S.P.; Denga, Y.M.; Zubcov, E.; Bagrin, N.; Andreev, N.; Ciornea, V.; Kolosov, V.; Ene, A. Study of metals in water, suspensions and sediments in the lower part of the Dniester River during 2019. In Proceedings of the International Conference “Environmental Challenges in the Black Sea Basin: Impact on Human Health”, Galati, Romania, 23–26 September 2020; pp. 11–12. [Google Scholar]
- Poznańska, M.; Kobak, J.; Wolnomiejski, N.; Kakareko, T. Shallow-water benthic macroinvertebrate community of the limnic part of a lowland Polish dam reservoir. Limnologica 2009, 39, 163–176. [Google Scholar] [CrossRef] [Green Version]
- Crommentnijn, T. Maximum Permissible Concentrations and Negligible Concentrations for Metals, Taking Background Concentrations into Account; RIVM: Bilthoven, The Netherlands, 1997. [Google Scholar]
- Grandova, M.A. Changes in phytoplankton community of Lower Dniester in 2018–2019. In Proceedings of the International Conference “EU Integration and Management of the Dniester River Basin”, Tiraspol, Moldova, 8–9 October 2020; Eco-TIRAS: Kishinev, Moldova, 2020; pp. 236–240. [Google Scholar]
- Nabokin, M.V. Mnogoletnie izmeneniya v zooplanktone del`ty` Dnestra [Long-term changes in the zooplankton of the Dniester delta]. In Proceedings of the International Conference “EU Integration and Management of the Dniester River Basin”, Tiraspol, Moldova, 8–9 October 2020; Eco-TIRAS: Kishinev, Moldova, 2020; pp. 236–239. [Google Scholar]
- Lebedenco, L.A.; Nabokin, M.V.; Andreev, N.N.; Kovalyshyna, S.P. The state of zooplankton communities in the Lower Dniester area under the conditions of river regulation and actual climatic changes. In Proceedings of the 10th International Conference of Zoologists Sustainable Use and Protection of Animal World in the Context of Climate Change, Kishinev, Moldova, 16 September 2021; pp. 55–64. [Google Scholar]
- UK TAG. Revised Classification of Aquatic Alien Species According to Their Level of Impact; UK TAG: Cambridge, UK, 2015; Volume 6. [Google Scholar]
- Paunovic, M.; Csanyi, B.; Simonovic, P.; Zoric, K. Invasive alien species in the Danube. Int. Rev. Allergol. Clin. Immunol. 2014, 20, 95–100. [Google Scholar] [CrossRef]
- Son, M.O. Alien invertebrates in Ukrainian inland waters in the context of basin approach to river management and monitoring. Geo & Bio 2019, 17, 77–84. [Google Scholar] [CrossRef]
- Vladimirov, M.Z. New information about freshwater oligochaete Branchiura sowerbyi of Europian part of USSR. Proc. Natl. Acad. Sci. MSSR. Ser. Biol. Chem. Sci. 1989, 2, 72–74. (In Russian) [Google Scholar]
- Korobov, R.; Trombitsky, I.; Matygin, A.; Onishchenko, E.; Kolvenko, V. On the issue of the annual runoff of the Dniester. In Proceedings of the «Hydropower Impact on River Ecosystem Functioning» Proceeding of the International Conference, Tiraspol, Moldova, 8–9 October 2019; Eco-TIRAS: Tiraspol, Moldova, 2019; pp. 176–182. [Google Scholar]
- Cushing, C.E.; Cummins, K.W.; Minshall, G.W. River and Stream Ecosystems of the World; University of California Press: Berkeley, CA, USA, 2006; ISBN 9780520245679. [Google Scholar]
- Timchenko, V.; Oksiyuk, O.; Gore, J. A model for ecosystem state and water quality management in the Dnieper River delta. Ecol. Eng. 2000, 16, 119–125. [Google Scholar] [CrossRef]
- Yao, N.; Feng, B.; Zhang, M.; He, L.; Zhang, H.; Liu, Z. Impact of industrial production, dam construction, and agriculture on the Z-IBI in river ecosystems: A case study of the wanan river basin in China. Water 2021, 13, 123. [Google Scholar] [CrossRef]
- Vannote, R.L.; Minshall, G.W.; Cummins, K.W.; Sedell, J.R.; Cushing, C.E. The River Continuum Concept. Can. J. Fish. Aquat. Sci. 1980, 37, 130–137. [Google Scholar] [CrossRef]
- Almazov, A.M. Gidrokhimiya Ust’yevykh Oblastey Rek (Severnoye Prichernomor’ye) [Hydrochemistry of River Estuary Areas (Northern Black Sea Region)]; AN USSR: Kiev, Ukraine, 1962. (In Russian) [Google Scholar]
- Garkavaya, G.P.; Bogatova, Y.I.; Berlinskii, N.A.; Goncharov, O.Y. Zoning of the Ukrainian Sector of a Northwest Part of the Black Sea (According to Hydrophysical and Hydrochemical Characteristics). Ecol. Saf. Coast. Shelf Zo. Complex Resour. Use Shelf 2000, 1, 9–24. [Google Scholar]
- Goncharov, O. Variation of Rivers runoff as an Important Factor of Nutrient Regime of the Black Sea. In Proceedings of the Integrirovannoye Upravleniye Transgranichnym Basseynom Dnestra [Integrated Management of the Dniester Transboundary Basin], Tiraspol, Moldova, 26–27 October 2017; Eco-TIRAS: Tiraspol, Moldova, 2017; pp. 62–64. [Google Scholar]
- Goncharov, O.Y.; Ukrainskiy, V.V.; Tityapkin, A.S. Influence of Dniester River Runoff on Dynamics of Chlorophyll in the Dniester Estuary and Adjacent Sea Area; Eco-TIRAS: Tiraspol, Moldova, 2018; p. 57. [Google Scholar]
- Garkavaya, G.P.; Bogatova, Y.I.; Goncharov, A.Y. Gidrokhimicheskie issledovaniia. In Severo-Zapadnaia Chast’ Chernogo Moria: Biologiia u Ekologiia [Hydro Chemical Research in the North Western Part of the Black Sea: Biology and Ecology]; Zaitsev, Y.P., Aleksandrov, B.G., Minicheva, G.G., Eds.; Naukova Dumka: Kiev, Ukraine, 2006; pp. 59–86. [Google Scholar]
- Wei, G.L.; Yang, Z.F.; Cui, B.S.; Li, B.; Chen, H.; Bai, J.H.; Dong, S.K. Impact of dam construction on water quality and water self-purification capacity of the Lancang River, China. Water Resour. Manag. 2009, 23, 1763–1780. [Google Scholar] [CrossRef]
- Darricau, L.; Elghali, A.; Martel, P.; Benzaazoua, M. Evaluation of the anthropogenic metal pollution at osisko lake: Sediments characterization for reclamation purposes. Appl. Sci. 2021, 11, 2298. [Google Scholar] [CrossRef]
- Alekseev, Y.V. Tyazhelyye Metally v Pochvakh i Rasteniyakh [Heavy Metals in Soils and Plants]; Agropromizdat: Saint Petersburg, Russia, 1987. (In Russian) [Google Scholar]
- Wu, H.; Chen, J.; Xu, J.; Zeng, G.; Sang, L.; Liu, Q.; Yin, Z.; Dai, J.; Yin, D.; Liang, J.; et al. Effects of dam construction on biodiversity: A review. J. Clean. Prod. 2019, 221, 480–489. [Google Scholar] [CrossRef]
- Vranovsky, M. Impact of the Gabcíkovo hydropower plant operation on planktonic copepods assemblages in the River Danube and its floodplain downstream of Bratislava. Hydrobiologia 1997, 347, 41–49. [Google Scholar] [CrossRef]
- Mineeva, N.M.; Korneva, L.G.; Solov’eva, V.V. Phytoplankton production characteristics in the upper and lower pools of Volga reservoir HPPs. Water Resour. 2017, 44, 831–839. [Google Scholar] [CrossRef]
- Ochocka, A.; Pasztaleniec, A. Sensitivity of plankton indices to lake trophic conditions. Environ. Monit. Assess. 2016, 188, 622. [Google Scholar] [CrossRef] [PubMed] [Green Version]
- Teneva, I.; Mladenov, R.; Belkinova, D.; Dimitrova-Dyulgerova, I.; Dzhambazov, B. Phytoplankton community of the drinking water supply reservoir Borovitsa (South Bulgaria) with an emphasis on cyanotoxins and water quality. Open Life Sci. 2010, 5, 231–239. [Google Scholar] [CrossRef]
- Chen, Q.; Shi, W.; Huisman, J.; Maberly, S.C.; Zhang, J.; Yu, J.; Chen, Y.; Tonina, D.; Yi, Q. Hydropower reservoirs on the upper Mekong River modify nutrient bioavailability downstream. Natl. Sci. Rev. 2020, 7, 1449–1457. [Google Scholar] [CrossRef]
- Kasprzak, S.M. Reservoir Hydroelectric Dams Silica Depletion Silica Shelled Diatom Phytoplankton A Gulf of Maine Catastrophe. 2018. Available online: https://www.maine.gov/dep/ftp/projects/necec/public-interest/2019-02-14%20from%20Steve%20Kasprzak%20Attachment%204%20%20Reservoir%20Hydroelectric%20Dams%20Silica%20Depletion%20-%20A%20Gulf%20of%20Maine%20Catastrophe.pdf (accessed on 20 October 2021).
- Ouyang, W.; Li, Z.; Yang, J.; Lu, L.; Guo, J. Spatio-temporal variations in phytoplankton communities in sediment and surfacewater as reservoir drawdown—A case study of pengxi river in three Gorges reservoir, China. Water 2021, 13, 340. [Google Scholar] [CrossRef]
- Deksne, R.; Škute, A.; Gruberts, D.; Paidere, J. Effects of climate change on zooplankton community structure of the middle stretch of the Daugava river over the last 50 years. Ecohydrol. Hydrobiol. 2011, 11, 79–95. [Google Scholar] [CrossRef]
- Nabokin, M.V.; Kovalishina, S.P. Analysis of seasonal changes in the zooplankton of the Dniester delta. In Proceedings of the «Hydropower Impact on River Ecosystem Functioning», International Conference, Kishinev, Moldova, 8–9 October 2019; pp. 257–260. [Google Scholar]
- Kernan, M.; Battarbee, R.W.; Moss, B. Climate Change Impacts on Freshwater Ecosystems; John Wiley & Sons: Hoboken, NJ, USA, 2010; ISBN 9781444327397. [Google Scholar] [CrossRef]
- Townsend, C.R. The Patch Dynamics Concept of Stream Community Ecology. J. N. Am. Benthol. Soc. 1989, 8, 36–50. [Google Scholar] [CrossRef]
- Munjiu, O. Distribution of endangered mayfly Palingenia longicauda (Olivier, 1791)(Ephemeroptera, Palingeniidae) on the territory of the Republic of Moldova. Lauterbornia 2017, 84, 39–51. [Google Scholar]
- Munjiu, O.; Andreev, N. Zoobenthos of the Dniester River on the territory of the Republic of Moldova for the period 2018–2021. In Proceedings of the Conferința ‘Sustainable Use and Protection of Animal World in the Context of Climate Change’, Tiraspol, Moldova, 16 September 2021; Eco-TIRAS: Kishinev, Moldova, 2021; pp. 65–69. [Google Scholar] [CrossRef]
- Semenchenko, V.P.; Son, M.O.; Novitsky, R.A.; Kvatch, Y.V.; Panov, V.E. Alien macroinvertebrates and fish in the Dnieper River basin. Russ. J. Biol. Invasions 2015, 6, 51–64. [Google Scholar] [CrossRef]
- Son, M.O.; Prokin, A.A.; Dubov, P.G.; Konopacka, A.; Grabowski, M.; Macneil, C.; Panov, V.E. Caspian invaders vs. Ponto-caspian locals—Range expansion of invasive macroinvertebrates from the volga basin results in high biological pollution of the lower don river. Manag. Biol. Invasions 2020, 11, 178–200. [Google Scholar] [CrossRef]
- Vaikasas, S.; Palaima, K.; Pliuraite, V. Influence of hydropower dams on the state of macroinvertebrates assemblages in the Virvyte river, Lithuania. J. Environ. Eng. Landsc. Manag. 2013, 21, 305–315. [Google Scholar] [CrossRef]
- Schöll, F.; Haybach, A.; König, B. Das erweiterte Potamontypieverfahren zur ökologischen Bewertung von Bundeswasserstraßen (Fließgewässertypen 10 und 20: Kies-und sandgeprägte Ströme, Qualitätskomponente Makrozoobenthos) nach Maßgabe der EU-Wasserrahmenrichtlinie. Hydrologie und Wasserwirtschaft 2005, 49, 234–247. [Google Scholar]
- Bogatov, V. Kombinirovannaya kontseptsiya funktsionirovaniya rechnykh ekosistem [Combined concept of river ecosystem functioning]. FEB RAS Bull. 1995, 3, 51–61. (In Russian) [Google Scholar]


| Season | DO | TOC | BOD5 | TSS | Nitrogen Species | Phosphorus Species | Silicate | |||||||
|---|---|---|---|---|---|---|---|---|---|---|---|---|---|---|
| NH4+ | NO2− | NO3− | DIN | DON | TDN | DIP | DOP | TDP | ||||||
| % | mg L−1 | mgN L−1 | mgP L−1 | mgSi L−1 | ||||||||||
| Winter | 98.0 ± 12.0 68.9–127 | 7.3 ± 2.0 4.2–11.8 | 3.37 ± 0.45 2.50–4.44 | 8.2 ± 5.6 1.9–25.1 | 0.093 ± 0.020 0.050–0.144 | 0.021 ± 0.010 0.010–0.050 | 1.76 ± 0.42 0.99–2.74 | 1.87 ± 0.42 1.08–2.88 | 1.09 ± 0.18 0.59–1.36 | 2.95 ± 0.48 1.88–3.89 | 0.084 ± 0.004 0.075–0.091 | 0.024 ± 0.004 0.013–0.032 | 0.107 ± 0.007 0.088–0.121 | 2.87 ± 0.23 2.39–3.29 |
| Spring | 81.1 ± 6.9 60.6–90.2 | 5.0 ± 1.5 3.4–9.6 | 0.97 ± 0.25 0.55–1.67 | 30.6 ± 7.2 13.3–45.1 | 0.064 ± 0.030 0.014–0.131- | 0.032 ± 0.010 0.016–0.060 | 1.66 ± 0.24 1.27–2.37 | 1.88 ± 0.28 1.50–2.52 | 0.78 ± 0.19 0.51–1.23 | 2.66 ± 0.47 2.10–3.75 | 0.065 ± 0.006 0.055–0.077 | 0.018 ± 0.001 0.016–0.020 | 0.083 ± 0.005 0.075–0.093 | 2.28 ± 0.30 1.71–3.13 |
| Summer | 63.5 ± 5.5 47.3–71.9 | 6.4 ± 1.5 4.3–10.7 | 1.23 ± 0.23 0.63–1.67 | 24.1 ± 4.3 17.4–36.6 | 0.085 ± 0.039 0.016–0.170 | 0.038 ± 0.004 0.031–0.047 | 1.17 ± 0.14 0.94–1.58 | 1.30 ± 0.14 1.08–1.62 | 1.10 ± 0.24 0.55–1.44 | 2.50 ± 0.11 2.17–2.84 | 0.061 ± 0.014 0.023–0.087 | 0.036 ± 0.015 0.008–0.063 | 0.097 ± 0.009 0.082–0.123 | 3.44 ± 0.34 2.89–4.41 |
| Autumn | 67.4 ± 4.3 55.3–78.4 | 5.4 ± 1.1 2.4–8.5 | 1.51 ± 0.39 0.72–2.95 | 19.5 ± 5.2 7.6–39.0 | 0.025 ± 0.004 0.016–0.035 | 0.034 ± 0.004 0.018–0.040 | 0.55 ± 0.24 0.09–1.43 | 0.58 ± 0.27 0.15–1.48 | 1.55 ± 0.47 0.62–2.69 | 1.68 ± 0.38 0.89–2.84 | 0.091 ± 0.019 0.022–0.137 | 0.050 ± 0.015 0.018–0.102 | 0.141 ± 0.015 0.103–0.184 | 4.23 ± 0.27 3.44–4.83 |
| Season | Characteristic | Rotifera | Copepoda | Cladocera | Varia | Total * |
|---|---|---|---|---|---|---|
| Spring | Abundance, ind. m−3 | 5575 ± 3660 | 17,689 ± 16,033 | 1490 ± 941 | 312 ± 103 | 25,067 ± 17,668 |
| Biomass, mg m−3 | 12.3 ± 7 | 412.7 ± 396.3 | 84.4 ± 45 | 5.7 ± 3.6 | 515.1 ± 436.6 | |
| Summer | Abundance, ind. m−3 | 3594 ± 963 | 5310 ± 1789 | 2463 ± 1046 | 1758 ± 425 | 13,125 ± 2497 |
| Biomass, mg m−3 | 10.5 ± 4.6 | 68.1 ± 22.7 | 207.6 ± 99.4 | 7 ± 1.4 | 293.2 ± 113.6 | |
| Autumn | Abundance, ind. m−3 | 394 ± 235 | 265 ± 107 | 155 ± 131 | 53 ± 29 | 867 ± 439 |
| Biomass, mg m−3 | 2.2 ± 1.1 | 2.3 ± 0.9 | 4.7 ± 3.7 | 0.2 ± 0.1 | 9.3 ± 5.2 | |
| Winter | Abundance, ind. m−3 | 128 ± 33 | 70 ± 10 | 55 ± 45 | 25 ± 5 | 278 ± 93 |
| Biomass, mg m−3 | 0.1 ± 0.1 | 0.3 ± 0.1 | 1 ± 0.3 | 0.2 ± 0.2 | 1.7 ± 0.5 |
| Biotic Characteristics | 1949–1951 | 2018–2020 | ||
|---|---|---|---|---|
| Average ± SE | Range | Average ± SE | Range | |
| Abundance, ind. m−2 | 3914 ± 828 | 1463–6432 | 14,528 ± 3552 | 107–58,764 |
| Biomass, g m−2 | 29 ± 9 | 7.27–56 | 799 ± 230 | 0.76–3411 |
| Number of Taxa | 11 ± 3 | 3–21 | 8 ± 1 | 1–40 |
| Shannon Index | 0.81 ± 0.16 | 0.22–1.25 | 1.28 ± 0.08 | 0.1–1.85 |
| Saprobic Index (Zelinka & Marvan) | 2.14±0.09 | 1.9-2.32 | 2.25 ± 0.06 | 1.94–3.27 |
| Romania Saprobic Index | 2.28 ± 0.11 | 1.98–2.5 | 2.2 ± 0.06 | 1.96–3.08 |
| BMWP Score | 19 ± 6 | 8–47 | 14 ± 1 | 1–32 |
| BMWP N taxa | 5 ± 1 | 2–10 | 4 ± 1 | 1–7 |
| Average BMWP score per Taxon | 4.1 ± 0.15 | 3.75–4.7 | 3.43 ± 0.18 | 1–4.57 |
| DSFI Diversity Groups | — | 0–1 | — | 0–3 |
| DSFI | — | — | — | — |
| BBI | 3.5 ± 0.24 | 3–4 | 3.9 ± 0.11 | 3–5 |
| Potamon Type Index | 3.45 ± 0.58 | 1.87–5 | 3.05 ± 0.19 | 1.67–5 |
| Functional Feeding Groups | ||||
| % Grazers and scrapers | 20.02 ± 11.03 | 0–68.18 | 11.53 ± 2.46 | 0–47.41 |
| % Miners | 1.29 ± 0.75 | 0–15.82 | ||
| % Shredders | 0.73 ± 0.36 | 0–7.71 | ||
| % Gatherers/Collectors | 34.91 ± 15.29 | 3.05–95.04 | 47.92 ± 6.9 | 0–92.4 |
| % Active filter feeders | 20.71 ± 12.2 | 0–77.88 | 7.29 ± 1.83 | 0–40 |
| % Passive filter feeders | 3.42 ± 3.39 | 0–20.36 | 1.03 ± 1.02 | 0–22.37 |
| % Predators | 0.64 ± 0.58 | 0–3.5 | 2.71 ± 1.26 | 0–20 |
| % Parasites | 0.74 ± 0.48 | 0–10.33 | ||
| % Other Feeding types | 0.19 ± 0.08 | 0–1.34 | ||
| LIFE Index | 6.83 ± 0.2 | 6–7.5 | 5.17 ± 0.25 | 3–7 |
Publisher’s Note: MDPI stays neutral with regard to jurisdictional claims in published maps and institutional affiliations. |
© 2021 by the authors. Licensee MDPI, Basel, Switzerland. This article is an open access article distributed under the terms and conditions of the Creative Commons Attribution (CC BY) license (https://creativecommons.org/licenses/by/4.0/).
Share and Cite
Kovalyshyna, S.; Chuzhekova, T.; Grandova, M.; Onishchenko, E.; Zubcov, E.; Ukrainskyy, V.; Goncharov, O.; Munjiu, O.; Nabokin, M.; Ene, A. Ecological Conditions of the Lower Dniester and Some Indicators for Assessment of the Hydropower Impact. Appl. Sci. 2021, 11, 9900. https://doi.org/10.3390/app11219900
Kovalyshyna S, Chuzhekova T, Grandova M, Onishchenko E, Zubcov E, Ukrainskyy V, Goncharov O, Munjiu O, Nabokin M, Ene A. Ecological Conditions of the Lower Dniester and Some Indicators for Assessment of the Hydropower Impact. Applied Sciences. 2021; 11(21):9900. https://doi.org/10.3390/app11219900
Chicago/Turabian StyleKovalyshyna, Svitlana, Tatiana Chuzhekova, Maria Grandova, Eduard Onishchenko, Elena Zubcov, Volodymyr Ukrainskyy, Oleksandr Goncharov, Oxana Munjiu, Mikhailo Nabokin, and Antoaneta Ene. 2021. "Ecological Conditions of the Lower Dniester and Some Indicators for Assessment of the Hydropower Impact" Applied Sciences 11, no. 21: 9900. https://doi.org/10.3390/app11219900