
Take-Over Time: A Cross-Cultural Study of Take-Over Responses in Highly Automated Driving


1
The User-Adapted Communication and Ambient Intelligence Lab, Faculty of Electrical Engineering, University of Ljubljana, Tržaška Cesta 25, 1000 Ljubljana, Slovenia
2
Department of Industrial & Systems Engineering, University of Washington Seattle, Seattle, WA 98105, USA
3
Mechanical Engineering Department, Colorado State University, 400 Isotope Dr, Fort Collins, CO 80521, USA
4
Laboratory of Information Technologies, Faculty of Electrical engineering, University of Ljubljana, Tržaška Cesta 25, 1000 Ljubljana, Slovenia
*
Author to whom correspondence should be addressed.
Appl. Sci. 2021, 11(17), 7959; https://doi.org/10.3390/app11177959
Submission received: 9 August 2021
/
Revised: 25 August 2021
/
Accepted: 26 August 2021
/
Published: 28 August 2021
(This article belongs to the Special Issue The Development and Prospects of Autonomous Driving Technology)
Abstract
:The article presents a cross-cultural study of take-over performance in highly automated driving. As take-over performance is an important measure of safe driving, potential cultural differences could have important implications for the future development of automated vehicles. The study was conducted in two culturally different locations, Seattle, WA (n = 20) and Ljubljana, Slovenia (n = 18), using a driving simulator. While driving, participants voluntarily engaged in secondary tasks. The take-over request (TOR) was triggered at a specific time during the drive, and take-over time and type of response (none, brake, steer) were measured for each participant. Results show significant differences in take-over performance between the two locations. In Seattle 30% of participants in Seattle did not respond to TOR; the remaining 70% responded by braking only, compared to Slovenian participants who all responded by either braking or steering. Participants from Seattle responded significantly more slowly to TOR (M = +1285 ms) than Slovenian participants. Secondary task engagement at TOR also had an effect, with distracted US participants’ response taking significantly longer (M = +1596 ms) than Slovenian participants. Reported differences in take-over performance may indicate cultural differences in driving behavior and trust in automated driving.
1. Introduction
There are positive and negative impacts associated with automated driving. The change from manual to automated driving alters the driver’s role and encourages drivers to engage in more non-driving related tasks [1]. Automated driving can also affect driver’s situation awareness and performance in critical situations [2]. While some drivers have reported that their perceived workload decreases with automated driving [1,3], their ability to take over when needed is not clear [4].
Several studies have examined driver behavior during a take-over request (TOR). A meta-study using SAE level 2 automation and higher showed that the mean take-over time was affected by situation, type of TOR, driver’s prior experience with TOR, and the secondary task engagement [5]. This meta-study is in line with other studies that reported the negative effects of (particularly visual) secondary tasks on the driver performance and take-over time [3,6,7,8,9,10,11,12]. For example, Merat et al. examined how changes in workload affected driver performance and found that driver’s engagement in a secondary task significantly reduced their performance [6]. Wandtner et al. investigated the effects of various task modalities on take-over time [12]. A model task was used to control for stimulus and response, keeping the task characteristics as constant as possible. The authors found significant effects of visual task modality on take-over time and quality, with visual/manual distraction contributing to longest take-over times. Radlmayr et al. investigated the effect of varying traffic situations and secondary tasks on the take-over time and quality [7]. Their results showed significant negative effects on the take-over time in high-density traffic or while engaged in a task. Importantly, similar effects on the take-over time were shown between the two types of tasks, with authors concluding “that cognitive non-driving tasks can lead to a similar distraction and thus loss of situation awareness compared with mainly visual tasks” (Radlmayr et al. 2014, p. 2067). Gold et al. compared four types of secondary tasks: visual-motoric SuRT task, cognitive 2-back test, cognitive-motoric task, and laptop-based fill-in-the-blank text task [8]. Their results showed that the take-over time was affected by the interaction between TOR and the secondary task distraction of the same modality, whether cognitive or motoric. As a consequence, cognitive demanding tasks had a larger effect on the take-over time in time-critical and cognitively demanding situations, as compared to more casual take-over situations where motoric distractions had a bigger effect on take-over performance (cf. [8,12]).
Petermeijer et al. [11] investigated the interaction effects between TOR and secondary task modalities (auditory and visual). The secondary tasks included reading or watching a video on a tablet and making a phone call. Their results show that the visual TOR alert had a substantial negative effect on the take-over time. However, no significant effect was found for secondary tasks, nor was there any interaction effect on the take-over time detected for TOR and secondary task of the same modality (cf. [7,8]).
With respect to age-related effects, there have been no consistent effects on take-over time [4,5,10,13]. While Li et al. [13] showed a significant age effect on take-over time, Zhang et al. [5], Körber et al. [10], Clark and Feng [4], and Miller et al. [14] did not. Zeeb et al. [9] and Clark and Feng [4] also found no significant effect of age or secondary tasks on the take-over time, but reported a deterioration in take-over quality for distracted drivers.
While age-related differences have been examined, cultural differences in automated driving behavior have not been extensively studied. To our knowledge, only two other relevant cross-cultural studies exist. Hergeth et al. investigated the effects of TORs on driver’s trust in highly automated driving among Chinese and German drivers [15]. While Chinese drivers reported significantly higher mistrust in automated driving, the trust ratings did not significantly predict take-over times between the two nationalities. Wang et al. investigated risk-avoiding behaviors between Chinese and German drivers in three driving scenarios involving vulnerable traffic participants (motorbike lane violation, pedestrian crossing the road, and wild animal crossing the road) [16]. They found significant cultural differences between Chinese and German drivers in risk-avoiding behaviors and subjective assessments under the same scenarios. Moreover, differences were found in the two of the three driving scenarios, with Chinese participants having significantly longer take-over time than German participants [16].
Identifying cultural differences is important as we move forward with automated vehicles as they impact display design, communication protocols, and even adherence to, interpretation of, and use of in-vehicle alerts. This study extends our preliminary work [17] and examines potential cultural differences in TOR and secondary task engagement between two very different parts of the world: Ljubljana, Slovenia and Seattle, WA, United States. These two parts of the world provide an interesting comparison as both are moving forward with autonomous cars, but given cultural, educational, and policy differences, users may have very different response time to take-over requests and attention to non-driving tasks that may impact overall driver safety.
2. Materials and Methods
The study was conducted in Seattle, WA, USA and in Ljubljana, Slovenia, using driving simulators with the same experimental design and protocol as far as feasibly possible.
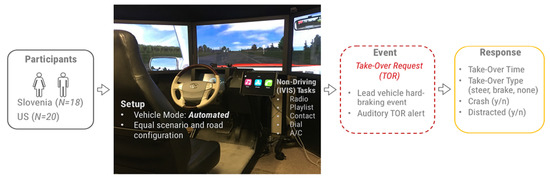
2.1. Participants
A total of 43 participants completed the study;, however, five participants (four in Slovenia and one in USA) were excluded from further analysis due to technical issues with the measuring equipment. Thus, there were a total of 38 participants used in the analysis (see Table 1).
2.2. Equipment
A compact Nervtech simulator (Slovenia) and a NADS miniSim (USA) were used to simulate highly automated driving conditions. Although the different simulators had different software, the driving scenario and study procedures were matched to the best of our ability to maintain high internal validity. The scenario used in both locations had the same roadway configuration, which was a rural highway with one lane in each direction. The posted speed was 55 miles per hour (88.5 kph) for the USA and 90 km per hour (56 mph) for Slovenia. The scenario had a lead vehicle set at a gap of 1.6 s.
2.3. Non-Driving Tasks
During the drive, participants voluntarily engaged in naturalistic secondary tasks using an in-vehicle information system (IVIS). The tasks involved making a phone call (dialing or selecting a contact), finding music (tuning the radio or selecting from a playlist), and setting the air conditioning (A/C). Participants were given audio instructions for the task and completed the tasks using visual-manual input. Participants initiated each task by pressing “start next task” and signaled the completion of their task by pressing “submit” on the top right of the IVIS interface. Participants were instructed to complete as many IVIS tasks as they felt comfortable.
2.4. Procedure
Participants were told that the vehicle simulated a highly automated driving, and that while the automation would control their vehicle, they were still responsible for monitoring the driving task because the automation was not perfect. Participants first completed a practice drive, which included using the IVIS and vehicle automation. Each participant then completed the study drive, which was 13 min (USA) and 10 min (Slovenia). At 12.5 min (USA) and 9.5 min (Slovenia) into the drive, the lead vehicle had a hard-braking event, triggering a take-over request (TOR) from the ego vehicle’s automation. TOR provided a 2 s audio alert, which was the same tone, volume, and duration in both study locations. The scenario and road configuration for TOR was the same at both locations, with TOR occurring on a rural highway.
2.5. Response Measures
Take-over time: Time from when the lead vehicle began the hard braking event (which is also when the audio alert cued) until the participant applied force to the steering wheel (at least 2 degrees movement) or brake pedal (at least 10% depression of brake pedal). These thresholds were determined through pilot testing and for the purpose of avoiding misclassifications of noise as a driver-initiated response.
Take-over response type (3 levels): This was recorded as initial response to TOR, whether the participant applied force to the steering wheel, brake pedal, or none.
Crash (yes, no): The driving simulator recorded whether the participant crashed into the lead vehicle during TOR event.
Distracted (yes, no): This variable was coded as “yes” if the participants were engaged in IVIS during TOR.
Task completion rate: Objective workload of the IVIS task types (radio, playlist, contact, dial, A/C) was recorded as the ratio of total IVIS tasks the participants completed correct per the task instructions.
NASA TLX: Subjective workload of the IVIS task types (radio, playlist, contact, dial, A/C) was measured using the NASA TLX [18] after the drive. The NASA TLX measures workload on six sub-scales with respect to the task at hand. Mental, physical, and temporal demands, frustration, effort, and performance are rated on scales from 1 to 100 and a weighting procedure is used to compute a global workload score between 1 (low) and 100 (high) [18].
Independent variables included location, age, gender, secondary task completion rate, and task difficulty.
2.6. Statistical Analysis
Multiple linear regression model was used for the analysis of take-over time and for the subjective assessment of workload (NASA TLX for IVIS). A linear mixed effects model was used for the analyses of response type (none, brake, steer) and for the objective assessment of workload (task completion rate for IVIS), with the participant fitted as a random factor in both cases. Pairwise t-tests and Tukey’s HSD were used in the post hoc analyses, with p values adjusted (Bonferroni) for multiple comparisons. A significance level of α = 0.05 was used for all statistical tests. All statistical analyses were conducted using statsmodels v0.11.1 [19].
3. Results
We investigated the differences in the take-over performance (type of response to TOR and take-over time) between both locations, as well as workload related to the secondary task engagement in IVIS.
3.1. Take-Over Responses
As shown in Table 2, there are notable differences in the type of response to TOR (none, brake, steer) between the two locations. Six (30%) of the US participants did not respond to TOR (five of those were distracted, three among them were older participants), as compared to the Slovenian participants who all did. Of those who responded, the US participants responded only by braking, as compared to the Slovenian participants whose response was either braking (61%) or steering (39%).
A linear mixed effects model with a random intercept for the participant was created to analyze the effect of location, age (young, old), gender, and task difficulty (none: not distracted; easy: playlist, contact; hard: A/C, radio, dial) on the type of response to TOR (none, brake, steer). The task difficulty level was set based on the analysis of the objective task workload (see Section 3.3). The random intercept for the participant was fitted to account for variability among the participants. Location (β = −0.725, SE = 0.22, z(38) = −3.3, p = 0.001) had a significant effect on response type, whereas age (β = 0.036, SE = 0.256, z = 0.14, p = 0.9), gender (β = 0.095, SE = 0.2, z = 0.47, p = 0.64) and task difficulty (easy: β = 0.012, SE = 0.212, z = 0.06, p = 0.9; hard: β = −0.039, SE = 0.213, z = −0.18, p = 0.9) did not.
3.2. Take-Over Time
A multiple linear regression was conducted to investigate the effects of location, gender, age (young, old), and being engaged in IVIS (distracted) at TOR on the take-over time (in milliseconds). The six participants in Seattle, WA who did not respond to TOR (see Table 2) were removed prior to the analysis. The regression results show a collective significant effect of these variables on the take-over time (F(4,27) = 6.77, p < 0.001, R2 = 0.50, R2adj = 0.43). A significant effect was found for location (β = 0.59, t = 3, p = 0.006) and being engaged in IVIS (distracted) at TOR (β = 0.32, t = 2.2, p = 0.034), with the mean take-over time for the US participants (n = 14; M = 3307, SD = 923) being significantly longer (M = +1285) than for the Slovenian participants (n = 18; M = 2022, SD = 778). Age (β = −0.04, t = −0.17, p = 0.87) and gender (β = −0.11, t = −0.54, p = 0.59) had no statistically significant effect on the model. Figure 1 shows the distribution of take-over time data across location and being distracted at TOR.
The individual predictors were further examined separately between locations. Post hoc pairwise t-tests revealed a significant difference in the mean take-over time between the two locations for the participants engaged in IVIS at TOR (see Figure 1). The distracted US participants (M = 3775, SD = 595) had significantly longer mean take-over time (M = +1596) than the distracted Slovenian participants (M = 2179, SD = 804), t = 4.97, pcorr < 0.001, Hedge’s g = 2.10. No statistically significant effect on the mean take-over time was found for the participants not engaged in IVIS, t = 1.91, pcorr = 0.17, Hedge’s g = 1.01. However, the difference in the mean take-over time between both locations is still large, with the non-distracted US participants (M = 2683, SD = 951) having longer mean take-over time (M = +906) as compared to the non-distracted Slovenian participants (M = 1777, SD = 723).
The effect of being distracted with IVIS at TOR was also investigated within each location. The mean take-over time was compared per location for the participants who were engaged in IVIS (US: M = 3775, SD = 595; SI: M = 2179, SD = 804) and those who were not (US: M = 2683, SD = 951; SI: M = 1776, SD = 723). No statistically significant differences in the mean take-over time were found for either location (US: t = 2.47, pcorr = 0.07; SI: t = 1.10, pcorr = 0.57). However, the mean take-over time was longer for the participants who were engaged in IVIS, and particularly for participants in Seattle, WA (US: M = +1092; SI: M = +402).
3.3. Measures of Workload for Non-Driving Tasks
3.3.1. Task Completion Rate
The participants actively engaged in IVIS, with a similar mean number of tasks between the locations (SI: M = 20.6, US: M = 19.8). The task completion rate gives an objective measure of the IVIS task workload, with more difficult tasks having a lower completion rate than easier tasks. As each participant was repeatedly subjected to several instances of IVIS tasks, the task completion rate was measured as a fraction of correctly completed tasks from the total started, per participant and IVIS type.
A linear mixed effects model with a random intercept for the participant was created to analyze the effect of location, IVIS task type (A/C, contact, dial, playlist, radio) and age (young, old) on the task completion rate. The random intercept for the participant was fitted to account for variability among the participants. Table 3 shows the outcome of the linear mixed effect model. A significant difference in task completion was found between the younger and the older participants, with the older participants having a lower mean task completion rate (β = −0.117, SE = 0.58, z(207) = −2.02, p = 0.04). Significant differences were also found between IVIS task types, with contact, dial, and playlist all significantly different from the reference group (A/C). However, no significant effects were found for location and gender.
Post hoc Tukey’s HSD test showed significant differences in task completion rate between several IVIS types (see Table 4). These differences indicate that some IVIS tasks, such as A/C and radio, have lower completion rates and can thus be interpreted as more difficult than the rest (see also Figure 2, right). Older participants did not compensate for the task difficulty and were just as engaged in difficult tasks (A/C and radio: M = 4.86) as the younger participants (A/C and radio: M = 4.3), with no significant overall difference in the type of IVIS engagement between both age groups (t(8) = 1.94, p = 0.09, 95% CI = [−0.07, 0.84]).
3.3.2. NASA TLX
A multiple linear regression was conducted to evaluate the effects of location, gender, age group and IVIS type on the global NASA TLX score. Participants who did not report on all TLX dimensions were dropped from the analysis. The results show a significant effect of several independent variables on the TLX score (F(4,155) = 16.76, p < 0.001, R2 = 0.30, R2adj = 0.28). A significant effect was found for age, with perceived workload higher for the older participants (β = 0.18, t = 2.13, p = 0.035), as compared to the younger. IVIS task type also had a significant effect (β = −0.52, t = −7.69, p < 0.001). No significant effect was found for location (β = 0.004, t = 0.005, p = 0.9) and gender (β = 0.01, t = 0.12, p = 0.91).
Post hoc Tukey’s HSD showed significant differences in NASA TLX scores between several IVIS types, comparable to the results of objective workload. Results in Table 4 show differences in subjective and objective evaluation of IVIS workload. The NASA TLX index was normalized for the comparison with the task completion rate.
As shown in Figure 2, the global TLX scores for each IVIS type correspond with the objective measurement of the IVIS workload. Note the inverse relationship: the IVIS task types that were perceived as difficult on the TLX index (with higher mean score indicating higher workload) had a lower mean completion rate, whereas those perceived as easy on TLX (lower mean score indicating lower workload) had a higher mean completion rate.
4. Discussion
An important finding of the presented study is the notable differences in driving performance between the two locations, particularly in the take-over time and type of response to TOR. Participants in Seattle were significantly slower to respond to TOR (M = +1285) than Slovenian participants. Engagement in a secondary task (IVIS) at TOR also had an effect on take-over time (similar to [10]), while gender and age had no effect (cf. [13]). Distracted US participants had significantly longer response times to TOR (M = +1596) than distracted Slovenian participants. Within each site, mean adoption time was also longer for participants who engaged with IVIS, particularly for US participants (US: M = +1092; SI: M = +402). Although the difference in mean acquisition time between the two locations was not significant for the non-distracted participants, it was large and consistent with the results of [7,9]), with the non-distracted US participants having a longer mean acquisition time (M = +906) than the non-distracted Slovenian participants.
The differences in response times between the two locations could be due to age differences, as half of the US participants were older than the Slovenian participants (see Table 1). However, as reported in the results (Section 3.2), there were no significant age-related effects on TOR, either between or within the two locations. For example, on the secondary task TOR, where age-related decline should be most pronounced, the distracted older US participants performed comparably to the younger US participants (acquisition time: M = 3775, SD = 595). These results are supported by several studies that investigated age-related differences in vehicle take-over during automated driving [4,5,10,13]. For example, in their meta-analysis of mean take-over times from 129 studies, Zhang et al. found that mean take-over times were shorter for participants who had no secondary tasks but found no consistent effect of age [5].
Another important finding of the present study is the differences in the nature of the response to TOR. While Slovenian participants all responded to TOR, 30% of US participants did not. The remaining US participants all responded by braking, while the Slovenian participants responded by either braking and/or steering.
The differences in responses between the two locations appear even more surprising when we look at task workload ratings. Significant differences in workload were found for secondary task type and age, but not for location or gender. The older participants experienced higher workload than the younger participants, which could have contributed to longer take-over time or no response to TOR, but as the results show, not significantly. Furthermore, unlike in the study by [4], the older participants did not compensate for task difficulty and were as actively engaged on difficult tasks as the younger participants.
The differences in driver performance on TOR, and in particular the fact that 30% of the US participants did not respond to TOR, could indicate greater trust in autonomous driving among these participants. On the other hand, the significant differences in take-over time and type of response among the participants who responded to TOR (braking only vs. either braking or steering) may also indicate possible cultural differences in driving behaviors among the participants from Seattle and Slovenia.
A larger cross-cultural study with more participants and locations is needed to further explore the presented findings and place them in a broader behavioral, social, demographic, and cultural context. Slovenia and the US each share similarities with other countries in the world; however, a broader study would increase the external validity of these findings. Differences in policy, driver education, and transportation infrastructure may contribute to differences in driving behavior and will be further explored in our future work.
5. Conclusions
The effects associated with highly automated driving are both positive and negative. The shift from manual to highly automated driving changes the role and behavior of drivers, as they no longer need to constantly monitor the road. In several studies, drivers reported reduced perceived workload associated with driving and increased subjective safety and trust in the system [3,20,21]. As a result, drivers are more likely to engage in non-driving tasks, which in turn may affect their situational awareness and performance in critical situations, leading to increased time responses to TORs [4,9,21].
The presented study investigated the take-over responses and secondary task en-gagement of drivers from two culturally different locations, namely Seattle, WA, and Ljubljana, Slovenia. The main objective of the study was to identify possible differences in driver behavior in the two locations. Significant differences were found between the two locations in terms of take-over time and type of response type at TOR. On average, the US participants responded significantly more slowly to TOR, as compared to the Slovenian participants. Secondary task engagement at TOR also affected take-over time, with significantly longer take-over responses among distracted US participants. In addition, 30% of US participants did not respond to TOR, in contrast to Slovenian participants, all of whom responded. The remainder of the US participants responded to TOR only by braking, whereas the Slovenian participants responded by either braking or steering.
The differences in take-over performance between the two locations could indicate greater trust in automated driving among US participants. In addition, the differences in responses to TOR could also indicate cultural differences in driving behavior between the United States and Slovenia. Because TOR performance is an important evaluation measure of driving safety, potential cultural effects on TOR could have important implications for future development of automated vehicles.
Author Contributions
Conceptualization, G.S., E.E.M., L.N.B. and J.S.; methodology, G.S., Y.X., L.N.B. and J.S.; formal analysis, G.S., Y.X. and L.N.B.; investigation, E.E.M., L.N.B. and J.S.; resources, E.E.M., L.N.B. and J.S.; data curation, G.S. and Y.X.; writing—original draft preparation, G.S.; writing—review and editing, G.S., L.N.B. and J.S.; visualization, G.S.; funding acquisition, E.E.M., L.N.B. and J.S. All authors have read and agreed to the published version of the manuscript.
Funding
This research was funded by the Slovenian Research Agency within the research program P2-0246, research project L2-8178, and bilateral project BI-US/18-19-086.
Institutional Review Board Statement
The study was conducted according to the guidelines of the Declaration of Helsinki, and approved by the Institutional Review Board (or Ethics Committee). All procedures performed in studies involving human participants were in accordance with the ethical standards of the institutional and/or national research committee.
Informed Consent Statement
Informed consent was obtained from all subjects involved in the study.
Data Availability Statement
The data presented in this study are available on request from the corresponding author.
Conflicts of Interest
The authors declare no conflict of interest. The funders had no role in the design of the study; in the collection, analyses, or interpretation of data; in the writing of the manuscript, or in the decision to publish the results.
References
- Merat, N.; Jamson, A.H.; Lai, F.C.H.; Daly, M.; Carsten, O.M.J. Transition to manual: Driver behaviour when resuming control from a highly automated vehicle. Transp. Res. Part F Traffic Psychol. Behav. 2014, 27, 274–282. [Google Scholar] [CrossRef] [Green Version]
- De Winter, J.C.F.; Happee, R.; Martens, M.H.; Stanton, N.A. Effects of adaptive cruise control and highly automated driving on workload and situation awareness: A review of the empirical evidence. Transp. Res. Part F Traffic Psychol. Behav. 2014, 27, 196–217. [Google Scholar] [CrossRef] [Green Version]
- Gold, C.; Körber, M.; Lechner, D.; Bengler, K. Taking over Control from Highly Automated Vehicles in Complex Traffic Situations. Hum. Factors 2016, 58, 642–652. [Google Scholar] [CrossRef] [PubMed]
- Clark, H.; Feng, J. Age differences in the takeover of vehicle control and engagement in non-driving-related activities in simulated driving with conditional automation. Accid. Anal. Prev. 2017, 106, 468–479. [Google Scholar] [CrossRef] [PubMed]
- Zhang, B.; de Winter, J.; Varotto, S.; Happee, R.; Martens, M. Determinants of take-over time from automated driving: A meta-analysis of 129 studies. Transp. Res. Part F Traffic Psychol. Behav. 2019, 64, 285–307. [Google Scholar] [CrossRef]
- Merat, N.; Jamson, A.H.; Lai, F.C.H.; Carsten, O. Highly automated driving, secondary task performance, and driver state. Hum. Factors 2012, 54, 762–771. [Google Scholar] [CrossRef] [PubMed]
- Radlmayr, J.; Gold, C.; Lorenz, L.; Farid, M.; Bengler, K. How traffic situations and non-driving related tasks affect the take-over quality in highly automated driving. Proc. Hum. Factors Ergon. Soc. Annu. Meet. 2014, 58, 2063–2067. [Google Scholar] [CrossRef] [Green Version]
- Gold, C.; Berisha, I.; Bengler, K. Utilization of drivetime—Performing non-driving related tasks while driving highly automated. Proc. Hum. Factors Ergon. Soc. Annu. Meet. 2015, 59, 1666–1670. [Google Scholar] [CrossRef]
- Zeeb, K.; Buchner, A.; Schrauf, M. Is take-over time all that matters? the impact of visual-cognitive load on driver take-over quality after conditionally automated driving. Accid. Anal. Prev. 2016, 92, 230–239. [Google Scholar] [CrossRef] [PubMed]
- Körber, M.; Gold, C.; Lechner, D.; Bengler, K. The influence of age on the take-over of vehicle control in highly automated driving. Transp. Res. Part F Traffic Psychol. Behav. 2016, 39, 19–32. [Google Scholar] [CrossRef] [Green Version]
- Petermeijer, S.; Doubek, F.; De Winter, J. Driver response times to auditory, visual, and tactile take-over requests: A simulator study with 101 participants. In Proceedings of the 2017 IEEE International Conference on Systems, Man, and Cybernetics (SMC), Banff, AB, Canada, 5–8 October 2017; pp. 1505–1510. [Google Scholar] [CrossRef] [Green Version]
- Wandtner, B.; Schömig, N.; Schmidt, G. Effects of Non-Driving Related Task Modalities on Takeover Performance in Highly Automated Driving. Hum. Factors 2018, 60, 870–881. [Google Scholar] [CrossRef]
- Li, S.; Blythe, P.; Guo, W.; Namdeo, A.; Edwards, S.; Goodman, P.; Hill, G. Evaluation of the effects of age-friendly human-machine interfaces on the driver’s takeover performance in highly automated vehicles. Transp. Res. Part F Traffic Psychol. Behav. 2019, 67, 78–100. [Google Scholar] [CrossRef]
- Miller, D.; Johns, M.; Ive, H.P.; Gowda, N.; Sirkin, D.; Sibi, S.; Mok, B.; Aich, S.; Ju, W. Exploring Transitional Automation with New and Old Drivers. SAE Tech. Pap. 2016. [Google Scholar] [CrossRef]
- Hergeth, S.; Lorenz, L.; Krems, J.F.; Toenert, L. Effects of Take-Over Requests and Cultural Background on Automation Trust in Highly Automated Driving. In Proceedings of the 8th International Driving Symposium on Human Factors in Driver Assessment, Training, and Vehicle Design, Salt Lake City, UT, USA, 22–25 June 2015; pp. 331–337. [Google Scholar] [CrossRef] [Green Version]
- Wang, W.; Cheng, Q.; Li, C.; André, D.; Jiang, X. A cross-cultural analysis of driving behavior under critical situations: A driving simulator study. Transp. Res. Part F Traffic Psychol. Behav. 2019, 62, 483–493. [Google Scholar] [CrossRef]
- Miller, E.E.; Boyle, L.N.; Hwang, S.; Sodnik, J.; Cegovnik, T. Takeover response: Differences between US and Slovenia. In Proceedings of the Adjunct Proceedings—11th International ACM Conference on Automotive User Interfaces and Interactive Vehicular Applications, Utrecht, The Netherlands, 22–25 September 2019; pp. 227–231. [Google Scholar]
- Hart, S.G.; Staveland, L.E. Development of NASA-TLX (Task Load Index): Results of Empirical and Theoretical Research. Adv. Psychol. 1988, 52, 139–183. [Google Scholar] [CrossRef]
- Seabold, S.; Perktold, J. Statsmodels: Econometric and Statistical Modeling with Python. In Proceedings of the 9th Python in Science Conference, Austin, TX, USA, 28 June–3 July 2010; pp. 92–96. [Google Scholar]
- Jamson, A.H.; Merat, N.; Carsten, O.M.J.; Lai, F.C.H. Behavioural changes in drivers experiencing highly-automated vehicle control in varying traffic conditions. Transp. Res. Part C Emerg. Technol. 2013, 30, 116–125. [Google Scholar] [CrossRef] [Green Version]
- Naujoks, F.; Purucker, C.; Neukum, A. Secondary task engagement and vehicle automation- Comparing the effects of different automation levels in an on-road experiment. Transp. Res. Part F Traffic Psychol. Behav. 2016, 38, 67–82. [Google Scholar] [CrossRef]
Figure 1.
Take-over time per location and being distracted at TOR (with marked quartiles of the distributions).
Figure 1.
Take-over time per location and being distracted at TOR (with marked quartiles of the distributions).

Figure 2.
The global NASA TLX workload scores for the IVIS tasks type (left) and the multiple comparisons plot of the completion rate per IVIS task type (right). The multiple comparisons plot shows the mean and the 95% confidence interval for each IVIS type. The significant difference from the reference group (in blue) is marked in red, whereas non-significant difference is marked in gray.


Table 1.
Participant demographics for Slovenia (SI) and USA (US).
| Total | Younger | Older | |||
|---|---|---|---|---|---|
| SI | US | SI | US | US | |
| n | 18 | 20 | 18 | 10 | 10 |
| Male | 13 | 11 | 13 | 3 | 8 |
| Ages | 19–39 | 19–57 | 19–39 | 46–57 | |
| Mean age | 26 | 41 | 26 | 32 | 51 |
| SD age | 5 | 11 | 5 | 7.8 | 4.6 |
Table 2.
Response type and secondary task engagement (IVIS) at TOR, for Slovenia (SI) and USA (US), values = n.
Table 2.
Response type and secondary task engagement (IVIS) at TOR, for Slovenia (SI) and USA (US), values = n.
| Total | Crashed | Distracted at TOR | ||||
|---|---|---|---|---|---|---|
| Response | SI | US | SI | US | SI | US |
| None | – | 6 | 6 | – | 5 | |
| Brake | 11 | 14 | 7 | 6 | 6 | 8 |
| Steer | 7 | – | 4 | – | 5 | – |
Table 3.
Estimated coefficients for task completion (objective workload measure) 1.
| Independent Variables | Task Completion | ||||
|---|---|---|---|---|---|
| Est. | SE | z Value | p Value | 95% CI | |
| (Intercept) | 0.573 | 0.047 | 12.170 | 0.000 | [0.481, 0.666] |
| Location (US) | 0.099 | 0.053 | 1.880 | 0.060 | [−0.004, 0.203] |
| Task (base: A/C) | |||||
| contact | 0.403 | 0.057 | 7.126 | 0.000 | [0.292, 0.514] |
| dial | 0.169 | 0.057 | 2.979 | 0.003 | [0.058, 0.280] |
| playlist | 0.391 | 0.057 | 6.897 | 0.000 | [0.280, 0.502] |
| radio | −0.077 | 0.057 | −1.345 | 0.179 | [−0.189, 0.035] |
| Age (older: 46–57) | −0.117 | 0.058 | −2.018 | 0.044 | [−0.231, −0.003] |
| Gender (female) | −0.020 | 0.045 | −0.459 | 0.647 | [−0.108, 0.067] |
1 Significant estimates are in bold.
Table 4.
Comparison of the mean workload scores for IVIS tasks (Tukey’s HSD) 2. Left: objective workload measured by the task completion rate. Right: subjective workload measured by NASA TLX.
Table 4.
Comparison of the mean workload scores for IVIS tasks (Tukey’s HSD) 2. Left: objective workload measured by the task completion rate. Right: subjective workload measured by NASA TLX.
| Task Completion Rate | NASA TLX Index | ||||||
|---|---|---|---|---|---|---|---|
| Group 1 | Group 2 | Mean Diff | pcorr | 95% CI | Mean Diff | pcorr | 95% CI |
| A/C | contact | 0.40 | 0.001 | [0.2436, 0.5621] | −0.25 | 0.001 | [−0.3876, −0.111] |
| A/C | dial | 0.17 | 0.030 | [0.0103, 0.3288] | −0.12 | 0.114 | [−0.2598, 0.0168] |
| A/C | playlist | 0.39 | 0.001 | [0.2317, 0.5502] | −0.27 | 0.001 | [−0.4025, −0.1279] |
| A/C | radio | −0.08 | 0.67 | [−0.2377, 0.0847] | −0.08 | 0.546 | [−0.2113, 0.0615] |
| contact | dial | −0.23 | 0.001 | [−0.3916, −0.075] | 0.13 | 0.073 | [−0.0071, 0.2626] |
| contact | playlist | −0.01 | 0.9 | [−0.1702, 0.1464] | −0.02 | 0.9 | [−0.1497, 0.1179] |
| contact | radio | −0.48 | 0.001 | [−0.6396, −0.3191] | 0.17 | 0.004 | [0.0415, 0.3072] |
| dial | playlist | 0.22 | 0.002 | [0.0631, 0.3797] | −0.14 | 0.029 | [−0.2775, −0.0098] |
| dial | radio | −0.25 | 0.001 | [−0.4063, −0.0858] | 0.05 | 0.855 | [−0.0863, 0.1795] |
| playlist | radio | −0.47 | 0.001 | [−0.6277, −0.3072] | 0.19 | 0.001 | [0.0584, 0.3221] |
2 Significant estimates are in bold.
Publisher’s Note: MDPI stays neutral with regard to jurisdictional claims in published maps and institutional affiliations. |
© 2021 by the authors. Licensee MDPI, Basel, Switzerland. This article is an open access article distributed under the terms and conditions of the Creative Commons Attribution (CC BY) license (https://creativecommons.org/licenses/by/4.0/).
Share and Cite
MDPI and ACS Style
Strle, G.; Xing, Y.; Miller, E.E.; Boyle, L.N.; Sodnik, J. Take-Over Time: A Cross-Cultural Study of Take-Over Responses in Highly Automated Driving. Appl. Sci. 2021, 11, 7959. https://doi.org/10.3390/app11177959
AMA Style
Strle G, Xing Y, Miller EE, Boyle LN, Sodnik J. Take-Over Time: A Cross-Cultural Study of Take-Over Responses in Highly Automated Driving. Applied Sciences. 2021; 11(17):7959. https://doi.org/10.3390/app11177959
Chicago/Turabian StyleStrle, Gregor, Yilun Xing, Erika E. Miller, Linda Ng Boyle, and Jaka Sodnik. 2021. "Take-Over Time: A Cross-Cultural Study of Take-Over Responses in Highly Automated Driving" Applied Sciences 11, no. 17: 7959. https://doi.org/10.3390/app11177959
Note that from the first issue of 2016, this journal uses article numbers instead of page numbers. See further details here.