Article

Development and Validation of Retention Models in Supercritical Fluid Chromatography for Impregnation Process Design

1
Institute of Thermal Separation Processes, Hamburg University of Technology, Eißendorfer Straße 38, 21073 Hamburg, Germany
2
Department of Pharmaceutical Biotechnology, School of Pharmacy, Altinbas University, Istanbul 34144, Turkey
3
Empa-Swiss Federal Laboratories for Materials Science and Technology, Building Energy Materials and Components, Überlandstrasse 129, 8600 Dübendorf, Switzerland
4
Institute of Multiphase Flows, Hamburg University of Technology, Eißendorfer Straße 38, 21073 Hamburg, Germany
5
Department of Chemical and Biological Engineering, Koc University, Sarıyer, Istanbul 34450, Turkey
6
Koç University Tüpraş Energy Center (KUTEM), Koc University, Sarıyer, Istanbul 34450, Turkey
7
Laboratory for Development and Modelling of Novel Nanoporous Materials, Hamburg University of Technology, Eißendorfer Straße 38, 21073 Hamburg, Germany
*
Authors to whom correspondence should be addressed.
Appl. Sci. 2021, 11(15), 7106; https://doi.org/10.3390/app11157106
Submission received: 8 June 2021 / Revised: 24 July 2021 / Accepted: 27 July 2021 / Published: 31 July 2021

Abstract

:
The retention factor is the key quantity for the thermodynamic analysis of the retention mechanism in chromatographic experiments. In this work, we measure retention factors for moderately polar solutes on four silica-based porous matrices as stationary phases by supercritical fluid chromatography. Elution of the solutes is only possible with binary mixtures of supercritical carbon dioxide (sc-CO2) and modifier (methanol) due to the low polarity of pure sc-CO2. The addition of modifiers makes the retention mechanism more complex and masks interactions between solute and stationary phase. In this work, we develop and validate several retention models that allow the obtaining of retention factors in modifier-free sc-CO2. Such models pave the way for quantifying adsorption interactions between polar solutes and non-swellable porous matrices in pure sc-CO2 based on retention data obtained in sc-CO2/modifier mixtures. The obtained information will thereby facilitate the understanding and design of impregnation processes, which are often performed in modifier-free conditions.

1. Introduction

Supercritical solvents and, in particular, supercritical carbon dioxide (sc-CO2) has gained world-wide attention in recent decades as a green processing media for the impregnation of porous matrices like wood, textile, monolithic and porous polymers with various solutes such as pharmaceutically active compounds, pesticides, or organometallic compounds, among others [1,2,3]. Sc-CO2 is an environmentally friendly alternative to conventional organic solvents. The reasons for which sc-CO2 has attracted attention are as follows: (1) its high diffusivity and low viscosity diminish mass transfer limitations; (2) mild conditions (above 31 °C, 73 bar), that are easily achievable with standard lab and industrial compressors and fittings, allow the processing of sensitive and thermolabile materials; (3) non-flammability, low price, and GRAS status (generally recognized as safe) by the European Food Safety Authority and Food and Drug Administration (USA). Furthermore, impregnated materials can be recovered free of solvent residues by simple depressurization. As a result of all these advantages, sc-CO2-based processes have a great potential, particularly, for impregnation in the biomedical field [4,5,6,7,8]. Two mechanisms play the major roles in the impregnation processes: adsorption of the solutes on the matrix surface and precipitation upon solvent evaporation [1]. In this work, we mainly focus on the first mechanism and aim to quantify adsorption interactions between a given solute on a given matrix, which contributes to the rational development of such impregnation processes.
Broadly, methods for studying adsorption equilibria in supercritical solvents can be classified into static and dynamic ones [9]. Although static methods offer superior precision, they are often too time consuming for screening of the affinity of numerous solutes towards a selected matrix. To ensure a high throughput, dynamic methods are employed instead [10,11,12,13].
Dynamic methods rely on the fundamental link between thermodynamic and kinetic properties. One common example is the partitioning of the solute between an adsorbent and flowing fluid in chromatographic experiments, where retention factor k 0 can be used to obtain distribution coefficients and adsorption isotherms [14].
Thus, supercritical fluid chromatography (SFC) using a porous matrix of interest as stationary phase and solutes injected into pure sc-CO2 (mobile phase) can provide direct access to adsorption equilibria. Such an implementation of SFC is referred to as inverse SFC (iSFC), stressing the fact that retention characteristics of a single solute are studied. Using fundamental thermodynamic relations for the retention factor k 0 (Subscript “0” refers to the condition of using pure sc-CO2 as mobile phase) [14,15], iSFC with pure sc-CO2 as a mobile phase has been used to determine distribution coefficients, adsorption enthalpies, and partial molar volumes at infinite dilution on activated carbons, resins, and plain and modified silicas (see [14]).
Typically, even moderately polar solutes demonstrate a high affinity to porous matrices [10], so their retention time is extremely large and the peak broadening is severe with pure sc-CO2, given its comparably low solvation power. Thus, it is not possible to determine the precise retention factor. Addition of a few percent of organic solvents, so-called modifiers, are commonly employed to remedy this issue. This—at first sight, just a practical difficulty—has serious negative consequences for the interpretation of the retention factor in terms of thermodynamic quantities: the retention factor   k measured in systems with modifier cannot be directly related to the retention factor k 0 in modifier-free conditions.
Our aim is to develop models for the estimation of retention factors for polar solutes in pure sc-CO2 using retention data obtained in sc-CO2/modifier mixtures, that is, to deduce k 0 values from experimentally measurable retention factors, k . The developed models were validated against experimental data.

2. Materials and Methods

2.1. Stationary Phase, Mobile Phase, and Solutes

Four silica-based porous materials were employed as stationary phases in this work (Table 1). Three commercial silica gels, Kromasil® 60-5-SIL, 100-5-SIL, and 300-5-SIL, were supplied by AkzoNobel (Bohus, Sweden). They are referred to as “SIL-60”, “SIL-100”, and “SIL-300”, respectively, in the following. The fourth material is a silica aerogel produced in our laboratory, referred to as “SIL-Aerogel”. The porous materials were packed in commercial HPLC columns as reported in our previous work [10]. A mixture of supercritical CO2 (Westfalen AG, Münster, Germany) and methanol (Roth, Karlsruhe, Germany) was employed as mobile phase. Phenol (Fluka, Taufkirchen, Germany), toluene (Carl Roth, Karlsruhe, Germany), naproxen, nicotinamide, ketoprofen (Merck, Kenilworth, NJ, USA), and rosmarinic acid (Sigma-Aldric, Steinheim, Germany) were employed as solutes. All solutes were dissolved in methanol to a concentration of 0.1 g L−1. The hold-up time t M was measured with a solution of nitrous oxide (N2O) (Westfalen AG, Münster, Germany) in methanol. The solution was prepared by bubbling N2O through a metal solvent filter in methanol for at least five minutes.

2.2. Chromatographic System and Measurements

SFC system: both retention and adsorption isotherm measurements were carried out with Waters Acquity UPC2 supercritical fluid chromatography system equipped with a photodiode array (PDA) detector (Waters Corporation, Milford, CT, USA).
Hold-up time and retention data: Mobile phase was pumped at a flow rate of 2 mL min−1 with 0 to 30 vol.% methanol. Columns packed with porous materials were fixed in an insulated container equipped with a preheater enabling temperature control in increments of 0.1 ° C. The pressure was controlled by back pressure regulators with an accuracy of 0.5 bar. The samples were injected into the SFC system and had volumes of 2 µL. The PDA detector signal was recorded for each compound at its specific working wavelength: phenol at 210 nm, toluene 240 nm, naproxen at 220 nm, nicotinamide at 210 nm, ketoprofen at 254 nm, rosmarinic acid at 330 nm, and nitrous oxide at 195 nm [16]. Empower® 3 software [17] was used to operate the SFC system.
The time at which the maximum signal appears was taken as the retention time, t R . The retention time of nitrous oxide was employed as the hold-up time, t M . Retention and hold-up times of all solutes were measured at least in triplicate and averaged. The averaged values were used to calculate the retention factor, as in Equation (1):
k = t R t M t M
The methanol concentration was varied from 0 to 30 vol.%. Retention factors were plotted against methanol concentration to generate a retention profile.
Determination of methanol adsorption isotherms: Adsorption isotherms of methanol on all porous matrices in sc-CO2 were measured by frontal analysis chromatography with the staircase method. This method was used in several previous studies [11,18].
Breakthrough curves were measured in the SFC systems for a series of methanol concentrations for each silica material. By integrating the area above the breakthrough curves, the maximum loadings at specific methanol concentrations were determined. Obtained loadings were fitted to the Langmuir equation to estimate the equilibrium constant K e q . The complete experimental procedure and integration method are detailed in Supplementary Materials (Section S1, Figure S1, Table S1).

3. Retention Modeling

3.1. Model Development

For a retention model to be useful, it should relate the retention factor k to operating conditions such as pressure, temperature, and composition of the mobile phase. Once such a model is obtained, the retention factor can then be related to the distribution constant of a solute between mobile phase and stationary phases (Equation (2)) and other thermodynamic quantities [14].
k = D β = c s c m β
Here, D is the distribution coefficient, c s and c m are the concentrations of a solute (mg mL−1) in the stationary and mobile phases, and β is the ratio of stationary to mobile phase volumes [19].
With a retention model in hand which is valid at zero modifier concentration, the retention factor k 0 can be then extracted from experimental retention data. In this work, two classes of retention models were developed based on different assumptions.

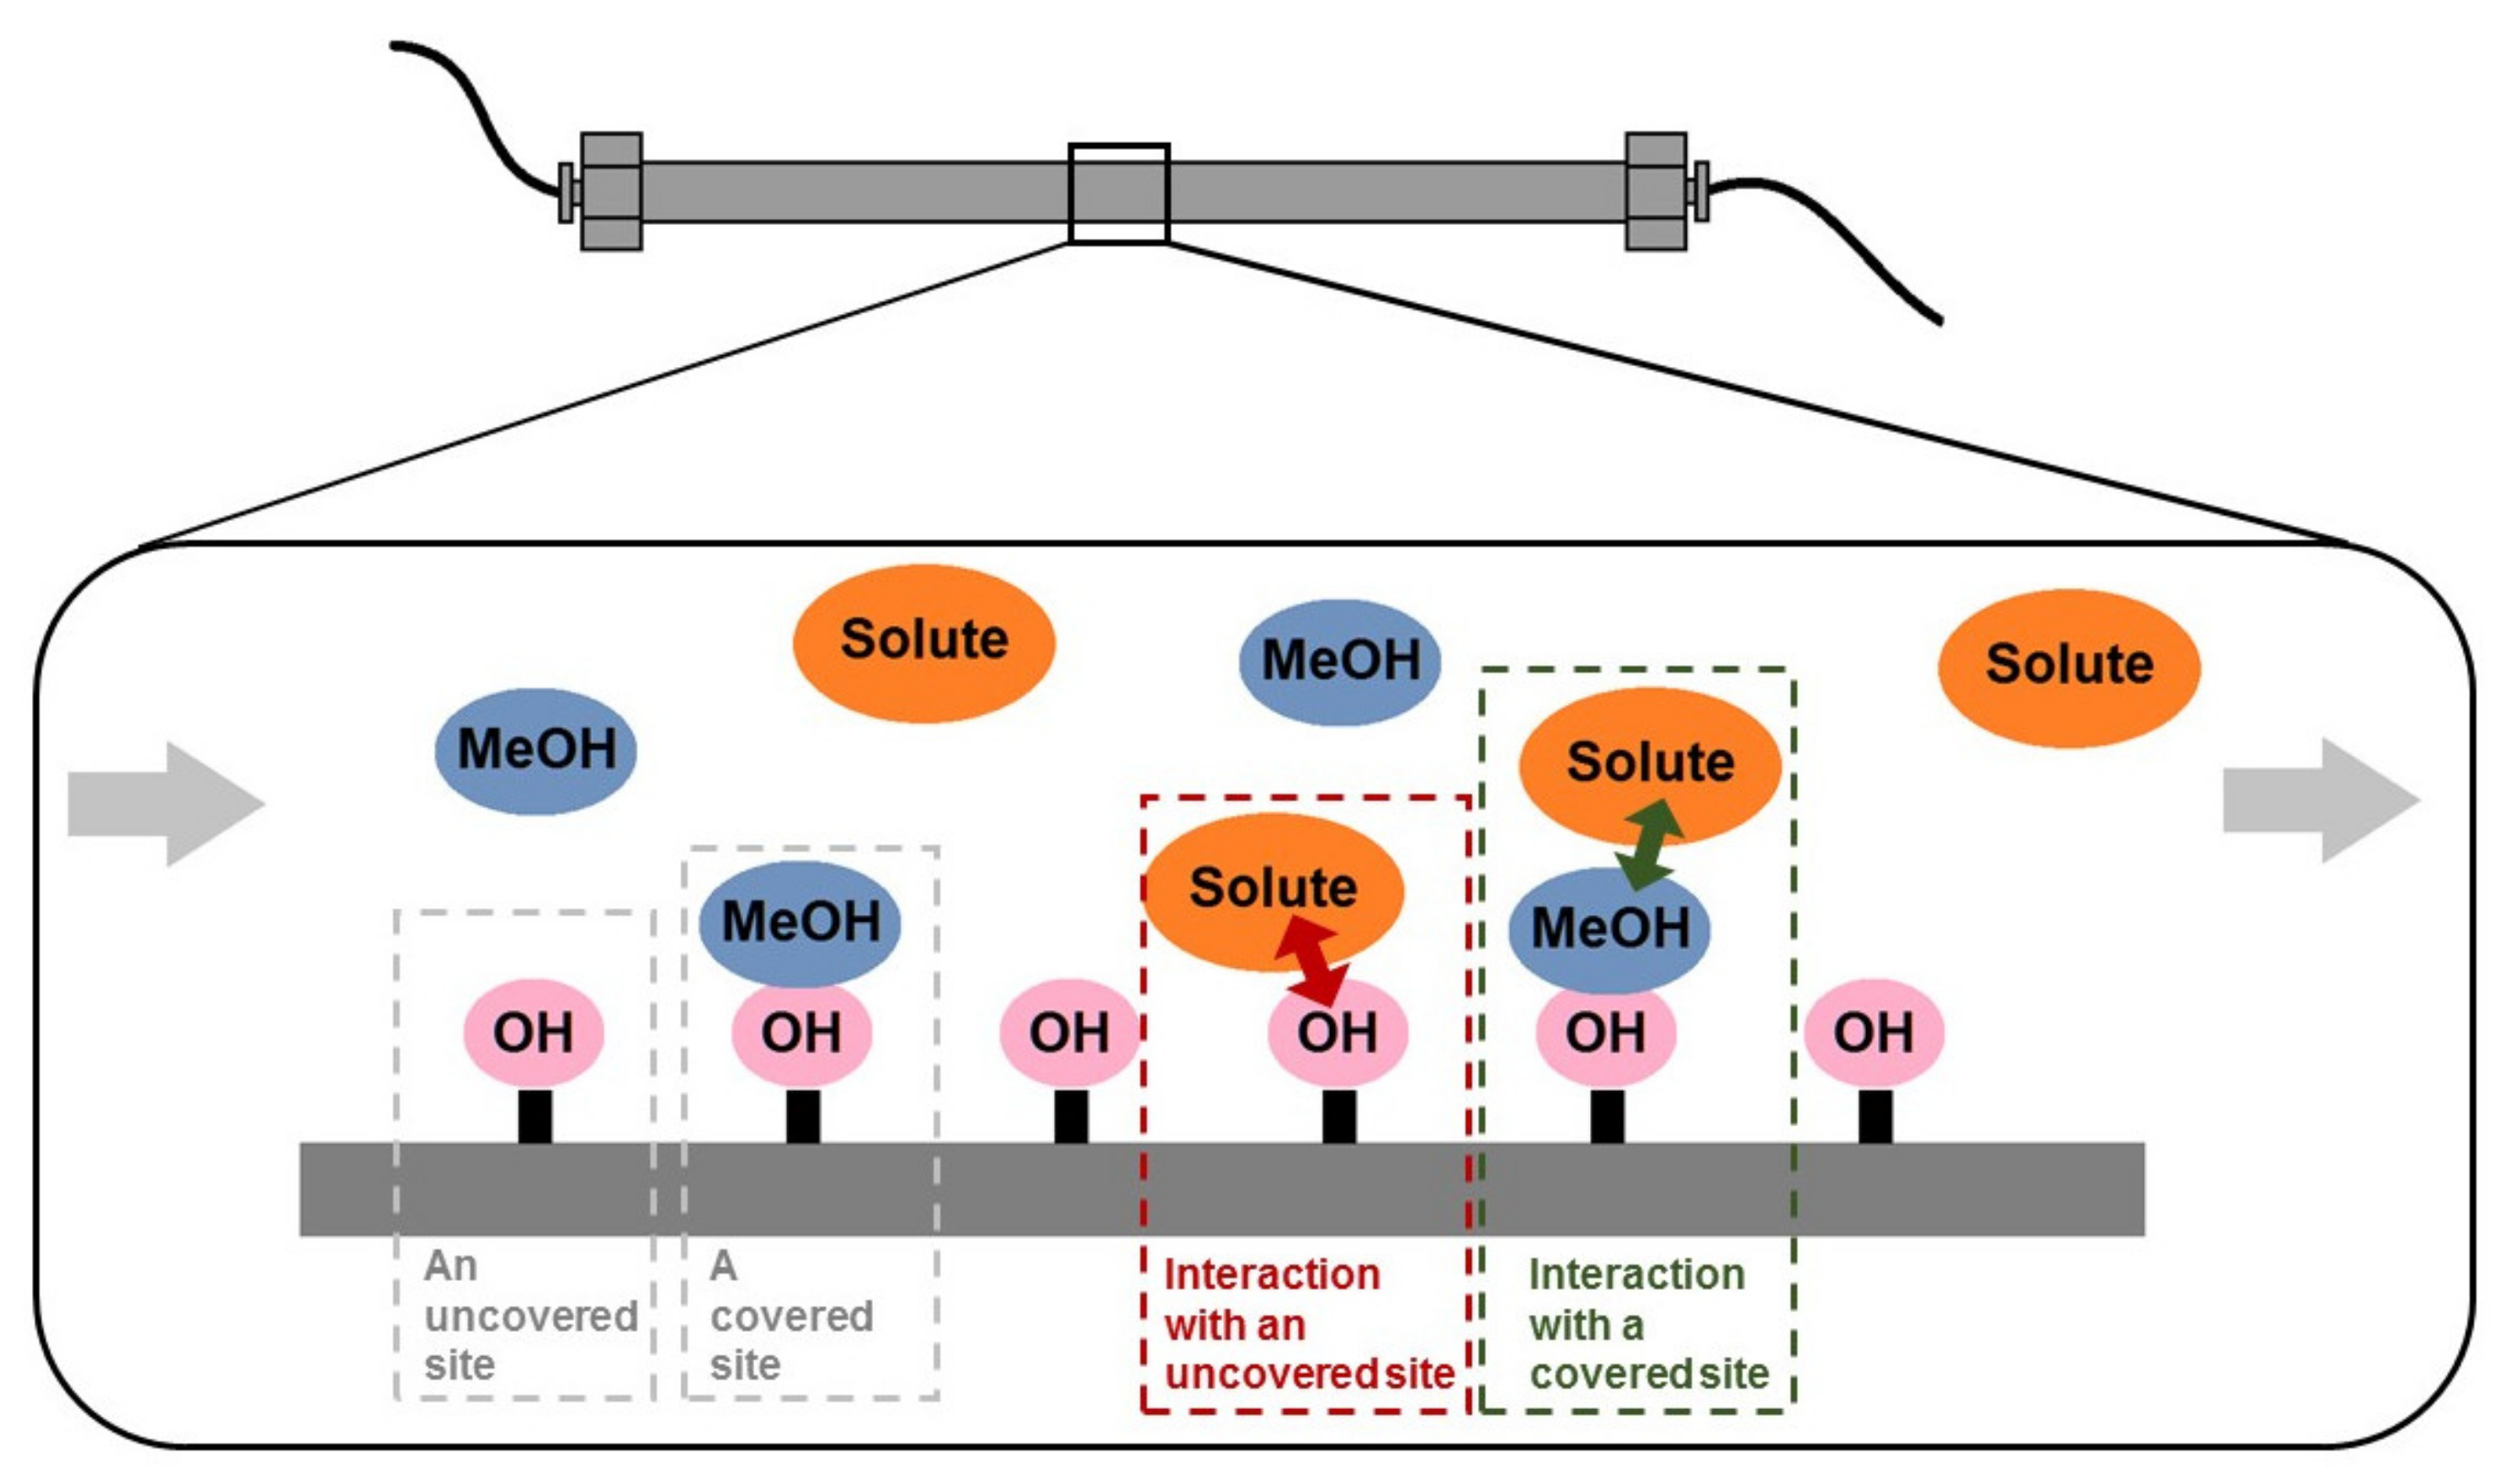
3.1.1. Dual Influential Model

The first category of models is based on the idea that modifier influences the solute retention both in the mobile and stationary phases. We assume that the ratio of the solute concentration in the mobile phase with modifier c m over the corresponding concentration without modifier is proportional to the modifier concentration c m o d (Equation (3)). Likewise, the solute concentration in the stationary phase is increased proportional to the modifier loading in the stationary phase (Equation (4)). The loading is assumed to be independent of the presence of the solute and is a function of the pressure and temperature of the mobile phase. This class of models is referred to as dual influential models (DIM). Equations (3) and (4) are suggested in the spirit of the Setschenow equation for the salting out effect and the log-linear model for solubility in mixed solvents [20]:
lg c m c m , 0 = a c m o d
lg c s c s , 0 = b q m o d
where c m , 0 and c s , 0 are the concentrations of a solute in mobile and stationary phases at zero modifier concentration, c m o d is the modifier concentrations (mg mL−1) in mobile phase, q m o d is the loading (mg mL−1) of modifier on stationary phase by adsorption, and both a and b are empirical parameters (mL g−1) that can be regarded as a strength of the modifier effect on the mobile and stationary phases, respectively. When the absolute values of a and b are large, the solute concentrations are more sensitive to small changes of modifier concentration. The values of a and b depend on the nature of the solute, the mobile and stationary phase, and the operational conditions (temperature, pressure).
If we now assume the simplest case, namely a linear isotherm for the modifier adsorption equilibrium, we get Equation (5), as follows:
q m o d = K e q ,   l i n c m o d
where K e q ,   l i n is the equilibrium constant. Equations (2)–(5) can be rearranged into the following expression for the retention factors k at the modifier concentration c m o d and k 0 is the retention factor at c m o d = 0 :
lg k = lg k 0 A c m o d
where A = a b K e q , l i n . The constant A is the overall strength of the modifier effect, which accounts for the change in the retention factor from its value k 0 under modifier-free conditions.
Another natural extension is to plug a non-linear adsorption isotherm into the retention model. Several previous works have demonstrated that the adsorption of individual organic solvents in supercritical CO2 follows Langmuir-type isotherm models [13,21,22,23,24].
In this study, we also demonstrate that Langmuir isotherm, Equation (7), provides an acceptable fit to the experimental data for methanol on silica-based materials (see Section S1 in Supplementary Materials).
q m o d = q m a x K e q , L c m o d 1 + K e q , L c m o d
The fractional surface coverage θ of the stationary phase by modifier molecules is given as follows:
θ = q m o d q m a x = K e q , L c m o d 1 + K e q , L c m o d
Here, K e q , L is the Langmuir equilibrium constant (mg mL−1) and q m a x is the maximum modifier loading (mg mL−1) at monolayer coverage. Several K e q , L values were measured as a part of our preliminary work (see Section S1 in Supplementary Materials).
Equation (8) together with Equations (2)–(4) results in the retention model given by Equation (9).
lg k = lg k 0 + B θ a c m o d
lg k = lg k 0 + B K e q ,     L c m o d 1 + K e q ,     L c m o d a c m o d
where B = b q m a x . Equation (10) gives a concentration-explicit form of Equation (9) and will be tested for the ability to estimate k 0 values along with linear-DIM model, Equation (6).

3.1.2. Mixed-Retention Model

Next, we develop and study another category of retention models which are based on the following assumption: the solute retention is due to independent adsorption on two types of active sites of the stationary phase, free adsorption sites as well as the active sites covered by adsorbed modifier (Figure 1). We call such models mixed retention models (MRM). Experimentally observed retention is a joint effect of the retentions due to both sites.
For plain silica, the adsorption sites are silanol groups and methanol molecules adsorbed on the silanols. Since the fraction of the methanol-covered sites is identical to the modifier surface coverage, θ , the retention factor can be expressed by a weighted sum of the retention factor at zero modifier concentration, k 0 , and the retention factor for completely covered surface, k c (subscript c stands for covered):
k = k 0 1 θ + k c θ
If we rearrange Equation (11), a linear relation between k and θ is seen:
k = k c k 0 θ + k 0
However, according to the collected experimental data of k and θ in this work, the linear relationship does not hold for the whole range of modifier concentrations. Details will be given later in Section 4.2. Testing various modifications of Equation (12) that better fit the experimental data, we introduced an empirical parameter M to outweigh the influence of covered active sites; by introducing the term M c m o d to the denominator, the influence of modifier on retention factor reduces at higher modifier concentration. The extended MRM is given by the following:
k = k 0 1 θ + k c 1 + M θ 1 + M c m o d
The terms 1 + M in the numerator and M in the denominator are introduced to make the original model by Equation (11) a special case of the extended model if M = 0 .
The MRM given by Equation (13) can also be written in a concentration-explicit form by substitution of a certain adsorption isotherm θ = f c m o d . For example, for the Langmuir isotherm, we obtain:
k = k 0 + K e q , L k c 1 + M c m o d 1 + K e q , L c m o d 1 + M c m o d

3.2. Evaluation of the Models

As explained above, we have discussed two categories of retention models, DIMs and MRMs. Each category contains several models, derived with different isotherm types or extended versions. Furthermore, even with the same model, fits can be performed using different input data arrangements and lead to significantly different results. To keep the text clearer, we introduce the following notation. The name of each method contains three parts: (1) either a DIM or MRM, (2) either linear (Lin) or Langmuir isotherm (Lan), and (3) the symbols of input data. Taken together, all these elements form what we call a method. Table 2 gives an overview of the employed methods. All regressions (linear and nonlinear) were performed in Origin 8.5.1 [25], through chi-square minimization with a tolerance of 10−9, and a statistical weighting method was applied. A summary of fitting parameters applied for each method and the ranges of R2 values of regressions are given in Table 3.

4. Results and Discussion

4.1. Applying Dual Influential Models

In this section, the DIMs based on linear and Langmuir isotherms were compared by analyzing the results of the fittings to experimental data. The appropriate method to proceed with the regression analysis according to different situations will be suggested after the comparison and discussion.

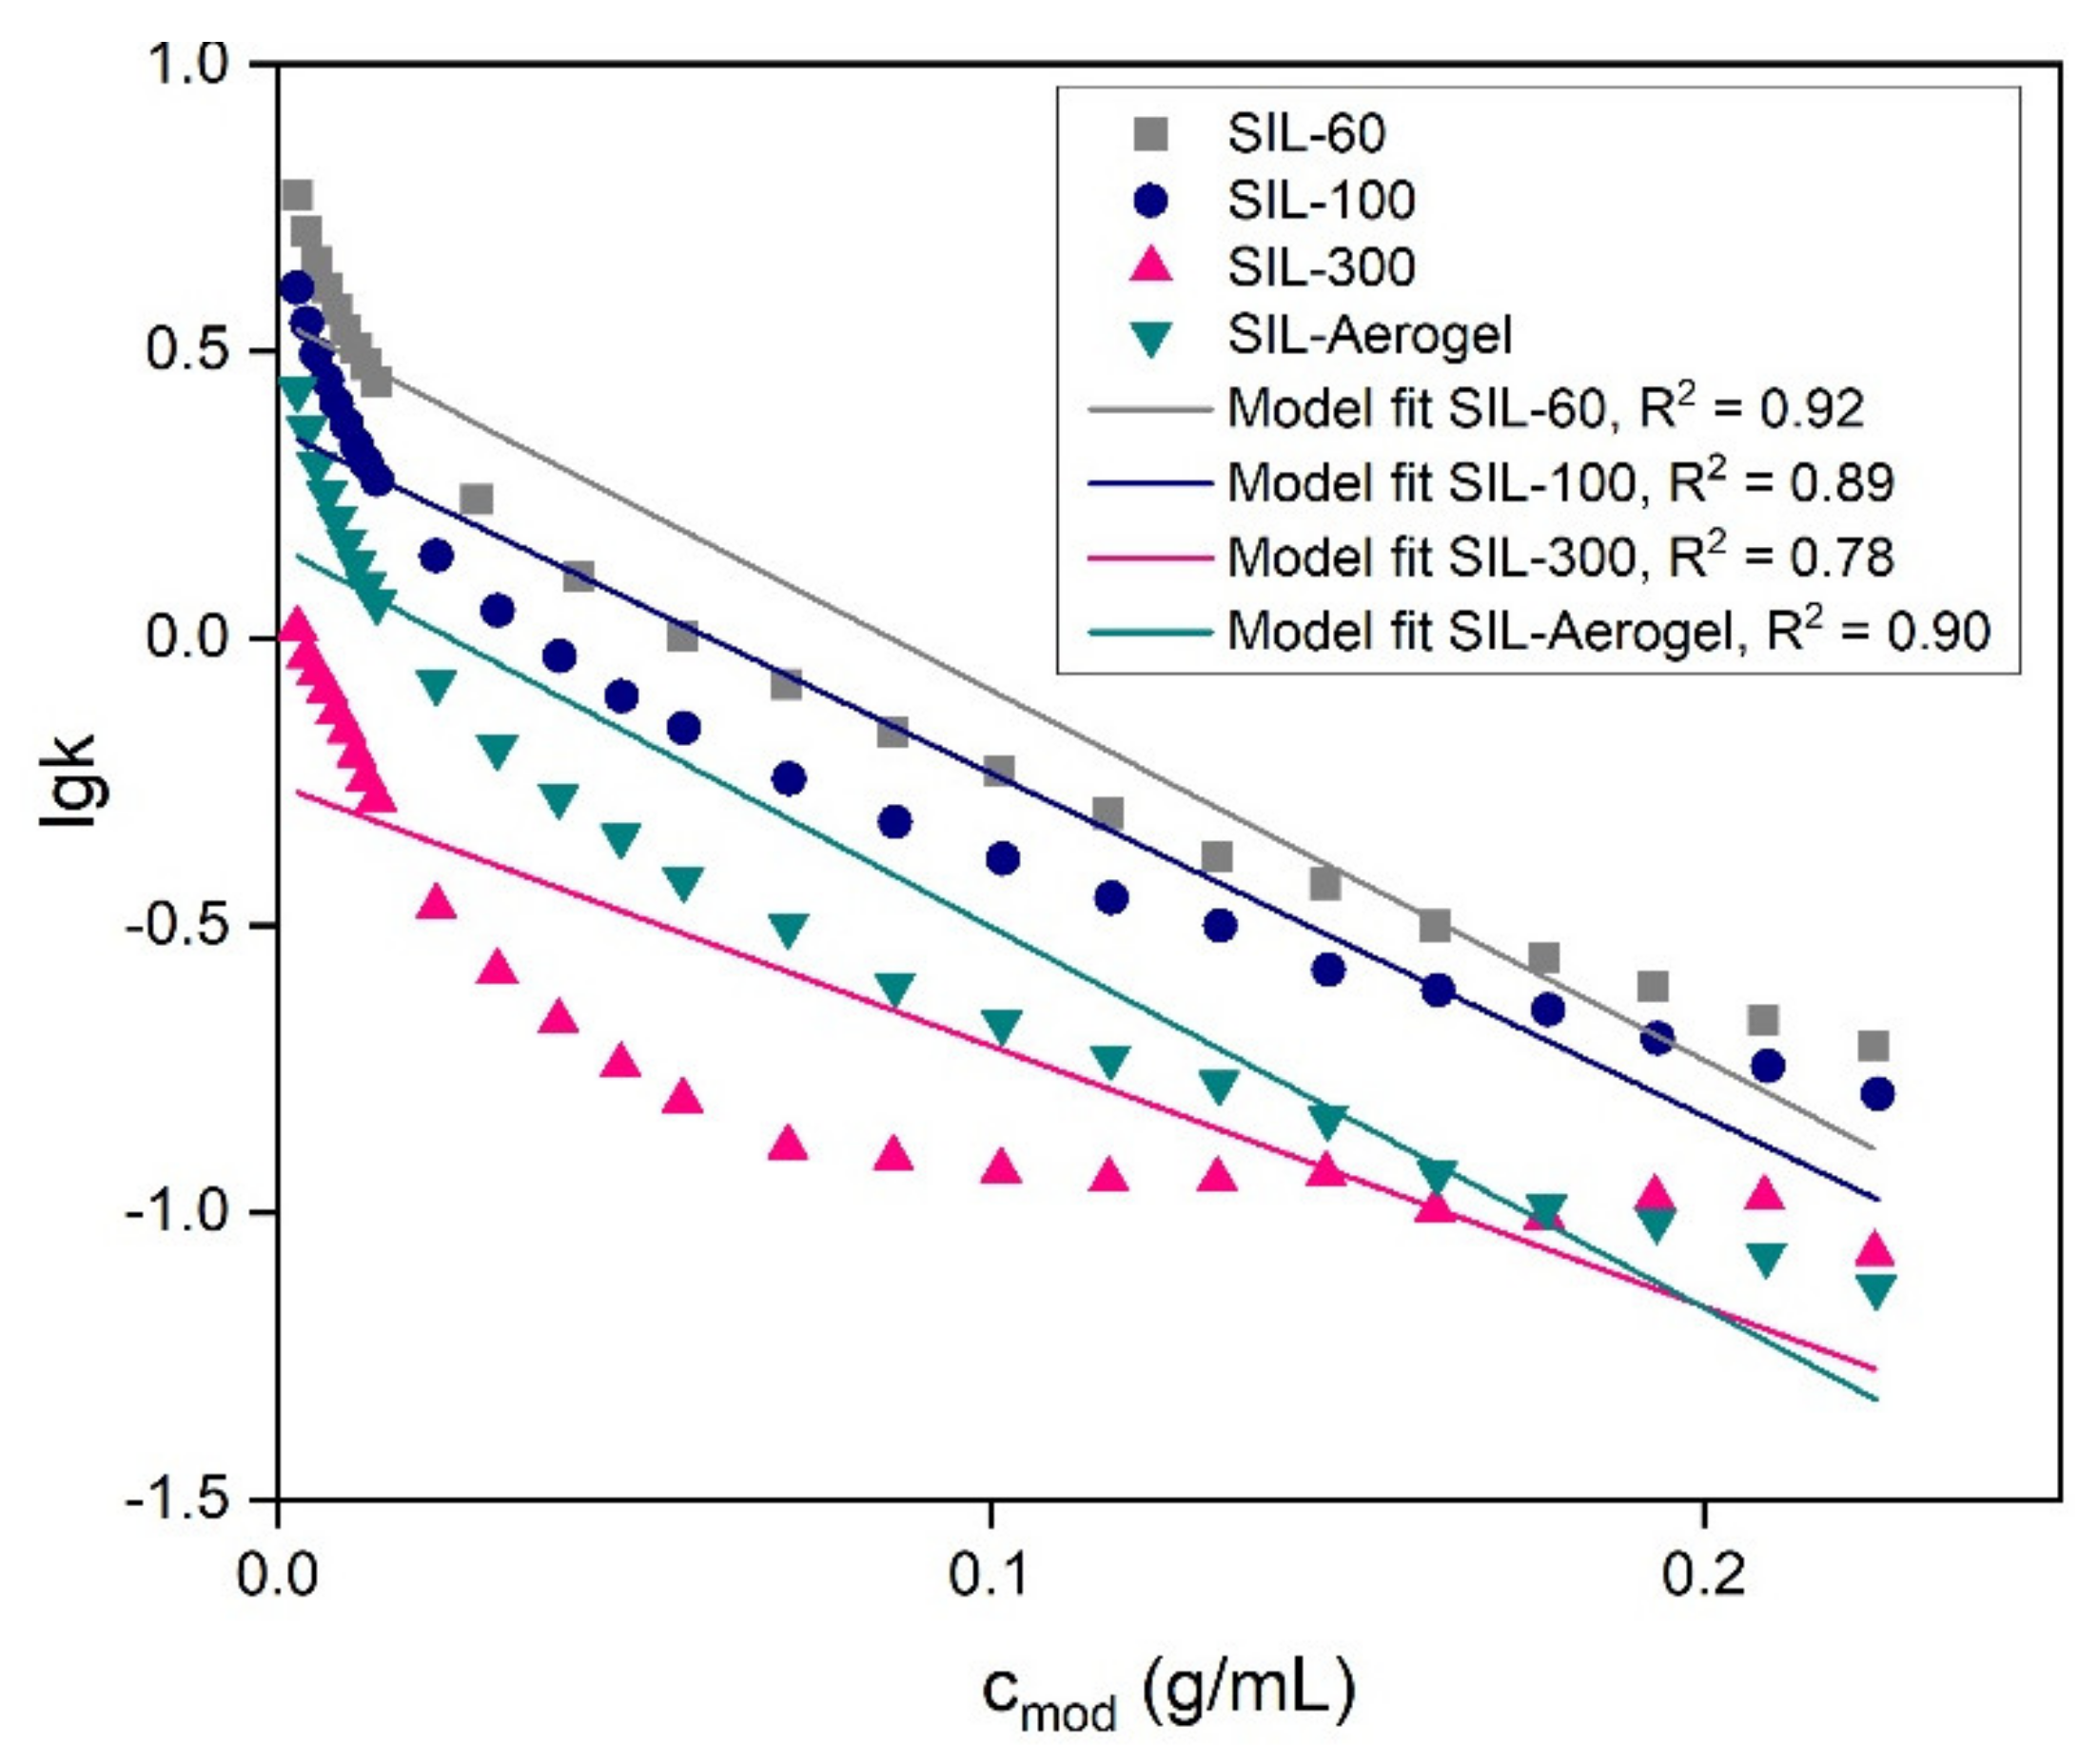
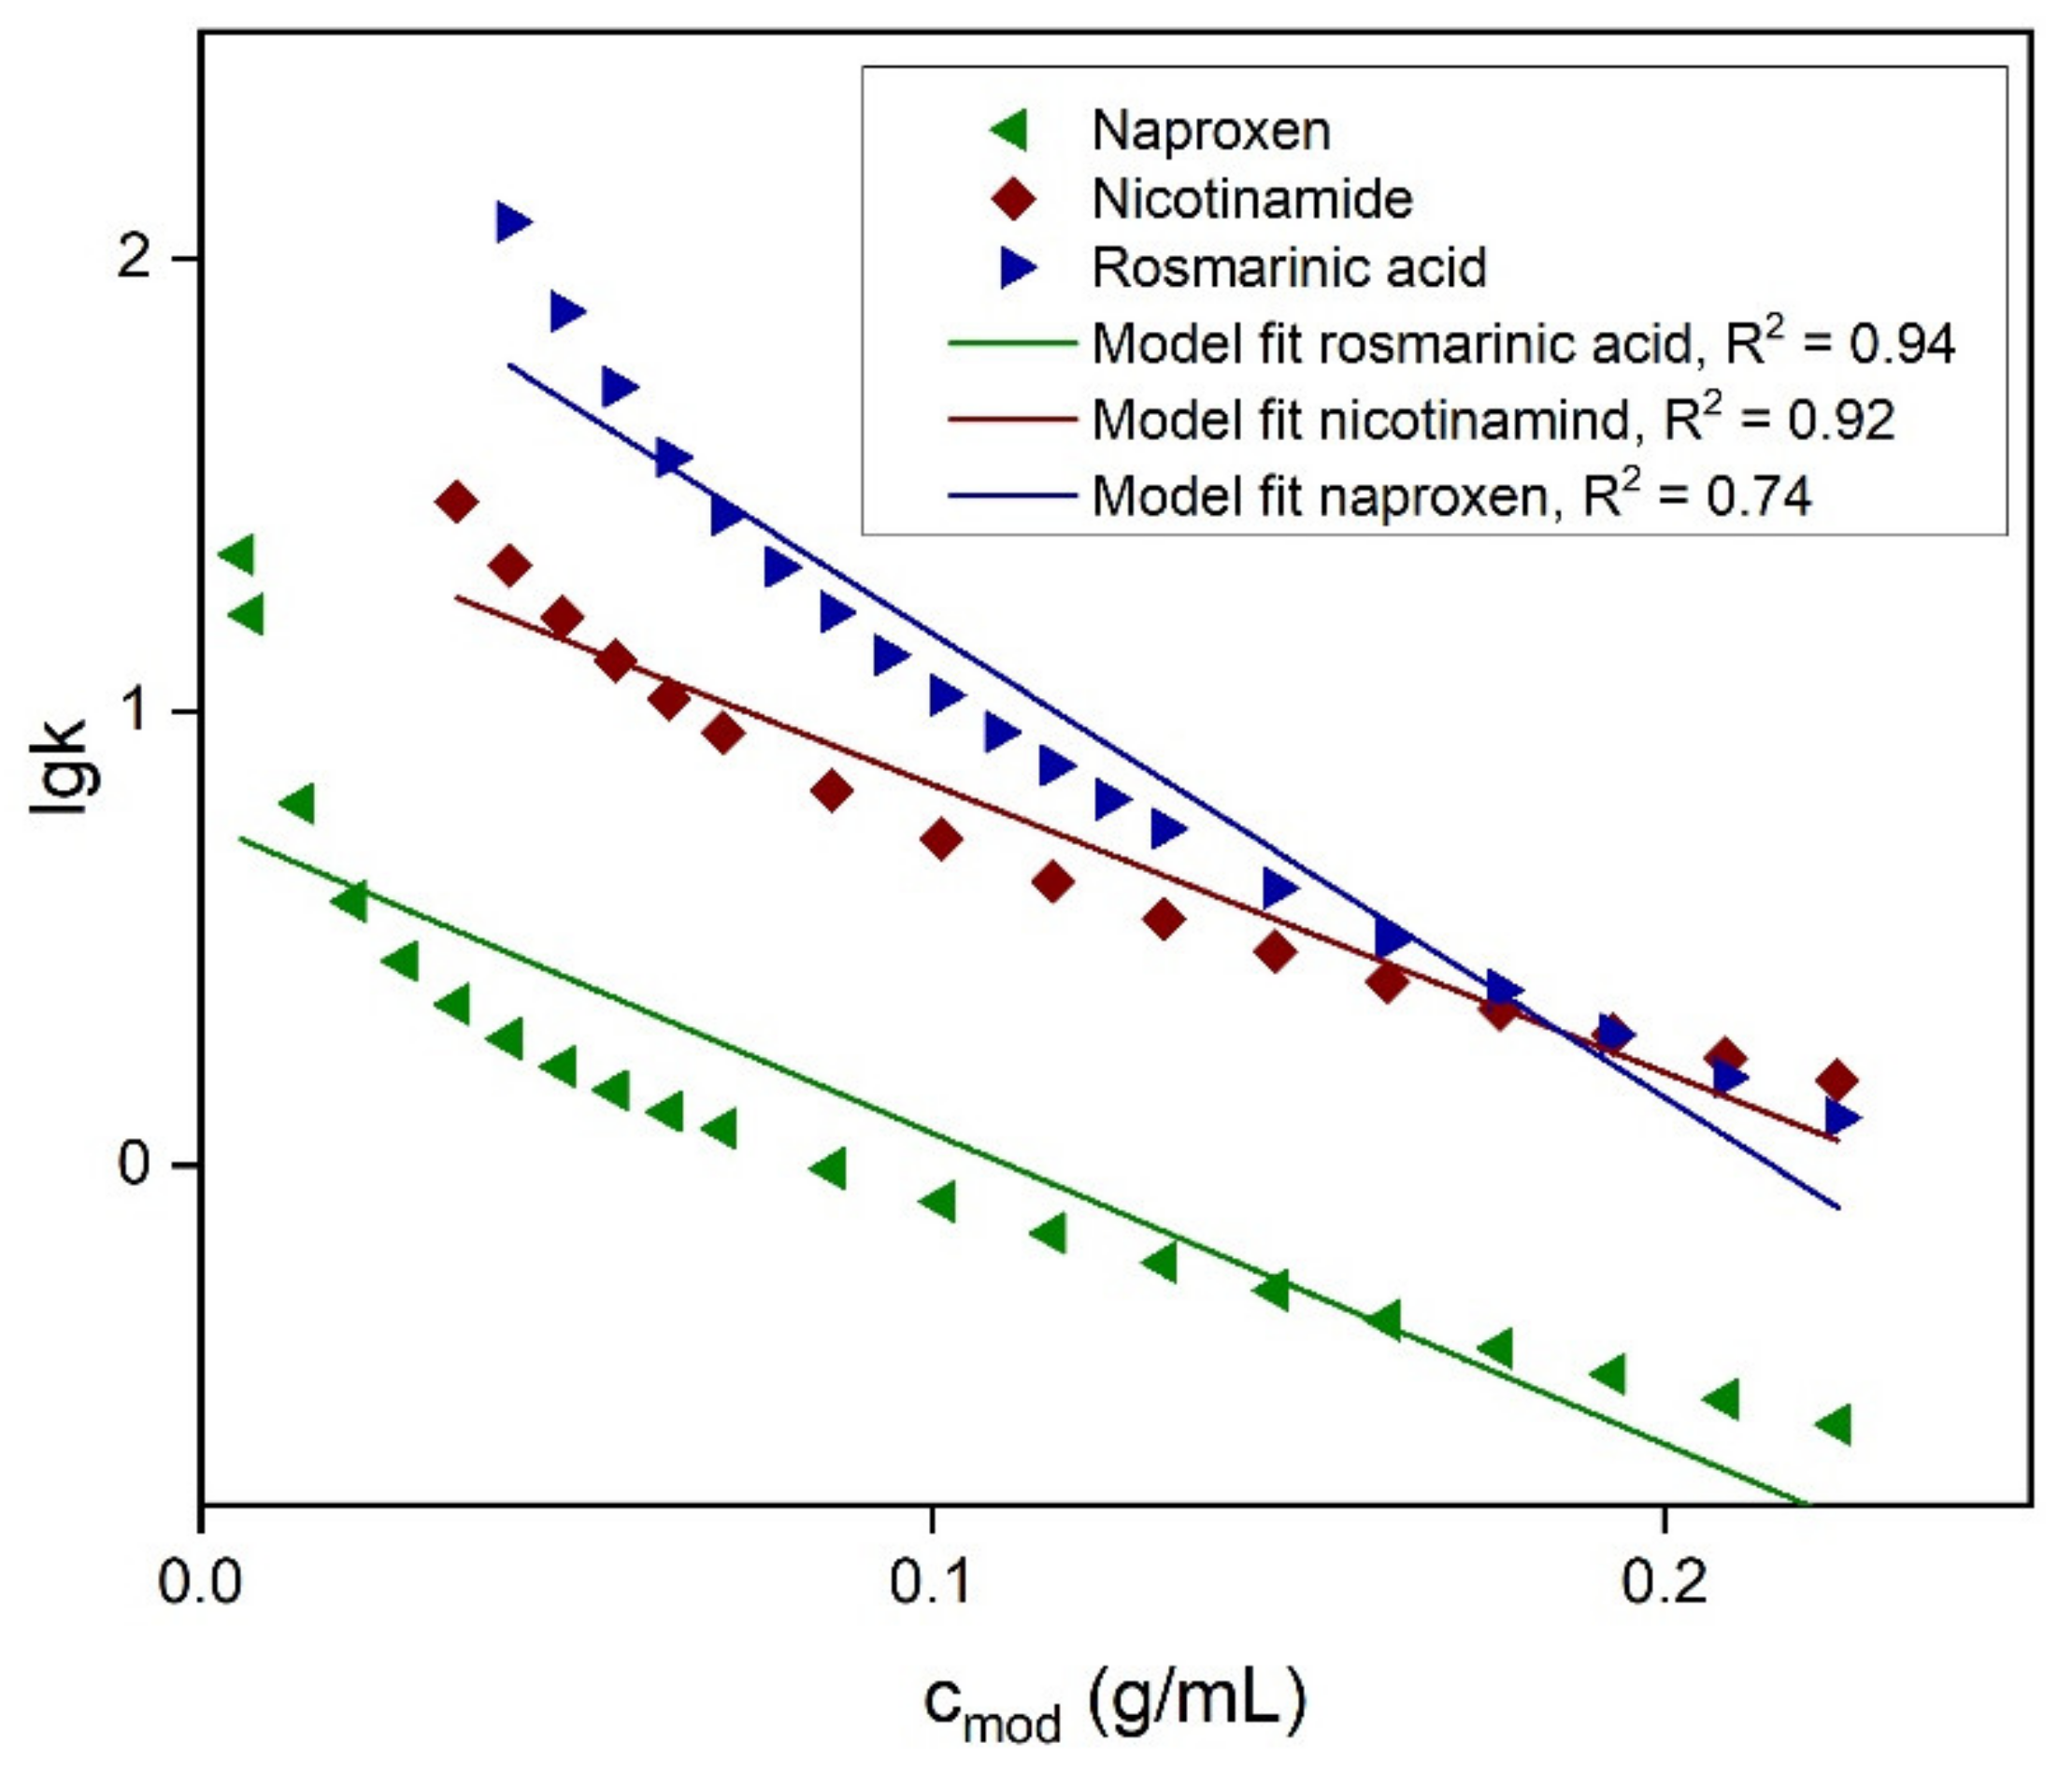
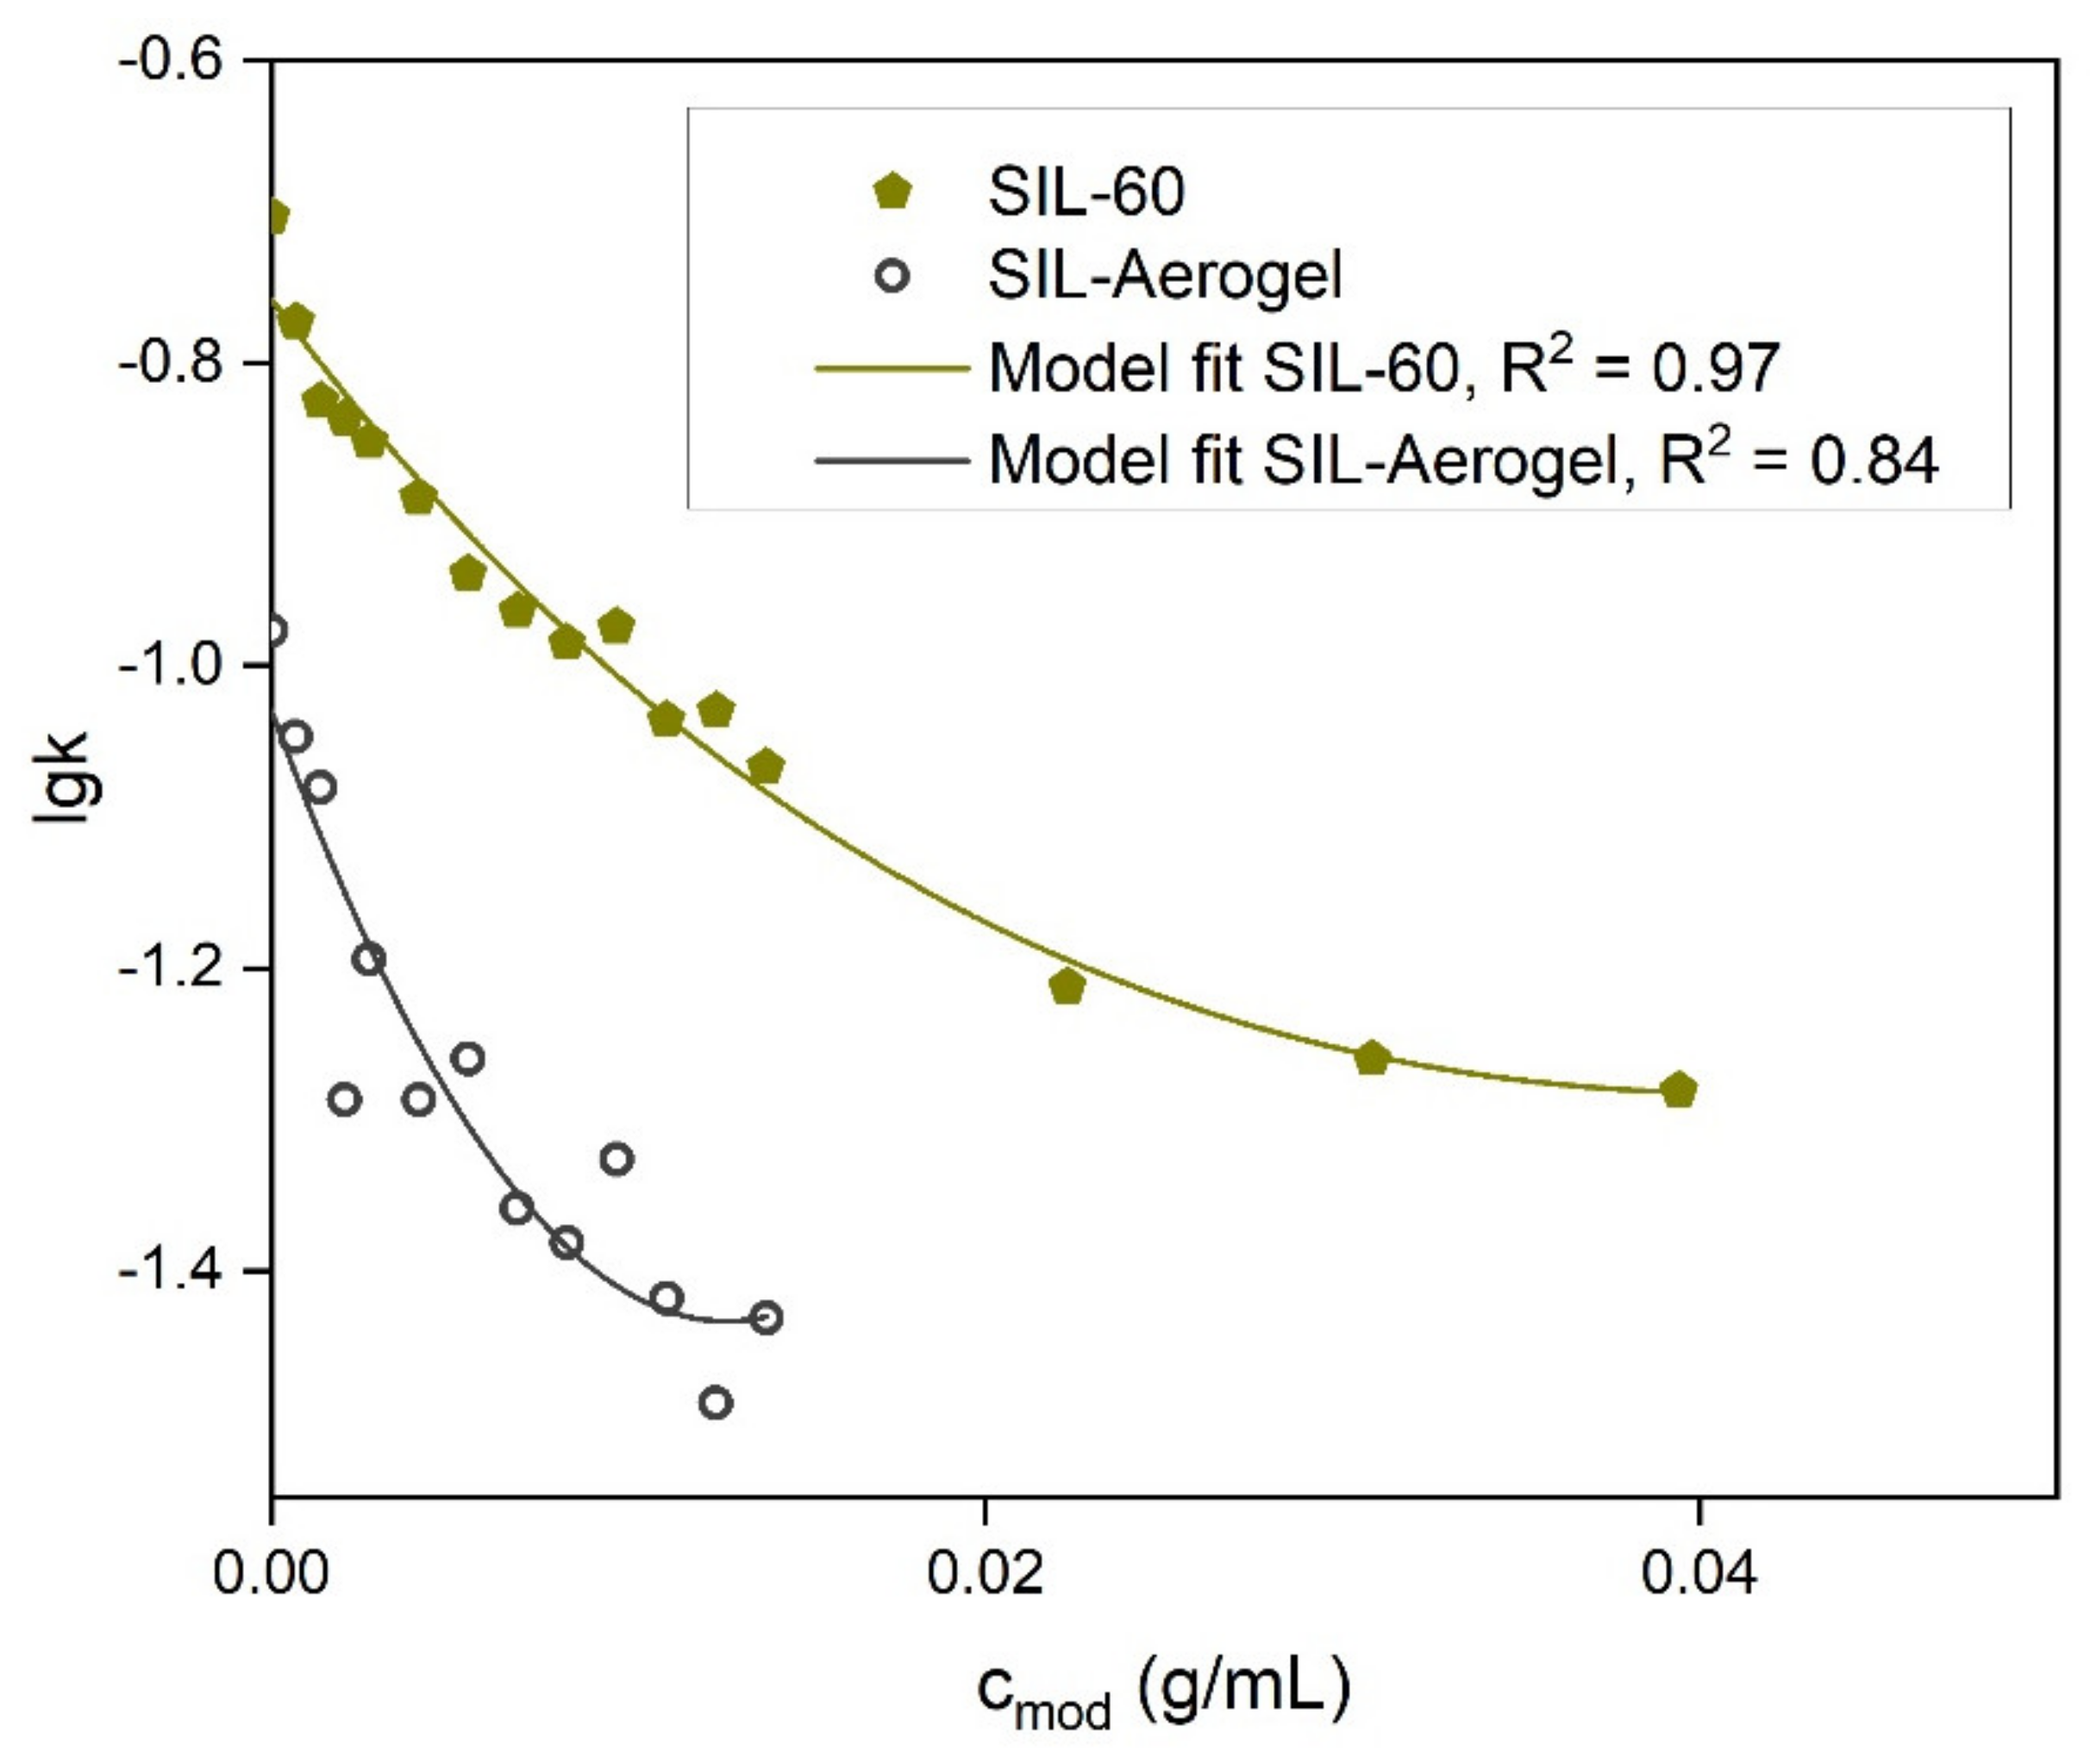
4.1.1. Model Assuming Linear Isotherms for Modifier Adsorption

Method DIM-Lin-kc applied Equation (6) for data fitting. Equation (6) was derived based on the assumption that the loading of modifier in the stationary phase is proportional to the modifier concentration in the mobile phase. This assumption was applied as a first attempt, intended to obtain the simplest model with the least number of fitting parameters, although it is known that methanol adsorption on porous silica in sc-CO2 does not follow a linear isotherm across the whole range of methanol fraction [26].
The results of the fitting for retention factors of phenol on silicas are demonstrated in Figure 2, and those for other solutes on SIL-60 are in Figure 3. The model fittings were all successful in the sense that either the chi-square minimization reached the tolerance of 10−9 or the chi-square no longer changed. The adjusted R2 (adj. R2) for all cases were in the range of 0.74–0.94, and the relative standard errors (RSEs) of the fitting parameter A and k 0 were in the range of 7–16%. However, it can be observed from the figures that the model fittings diverge from the experimental data at low concentrations of methanol. This leads to the underestimations of the k 0 values (y-intercept) in all cases regardless of physical properties of stationary phase (Figure 2) and the solute nature (Figure 3). These observations point to inadequacy of the model assumptions: as expected, the use of linear isotherms to describe the modifier adsorption on porous silica materials is an oversimplification and cannot be recommended for estimation of k 0 .
Note that Equation (6), derived in this work, has a certain similarity to the common retention model for reversed phase chromatography, where the logarithm of the retention factor of a solute is linearly related to the organic solvent fraction and the intercept is the logarithm of the retention factor in pure water as mobile phase [27]. This simple model was found to be not accurate enough for certain systems. Efforts were made to improve the model by introducing quadratic terms to the right-hand side [28]. Another natural way, however, is to apply non-linear adsorption isotherms.

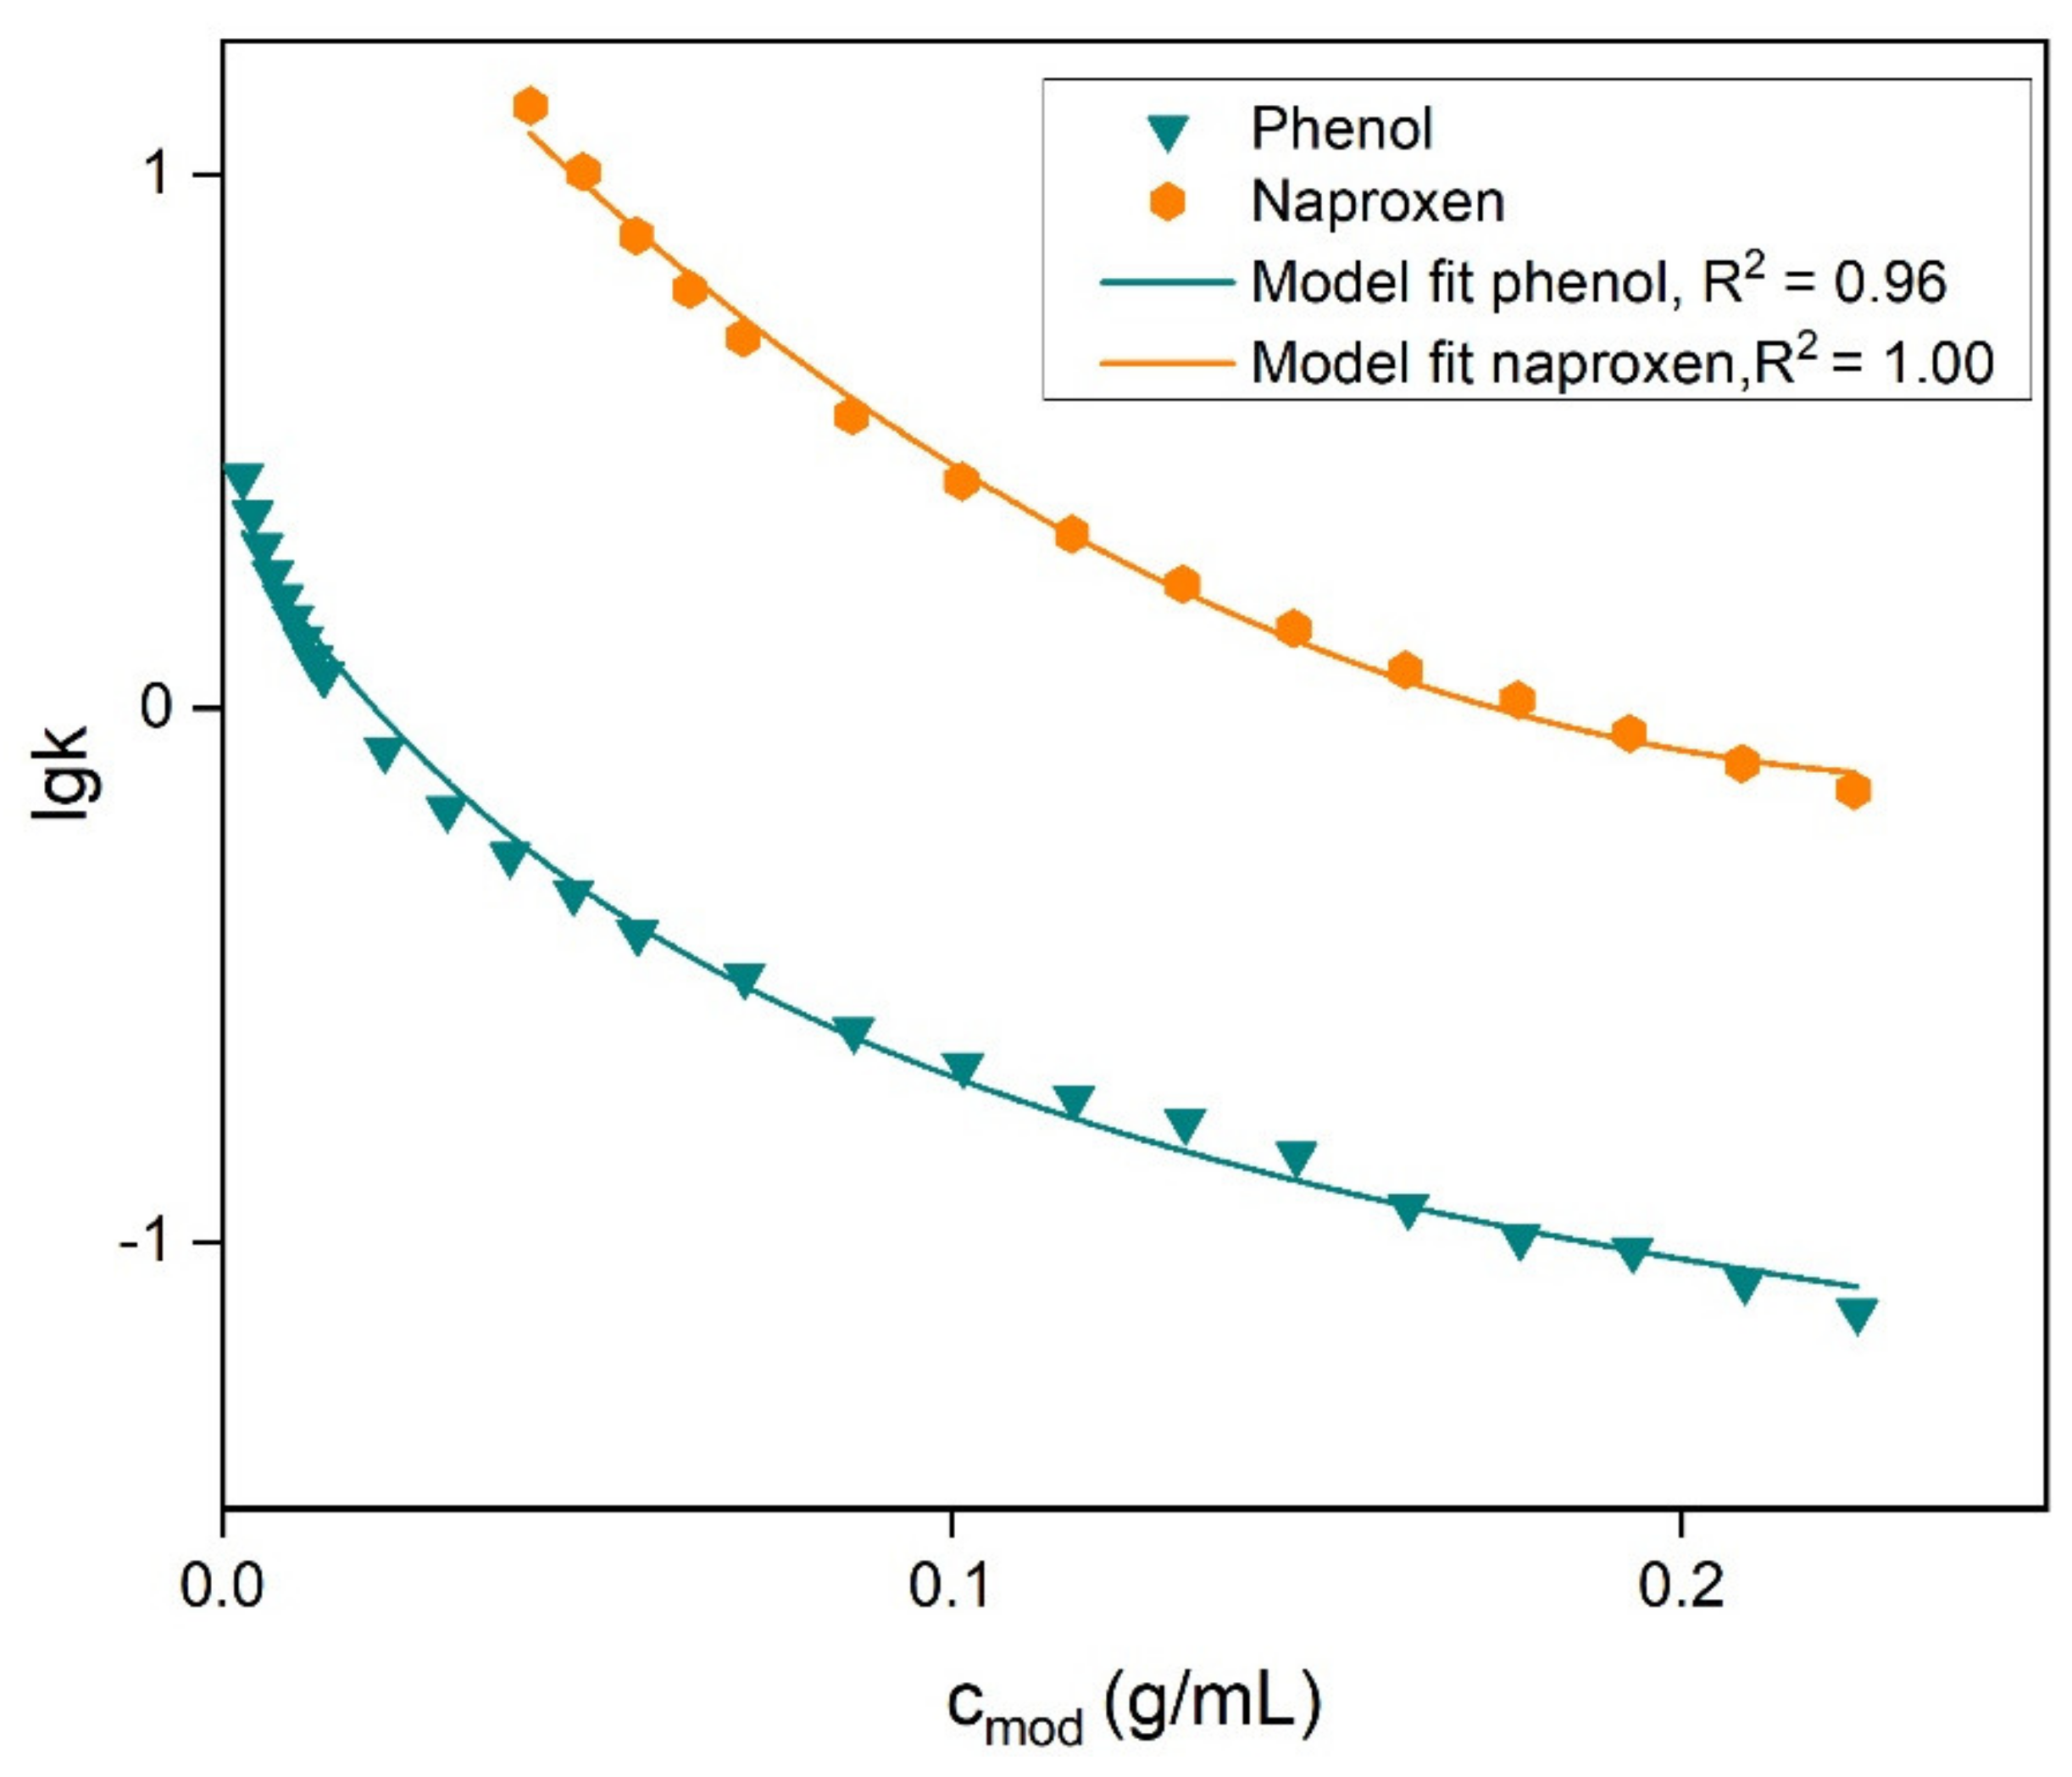
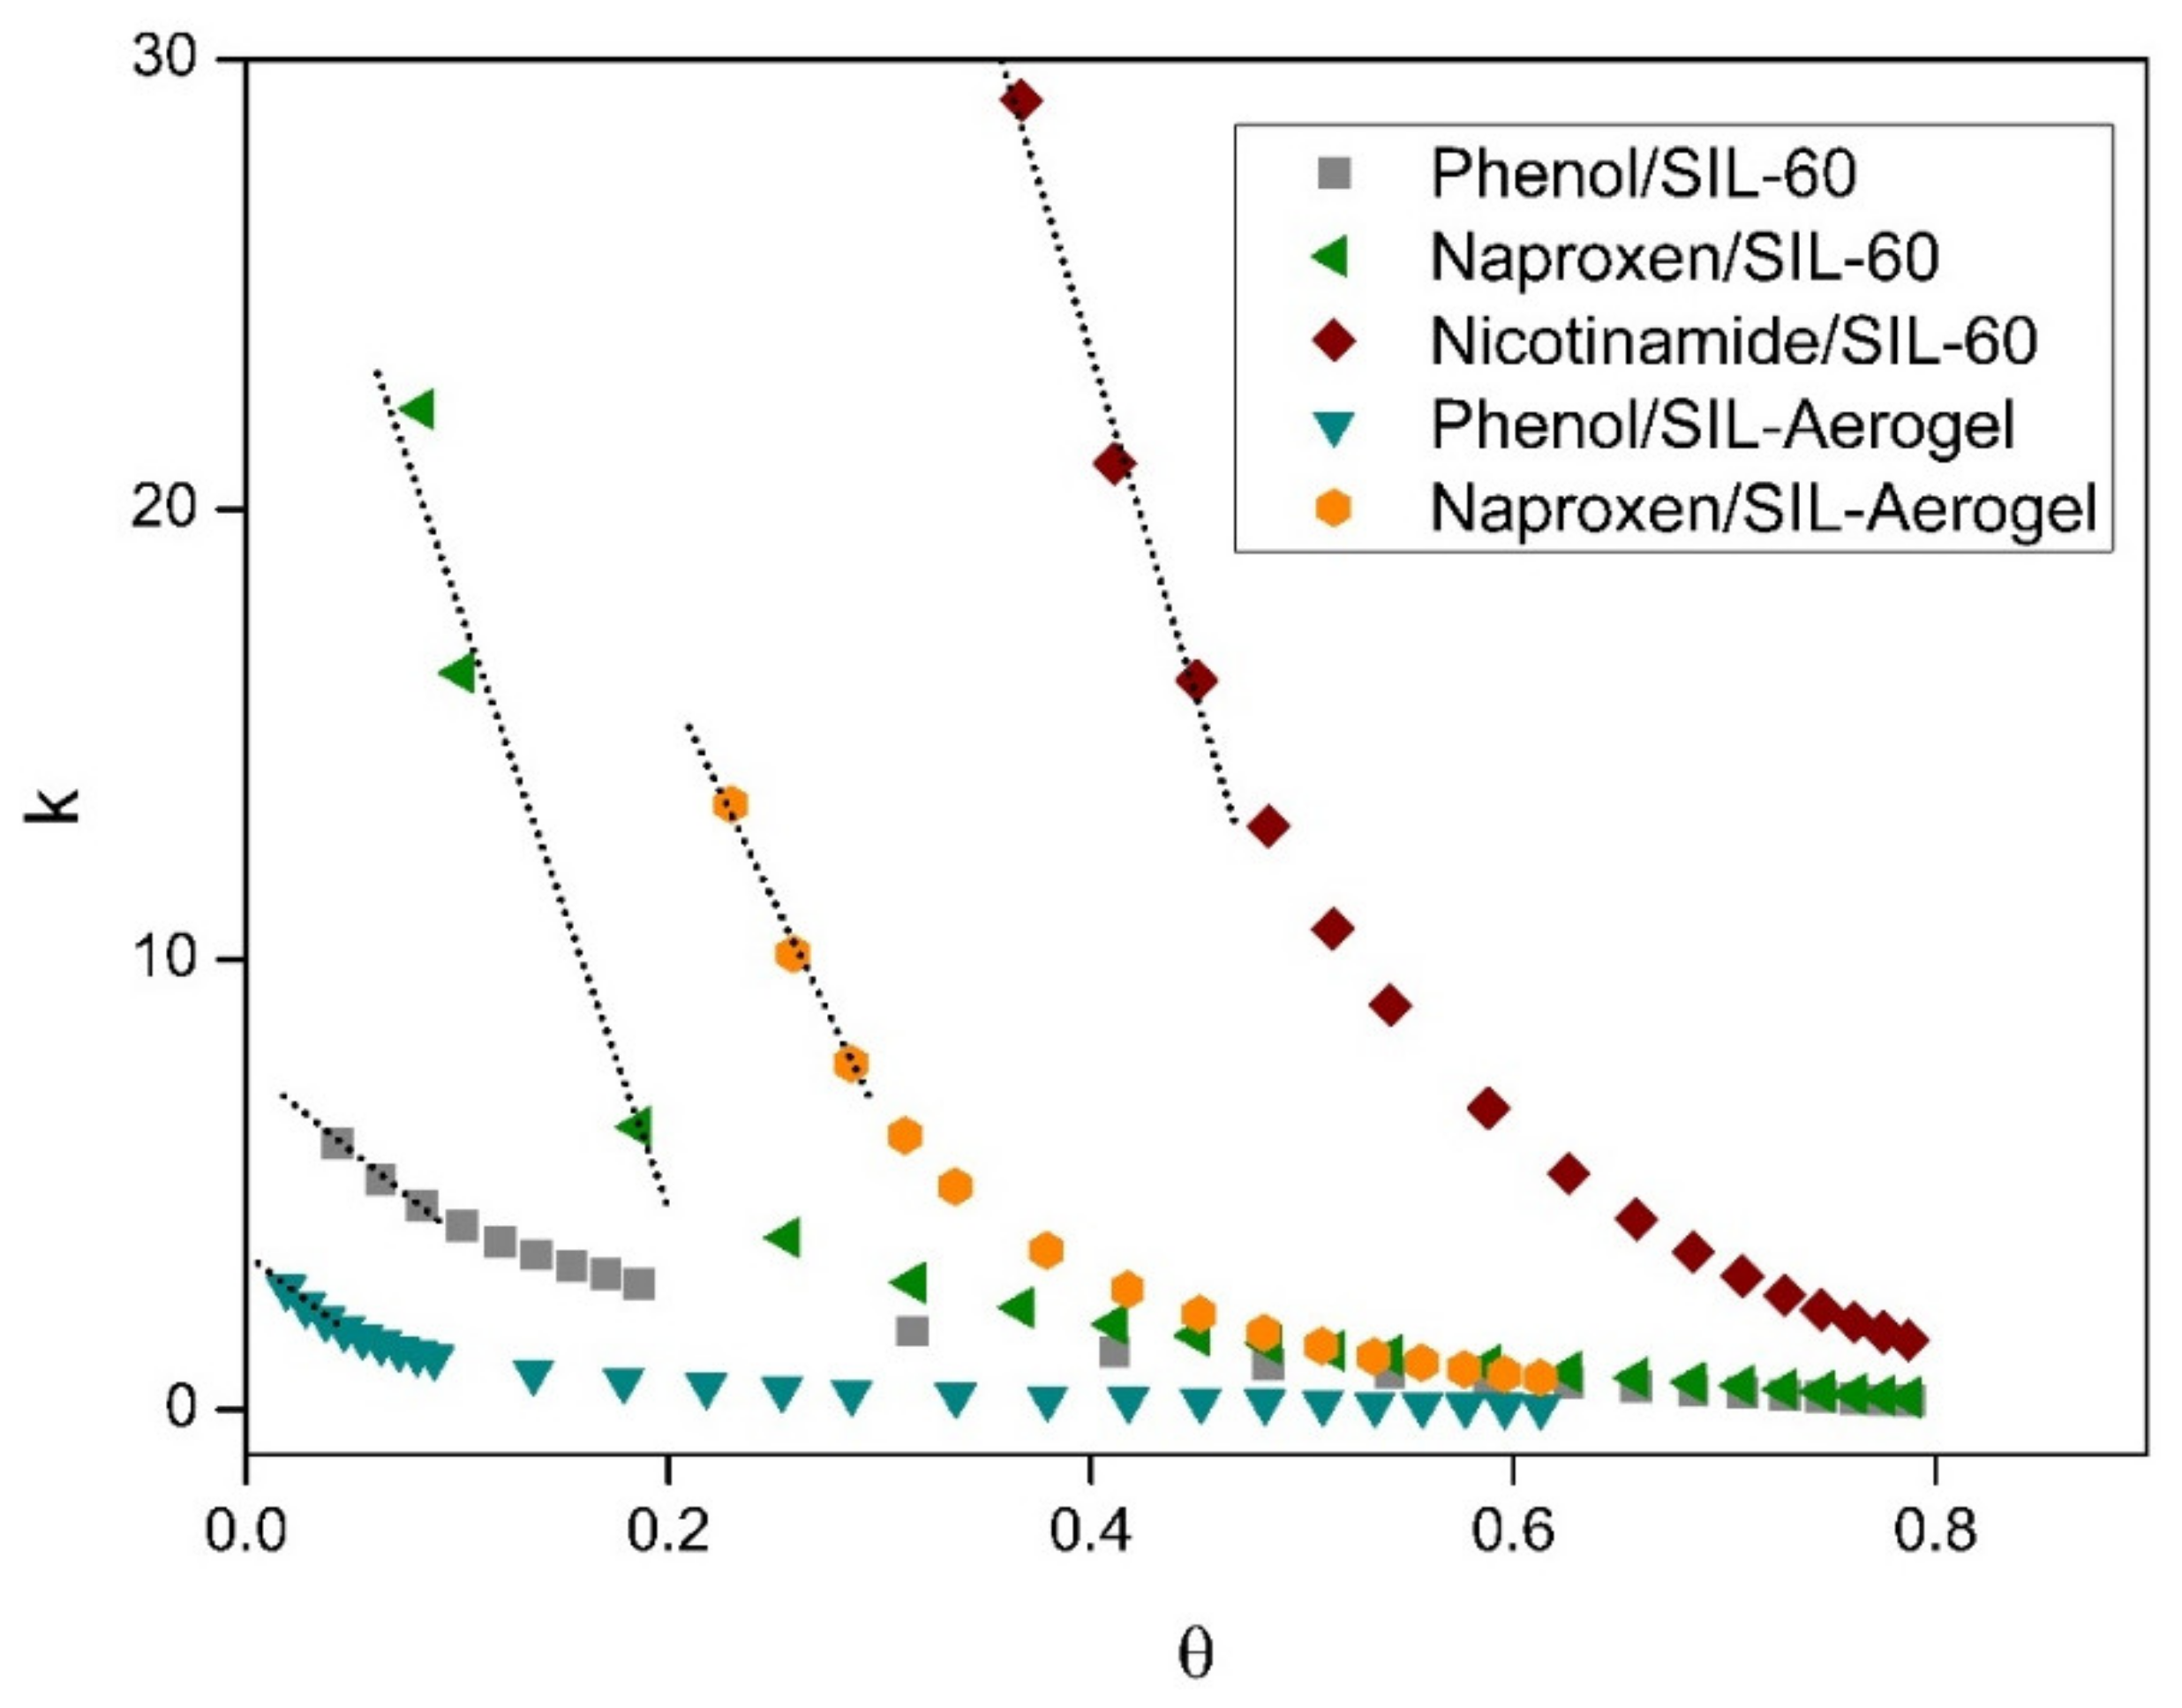
4.1.2. Models Assuming Langmuir Isotherms for Modifier Adsorption

As mentioned in Section 3.1.1, Langmuir isotherm was adopted for constructing retention models to describe the modifier adsorption in this work. Three methods based on Langmuir isotherm to analyze the retention data were established. Together with the linear-isotherm-based method discussed in the previous section, in total four methods based on DIMs were studied. Estimated k 0 and adj. R2 for the four methods are listed in Table 4. All experimental data were obtained at 40 °C, 200 bar. The method DIM-Lan-kcK’ employs a corrected K e q ,   L c o r r as input instead of measured K e q ,   L . This method was established after analyzing the results from the first three methods and is described in the following.
Regarding the aim of selecting the best method, three aspects were considered: (1) experimental efforts, (2) goodness of fitting, and (3) number of fitting parameters or problem of overfitting.
The DIM-Lan-kcK method relies on experimentally measured K e q ,   L as input data for fitting; thus, we kept a small number of fitting parameters to avoid overfitting. However, measurements of K e q ,   L require intensive efforts considering both time and equipment upgrades [13,22]. In the method DIM-Lan-kc, we attempted to avoid such troublesome experimental measurements by making K e q ,   L a fitting parameter. The fitted K e q ,   L values were found to be significantly larger than the measured ones. In addition, the equilibrium constants should remain nearly constant for each stationary phase at a constant temperature regardless of the used solutes. Contrary to this, the fitted values of K e q ,   L obtained for different solutes deviate largely for SIL-60 and SIL-aerogel (data not shown).
We surmise that overfitting of the retention data is a possible reason. Nevertheless, we observed that the fitted K e q ,   L values obtained in the DIM-Lan-kc method for phenol correlate well with the experimentally measured K e q ,   L values. Thus, the K e q ,   L obtained from the DIM-Lan-kc method should be first corrected by multiplying by an empirical factor, F . We call this value K e q ,   L c o r r :
K e q ,   L c o r r = F K e q ,   L
In the DIM-Lan-kcK’ method, the corrected adsorption constant from Equation (15) was employed to solve the overfitting problem of the DIM-Lan-kc method. An estimation for the correction factor F was made through a paired t-test (see details in Supplementary Materials, Section S2, Tables S2 and S3) and found to be 0.19. The value of k 0 estimated by the DIM-Lan-kcK’ method is close (55–133%, Table 4) to that from the method DIM-Lan-kcK, where experimental values of K e q ,   L are used.
Compared to linear adsorption isotherm, the use of Langmuir isotherms showed a significantly better correlation, as expected, due to a greater number of fitting parameters in the latter case. However, although the DIM-Lan-kc method had one more fitting parameter than DIM-Lan-kcK and DIM-Lan-kcK’, the adj. R2 did not show a visible increase. Another observation regarding the goodness of fitting is that the regression for toluene always results in the smallest adj. R2. Toluene was selected as it is the only solute for which k 0 could be measured experimentally due to its low affinity to silica. However, because of the same reason, retention times of toluene are close to the hold-up time, resulting in large uncertainties of the retention factor. Therefore, the low adj. R2 for toluene should not be interpreted as a failure of the model.
To summarize, the DIM-Lin-kc method is not recommended in any case because it has the worst goodness of fitting. Having the same level of goodness of fitting, the DIM-Lan-kcK’ method shows significant advantages compared to DIM-Lan-kcK for less experimental efforts and to DIM-Lan-kc for less risk of overfitting (Figure 4 and Figure 5).
Based on the above results, several issues shall be addressed when applying the DIMs for estimating k 0 from retention data in the presence of a modifier. First of all, when the methanol adsorption isotherm on the to-be-tested stationary phase in supercritical CO2 is available at the required temperature and pressure, the method DIM-Lan-kcK can be applied with the measured K e q , L for the most reliable estimation. However, in most cases, adsorption isotherms are not available. If so, phenol should be injected into the column as a model solute at various methanol concentration. The K e q , L can be obtained afterwards by regression using DIM-Lan-kc on the retention data of phenol. The value of A K e q ,   L c o r r can be then calculated by multiplying by the correction factor F . DIM-Lan-kcK’ can be finally applied for estimation of k 0 of any solutes on the stationary phase of this column using the K e q ,   L c o r r .

4.2. Applying Mixed-Retention Models

According to the original MRM, Equation (12), the retention factor k varies linearly with surface coverage θ :
k = k c k 0 θ + k 0
As seen in the k vs. θ plot (Figure 6), the experimental data does not show linear correlations among any solute/stationary phase pairs. Only the data points of each solute/stationary phase pair at relatively lower modifier concentrations can be treated as a linear function. The reason might be that the assumption of single layer adsorption to apply Langmuir isotherm does not hold true. Studies have demonstrated the adsorption of alcohols on silica materials could exhibit multilayer behavior above a certain concentration [26,29,30]. If this is the case, two issues should be considered. Firstly, the calculated θ values are only hypothetical and do not have any physical meaning. Secondly, the proposed model, Equation (16), is based on the theory that when methanol is adsorbed as a single layer, the solute molecules are attracted to the methanol molecules, which leads to k c . However, when multilayer adsorption appears, the affinity between the solute and adsorbed methanol changes, which leads to a different k c . In this case, k c depends on the modifier concentration, and the model assumptions break down. Because of these reasons, an advanced model Equation (14) with an empirical factor M was suggested. As discussed above for the DIMs, when the experimental value of K e q , L is not available, an estimated value can be taken. The results from regression by MRM-Lan-kcK and MRM-Lan-kcKM methods are given in Table 5.
We have observed that when Equation (14) was applied using the experimental measured K e q , L (MRM-Lan-kcK), the data could not be regressed and the parameters did not converge. The suspected reason was over-parameterization, which leads to deterioration of estimation accuracy, and the resulted estimations and errors were unreliable. However, the fitting worked in all cases for phenol and toluene as solutes and the estimated k 0 values were always comparable to those from DIM-Lan-kcK. The parameter M was found to lie in the range 100–200.
Although the retention factors of toluene and phenol are very different at zero modifier concentration, they have similar M values. We may surmise that M is not solute-dependent, but modifier-dependent. This is reasonable because M was introduced to correct the strength of the modifier influence at high modifier concentration where multilayer adsorption may take place and the influence of solutes shall be minimal. Therefore, to solve the overparameterization problem, M was fixed to 150 in all cases for the next method, MRM-Lan-kcKM.
Unlike developing method DIM-Lan-kcK’ based on the result from DIM-Lan-kc, it is not possible to treat the K e q , L as a fitting parameter in the MRMs: it is not reasonable to add an extra fitting parameter to a model which is already overparameterized. We suggest a rough estimation of K e q , L = 20 mL g−1 as a representative value across all studied silica materials. With these estimates for M and K e q , L , the regressions were performed and the results show reasonable agreement (89–147%) with the method DIM-Lan-kcK (Table 5). One exception was the case of rosmarinic acid, which has an exceptionally high affinity to silica. In this case, the estimations of k 0 by MRM are not reliable. For the second strongest retained solute, nicotinamide, the DIM-Lan and MRM-Lan methods give consistent estimations (304 ± 16 and 277 ± 10, respectively), even when arbitrary selected parameters K e q , L and M were taken.
To summarize, if K e q , L is not available, the method MRM-Lan-kcKM is recommended; it provides satisfying estimations close to DIM-Lan-kcK without over-parameterization.

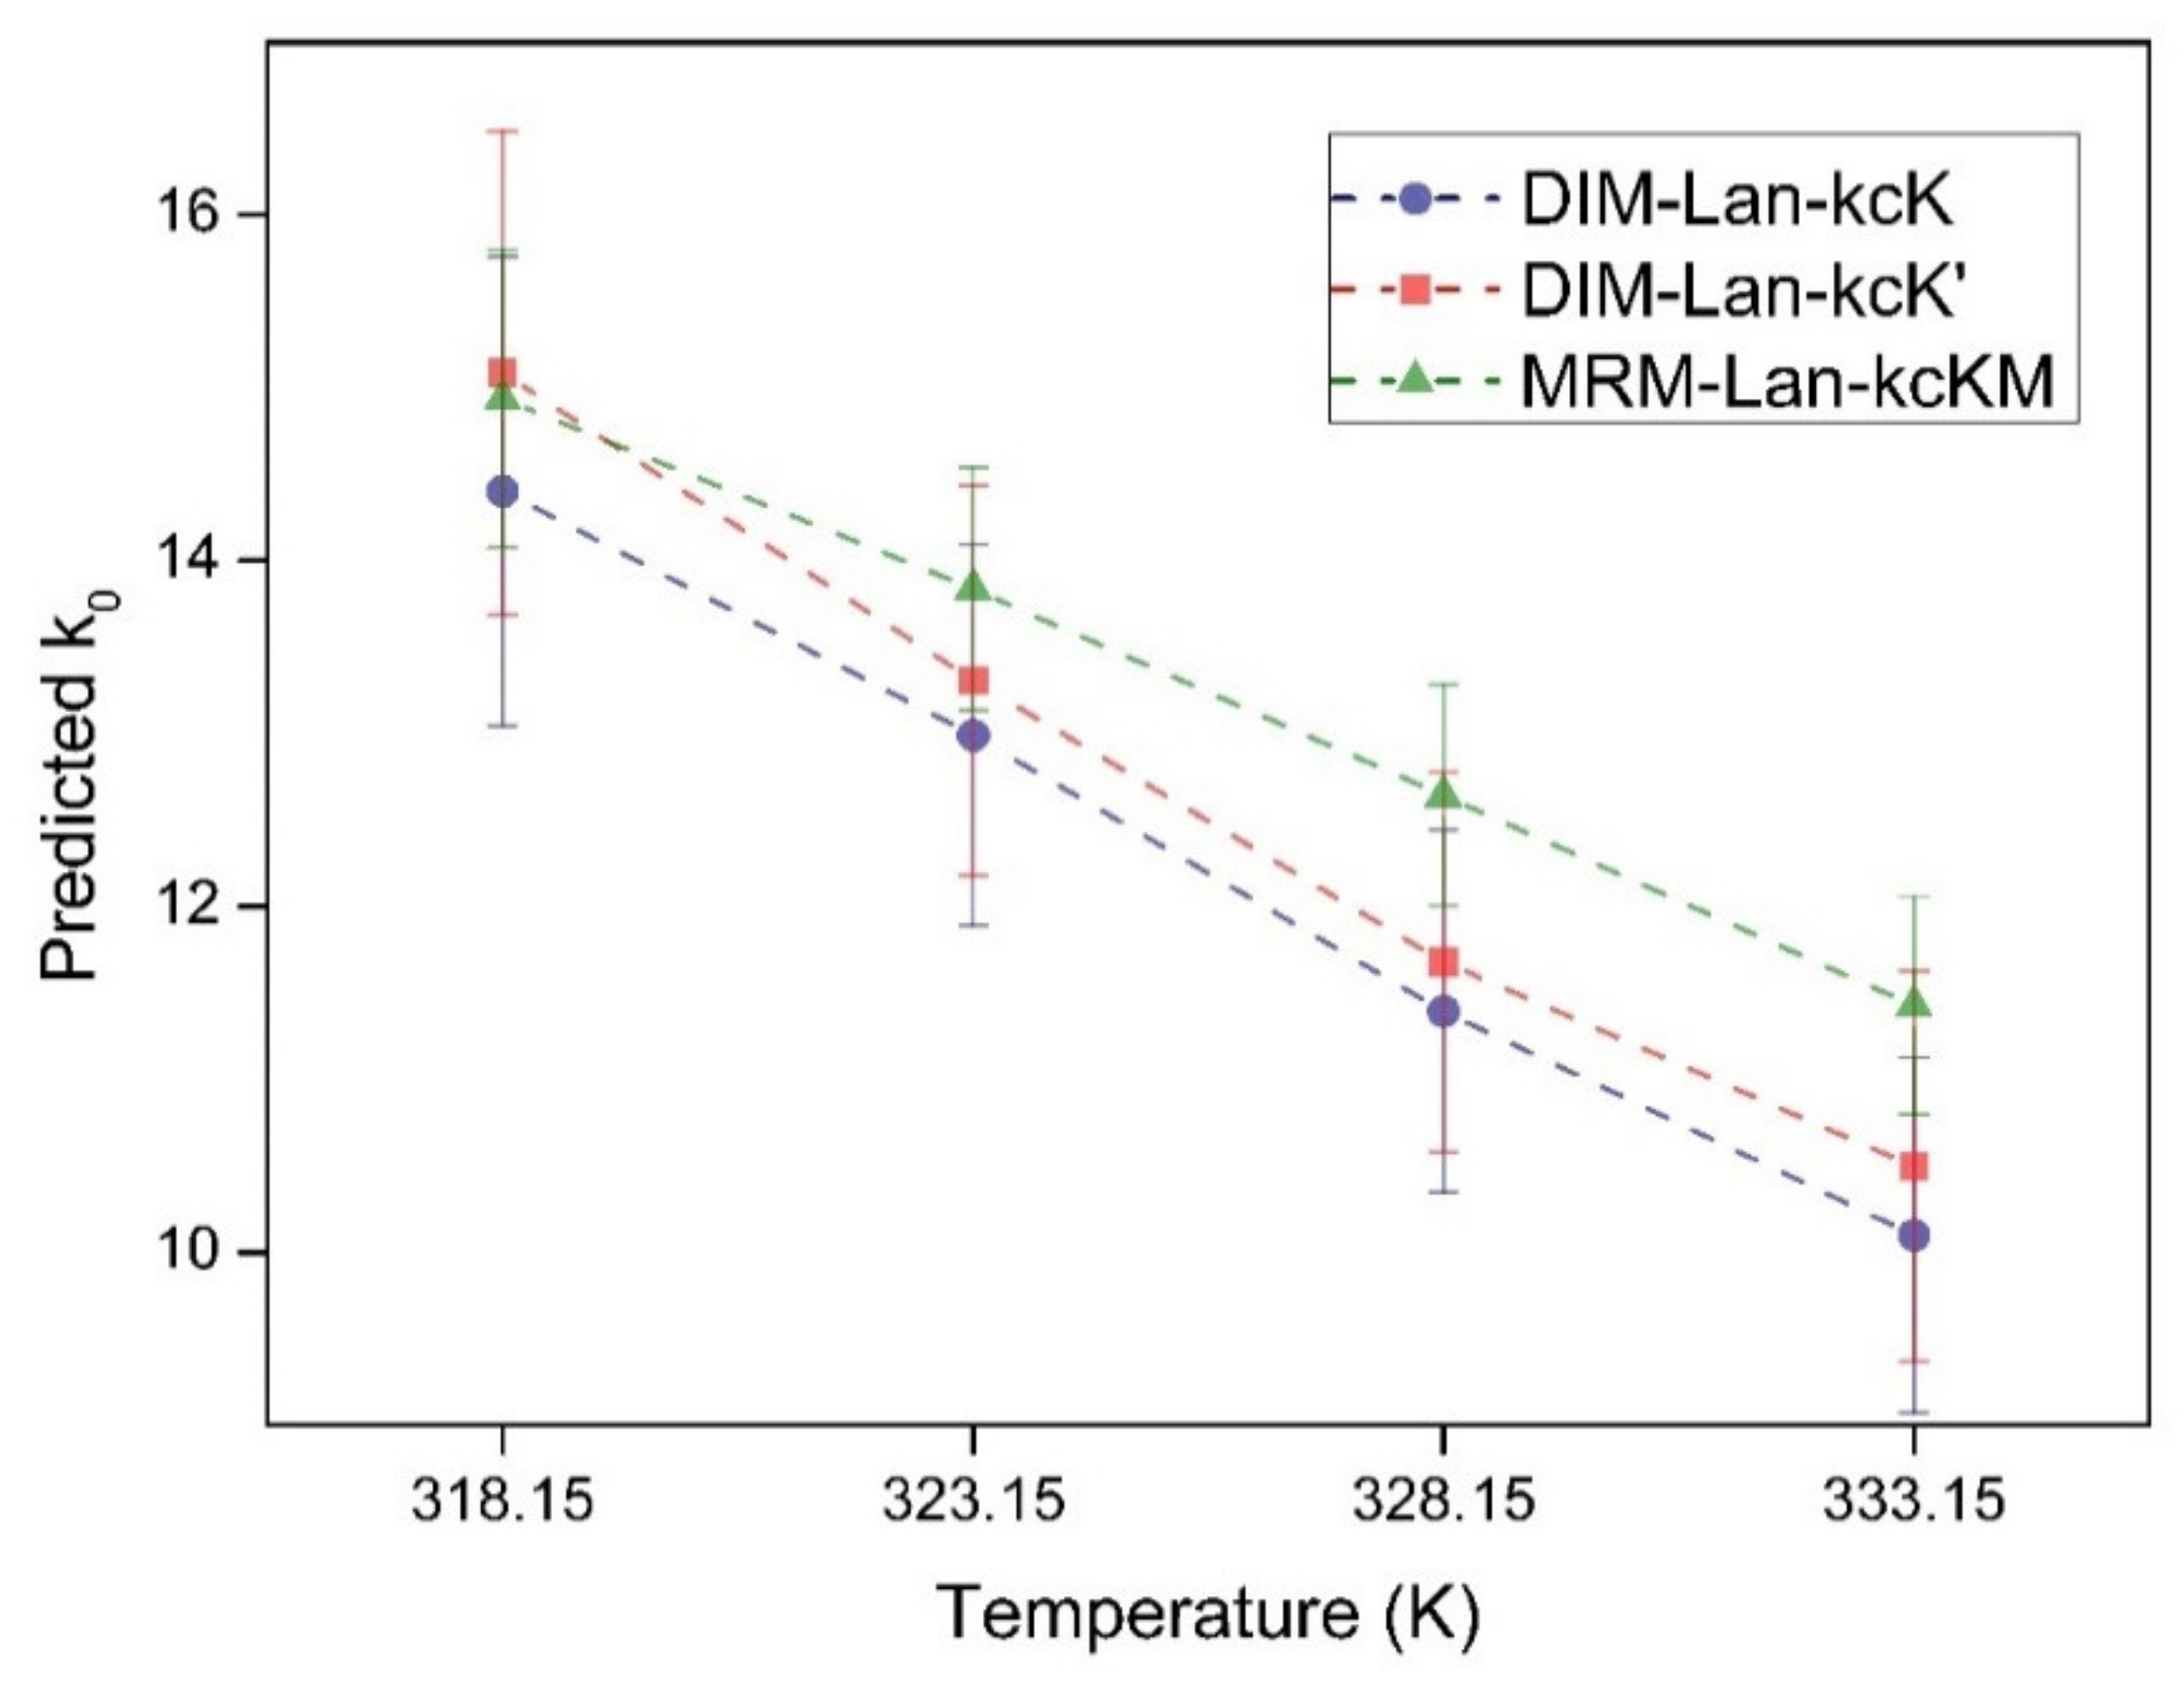
4.3. Case Study: Temperature Influence on Retention

To validate the methods explained in the previous chapters and to study the temperature influence on the retention factors, injections of ketoprofen were performed at constant CO2 density (807 g L−1). Four temperatures were investigated and the back pressure of the system was adjusted accordingly. The concentration of the modifier was very low and considered as having no influence on fluid density. The experimental data and the model fitting with the MRM-Lan-kcKM method is given in Figure 7, while the estimated k 0 values using the methods DIM-Lan-kcK, DIM-Lan-kcK’ and MRM-Lan-kcKM are presented in Figure 8.
The temperature dependence of adsorption in supercritical CO2 has been studied in many previous works [31,32,33,34,35]. However, all of these works were done by varying temperatures at a fixed pressure. No matter which solutes or stationary phases were studied, the same conclusion was drawn: that the adsorbed amount increases with increasing temperature. This phenomenon was explained mainly by the density influence. With increasing temperature, the density and solvation power of CO2 is lowered, favoring solute adsorption on the solid surface. In the current work, we eliminated this cause by fixing the density to a constant value, and we found that the k 0 decreases with increasing temperature. When temperature increases, the vapor pressure of ketoprofen increases, and therefore, ketoprofen shows lower affinity to the stationary phase at higher temperatures. This behavior follows the general temperature dependence of adsorption in gases and liquids. It is also seen in Figure 7 that the four lines come closer at higher c m o d , pointing to the fact that temperature has less influence at higher c m o d on the adsorption of solute to SIL-Aerogel. One explanation is that the higher modifier content leads to higher solubility of solutes in the mobile phase, which dominates over the temperature effect. Another explanation could be that the temperature influence on the adsorption of modifier and solute counteract each other: at lower temperatures, the adsorption of both modifier and solute is higher. At the same time, since more modifier is adsorbed, it is covering a larger surface and inhibiting the adsorption of the solute. This counteraction is more obvious at higher methanol concentrations.
Observed in Figure 8, as expected, the estimated k 0 values from all three methods were constant taking into account the margin of error. This result validated the two methods DIM-Lan-kcK’ and MRM-Lan-kcKM, which do not require prior determinations of adsorption isotherms of modifiers. A quick summary of the key estimations of the two methods: Both methods assume the modifier adsorption follows Langmuir isotherm. To apply DIM-Lan-kcK’, the K e q ,   L c o r r can be calculated from the retention data of phenol on a selected column. A correction factor F = 0.19 shall be adopted. The obtained K e q ,   L c o r r can be then used further for other solutes. To apply MRM-Lan-kcKM, rough estimations of K e q , L = 20 mL g−1 and M = 150 should be taken.

5. Conclusions

This work reports on experimental retention factors for moderately polar solutes on four silica-based porous matrices used as stationary phases in packed-column SFC. Low polarity of pure sc-CO2 makes elution of the solutes only possible if modifier (methanol) is added to the mobile phase. To extrapolate the retention factors into experimentally inaccessible modifier-free conditions, two classes of empirical retention models were developed. The first class relies on log-linear relations for the equilibrium concentration of the solute in both mobile and stationary phases. The second class interprets the overall retention as a sum result of the retention on native and covered-by-modifier adsorption sites. To obtain analytical expressions for both classes, a functional form for adsorption isotherms of modifier on the porous matrix is required. We demonstrated that linear adsorption isotherm is insufficient to describe experimental results. Langmuir isotherm yields qualitatively correct behavior. To obtain quantitative agreement and to avoid overfitting of the models, we suggested how to estimate the adsorption coefficient of the modifier. An additional advantage is that time-consuming prior determinations of adsorption isotherms of modifier can be avoided. We apply the developed models to the adsorption of a model drug, ketoprofen, on silica aerogel and deduce the retention factor in modifier-free conditions based on retention data obtained with modifier. Since the impregnation processes are commonly performed in modifier-free conditions, the developed models may facilitate the screening of porous matrices with a required affinity towards solutes of interest.

Supplementary Materials

The following are available online at https://www.mdpi.com/article/10.3390/app11157106/s1, Figure S1: The breakthrough curve of staircase frontal analysis on SIL-300 column, Table S1: Fitted Langmuir parameters to the adsorption isotherm data, Table S2: Calculation of corrected adsorption constant K e q ,   L c o r r by selected correction factor, Table S3: Data of paired t-test for correction factor selection.

Author Contributions

Conceptualization, M.S. and P.G.; methodology, M.S., Z.Ü. and P.G.; software, M.S., Z.C. and P.G.; validation, M.S., Z.Ü., Z.C., S.D. and P.G.; formal analysis, M.S., Z.Ü. and P.G.; investigation, M.S., Z.Ü., Z.C., S.D. and P.G.; resources, M.J., C.E. and P.G.; data curation, M.S. and P.G.; writing—original draft preparation, M.S., M.J., C.E. and P.G.; writing—review and editing, M.S. and P.G.; visualization, M.S. and P.G.; supervision, M.J., C.E. and P.G.; project administration, M.J., C.E. and P.G.; funding acquisition, M.J., C.E. and P.G. All authors have read and agreed to the published version of the manuscript.

Funding

This research received no external funding.

Institutional Review Board Statement

Not applicable.

Informed Consent Statement

Not applicable.

Acknowledgments

Publishing fees supported by Funding Programme Open Access Publishing of Hamburg University of Technology (TUHH). The authors are grateful to Marianne Kammlott for her help with the nitrogen adsorption measurements and to Frank Rimoschat for the assistance with helium pycnometry.

Conflicts of Interest

The authors declare no conflict of interest.

References

  1. Gurikov, P.; Smirnova, I. Amorphization of drugs by adsorptive precipitation from supercritical solutions: A review. J. Supercrit. Fluids 2018, 132, 105–125. [Google Scholar] [CrossRef]
  2. Tkalec, G.; Pantić, M.; Novak, Z.; Knez, Z. Supercritical impregnation of drugs and supercritical fluid deposition of metals into aerogels. J. Mater. Sci. 2014, 50, 1–12. [Google Scholar] [CrossRef]
  3. Sanli, D.; Erkey, C. Silylation from supercritical carbon dioxide: A powerful technique for modification of surfaces. J. Mater. Sci. 2015, 50, 7159–7181. [Google Scholar] [CrossRef]
  4. Bouledjouidja, A.; Masmoudi, Y.; Sergent, M.; Badens, E. Effect of operational conditions on the supercritical carbon dioxide impregnation of anti-inflammatory and antibiotic drugs in rigid commercial intraocular lenses. J. Supercrit. Fluids 2017, 130, 63–75. [Google Scholar] [CrossRef]
  5. Tabernero, A.; Cardea, S. Supercritical carbon dioxide techniques for processing microbial exopolysaccharides used in biomedical applications. Mater. Sci. Eng. C 2020, 112, 110940. [Google Scholar] [CrossRef] [PubMed]
  6. Kankala, R.K.; Zhang, Y.S.; Wang, S.-B.; Lee, C.-H.; Chen, A.-Z. Supercritical Fluid Technology: An Emphasis on Drug Delivery and Related Biomedical Applications. Adv. Healthc. Mater. 2017, 6. [Google Scholar] [CrossRef] [PubMed] [Green Version]
  7. Milovanovic, S.; Hollermann, G.; Errenst, C.; Pajnik, J.; Frerich, S.; Kroll, S.; Rezwan, K.; Ivanovic, J. Supercritical CO2 impregnation of PLA/PCL films with natural substances for bacterial growth control in food packaging. Food Res. Int. 2018, 107, 486–495. [Google Scholar] [CrossRef] [PubMed]
  8. García-Casas, I.; Crampon, C.; Montes, A.; Pereyra, C.; de la Ossa, E.M.; Badens, E. Supercritical CO2 impregnation of silica microparticles with quercetin. J. Supercrit. Fluids 2019, 143, 157–161. [Google Scholar] [CrossRef]
  9. Fonseca, J.M.; Dohrn, R.; Peper, S. High-pressure fluid-phase equilibria: Experimental methods and systems investigated (2005–2008). Fluid Phase Equilib. 2011, 300, 1–69. [Google Scholar] [CrossRef]
  10. Sun, M.; Barbero, S.R.; Johannsen, M.; Smirnova, I.; Gurikov, P. Retention characteristics of silica materials in carbon dioxide/methanol mixtures studied by inverse supercritical fluid chromatography. J. Chromatogr. A 2019, 1588, 127–136. [Google Scholar] [CrossRef]
  11. Kern, J.; Johannsen, M. Measuring and modeling adsorption equilibria of non-volatile compounds dissolved in supercritical carbon dioxide on nanoparticles using dynamic methods. J. Supercrit. Fluids 2016, 113, 72–79. [Google Scholar] [CrossRef]
  12. Vajda, P.; Guiochon, G. Modifier adsorption in supercritical fluid chromatography onto silica surface. J. Chromatogr. A 2013, 1305, 293–299. [Google Scholar] [CrossRef]
  13. Enmark, M.; Forssén, P.; Samuelsson, J.; Fornstedt, T. Determination of adsorption isotherms in supercritical fluid chromatography. J. Chromatogr. A 2013, 1312, 124–133. [Google Scholar] [CrossRef] [PubMed]
  14. Roth, M. Determination of thermodynamic properties by supercritical fluid chromatography. J. Chromatogr. A 2004, 1037, 369–391. [Google Scholar] [CrossRef] [PubMed]
  15. Wu, Y. Retention Mechanism Studies on Packed Column Supercritical Fluid Chromatography (pSFC) and Related Unified Chromatography Techniques. J. Liq. Chromatogr. Relat. Technol. 2004, 27, 1203–1236. [Google Scholar] [CrossRef]
  16. Vajda, P.; Guiochon, G. Determination of the column hold-up volume in supercritical fluid chromatography using nitrous-oxide. J. Chromatogr. A 2013, 1309, 96–100. [Google Scholar] [CrossRef]
  17. Empower, Version 3; Waters Corporation: Milford, MA, USA, 2010.
  18. Seidel-Morgenstern, A.; Guiochon, G. Thermodynamics of the adsorption of Tröger’s base enantiomers from ethanol on cellulose triacetate. J. Chromatogr. A 1993, 631, 37–47. [Google Scholar] [CrossRef]
  19. Janssen, H.-G.; Schoenmakers, P.; Cramers, C.A. Mobile and stationary phases for SFC: Effects of using modifiers. Microchim. Acta 1991, 104, 337–351. [Google Scholar] [CrossRef] [Green Version]
  20. Millard, J.W.; Alvarez-Núñez, F.; Yalkowsky, S. Solubilization by cosolvents: Establishing useful constants for the log–linear model. Int. J. Pharm. 2002, 245, 153–166. [Google Scholar] [CrossRef]
  21. Ottiger, S.; Kluge, J.; Rajendran, A.; Mazzotti, M. Enantioseparation of 1-phenyl-1-propanol on cellulose-derived chiral stationary phase by supercritical fluid chromatography: II. Non-linear isotherm. J. Chromatogr. A 2007, 1162, 74–82. [Google Scholar] [CrossRef]
  22. Enmark, M.; Samuelsson, J.; Forss, E.; Forssén, P.; Fornstedt, T. Investigation of plateau methods for adsorption isotherm determination in supercritical fluid chromatography. J. Chromatogr. A. 2014, 1354, 129–138. [Google Scholar] [CrossRef]
  23. Kern, J.; Johannsen, M. Modeling adsorption on energetically heterogeneous surfaces with an extended SAFT-VR approach. J. Supercrit. Fluids 2018, 133, 70–76. [Google Scholar] [CrossRef]
  24. Wenda, C.; Rajendran, A. Enantioseparation of flurbiprofen on amylose-derived chiral stationary phase by supercritical fluid chromatography. J. Chromatogr. A 2009, 1216, 8750–8758. [Google Scholar] [CrossRef]
  25. Origin, Version 8.5.1; OriginLab Corporation: Northampton, MA, USA, 2011.
  26. Glenne, E.; Öhlén, K.; Leek, H.; Klarqvist, M.; Samuelsson, J.; Fornstedt, T. A closer study of methanol adsorption and its impact on solute retentions in supercritical fluid chromatography. J. Chromatogr. A 2016, 1442, 129–139. [Google Scholar] [CrossRef]
  27. Snyder, L.R.; Quarry, M.A. Computer Simulation in HPLC Method Development. Reducing the Error of Predicted Retention Times. J. Liq. Chromatogr. 1987, 10, 1789–1820. [Google Scholar] [CrossRef]
  28. Ko, J.; Ford, J.C. Comparison of selected retention models in reversed-phase liquid chromatography. J. Chromatogr. A 2001, 913, 3–13. [Google Scholar] [CrossRef]
  29. Poole, C.F.; Lenca, N. Applications of the solvation parameter model in reversed-phase liquid chromatography. J. Chromatogr. A 2017, 1486, 2–19. [Google Scholar] [CrossRef] [PubMed]
  30. Vajda, P.; Guiochon, G. Effects of the back pressure and the temperature on the finite layer thickness of the adsorbed phase layer in supercritical fluid chromatography. J. Chromatogr. A 2013, 1309, 41–47. [Google Scholar] [CrossRef]
  31. Ushiki, I.; Takahashi, N.; Shimizu, T.; Sato, Y.; Ota, M.; Smith, R.; Inomata, H. Adsorption equilibria of rhodium acetylacetonate with MCM-41, MSU-H, and HMS silica substrates in supercritical carbon dioxide for preparing catalytic mesoporous materials. J. Supercrit. Fluids 2017, 120, 240–248. [Google Scholar] [CrossRef]
  32. Ushiki, I.; Ota, M.; Sato, Y.; Inomata, H. VOCs (acetone, toluene, and n-hexane) adsorption equilibria on mesoporous silica (MCM-41) over a wide range of supercritical carbon dioxide conditions: Experimental and theoretical approach by the Dubinin–Astakhov equation. Fluid Phase Equilib. 2015, 403, 78–84. [Google Scholar] [CrossRef]
  33. Ushiki, I.; Ota, M.; Sato, Y.; Inomata, H. Measurements and Dubinin–Astakhov correlation of adsorption equilibria of toluene, acetone, n-hexane, n-decane and methanol solutes in supercritical carbon dioxide on activated carbon at temperature from 313 to 353K and at pressure from 4.2 to 15.0MPa. Fluid Phase Equilib. 2013, 344, 101–107. [Google Scholar] [CrossRef]
  34. Aschenbrenner, O.; Dahmen, N.; Schaber, K.; Dinjus, E. Adsorption of Dimethyl(1,5-cyclooctadiene)platinum on Porous Supports in Supercritical Carbon Dioxide. Ind. Eng. Chem. Res. 2008, 47, 3150–3155. [Google Scholar] [CrossRef]
  35. Xing, H.; Su, B.; Ren, Q.; Yang, Y. Adsorption equilibria of artemisinin from supercritical carbon dioxide on silica gel. J. Supercrit. Fluids. 2009, 49, 189–195. [Google Scholar] [CrossRef]
Figure 1. A schematic diagram of the mixed retention mechanism in a silica-packed column. The interaction in the green dashed line contributes to k c in Equation (11) and the interaction in red dashed line contributes to k 0 .
Applsci 11 07106 g001
Figure 2. Retention factors of phenol on different silicas and model fittings according to DIM-Lin-kc. SFC conditions: 200 bar, 40 °C, injection volume 2 μL, flow rate 2 mL min−1.
Applsci 11 07106 g002
Figure 3. Retention factors of various solutes on SIL-60 and model fittings according to DIM-Lin-kc. SFC conditions: 200 bar, 40 °C, injection volume 2 μL, flow rate 2 mL min−1.
Applsci 11 07106 g003
Figure 4. Retention factors of phenol and naproxen on SIL-Aerogel and model fittings according to DIM-Lan-kcK’. SFC conditions: 200 bar, 40 °C, injection volume 2 μL, flow rate 2 mL min−1.
Applsci 11 07106 g004
Figure 5. Retention factors of toluene on SIL-60 and SIL-Aerogel and model fittings according to DIM-Lan-kcK’. SFC conditions: 200 bar, 40 °C, injection volume 2 μL, flow rate 2 mL min−1.
Applsci 11 07106 g005
Figure 6. Retention factors of various solutes on SIL60 and SIL-Aerogel. SFC conditions: 200 bar, 40 °C, injection volume 2 μL, flow rate 2 mL min−1, modifier (methanol) fraction at 0.1–30 vol.%. The dashed straight lines were plotted to guide the eyes at low coverages.
Applsci 11 07106 g006
Figure 7. Retention factors of ketoprofen on SIL-Aerogel at different temperatures and model fittings according to MRM-Lan-kcKM. SFC conditions: 191 bar for 318.15 K, 217 bar for 323.15 K, 242 bar for 328.15 K, and 268 bar for 333.15 K, flow rate 2 mL min−1, modifier (methanol) fraction at 0.8–7.5 vol.%.
Applsci 11 07106 g007
Figure 8. Estimated k 0 values of ketoprofen on SIL-Aerogel at different temperatures. Method DIM-Lan-kcK, DIM-Lan-kcK’, and MRM-Lan-kcKM were applied following the procedure explained in Section 4.1 and Section 4.2.
Applsci 11 07106 g008
Table 1. Textural properties of the porous materials employed as stationary phases.
ColumnKromasil®
60-5-SIL
Kromasil®
100-5-SIL
Kromasil®
300-5-SIL
Aerogel
AbbreviationSIL-60SIL-100SIL-300SIL-Aerogel
* Particle size, μm6.26.16.2 17.4
** Mean pore diameter, nm462327
** Specific surface area, m2 g−1540320110858
** Specific pore volume, cm3 g−11.10.90.95.2
* Measured by electrical sensing zone particle analyzer and scanning electron microscope. ** Measured by N2-adsorption/desorption with Nova 3000e surface area and pore analyzer (Quantachrome instruments); BET and BJH methods were employed for surface area and pore volume, respectively.
Table 2. Description of employed methods: each method is a combination of a model (DIM or MRM), adsorption isotherm, and a set of fitted parameters.
MethodEquation UsedInput DataFitted Parameters
DIM-Lin-kc lg k = lg k 0 A c m o d k , c m o d A ,   k 0
DIM-Lan-kcK lg k = lg k 0 + B K e q , L c m o d 1 + K e q , L c m o d a c m o d k ,   c m o d ,   K e q , L B , a , k 0
DIM-Lan-kc lg k = lg k 0 + B K e q , L c m o d 1 + K e q , L c m o d a c m o d k , c m o d B , a , k 0 , K e q , L
DIM-Lan-kcK’ lg k = lg k 0 + B K e q , L c m o d 1 + K e q , L c m o d a c m o d k ,   c m o d ,   K e q ,   L c o r r B , a , k 0
MRM-Lan-kcK k = k 0 + K e q , L k c 1 + M c m o d 1 + K e q , L c m o d 1 + M c m o d k ,   c m o d ,   K e q , L k 0 , k c , M
MRM-Lan-kcKM k = k 0 + K e q , L k c 1 + M c m o d 1 + K e q , L c m o d 1 + M c m o d k ,   c m o d ,   K e q , L , M k 0 , k c
Table 3. Comparison of methods based on DIMs an MRMs.
MethodNumber of Fitting ParametersRange of R2Experimental Efforts
DIM-Lin-kc2 ( A and k 0 )0.74–0.94Low
DIM-Lan-kcK3 ( B , α , and k 0 )0.83–1.00High
DIM-Lan-kc4 ( B , α , k 0 and K e q , L )0.87–1.00Low
DIM-Lan-kcK’3 ( B , α , and k 0 )0.84–1.00Low
MRM-Lan-kcK3 ( k 0 , k c , M )(0.86) *–1.00High
MRM-Lan-kcKM2 ( k 0 , k c )0.69–1.00Low
* 0.86 is the lowest R2 among those with successful fitting. However, several fittings failed by this method.
Table 4. Regression results for DIMs.
Stationary PhaseSoluteDIM-Lin-kcDIM-Lan-kcKDIM-Lan-kcDIM-Lan-kcK’
k 0 R2 k 0 K e q , L R2 k 0 K e q , L R2 k 0 K e q ,   L c o r r R2 k 0 D I M L a n k c K / k 0 D I M L a n k c K
SIL-60Phenol4.4 ± 0.30.926.2 ± 0.216.50.998.1 ± 0.162 ± 21.005.9 ± 0.211.70.990.96
Naproxen25 ± 50.7436 ± 40.93330 ± 19170 ± 41.0032 ± 40.910.91
Nicotinamide42 ± 50.92304 ± 161.00(1.4 ± 0.2) × 103 40 ± 31.00219 ± 141.000.72
Rosmarinic acid483 ± 810.94(1.02 ± 0.08) × 104 1.00(2.9 ± 1.2) × 105 45 ± 41.00(5.6 ± 0.4) × 103 1.000.55
Toluene0.20.890.20.970.2308 ± 1310.980.20.971.00
SIL-100Phenol3.0 ± 0.20.894.1 ± 0.111.20.995.6 ± 0.158 ± 21.004.1 ± 0.111.10.991.01
SIL-300Phenol0.9 ± 0.10.781.15.30.971.424 ± 31.001.14.60.970.99
SIL-AerogelPhenol2.0 ± 0.20.902.6 ± 0.17.10.983.9 ± 0.163 ± 31.002.3 ± 0.111.90.960.90
Naproxen96 ± 230.93139 ± 81.00641 ± 17826 ± 31.00185 ± 101.001.33
Toluene0.10.740.10.830.1433 ± 4870.870.10.841.05
Table 5. Regression results for MRMs.
Stationary PhaseSoluteMRM-Lan-kcKMRM-Lan-kcKM
k 0 M K e q , L R2 k 0 M K e q , L R2 k 0 M R M L a n k c K M / k 0 D I M L a n k c K
SIL-60Phenol7.6113 ± 1316.51.008.3 ± 0.1150.020.01.001.35
Naproxen---31.70.900.89
Nicotinamide---277 ± 100.990.91
Rosmarinic acid---915 ± 2760.690.09
Toluene0.2184 ± 410.980.20.981.03
SIL-100Phenol5.4 ± 0.2135 ± 911.21.005.6 ± 0.1150.020.01.001.39
SIL-300Phenol1.7 ± 0.2191 ± 425.30.981.5 ± 0.1150.020.00.971.35
SIL-AerogelPhenol3.8 ± 0.1152 ± 107.11.003.78 ± 0.04150.020.01.001.47
Naproxen---155 ± 110.971.12
Toluene0.09 ± 0.01200 ± 1390.860.09 ± 0.010.860.99
Publisher’s Note: MDPI stays neutral with regard to jurisdictional claims in published maps and institutional affiliations.

