
Radon Levels of Water Sources in the Southwest Coastal Region of Peninsular Malaysia
by
 , and
, and
Noor Fadilla Ismail
1,2, 
Suhairul Hashim
2,3,*,
Mohamad Syazwan Mohd Sanusi
2,
Ahmad Taufek Abdul Rahman
4,5 and
David Andrew Bradley
6,7 1
Health Physics Research Group, Department of Radiation Safety and Health, Malaysian Nuclear Agency, Bangi, Kajang 43000, Selangor, Malaysia
2
Department of Physics, Faculty of Science, Universiti Teknologi Malaysia, Skudai 81310, Johor, Malaysia
3
Ibnu Sina Institute for Scientific and Industrial Research (ISISIR), Universiti Teknologi Malaysia, Skudai 81310, Johor, Malaysia
4
Centre of Astrophysics and Applied Radiation, Institute of Science, Universiti Teknologi MARA, Shah Alam 40450, Selangor, Malaysia
5
School of Physics and Material Studies, Faculty of Applied Sciences, Universiti Teknologi MARA, Shah Alam 40450, Selangor, Malaysia
6
School of Engineering Technology, Sunway University, Bandar Sunway 47500, Selangor, Malaysia
7
Department of Physics, University of Surrey, Guildford, Surrey GU2 7XH, UK
*
Author to whom correspondence should be addressed.
Appl. Sci. 2021, 11(15), 6842; https://doi.org/10.3390/app11156842
Submission received: 4 July 2021
/
Revised: 21 July 2021
/
Accepted: 22 July 2021
/
Published: 25 July 2021
(This article belongs to the Special Issue Radiation Protection in Clinical and Environmental Setting)
Abstract
:Across populations, the dominating source of public exposure to radiation is radon gas. In the present study, we aimed at determining the concentration of radon in water sources from the southwest coastal region of Peninsular Malaysia. A total of 27 water samples were taken from various water sources which included groundwater, as well as hot spring, lake, river, seawater, and tap water; the radon concentrations were measured using a RAD7 portable radon detector. The radon concentrations ranged from 0.07 ± 0.12 to 187 ± 12 Bq l−1, with an average of 21 ± 12 Bq l−1. The highest concentration was found in hot spring water, with an average concentration of 99 ± 6 Bq l−1, while the lowest concentration was found in tap water, with an average concentration of 1.95 ± 0.61 Bq l−1. The average concentrations of radon for all categories of sampled water were below the 100 Bq l−1 WHO guidance level for safe drinking water. According to the ICRP effective dose conversion factor and UNSCEAR (2000), the total effective dose from the summation of inhaled and imbibed water was calculated from the aqueous radon concentrations, with an average effective dose of 4.45 µSv y−1, well within the WHO safe drinking water guideline value of 100 µSv per year. The results of this study could support the efforts of authorities and regulators who are responsible for controlling and strategizing to ensure public safety against radon exposures.
1. Introduction
Radon (222Rn), a radioactive gas with a half-life of 3.82 days, is a prominent dose conveying product of the 238U decay process. Radon is ubiquitous in soil and water; its presence in the earth’s crust varies according to the underlying geology, forming a source of internal and external exposure to all life on earth [1]. It is a gas, and hence highly mobile; it can move quickly from rocks and soil, through to air and water.
For the human populace of Malaysia, primary water sources are derived from reservoirs contained by dams and from groundwater. Highly volatile and readily dissolved and released from water, in the absence of aeration prior to supply, radon accumulates in water [2]. Since access to safe water supplies is a basic human right, it is worthwhile noting that the presence of radon can have an impact on health. In numerous situations, such as showering, washing clothes, and flushing toilets, radon is released from the water and mixed with indoor air. Accordingly, radon from water contributes to the total risk associated with radon in indoor air, and its radioactive decay products are exposed to sensitive cells in the stomach, and other organs, once absorbed into the bloodstream [3].
Generally, when radon decays post inhalation and ingestion, the released energy is at levels capable of creating damage in various living tissues, for example, the formation of free radicals that can lead to unnatural reproduction of cells and consequent risks of malignant disease. A study has claimed that radon inhalation dissolved in and released from water intended for human consumption accounts for 89% of an individual’s estimated cancer risk [4]. Accordingly, radon measurement plays a vital role in community health assessment, and awareness of radon levels in household water supplies is critical for protecting humans against the effects of exposure.
Radon gas and progeny concentration surveys are of global interest, undoubtedly connected with the formal recognition, in 1988, by the World Health Organization (WHO) that, in many countries, radon was the second leading cause of lung cancer after tobacco smoke [5]. For this reason, radon has been classified as a group 1 carcinogen by the International Agency for Research on Cancer (IARC), a branch of the WHO [6,7]. For present interests, elevated concentrations of radon in drinking water have been linked with radiation doses of concern to the stomach lining [8], with a potential significant risk for stomach and gastrointestinal cancer [9].
Various radon levels have been introduced to protect human health from exposure to radon from drinking water consumption. For example, the U.S. Environmental Protection Agency (USEPA) has set a reference level of maximum contaminant level (MCL) for radon in drinking water of 300 pCi l−1 or 11.1 Bq l−1 [10]. Similarly, Euroatom has recommended a reference limit for radon concentration in drinking water of 11 Bq l−1 [11]. Conversely, in 2004, in the third edition of the WHO Guidelines for Drinking-Water Quality, the WHO’s guideline for radon concentration level is 100 Bq l−1 [12]. The WHO recommendation links to a committed effective dose equal to 100 μSv y−1 for consumption of drinking water [12,13]. If the radon concentration exceeds 100 Bq l−1, the WHO recommends that treatment of the water source should be undertaken to reduce the radon levels to well below 100 Bq l−1 [12].
In the present study, the aim was to determine the concentrations of radon gas in various water sources from the southwest coastal region of Peninsular Malaysia, specifically, the states of Negeri Sembilan and Malacca. From these measurements, the annual effective dose from the consumption of radon in water via inhalation and ingestion were calculated, and the results were compared with the WHO recommended value as well as those of several other countries.
2. Materials and Methods
2.1. Study Area
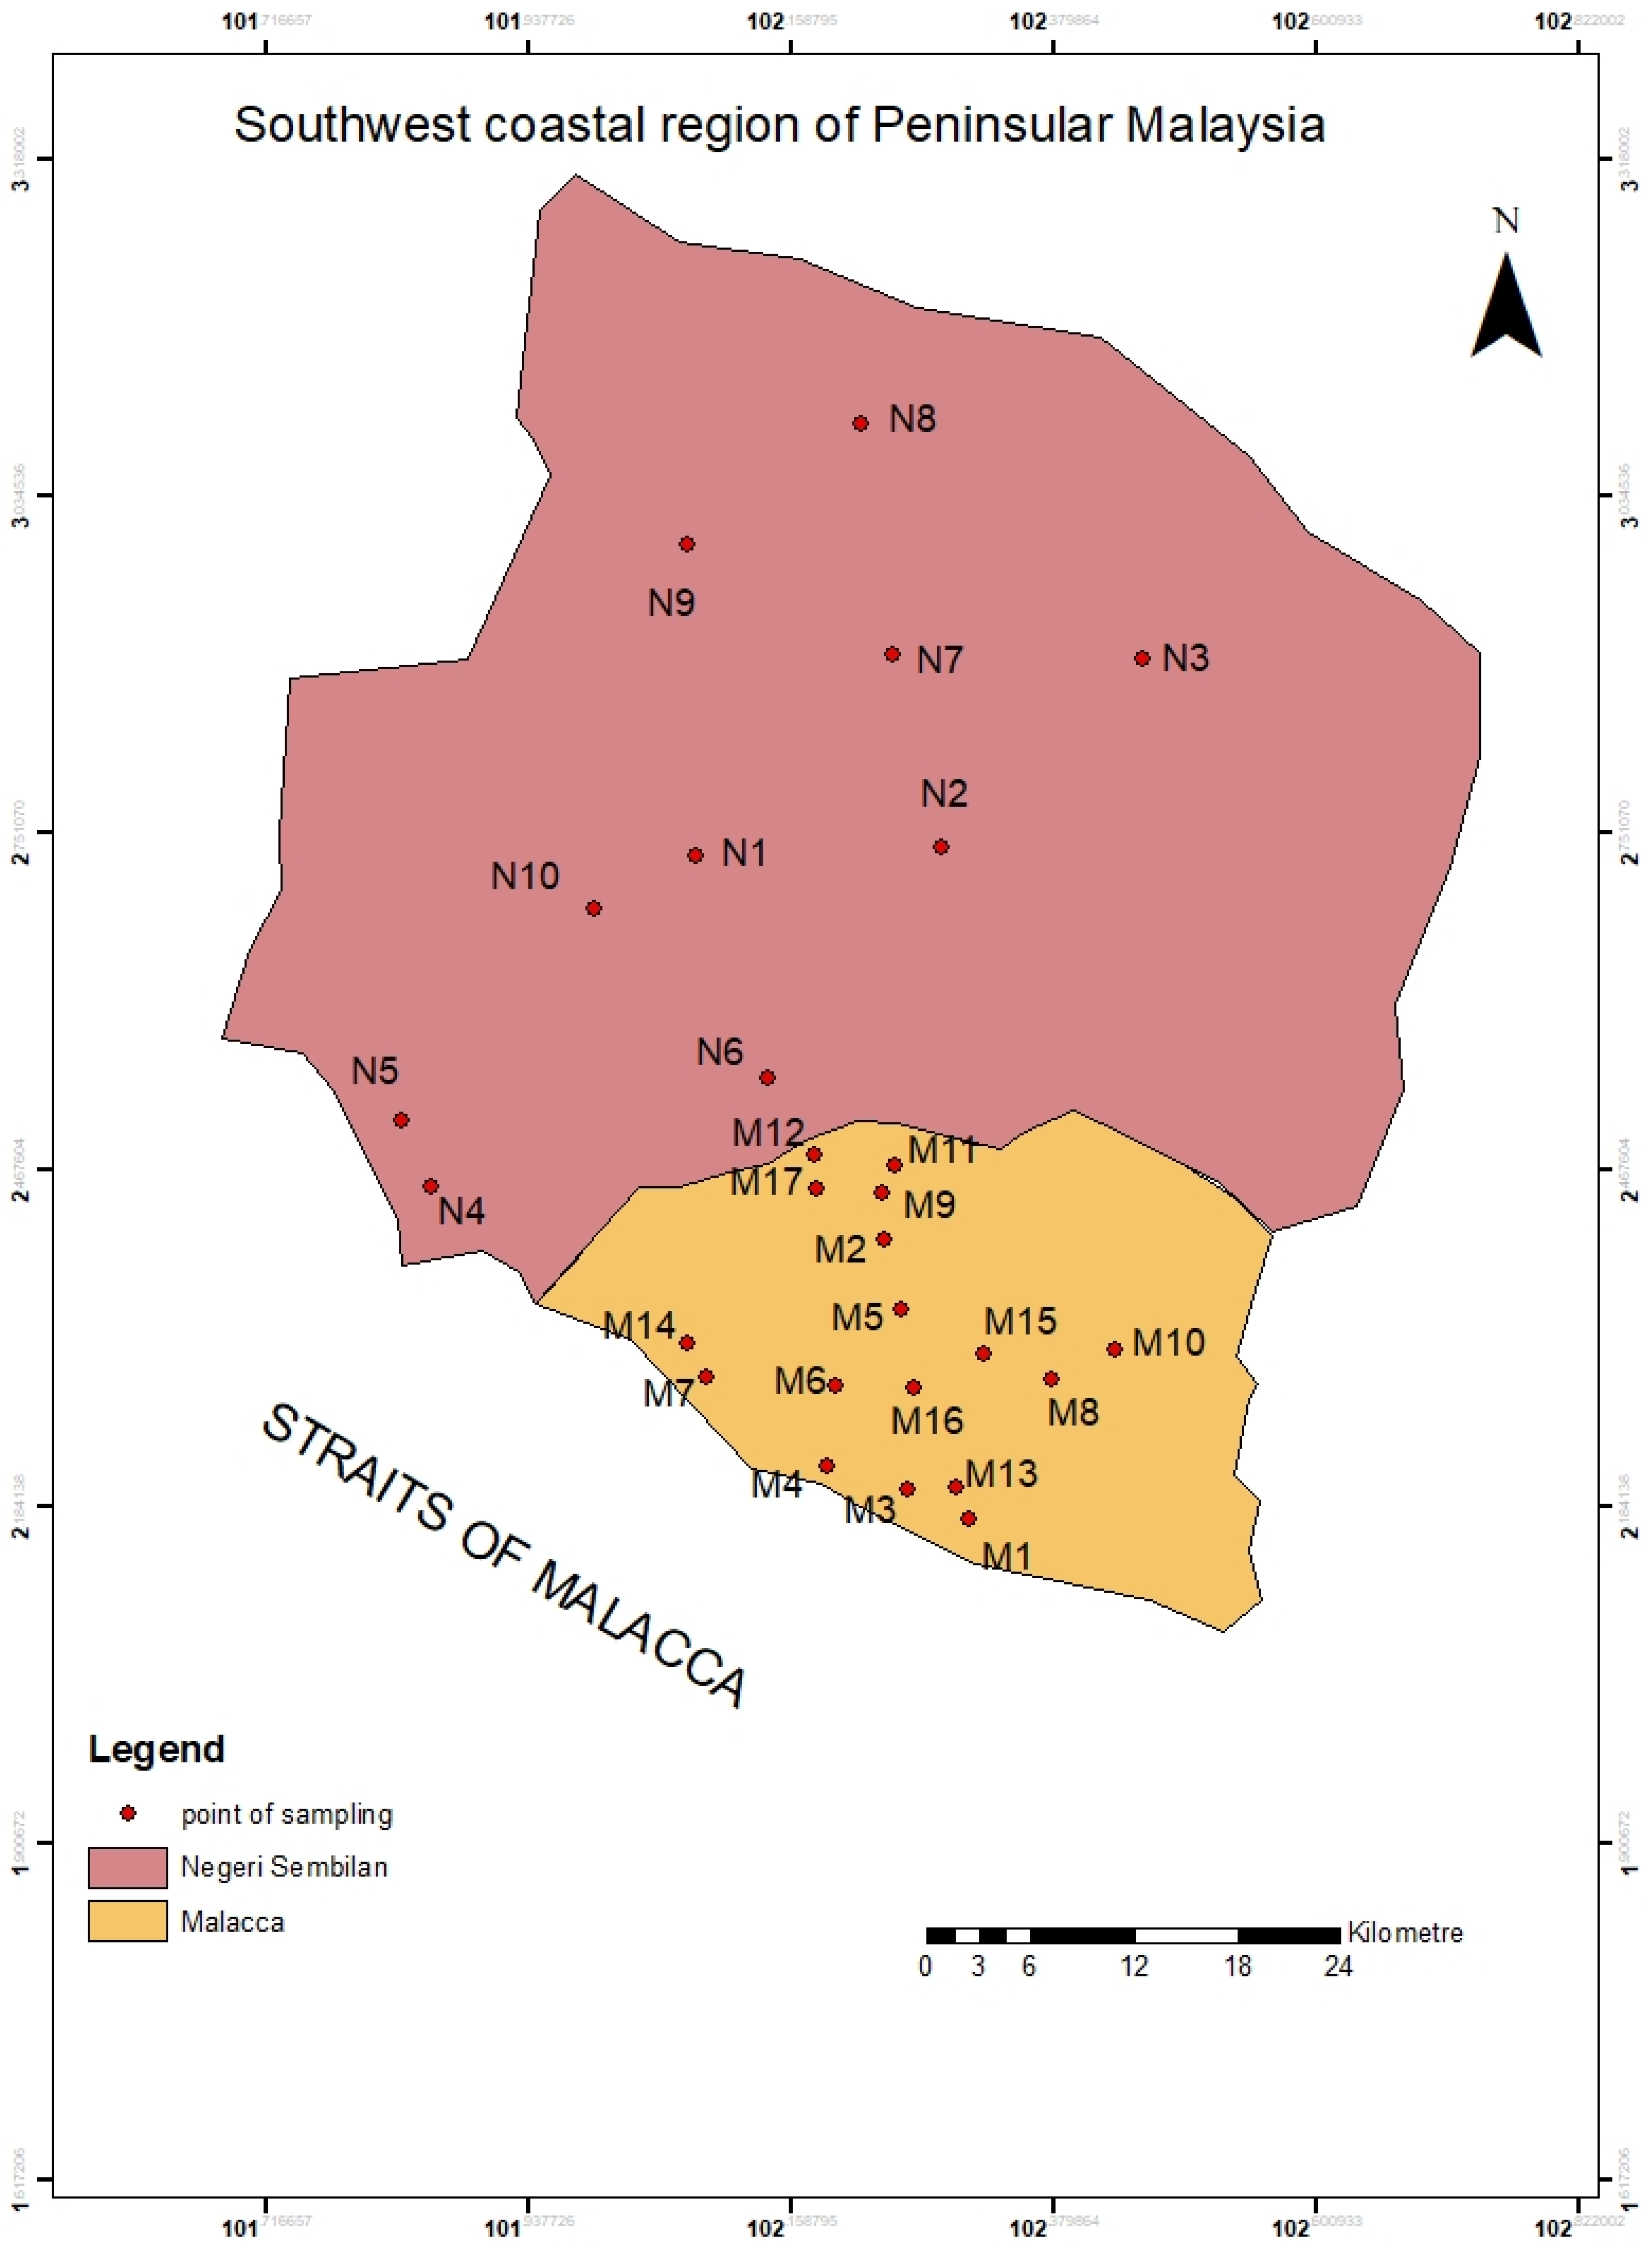
This 2019 study was conducted in the southwest coastal region of Peninsular Malaysia, a region located along the Straits of Malacca; the total study area was about 8350 km2. In the study area, various water sources were identified for sampling, including lake water, sea water, hot spring water, river water, groundwater, and tap water. A total of 27 samples of water were collected from the different locations; the coordinates of each sampling area were determined using a Global Positioning System (GPS). The distribution of the sampling locations is shown in Figure 1.
2.2. Radon Activity Measurements
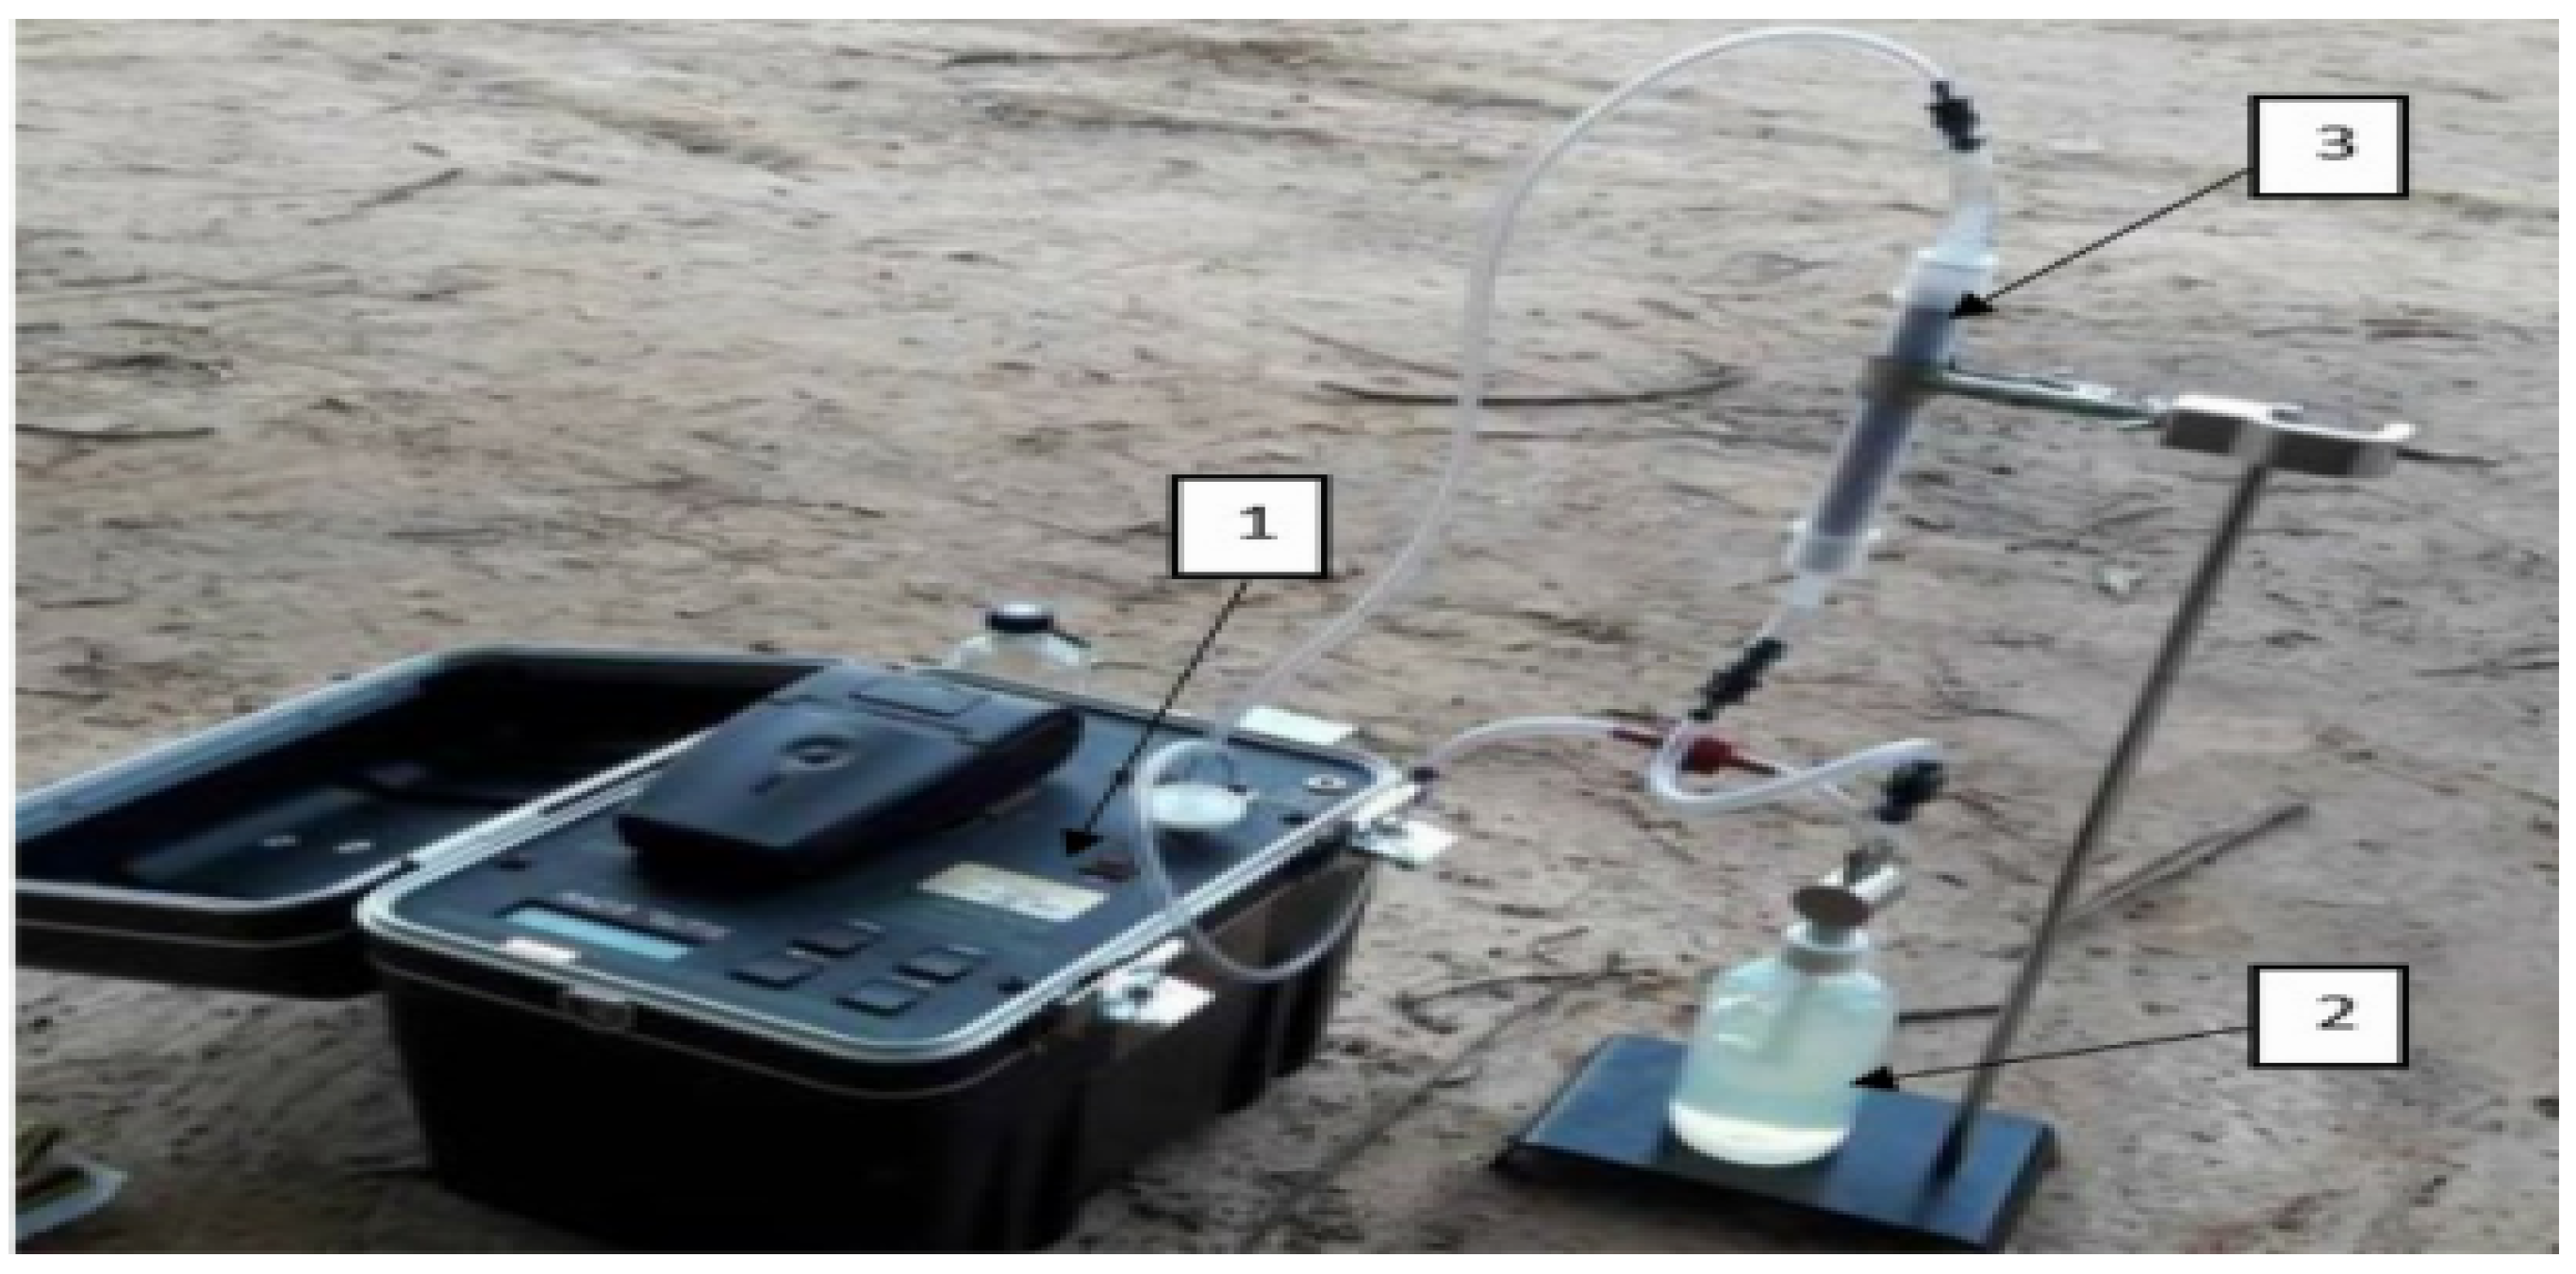
Direct measurement of radon concentrations in the water samples was conducted at the sampling sites using a RAD7 portable radon detector (DURRIDGE Company Inc., Billerica, MA, USA) complete with a set of RAD7 H2O accessories. The RAD7 equipment used for the measurements included: the RAD7 electronic detector, a 250 mL water vial with an inserted aerator, and the desiccant tube supported by a retort stand, as shown in Figure 2.
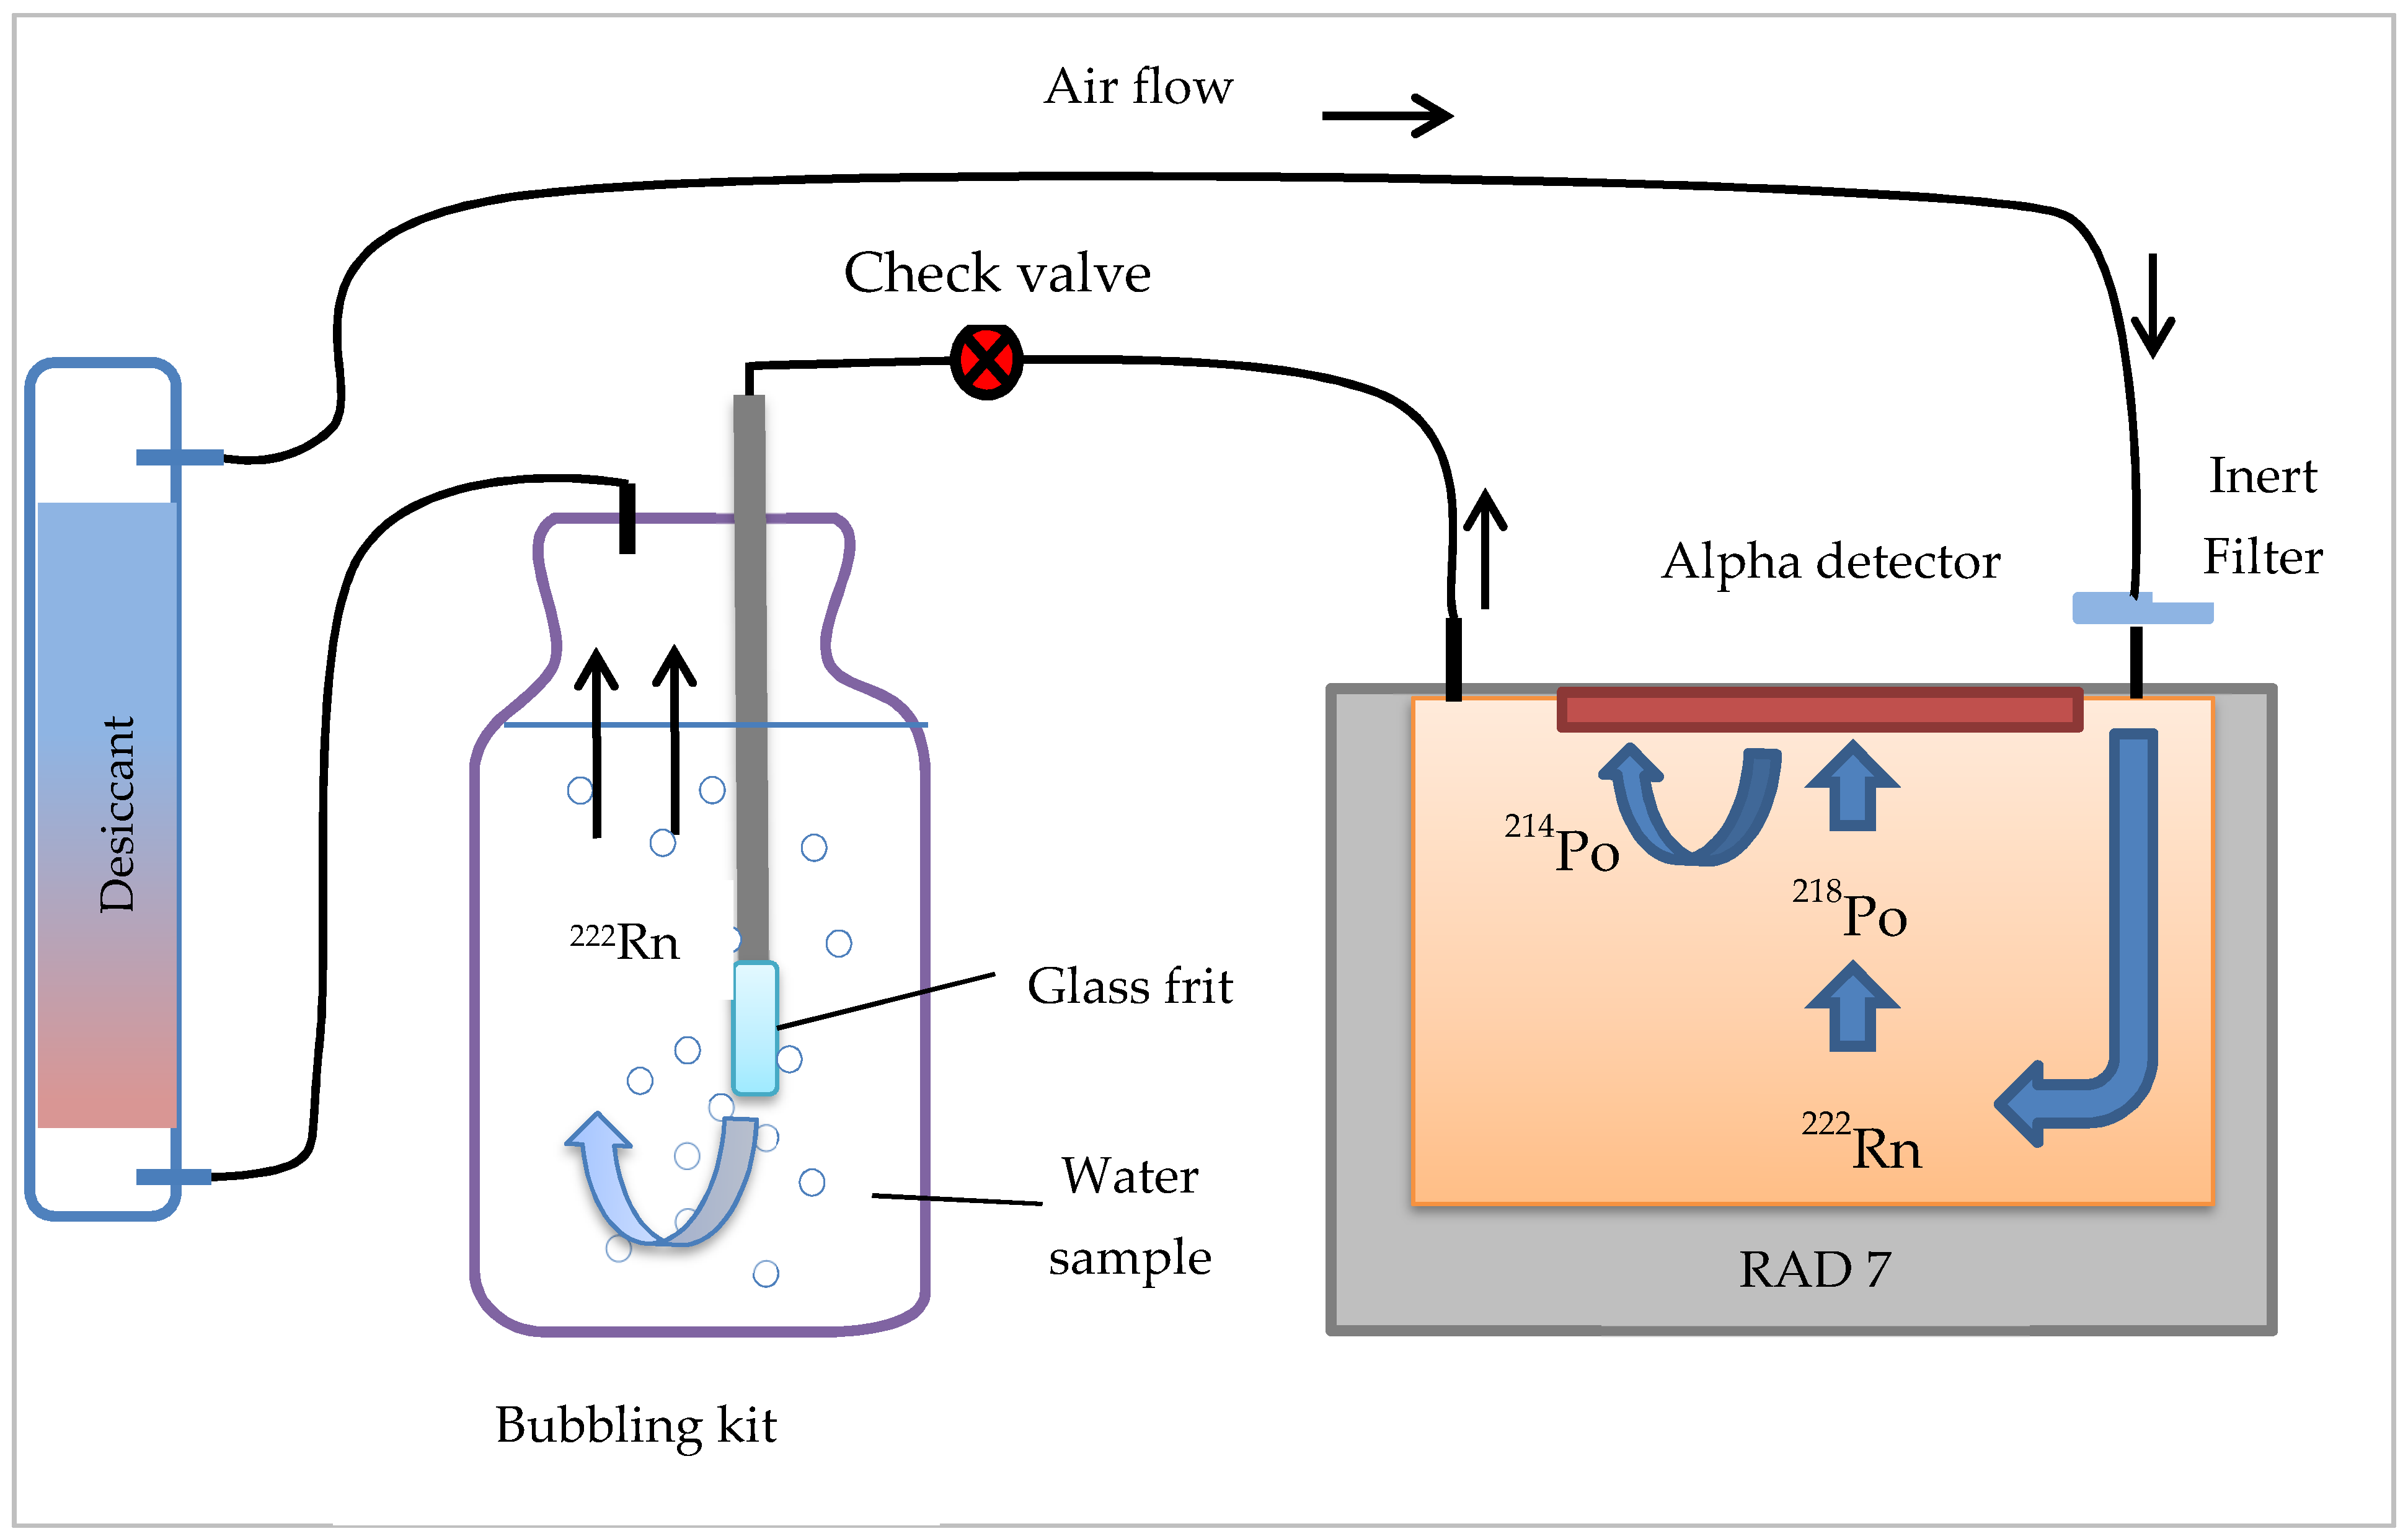
For each sample, a completely filled vial was carefully sealed to avoid loss of radon or water, and measurements were performed using a closed-circuit technique, a closed-loop aeration design in which the air and water volumes are constant and independent of flow rate. Accordingly, no decay correction was required [14]. During the aeration phase, air was recirculated through the water, continuously extracting the radon gas until a state of equilibrium was achieved, obtained in approximately 5 min. In the equilibrium state, no more radon could be removed from the water sample. The working principle of the schematic diagram of the RAD7 detector in a closed-circuit setup is presented in Figure 3.
The RAD7 radon detector was operated followed the protocol designated as Wat 250 and the process was starting with a 5 min aeration phase. During this phase, the extraction efficiency (the percentage of radon removed from the water to the air-loop) was high, at approximately 94% for a 250 mL sample. The exact value of extraction efficiency depends somewhat on the ambient temperature but is almost always well above 90% [15]. During the aeration phase, the presence of thoron gas from the water to the air-loop is neglected due to its short half-life and small diffusion length. The concentration of thoron is expected to decrease very sharply as one moved away from its source [7]; however, if the area has high background radiation it needs special attention to measure radon gas, such as the areas in China, India, and Brazil with thorium rich soils [16]. A previous study, in 2020, successfully measured thoron in surface waters using a novel method for assessing the sensitivity of a mobile thoron-in-water detection setup, thus, achieving quantitative measurements of thoron-in-water concentration in the field using an experimental approach of RAD AQUA accessories coupled with a RAD7 detector [17]. The measurement technique was very useful and could be applied for future study in the measurement of radon and thoron concentrations at the locations with high background radiation, for example, in mines.
The RAD7 radon detector makes use of alpha spectrometry to detect radon concentrations in the air, collecting positively charged carriers from alpha particle to form the electric signal; moreover, allowing radon and thoron (220Rn) to be distinguished [14,15]. In particular, the high electrical field within the active surface of the RAD7 detector attracts the positively charged particles from the polonium daughters, 218Po at 6.00 MeV and 214Po at 7.76 MeV, and converts them to electrical signals that act as a measurement of radon concentration in air. At the end of the analysis, the RAD7 results from the sample analysis are provided in terms of radon concentration, in units of Bq m−3 or Bq l−1. The RAD7 minimum detectable activity (MDA) concentration is 0.004 Bq l−1 [18]. Before each measurement is carried out, the RAD7 detector needs to be set up in purging mode for 10 min to remove high humidity and radon in the detector system.
2.3. Estimation of Annual Effective Dose
The annual mean effective dose for ingestion ∑Wing and ingestion ∑Winh were calculated from the experimentally determined values of radon concentrations in water (CRnW) by using Expressions (1) and (2), respectively, as given in [14,19,20]:
where ∑Wing and ∑Winh are the effective doses for ingestion and inhalation (mSv y−1), respectively; CRnW is the measured radon concentration in water (Bq l−1); CW is the weighted estimate of water consumption (60 L y−1); EDC is the effective dose coefficient per bacquerel of radon concentration for ingestion (3.5 nSv Bq−1); 10−6 is the conversion of nano-to-mili; RAW is the ratio of radon-in-air to radon-in-tap water (10−4); F is the equilibrium factor for radon and its progeny (0.4); O is the global average of indoor occupancy factor (7000 h y−1); and DCF is the dose conversion factor for radon exposure, 9 nSv h−1 Bq−1 m3 [20].
3. Results and Discussion
In this study of 27 samples of water taken from different sources, the measured radon concentrations are given in Table 1, with an average value of 21.21 ± 1.67 Bq l−1. The lowest radon concentration in water was recorded for the sampling location M15 (Durian Tunggal, Malacca), while the highest concentration of radon was recorded from the sampling location N6 (Chengkau, Negeri Sembilan). It is suggested that the variations in concentration are affected by factors including uranium and associated radium contents in the aquifer, the nature of the basement rocks, the solubility and mobility of parent radionuclides in the study area, climatic conditions, transport processes, depth of aquifers, as well as various other hydrogeological conditions [4,14,21,22,23].
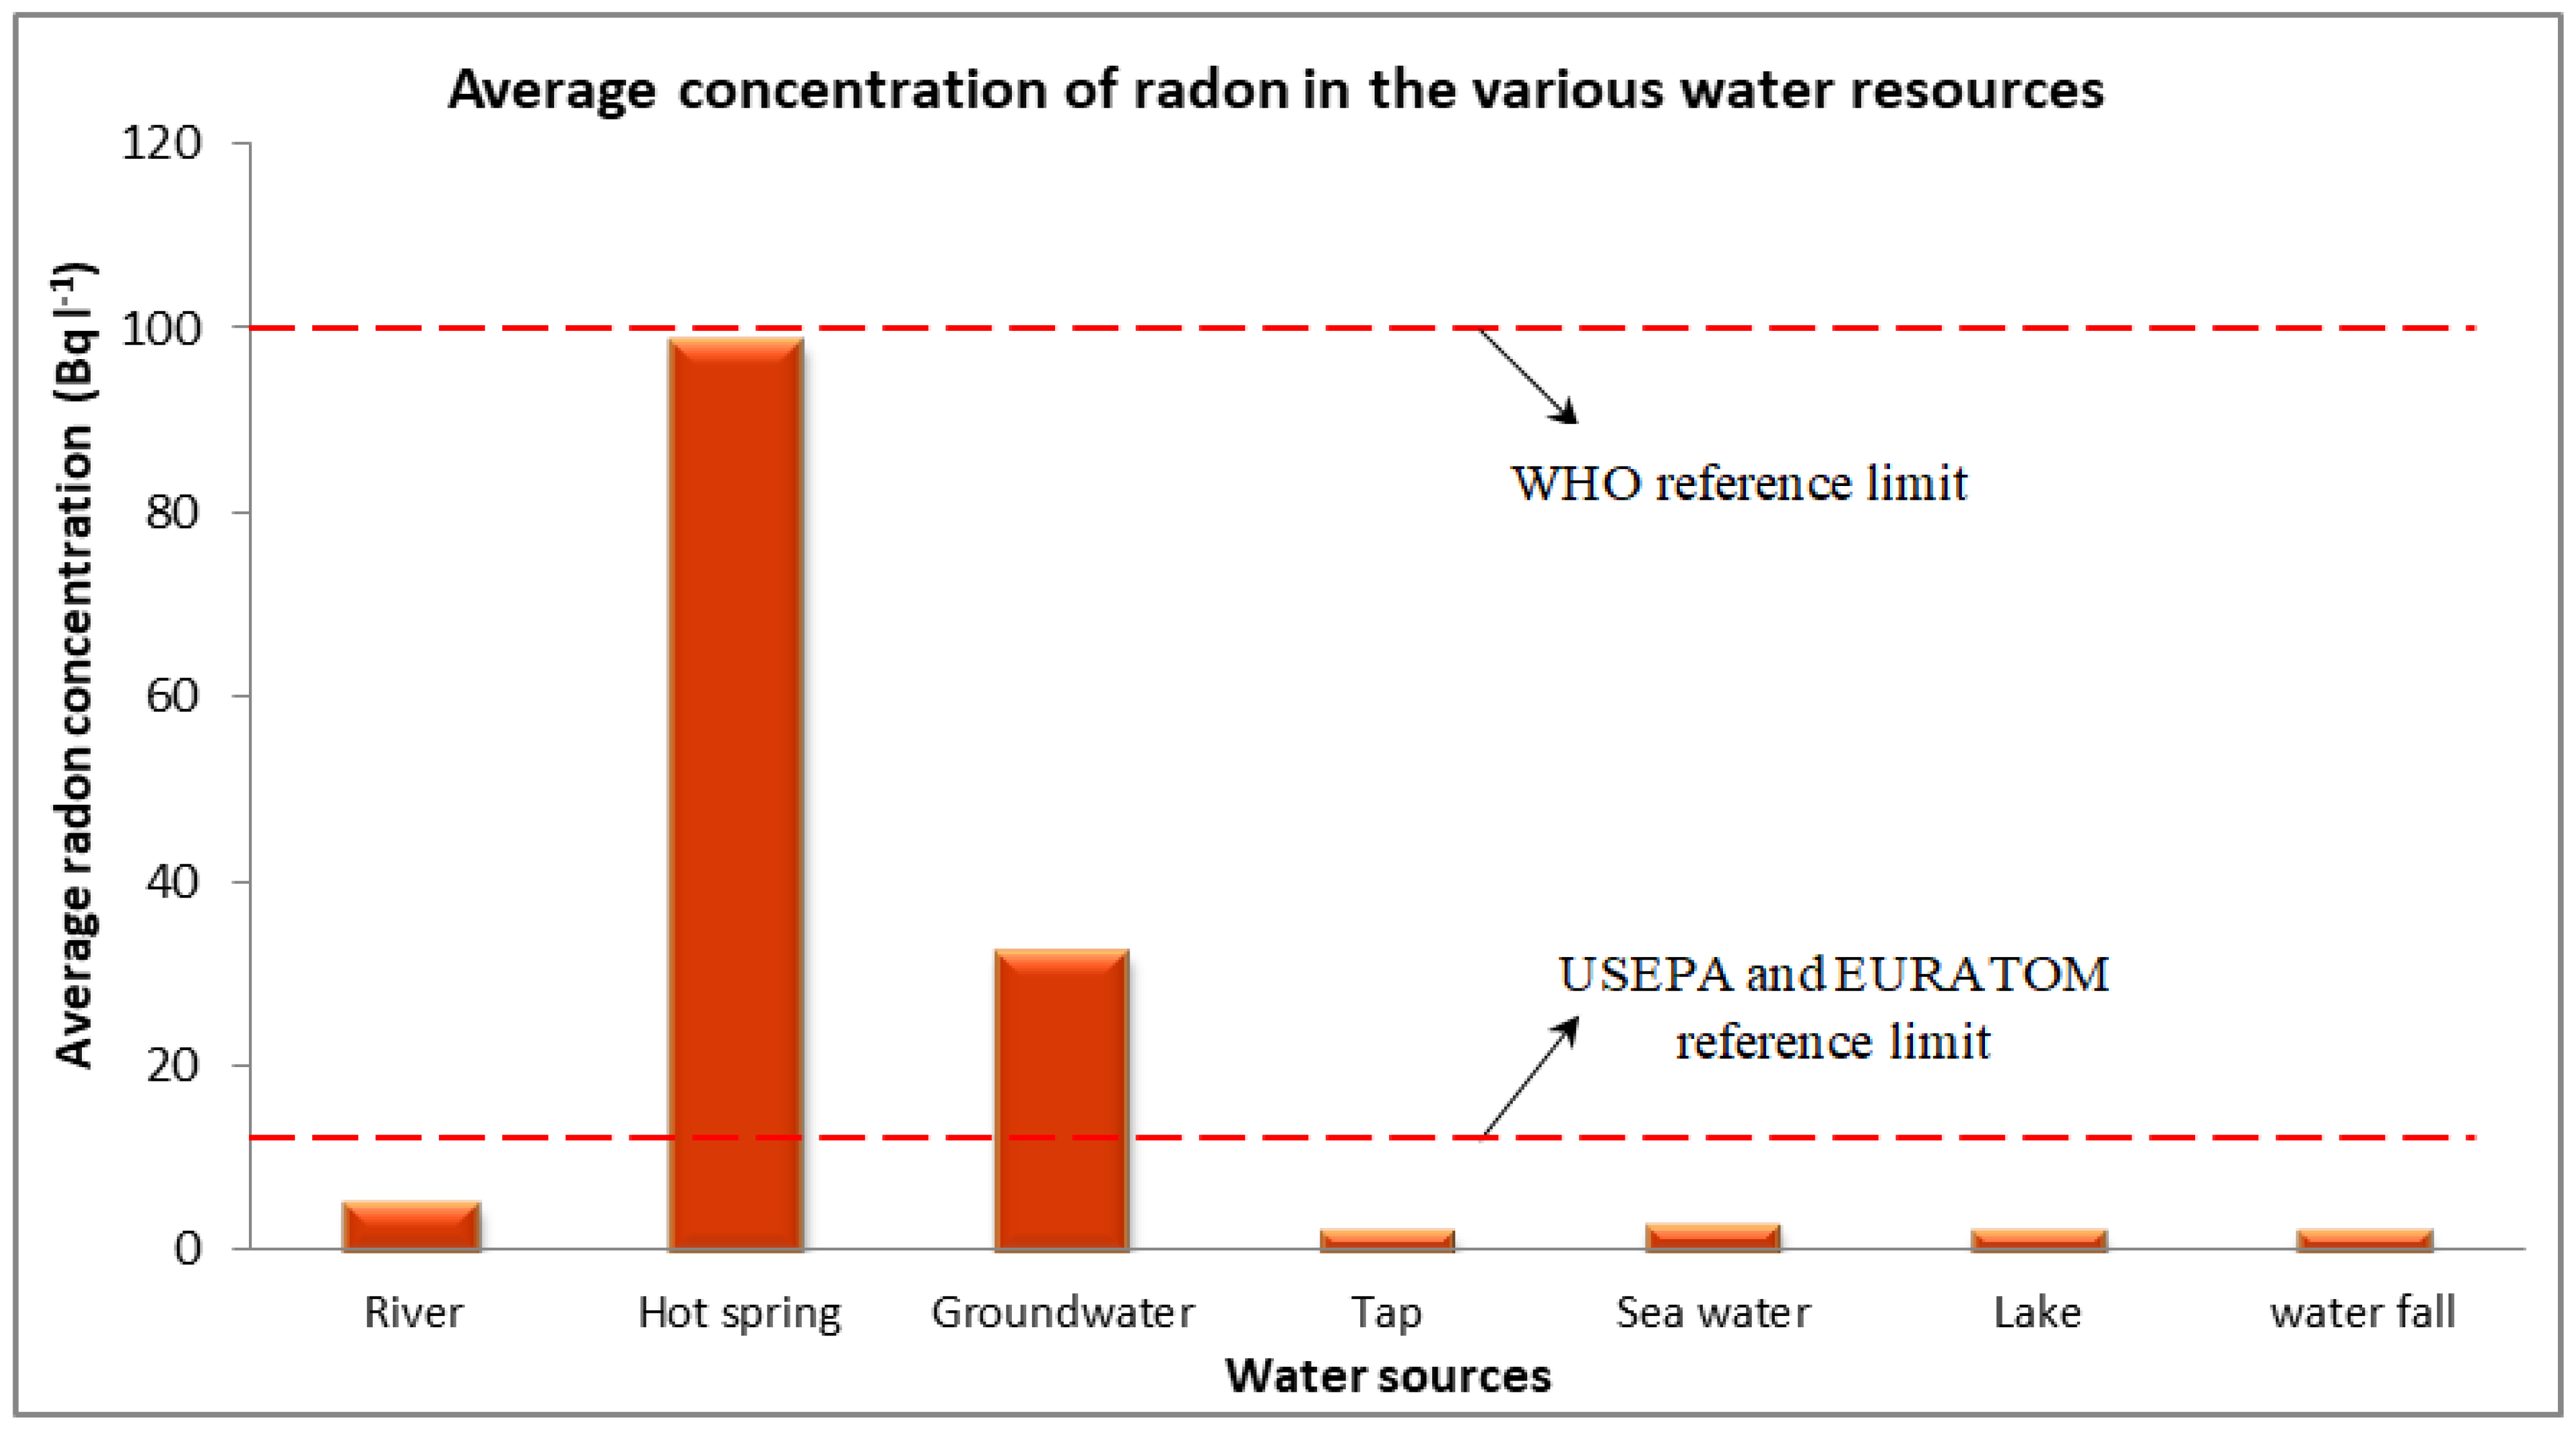
A further analysis of radon concentration was compiled based on the categories of water sources, and the results are displayed in Figure 4. The average radon concentration in hot spring water was the highest, i.e., 98.56 ± 5.88 Bq l−1, followed by groundwater, with an average radon concentration of 32.36 ± 1.8 Bq l−1. The lowest average radon concentration was 1.95 ± 0.61 Bq l−1, recorded for tap water.
For the hot spring water, the radon concentration is the lowest, albeit of a similar order to that reported in Thailand, Rachaburi Province, which was from 95 to 154 Bq l−1 [24], with differences in geological formation and soil types, i.e., Rachaburi being of igneous and sedimentary types [25] while the geological formation in the present study area is triassic, dominated by sedimentary rocks. Elsewhere, in northern Venezuela, the concentration of radon in hot spring water has been reported to be in a wider range, i.e., from 1 to 560 Bq l−1 [26], the various influencing factors being as discussed herein as well as elsewhere [27,28,29].
In this study, the groundwater radon concentration is greater than the average radon concentration recorded by a study conducted in Rajasthan that also used a RAD7 detector [30]. In another study conducted in Gadau, Nigeria [14], the radon concentration ranged from 4.92 to 82.89 Bq l−1 with a mean value of 38.3 Bq l−1; potential factors, additional to those previously alluded to, included the minerals derived from the aquifer rocks such as uranium mineralization in granites, gneisses, and quartzite rocks, as well as the presence of faults and shears at the study areas [30,31].
In regard to the relatively low radon concentration for tap water, in this study, the averaging was 1.95 ± 0.61 Bq l−1 as compared with the average of 5.37 ± 0.58 Bq l−1 reported in Sungai Petani, Kedah [32] and 10.82 Bq l−1 reported in Turkey [22]. The lower radon concentration values in tap water are expected, herein, since the water was mainly comprised of surface water such as in lakes, rivers, and reservoirs with the radon easily released into the air. Additionally, in many situations, water is supplied to residential housing from storage tanks, and the length of pipeline should also be taken into consideration for understanding why the radon in tap water may be low as compared with other sources.
The results obtained in this study were compared with those from other locations in Malaysia and other parts of the world, as shown in Table 2. Notably, in this study, the average radon concentrations of all samples did not exceed the WHO guidelines of 100 Bq l−1 as a safe limit for drinking water [7,21,32,33]. Nevertheless, the radon concentrations in the water samples from the hot spring water and groundwater were above those recommended for drinking water by the United States Environmental Protection Agency (USEPA); however, the other water sources were all below the recommended limit of 11.1 Bq l−1 [13,15,34].
The total annual effective doses due to ingestion and inhalation of radon in drinking water were assessed using the procedures recorded in the UNSCEAR (2000). Table 3 shows the calculated annual effective doses based on the analyzed samples of water taken from each of the sampling sites to the population. The annual effective dose for an adult due to radon in drinking water for ingestion and inhalation varied from practically negligible (below limits of detection) to 39.167 µSv y−1 and from practically negligible to 0.47 µSv y−1, respectively. In this study, the average dose calculated from the intakes of radon in drinking water is extremely low at 0.06 µSv y−1 via inhalation and 4.45 µSv y−1 from ingestion. Thus, the total annual effective dose from both inhalation and ingestion ranged from 0.02 to 39.64 µSv y−1, with an average of 4.51 µSv y−1.
In Table 4, the annual effective dose for ingestion of radon from drinking water in others states and countries ranged from 0.1 to 65200 μSv y−1 and the recorded average was from 1.76 to 3920 μSv y−1. Elsewhere, the annual effective dose for ingestion of radon ranged from 0.01 to 56,600 μSv y−1, with the recorded average from 0.1 to 570.6 μSv y−1. The average total of annual effective dose from the consumption of drinking water in this study is relatively low as compared with that observed in other countries, including that reported in Iran at 6.4 μSv y−1 [9], Nigeria at 8.14 μSv y−1 [14], Himalayan region at 2130 μSv y−1 [19], Iraq 450 μSv y−1 [37], and Turkey at 5.848 μSv y−1 [22].
The WHO has recommended that the safe limit for the annual effective dose received from radon intakes in drinking water is 100 μSv y−1 [40] as compared with the total annual effective dose from the studied samples that was lower than the reference dose specified by the WHO.
4. Conclusions
Overall, the measured radon concentration levels in various water sources from the southwest coastal region of Peninsular Malaysia, specifically, the states of Negeri Sembilan and Malacca, are low and safe for drinking water; the concentration of radon measurements ranged from 0.07 ± 0.12 to 186.5 ± 12.18 Bq l−1, with an average value of 21.21 ± 12.18 Bq l−1. Moreover, the measured concentration of radon in the various categories of water sources revealed the highest concentration in hot spring water, with an average concentration of 98.6 ± 5.9 Bq l−1, while the lowest radon concentration was in tap water, with an average of 1.95 + 0.61 Bq l−1. According to our results, the average radon concentration values for all the sampled water sources are lower than the WHO guidelines for safe drinking water. In addition, the total effective dose from the summation of ingestion and inhalation dose is 4.45 μSv y−1, a value much lower than the safe limit of 100 μSv y−1 recommended by the WHO.
Author Contributions
Conceptualization, Methodology, Investigation, Formal analysis, Writing—original draft, N.F.I.; Supervision, Funding, Conceptualization, Investigation, Writing—original draft, Formal analysis, S.H.; Investigation, M.S.M.S.; Writing—review and editing, A.T.A.R. and D.A.B. All authors have read and agreed to the published version of the manuscript.
Funding
This work was supported by the Ministry of Higher Education Malaysia and Universiti Teknologi Malaysia through a UTMSHINE Signature Grant (no. 07G82 and 07G90).
Institutional Review Board Statement
Not applicable.
Informed Consent Statement
Not applicable.
Conflicts of Interest
There is no conflict of interest.
References
- Sabbarese, C.; Ambrosino, F.; D’Onofrio, A.; Pugliese, M.; La Verde, G.; D’Avino, V.; Roca, V. The first radon potential map of the Campania region (southern Italy). Appl. Geochem. 2021, 126, 104890. [Google Scholar] [CrossRef]
- Muhammad, B.G.; Jaafar, M.S.; Azhar, A.R.; Akpa, T.C. Measurements of 222Rn activity concentration in domestic water sources in Penang, northern peninsular Malaysia. Radiat. Prot. Dosim. 2011, 149, 340–346. [Google Scholar] [CrossRef]
- USNRC National Research Council. Risk Assessment of Radon in Drinking Water; The National Academies Press: Washington, DC, USA, 1999. [Google Scholar] [CrossRef]
- Le, C.H.; Huynh, N.P.T.; Nguyen, V.T.; Le, Q.B. Radon and Radium Concentrations in DrinkableWater Supplies of the Thu Duc Region in Ho Chi Minh City, Vietnam. Appl. Radiat. Isot. 2015, 105, 219–224. [Google Scholar] [CrossRef]
- Kessongo, J.; Bahu, Y.; Inácio, M.; Peralta, L.; Soares, S. Radon concentration potential in Bibala municipality water: Consequences for public consumption. Radiat. Phys. Chem. 2020, 173, 108951. [Google Scholar] [CrossRef]
- Mehra, R.; Bala, P. Estimation of annual effective dose due to Radon level in indoor air and soil gas in Hamirpur district of Himachal Pradesh. J. Geochem. Explor. 2014, 142, 16–20. [Google Scholar] [CrossRef]
- Sharma, S.; Mehta, K.; Narang, S.; Kumar, A. Dose estimation from the exposure to radon, thoron and their progeny concentrations in the environs of Kangra area, Himachal Himalayas, India. Groundw. Sustain. Dev. 2020, 11, 100409. [Google Scholar] [CrossRef]
- WHO. WHO Handbook on Indoor Radon: Public Health Perspective; World Health Organization: Geneva, Switzerland, 2009. [Google Scholar]
- Gahrouei, D.S.; Saeb, M. Dose assessment and radioactivity of the mineral water resources of Dimeh springs in the Chahar-mahal and Bakhtiari Province, Iran. Nukleonika 2008, 53, 31–34. [Google Scholar]
- USEPA. National Primary Drinking Water Regulations; Radon-222; Proposed Rule; Federal Register; United State of America Environmental Protection Agency: New York, NY, USA, 1999.
- EURATOM. Council Directive 2013/51/EURATOM of 22 October 2013 Laying down Requirements for the Protection of the Health of the General Public with Regard to Radioactive Substances in Water Intended for Human Consumption; Euratom, Official Journal of the European Communities: Rome, Italy, 2013. [Google Scholar]
- WHO. Guidelines for Drinking-Water Quality; First Addendum to Third Edition; World Health Organization: Geneva, Switzerland, 2004; Volume 1. [Google Scholar]
- Malik, M.F.I.; Rabaiee, N.A.; Jaafar, M.S. Determination of radon concentration in water using RAD7 with RAD H 2 O accessories. AIP Conf. Proc. 2015, 1657, 1–6. [Google Scholar] [CrossRef]
- Shu’Aibu, H.K.; Khandaker, M.U.; Baballe, A.; Tata, S.; Adamu, M.A. Determination of radon concentration in groundwater of Gadau, Bauchi State, Nigeria and estimation of effective dose. Radiat. Phys. Chem. 2021, 178, 108934. [Google Scholar] [CrossRef]
- Rani, A.; Mehra, R.; Duggal, V. Radon monitoring in groundwater samples from some areas of northern Rajasthan, India, using a RAD7 detector. Radiat. Prot. Dosim. 2012, 153, 496–501. [Google Scholar] [CrossRef]
- Sharma, S.; Kumar, A.; Mehra, R.; Kaur, M.; Mishra, R. Assessment of progeny concentrations of 222Rn/220Rn and their related doses using deposition-based direct progeny sensors. Environ. Sci. Pollut. Res. 2018, 25, 11440–11453. [Google Scholar] [CrossRef]
- Lane-Smith, D.; Schubert, M. Absolute Measurement of Thoron in Surface Waters. Water 2020, 12, 3083. [Google Scholar] [CrossRef]
- Durridge. Rad7 Radon Detector User Manual; DURRIDGE Co. Inc.: Billerica, MA, USA, 2015; pp. 1–81. [Google Scholar]
- Kandari, T.; Aswal, S.; Prasad, M.; Bourai, A.; Ramola, R. Estimation of annual effective dose from radon concentration along Main Boundary Thrust (MBT) in Garhwal Himalaya. J. Radiat. Res. Appl. Sci. 2016, 9, 228–233. [Google Scholar] [CrossRef] [Green Version]
- UNSCEAR United Nations Science Committee on the Effects of Atomic Radiation. Sources and Effects of Ionizing Radiation; UNSCEAR 2000 Report to the General Assembly, with Scientific Annexes; United Nations: New York, NY, USA, 2000. [Google Scholar]
- Ahmed, N.K. Natural radioactivity of ground and drinking water in some areas of Upper Egypt. Turk. J. Eng. Environ. Sci. 2004, 28, 345–354. [Google Scholar]
- Çevik, U.; Damla, N.; Karahan, G.; Çelebi, N.; Kobya, A.I. Natural radioactivity in tap waters of Eastern Black Sea region of Turkey. Radiat. Prot. Dosim. 2005, 118, 88–92. [Google Scholar] [CrossRef]
- Clement, C.; Tirmarche, M.; Harrison, J.; Laurier, D.; Paquet, F.; Blanchardon, E.; Marsh, J. Lung Cancer Risk from Radon and Progeny and Statement on Radon. Ann. ICRP 2010, 40, 1–64. [Google Scholar] [CrossRef]
- Sola, P.; Srisuksawad, K.; Loaharojanaphand, S.; O-Manee, A.; Permnamtip, V.; Issarapan, P.; Thummagarun, L. Radon concentration in air, hot spring water, and bottled mineral water in one hot spring area in Thailand. J. Radioanal. Nucl. Chem. 2013, 297, 183–187. [Google Scholar] [CrossRef]
- Thumvijit, T.; Chanyotha, S.; Sriburee, S.; Hongsriti, P.; Tapanya, M.; Kranrod, C.; Tokonami, S. Identifying indoor radon sources in Pa Miang, Chiang Mai, Thailand. Sci. Rep. 2020, 10, 1–14. [Google Scholar] [CrossRef]
- Horváth, Á.; Bohus, L.; Urbani, F.; Marx, G.; Piróth, A.; Greaves, E. Radon concentrations in hot spring waters in northern Venezuela. J. Environ. Radioact. 2000, 47, 127–133. [Google Scholar] [CrossRef]
- Ródenas, C.; Gómez, J.; Soto, J.; Maraver, F. Natural radioactivity of spring water used as spas in Spain. J. Radioanal. Nucl. Chem. 2008, 277, 625–630. [Google Scholar] [CrossRef]
- Vinson, D.; Vengosh, A.; Hirschfeld, D.; Dwyer, G.S. Relationships between radium and radon occurrence and hydrochemistry in fresh groundwater from fractured crystalline rocks, North Carolina (USA). Chem. Geol. 2009, 260, 159–171. [Google Scholar] [CrossRef] [Green Version]
- Hamzah, Z.; Saat, A.; Kassim, M. Determination of Radon Activity Concentration in Hot Spring and Surface Water Using Gamma Spectrometry Technique (Penentuan Kepekatan Aktiviti Radon Di dalam Air Panasdan Air Permukaan Dengan Menggunakan Teknik Spektrometri Gama). Malays. J. Anal. Sci. 2011, 15, 288–294. [Google Scholar]
- Duggal, V.; Sharma, S.; Mehra, R. Risk assessment of radon in drinking water in Khetri Copper Belt of Rajasthan, India. Chemosphere 2020, 239, 124782. [Google Scholar] [CrossRef]
- El-Mageed, A.I.A.; El-Kamel, A.E.-H.; Abbady, A.E.-B.; Harb, S.; Saleh, I.I. Natural radioactivity of ground and hot spring water in some areas in Yemen. Desalination 2013, 321, 28–31. [Google Scholar] [CrossRef]
- Ahmad, N.; Jaafar, M.S.; Alsaffar, M.S. Study of radon concentration and toxic elements indrinking and irrigated water and its implications in Sungai Petani, Kedah, Malaysia. J. Radiat. Res. Appl. Sci. 2015, 8, 294–299. [Google Scholar] [CrossRef] [Green Version]
- Malakootian, M.; Nejhad, Y.S. Determination of radon concentration in drinking water of Bam villages and evaluation of the annual effective dose. Int. J. Radiat. Res. 2017, 15, 81–89. [Google Scholar] [CrossRef]
- D’Alessandro, W.; Vita, F. Groundwater radon measurements in the Mt. Etna area. J. Environ. Radioact. 2003, 65, 187–201. [Google Scholar] [CrossRef]
- Abdurabu, W.A.; Ramli, A.T.; Saleh, M.A.; Heryansyah, A. The activity concentrations of 222Rn and corresponding health risk in groundwater samples from basement and sandstone aquifer; the correlation to physicochemical parameters. Radiat. Phys. Chem. 2016, 127, 34–41. [Google Scholar] [CrossRef]
- Alabdula’Aly, A.I. Occurrence of radon in groundwater of Saudi Arabia. J. Environ. Radioact. 2014, 138, 186–191. [Google Scholar] [CrossRef]
- Al-attiyah, K.H.H.; Kadhim, I.H. Measurement and Study of Radioactive Radon Gas Concentrations in the Selected Samples of water for AL-Shomaly/Iraq. Aust. J. Basic Appl. Sci. 2014, 3, 156–160. [Google Scholar]
- Duggal, V.; Sharma, S.; Mehra, R. Radon levels in drinking water of Fatehabad district of Haryana, India. Appl. Radiat. Isot. 2017, 123, 36–40. [Google Scholar] [CrossRef] [PubMed]
- Nuhu, H.; Hashim, S.; Sanusi, M.S.M.; Saleh, M.A. Radon activity concentration measurements in water sources from Perak state Malaysia. J. Radiat. Res. Appl. Sci. 2020, 13, 665–671. [Google Scholar] [CrossRef]
- WHO. Guidelines for Drinking-Water Quality, 4th ed.; World Health Organization: Geneva, Switzerland, 2012. [Google Scholar]
Figure 1.
Sampling points in an area of the southwest coast region of Peninsular Malaysia (using ArcGIS 10.4.1).
Figure 1.
Sampling points in an area of the southwest coast region of Peninsular Malaysia (using ArcGIS 10.4.1).

Figure 2.
RAD7 equipment for the radon measurements in the water samples: (1) RAD7 detector; (2) 250 mL water vial with aerator; (3) tube of desiccant.
Figure 2.
RAD7 equipment for the radon measurements in the water samples: (1) RAD7 detector; (2) 250 mL water vial with aerator; (3) tube of desiccant.

Figure 3.
The schematic diagram of the RAD7 detector in a closed-circuit setup.

Figure 4.
Average radon concentrations in water sources of the southwest coastal region of Peninsular Malaysia.
Figure 4.
Average radon concentrations in water sources of the southwest coastal region of Peninsular Malaysia.


Table 1.
Radon concentrations in water samples from the studied areas.
| Sampling Code | Location and Coordinates | Water Sources | Radon Concentration (Bq l−1) |
|---|---|---|---|
| M1 | Taman Perdana Alai (2.172, 102.308) | River | 1.2 ± 0.4 |
| M2 | Kg. Ganun (2.409, 102.238) | Hot spring | 88 ± 8 |
| M3 | Bukit China (2.198, 102.256) | Groundwater | 14 ± 2 |
| M4 | Klebang (2.218, 102.188) | Tap water | 3.8 ± 0.5 |
| M5 | Durian tunggal (2.35, 102.25) | Groundwater | 7.4 ± 0.8 |
| M6 | Tanjung minyak (2.286, 102.197) | Tap water | 0.7 ± 0.3 |
| M7 | Tanjung Bidara (2.293, 102.087) | Seawater | 1.4 ± 0.7 |
| M8 | Jasin (2.315, 102.431) | Tap water | 1.55 ± 0.36 |
| M9 | Pulau Sebang (2.448, 102.236) | River | 4.30 ± 1.20 |
| M10 | Kolam air panas, Jasin (2.291, 102.377) | Hot spring | 8.1 ± 0.9 |
| M11 | Kampung Arongan (2.454, 102.237) | River | 9.63 ± 2.2 |
| M12 | Cherana putih (2.482, 102.179) | Hot spring | 111.35 ± 2.76 |
| M13 | Kg. Duyong (2.2, 102.297) | Groundwater | 18.52 ± 1.31 |
| M14 | Pangkalan Balak (2.321, 102.071) | Sea water | 0.72 ± 0.82 |
| M15 | Durian Tunggal (2.311, 102.32) | Lake | 0.07 ± 0.12 |
| M16 | Kampung Gangsa (2.285, 102.262) | Tap water | 2.3 ± 0.4 |
| M17 | Taboh Naning (2.452, 102.181) | Groundwater | 89.12 ± 3.38 |
| N1 | Tanjung Ipoh (2.730, 102.078) | Waterfall | 2.13 ± 1.12 |
| N2 | Kg. Sungai Gunung Dua Besar (2.738, 102.284) | Tap water | 0.93 ± 0.71 |
| N3 | Bandar Baru Serting (2.895, 102.408) | Lake | 3.92 ± 0.81 |
| N4 | Pantai Kemang (2.454, 101.856) | Seawater | 6.17 ± 0.78 |
| N5 | Pantai Bagan pinang (2.508, 101.829) | Tap water | 2.75 ± 0.81 |
| N6 | Chengkau (2.543, 102.137) | Hot spring | 186.5 ± 12.18 |
| N7 | Batu Kikir (2.894, 102.287) | Tap water | 1.33 ± 0.53 |
| N8 | Simpang Durian (3.096, 102.217) | Tap water | 3.98 ± 1.02 |
| N9 | Kuala Klawang (2.992, 102.071) | Tap water | 0.88 ± 0.69 |
| N10 | Senawang (2.69, 101.991) | Tap water | 1.35 ± 0.73 |
| Average | - | - | 21.21 ± 1.67 |
Table 2.
Radon activity concentration in water in other parts of Malaysia and the world.
| No. | Water Sources | State and Country | Radon Concentration (Bq l−1) | Reference | ||
|---|---|---|---|---|---|---|
| Min | Max | Mean | ||||
| 1 | Groundwater | Gadau Nigeria | 4.92 | 82.89 | 38.3 | [14] |
| Rajasthan, India | 12.5 ± 1.5 | 862 ± 38 | 113 | [30] | ||
| Yemen | 1.03 ± 0.16 | 895.91 ± 0.77 | 226.41 ± 62.39 | [35] | ||
| Saudi Arabia | 0.01 | 67.4 | 4.62 | [36] | ||
| The Southwest Coastal of Peninsular Malaysia (Negeri Sembilan and Malacca) | 7.42 | 89.12 | 32.36 ± 1.8 | Present study | ||
| 2 | Tap water | Turkey | 5.31 | 18.46 | 10.82 | [22] |
| Sungai Petani, Kedah | - | - | 5.37 ± 0.58 | [32] | ||
| The Southwest Coastal of Peninsular Malaysia (Negeri Sembilan and Malacca) | 0.68 | 3.98 | 1.95 ± 0.61 | Present study | ||
| 3 | Hot spring | Thailand | 95 | 154 | - | [24] |
| Northern Venezuela | 1 | 560 | - | [26] | ||
| The Southwest Coastal of Peninsular Malaysia (Negeri Sembilan and Malacca) | 8.05 | 186.5 | 98.56 ± 5.88 | Present study | ||
Table 3.
The annual effective doses, due to inhalation and ingestion, from the consumption of drinking water.
Table 3.
The annual effective doses, due to inhalation and ingestion, from the consumption of drinking water.
| ID | Annual Effective Dose (µSv y−1) | ||
|---|---|---|---|
| Ingestion | Inhalation | Total | |
| M1 | 0.242 | 0.003 | 0.24 |
| M2 | 18.549 | 0.223 | 18.8 |
| M3 | 3.02 | 0.036 | 3.06 |
| M4 | 0.794 | 0.01 | 0.80 |
| M5 | 1.558 | 0.019 | 1.58 |
| M6 | 0.143 | 0.002 | 0.15 |
| M7 | 0.29 | 0.003 | 0.29 |
| M8 | 0.326 | 0.004 | 0.33 |
| M9 | 0.903 | 0.011 | 0.91 |
| M10 | 1.691 | 0.02 | 1.71 |
| M11 | 2.022 | 0.024 | 2.04 |
| M12 | 23.384 | 0.281 | 23.67 |
| M13 | 3.89 | 0.047 | 3.94 |
| M14 | 0.151 | 0.002 | 0.15 |
| M15 | 0.015 | 0.0002 | 0.02 |
| M16 | 0.483 | 0.006 | 0.49 |
| M17 | 18.715 | 0.225 | 18.94 |
| N1 | 0.447 | 0.005 | 0.45 |
| N2 | 0.195 | 0.002 | 0.2 |
| N3 | 0.823 | 0.01 | 0.83 |
| N4 | 1.296 | 0.016 | 1.31 |
| N5 | 0.578 | 0.007 | 0.59 |
| N6 | 39.165 | 0.47 | 39.64 |
| N7 | 0.279 | 0.003 | 0.28 |
| N8 | 0.836 | 0.01 | 0.85 |
| N9 | 0.185 | 0.002 | 0.19 |
| N10 | 0.284 | 0.003 | 0.29 |
| Average | 4.45 | 0.06 | 4.51 |
Table 4.
The annual effective dose from the consumption of drinking water in other countries.
| State and Country | Annual Effective Dose for Ingestion, ∑Wing (μSv y−1) | Annual Effective Dose for Ingestion, ∑Winh (μSv y−1) | Total Annual Effective Dose, ∑WTotal (μSv y−1) | Reference | |||
|---|---|---|---|---|---|---|---|
| Range | Average | Range | Average | Range | Average | ||
| Iran | - | - | - | - | - | 6.4 | [9] |
| Nigeria | 1.03 to 17.4 | 8.05 | 0.01 to 0.21 | 0.1 | 1.1 to 17.6 | 8.14 | [14] |
| Garhwal Himalaya | 360 to 7910 | 3920 | 4.2 to 145.4 | 50.4 | 880 to 3780 | 2130 | [19] |
| Turkey | - | - | - | - | - | 5.848 | [22] |
| Juban District, Yemen | 0.2 to 188.1 | 47.5 | 2.6 to 2257.7 | 570.6 | - | - | [35] |
| River Hilla, Iraq | - | - | - | - | - | 450 | [37] |
| Haryana, India | 10.5 to 165.2 | - | 3.6 to 56.6 | - | 14.1 to 221.8 | - | [38] |
| Perak, Malaysia | 0.102 to 10.112 | 1.759 | 0.102 to 9.954 | 1.733 | - | - | [39] |
| The Southwest Coastal of Peninsular Malaysia (Negeri Sembilan and Malacca) | 0.15 to 39.167 | 4.45 | 0.0002 to 0.47 | 0.06 | 0.02 to 39.64 | 4.51 | Present study |
Publisher’s Note: MDPI stays neutral with regard to jurisdictional claims in published maps and institutional affiliations. |
© 2021 by the authors. Licensee MDPI, Basel, Switzerland. This article is an open access article distributed under the terms and conditions of the Creative Commons Attribution (CC BY) license (https://creativecommons.org/licenses/by/4.0/).
Share and Cite
MDPI and ACS Style
Ismail, N.F.; Hashim, S.; Sanusi, M.S.M.; Abdul Rahman, A.T.; Bradley, D.A. Radon Levels of Water Sources in the Southwest Coastal Region of Peninsular Malaysia. Appl. Sci. 2021, 11, 6842. https://doi.org/10.3390/app11156842
AMA Style
Ismail NF, Hashim S, Sanusi MSM, Abdul Rahman AT, Bradley DA. Radon Levels of Water Sources in the Southwest Coastal Region of Peninsular Malaysia. Applied Sciences. 2021; 11(15):6842. https://doi.org/10.3390/app11156842
Chicago/Turabian StyleIsmail, Noor Fadilla, Suhairul Hashim, Mohamad Syazwan Mohd Sanusi, Ahmad Taufek Abdul Rahman, and David Andrew Bradley. 2021. "Radon Levels of Water Sources in the Southwest Coastal Region of Peninsular Malaysia" Applied Sciences 11, no. 15: 6842. https://doi.org/10.3390/app11156842
Note that from the first issue of 2016, this journal uses article numbers instead of page numbers. See further details here.