Article

Machine-Learning-Aided Prediction of Flexural Strength and ASR Expansion for Waste Glass Cementitious Composite

1
School of Design and the Built Environment, Curtin University, Perth, WA 6102, Australia
2
School of Civil and Environmental Engineering, University of New South Wales, Sydney, NSW 2052, Australia
3
Department of Civil Engineering, Monash University, Clayton, VIC 3800, Australia
4
School of Building Engineering, Hunan Institute of Engineering, Xiangtan 411228, China
5
College of Civil Engineering, Hunan City University, Yiyang 413000, China
6
Hunan Provincial Key Laboratory of Geotechnical Engineering for Stability Control and Health Monitoring, Hunan University of Science and Technology, Xiangtan 411201, China
7
China Coal Construction Engineering Group Co., Ltd., Beijing 100161, China
8
School of Civil Engineering and Architecture, East China Jiaotong University, Nanchang 330013, China
9
Australasian Joint Research Centre for Building Information Modelling, Curtin University, Perth, WA 6102, Australia
*
Author to whom correspondence should be addressed.
Appl. Sci. 2021, 11(15), 6686; https://doi.org/10.3390/app11156686
Submission received: 17 June 2021 / Revised: 11 July 2021 / Accepted: 19 July 2021 / Published: 21 July 2021
(This article belongs to the Section Civil Engineering)

Abstract

:
Waste glass (WG) is unsustainable due to its nonbiodegradable property. However, its main ingredient is silicon dioxide, which can be utilised as a supplementary cementitious material. Before reusing WG, the flexural strength (FS) and alkali–silica reaction (ASR) expansion of WG concrete are two essential properties that must be investigated. This study produced mortar containing activated glass powder using mechanical, chemical, and mechanical–chemical (combined) approaches. The results showed that mortar containing 30% WG powder using the combined method was optimal for improving the FS and mitigating the ASR expansion. The microstructure analysis was implemented to explore the activation effect on the glass powder and mortar. Moreover, a random forest (RF) model was proposed with hyperparameters tuned by beetle antennae search (BAS), aiming at predicting FS and ASR expansion precisely. A large database was established from the experimental results based on 549 samples prepared for the FS test and 183 samples produced for the expansion test. The BAS-RF model presented high correlation coefficients for both FS (0.9545) and ASR (0.9416) data sets, showing much higher accuracy than multiple linear regression and logistic regression. Finally, a sensitivity analysis was conducted to rank the variables based on importance. Apart from the curing time, the particle granularity and content of WG were demonstrated to be the most sensitive variable for FS and expansion, respectively.

1. Introduction

Sustainable construction involves the creation of a resource-efficient and eco-friendly environment. Construction waste reduction and waste recycling are two essential principles of this practice. Waste glass (WG) is a common urban solid waste, which is hazardous to the environment because of its inert and biodegradable properties. However, WG treatment is expansive, and its reuse is still at the initial stage. Statistically, 11,530 kilotons of WG were generated in the United States in 2010, with only 30% recycled, and approximately 300 tonnes per day were produced in Hong Kong in 2016, with only 10% recycled [1,2]. Therefore, developing a feasible method to cope with the increasing WG content is urgent and essential.
Due to its abundance, low cost, and high stiffness, WG has been used in the construction industry. Previous research studies have shown that WG is a good replacement for sand or cement, serving as a supplementary cementitious material. This is mainly attributed to WG’s high silica content (over 70%), which can react with calcium hydroxide (CH) to generate calcium silica hydrates (C-S-H). Furthermore, glass can alleviate the corrosion of steel bars within reinforced concrete. Therefore, reusing WG in concrete manufacturing is promising in terms of increasing its recycling degree, reducing carbon dioxide emissions caused by cement production, and mitigating the shortage of high-quality sand.
However, the strength property and expansion arising from alkali–silica reaction (ASR) of concrete containing WG are two key points that must be investigated before applying WG. This is mainly due to WG’s chemical and physical properties. Generally, discarded glass cullet from bottles, windows, decorations, etc. has poor geometry, that is, an angular, flat, or elongated shape, leading to poor workability and diminished strength grade [3,4]. In addition, the high silica content of WG will inevitably produce ASR expansion and probably result in structural instability, which is the chief reason for the failed early application of waste glass concrete [5,6]. Therefore, the investigation on ASR expansion and reliable expansion prediction is essential.
To overcome the reduced strength and excessive ASR expansion, researchers made massive efforts to investigate concrete containing WG and proposed many practicable approaches. These include in-depth studies of glass granularity and admixtures. When the glass cullet was milled to less than 300 μm, both the pozzolanic level of waste glass powder (WGP) and the strength of concrete significantly increased [7,8,9]. Several studies even pointed out the improved pozzolanic ability (compared with fly ash) from ground WG with particle sizes below 100 μm [5,10]. Moreover, the smaller particle sizes of waste glass can mitigate ASR expansion, as demonstrated by many reports [11,12]. Corinaldesi et al. [13] observed improved unconfined compression strength and flexural strength (FS) without obvious macroscopic expansion. Petrella et al. [14] conducted the mechanical test on mortar containing waste porous glass and found the good adhesion of the glass to the cement paste through microstructural observations. Furthermore, the addition of admixtures, such as silica fume, fly ash, lithium compounds, and metakaolin was useful in preventing deleterious ASR expansion [15,16]. Adhikary et al. [17] also illustrated that expanded glass produced by mixing waste glass and expansive agents was effective in prohibiting the ASR expansion.
Previous studies concentrated on the aforementioned aspects in solving the strength and expansion problems, but few reports mentioned the chemical activation of WGP. The possible explanations are the complex chemical reactions and the various types of chemical agents. Additionally, the traditional method of analysis is inadequate in seeking optimal mixture proportions and controlling the error when the variables are multiple. Although multiple linear regression (MLR) and logistic regression (LR) have been proposed, an accurate simulation is still challenging mainly due to the curse of dimensionality and co-linearity susceptibility [18,19,20]. Therefore, this study aimed to activate WGP using chemical activators and an accurate machine learning (ML) model to predict the FS and ASR expansion of WGP mortars.
Recently, the performance of cementitious materials has been broadly studied using artificial intelligence (AI) techniques. ML models exhibit an excellent generalisation ability and perfect prediction accuracy in coping with nonlinear tasks [21,22]. The artificial neural network (ANN), support vector regression (SVR), and random forest (RF) are three widely used ML models that are effective for employing various construction materials [23,24]. The first two models are standalone, while the latter (RF) is an ensemble model that exhibits less probability of generating overfitting problems. RF also has better tolerance than standalone ML models when outliers or noise exist in the data set [25,26]. Furthermore, the blessing of dimensionality and the central limit theorem partly contribute to the success of the ensemble models that outperform the individual models. Therefore, the performance of the RF model is expectedly higher than individual models in solving high dimensionality problems [27,28]. As a result, the RF model was chosen for data prediction.
The accuracy of the RF model depends mainly on two hyperparameters: the total number of trees ( n u m T r e e ) and the minimum sample number of a leaf node ( m i n N u m L e a f ) [29]. The n u m T r e e has a remarkable effect on the model’s ability, and the m i n N u m L e a f controls the splitting condition and determines the relationship between various decision trees. Nevertheless, the process of determining the optimal hyperparameters is time consuming and thus inadequate through the traditional selection method, and if time was not the issue, they would work as well [25]. Recently, optimisation algorithms are preferable since they can automatically seek optimal hyperparameters via iterations. Commonly used metaheuristic algorithms include particle swarm optimisation (PSO) [30], genetic algorithm (GA) [31], and firefly algorithm (FA) [32], which are all computationally intensive. The beetle antennae search (BAS) algorithm uses only one beetle to search the optimal hyperparameters instead of the beetle swarm so that it converges fast and significantly reduces calculation time [33,34]. However, BAS is easily trapped into a local optimum as indicated by previous researchers [35,36]. To reduce the possibility of the local optimum, the BAS algorithm with a changeable step size was proposed for the RF hyperparameter adjustment in this study.
This study investigated the impact of the mechanical, chemical, and mechanical–chemical (combined) activation on the FS and ASR expansion of mortars containing WGP. The sand was replaced with WGP with mean particle sizes of 75 μm and 300 μm. The variables were the replacement ratio, the WGP size, and the content and category of chemical activators (sodium sulphate, calcium hydroxide, and sodium hydroxide). A microscopic test was conducted to investigate the activation effect. In total, 549 samples were prepared for the FS test, and 183 samples were produced for the expansion test. The experimental results are presented as the data set to train the highly accurate BAS-RF model. The baseline models (LR and MLR) were also adopted to compare with BAS-RF. In addition, the sensitivity analysis (SA) was performed on the FS and ASR expansion data sets for a ranking of the input variables.

2. Experimental Program

2.1. Materials and Methods

The mean particle sizes of WGP derived from waste glass vessels were 75 μm and 300 μm. Before being crushed and ground, the vessels were cleaned to eliminate labels and taps and then air-dried. Then, the milled WGP was properly reserved in a sealed and dry container. Figure 1 shows the 75 μm and 300 μm WGP, and Table 1 presents the chemical ingredients. The high silicon dioxide content (approximately 74%) demonstrates the excellent potential of WGP as pozzolans [37]. The ordinary Portland cement (with a strength grade of 42.5) was utilised as an essential binder composition, whose physical and chemical indexes are presented in Table 2. Natural sand was used as the filler with over 96% silicon dioxide, and ASTM C778 [38] was used for its gradation before use.
To investigate the activation effects, five variables were considered: the particle size and substitute proportion of WGP, the category and content of the chemical activators, and the curing times. These five variables were set as the features for the ML modelling. Natural sand was replaced with WGP (75 μm and 300 μm) on three levels (10 wt%, 20 wt%, and 30 wt%). The chemical additive comprises a salt activator (sodium sulphate) and alkaline activators (calcium hydroxide and sodium hydroxide). Additionally, the water-to-cement (W/C) and aggregate-to-cement ratios (A/C) were maintained at 0.47 and 2.25, respectively. The following is the detailed activation methodology:
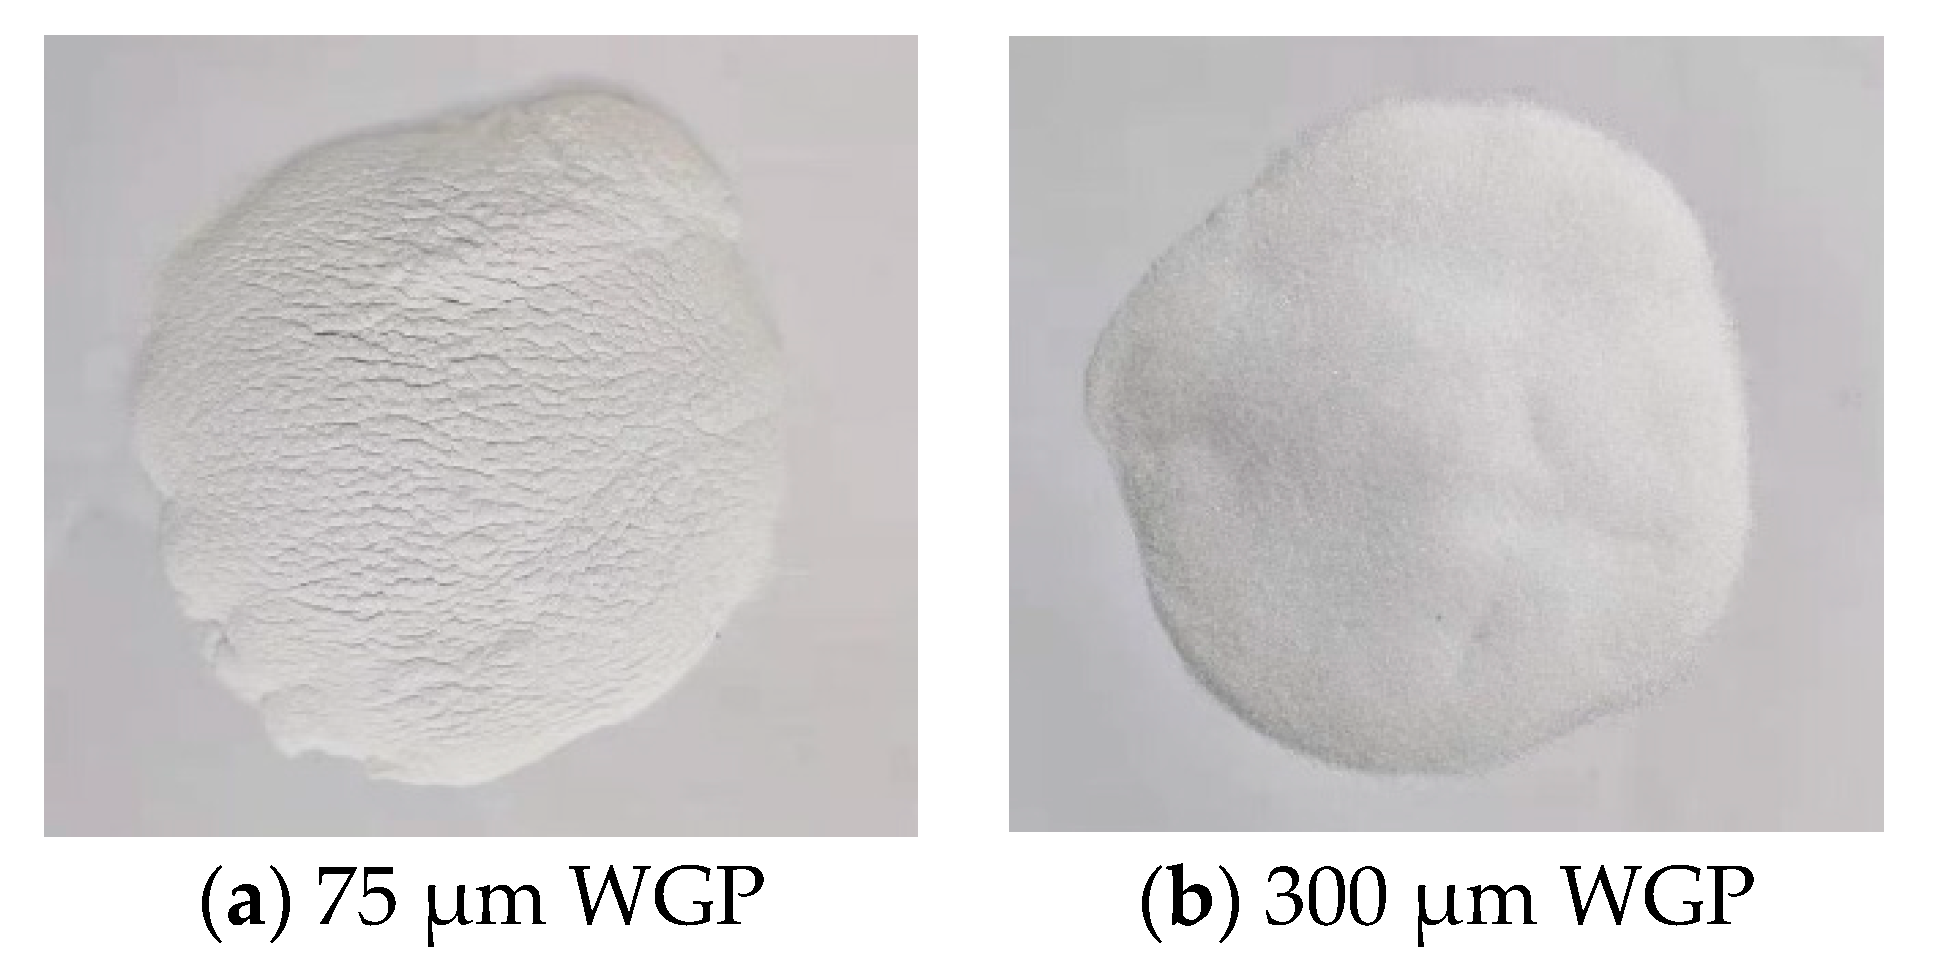
  • Mechanical activation: By employing a ball mill, a glass cullet was ground into WGP with two particle sizes: 300 μm and 75 μm. Compared to coarse WGP (300 μm), the finer WGP was supposed to acquire better pozzolanic characteristics.
  • Chemical activation: Sodium hydroxide, calcium hydroxide, and sodium sulphate (anhydrous) were the three agents used to activate WGP and the WGP–cement system. They are all analytically pure (AR) and commercially available. The alkaline activator is composed of 50 wt% sodium hydroxide and 50 wt% calcium hydroxide, and sodium sulphate served as a salt activator. Both activators were jointly applied at 2 wt%, 4 wt%, and 6 wt% of cement. Before their application, sodium sulphate and sodium hydroxide were dissolved in water, while calcium hydroxide was directly mixed with WGP and sand. The mixing time was enough for the thorough dispersion of raw materials as per ASTM C305 [39].
  • Combined activation: The mechanical–chemical activation integrated the abovementioned mechanical and chemical approaches, where the 300 μm WG was ground to 75 μm WGP, and the chemical activators were utilised in the meantime.
In total, 60 mixes with one control group are summarised in Table 3, where the WG, sodium sulphate, and alkali activators are expressed as G, S, and H, respectively. The particle sizes of WGP are represented as the numbers 75 and 300 without the unit. The numbers 10, 20, and 30 represent the replacement ratios of WGP, i.e., 10%, 20%, and 30%, respectively. The numbers 2, 4, 6 represent the chemical activators’ ratios of 2%, 4%, and 6%, respectively.

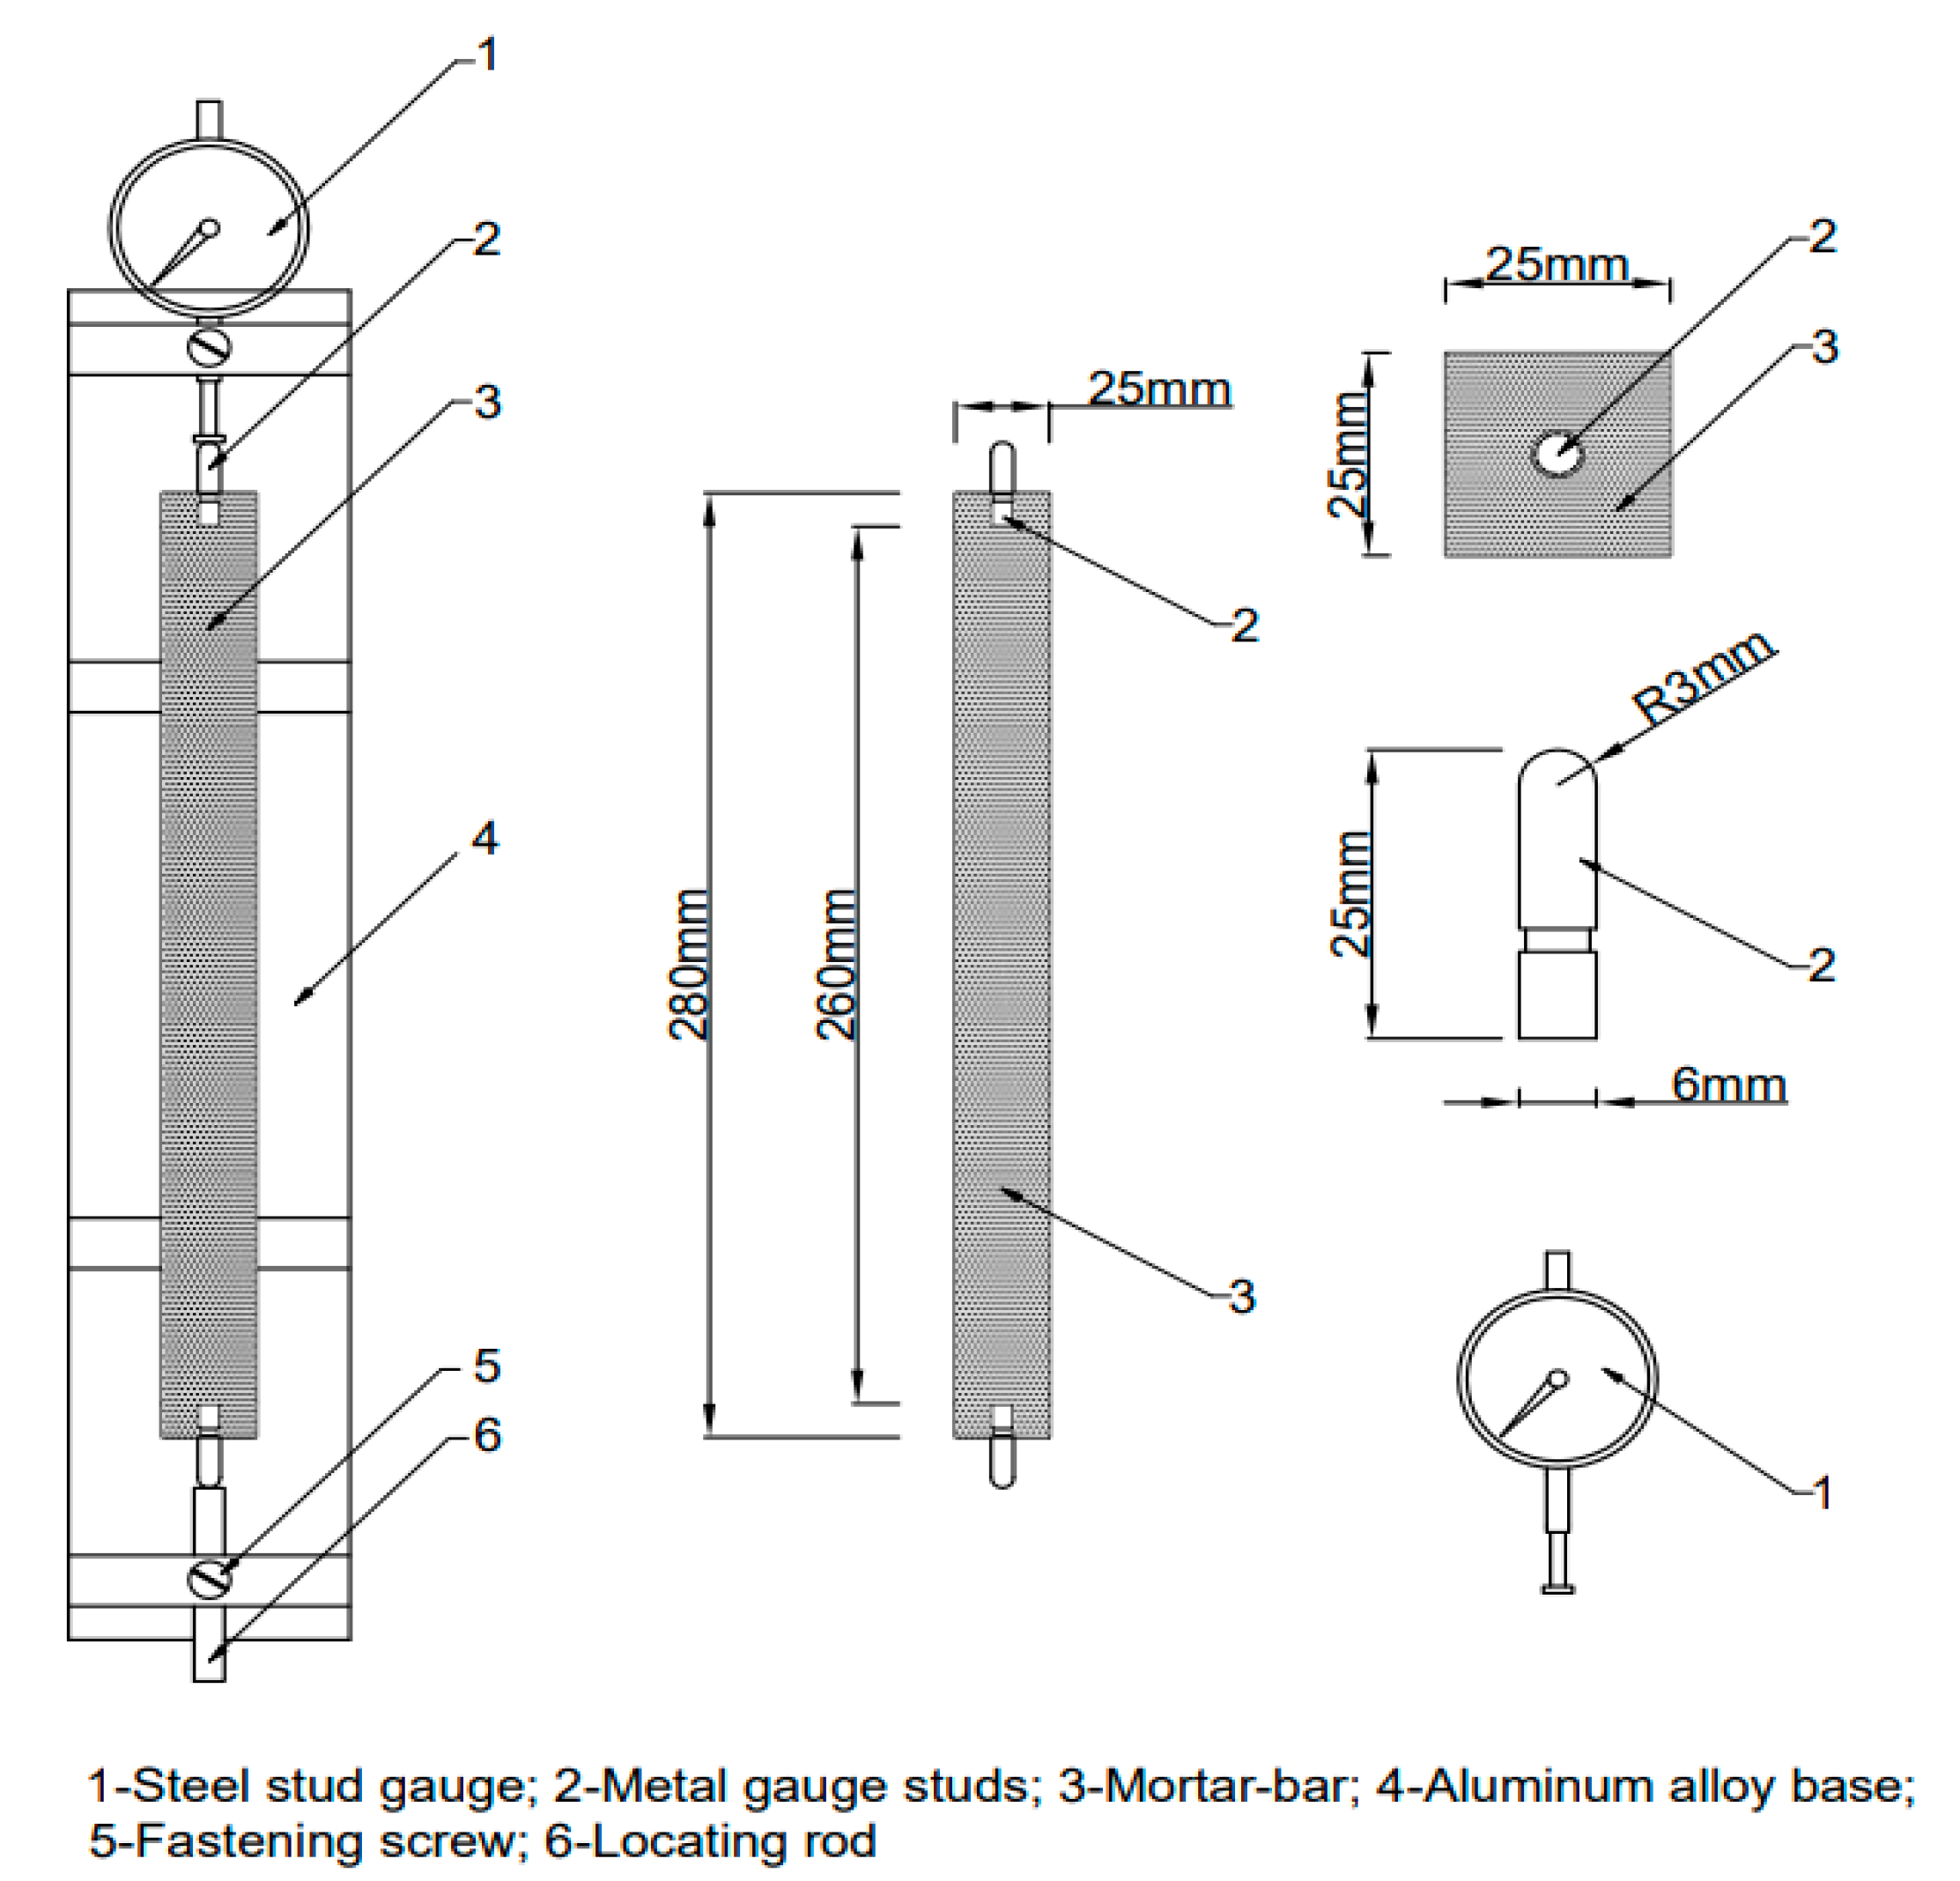
2.2. Mechanical Test

The FSs at 7, 14, and 28 curing times were tested for each mix of mortar containing WGP. Three parallel specimens were cast and the mean values were calculated as the ultimate results after eliminating the outliers. The FS samples were prepared in a prismatic shape (40 × 40 × 160 mm), complying with ASTM C348 [40]. After casting, the mortar samples with moulds were transferred to a wet closet at 20 ± 1 °C temperature and 95 ± 5% humidity for 24 h. Then, the samples were separated from the moulds and stored in saturated lime water until the curing time ended. A three-point bending apparatus was fabricated at a steady loading level of 0.03 MPa/s and the flexural strength f s (MPa) was formulated in Equation (1). The results of mechanical test are summarised in the Appendix A.
f s = 3 F L 2 b h 2
where F is the fracture surcharge (N); L , h , and b are the length, height, and width of the sample (mm), respectively.

2.3. Alkali–Silica Reaction

The ASR experiment was conducted per ASTM C1260 [41] to estimate the risk of detrimental expansion. For each mix, the average longitudinal change of three identical bar samples (25 × 25 × 280 mm) was determined after 2, 4, 7, 10, and 14 days. The effective length of the specimen was 260 mm, which was the length between two steel stud gauges, as shown in Figure 2. The prepared samples are shown in Figure 3. After casting, they were stored in the moisture closet for 24 h and were subsequently immersed in water (80 °C) for another 24 h. The initial lengths L 0 of the samples (accurate to 0.002 mm) were measured through a length comparator, and then specimens were transferred to a 1 N 80 °C NaOH solution. The longitudinal length of the sample at day x is symbolised by L x , and the expansion proportion e x can be determined by Equation (2). The deleterious expansion is negligible if the expansion ratio at 14 days is less than 0.1%. The results of ASR test are summarised in the Appendix B.
e x = L x L 0 260 × 100 %

2.4. Scanning Electron Microscopy

To investigate the microscopic influence of chemical activators on WGP and the bonding ability of WGP with hydration products, scanning electron microscopy (SEM) was employed as a supplementary test. The chemically activated WGP samples were fabricated by immersing them into the water that dissolved the alkali and sodium sulphate for 7 days. The mortar specimens for the SEM experiment were derived from the sample fragments after conducting the FS test.

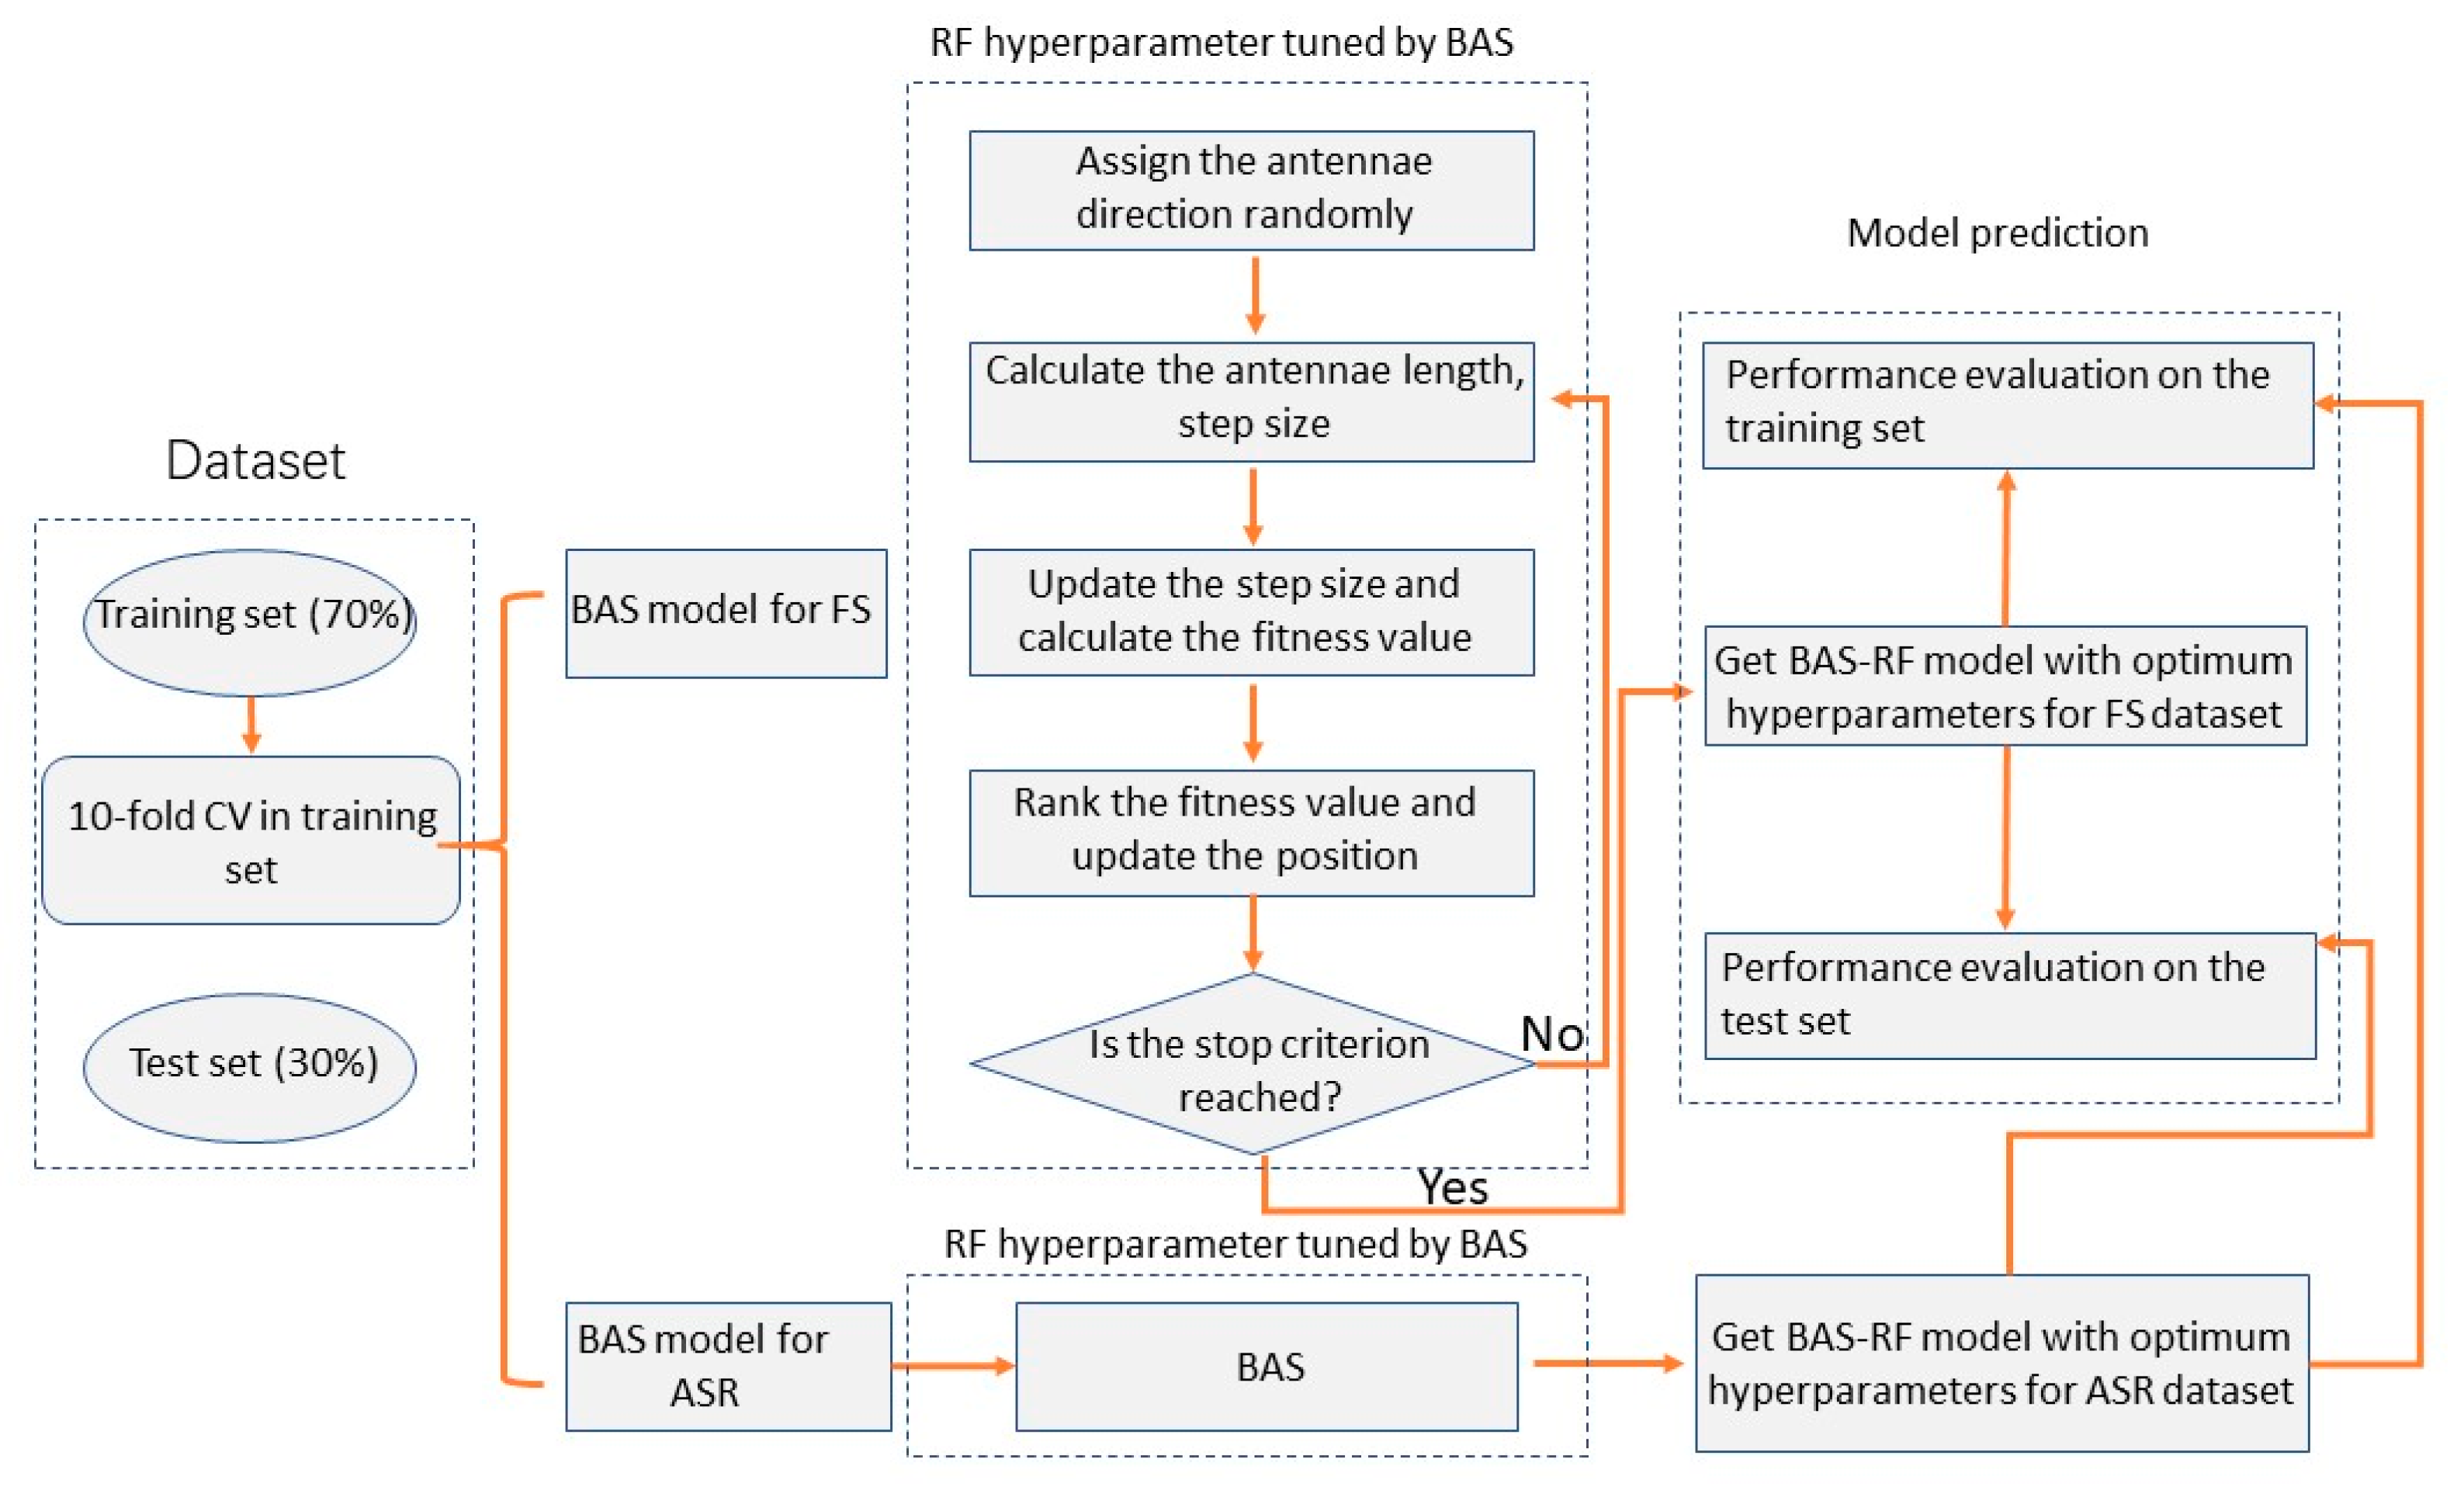
3. Machine Learning Models

The ML models utilised in this study are RF, LR, and MLR. In this section, the RF model is elaborated, followed by the baseline models (LR, MLR). The BAS algorithm and 10-fold cross-validation (CV) are subsequently explained with the ability to optimise the hyperparameters of RF and increasing the prediction performance of ML, respectively. The model evaluation index and variable sensitivity analysis are finally demonstrated.

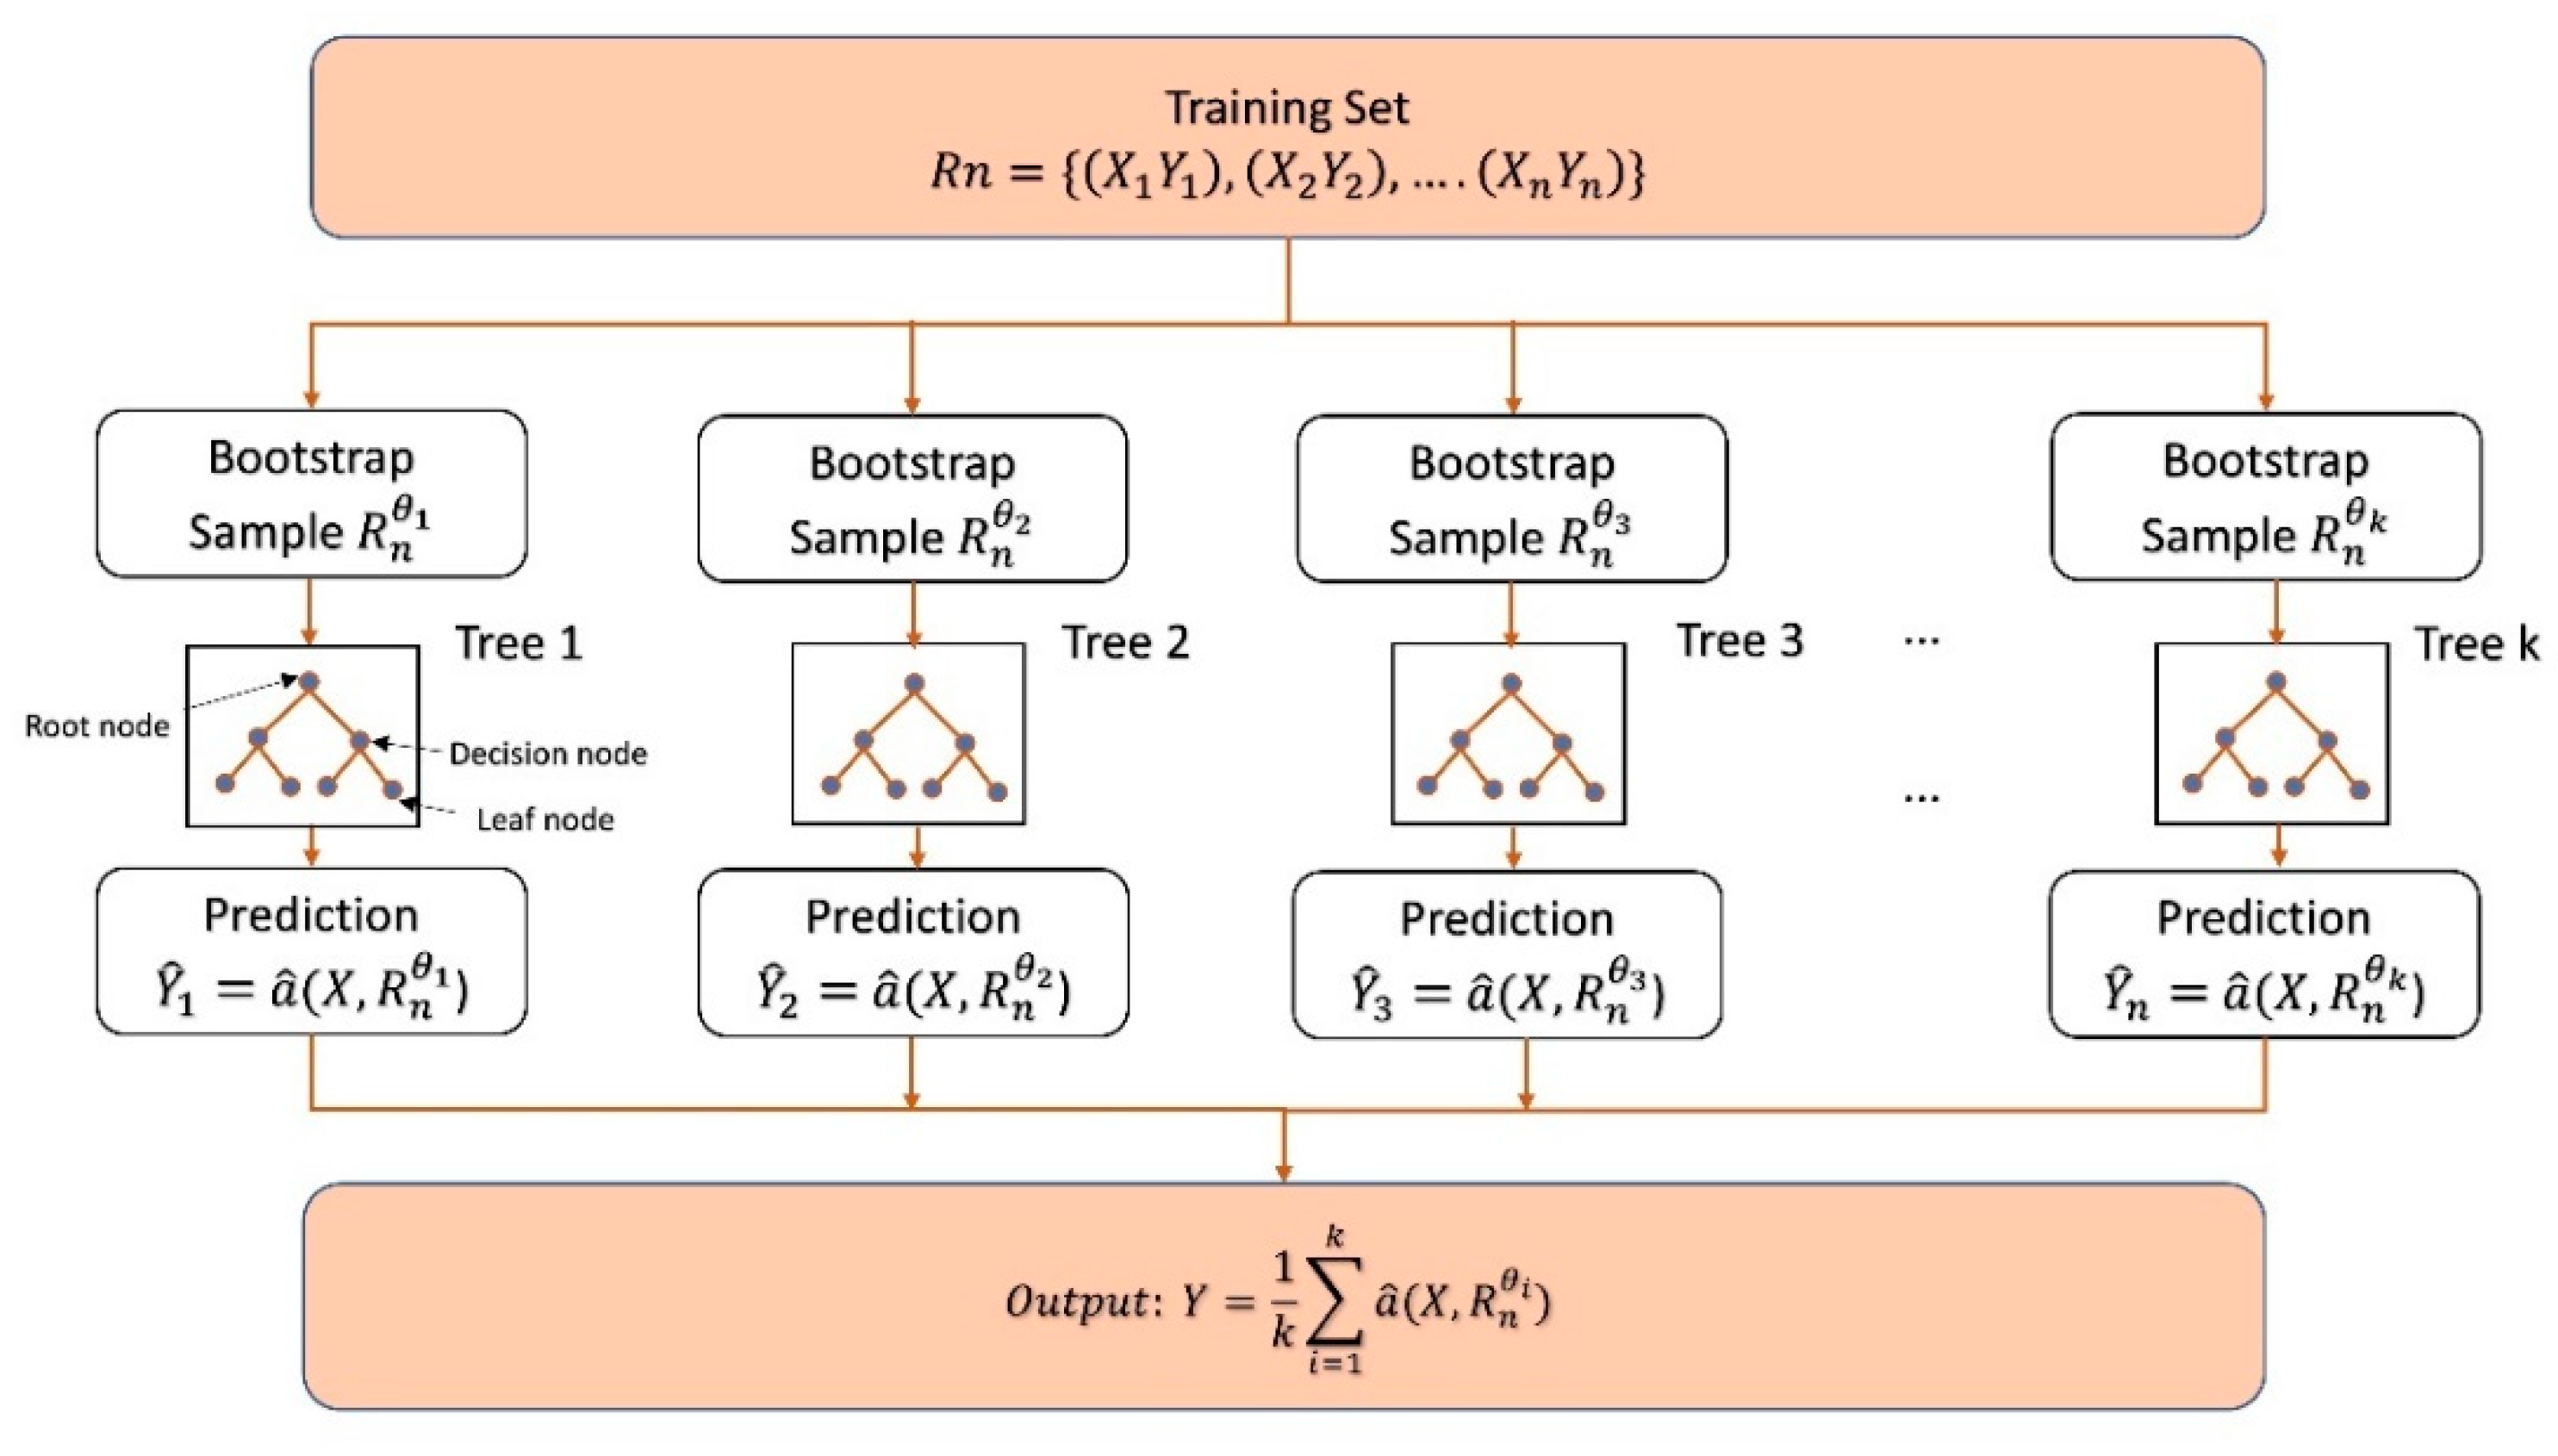
3.1. Random Forest Model

To acquire more reliable output, random forest generates hundreds of decision trees (RTs) with their own regression functions. RT is a nonparametric model which consists of a root node, decision nodes, and leaf nodes. The training set is represented as R n shown in Equation (3) where X and Y are the input vector with m features (X =   { x 1 , x 2 , ,   x m } ) and the output scalar, respectively. In this study, R n represents the FS and ASR datasets. The X and Y indicate the input vector with five features and the outputs (FS, ASR), respectively. Each sample in the training set will be evaluated by the decision nodes using a split function. Then, the sample will be passed to different branches until the leaf node is reached. The tree is stopped when the minimum sample number of a leaf node is achieved.
During the training process of each RT, n samples from the training set R n are randomly sampled without replacement (1/n possibility for each sample to be selected at each time). This sample collecting process is called ‘bootstrap’, and the corresponding sample set is represented as R n θ . Subsequently, the samples of R n θ are split from the root node to the leaf node with each node applying its own split function. At the end of this training process, the prediction function a ^ (X, R n θ ) is established over R n θ .
As mentioned before, the RF is an extension of RT constructing numerous RTs. A ‘bagging’ method is applied to integrate all the results derived from these RTs and utilises the average value as the final output [42]. The bagging technique is proposed by Breiman [43], which effectively reduces the prediction variance to improve prediction performance. The RF algorithm is described in Figure 4 in which RF comprises k de-correlated RTs so that k prediction functions a ^ (X, R n θ k ), where k = 1 , 2 , ,   k , will be constructed. The symbol θ k represents independently distributed random vector to represent different RTs. Finally, the RF produces k outputs { Y ^ 1 ,   Y ^ 2 ,   ,   Y ^ k } corresponding to each RT. The ultimate prediction Y is achieved by averaging these outputs as shown in Equation (4).
R n = { ( X 1 , Y 1 ) , ( X 2 , Y 2 ) , ,   ( X n , Y n )   } ,   X m , Y .
Y = 1 k i = 1 k Y i ^ = 1 k i = 1 k a ^ ( X , R n θ i )

3.2. Baseline Models

Lasso regression is a type of linear regression method using shrinkage theory that can address high levels of multicollinearity problems [44,45]. However, LR and MLR models are more popular than Lasso regression in solving regression problems in the construction field [46,47]. Therefore, these two baseline models (LR and MLR) are proposed to compare with the BAS-RF model and assess their prediction discrepancy.

3.3. Beetle Antennae Search (BAS)

To automatically seek the optimal hyperparameters of the RF model, the BAS algorithm is proposed, which is derived from the foraging behaviour of the longhorn beetle [48,49]. The beetle can continuously change the moving orientation according to its two antennae that can perceive the odour concentration. In the BAS algorithm, we use x l and x r to symbolise the location of the left and right antennae. Their placements at the i t h time instant can be given by
x l i = x i + d i b x r i = x i d i b
where b is a random vector and can be written in Equation (6).
b = r a n d ( k , 1 ) r a n d ( k , 1 )
where r a n d ( k , 1 ) is a random function having k dimensions. The following equations show the location vector of the beetle, the updated antennae length, and the step size.
x i = x i 1 + δ i b s i g n ( f ( x r i ) f ( x l i ) )
d i = 0.95 d i 1 + 0.01
δ i = 0.95 δ i 1
where δ means the step length; f ( x ) represents fitness function; s i g n ( ) is a sign function that extracts the sign of a real number.

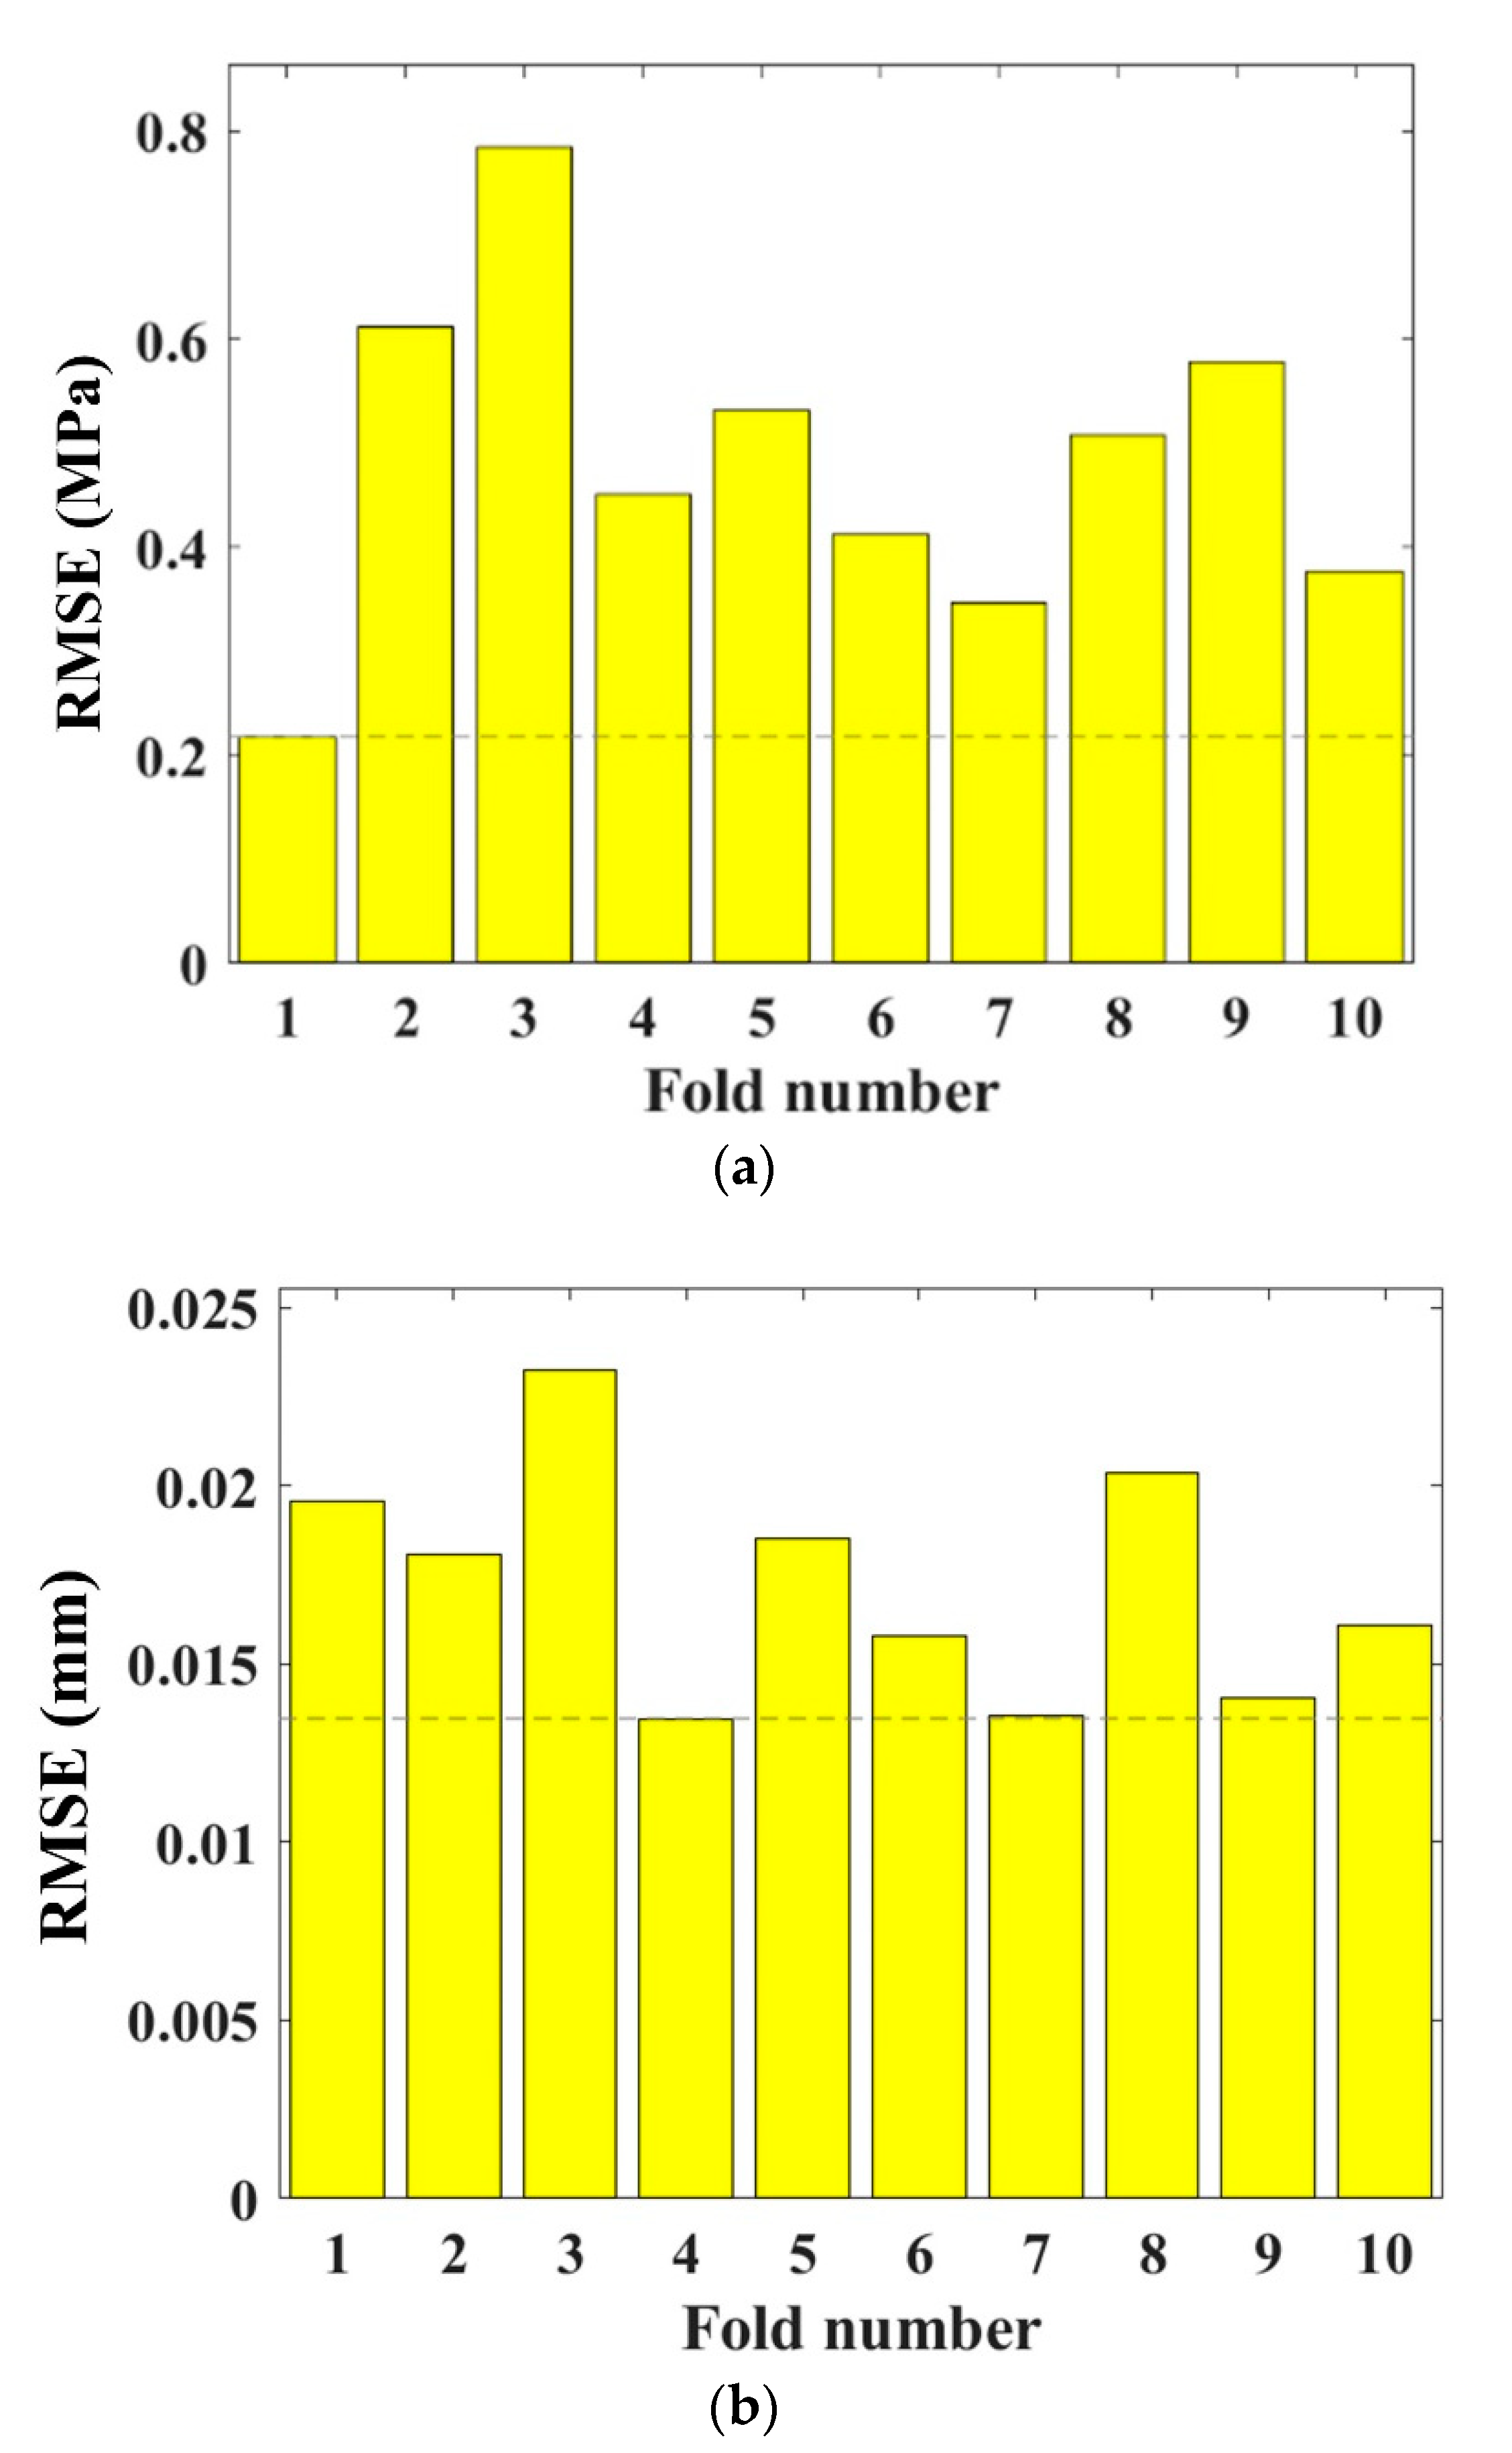
3.4. The 10-Fold Cross-Validation Process

Two hyperparameters of the RF model need to be adjusted, which are n u m T r e e and m i n N u m L e a f . To eliminate the overfitting problems caused by a limited database, a 10-fold cross-validation method was utilised, which is frequently used in predicting cementitious materials performance [47,50]. Meanwhile, all the data can be used for training and testing, giving a fair and comprehensive evaluation metric, although the database is not large. Therefore, the small dataset limitation is supposed to be eliminated. During the process of CV, the data set is firstly randomly separated into two parts: the test group (30%) and the training group (70%) [51]. Secondly, the training group is divided into 10 folds among which the 9 folds are applied to develop the RF model and the rest is for performance validation [52,53]. During the modelling process, the RF hyperparameters are tuned by the BAS algorithm through 50 iterations. Additionally, the root means square error (RMSE) is obtained when finishing validating. This process repeats 10 times to compare the validation outcome. Ultimately, the trained model with the minimum RSME and optimal hyperparameters was used to predict the FS and ASR expansion in this study. The procedure of RF model training by 10-fold CV and BAS is shown in Figure 5.

3.5. Performance Evaluation

The RMSE and correlation coefficient (R) are two evaluation indexes to estimate the accuracy of various ML models. The definitions are as follows:
R M S E = 1 n i = 1 n ( y i * y i ) 2
R = Σ i 1 N ( y i * y * ¯ ) ( y i y ¯ ) Σ i = 1 N ( y i * y * ¯ ) 2 Σ i = 1 N ( y i y ¯ ) 2
where n represents the quantity of the data specimens; y i * is the predicted output by the ML models; y i is the actual output in the data set; y * ¯ and y ¯ are the mean values of the predicted and actual values, separately.

3.6. Variable Significance Determination

An approach based upon sensitivity analysis (SA) was used to investigate the connection between variables and outcomes. Within the range of input variables, this method can assess the impact on the output by changing the input values [54,55]. The beginning procedure is to design input and output variables, followed by evaluating each input variable with all the other variables constant. The SA comprises global sensitivity analysis (GSA) and local sensitivity analysis (LSA), but LSA cannot be used to search uncertainties. In contrast, GSA can simultaneously assess all input variables and therefore is applied in this study. Finally, importance sequences (0 to 100%) are visualised through bar charts [56]. The following equations show a gradient metric to estimate the resulting change of the output and the relative importance formulation [56].
g ε = j = 2 L | y ε , j ^ y ϵ , j 1 ^ | L 1
R ε = g ε / i = 1 I g i
where ε is the analysed input variable; y ε , j ^ represents the susceptibility reaction indicator for x ε , j ; R ε is the relative importance of the variable.

4. Results and Discussion

4.1. Results of the Laboratory Experiments

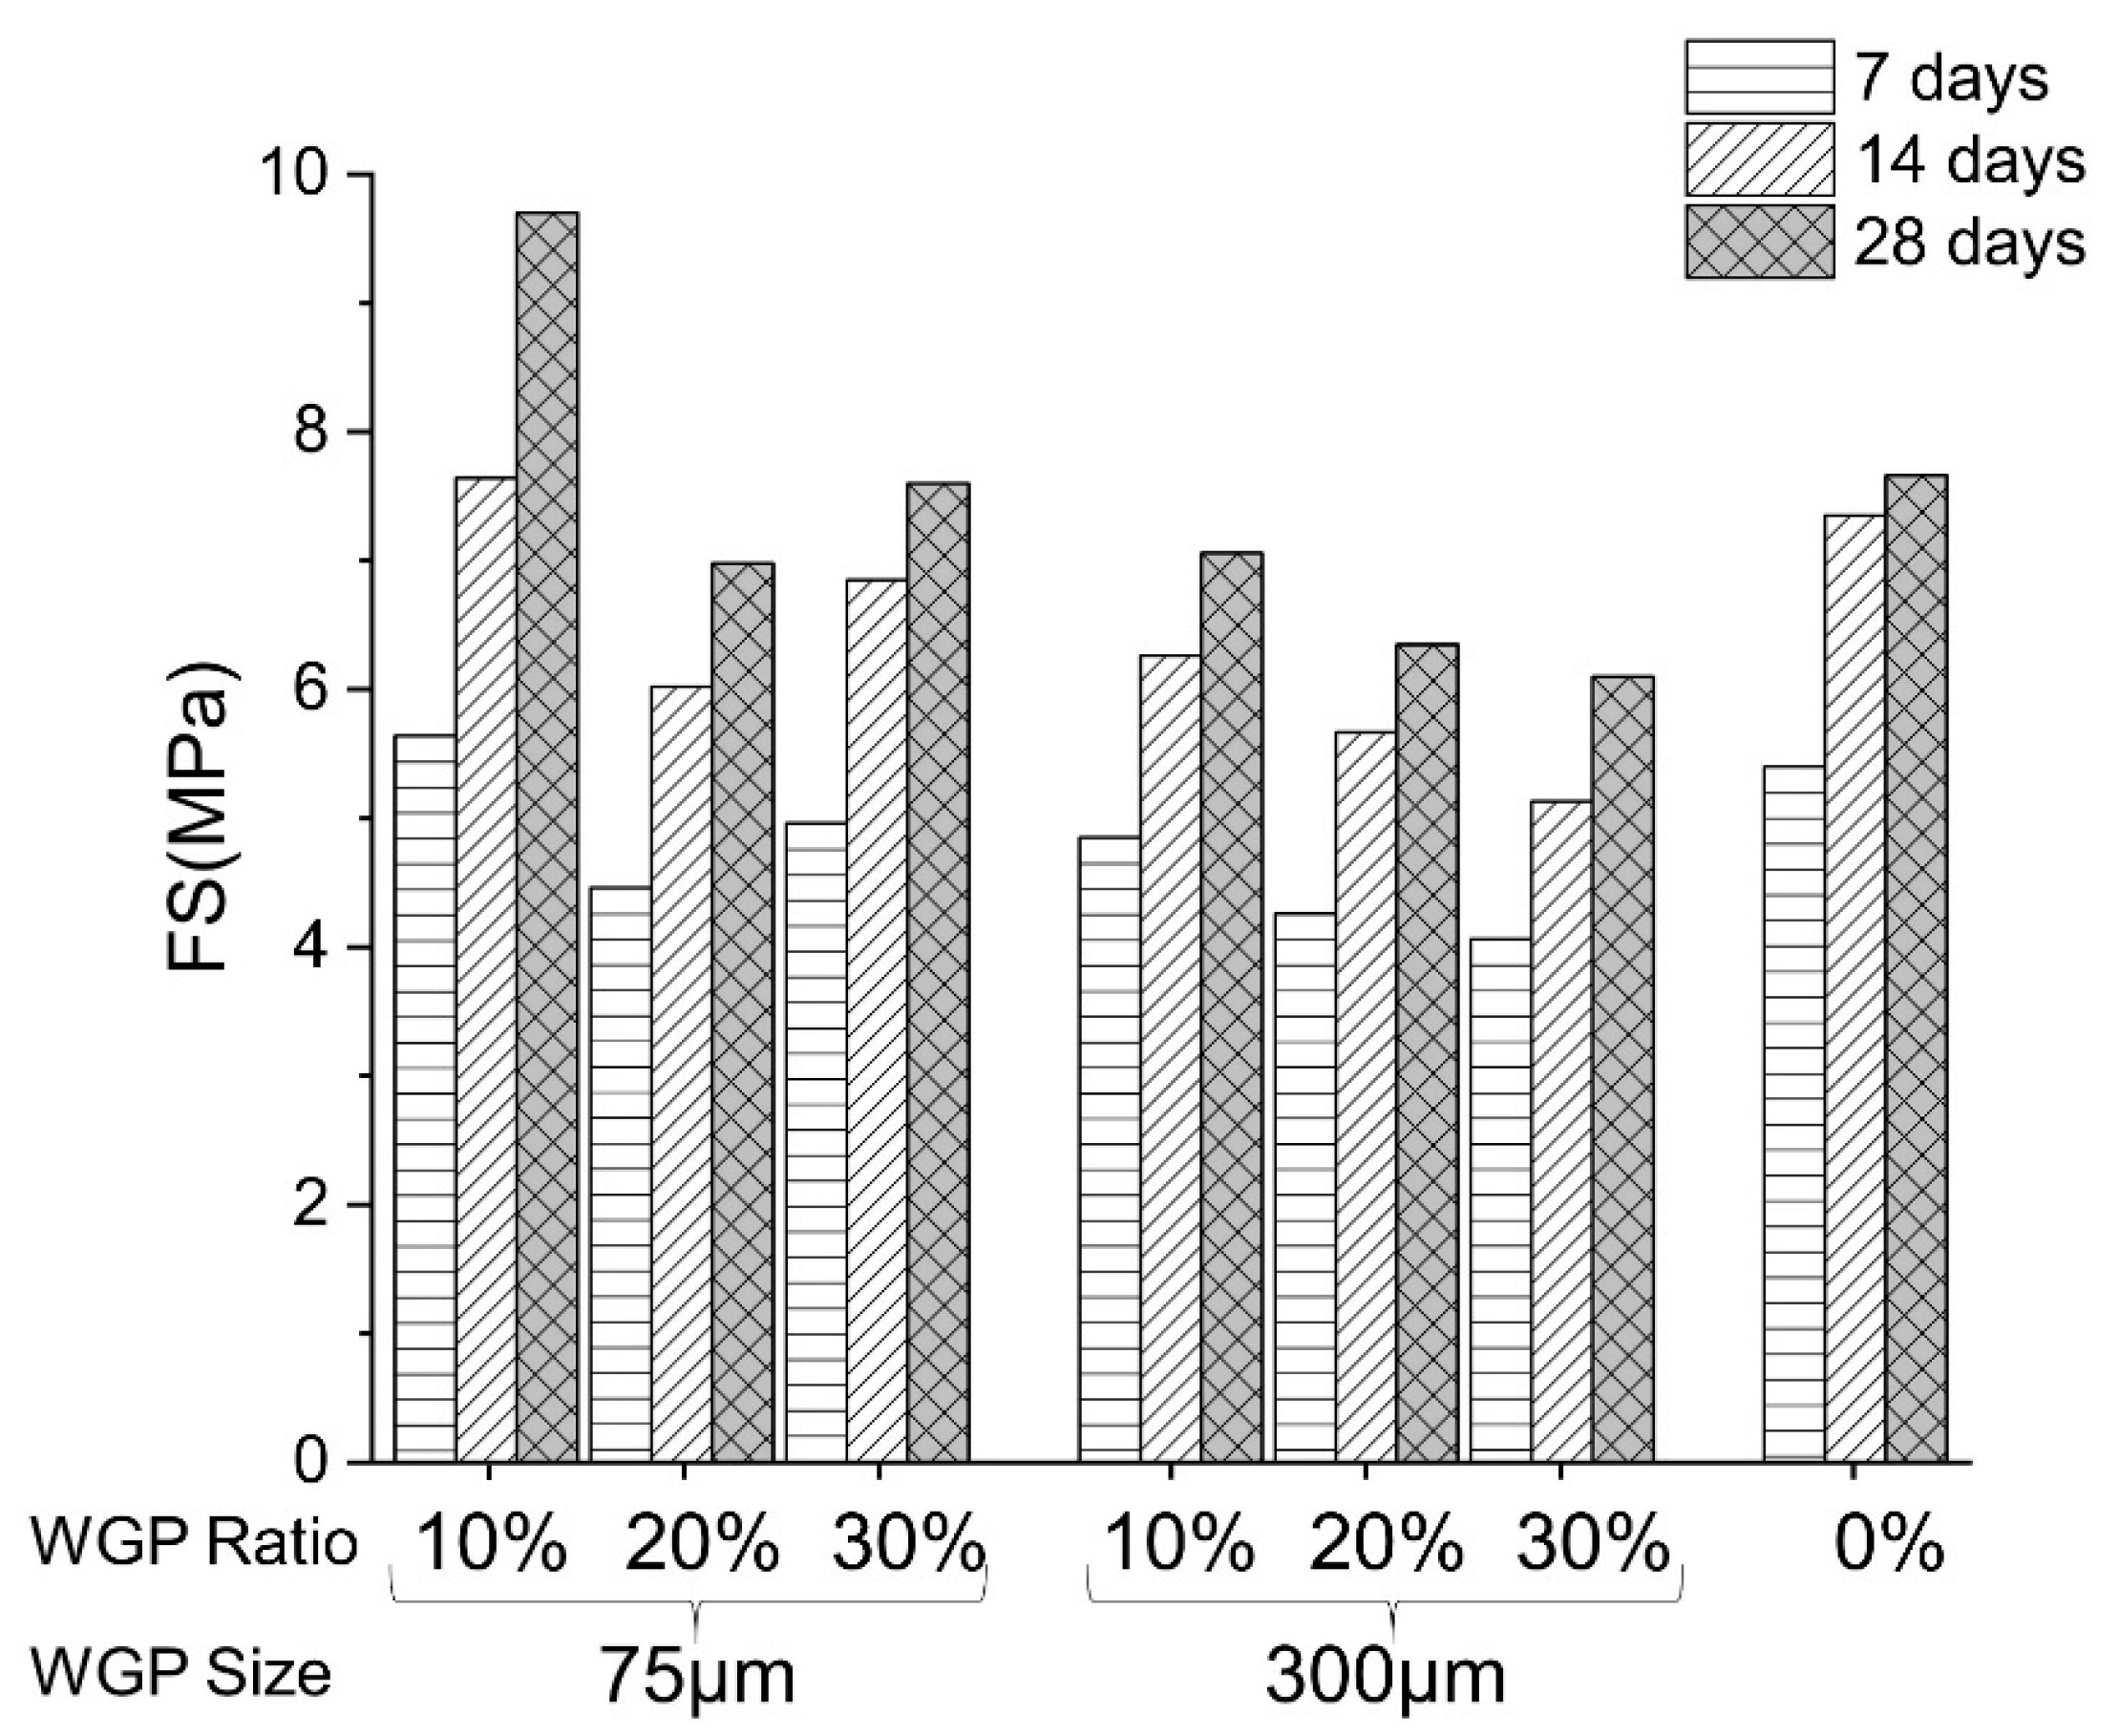
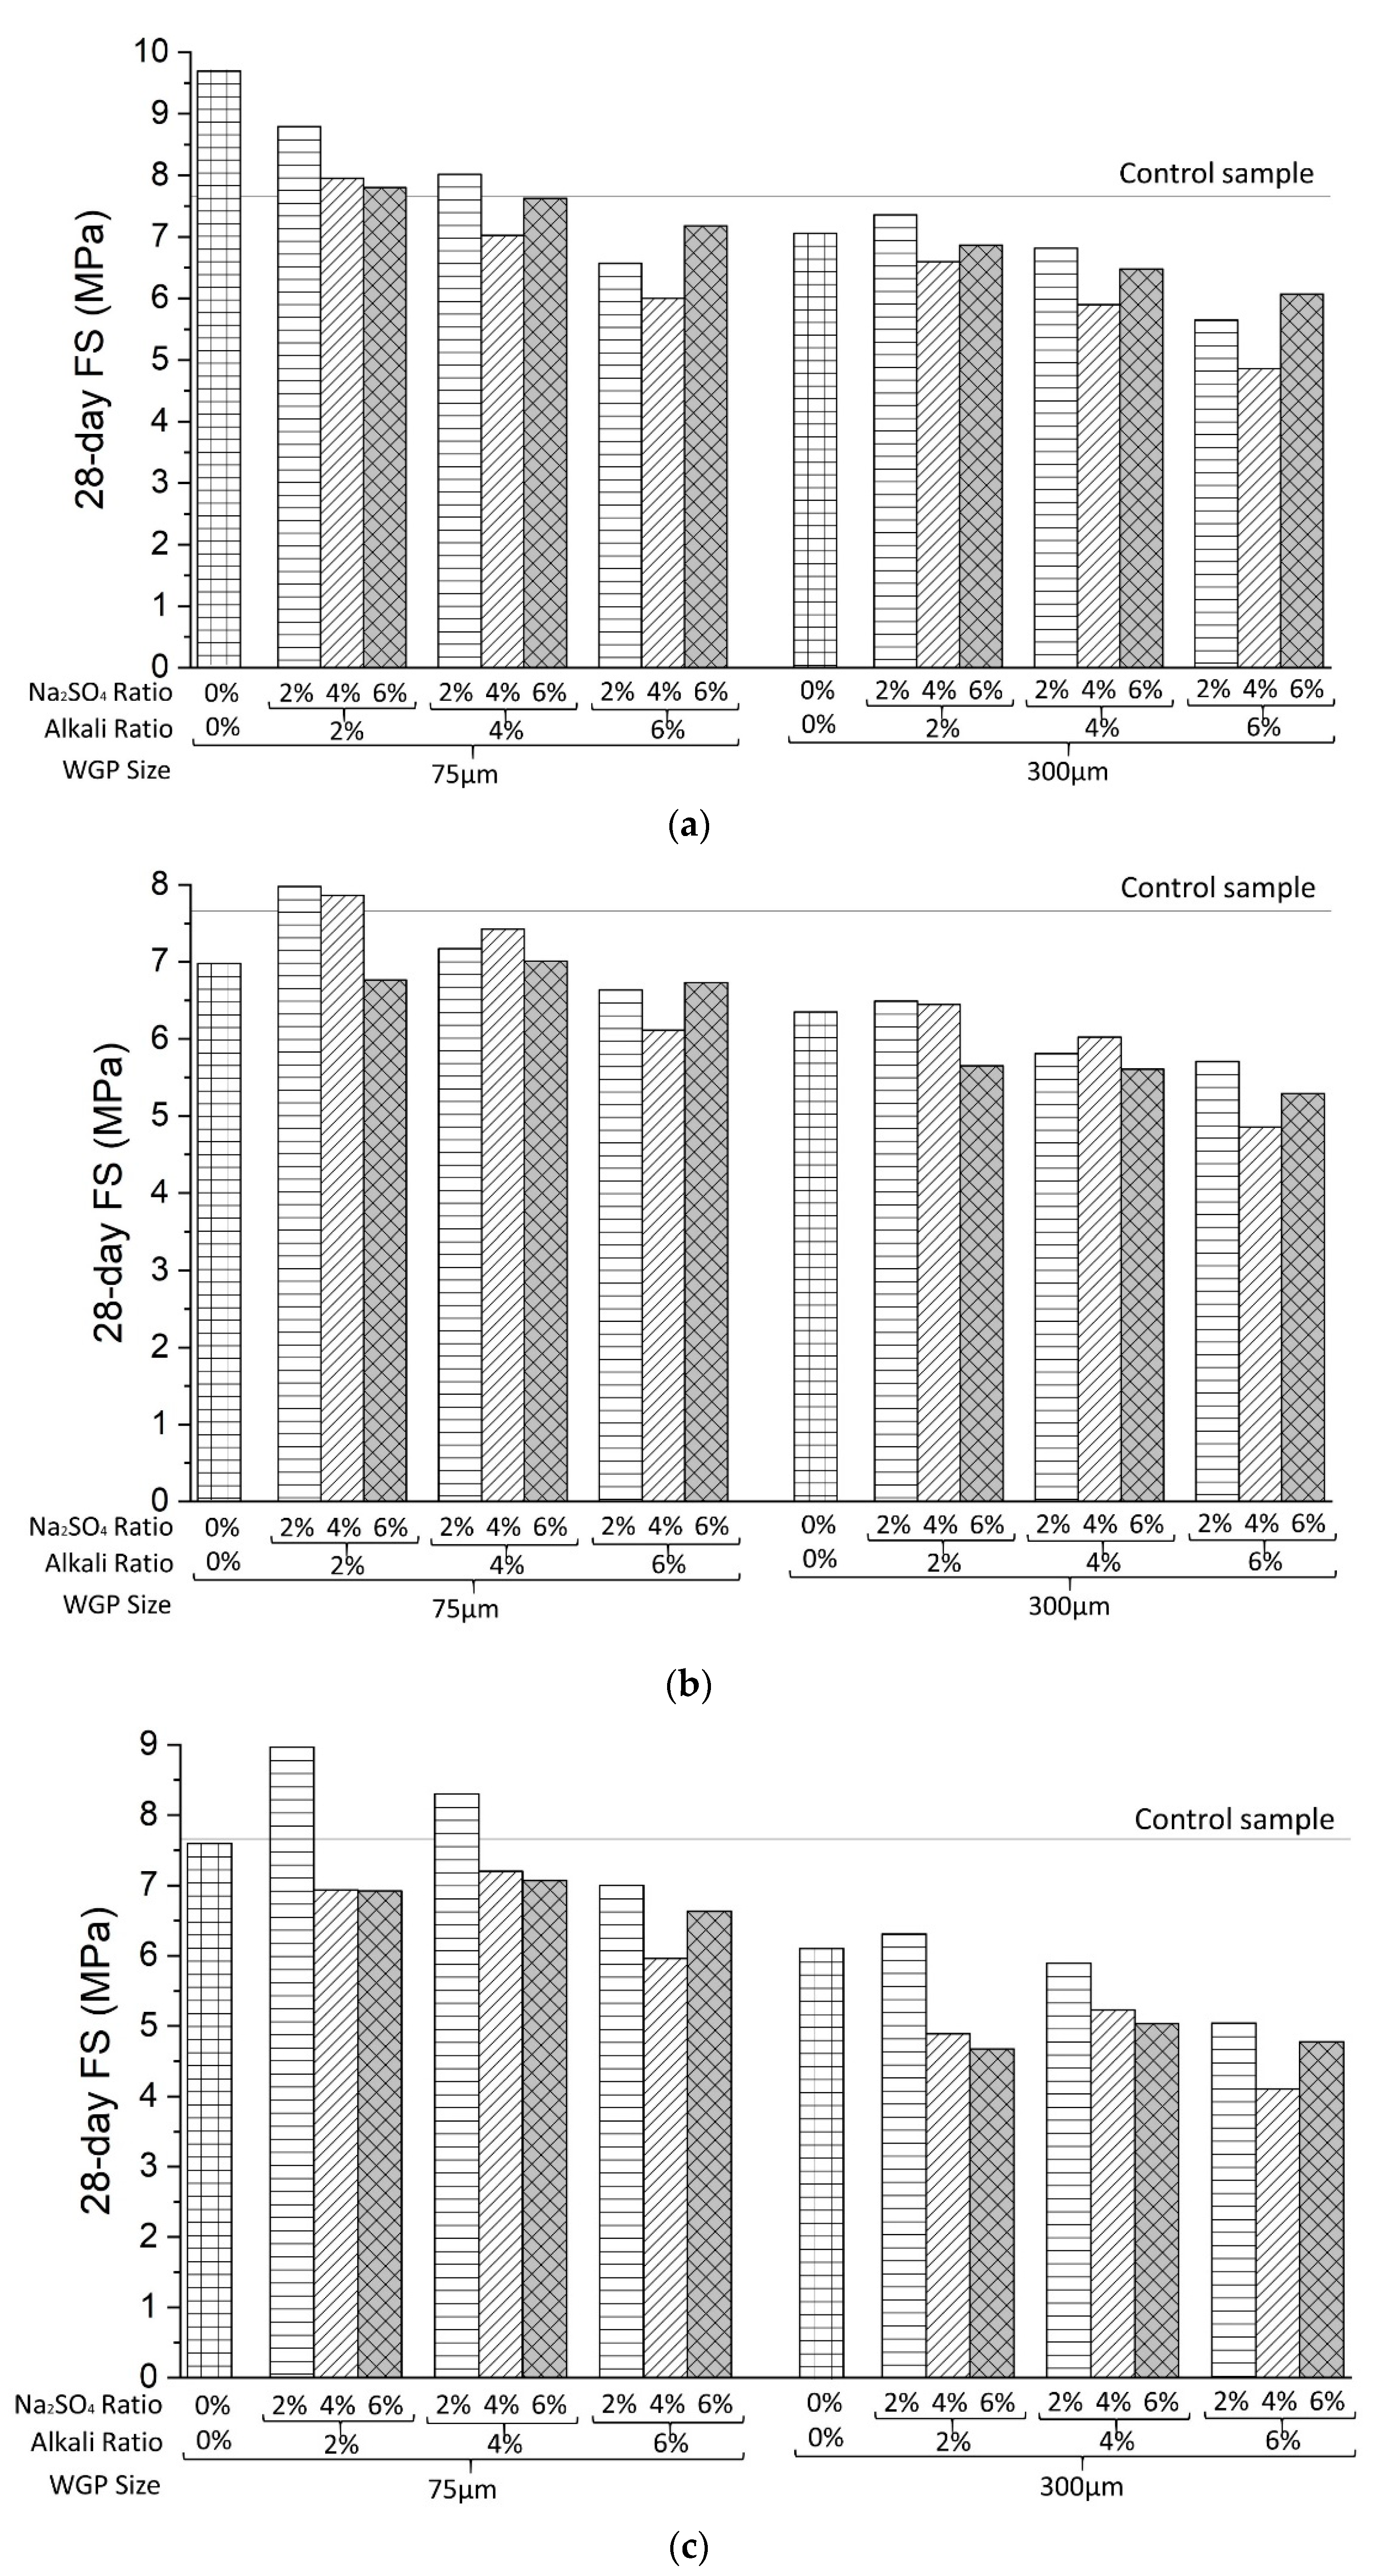
4.1.1. Results of the Flexural Strength Test

Figure 6 shows the FS values of mortar samples containing different WGP substituting ratios without adding chemical agents at 7, 14, and 28 days. Lower FS was observed in specimens containing 300 μm WGP, which agrees with previous findings that coarse glass adversely affected mechanical characteristics [1,57]. In contrast, the mortar specimens containing 75 μm WGP exhibited improved FS, compared to both 300 μm WGP samples and the control one. This phenomenon illustrates the positive effect of mechanical activation in increasing FS. The 10% 75 μm WG proportion showed the highest strength at 9.7 MPa (28 days), which was 26.63% higher than that of the control sample. Moreover, the FS of the sample containing 30% 75 μm WGP was 7.6 MPa, which almost reached the same strength level as the ordinary mortar sample. This is mainly attributed to the bonding strength arising from WGP’s pozzolanic reaction [11,58,59]. When glass’s particle granularity shrank through physical grinding, its stable silica tetrahedron structure would be destroyed, leading to reduced crystallisation and increased reactivity. Meanwhile, the finer WGP had a larger specific surface area and simultaneously compacted the mortar structure through evenly distributed in the pores of the mortar. Therefore, it is effective to increase the FS of WGP mortars by applying a mechanical approach.
Figure 7 compares the 28-day FS results of the mortar samples containing 300 μm and 75 μm WGP (10%, 20%, and 30%) under the chemical activation. When the WGP particle size was 300 μm, the FS increase was only observed in samples containing activated WGP (2% Na2SO4 and 2% alkali), compared to mortars with nonactivated WGP. Meanwhile, the FS in all the 300 μm WGP mortars was less than that in the control sample, illustrating the limited chemical activation effect on coarse glass particles. The opposite phenomenon was observed when the WGP size was mechanically ground into 75 μm. Figure 7c shows the highest FS value (around 9 MPa) on the mortar sample with 30% WGP (75 μm) under the treatment of 2% Na2SO4 and 2% alkali. It was both higher than the 30% nonactivated WGP sample (7.60 MPa) and the normal sample (7.66 MPa), indicating the positive efficacy of the mechanical–chemical activation. However, the FS was reduced provided that the 75 μm activated WGP content was 10%, as shown in Figure 7a. This is mainly due to the excessive ASR expansion that exceeded the ASTM threshold (0.1%) shown in following chapters.
The Na2SO4 and alkali effect on the WGP–cement system is analogous to that on fly ash–cement system considering the slow pozzolanic reaction and similar chemical constituents for WGP and fly ash. According to the previous findings, the Na2SO4 reacts with Ca(OH)2 to generate gypsum and NaOH [60,61]. The gypsum further reacts with the aluminate in cement to generate ettringite (AFt), and NaOH participates in the reaction with Ca(OH)2 and WGP (or fly ash) to produce the additional gels [62,63]. This results in more hydration products compacting the WGP mortar structure and improving the flexural strength. In addition, the Alite (C3S) hydration has been verified to be accelerated under the high concentration of dissolved sulphate ions [60]. Therefore, more calcium silicate hydrates and calcium hydroxide will be generated to further increase mechanical strength.
Regarding the alkali (NaOH and Ca(OH)2) effect, it has been verified to effectively depolymerise WGP structure by destroying the chemical bond between the oxygen atom and silicon [64,65]. Therefore, the WGP stable Silica tetrahedron units can be broken to accelerate the silica dissolution and WGP pozzolanic reaction, as illustrated by many researchers [66,67]. However, the results in Figure 7 also indicated the negative effect of both Na2SO4 and alkali when their contents were over 2%. This was in agreement with the previous investigations that excessive Na2SO4 and alkali would lead to numerous AFt generation and heterogeneous gel production, respectively [64,68]. Therefore, the loose structure can be ultimately formed diminishing the flexural strength. Moreover, the excessive alkali content also increases the risk of detrimental ASR expansion. From the FS test results, the optimal content of chemical agents is 2% Na2SO4 and 2% alkali.

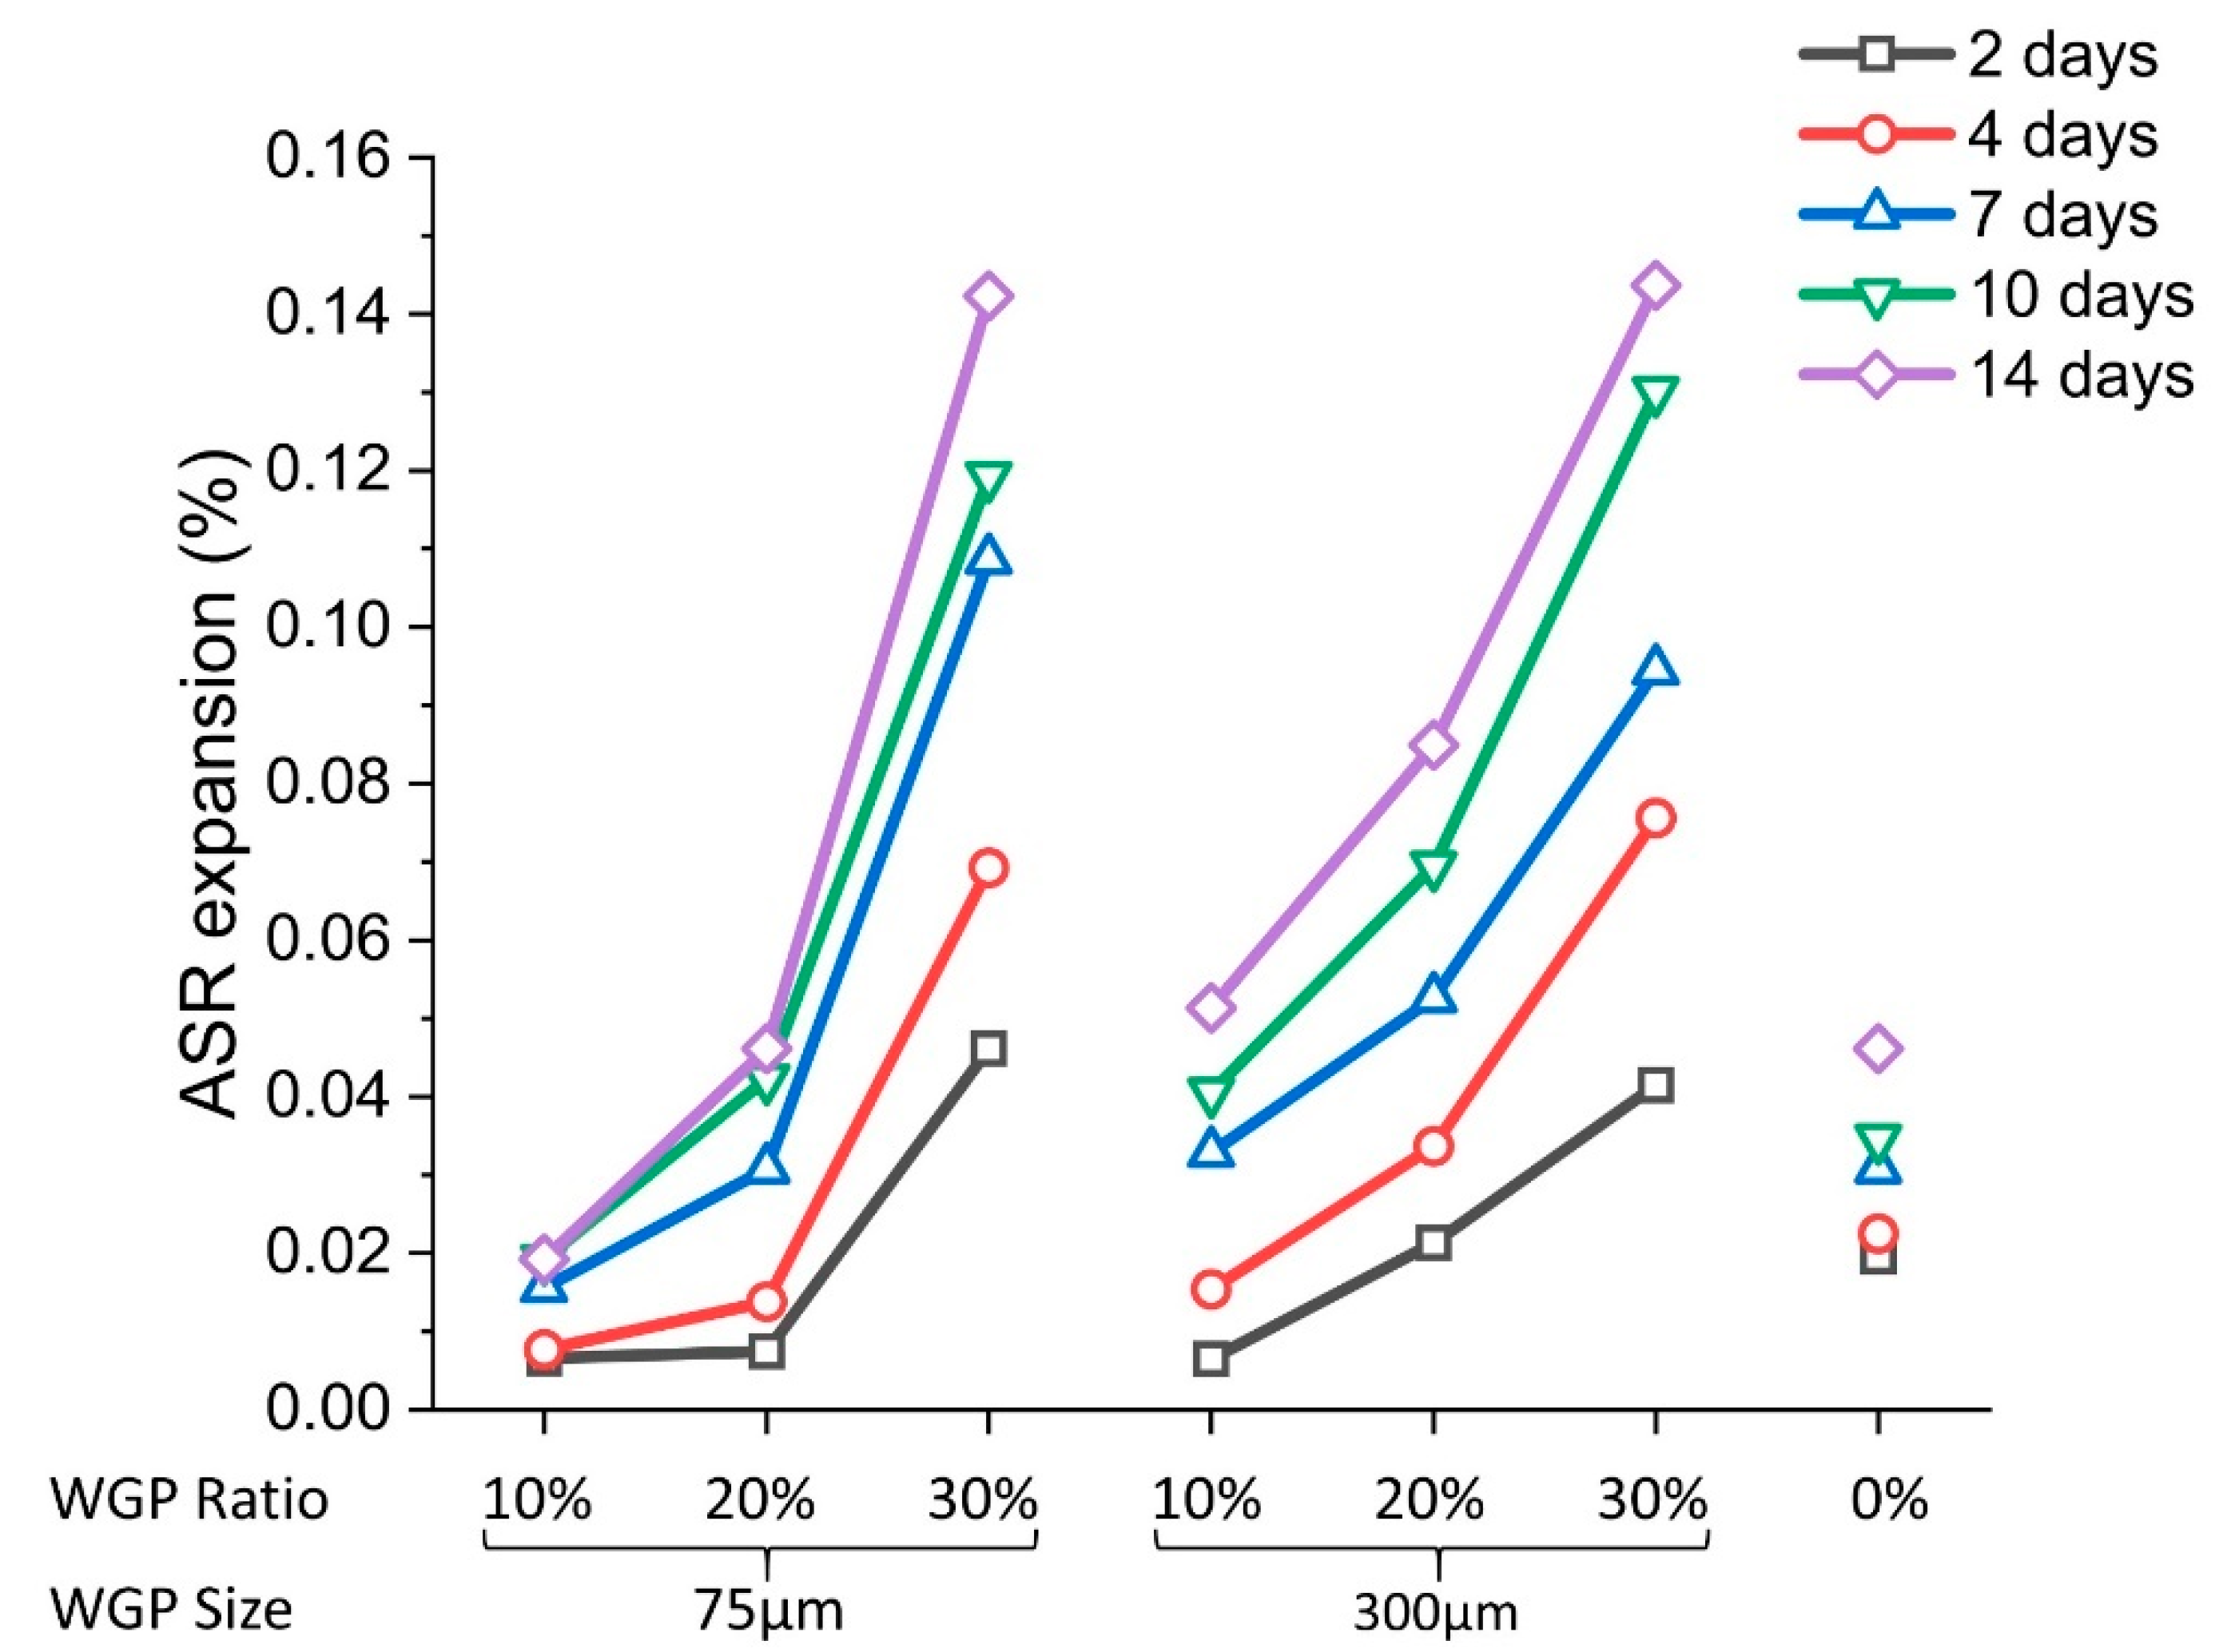
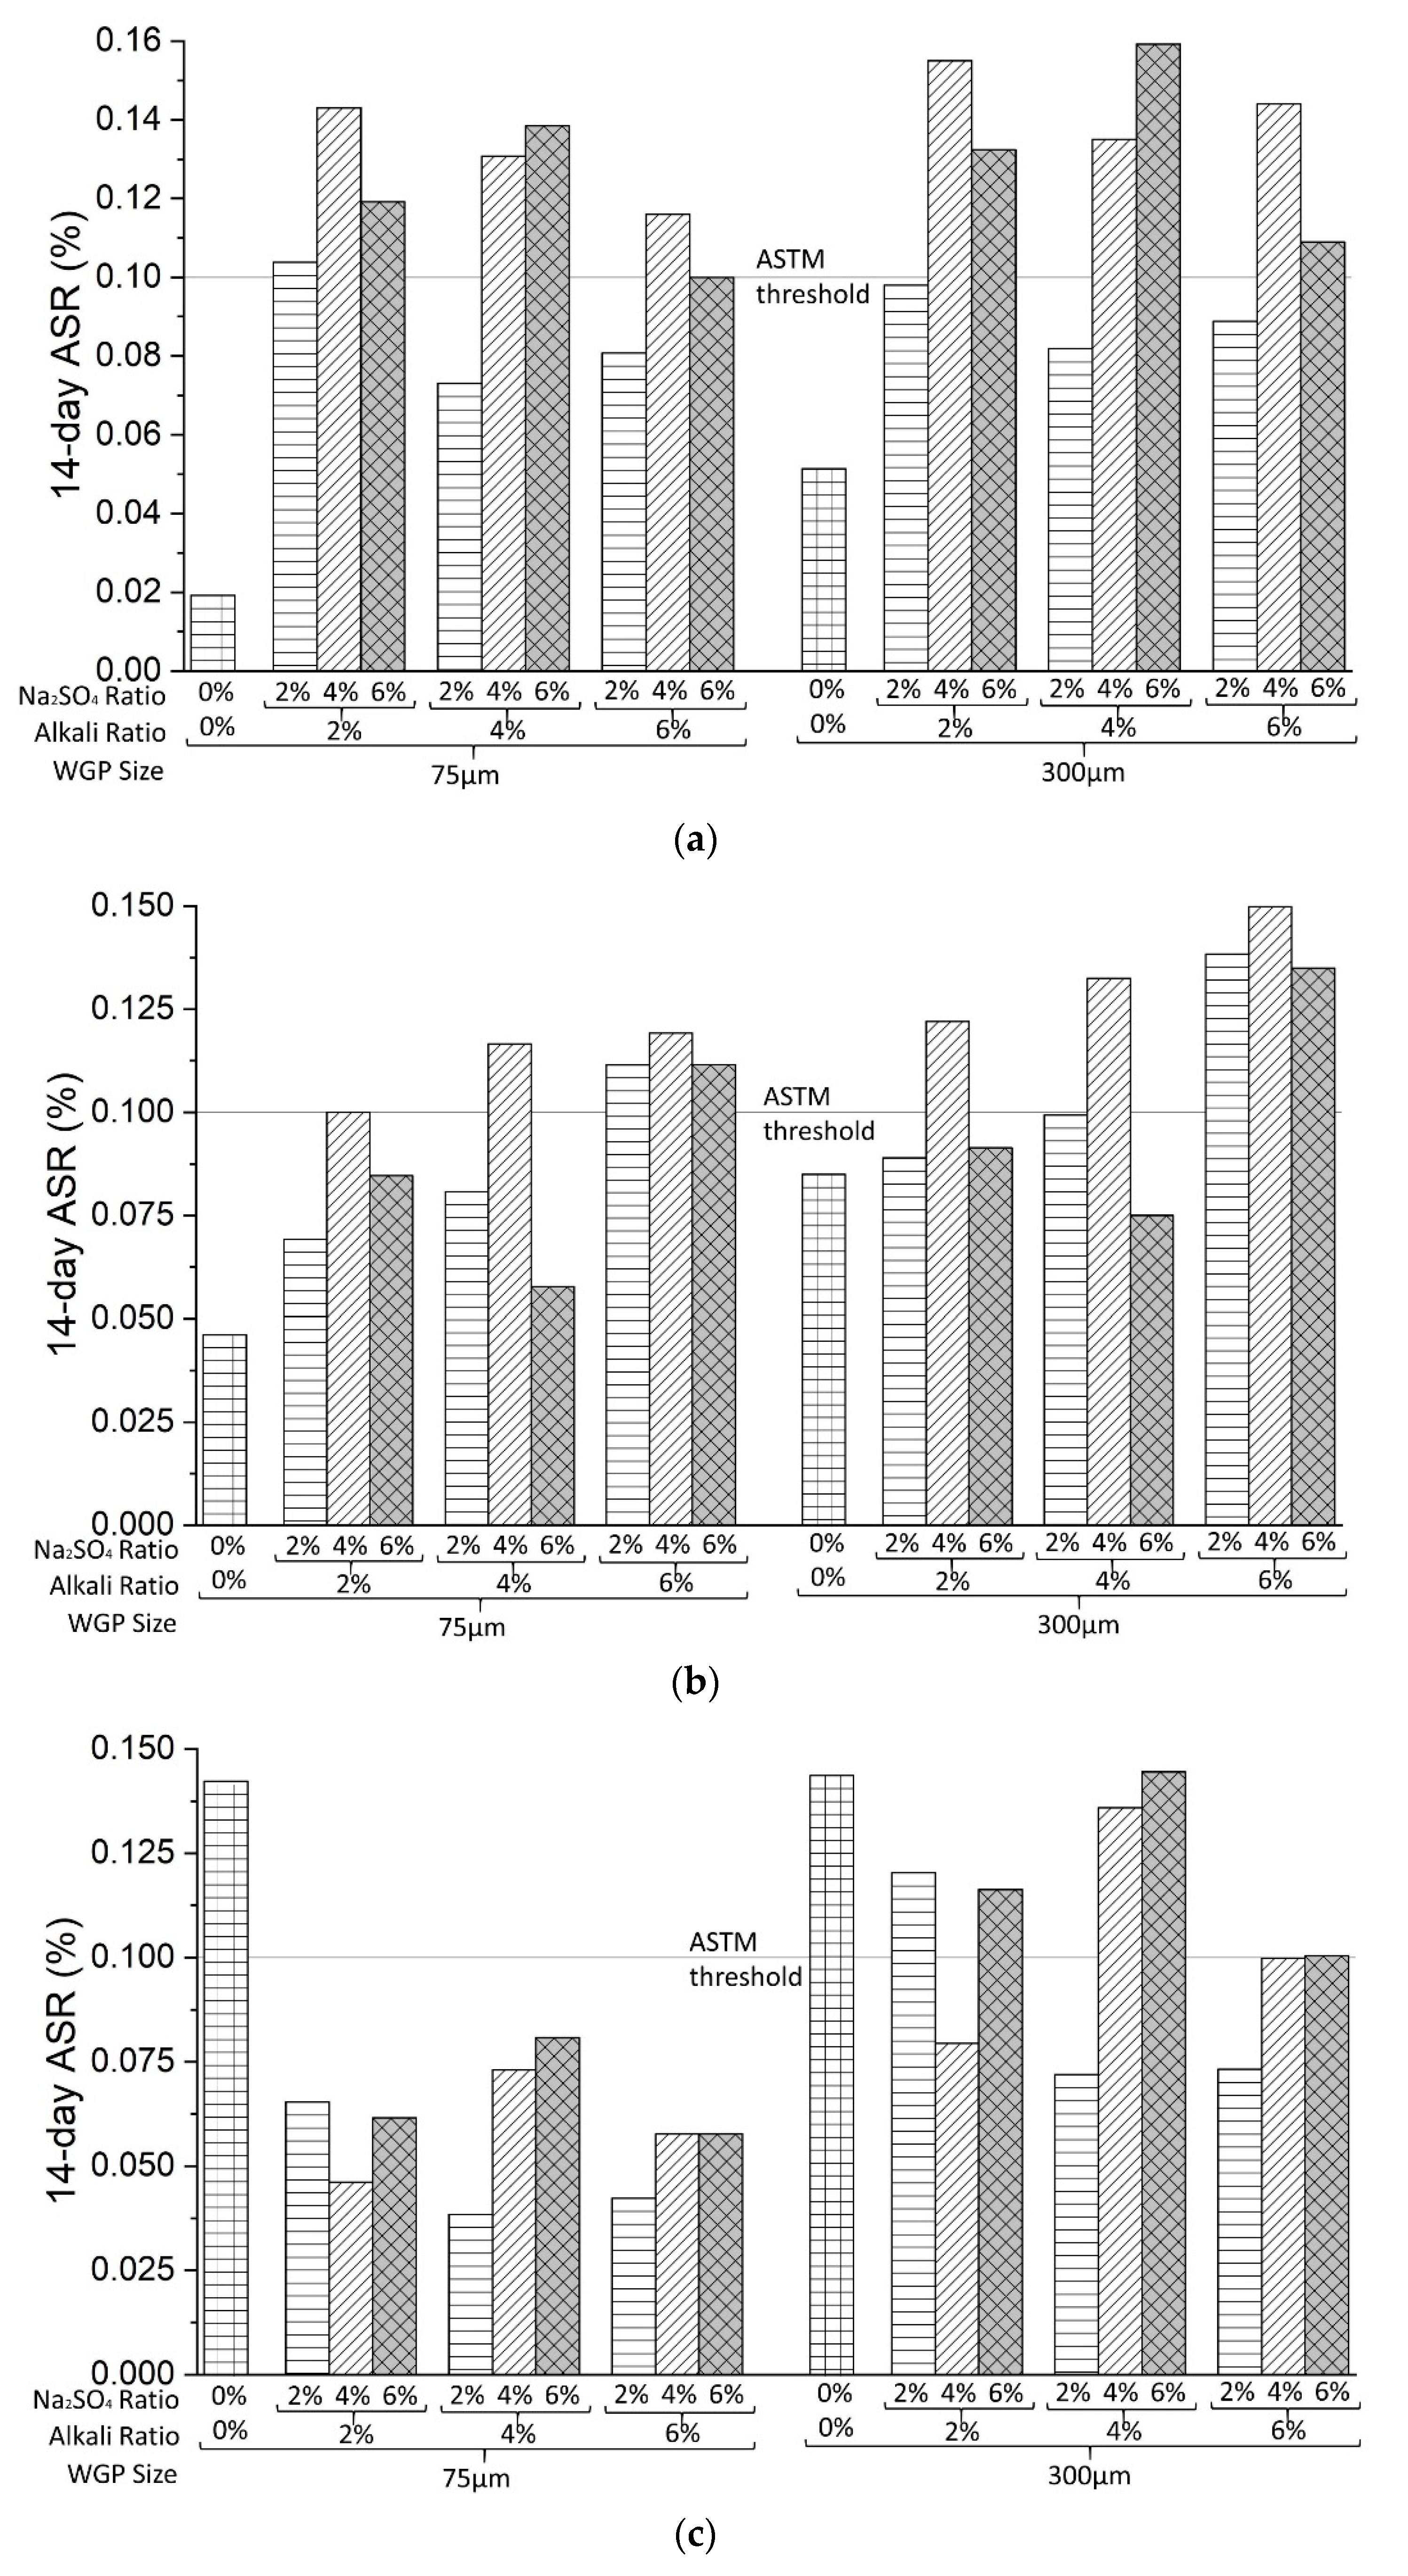
4.1.2. Results of the Alkali–Silica Activation Test

Figure 8 shows the increase in the ASR expansion with curing time. The expansion kept increasing with the rise in the WGP ratio. The 14-day ASR expansion of all mortars containing 300 μm WGP was larger than the expansion of the control specimens. This demonstrates the negative effect of coarse glass powder, which is consistent with the previous investigations [69,70]. In contrast, the mortar sample containing 10% 75 μm WGP showed the lowest expansion value (0.0192% at 14 days), which was much less than the control sample and the ASTM threshold. This resulted from the pozzolanic reaction of WGP, which is prone to generating gels with nonswelling properties [71,72]. However, the excessive ASR expansion was obvious when the WGP (75 μm) ratio was increased to 30%. This phenomenon disagreed with the previous finding that fine glass particle was harmless to the ASR expansion. Du et al. [69] explained that this may be attributed to the microcracking of the glass powder during the grinding process. Although high WGP content can cause detrimental expansion, mechanical grinding’s efficacy in mitigating ASR expansion has been verified.
Figure 9 depicts the impact of chemical activation on 14-day ASR results of samples with different WGP particle sizes and contents. When the WGP ratios were 10% and 20%, the chemical activator showed adverse effects because a larger expansion appeared on chemically excited samples. However, this negative effect turned out to be positive when the WGP ratio was increased to 30%, as shown in Figure 9c. The ASR expansion was 0.0654% for 30% WGP samples activated by 2% Na 2 SO 4 and 2% alkali, which was 54% smaller than that of specimen 75G30. This might be because the alkaline activator increased the concentration of calcium ions, thus generating fewer swelling gels [66,73]. Regarding the chemical activator’s content, the relationship between it and ASR expansion was not obvious, and therefore, ML models were proposed, as discussed in the next section. Generally, chemical activation was feasible in mitigating the detrimental ASR expansion only for mortars with high WGP content. Specifically, the mitigation effect of chemical activator on ASR expansion mainly depended on the WGP content other than the activator’s content. Combined with the FS results, mortars containing 30% 75 μm WGP activated by 2% Na 2 SO 4 and 2% alkali can achieve improved strength and satisfactory potential for ASR expansion.

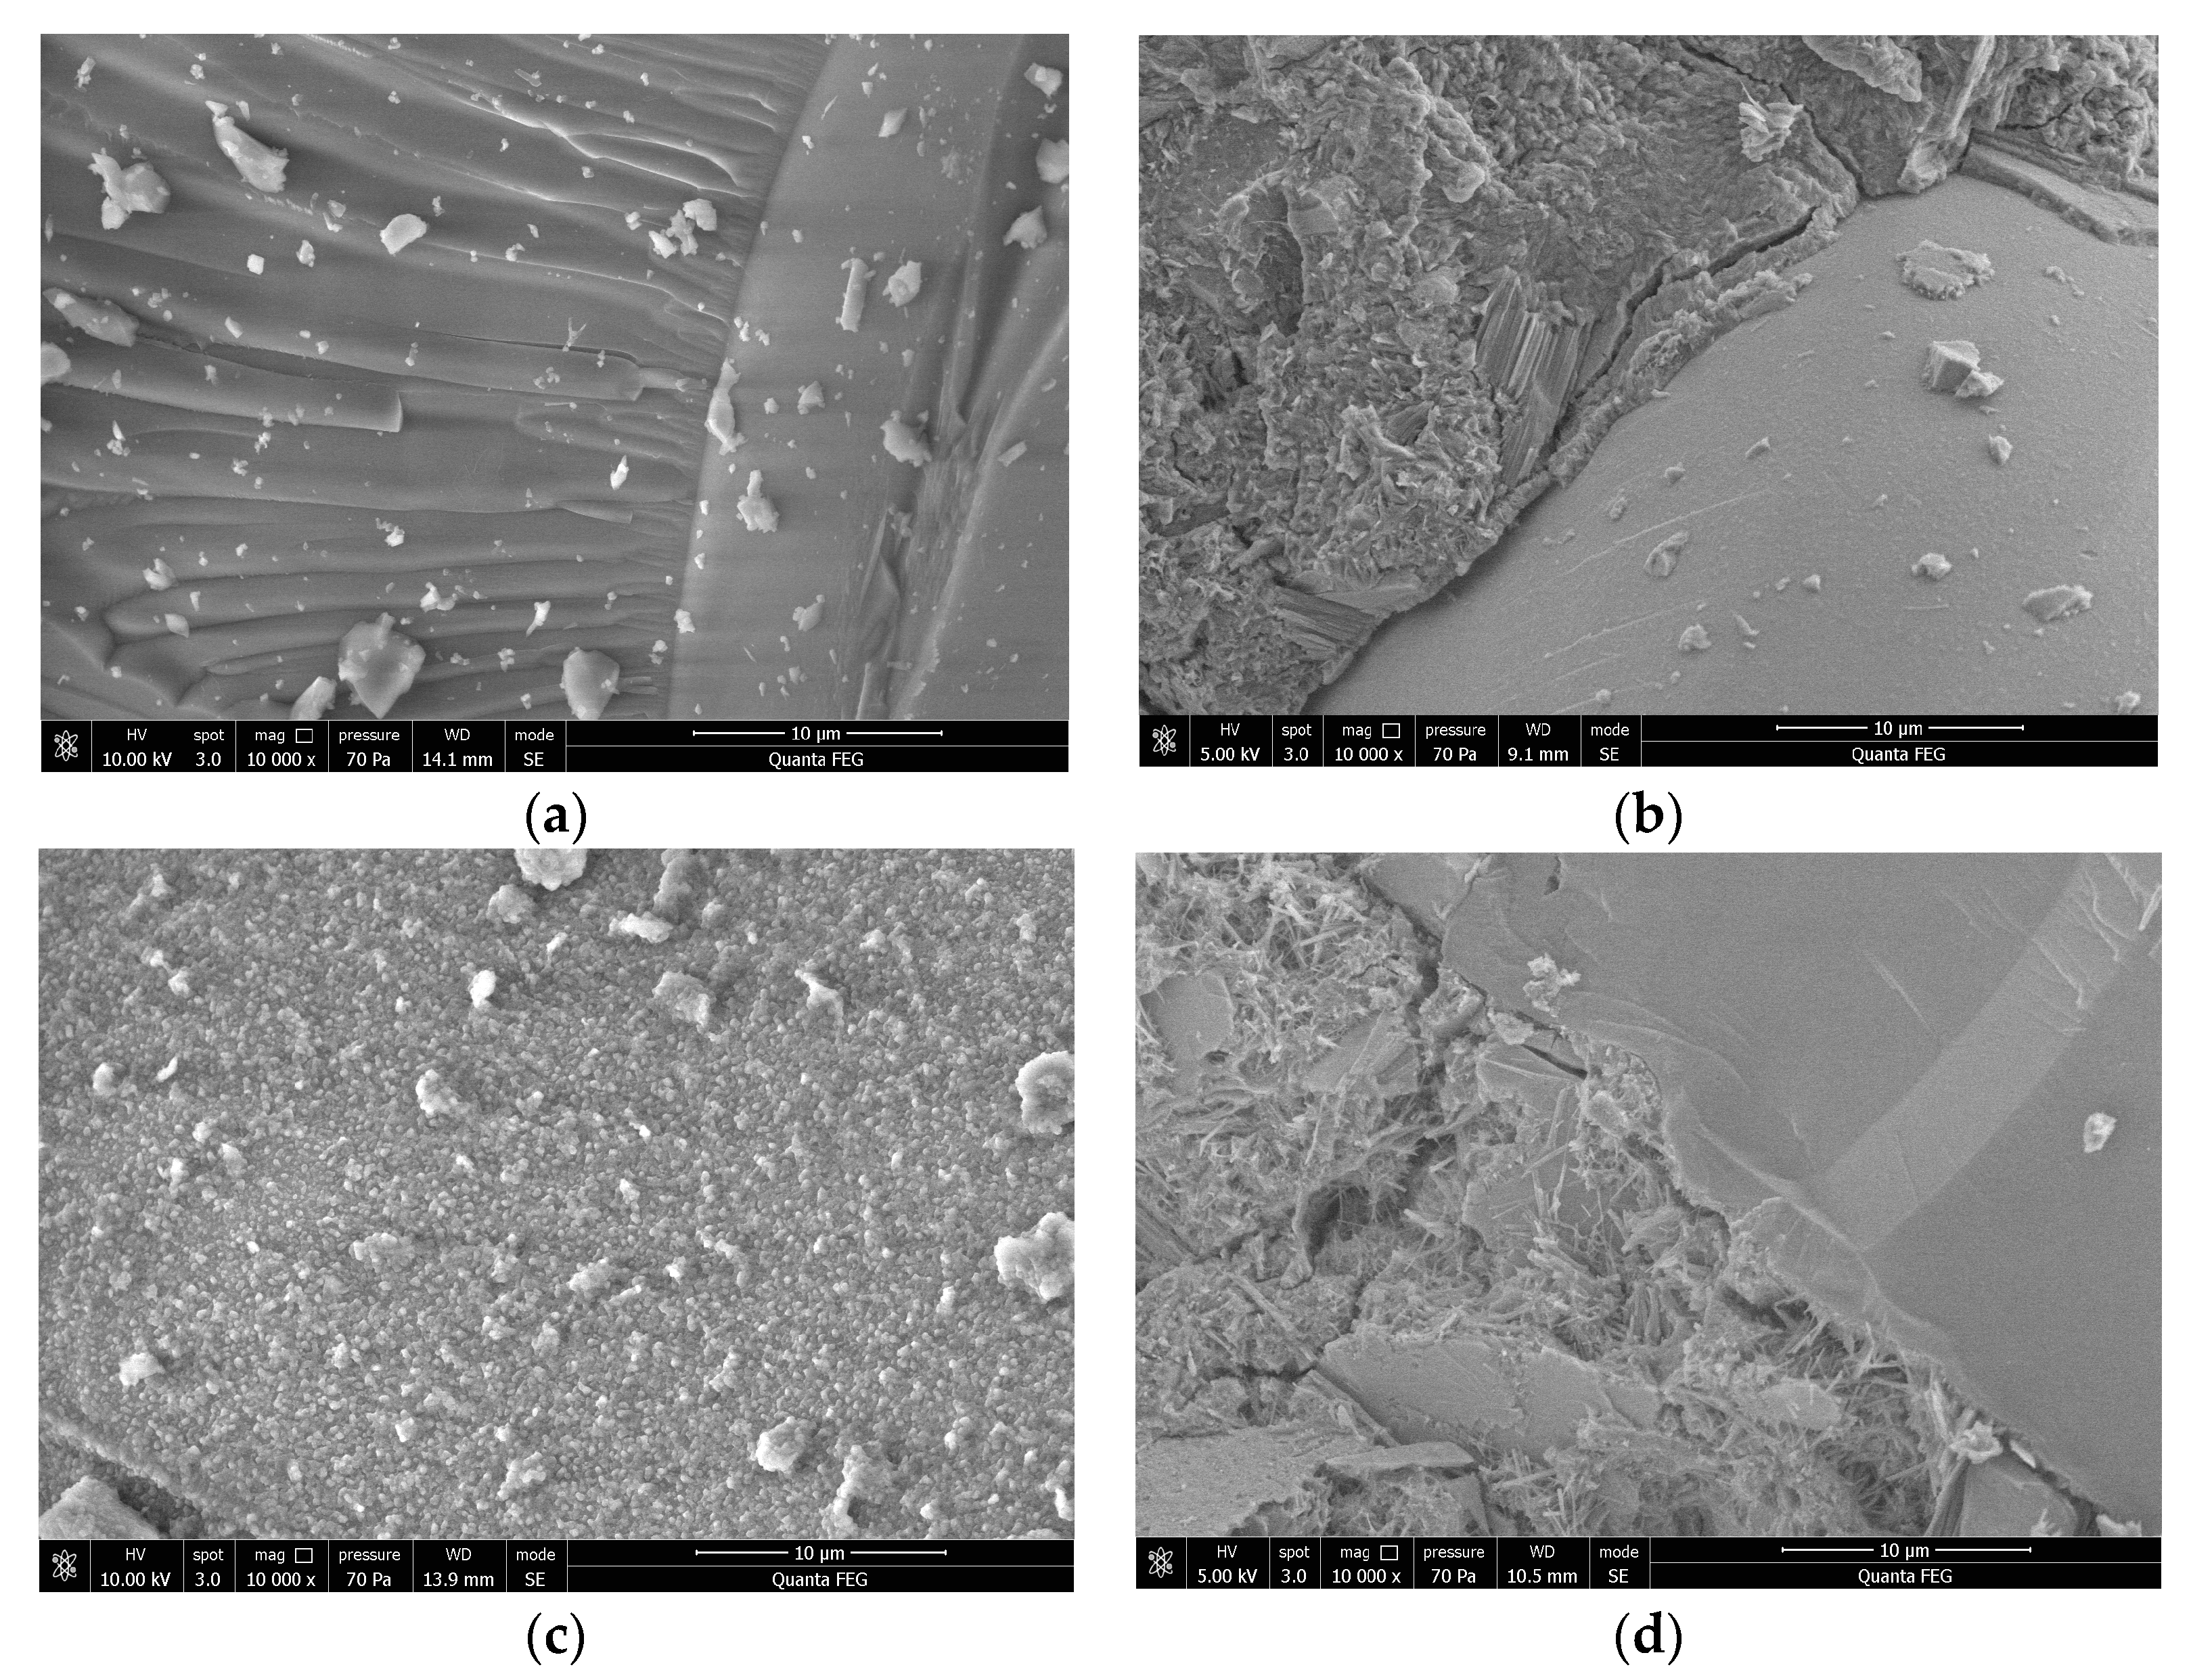
4.1.3. Results of SEM

Figure 10 shows the microstructures of different WGP and mortar samples, exploring the chemical activation’s effect. The relatively smooth surface of the nonactivated WGP was in striking contrast with the eroded surface shown in Figure 10c. This phenomenon indicates the susceptibility of the WGP to chemical activators. Moreover, more hydrates and finer fissures were revealed in the WGP mortar sample activated by 2% alkali and 2% Na 2 SO 4 , compared with the nonactivated one. Figure 10d shows that fewer calcium hydroxide (CH) crystals were detected than in the sample without chemical activation, indicating a more intense pozzolanic reaction. Therefore, the chemical agents promote the pozzolanic activation of WGP and simultaneously increase its mechanical property, as described before, if the activators’ content is moderate.

4.2. Modelling Results

4.2.1. Hyperparameter Tuning

By using BAS and 10-fold CV, the optimal hyperparameters can be obtained from the fold having the minimum RMSE. As shown in Figure 11, the first and fourth folds achieved the minimum RMSE in the process of FS and ASR modelling. The RMSE converged during the 50 iterations, illustrating the success of hyperparameter tuning and model establishment. Finally, the optimal hyperparameters chosen for FS and ASR datasets were both m i n N u m l e a f = 1 and n u m T r e e = 87 .

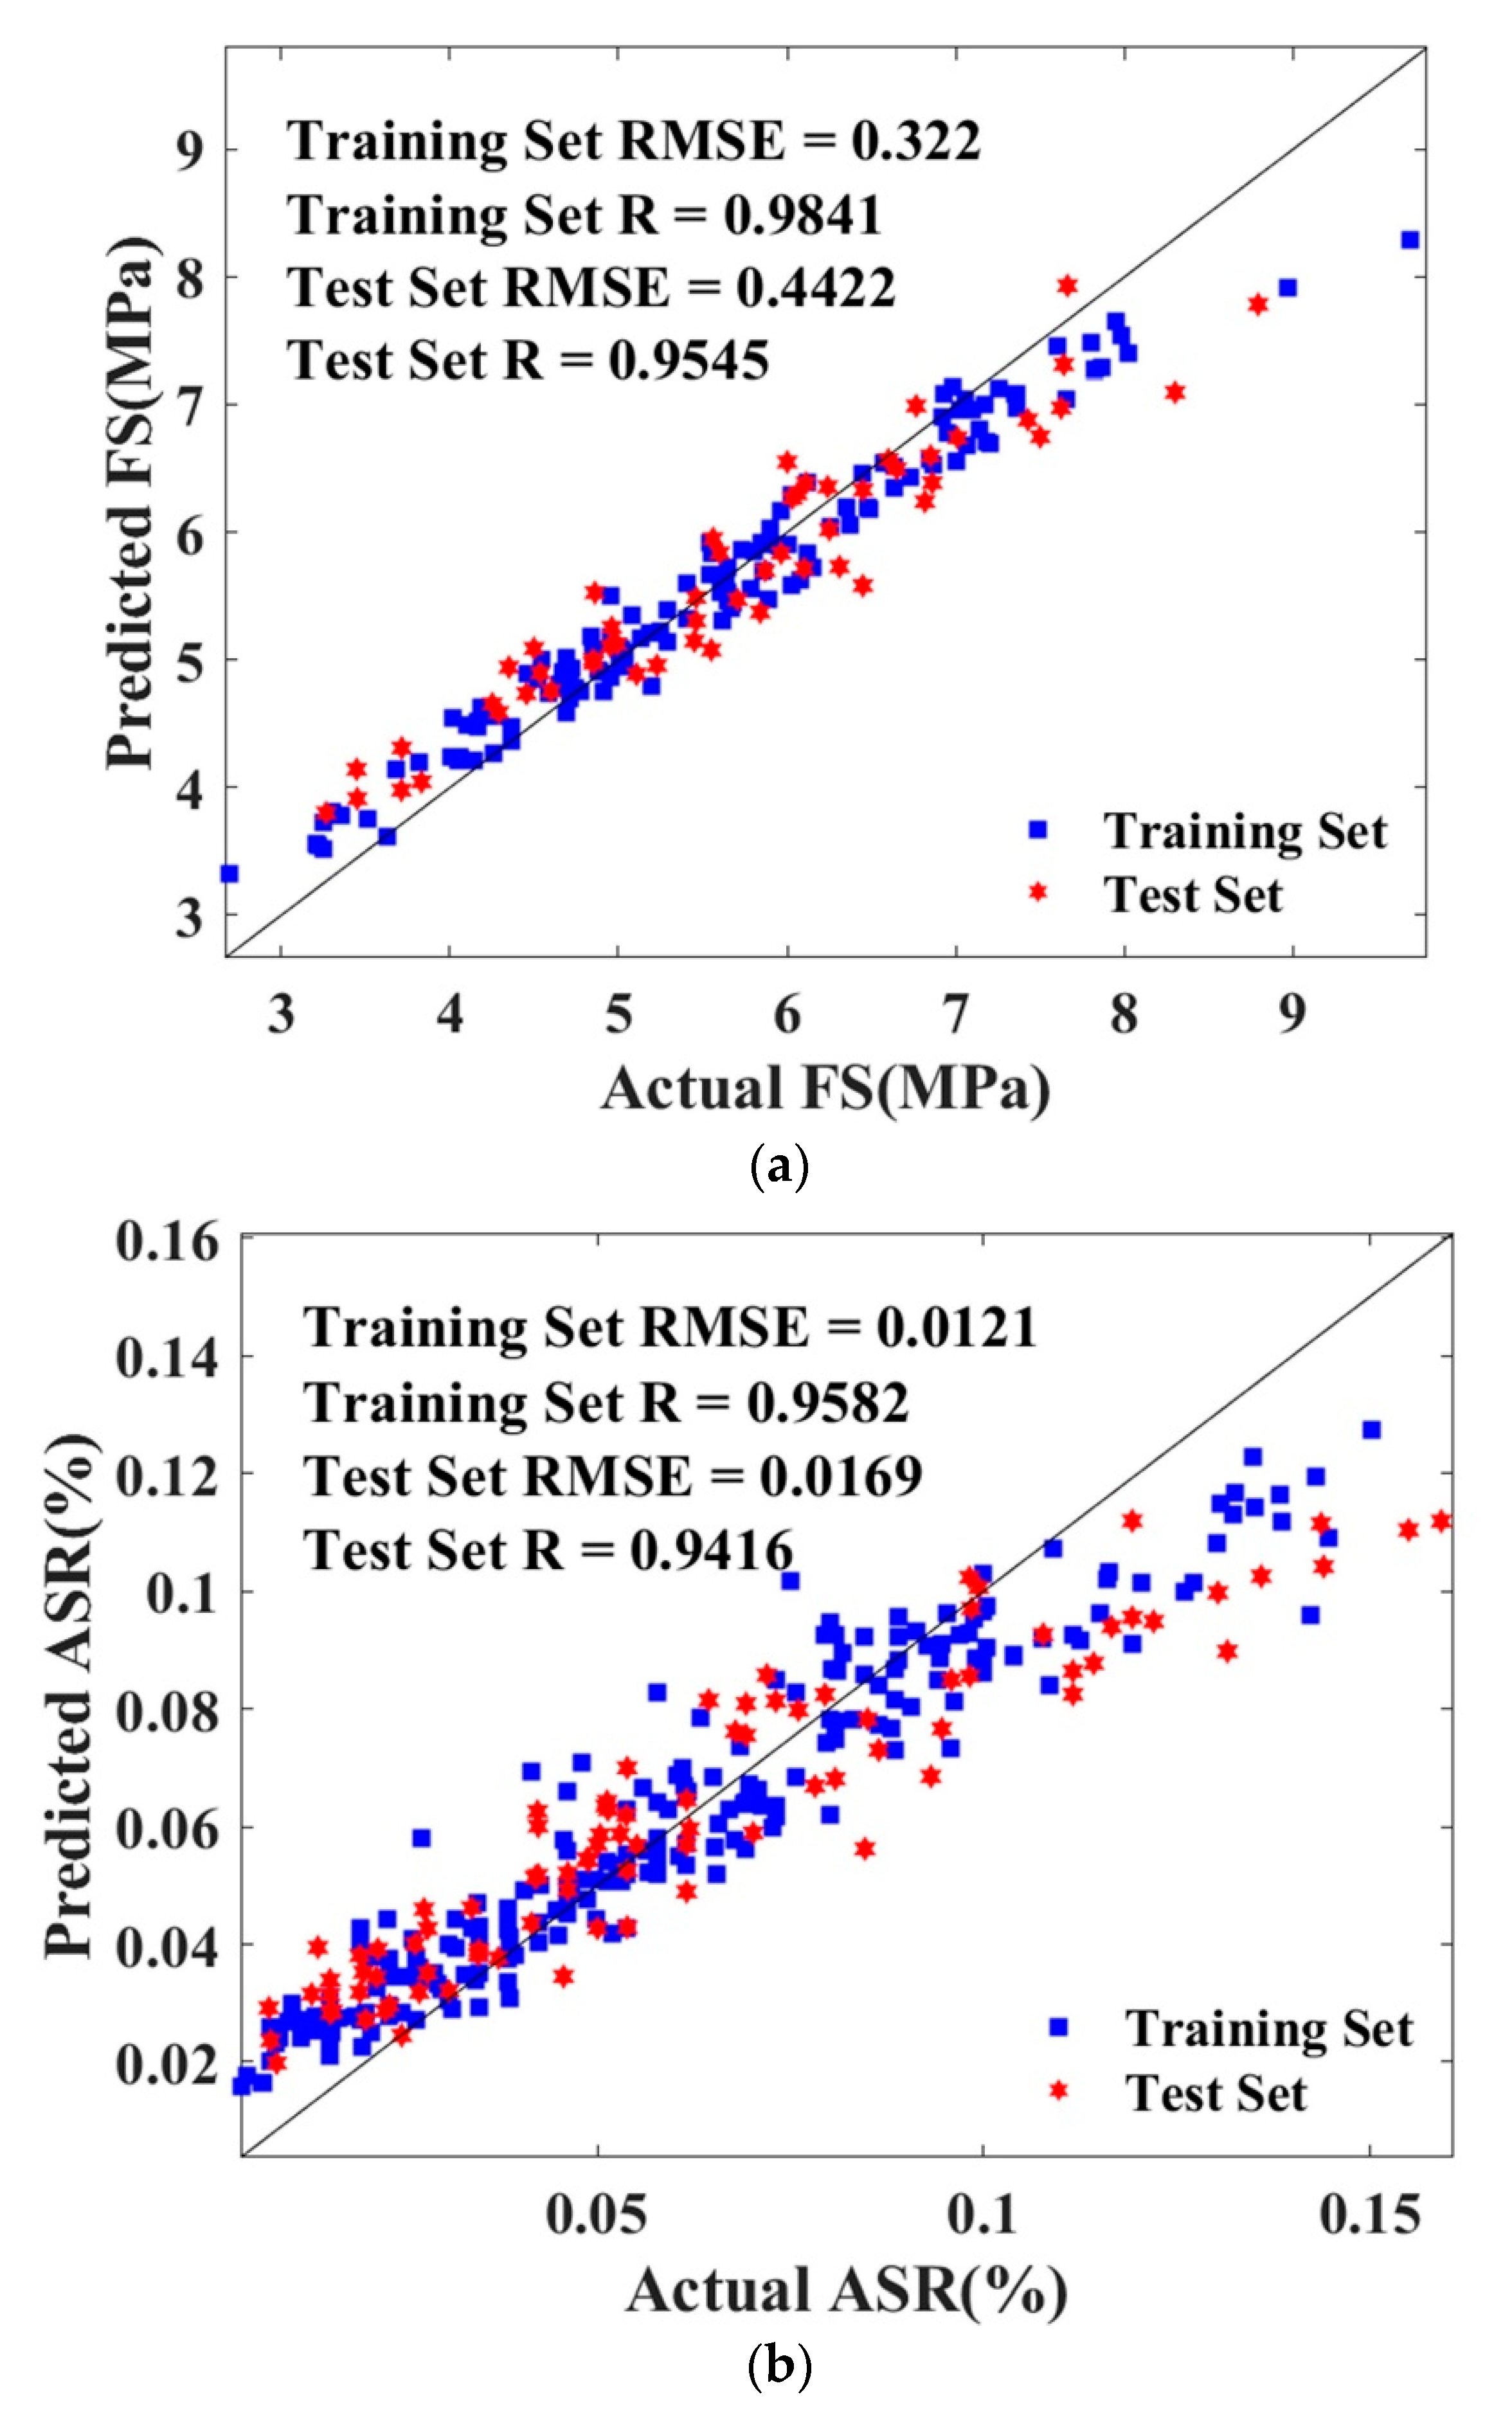
4.2.2. Performance of BAS-RF for FS and ASR Expansion Modelling

The capability of the RF model with adjusted hyperparameters was verified by assessing the predictive precision of the test group. In Figure 12, the predicted and actual FS and ASR values in the training and test groups are presented. The relationship between the predicted and actual outcomes was estimated by calculating the RMSE and correlation coefficient. Apart from minor RMSE values, high correlation coefficients were observed for both training (FS: 0.9841, ASR: 0.9582) and test sets (FS: 0.9545, ASR: 0.9416). Therefore, the prediction performance of the ML models was accurate and reliable. Furthermore, the RMSE/R values of the training set and test set were close illustrating that no overfitting problem existed.

4.2.3. Comparison of Two Baseline Models with the BAS-RF

The precision of the BAS-RF model, compared with the other two (LR and MLR), is shown in Figure 13 through boxplots and Taylor diagrams. The difference between the predicted and actual sample values is indicated in the boxplot. In Figure 13a, the RF model had a lower median value (the red line) and a more condensed interquartile range (the space between the upper and lower blue lines). This phenomenon indicated a lower prediction error than the other two baseline models. In addition, the upper limit of the RF was lower than the LR and MLR, although one outlier was observed, illustrating the high accuracy of the RF model. In Figure 13b, the RF model was also more accurate in predicting ASR values than LR and MLR because of its condensed interquartile range although several outliers appeared. Moreover, three model evaluation indices (standard deviation, RMSE, and R) are integrated into the polar coordinates, as shown in Figure 13c,d. The two RF models were both in the closest position to the “actual” points with the uppermost R-value, minimum RMSE, and lowest standard deviation values. Owing to the highest prediction accuracy and lowest error among the three ML models, the BAS-RF model is the most suitable to predict the FS and ASR values of WGP modified mortar.

4.3. Variable Significance for FS and ASR Expansion

The effects of the variables on the FS and ASR results were quantified as the importance ratio presented in Figure 14. The curing time is the most significant factor for both FS and ASR expansion. The WGP particle size was the second important variable for FS (26%), thus remarkably affecting the mechanical strength of mortars containing WGP. This was followed by the alkali content (18%) and the WGP replacement ratio (12%). Further, Na 2 SO 4 appeared less important than alkali, which agrees with the experimental findings. For the ASR expansion, the WGP replacement ratio became the most significant factor (16%) except for the curing time. This agreed with the experimental results that ASR expansion significantly depended on the WGP replacement ratio other than the activator’s content. Moreover, the alkali content was less important than Na 2 SO 4 , which is reasonable since the 1 N NaOH solution was used to immerse the samples. In conclusion, the importance measure provides a quantitative analysis of input variables, indicating that the WGP’s particle size and replacement ratio are the most crucial parameters (except curing time) for FS and ASR, respectively.

5. Conclusions

In this study, the characteristics of mortars containing WGP were investigated by conducting FS and ASR expansion tests. Based on the experimental data set, three ML models were applied to simulate the FS and expansion values. The prediction results were consistent with the actual figures and the essential conclusions were described as follows:
  • WGP’s mechanical grinding significantly improved the FS of WGP mortars. The chemical activation was only effective when the amounts of the chemical agents were appropriate. The combined activation exhibited the most remarkable efficacy; the FS of the sample containing 30% WGP that underwent the combined activation method was 8.97 MPa (18% higher than the sample subjected to mechanical excitation only).
  • Mechanical activation mitigated ASR expansion, and chemical activation was also feasible when the WGP content was 30%. The ASR expansion was 0.0654% (54% lower than the nonactivated one) for the sample that had 30% of WGP with combined activation. This illustrates the effectiveness of combined activation. The SEM results also verified its efficacy which improved the pozzolanic activity of WGP and concurrently compacted the mortars’ structure.
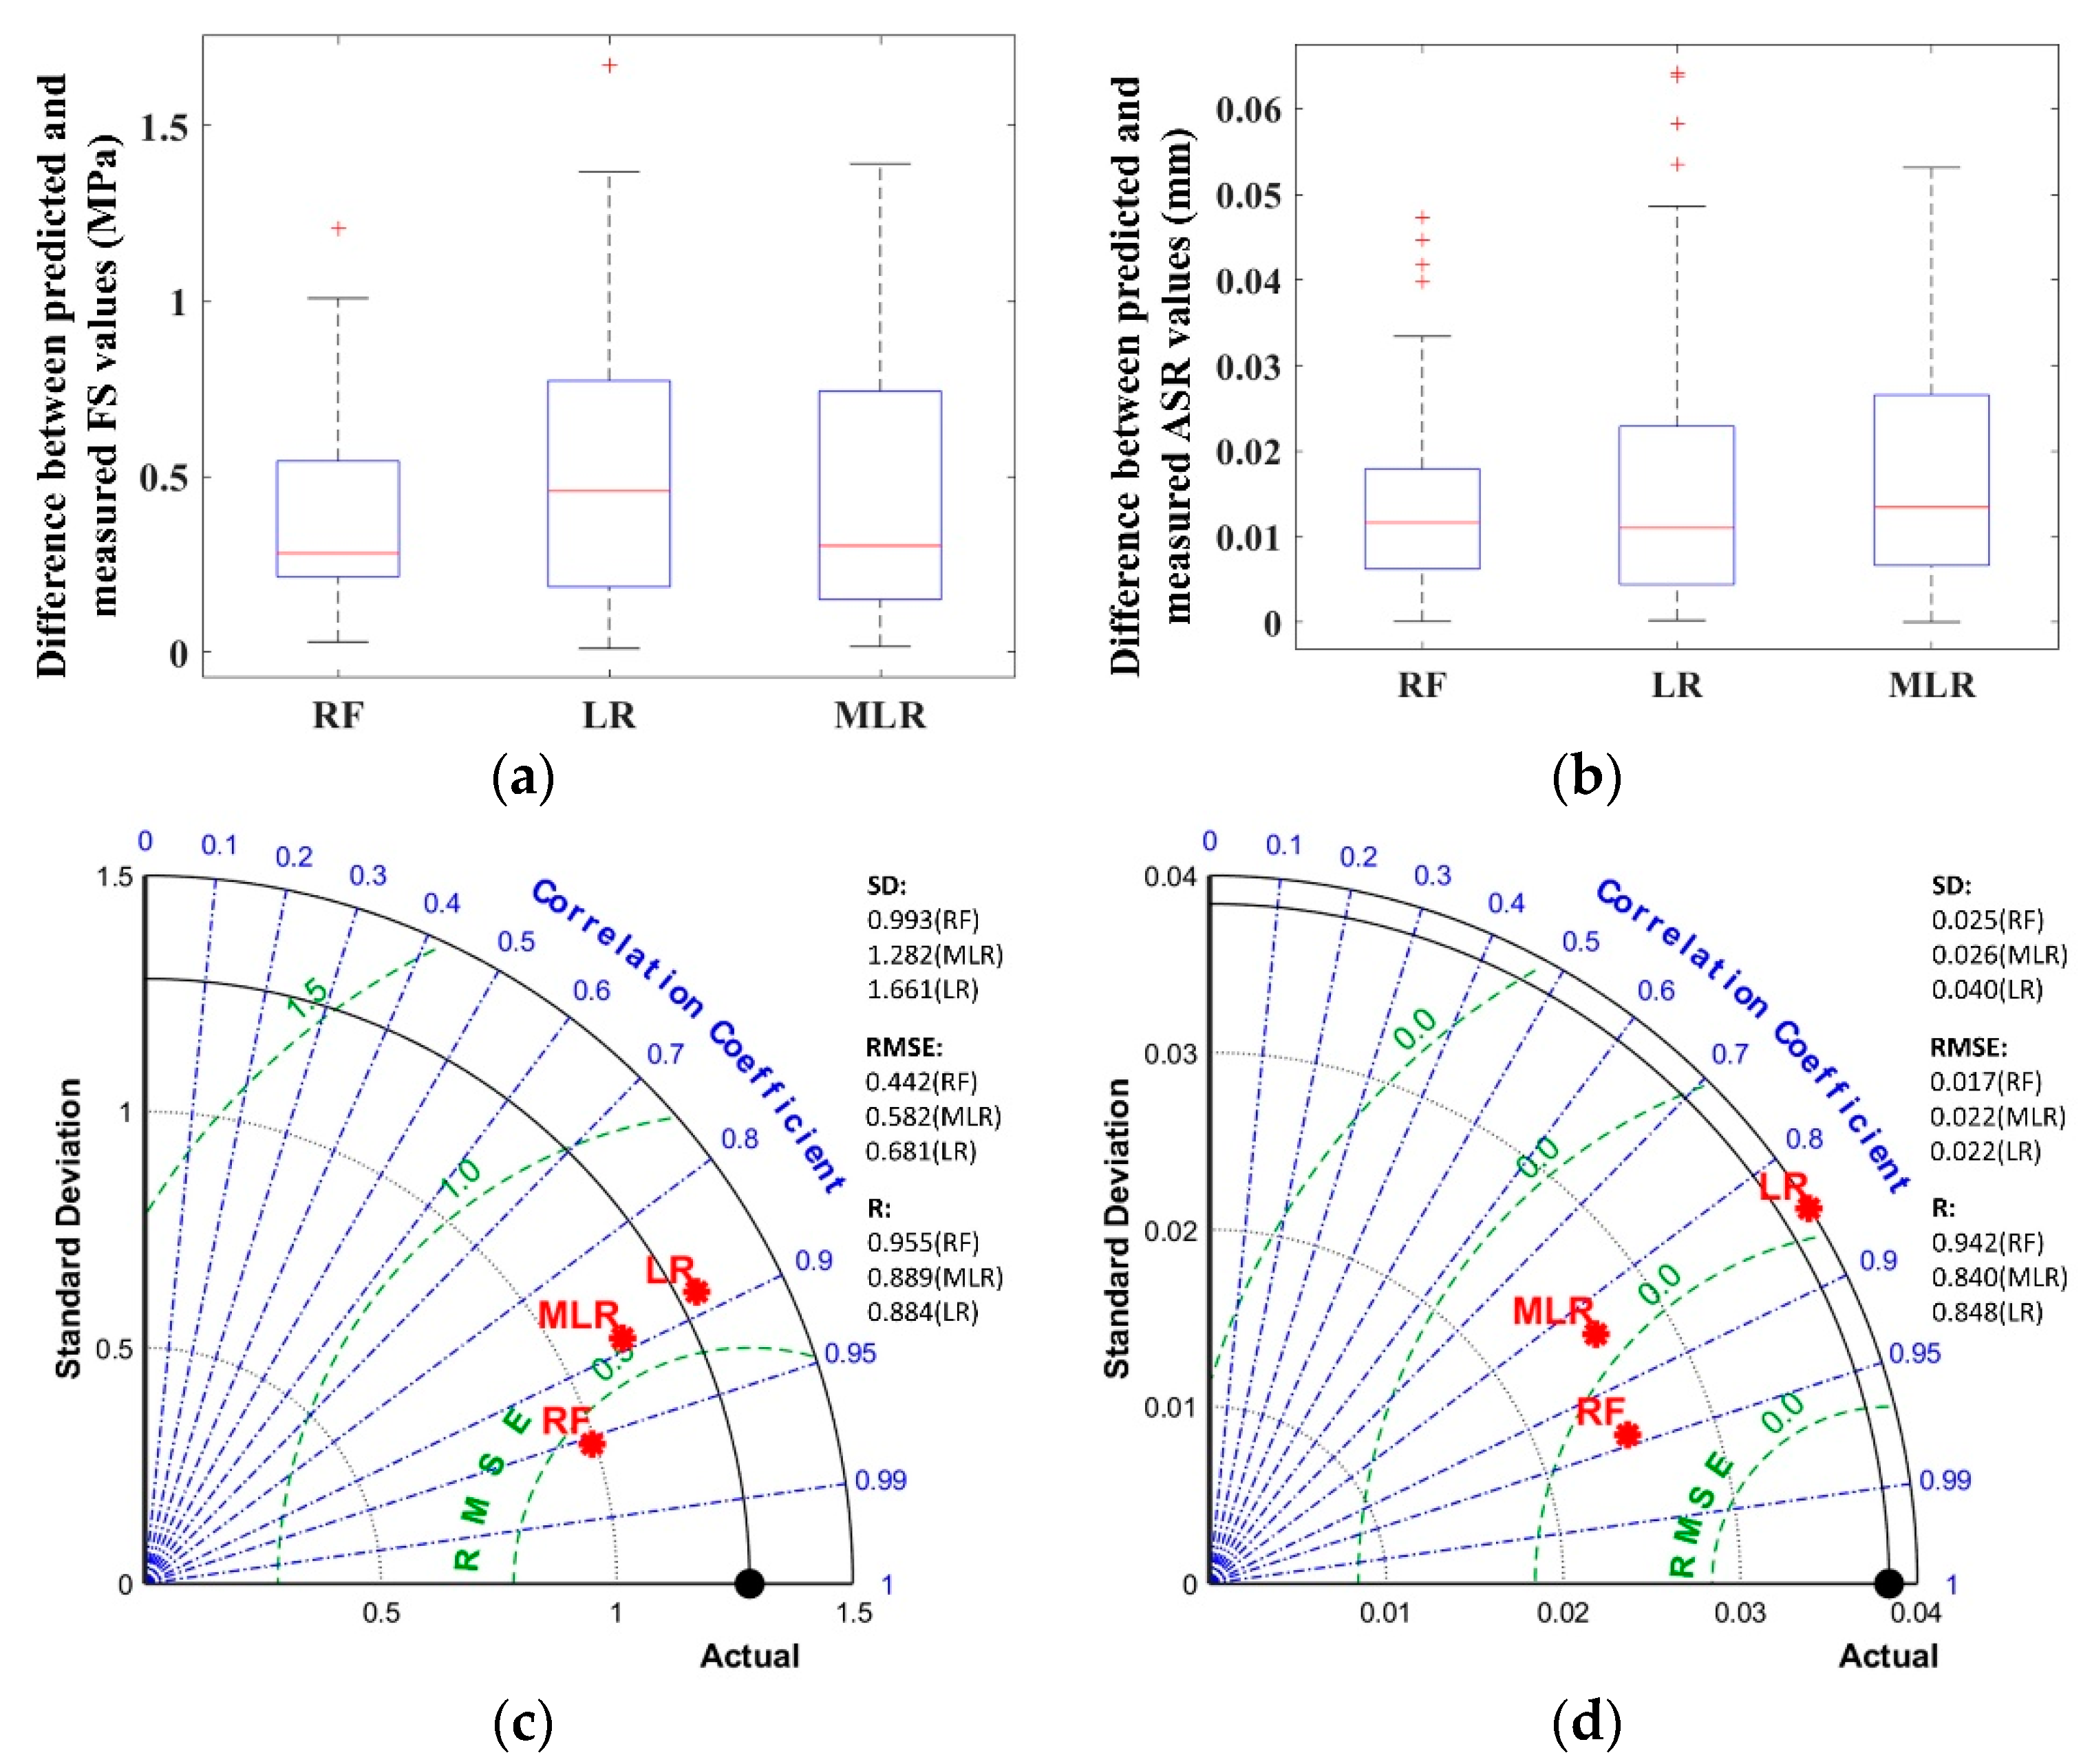
  • The accuracy of the BAS-RF model in predicting FS and ASR expansion was reflected in the high R values (0.9545 for FS and 0.9416 for ASR expansion). Compared with the other two baseline models (LR and MLR), the BAS-RF model obtained higher R values and fewer RMSE results, showing that both FS and ASR data sets had better properties. The predicted results simulated by the BAS-RF model agreed with the experimental outcomes.
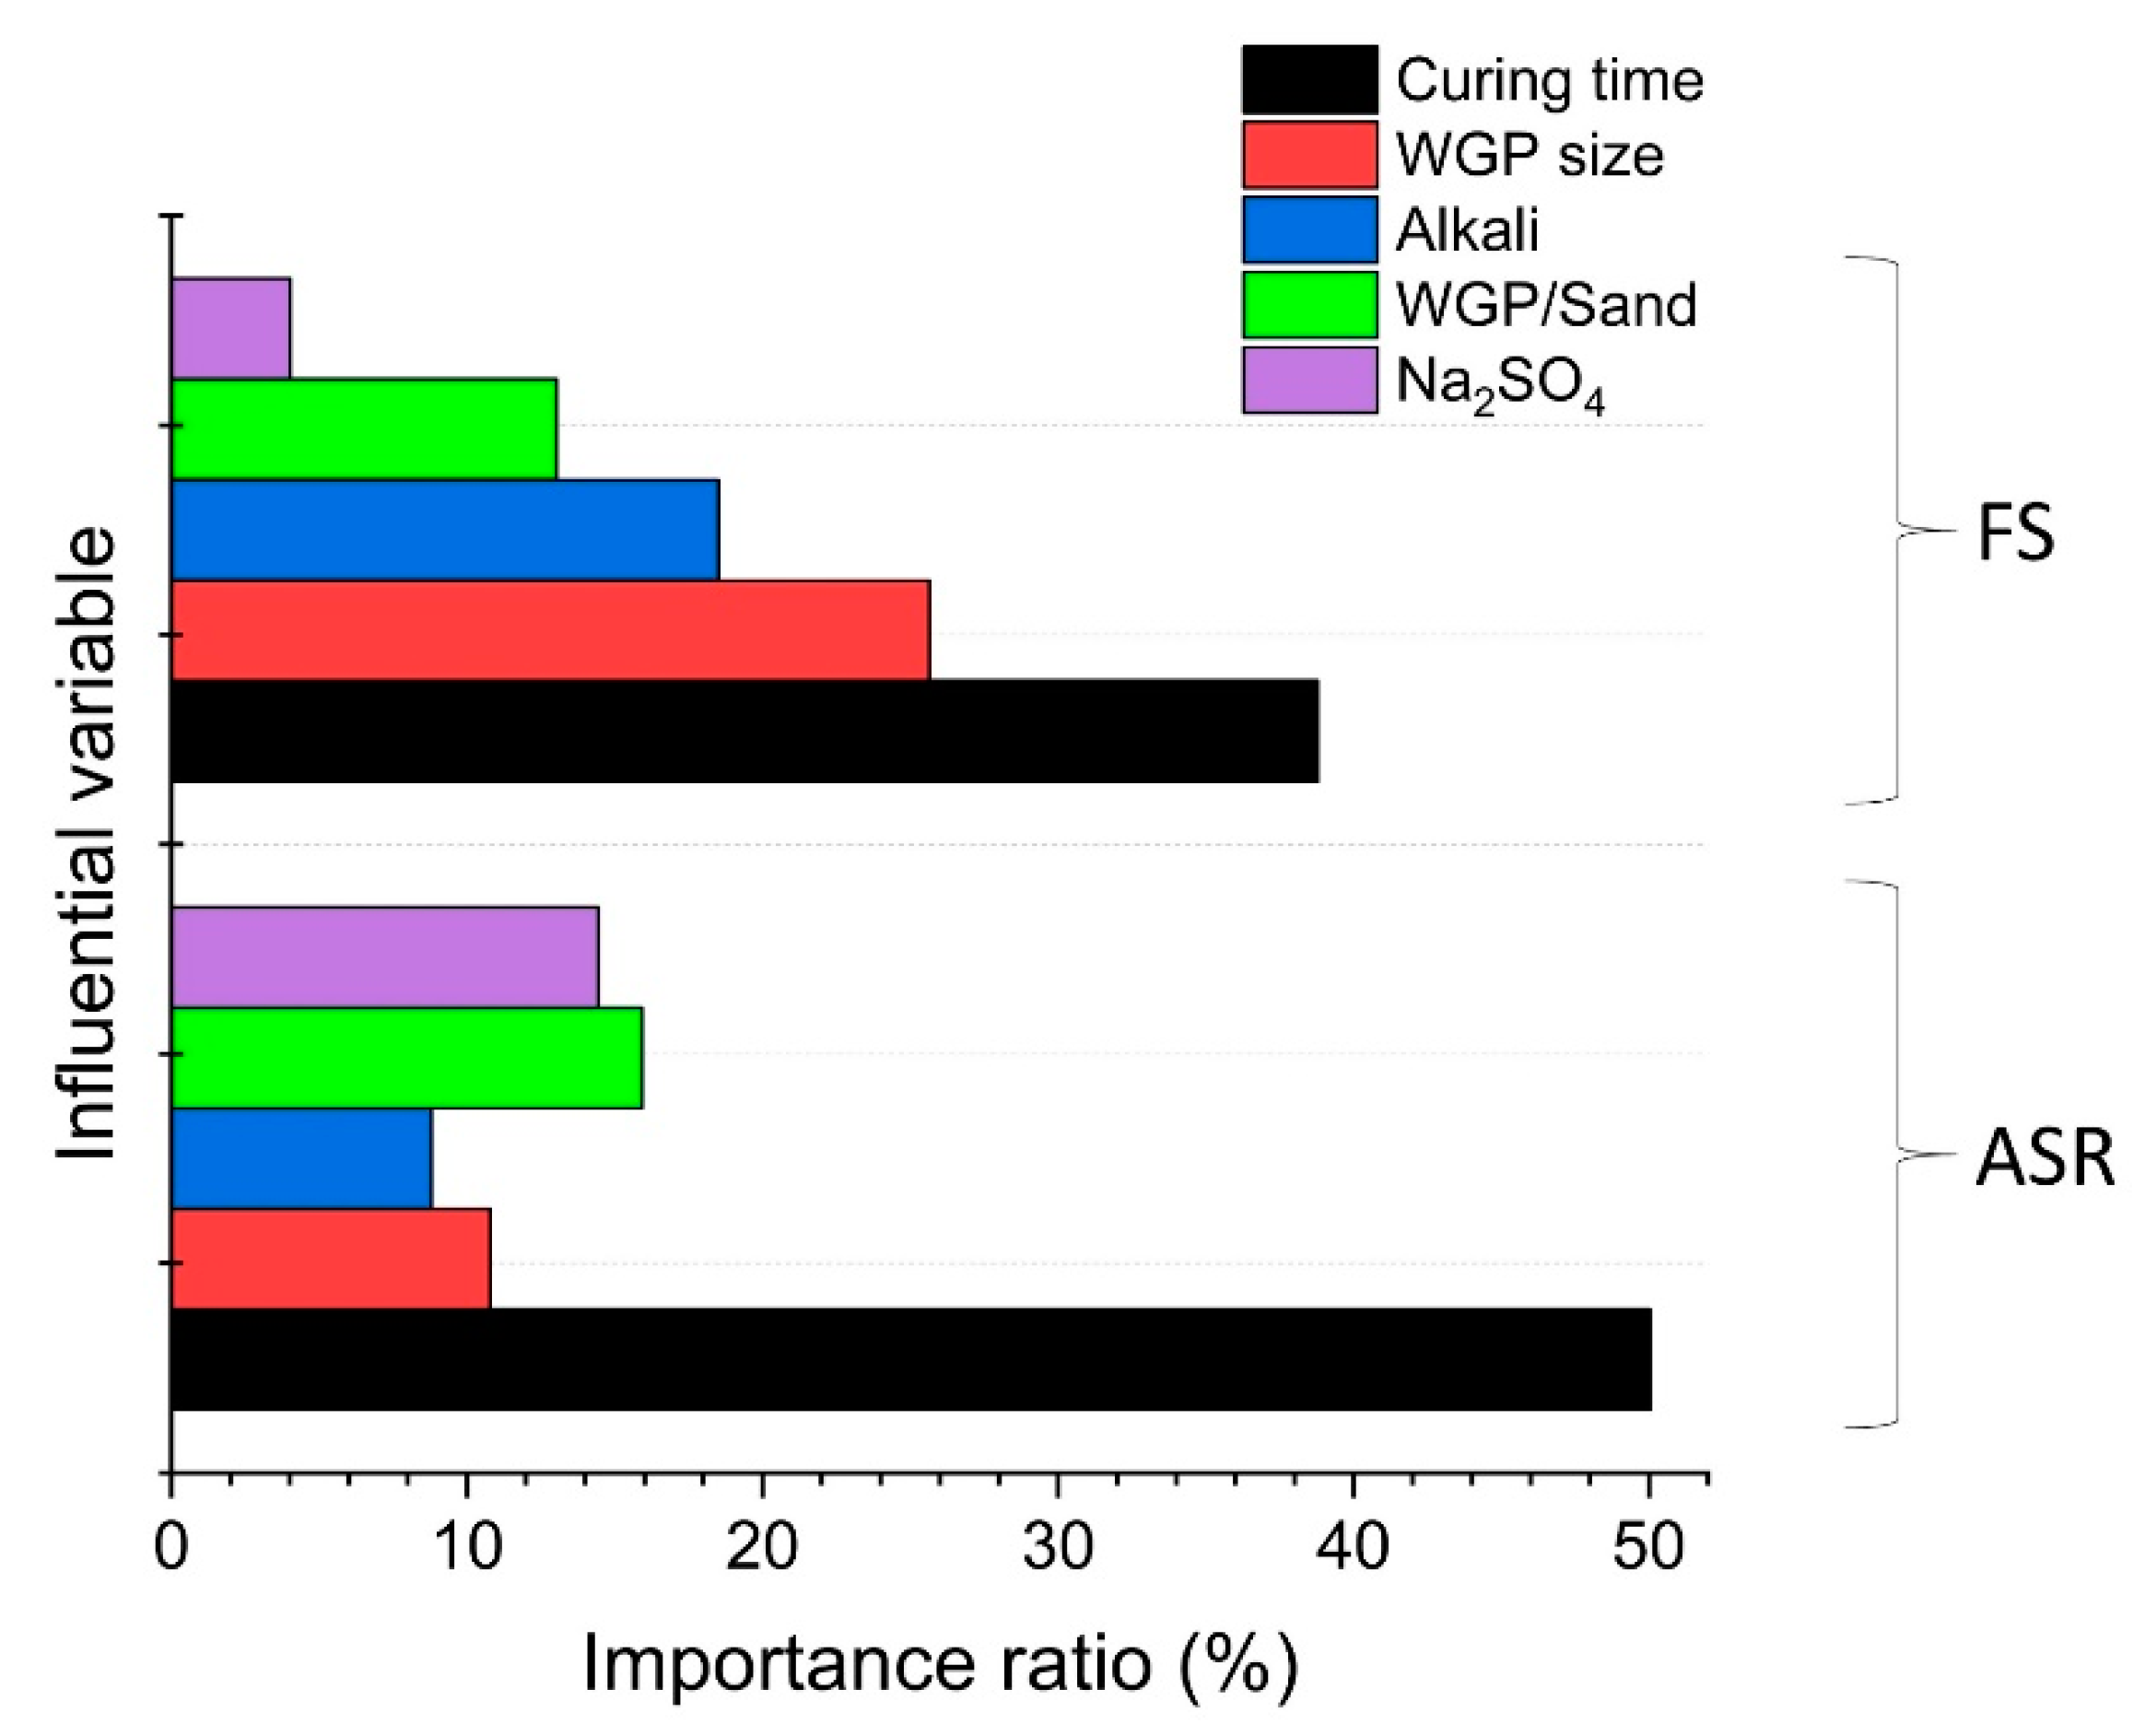
  • The variable significance ranking showed that WGP’s particle size and replacement ratio were the most essential factors (except the curing time) for FS and ASR expansion, respectively. The results also agreed with the experimental findings.
In the future, the activated WGP incorporated 3D-printed concrete and alkali-activated concrete will be investigated. Regarding the ML research, a more comprehensive database must be constructed to increase the model generalisability. The evolved ML models with improved applicability, accuracy, and efficiency should also be developed. Furthermore, it is crucial to investigate more variables, such as glass types, chemical activator categories, and admixtures.

Author Contributions

Conceptualization, J.S. and X.Y.; methodology, Y.W.; software, Y.W.; validation, Z.R., W.M. and X.Y.; formal analysis, G.Z.; investigation, C.Z.; resources, X.C.; data curation, C.Z.; writing—original draft preparation, Y.W.; writing—review and editing, X.W.; visualization, X.W.; supervision, X.W.; project administration, J.S.; funding acquisition, X.W. All authors have read and agreed to the published version of the manuscript.

Funding

This research was funded by the Australian Research Council’s Linkage Project, grant number LP180100222, Key R&D Project of Hunan Province Intelligent Disaster Prevention and Mitigation and Ecological Restoration in Civil Engineering, grant number 2020SK2109.

Data Availability Statement

The data presented in this study are openly available.

Acknowledgments

The research is supported by Hunan Key Laboratory of Intelligent Disaster Prevention and Mitigation and Ecological Restoration in Civil Engineering, Catastrophe and Reinforcement of Dangerous Engineering Structures, Hunan Provincial Engineering Research Center.

Conflicts of Interest

The authors declare no conflict of interest.

Appendix A

Table A1. The experimental results of 75 μm WGP mortar samples.
IDFlexural Strength
(MPa)
ASR Expansion
(%)
7 d14 d28 d0 d2 d4 d7 d10 d14 d
C5.40 7.35 7.66 00.0196 0.0225 0.0308 0.0346 0.0462
75G105.64 7.64 9.70 00.0066 0.0077 0.0156 0.0192 0.0192
75G10S2H26.12 7.82 8.79 00.0346 0.0385 0.0519 0.0692 0.1038
75G10S2H45.46 7.14 8.02 00.0154 0.0214 0.0315 0.0577 0.0731
75G10S2H64.66 5.54 6.57 00.0246 0.0308 0.0446 0.0538 0.0808
75G10S4H25.87 7.26 7.95 00.0231 0.0292 0.0538 0.0984 0.1430
75G10S4H45.41 6.13 7.02 00.0154 0.0254 0.0538 0.0808 0.1308
75G10S4H64.19 5.60 6.00 00.0100 0.0231 0.0615 0.0885 0.1160
75G10S6H25.54 7.10 7.80 00.0038 0.0115 0.0462 0.0846 0.1192
75G10S6H45.65 6.45 7.62 00.0085 0.0231 0.0615 0.1077 0.1385
75G10S6H64.60 5.56 7.18 00.0046 0.0247 0.0462 0.0810 0.1000
75G204.46 6.02 6.98 00.0075 0.0138 0.0308 0.0423 0.0462
75G20S2H25.68 7.50 7.98 00.0157 0.0346 0.0385 0.0538 0.0692
75G20S2H45.02 6.45 7.17 00.0200 0.0386 0.0465 0.0612 0.0808
75G20S2H64.26 5.95 6.63 00.0538 0.0577 0.0713 0.0831 0.1115
75G20S4H25.45 6.95 7.86 00.0346 0.0538 0.0615 0.0756 0.1000
75G20S4H44.85 6.85 7.43 00.0385 0.0615 0.0885 0.1038 0.1166
75G20S4H64.36 5.90 6.11 00.0421 0.0731 0.0885 0.1077 0.1055
75G20S6H24.69 6.24 6.76 00.0077 0.0192 0.0500 0.0650 0.0846
75G20S6H44.35 6.03 7.01 00.0154 0.0260 0.0423 0.0462 0.0577
75G20S6H64.16 6.00 6.73 00.0385 0.0846 0.0962 0.1000 0.1115
75G304.96 6.85 7.60 00.0462 0.0692 0.1086 0.1192 0.1423
75G30S2H26.15 7.65 8.97 00.0154 0.0200 0.0269 0.0500 0.0654
75G30S2H45.46 6.86 8.30 00.0077 0.0085 0.0154 0.0231 0.0385
75G30S2H64.65 5.55 7.00 00.0154 0.0192 0.0231 0.0269 0.0423
75G30S4H24.95 6.65 6.93 00.0192 0.0288 0.0346 0.0427 0.0462
75G30S4H44.95 6.25 7.20 00.0346 0.0538 0.0577 0.0615 0.0731
75G30S4H64.02 4.95 5.96 00.0216 0.0386 0.0462 0.0538 0.0577
75G30S6H24.95 6.06 6.92 00.0208 0.0269 0.0346 0.0513 0.0615
75G30S6H44.85 5.85 7.07 00.0154 0.0346 0.0486 0.0692 0.0808
75G30S6H65.19 5.86 6.63 00.0268 0.0346 0.0462 0.0538 0.0652

Appendix B

Table A2. The experimental results of 300 μm WGP mortar samples.
IDFlexural Strength
(MPa)
ASR Expansion
(%)
7 d14 d28 d0 d2 d4 d7 d10 d14 d
300G104.85 6.26 7.06 00.007 0.015 0.033 0.041 0.051
300G10S2H25.55 6.37 7.36 00.027 0.046 0.057 0.095 0.126
300G10S2H44.59 5.78 6.82 00.016 0.025 0.037 0.066 0.083
300G10S2H64.01 4.54 5.65 00.025 0.034 0.062 0.058 0.091
300G10S4H25.11 5.74 6.60 00.027 0.034 0.066 0.133 0.166
300G10S4H44.71 5.08 5.90 00.018 0.028 0.072 0.109 0.144
300G10S4H63.81 4.54 4.86 00.011 0.026 0.076 0.096 0.140
300G10S6H24.88 5.96 6.87 00.004 0.015 0.052 0.094 0.131
300G10S6H44.92 5.29 6.48 00.009 0.030 0.071 0.134 0.158
300G10S6H64.05 4.73 6.07 00.005 0.035 0.063 0.093 0.108
300G204.26 5.67 6.35 00.021 0.034 0.062 0.070 0.085
300G20S2H24.29 5.84 6.49 00.029 0.038 0.055 0.079 0.089
300G20S2H43.71 4.84 5.81 00.021 0.050 0.056 0.080 0.092
300G20S2H63.45 4.52 5.71 00.059 0.065 0.082 0.108 0.128
300G20S4H24.14 5.18 6.45 00.044 0.060 0.067 0.092 0.114
300G20S4H43.83 5.25 6.02 00.049 0.077 0.104 0.134 0.126
300G20S4H63.36 4.71 4.86 00.052 0.085 0.122 0.137 0.155
300G20S6H23.45 4.99 5.65 00.008 0.021 0.055 0.081 0.097
300G20S6H43.31 4.50 5.61 00.017 0.028 0.049 0.061 0.072
300G20S6H63.24 4.74 5.29 00.042 0.113 0.125 0.129 0.137
300G304.06 5.13 6.10 00.041 0.076 0.086 0.130 0.144
300G30S2H24.26 5.62 6.31 00.039 0.053 0.086 0.113 0.120
300G30S2H43.71 5.01 5.89 00.013 0.015 0.029 0.038 0.069
300G30S2H63.21 4.25 5.04 00.028 0.037 0.043 0.045 0.077
300G30S4H23.51 4.74 4.89 00.032 0.053 0.064 0.071 0.086
300G30S4H43.22 4.69 5.23 00.062 0.095 0.104 0.103 0.140
300G30S4H62.69 3.68 4.11 00.037 0.073 0.085 0.089 0.106
300G30S6H23.27 4.45 4.67 00.039 0.048 0.060 0.086 0.107
300G30S6H43.25 4.17 5.03 00.026 0.062 0.084 0.122 0.145
300G30S6H63.63 4.37 4.78 00.050 0.060 0.080 0.093 0.099

References

  1. Tan, K.H.; Du, H. Use of waste glass as sand in mortar: Part I—Fresh, mechanical and durability properties. Cem. Concr. Compos. 2013, 35, 109–117. [Google Scholar] [CrossRef]
  2. Sun, J.; Lin, S.; Zhang, G.; Sun, Y.; Zhang, J.; Chen, C.; Morsy, A.M.; Wang, X. The effect of graphite and slag on electrical and mechanical properties of electrically conductive cementitious composites. Constr. Build. Mater. 2021, 281, 122606. [Google Scholar] [CrossRef]
  3. Federico, L.M.; Chidiac, S.E. Waste glass as a supplementary cementitious material in concrete—Critical review of treatment methods. Cem. Concr. Compos. 2009, 31, 606–610. [Google Scholar] [CrossRef]
  4. Huang, H.; Guo, M.; Zhang, W.; Zeng, J.; Yang, K.; Bai, H. Numerical investigation on the bearing capacity of RC columns strengthened by HPFL-BSP under combined loadings. J. Build. Eng. 2021, 39, 102266. [Google Scholar] [CrossRef]
  5. Shi, C.; Zheng, K. A review on the use of waste glasses in the production of cement and concrete. Resour. Conserv. Recycl. 2007, 52, 234–247. [Google Scholar] [CrossRef]
  6. Wu, C.; Wu, P.; Wang, J.; Jiang, R.; Chen, M.; Wang, X. Ontological knowledge base for concrete bridge rehabilitation project management. Autom. Constr. 2021, 121, 103428. [Google Scholar] [CrossRef]
  7. Schwarz, N.; Cam, H.; Neithalath, N. Influence of a fine glass powder on the durability characteristics of concrete and its comparison to fly ash. Cem. Concr. Compos. 2008, 30, 486–496. [Google Scholar] [CrossRef]
  8. Li, J.; Qin, Q.; Sun, J.; Ma, Y.; Li, Q. Mechanical and conductive performance of electrically conductive cementitious composite using graphite, steel slag, and GGBS. Struct. Concr. 2020. [CrossRef]
  9. Bai, Y.; Wang, S.; Mou, B.; Wang, Y.; Skalomenos, K.A. Bi-directional seismic behavior of steel beam-column connections with outer annular stiffener. Eng. Struct. 2021, 227, 111443. [Google Scholar] [CrossRef]
  10. Zhu, J.; Wu, P.; Chen, M.; Kim, M.J.; Wang, X.; Fang, T. Automatically processing IFC clipping representation for BIM and GIS integration at the process level. Appl. Sci. 2020, 10, 2009. [Google Scholar] [CrossRef] [Green Version]
  11. Aly, M.; Hashmi, M.S.J.; Olabi, A.G.; Messeiry, M.; Abadir, E.F.; Hussain, A.I. Effect of colloidal nano-silica on the mechanical and physical behaviour of waste-glass cement mortar. Mater. Des. 2012, 33, 127–135. [Google Scholar] [CrossRef]
  12. Cao, X.; Huang, Z.; He, C.; Wu, W.; Xi, L.; Li, Y.; Fang, D. In-situ synchrotron X-ray tomography investigation of the imperfect smooth-shell cylinder structure. Compos. Struct. 2021, 267, 113926. [Google Scholar] [CrossRef]
  13. Corinaldesi, V.; Gnappi, G.; Moriconi, G.; Montenero, A. Reuse of ground waste glass as aggregate for mortars. Waste Manag. 2005, 25, 197–201. [Google Scholar] [CrossRef] [PubMed]
  14. Petrella, A.; Di Mundo, R.; De Gisi, S.; Todaro, F.; Labianca, C.; Notarnicola, M. Environmentally sustainable cement composites based on end-of-life tyre rubber and recycled waste porous glass. Materials 2019, 12, 3289. [Google Scholar] [CrossRef] [Green Version]
  15. Xu, J.; Wu, Z.; Chen, H.; Shao, L.; Zhou, X.; Wang, S. Triaxial Shear Behavior of Basalt Fiber-Reinforced Loess Based on Digital Image Technology. KSCE J. Civil Eng. 2021, 1–13. [Google Scholar] [CrossRef]
  16. Ye, M.; Jiang, J.; Chen, H.; Zhou, H.; Song, D. Seismic behavior of an innovative hybrid beam-column connection for precast concrete structures. Eng. Struct. 2021, 227, 111436. [Google Scholar] [CrossRef]
  17. Adhikary, S.K.; Ashish, D.K.; Rudžionis, Ž. Expanded glass as light-weight aggregate in concrete—A review. J. Clean. Prod. 2021, 127848. [Google Scholar] [CrossRef]
  18. Fernández-Martínez, J.L.; Fernández-Muñiz, Z. The curse of dimensionality in inverse problems. J. Comput. Appl. Math. 2020, 369, 112571. [Google Scholar] [CrossRef]
  19. Mou, B.; Bai, Y. Experimental investigation on shear behavior of steel beam-to-CFST column connections with irregular panel zone. Eng. Struct. 2018, 168, 487–504. [Google Scholar] [CrossRef]
  20. Chen, F.-X.; Zhong, Y.-C.; Gao, X.-Y.; Jin, Z.-Q.; Wang, E.-D.; Zhu, F.-P.; Shao, X.-X.; He, X.-Y. Non-uniform model of relationship between surface strain and rust expansion force of reinforced concrete. Sci. Rep. 2021, 11, 8741. [Google Scholar] [CrossRef] [PubMed]
  21. Young, B.A.; Hall, A.; Pilon, L.; Gupta, P.; Sant, G. Can the compressive strength of concrete be estimated from knowledge of the mixture proportions?: New insights from statistical analysis and machine learning methods. Cem. Concr. Res. 2019, 115, 379–388. [Google Scholar] [CrossRef]
  22. Sun, J.; Ma, Y.; Li, J.; Zhang, J.; Ren, Z.; Wang, X. Machine learning-aided design and prediction of cementitious composites containing graphite and slag powder. J. Build. Eng. 2021, 43, 102544. [Google Scholar] [CrossRef]
  23. Chaabene, W.B.; Flah, M.; Nehdi, M.L. Machine learning prediction of mechanical properties of concrete: Critical review. Constr. Build. Mater. 2020, 260, 119889. [Google Scholar] [CrossRef]
  24. Sun, Y.; Zhang, J.; Li, G.; Ma, G.; Huang, Y.; Sun, J.; Wang, Y.; Nener, B. Determination of Young’s modulus of jet grouted coalcretes using an intelligent model. Eng. Geol. 2019, 252, 43–53. [Google Scholar] [CrossRef]
  25. Zhou, Z.-H. Ensemble Methods: Foundations and Algorithms; Chapman and Hall/CRC: London, UK; New York, NY, USA, 2012. [Google Scholar]
  26. Liu, J.; Wu, C.; Wu, G.; Wang, X. A novel differential search algorithm and applications for structure design. Appl. Math. Comput. 2015, 268, 246–269. [Google Scholar] [CrossRef]
  27. Christiansen, B. Understanding the Distribution of Multimodel Ensembles. J. Clim. 2020, 33, 9447–9465. [Google Scholar] [CrossRef]
  28. Zhu, J.; Shi, Q.; Wu, P.; Sheng, Z.; Wang, X. Complexity analysis of prefabrication contractors’ dynamic price competition in mega projects with different competition strategies. Complexity 2018, 2018, 5928235. [Google Scholar] [CrossRef]
  29. Auret, L.; Aldrich, C.J.M.E. Interpretation of nonlinear relationships between process variables by use of random forests. Miner. Eng. 2012, 35, 27–42. [Google Scholar] [CrossRef]
  30. Yu, Y.; Zhang, C.; Gu, X.; Cui, Y. Expansion prediction of alkali aggregate reactivity-affected concrete structures using a hybrid soft computing method. Neural Comput. Appl. 2019, 31, 8641–8660. [Google Scholar] [CrossRef]
  31. Feng, J.; Liu, Z.; Feng, L. Identifying opportunities for sustainable business models in manufacturing: Application of patent analysis and generative topographic mapping. Sustain. Prod. Consum. 2021, 27, 509–522. [Google Scholar] [CrossRef]
  32. Feng, P.; Chang, H.; Liu, X.; Ye, S.; Shu, X.; Ran, Q. The significance of dispersion of nano-SiO2 on early age hydration of cement pastes. Mater. Design 2020, 186, 108320. [Google Scholar] [CrossRef]
  33. Jiang, X.; Li, S. BAS: Beetle antennae search algorithm for optimization problems. arXiv 2017, arXiv:1710.10724. [Google Scholar] [CrossRef]
  34. Wu, C.; Wu, P.; Wang, J.; Jiang, R.; Chen, M.; Wang, X. Critical review of data-driven decision-making in bridge operation and maintenance. Struct. Infrastruct. Eng. 2020, 1–24. [Google Scholar] [CrossRef]
  35. Boddy, R.; Smith, G. Statistical Methods in Practice: For Scientists and Technologists; John Wiley & Sons, Ltd.: Chichester, UK, 2009; ISBN 978-0-470-74664-6. [Google Scholar]
  36. Zhu, J.; Wang, X.; Wang, P.; Wu, Z.; Kim, M.J. Integration of BIM and GIS: Geometry from IFC to shapefile using open-source technology. Autom. Constr. 2019, 102, 105–119. [Google Scholar] [CrossRef]
  37. ASTM. Standard Specification for Coal Fly Ash and Raw or Calcined Natural Pozzolan for Use in Concrete; C618; ASTM International: West Conshohocken, PA, USA, 2012. [Google Scholar]
  38. ASTM. Standard Specification for Standard Sand; C778-13; ASTM International: West Conshohocken, PA, USA, 2013. [Google Scholar]
  39. ASTM. Standard Practice for Mechanical Mixing of Hydraulic Cement Pastes and Mortars of Plastic Consistency; C305; ASTM International: West Conshohocken, PA, USA, 2014. [Google Scholar]
  40. ASTM. Standard Test Method for Flexural Strength of Hydraulic-Cement Mortars; C109; ASTM International: West Conshohocken, PA, USA, 2008. [Google Scholar]
  41. ASTM. Standard Test Method for Potential Alkali Reactivity of Aggregates (Mortar-Bar Method); C1260; ASTM International: West Conshohocken, PA, USA, 2007. [Google Scholar]
  42. Schapire, R.E. The boosting approach to machine learning: An overview. In Nonlinear Estimation and Classification; Springer: Berlin/Heidelberg, Germany, 2003; pp. 149–171. [Google Scholar]
  43. Breiman, L. Bagging predictors. Mach. Learn. 1996, 24, 123–140. [Google Scholar] [CrossRef] [Green Version]
  44. Rajaratnam, B.; Roberts, S.; Sparks, D.; Dalal, O. Lasso regression: Estimation and shrinkage via the limit of Gibbs sampling. J. R. Stat. Soc. Ser. B (Stat. Methodol.) 2016, 78, 153–174. [Google Scholar] [CrossRef] [Green Version]
  45. Zhu, J.; Wang, X.; Chen, M.; Wu, P.; Kim, M.J. Integration of BIM and GIS: IFC geometry transformation to shapefile using enhanced open-source approach. Autom. Constr. 2019, 106, 102859. [Google Scholar] [CrossRef]
  46. Zhang, J.; Huang, Y.; Ma, G.; Sun, J.; Nener, B. A metaheuristic-optimized multi-output model for predicting multiple properties of pervious concrete. Constr. Build. Mater. 2020, 249, 118803. [Google Scholar] [CrossRef]
  47. Sun, Y.; Zhang, J.; Li, G.; Wang, Y.; Sun, J.; Jiang, C. Optimized neural network using beetle antennae search for predicting the unconfined compressive strength of jet grouting coalcretes. Int. J. Numer. Anal. Methods Geomech. 2019, 43, 801–813. [Google Scholar] [CrossRef]
  48. Wang, J.; Chen, H. BSAS: Beetle swarm antennae search algorithm for optimization problems. arXiv Preprint 2018, arXiv:1807.10470. [Google Scholar]
  49. Wang, L.; Yuan, J.; Wu, C.; Wang, X. Practical algorithm for stochastic optimal control problem about microbial fermentation in batch culture. Optim. Lett. 2019, 13, 527–541. [Google Scholar] [CrossRef]
  50. Qin, C.; Jin, Y.; Tao, J.; Xiao, D.; Yu, H.; Liu, C.; Lei, J.; Liu, C. DTCNNMI: A deep twin convolutional neural networks with multi-domain inputs for strongly noisy diesel engine misfire detection. Meas. J. Int. Meas. Confed. 2021, 180, 109548. [Google Scholar] [CrossRef]
  51. Hsu, C.-W.; Chang, C.-C.; Lin, C.-J. A Practical Guide to Support Vector Classification; Department of Computer Science, National Taiwan University: Taipei, Taiwan, 2003. [Google Scholar]
  52. Feng, S.; Zuo, C.; Zhang, L.; Yin, W.; Chen, Q. Generalized framework for non-sinusoidal fringe analysis using deep learning. Photonics Res. 2021, 9, 1084. [Google Scholar] [CrossRef]
  53. Singh, V.; Gu, N.; Wang, X. A theoretical framework of a BIM-based multi-disciplinary collaboration platform. Autom. Constr. 2011, 20, 134–144. [Google Scholar] [CrossRef]
  54. Cortez, P.; Embrechts, M.J. Opening black box data mining models using sensitivity analysis. In Proceedings of the 2011 IEEE Symposium on Computational Intelligence and Data Mining (CIDM), Paris, France, 11–15 April 2011; pp. 341–348. [Google Scholar]
  55. Tsai, Y.-H.; Wang, J.; Chien, W.-T.; Wei, C.-Y.; Wang, X.; Hsieh, S.-H. A BIM-based approach for predicting corrosion under insulation. Autom. Constr. 2019, 107, 102923. [Google Scholar] [CrossRef]
  56. Cortez, P.; Embrechts, M.J. Using sensitivity analysis and visualization techniques to open black box data mining models. Inf. Sci. 2013, 225, 1–17. [Google Scholar] [CrossRef] [Green Version]
  57. Sun, J.; Huang, Y.; Aslani, F.; Wang, X.; Ma, G. Mechanical enhancement for EMW-absorbing cementitious material using 3D concrete printing. J. Build. Eng. 2021, 41, 102763. [Google Scholar] [CrossRef]
  58. Wu, C.; Wang, X.; Chen, M.; Kim, M.J. Differential received signal strength based RFID positioning for construction equipment tracking. Adv. Eng. Inform. 2019, 42, 100960. [Google Scholar] [CrossRef]
  59. Sun, J.; Aslani, F.; Wei, J.; Wang, X. Electromagnetic absorption of copper fiber oriented composite using 3D printing. Constr. Build. Mater. 2021, 300, 124026. [Google Scholar] [CrossRef]
  60. Tang, F.J.; Gartner, E.M. Influence of sulphate source on Portland cement hydration. Adv. Cem. Res. 1988, 1, 67–74. [Google Scholar] [CrossRef]
  61. Huang, H.; Huang, M.; Zhang, W.; Yang, S. Experimental study of predamaged columns strengthened by HPFL and BSP under combined load cases. Struct. Infrastruct. Eng. 2020, 1–18. [Google Scholar] [CrossRef]
  62. Du Toit, G.; Kearsley, E.P.; Mc Donald, J.M.; Kruger, R.A.; van der Merwe, E.M. Chemical and mechanical activation of hybrid fly ash cement. Adv. Cem. Res. 2018, 30, 399–412. [Google Scholar] [CrossRef]
  63. Zhu, J.; Yang, K.; Chen, Y.; Fan, G.; Zhang, L.; Guo, B.; Guan, X.; Zhao, R. Revealing the substitution preference of zinc in ordinary Portland cement clinker phases: A study from experiments and DFT calculations. J. Hazard. Mater. 2021, 409, 124504. [Google Scholar] [CrossRef]
  64. Jiang, J.; Peng, Z.Y.; Ye, M.; Wang, Y.B.; Wang, X.; Bao, W. Thermal effect of welding on mechanical behavior of high-strength steel. J. Mater. Civil Eng. 2021, 33, 04021186. [Google Scholar] [CrossRef]
  65. Xu, D.-s.; Huang, M.; Zhou, Y. One-dimensional compression behavior of calcareous sand and marine clay mixtures. Int. J. Geomech. 2020, 20, 04020137. [Google Scholar] [CrossRef]
  66. Shi, C. Corrosion of glasses and expansion mechanism of concrete containing waste glasses as aggregates. J. Mater. Civ. Eng. 2009, 21, 529–534. [Google Scholar] [CrossRef]
  67. Gao, N.; Tang, L.; Deng, J.; Lu, K.; Hou, H.; Chen, K. Design, fabrication and sound absorption test of composite porous metamaterial with embedding I-plates into porous polyurethane sponge. Appl. Acoust. 2021, 175, 107845. [Google Scholar] [CrossRef]
  68. Yang, Y.; Chen, H.; Zou, X.; Shi, X.-L.; Liu, W.-D.; Feng, L.; Suo, G.; Hou, X.; Ye, X.; Zhang, L. Flexible carbon-fiber/semimetal Bi nanosheet arrays as separable and recyclable plasmonic photocatalysts and photoelectrocatalysts. ACS Appl. Mater. Interfaces 2020, 12, 24845–24854. [Google Scholar] [CrossRef]
  69. Du, H.; Tan, K.H. Use of waste glass as sand in mortar: Part II–Alkali–silica reaction and mitigation methods. Cem. Concr. Compos. 2013, 35, 118–126. [Google Scholar] [CrossRef]
  70. Sun, L.; Li, C.; Zhang, C.; Su, Z.; Chen, C. Early monitoring of rebar corrosion evolution based on FBG sensor. Int. J. Struct. Stab. Dyn. 2018, 18, 1840001. [Google Scholar] [CrossRef]
  71. Shi, C.; Wu, Y.; Shao, Y.; Riefler, C. Alkali-aggregate reaction expansion of mortars containing glass powders. In Proceedings of the 12th International Conference on Alkali-Aggregate Reaction in Concrete, Beijing, China, 15–19 October 2004; International Academic Publisher: Hong Kong, China, 2004; pp. 789–795. [Google Scholar]
  72. Chen, Z.; Zhang, H.; He, X.; Fan, G.; Li, X.; He, Z.; Wang, G.; Zhang, L. Fabrication of Cellulosic Paper Containing Zeolitic Imidazolate Framework and Its Application in Removal of Anionic Dye from Aqueous Solution. BioResources 2021, 16, 2644–2654. [Google Scholar] [CrossRef]
  73. Xu, D.; Liu, Q.; Qin, Y.; Chen, B. Analytical approach for crack identification of glass fiber reinforced polymer–sea sand concrete composite structures based on strain dissipations. Struct. Health Monit. 2020, 1475921720974290. [Google Scholar] [CrossRef]
Figure 1. The features of WGP of different granularity: (a) 75 µm; (b) 300 µm.
Applsci 11 06686 g001
Figure 2. Schematic figure of ASR expansion test.
Applsci 11 06686 g002
Figure 3. Bar specimens used in ASR expansion test.
Applsci 11 06686 g003
Figure 4. Construction of an RF model.
Applsci 11 06686 g004
Figure 5. RF model training by 10-fold CV and BAS.
Applsci 11 06686 g005
Figure 6. The FS of mortar containing WGP with different proportions by mechanical activation at different curing times.
Applsci 11 06686 g006
Figure 7. The 28-day FS of mortar containing (a) 10%, (b) 20%, and (c) 30% WGP by chemical activation.
Applsci 11 06686 g007
Figure 8. The ASR expansion of mortar containing WGP (10%, 20%, and 30%) with mechanical activation.
Applsci 11 06686 g008
Figure 9. The 14-day ASR values of bar samples containing (a) 10%, (b) 20%, and (c) 30% chemically activated WGP.
Applsci 11 06686 g009
Figure 10. SEM micrographs of (a) 75 μm WGP, (b) mortar-75G10, (c) pretreated 75 μm WGP by 2% alkali and 2% Na 2 SO 4 , and (d) mortar-75G10S2H2.
Applsci 11 06686 g010
Figure 11. RSME values from 10 validation sets for (a) FS and (b) ASR modelling.
Applsci 11 06686 g011
Figure 12. Scatter plot of simulated and actual values of (a) FS and (b) ASR.
Applsci 11 06686 g012
Figure 13. Performance evaluation of three models by (a) boxplot of FS modelling, (b) boxplot of ASR modelling, (c) Taylor diagram of FS modelling, and (d) Taylor diagram of ASR modelling.
Applsci 11 06686 g013
Figure 14. Variables significance on FS and ASR expansion of WGP mortar mixture design.
Applsci 11 06686 g014
Table 1. Chemical ingredients of WGP.
CompositionWaste Glass Powder
SiO 2 74.02%
Al 2 O 3 1.40%
Fe 2 O 3 0.19%
CaO 11.25%
MgO 3.34%
SO 3 0.33%
Na 2 O 9.03%
K 2 O 0.29%
Table 2. Chemical ingredients and physical indexes of OPC.
Chemical IngredientPhysical Index
SiO 2 20.10%Specific gravity3.0–3.2 t/m3
Al 2 O 3 4.60%Normal consistency27%
Fe 2 O 3 2.80%Loss on ignition3.80%
CaO 63.40%Fineness index390 m2/kg
MgO 1.30%Setting time initial120 min
SO 3 2.70%Setting time final210 min
Na 2 O 0.60%
Table 3. The mix proportions of WGP cementitious composites.
Specimen IDCement (g)Natural Sand (g)Water (g)WGP (g)Na2SO4 (g)Alkali (g)
C (Control Sample)4501012.5211.5000
Waste Glass Powder (75 μm)
75G10450911.25211.5101.2500
75G10S2H2450911.25211.5101.2599
75G10S2H4450911.25211.5101.25918
75G10S2H6450911.25211.5101.25927
75G10S4H2450911.25211.5101.25189
75G10S4H4450911.25211.5101.251818
75G10S4H6450911.25211.5101.251827
75G10S6H2450911.25211.5101.25279
75G10S6H4450911.25211.5101.252718
75G10S6H6450911.25211.5101.252727
75G20450810211.5202.5000
75G20S2H2450810211.5202.5099
75G20S2H4450810211.5202.50918
75G20S2H6450810211.5202.50927
75G20S4H2450810211.5202.50189
75G20S4H4450810211.5202.501818
75G20S4H6450810211.5202.501827
75G20S6H2450810211.5202.50279
75G20S6H4450810211.5202.502718
75G20S6H6450810211.5202.502727
75G30450708.75211.5303.7500
75G30S2H2450708.75211.5303.7599
75G30S2H4450708.75211.5303.75918
75G30S2H6450708.75211.5303.75927
75G30S4H2450708.75211.5303.75189
75G30S4H4450708.75211.5303.751818
75G30S4H6450708.75211.5303.751827
75G30S6H2450708.75211.5303.75279
75G30S6H4450708.75211.5303.752718
75G30S6H6450708.75211.5303.752727
Waste Glass Powder (300 μm)
300G10450911.25211.5101.2500
300G10S2H2450911.25211.5101.2599
300G10S2H4450911.25211.5101.25918
300G10S2H6450911.25211.5101.25927
300G10S4H2450911.25211.5101.25189
300G10S4H4450911.25211.5101.251818
300G10S4H6450911.25211.5101.251827
300G10S6H2450911.25211.5101.25279
300G10S6H4450911.25211.5101.252718
300G10S6H6450911.25211.5101.252727
300G20450810211.5202.5000
300G20S2H2450810211.5202.5099
300G20S2H4450810211.5202.50918
300G20S2H6450810211.5202.50927
300G20S4H2450810211.5202.50189
300G20S4H4450810211.5202.501818
300G20S4H6450810211.5202.501827
300G20S6H2450810211.5202.50279
300G20S6H4450810211.5202.502718
300G20S6H6450810211.5202.502727
300G30450708.75211.5303.7500
300G30S2H2450708.75211.5303.7599
300G30S2H4450708.75211.5303.75918
300G30S2H6450708.75211.5303.75927
300G30S4H2450708.75211.5303.75189
300G30S4H4450708.75211.5303.751818
300G30S4H6450708.75211.5303.751827
300G30S6H2450708.75211.5303.75279
300G30S6H4450708.75211.5303.752718
300G30S6H6450708.75211.5303.752727
Publisher’s Note: MDPI stays neutral with regard to jurisdictional claims in published maps and institutional affiliations.

