Compositional Variation and Color Diversity of Glass Beads from the 4th Century Tomb Complex in Korea


Department of Cultural Heritage Conservation Sciences, Kongju National University, Gongju 32588, Korea
*
Author to whom correspondence should be addressed.
Appl. Sci. 2021, 11(11), 5233; https://doi.org/10.3390/app11115233
Submission received: 12 May 2021
/
Revised: 30 May 2021
/
Accepted: 2 June 2021
/
Published: 4 June 2021
Abstract
:This study investigated the chemical compositions and color diversity of various colored glass beads excavated from the 4th century Suchonri site in Korea. The results reveal that the compositions of the coloring materials and stabilizers contain black or white impurities, and there are clear boundaries in the weathered surfaces within the glass beads. The weathered side turned brown, the amounts of Na and K are greater, and there is a decrease in alkali elements. The fragments in blue-green beads from tomb No. 11 were identified as potash glass, whereas the rest of the samples were soda glass. Analysis of the coloration elements identified Fe and Cu in all glass beads, and it was estimated that both elements resulted in a green color. Fe was predicted to cause a brown color. The results of the study may be used not only for scientific interpretation of the relics from the Suchonri tomb complex but also as archaeological evidence that may contribute to the material characterization of the ancient glass from the Korean peninsula.
1. Introduction
Ancient glass is classified according to its composition, color, excavation sites and form, and can be subdivided into soda glass, potash glass, soda-lime glass, potash-lime glass, lead glass, and lead-barium glass on the basis of its composition. The ancient glass excavated in southern Korea belongs to the soda and potash glass categories, which can be classified into lead glass, lead-barium glass, and potash glass groups [1].
Regarding ancient glass from southern Korea, a strong argument can be made that it was introduced from the Silk Road during movement from western Asia to China. Glassmaking techniques from Islamic civilizations spread through China to Korea and Japan [1].
Although glass products were widely used in ancient Egypt and medieval Europe and excellent craftsmanship was developed, few glass products have been manufactured in Korea since the 10th century. This is due to improvements in the technology involved in producing earthware and ceramics, as well as the practical use of such equipment, which have made the production of glass a low priority. Consequently, glass products are not often discovered during excavations, and they are found in a relatively small excavation area [1].
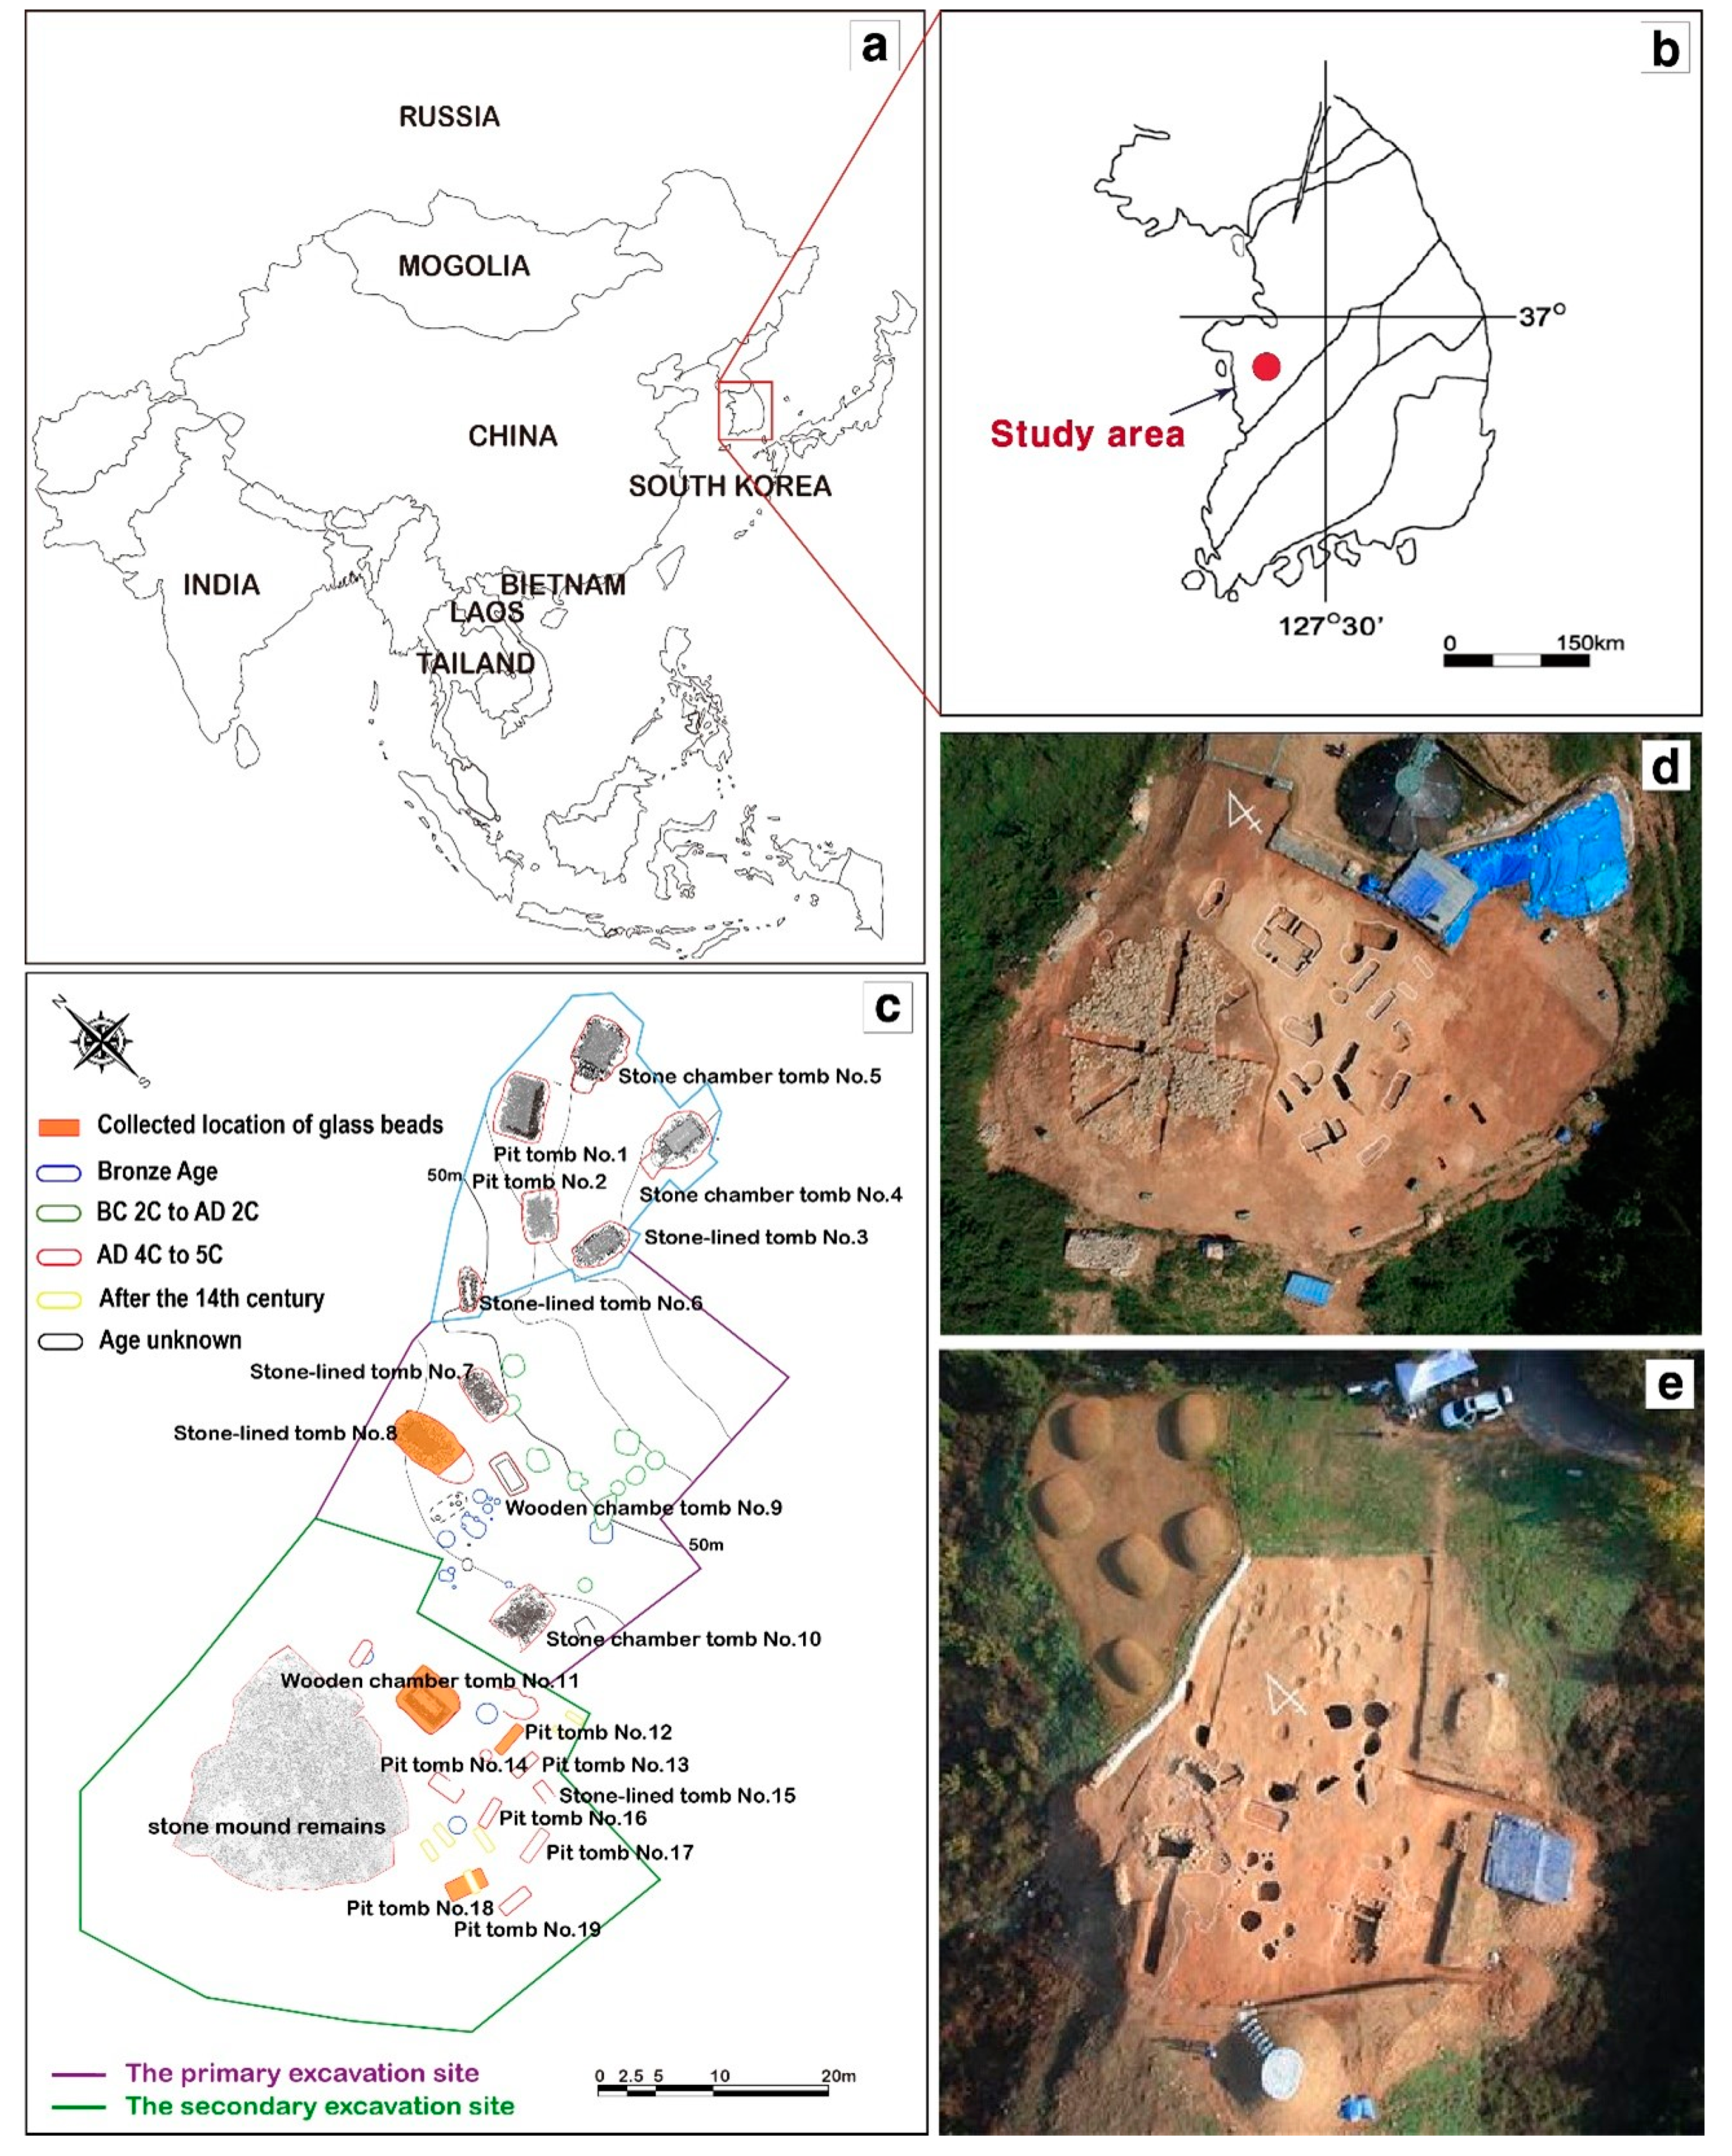
The Suchonri tomb complex was located in the Baekje Kingdom in ancient Korea at the Suchonri archaeological site in Gongju on the southwestern Korean Peninsula (Figure 1a,b). The tomb complex became a national designated cultural heritage site in 2005 (Historical Site No. 460). The site is estimated to have been developed from around the end of the fourth century to the early fifth century [2].
The Suchonri tomb complex in Gongju was divided into sites 1 and 2 based on geographical features (Figure 1c–e). Site 1 consist of residential areas and graves from the 4th to 10th centuries, and site 2 consists of five ancient tomb areas from the 4th to 5th centuries (Figure 1d,e). The glass beads used in this study were excavated from stone-lined tomb No. 8 in the first excavation site, and pit tombs Nos. 11, 12, and 18 in the second excavation site [1].
The main component of ancient Korean glass is silica, and pulverized sand or pebbles are used as the primary materials. Generally, glass is produced by mixing fluxes and melting the mixture. Fluxes are substances, usually oxides, that are used in glasses, glazes, and ceramic bodies to lower the high melting point of the main glass constituents, usually silica and alumina. Although it is possible to produce pure silica glass by melting silica, this was difficult with ancient techniques, as the melting temperature of silica is approximately 1850 °C. Therefore, ash from minerals or plants was added to lower the melting temperature to 700 to 900 °C [3,4,5,6].
However, as this process may result in a product with high water solubility and instability due to a low level of durability, stabilizers were sometimes added. The compositions of the stabilizers included PbO, CaO, Al2O3, and MgO. In addition, materials were introduced to add color to the glass, including Ti, Mn, Fe, Cu, and Co, and it was also possible to obtain different colors by using impurities [3,4,5,6].
This study identified the physicochemical properties of glass beads excavated from stone-lined tomb No. 8 and pit tombs Nos. 11, 12, and 18 from the Suchonri tomb complex in ancient Korea using a micro-invasive technique. In addition, the color diversity and production techniques used to produce glass beads from the Suchonri site were identified based on the findings.
2. Materials and Methods
2.1. Materials
Following excavation, the original forms of the glass beads from stone-lined tomb No. 8 at the time that they were buried were preserved; they were generally blue in color. The glass beads from pit tomb No. 11 were of various colors, such as blue, brown, green, and blue-green, and beads of the same color were grouped together. The glass beads from pit tomb No. 12 were distributed along one side of the site and were all brown in color. Glass beads of various colors, such as blue, light blue, brown and green, were excavated from pit tomb No. 18.
To identify the compositions and material features of the glass beads, they were classified, and the major colors were identified (Table 1). The colors selected were blue, brown, green, light blue, and blue-green. The glass beads from stone-lined tomb No. 8 were excavated in fragments instead of round forms, and the sample used for the analysis was a single fragment with minimal weathering (Table 1).
Brown, green, and blue-green glass was selected from pit tomb No. 11 (Table 1). Blue-green glass beads were excavated in fragments, and one fragment with minimal weathering was selected, similar to the glass from stone-lined tomb No. 8. As only brown glass was collected from pit tomb No. 12, only one bead was analyzed (Table 1). Light-blue, brown, and green glass beads were collected from pit tomb No. 18, and one glass bead of each color was selected for analysis (Table 1).
The brown glass beads from pit tomb Nos. 11 and 12, and green glass beads from tomb No. 18 were the largest in size. The widths of the round glass beads, aside from the fragments, were 0.09 to 0.32 mm for brown glass beads from pit tomb No. 12, and 0.22 to 0.34 mm and 0.19 to 0.32 mm, respectively, for the light-blue and green glass beads from pit tomb No. 18. These glass beads were the thickest (Table 1).
This study analyzed the physical and chemical compositions of glass beads and investigated the color diversity based on the findings. Eight samples were used for the analysis, including one sample from stone-lined tomb No. 8, three samples from stone-lined tomb No. 11, one sample from pit tomb No. 12, and three samples from pit tomb No. 18 at the Suchonri site.
2.2. Methods
The selected samples first underwent preprocessing. First, the surfaces of the glass samples were settled with epoxy resin, and scratches were eliminated by polishing the surfaces as follows: sandpaper, Nos. 400, 800, 1200, 2000, and 4000, and then diamond suspensions of 6 µm and 1 µm. In addition, contamination was minimized by washing the samples with ultrasonic waves three times for five minutes after each polishing stage.
Analysis of the physical properties was conducted with the naked eye and through stereoscopic microscope observations. The stereoscopic microscopes used were the Nikon SNZ1000 and the Dino AD-7013MZT, and observations included the form, color, transparency, and weathering conditions such as cracks.
The presence of internal cracks and bubbles, and the condition of the coloring materials and stabilizers, were observed using a scanning electron microscope (SEM, MIRA3 LMH), an energy-dispersive X-ray spectrometer (EDS, QUANTAX 200) was also used to analyze the compositions. The glass beads were coated in carbon and analyzed with 20 kV of beam energy; the measurement time varied depending on the condition of the sample.
3. Results and Interpretation
3.1. Stereoscopic Microscopy
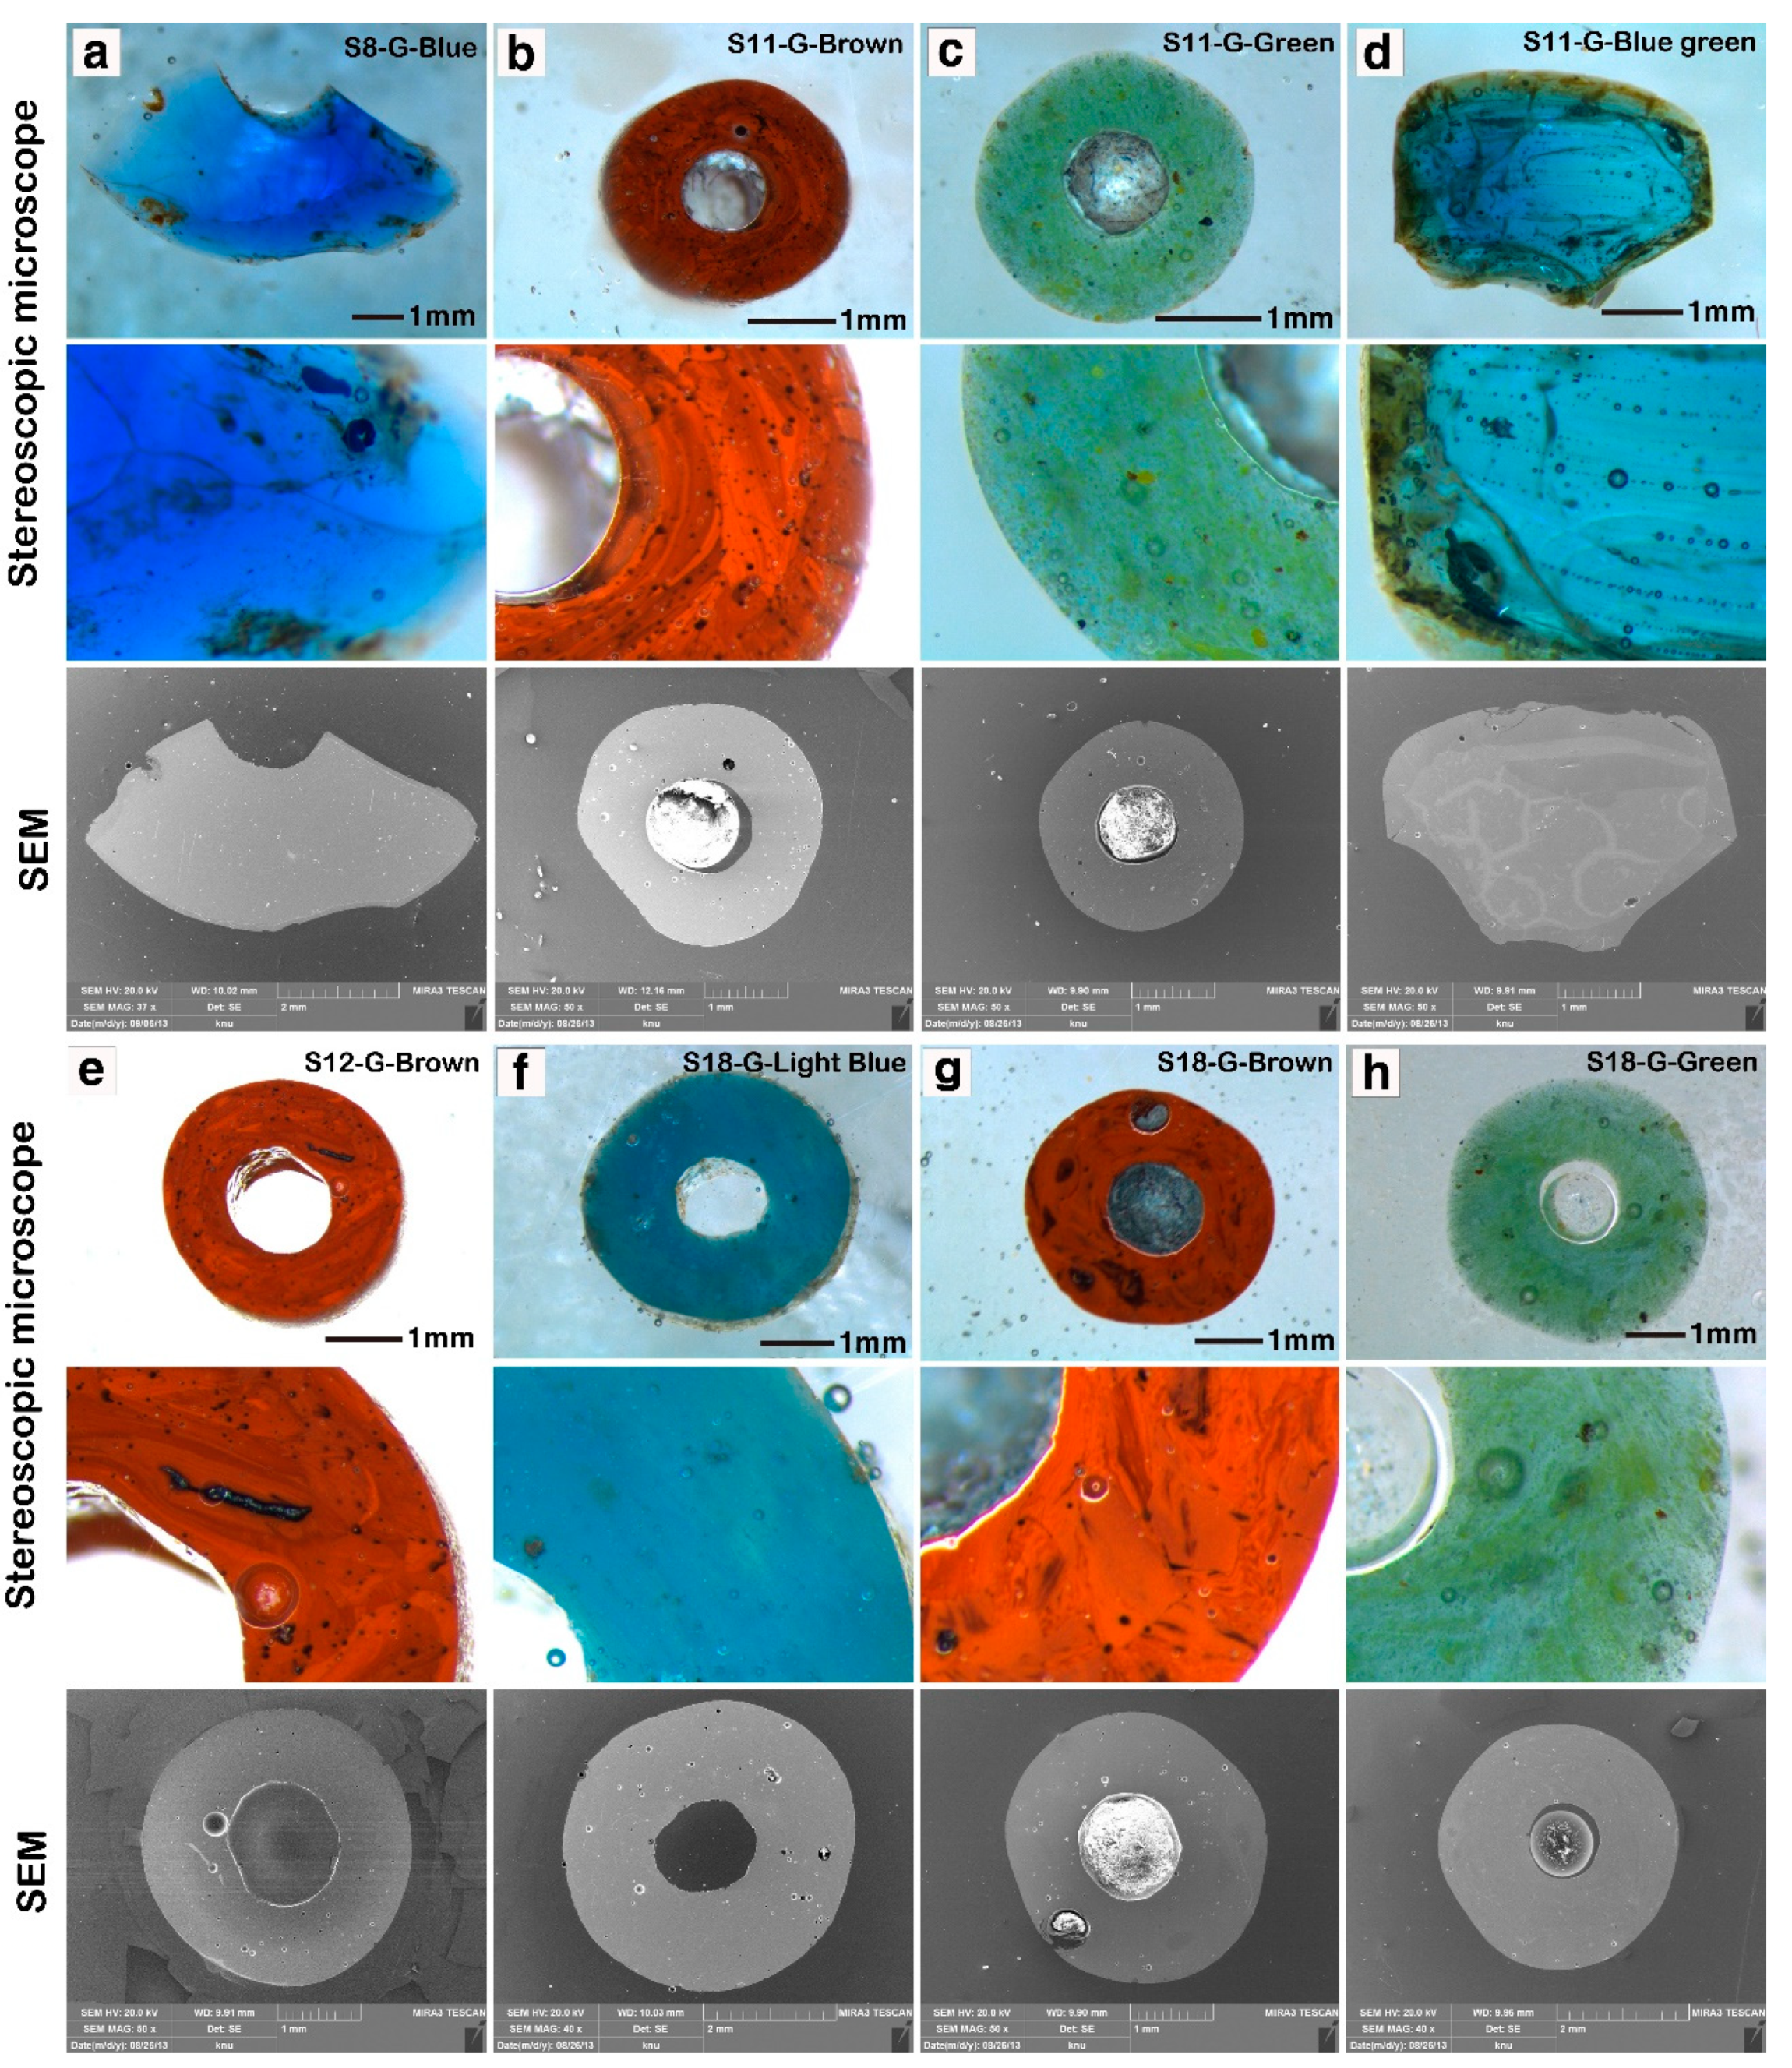
A stereoscopic microscope was used to identify the colors, distribution of bubbles, impurities, cracks, and surface weathering in the representative glass bead samples (Figure 2). All glass beads were translucent when they were blue, and opaque when they were brown and green, regardless of their excavation site.
The blue glass beads from tomb No. 8 and the blue-green glass beads from tomb No. 11, which were excavated in fragments, had greatly weathered brown edges, and small and large cracks (Figure 2a,d). Although the edges of the brown glass beads from tomb No. 11 were not greatly weathered, there were several small cracks within the glass beads (Figure 2b).
The green glass beads from tomb No. 11 were of a balanced round shape and did not have significant weathering (Figure 2c). The surfaces had several glass bubbles, and contained mixtures of brown, yellow, and blue substances. Unlike the glass beads from tomb No. 8, which were excavated in fragments in the same blue color, the blue-green glass beads from tomb No. 11 had small bubbles distributed in a traverse direction. This may be because the glass beads were shaped when they were not completely melted [7].
Although the brown glass beads from tomb No. 12 did not have significant weathering at the edges like the brown glass beads from tomb No. 11, they contained various black particles of different sizes (Figure 2e). In addition, there was not a single brown color, but rather a mixture of light and dark brown colors. The edges of the light-blue glass beads from tomb No. 18 were weathered and brown in color, and the color was relatively uniform (Figure 2f). Bubbles of various sizes were distributed throughout the beads, as were mixtures of brown and white substances.
The brown glass beads from tomb No. 18 showed melting traces identical to those of the brown glass beads from tombs No. 11 and 12. The surfaces of the glass also had black materials, in the form of elongated circles (Figure 2g). The surfaces of the green glass beads from tomb No. 18 had mixtures of brown, green, and light-green materials, and the edges were rounded (Figure 2h).
3.2. Scanning Electron Microscopy
A scanning electron microscope (SEM) was used to identify the detailed textures, cracks, and bubbles present in the beads. Backscattered electron (BSE) images were used to reveal the detailed bead structures, while the secondary electron (SE) mode was also used to identify cracks and bubbles (Figure 2).
The edges of the blue glass bead fragments from tomb No. 8 were weathered, and there were clear boundaries between the weathered and non-weathered parts. There were rarely any bubbles, and the stabilizers and coloring materials were distributed in spots. The brown glass beads from tomb No. 11 had numerous glass bubbles, and the edges were worn out.
Although few bubbles were identified in the green glass beads from tomb No. 11, unmelted white coloring materials and stabilizers were present. The SEM observations also showed clear boundaries between the weathered and non-weathered parts of blue-green glass fragments from tomb No. 11. The SEM data also showed significant weathering at the edges of these beads. In particular, there were more developed cracks and shattering in the upper parts of the fragments, and the weathered parts within the fragments contained darker colors.
The elongated black material from the brown glass beads from tomb No. 12 presented as white, and the helical organizational structure observed with the stereoscopic microscope was not observed in the SEM images. The bubbles were unbalanced, as they were concentrated on one side. The light-blue glass beads from tomb No. 18 were greatly worn out on the edges, and many bubbles, both small and large were identified.
The brown glass beads from tomb No. 18 had extremely large bubbles at the edges, which were filled with unknown components. There were black impurities that were not melted. The green glass beads from pit tomb No. 18 had smooth edges, unlike the brown and blue-green glass from the same location, and there were no traces of wearing out as well.
3.3. Chemical Composition and Variations
3.3.1. Classification
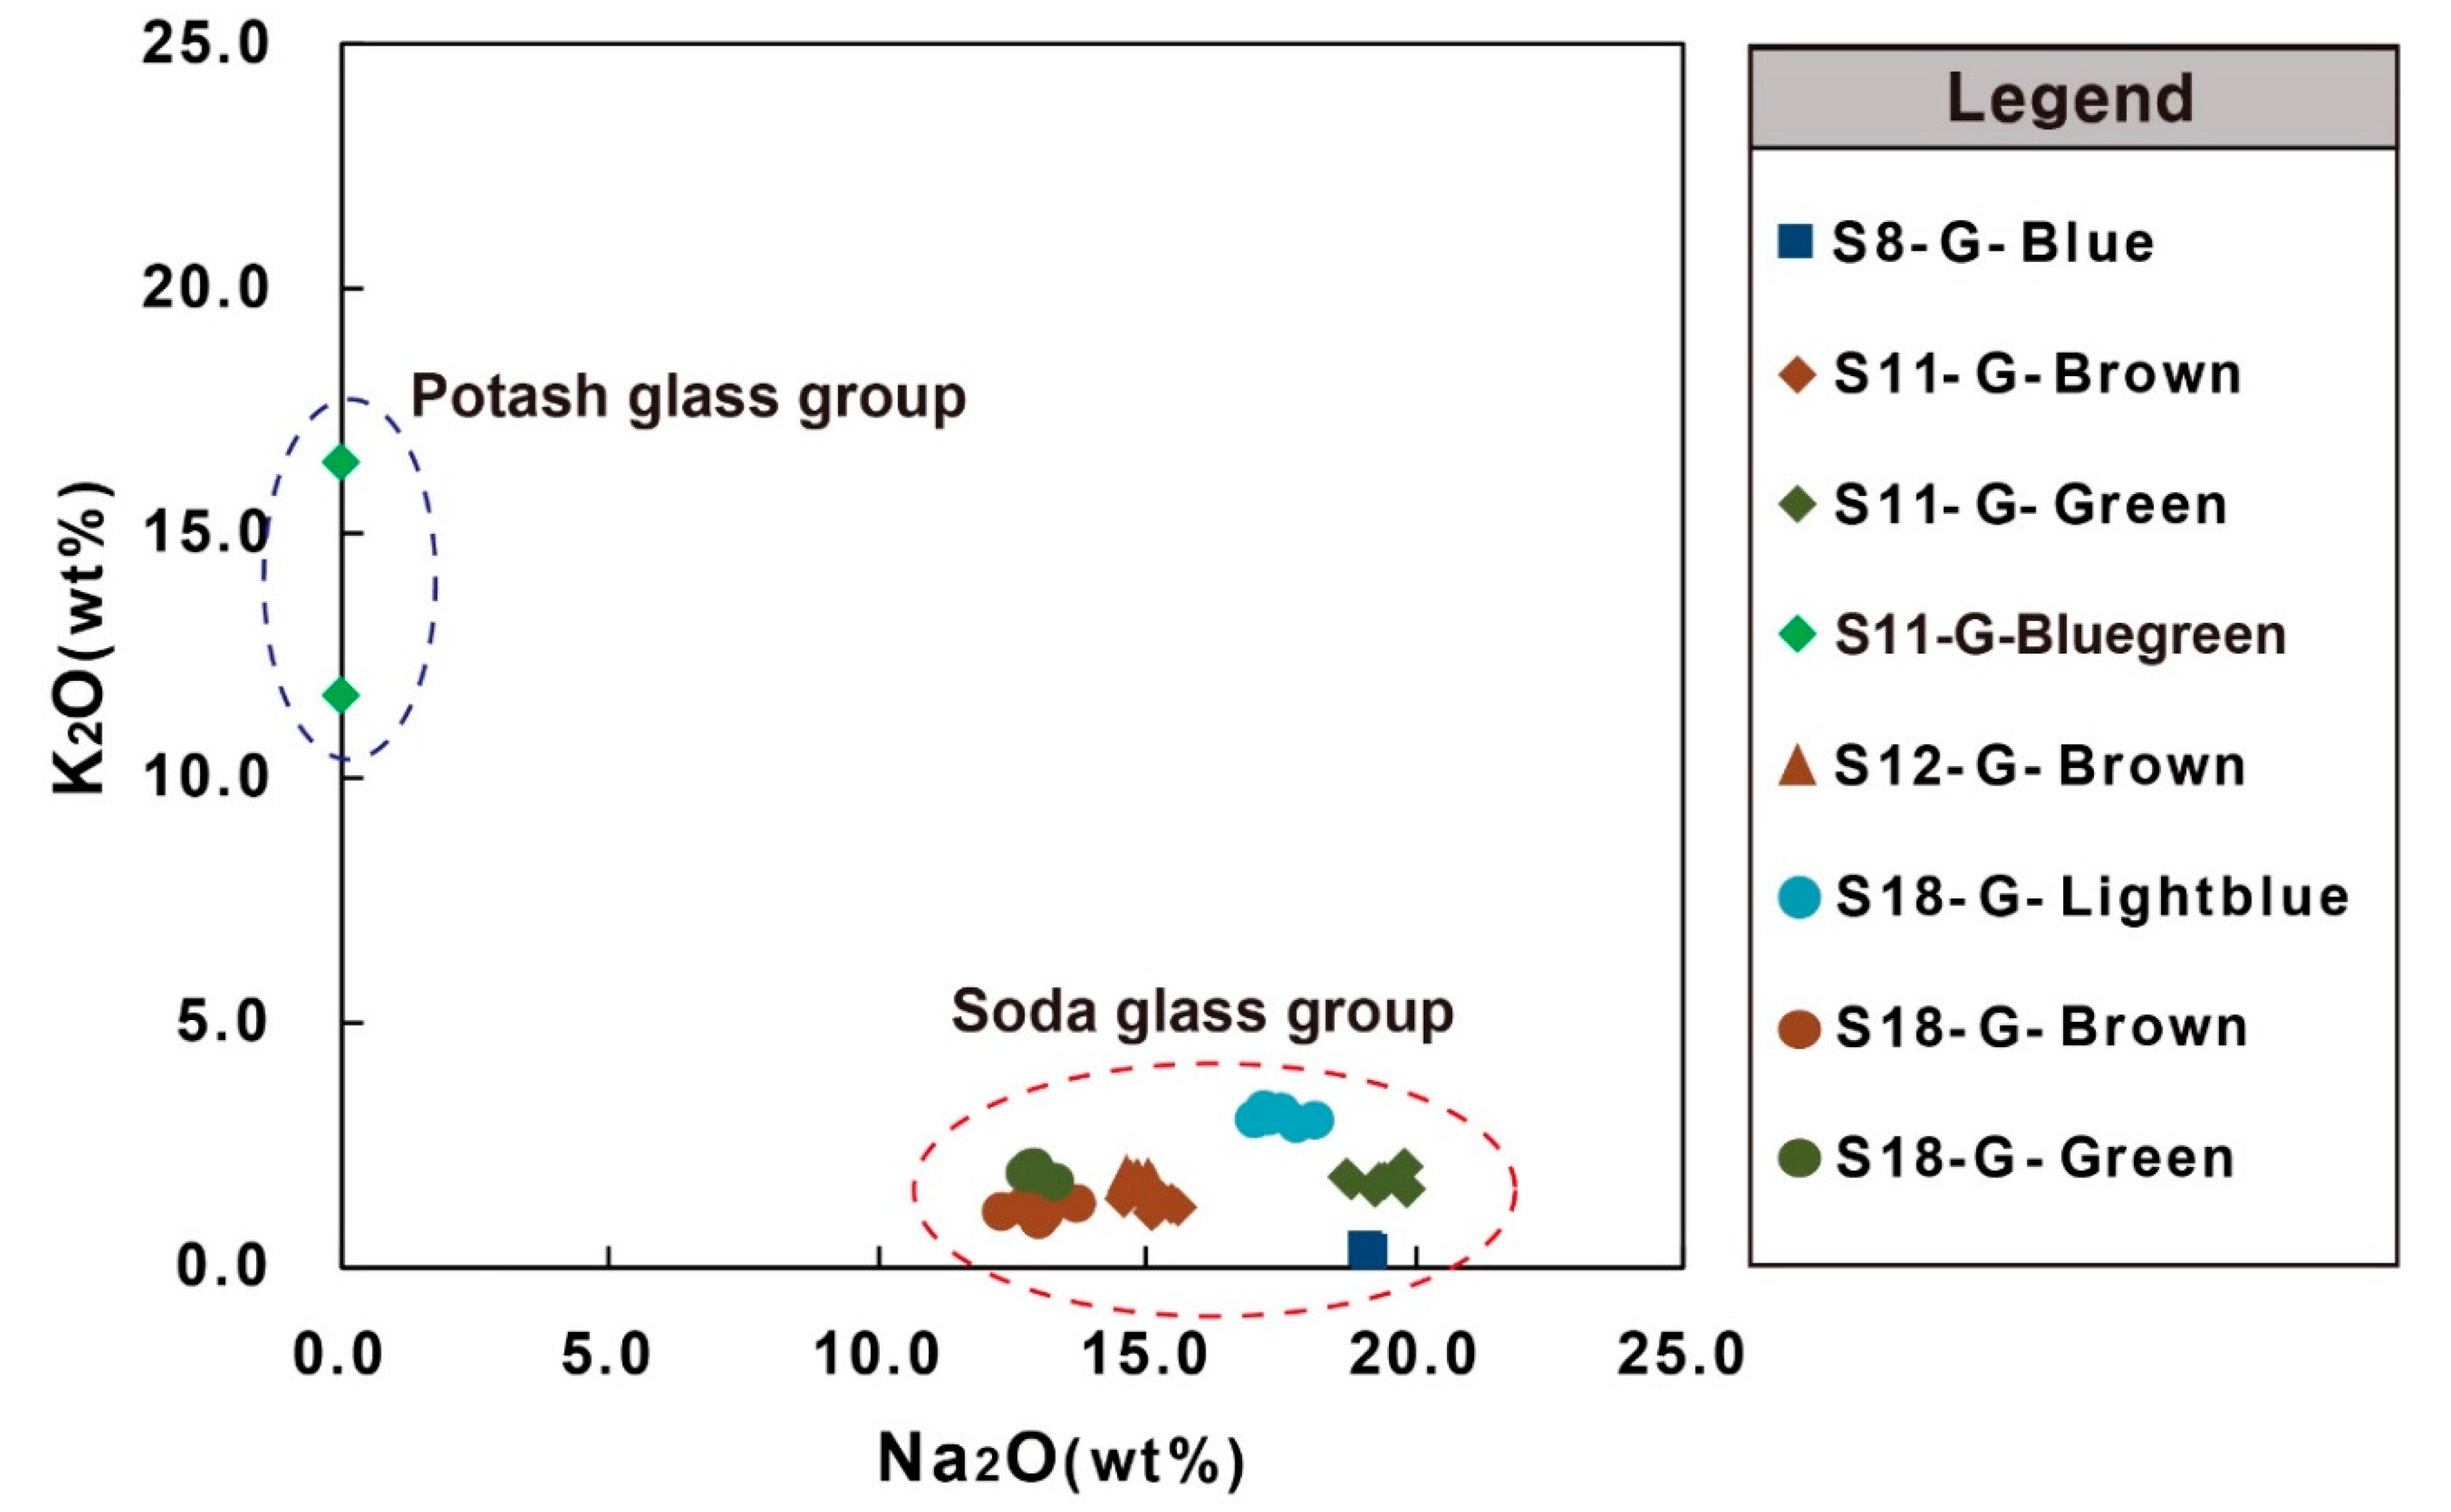
A SEM-EDS analysis was conducted to identify the chemical compositions of the glass beads (Table 2). Surface analyses were performed by dividing the glass beads into three to eight areas based on size and form, and the results of the analysis are shown as means. The major elements of glass are silica oxides, with oxidized alkali added to lower the melting temperature and make processing easier (Figure 3).
The alkali elements are called fluxes, and these include Na2O and K2O [3,5,8,9,10,11,12,13,14,15,16,17,18]. To identify the compositions of the glass beads excavated from the Suchonri site, the relationship between the concentrations of Na2O and K2O was graphed.
The graph shows that all samples, aside from the fragments of blue-green glass beads from tomb No. 11, were soda glass with large amounts of Na2O, regardless of their color. The fragments of blue-green glass beads from tomb No. 11 had more weathering at the edges, compared with the other glass beads, and it was possible to observe brown weathering boundaries under a microscope. This is because potash glass has chemical properties that make it more vulnerable to weathering than soda glass [19,20].
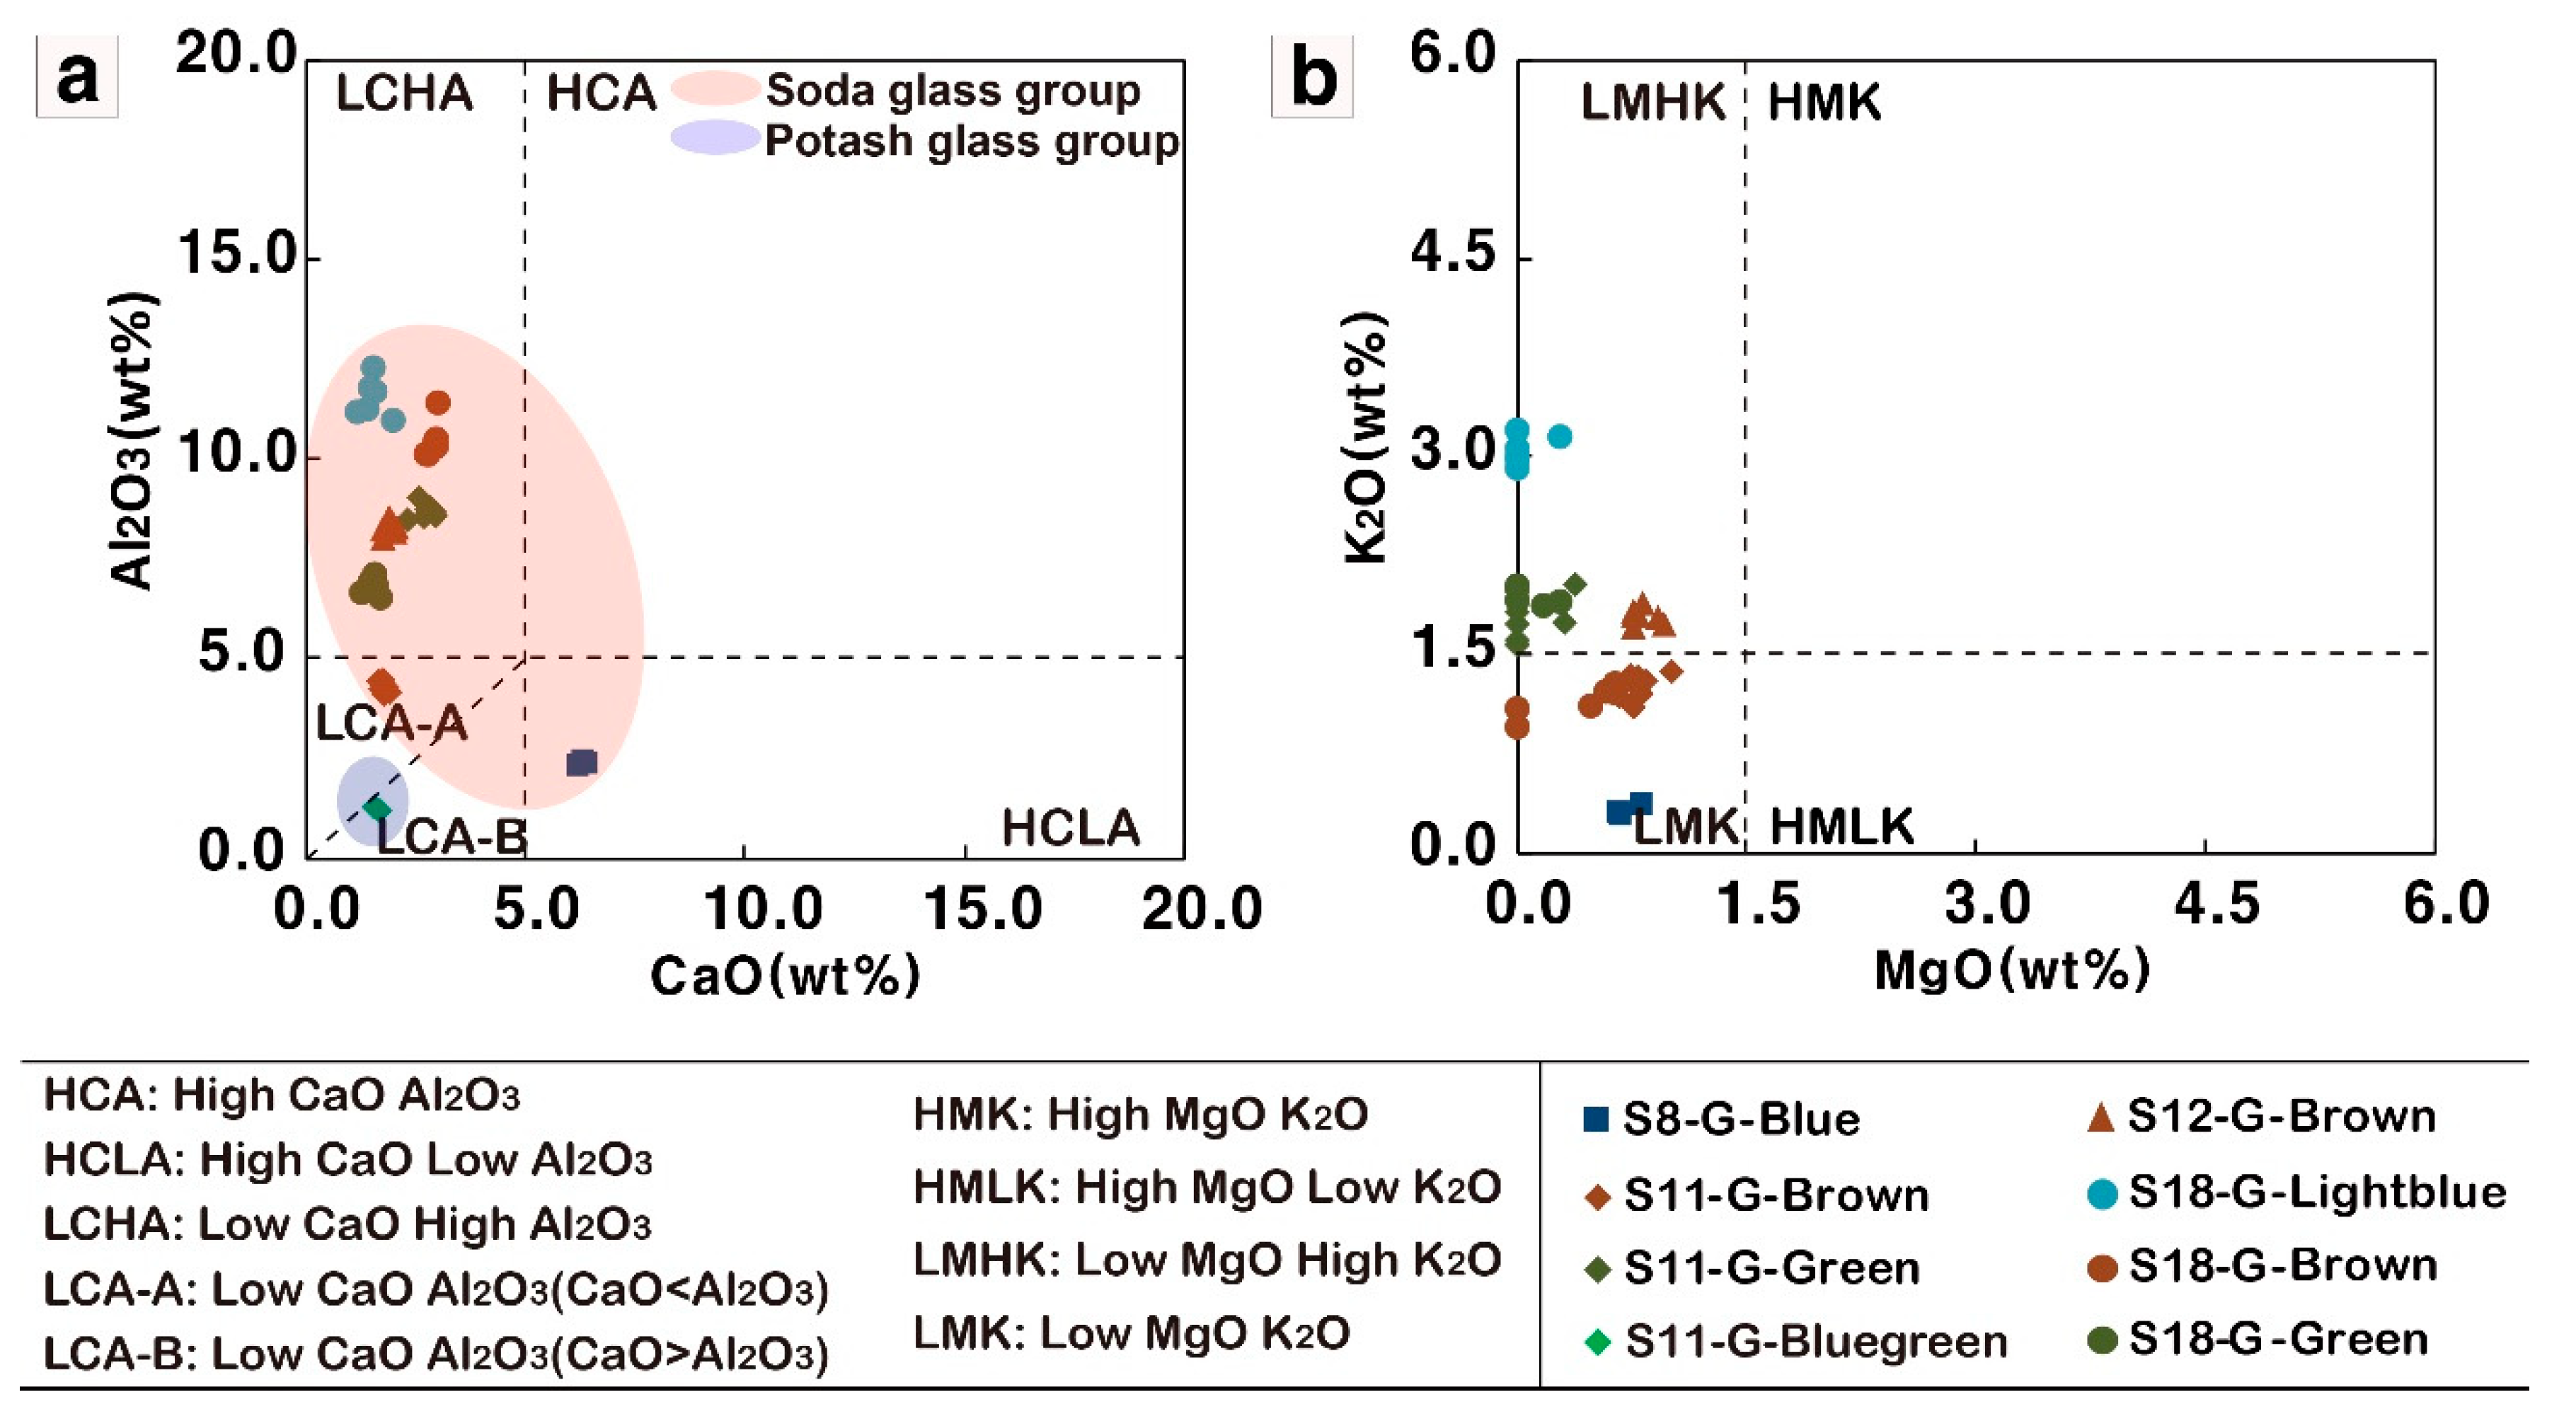
Stabilizers, which increase durability and maintain chemical stability, are added to glass. Based on the use of CaO and Al2O3 (5 wt.%) as stabilizers, the glass may be classified as LCA (low CaO, Al2O3), LCHA (low CaO, high Al2O3), HCLA (high CaO, low Al2O3), or HCA (high CaO, Al2O3). In addition, LCA glass can be divided into LCA-A (low CaO < Al2O3), which has large amounts of Al2O3, and LCA-B (low CaO > Al2O3) which has large amounts of CaO [5,16,17,20].
The glass beads excavated from the Suchonri site were classified based on the composition of their stabilizers (Figure 4). The results show that the blue-green glass beads from tomb No. 11, which are potash glass, were classified as LCA, and were closer to LCA-B due to having a relatively large concentration of CaO, in contrast to rather than LCA-A glass, which has a relatively large concentration of Al2O3 (Figure 4a).
Soda glass was identified in LCA, LCHA, and HCLA areas, aside from HCA. All the glass beads were located in LCHA areas and had a low concentration of CaO and a large concentration of Al2O3, regardless of their color, and the brown glass beads from tomb No. 11 were distributed along the LCA-A area and had a large concentration of Al2O3. The blue glass beads from tomb No. 8 were located in the HCLA area and had a large concentration of CaO and a low concentration of Al2O3 (Figure 4a).
In particular, the blue glass beads from tomb No. 8 had larger concentrations of CaO in comparison with other glass beads. However, while the concentration of CaO in the glass beads was 5 to 10 wt.%, the concentration of Al2O3 in light-blue and brown glass beads from tomb No. 18 was over 10 wt.%, which is extremely high (Figure 4a).
It is known that sodium in ancient glass is contained in minerals (Na2CO3) or ash from plants. The chemical composition of glass varies depending on the materials used, and generally, there are differences in the concentrations of MgO and K2O. Glass can be classified as HMK (high MgO, K2O), LMHK (low MgO, high K2O), HMLK (high MgO, low K2O), and LMK (low MgO, K2O) based on the 1.5% concentrations of MgO and K2O [5,16,17,20].
The compositions of seven soda glasses aside from the blue-green glass beads from tomb No. 11, which were potash glass, are displayed in Figure 4b. The graph shows that the soda glass was distributed along the LMHK and LMK areas. The blue glass beads from stone-lined tomb No. 8 were found in the LMK area, which means that they contain carbonate minerals, instead of ash from plants (Figure 4b).
However, the light-blue glass beads from tomb No. 18, which were also blue-colored glass, were different in that they had larger concentrations of K2O compared with the blue glass beads from stone-lined tomb No. 8. The reasons may be complex and may include the composition and amount of coloring materials (Figure 4b).
The green glass beads from tomb Nos. 11 and 18 had low concentrations of MgO and large concentrations of K2O, regardless of their excavation site. Unlike the green glass beads, the brown glass beads showed differences depending on their excavation site. Although the brown glass beads from tomb Nos. 11 and 18 were distributed along the LMK area, the brown glass beads from tomb No. 12 had similar concentrations of MgO but relatively greater concentrations of K2O (Figure 4b).
The coloring materials, which have the greatest effect in terms of determining the color of glass, have large amounts of metal components. Identical compositions may result in different colors because of oxidation and reduction occurring at the time of firing. Additionally, various colors may result from the addition of opaque materials such as PbO and bleaching materials. Generally, the coloring materials do not exceed 5 wt.% of the total glass composition [5,16,17,20].
The blue glass beads from tomb No. 8 had larger concentrations of Fe2O3 in comparison with other coloring materials. The fragments of blue-green glass beads from tomb No. 11 and the light-blue glass beads from tomb No. 18, which are all blue-colored glass just like the blue glass beads from tomb No. 8, differed, as the light-blue glass beads from tomb No. 18 had low concentrations of Fe2O3, CuO, and TiO2.
The blue-green glass beads from tomb No. 11 contained MnO, and large concentrations of copper oxide. All the green glass beads excavated from the Suchonri site contained Cu and Fe, as Cu results in a green color in oxidization firing environments.
The brown glass beads from tomb Nos. 11, 12, and 18 all contained Fe2O3, CuO, and TiO2 in addition to MnO. However, as there were slight differences in the concentrations of these compounds, it is estimated that differences in colors occur through the complex mixing process that the soda materials and impurities go through, even if the glass beads all appear to be brown in color.
3.3.2. Chemical Variation
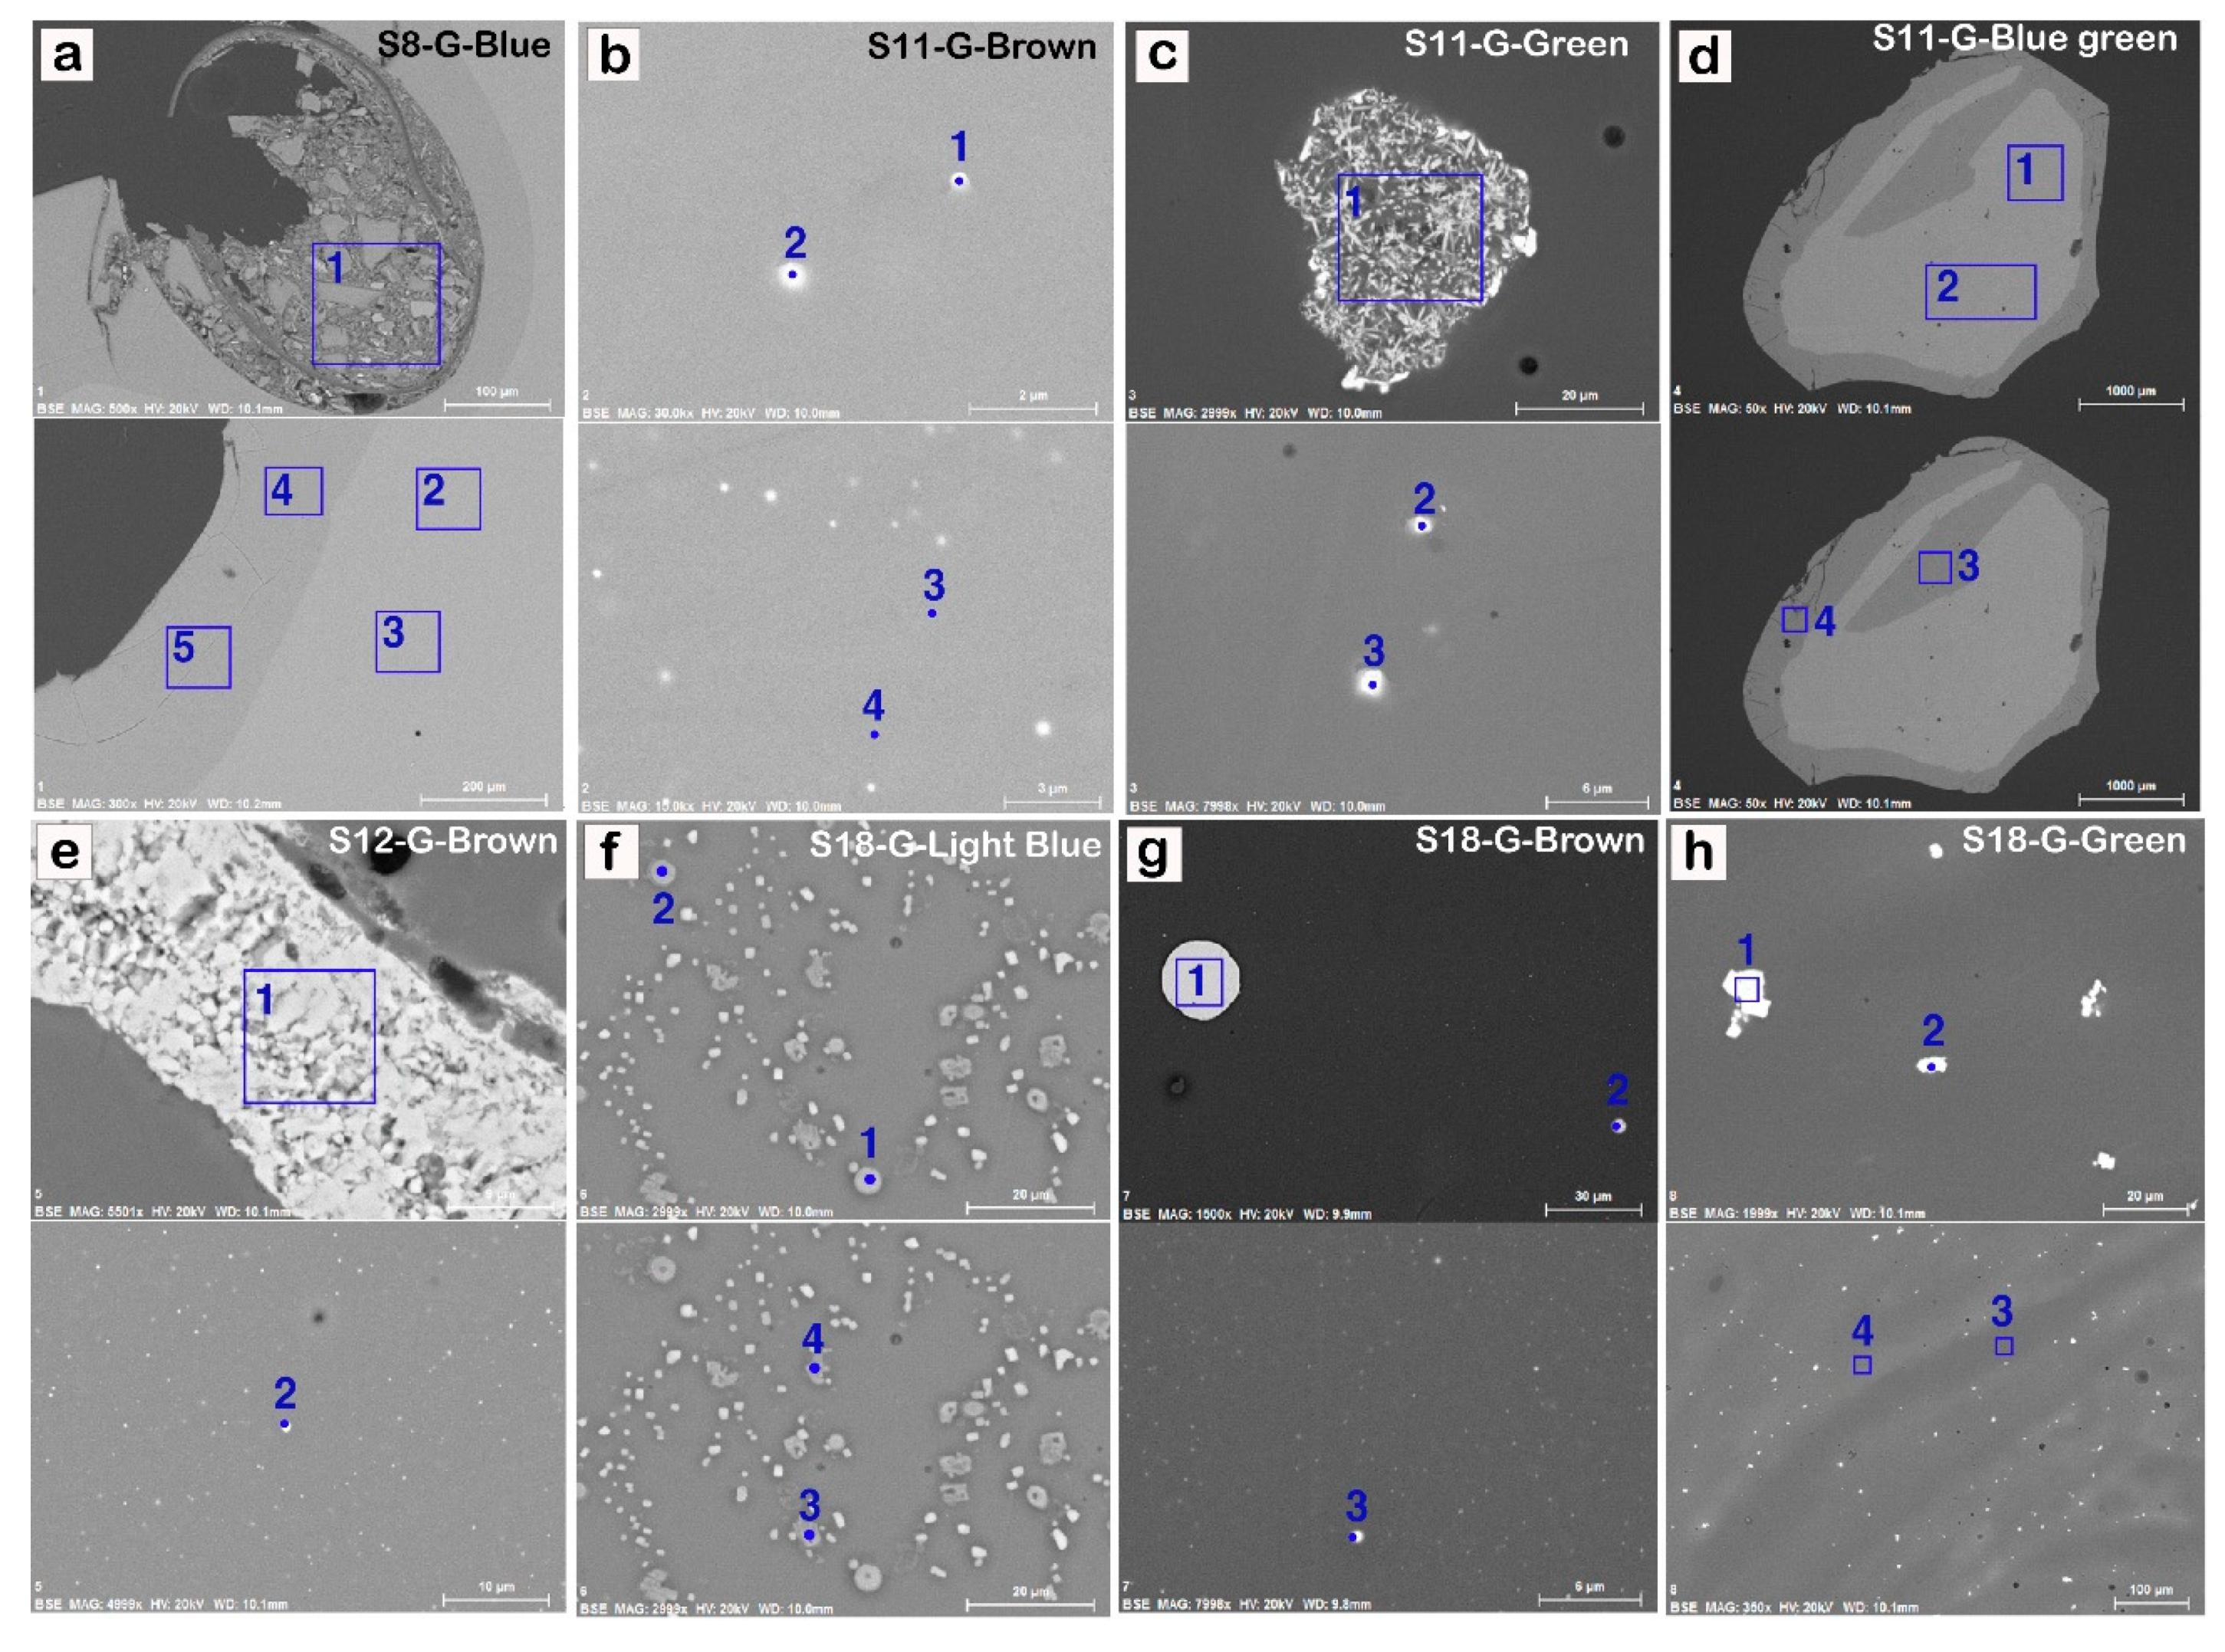
The SEM observations showed that there were weathered surfaces at the edges of most glass beads. There was crystallization of what was assumed to be stabilizers and coloring materials. Therefore, the differences in composition were compared and analyzed by EDS for both weathered and non-weathered surfaces. In addition, the distributions of coloring materials and stabilizers were identified, and quantitative and qualitative analyses were carried out (Figure 5 and Table 3).
The edges of the blue glass beads from tomb No. 8 were weathered, and the round materials, which were predicted to be coloring materials, were also weathered and shattered (Figure 5a). The bubbles were filled with crystalized materials, and the crystals were less than 100 µm in size. The SEM-EDS analysis revealed that 4.94 wt.% Fe2O3 was present in addition to the basic constituents. In addition, as there was a large concentration of Al2O3 (19.42%), it was concluded that the coloring materials and stabilizers were combined (Table 3).
There were no differences in the findings from the SEM-EDS analysis or the color composition for the brown glass beads from tomb No. 11 (Figure 5b). On the other hand, white impurities were identified on the surfaces of the green glass beads, and the SEM results showed the composition of the white impurities (Figure 5c). The white impurities were at least 20 µm in size and had strange shapes, and there were round impurities of less than 2 µm in size. The SEM-EDS analysis showed that the impurities had large concentrations of tin and lead (Figure 5c).
The concentrations of SnO2 and PbO in the large needle-shaped crystal impurities were 31.34 and 7.55 wt.%. The concentrations of SnO2 and PbO fromin the small round impurities were 6.64 to 9.64 wt.%, and 30.07 to 37.50 wt.%, respectively (Table 3). Therefore, it is estimated that these compounds form PbSnO3 making the glass opaque, instead of forming PbO and acting as stabilizers [7].
The results of the SEM-EDS analysis of the weathered and non-weathered surfaces of the blue-green glass beads from tomb No. 11 showed differences in the composition and concentrations of chemicals (Figure 5d). Small differences in the SiO2 concentration were identified: 75.72 to 76.20 wt.% on the non-weathered surfaces, and 84.86 to 89.01 wt.% on the weathered surfaces (Table 3).
The greatest difference identified was the K2O concentration. The concentration of K2O on non-weathered surfaces was 17.61 to 17.75 wt.%, but the concentration on weathered surfaces was only 0.40 to 6.58 wt.%, depending on the weathering conditions (Figure 5d). This may be because alkali elements have a high level of liquidity and can be easily dehydrated or eluviated from weathering. In addition, as the formula weight of the hydrogen ions substituted with potassium ions from the hydration process is lower, the weathered surfaces were darker in color than the non-weathered surfaces [20].
The surfaces of the brown glass beads from tomb No. 12 had an increased concentration of crystalized substances, and black and white impurities, as observed on other glass beads (Figure 5e). The results of the SEM-EDS showed that 97.69 wt.% of the beads was Fe2O3, with small amounts of SiO2 and CaO (Table 3).
As the base material of glass naturally contains some Fe, glass is a light-blue color if there are no coloring materials added [21,22,23]. However, Fe turns yellow or reddish-brown in color following oxidization. It is estimated that Fe was added to the glass for colorization, as Fe was included within glass in the crystal form. In addition, a large concentration of CuO was found in the white impurities (44.16 wt.%). CuO influences the color of the glass during firing, and it may have been added as a coloring material for the brown glass beads from pit tomb No. 12.
SEM observations of the light-blue glass beads from tomb No. 18 showed white and gray impurities were distributed in close proximity to each other (Figure 5f). These impurities were largely classified as being round or square in shape, and were quantitatively analyzed separately, as it was expected that the two would have different compositions. The results of the analysis show that although the compositions of the two were generally similar, there were differences in the concentrations of K2O, Na2O, and SO3. Although SO3 was not found in the square impurities, it was found in the round impurities in a low concentration.
The concentration of K2O in the round impurities was 7.80 to 11.20 wt.%, and the concentration in the square impurities was relatively low with 2.26 to 4.15 wt.%. The concentration of Na2O showed the opposite trend: 15.19 to 16.27 wt.% in the round impurities and 21.92 to 22.72 wt.% in the square impurities. The differences in the concentrations of K2O and Na2O may have resulted from substitution reactions rather than from the effects of fluxes, as K and Na are elements with strong ionization tendencies (Table 3).
The surfaces of the brown glass beads from tomb No. 18 were found to contain white impurities, just like the other glass beads (Figure 5g). The impurities were round in shape, and had various sizes ranging from approximately 5 µm to 30 µm. The results of SEM-EDS analysis show that the white impurities had large concentrations of CuO regardless of their size; therefore, it is predicted that they were added as coloring materials.
However, it is difficult to determine whether CuO was used as a coloring material rather than Fe2O3 in the glass beads from tomb No. 18. Generally, the concentration of coloring material is no more than 5 wt.% of the total composition of the glass, and the analysis of the glass compositions showed that brown glass beads from tombs Nos. 11, 12, and 18 all had less than 5 wt.% of Fe2O3 and CuO (Table 3). In addition, the stereoscopic microscope identified that black materials were present, just like in other types of brown glass, and the brown glass beads from tomb No. 18 used both CuO and Fe2O3 as coloring materials (Table 3).
There were white impurities of various sizes and forms in the green glass beads from tomb No. 18 (Figure 5h). The white impurities were less than 20 µm in size, and the results of the quantitative and qualitative analyses show that there were large concentrations of SnO2 and PbO: 12.23 to 15.18 wt.%, and 63.44 to 75.79 wt.%, respectively (Table 3). These results are identical to those obtained in the analysis of the green glass beads from tomb No. 11, and it is estimated that PbSnO3 was added to make the glass beads glossier and opaque.
3.4. Interpretation of Diversity
The results of the quantitative and qualitative analyses of the eight glass beads showed that one type was potash glass and the other seven were soda glass. Based on the findings, the study compared and analyzed the differences in fluxes, stabilizers, and coloring materials, and identified the origins of Na for the seven soda glass beads.
The quantitative and qualitative analyses of the glass beads showed that the blue glass bead from tomb No. 8, the brown and green glass beads from tomb No. 11, the brown glass beads from tomb No. 12, and the light-blue, brown, and green glass beads from tomb No. 18 were all soda glass. However, the blue-green glass beads from tomb No. 11 were potash glass. There was more soda glass from potash glass, and this may be because soda glass shows color more easily, is glossier, and resists weathering better than potash glass.
The stabilizers used for the glass included Al2O3, CaO, PbO, and MgO, and different concentrations of these were used according to whether the glass was soda or potash glass, and whether the color of the glass was brown, green, or blue. In addition, the blue glass beads from tomb No. 8, the brown and blue-green glass beads from tomb No. 11, the brown glass beads from tomb No. 12, and the light-blue glass beads from tomb No. 18 did not contain PbO.
Prior studies have stated that potash glass generally contains LCA (low CaO, Al2O3) properties and has few stabilizers. However, soda glass shows various stabilizer compositions depending on its color. The stabilizer concentration differs depending on the color of the glass. For the glass beads from the Suchonri site, blue-green potash glass was distributed along the LCA-B (low CaO < Al2O3) areas. However, green and blue-green glass was found to contain a lower concentration of CaO and a larger a concentration of Al2O3, and blue glass had less Al2O3 and more CaO.
All glass beads from the Suchonri site contained Fe, regardless of their color. Fe is yellow or reddish-brown in color, and it is estimated to affect the color of brown glass beads. Green glass beads contain Cu, as Cu has a green color in an oxidation firing environment. In addition, although Fe can be red or brown in an oxidation firing environment, it changes into green in a reduction firing environment. When comparing the concentrations of coloring materials among green colored glass beads, the green glass beads and blue-green glass bead of tomb No. 11 and the green glass beads of tomb No. 18 were found to contain more Cu than the green glass beads from tomb No. 18. This shows that there is a possibility that Cu and Fe were both used as coloring materials for green glass beads.
4. Discussion and Conclusions
The Suchonri site is an ancient tomb complex in Korea that was constructed in the Baekje Kingdom in the 4th century. This study analyzed the chemical compositions and color variations of blue, brown, blue-green, light blue, and green glass beads excavated from tombs Nos. 11, 12, 18, and stone-lined tomb No. 8. The glass beads had many bubbles, and the brown glass beads from tomb Nos. 11, 12, and 18 had larger amounts of black impurities. The rims of the blue glass beads from tomb No. 8 and the light-blue glass beads from tomb No. 18 were cracked or broken, and the blue-green glass bead from tomb No. 11 was discolored, and had become brown due to weathering.
The SEM observations showed that the coloring materials and stabilizers contained white or black impurities, and the weathered surfaces were darker than the non-weathered surfaces. The results of the quantitative and qualitative analyses of the compositions of the weathered surfaces showed decreasing trends for the concentrations of the alkali elements Na and K used. This is because alkali elements are vulnerable to weathering. The classification of the glass beads from the Suchonri site revealed that all samples, aside from the blue-green glass beads from tomb No. 11, were soda glass, and they all had high concentrations of Na2O, regardless of their color.
After analyzing the coloration elements, Fe and Cu were found in all of the glass beads, and it is predicted that both elements were used to produce a green color. It is predicted that Fe was used to produce a brown color. Cobalt (Co), known to give glass its blue color, was not detected in the glass. This needs to be further examined, and coloring agents other than cobalt should be considered as well.
This study shows that ancient glass samples from Korea exhibit a wide array of chemical compositions, and there are regional and historical variations as well. In addition, glass samples from the same era or area have different compositions depending on their color. The results of this study are expected to act an important data source for future research on the compositions and various colorant materials used in ancient glass beads on the peninsula at the end of the 4th century.
Author Contributions
Conceptualization, C.H.L. and J.Y.; Methodology, C.H.L. and J.Y.; Software, J.Y. and H.R.Y.; Validation, C.H.L., J.Y. and H.R.Y.; Formal Analysis, J.Y.; Investigation, J.Y.; Resources, J.Y.; Data Curation, J.Y. and H.R.Y.; Writing–Original Draft Preparation, J.Y.; Writing–Review & Editing, J.Y.; Visualization, J.Y.; Supervision, C.H.L.; Project Administration, J.Y.; Funding Acquisition, C.H.L. All authors have read and agreed to the published version of the manuscript.
Funding
This search received no external funding.
Institutional Review Board Statement
No applicable.
Informed Consent Statement
No applicable.
Data Availability Statement
Data is contained within the article.
Conflicts of Interest
The authors declare no conflict of interest.
References
- Pyeon, J.P.; Kim, J.S. Glass, Knocking at the Door of Art; Korea Craft & Arts Design Foundation: Seoul, Korea, 2010; pp. 1–398. (In Korean) [Google Scholar]
- CIHC (Chungnam Institute of History and Culture). The Suchonri Site in Gongju City; Chungnam Institute of History and Culture: Gongju, Korea, 2007; pp. 1–592. (In Korean) [Google Scholar]
- Goffer, Z. Archaeological Chemistry; John Wiley & Sons Inc.: Hoboken, NJ, USA, 1980; pp. 1–263. [Google Scholar]
- Kang, H.T.; Jeong, G.Y.; Hue, W.Y.; Kim, S.B.; Cho, N.C. Chemical compositions and lead isotope ratios of the lead glass from Wanggung-ni, Iksan, Chollabuk-do. J. Korean Anc. Hist. Soc. 2004, 45, 31–48. (In Korean) [Google Scholar]
- Lee, I.S. Ancient Glass of Republic Korea; Baeksan Culture: Jeollabuk-do, Korea, 1993; pp. 1–118. (In Korean) [Google Scholar]
- Tsuneo, Y.; Tanahashi, J. Oriental Glass China, Korea, Japan; Sansaisha: Tokyo, Japan, 1997; pp. 1–204. Available online: http://www.orientglassware.com/English/aboutus.asp?CLS=1 (accessed on 12 May 2021). (In Japanese)
- Lee, J.H. Glass Technology; Cheongmoongak: Gyeonggi, Korea, 1997; pp. 1–390. (In Korean) [Google Scholar]
- Bertini, M.; Shortland, A.; Milek, K.; Krupp, E.M. Investigation of Iron Age north-eastern Scottish glass beads using element analysis with LA-ICP-MS. J. Archaeol. Sci. 2011, 38, 2750–2766. [Google Scholar] [CrossRef]
- Garcia-Heras, M.; Rincon, J.M.; Jimeno, A.; Villegas, M.A. Pre-Roman coloured glass beads from the Iberian Peninsula: A chemico-physical characterisation study. J. Archaeol. Sci. 2005, 32, 727–738. [Google Scholar] [CrossRef]
- Kato, N.; Nakai, I.; Shindo, Y. Change in chemical composition of early Islamic glass excavated in Raya, Sinai Peninsula, Egypt: On-site analyses using a portable X-ray fluorescence spectrometer. J. Archaeol. Sci. 2009, 36, 1698–1707. [Google Scholar] [CrossRef]
- Liu, S.; Li, Q.H.; Gan, F.; Zhang, P.; Lankton, J.W. Silk Rad glass in Xinjiang, China: Chemical compositional analysis and interpretation using a high-resolution portable XRF spectrometer. J. Archaeol. Sci. 2012, 39, 2128–2142. [Google Scholar] [CrossRef]
- Moon, W.S.; Whang, J.J.; Cho, N.C.; Hong, J. The scientific analysis of glass beads excavated from Naesanri in Gosung. Conserv. Stud. 2000, 21, 57–75. (In Korean) [Google Scholar]
- Oujja, T.M.; Garcia-Heras, M.; Villegas, M.A.; Castilljo, M. Laser induced breakdown spectroscopy for analysis and characterization of degradation pathologies of Roman glasses. Spectrochim. Acta Part B 2013, 87, 114–120. [Google Scholar]
- Polikreti, K.; Murphy, J.M.A.; Kantarelou, V.; Katydas, G. XRF analysis of glass beads from the Mycenaean palace of Nestor at Pylos, Peloponnesus, Greece: New insight into the LBA glass trade. J. Archaeol. Sci. 2011, 38, 2889–2896. [Google Scholar] [CrossRef]
- Prinsloo, L.C.; Tournie, A.; Colomban, P. A Raman spectroscopic study of glass trade beads excavated at Mapungubwe hill and K2, two archaeological sites in southern Africa, raises questions about the last occupation date of the hill. J. Archaeol. Sci. 2011, 38, 3264–3277. [Google Scholar] [CrossRef]
- Robertshaw, P.; Wood, M.; Melchiorre, E.R.; Popelka-Filcoff, S.; Glascock, M.D. Southern African glass beads: Chemistry, glass sources and patterns of trade. J. Archaeol. Sci. 2010, 37, 1898–1912. [Google Scholar] [CrossRef]
- Smit, Z.; Knific, T.; Jezersek, D.; Istenic, J. Analysis of early medieval glass beads-glass in the transition period. Nucl. Instrum. Methods Phys. Res. B 2012, 278, 8–14. [Google Scholar] [CrossRef]
- Wedepohl, K.H.; Simon, K.; Kronz, A. The chemical composition including the rare earth elements of the three major glass types of Europe and the Orient used in late antiquity and the Middle Ages. Geochemistry 2011, 71, 289–296. [Google Scholar] [CrossRef]
- Han, M.S.; Lee, H.H.; Moon, J. Characteristics of chemical compositions and weathering of glass beads excavated from Andong Tumulus in Gildu-ri, Goheung. J. Conserv. Sci. 2011, 27, 323–332. (In Korean) [Google Scholar]
- Newton, R.; Davison, S. Conservation of Glass; Butterworths: Oxford, UK, 1989; pp. 135–158. [Google Scholar]
- Jo, D.Y. Experimenal work on lead-barium glass from the Korean Early Iron Age. J. Korean Archeaological Soc. 2007, 63, 34–63. (In Korean) [Google Scholar]
- Jung, G.Y.; Kang, H.T.; Go, M.J.; Kim, W.J. Chemical compositions of glass beads from tombs of Bupwha-ri site, Yeongdong. J. Conserv. Sci. 2011, 27, 243–250. (In Korean) [Google Scholar]
- Lee, C.; Chae, M.J.; Kim, S.W.; Kang, H.T.; Lee, J.D. Classification of Korean ancient glass pieces by pattern recognition method. J. Korean Chem. Soc. 1992, 36, 113–124. (In Korean) [Google Scholar]
Figure 1.
Location map and status showing the ancient tomb complex in the Suchonri site on the Korean Peninsula. (a,b) Map showing the location of research area. (c) Location of the selected glass beads at the Suchonri site. (d) Primary excavation site. (e) Secondary excavation site.
Figure 1.
Location map and status showing the ancient tomb complex in the Suchonri site on the Korean Peninsula. (a,b) Map showing the location of research area. (c) Location of the selected glass beads at the Suchonri site. (d) Primary excavation site. (e) Secondary excavation site.

Figure 2.
Glass bead samples observed under a stereoscopic microscope and scanning electron microscope. (a) Blue glass from tomb No. 8. brown (b), green (c), and blue-green (d) glasses from tomb No. 11. (e) Brown glass from tomb No. 12. light-blue (f), brown (g), and green (h) glasses from tomb No. 18.

Figure 3.
Diagram comparing the Na2O and K2O concentrations in representative glass bead samples.

Figure 4.
Diagram comparing the CaO and Al2O3 concentrations (a) and the MgO and K2O concentrations (b) in representative glass bead samples.
Figure 4.
Diagram comparing the CaO and Al2O3 concentrations (a) and the MgO and K2O concentrations (b) in representative glass bead samples.

Figure 5.
SEM-EDS analysis of microtextural constituents. (a) Analysis spots in five planes of a blue glass bead from tomb No. 8. (b) Four analysis points for a brown glass bead from tomb No. 11. (c) Analysis spots in one plane and at two points for a green glass bead from tomb No. 11. (d) Analysis spots in four planes for a blue glass bead from tomb No. 11. (e) Analysis spots in one plane and at one point for a brown glass bead from tomb No. 12. (f) Analysis spots in four points for a light-blue glass bead from tomb No. 18. (g) Analysis spots in one plane at two points for a brown glass bead from tomb No. 18. (h) Analysis spots in three planes and at one point for a brown glass bead from tomb No. 18.


Table 1.
Descriptions of glass beads from the Suchonri tomb complex.
| Sample No. | Material | Location | Tomb Type | Color | Number | Internal Diameter (mm) | External Diameter (mm) | Thickness (mm) | Characteristics |
|---|---|---|---|---|---|---|---|---|---|
| S8-G-Blue | glass bead | No. 8 | stone-lined tomb | Blue | broken pieces | 0.15–0.25 | 0.43–0.64 | 0.25–0.51 | translucent, small amount of air bell, black and yellow impurities, crack of surface, surface weathering |
| S11-G-Brown | glass bead | No. 11 | pit tomb | Brown | 4 | 0.10–0.15 | 0.34–0.35 | 0.18–0.22 | opaque, elongated black impurities, small amount of air bell, white particles on surface |
| S11-G-Green | Green | 16 | 0.05 | 0.19–0.24 | 0.09–0.16 | opaque, many air bells, black, yellow, and yellowish-brown impurities | |||
| S11-G-Blue-green | Blue-green | broken pieces | − | − | 0.08–0.42 | translucent, many air bells, surface weathering | |||
| S12-G-Brown | glass bead | No. 12 | pit tomb | Brown | 121 | 0.10–0.15 | 0.20–0.36 | 0.09–0.32 | opaque, black impurities, small number of air bells |
| S18-G-Light blue | glass bead | No. 18 | pit tomb | Light blue | 2 | 0.10–0.15 | 0.35–0.42 | 0.22–0.34 | translucent, many air bells, black impurities, surface weathering |
| S18-G-Brown | Brown | 12 | 0.10–0.15 | 0.23–0.29 | 0.08–0.26 | opaque, many air bells, elongated black impurities | |||
| S18-G-Green | Green | 74 | 0.10–0.15 | 0.29–0.43 | 0.19–0.32 | opaque, elongated black impurities |
Table 2.
Mean concentrations of compounds (wt.%) obtained by the SEM-EDS analysis for representative glass samples.
Table 2.
Mean concentrations of compounds (wt.%) obtained by the SEM-EDS analysis for representative glass samples.
| Compounds | S8-G-Blue | S11-G-Brown | S11-G-Green | S11-G-Blue-green | S12-G-Brown | S18-G-Lightgreen | S18-G-Brown | S18-G-Green |
|---|---|---|---|---|---|---|---|---|
| SiO2 | 68.61 | 70.59 | 60.37 | 78.63 | 66.73 | 63.49 | 63.91 | 68.89 |
| Al2O3 | 2.40 | 4.28 | 8.70 | 1.24 | 8.32 | 11.54 | 10.49 | 6.81 |
| Fe2O3 | 1.24 | 1.35 | 1.09 | 0.63 | 2.06 | 0.74 | 1.82 | 2.35 |
| CaO | 6.29 | 1.78 | 2.74 | 1.62 | 1.91 | 1.53 | 2.90 | 1.54 |
| MgO | 0.71 | 0.80 | 0.09 | 0.63 | 0.82 | 0.05 | 0.39 | 0.13 |
| Na2O | 19.13 | 15.22 | 19.31 | 0.00 | 14.79 | 17.49 | 12.95 | 12.94 |
| K2O | 0.32 | 1.26 | 1.73 | 14.06 | 1.79 | 3.05 | 1.14 | 1.90 |
| CuO | 0.00 | 3.11 | 0.95 | 2.09 | 1.93 | 0.54 | 2.05 | 0.85 |
| MnO | 0.00 | 0.00 | 0.00 | 1.12 | 0.00 | 0.00 | 0.00 | 0.00 |
| PbO | 0.00 | 0.00 | 4.18 | 0.00 | 0.00 | 0.00 | 2.80 | 2.43 |
| TiO2 | 0.00 | 0.65 | 0.39 | 0.00 | 0.86 | 0.55 | 0.90 | 1.73 |
| SO3 | 0.13 | 0.34 | 0.00 | 0.00 | 0.00 | 0.00 | 0.00 | 0.00 |
| Total | 98.83 | 99.38 | 99.55 | 100.02 | 99.21 | 98.98 | 99.35 | 99.57 |
Table 3.
Chemical compositions (wt.%) of glass bead samples. The numbers are the same as those used in Figure 5.
Table 3.
Chemical compositions (wt.%) of glass bead samples. The numbers are the same as those used in Figure 5.
| No. | SiO2 | Al2O3 | Fe2O3 | CaO | MgO | Na2O | K2O | CuO | MnO | PbO | SnO2 | TiO2 | SO3 | Total |
|---|---|---|---|---|---|---|---|---|---|---|---|---|---|---|
| a1 | 68.98 | 19.42 | 4.94 | 1.44 | 1.40 | 0.47 | 2.30 | 0.00 | 0.00 | 0.00 | 0.00 | 0.82 | 0.00 | 99.77 |
| a2 | 68.38 | 2.41 | 1.37 | 6.48 | 0.79 | 19.05 | 0.34 | 0.00 | 0.00 | 0.00 | 0.00 | 0.00 | 0.00 | 98.82 |
| a3 | 69.00 | 2.25 | 1.22 | 6.52 | 0.64 | 18.94 | 0.34 | 0.00 | 0.00 | 0.00 | 0.00 | 0.00 | 0.00 | 98.91 |
| a4 | 84.61 | 3.07 | 1.53 | 7.39 | 0.80 | 1.16 | 0.00 | 0.00 | 0.00 | 0.00 | 0.00 | 0.00 | 0.00 | 98.56 |
| a5 | 84.18 | 3.04 | 1.34 | 7.76 | 0.89 | 1.04 | 0.32 | 0.00 | 0.00 | 0.00 | 0.00 | 0.00 | 0.00 | 98.57 |
| b1 | 73.97 | 4.50 | 1.49 | 1.76 | 0.80 | 11.82 | 1.21 | 2.72 | 0.00 | 0.00 | 0.00 | 0.70 | 0.38 | 99.35 |
| b2 | 72.90 | 4.20 | 0.96 | 2.03 | 0.58 | 11.96 | 1.16 | 4.77 | 0.00 | 0.00 | 0.00 | 0.75 | 0.00 | 99.31 |
| b3 | 73.27 | 4.57 | 1.06 | 1.66 | 0.97 | 12.32 | 1.19 | 3.91 | 0.00 | 0.00 | 0.00 | 0.44 | 0.00 | 99.39 |
| b4 | 73.47 | 4.46 | 1.49 | 1.82 | 0.63 | 11.94 | 1.41 | 3.33 | 0.00 | 0.00 | 0.00 | 0.36 | 0.40 | 99.31 |
| c1 | 35.13 | 7.44 | 2.69 | 0.00 | 0.00 | 15.24 | 0.00 | 0.00 | 0.00 | 7.55 | 31.34 | 0.00 | 0.00 | 99.39 |
| c2 | 41.20 | 7.78 | 0.89 | 0.00 | 0.46 | 12.45 | 0.00 | 0.00 | 0.00 | 30.07 | 6.64 | 0.00 | 0.00 | 99.49 |
| c3 | 34.89 | 4.96 | 0.00 | 0.00 | 0.00 | 13.01 | 0.00 | 0.00 | 0.00 | 37.50 | 9.64 | 0.00 | 0.00 | 100.00 |
| d1 | 76.20 | 1.12 | 0.40 | 1.31 | 0.51 | 0.00 | 17.75 | 1.80 | 0.91 | 0.00 | 0.00 | 0.00 | 0.00 | 100.00 |
| d2 | 75.72 | 1.23 | 0.60 | 1.50 | 0.39 | 0.00 | 17.61 | 1.90 | 1.05 | 0.00 | 0.00 | 0.00 | 0.00 | 100.00 |
| d3 | 84.86 | 1.35 | 1.18 | 1.81 | 0.66 | 0.00 | 6.58 | 2.37 | 1.20 | 0.00 | 0.00 | 0.00 | 0.00 | 100.01 |
| d4 | 89.01 | 3.77 | 1.12 | 1.39 | 0.66 | 0.00 | 0.40 | 2.36 | 0.93 | 0.00 | 0.00 | 0.00 | 0.00 | 99.64 |
| e1 | 2.05 | 0.00 | 97.69 | 0.26 | 0.00 | 0.00 | 0.00 | 0.00 | 0.00 | 0.00 | 0.00 | 0.00 | 0.00 | 100.00 |
| e2 | 43.31 | 5.82 | 0.83 | 0.92 | 0.93 | 0.00 | 0.92 | 44.16 | 0.00 | 0.00 | 0.00 | 0.23 | 2.41 | 99.53 |
| f1 | 48.20 | 8.59 | 0.78 | 1.25 | 0.00 | 15.19 | 11.20 | 0.00 | 0.00 | 0.00 | 0.00 | 0.42 | 13.46 | 99.09 |
| f2 | 53.47 | 9.39 | 0.62 | 1.75 | 0.00 | 16.27 | 7.80 | 0.71 | 0.00 | 0.00 | 0.00 | 0.36 | 8.35 | 98.72 |
| f3 | 53.91 | 8.89 | 0.64 | 1.73 | 0.00 | 22.72 | 4.15 | 0.00 | 0.00 | 0.00 | 0.00 | 0.00 | 0.00 | 92.04 |
| f4 | 57.08 | 9.74 | 0.55 | 1.68 | 0.00 | 21.92 | 2.69 | 0.00 | 0.00 | 0.00 | 0.00 | 0.00 | 0.00 | 93.66 |
| g1 | 8.38 | 1.69 | 0.00 | 0.00 | 0.00 | 0.00 | 0.00 | 89.94 | 0.00 | 0.00 | 0.00 | 0.00 | 0.00 | 100.01 |
| g2 | 1.94 | 0.00 | 0.00 | 0.00 | 0.00 | 0.00 | 0.00 | 98.06 | 0.00 | 0.00 | 0.00 | 0.00 | 0.00 | 100.00 |
| g3 | 44.22 | 8.17 | 1.41 | 1.19 | 0.00 | 0.00 | 0.46 | 43.85 | 0.00 | 0.00 | 0.00 | 0.71 | 0.00 | 100.01 |
| h1 | 17.73 | 2.17 | 1.01 | 0.00 | 0.00 | 3.42 | 0.00 | 0.00 | 0.00 | 63.44 | 12.23 | 0.00 | 0.00 | 100.00 |
| h2 | 6.95 | 1.04 | 1.03 | 0.00 | 0.00 | 0.00 | 0.00 | 0.00 | 0.00 | 75.79 | 15.18 | 0.00 | 0.00 | 99.99 |
| h3 | 70.62 | 7.49 | 2.19 | 1.74 | 0.49 | 13.11 | 1.92 | 0.00 | 0.00 | 0.00 | 0.00 | 1.91 | 0.00 | 99.47 |
| h4 | 67.21 | 7.09 | 2.44 | 1.47 | 0.00 | 12.86 | 1.80 | 0.97 | 0.00 | 4.18 | 0.00 | 1.61 | 0.00 | 99.63 |
Publisher’s Note: MDPI stays neutral with regard to jurisdictional claims in published maps and institutional affiliations. |
© 2021 by the authors. Licensee MDPI, Basel, Switzerland. This article is an open access article distributed under the terms and conditions of the Creative Commons Attribution (CC BY) license (https://creativecommons.org/licenses/by/4.0/).
Share and Cite
MDPI and ACS Style
Yi, J.; Yang, H.R.; Lee, C.H. Compositional Variation and Color Diversity of Glass Beads from the 4th Century Tomb Complex in Korea. Appl. Sci. 2021, 11, 5233. https://doi.org/10.3390/app11115233
AMA Style
Yi J, Yang HR, Lee CH. Compositional Variation and Color Diversity of Glass Beads from the 4th Century Tomb Complex in Korea. Applied Sciences. 2021; 11(11):5233. https://doi.org/10.3390/app11115233
Chicago/Turabian StyleYi, Jeongeun, Hye Ri Yang, and Chan Hee Lee. 2021. "Compositional Variation and Color Diversity of Glass Beads from the 4th Century Tomb Complex in Korea" Applied Sciences 11, no. 11: 5233. https://doi.org/10.3390/app11115233
Note that from the first issue of 2016, this journal uses article numbers instead of page numbers. See further details here.