Article

Dye Removal from Colored Textile Wastewater Using Seeds and Biochar of Barley (Hordeum vulgare L.)

by
Fouad El Mansouri
1,*,
Hammadi El Farissi
1,
Mohamed Hassani Zerrouk
2,
Francesco Cacciola
3,*,
Chaimae Bakkali
1,
Jamal Brigui
1,
Miguel Palma Lovillo
4 and
Joaquim C. G. Esteves da Silva
5
1
Laboratory of Chemical Engineering and Valorization of Resources, Department of Chemistry, Faculty of Sciences and Technology, Abdelmalek Essaâdi University, Tangier 90000, Morocco
2
Environmental Technologies, Biotechnology and Valuation of Bio-resources (TEBVB), Al-Hoceima Faculty of Science and Technology (FSTH), Abdelmalek Essaadi University, Tetouan 93000, Morocco
3
Department of Biomedical, Dental, Morphological and Functional Imaging Sciences, University of Messina, 98125 Messina, Italy
4
Department of Analytical Chemistry, Faculty of Sciences, Instituto de Investigación Vitivinícola y Agroalimentaria (IVAGRO), University of Cadiz, Campus del Rio San Pedro, 11510 Puerto Real, Spain
5
Chemistry Research Unit (CIQUP), DGAOT, Faculty of Sciences of University of Porto, R. Campo Alegre 697, 4169-007 Porto, Portugal
*
Authors to whom correspondence should be addressed.
Appl. Sci. 2021, 11(11), 5125; https://doi.org/10.3390/app11115125
Submission received: 26 April 2021 / Revised: 25 May 2021 / Accepted: 26 May 2021 / Published: 31 May 2021
(This article belongs to the Section Food Science and Technology)

Abstract

:
Phenol red (X-PR) and malachite green carbinol (MGC) are two textile finishing dyes, which are present in aquatic environments through industrial effluents. Due to the toxic nature of both dyes, they are harmful to human health. In the present study, two materials, barley seeds and the biochar of barley (Hordeum vulgare L.), were used to remove the dyes in an aqueous solution. The materials used are characterized by AFM, FTIR, SEM, XRD and EDX techniques. In this study, the parameters studied are the adsorbent dose, pH, initial adsorbate concentration and contact time. The maximum equilibrium time was found to be 90 min for all dyes. Kinetic studies revealed that the adsorption of X-PR and MGC on barley seeds (BS-HVL) and the biochar of barley (BC-HVL) followed pseudo-second-order kinetics and that both porous and intraparticle diffusion mechanisms were involved. The adsorption equilibrium data were well fitted to the Langmuir and Freundlich isotherm model for both materials, and the maximum adsorption capacity of monolayer and multilayers for X-PR and MGC were 71.642 mg g−1 and 50 mg g−1 on BS-HVL, and 44.843 mg g−1 and 121.95 mg g−1 on BC-HVL, respectively. The thermodynamic results reveal that the dye removal on barley was endothermic and spontaneous in nature.

1. Introduction

Morocco is one of the countries that places importance on agriculture and the planting of different varieties of barley and wheat. Barley (Hordeum vulgare L.) is the second most cultivated cereal in Morocco after soft wheat. It occupies an average of 1.9 million hectares per year, or 38% of the utilized agricultural area of cereals and 21.8% of the country’s total area. In total 67% of these areas are located in arid and semiarid zones, 8% in mountainous areas, and 24% in areas with low-input soils.
Antioxidant compounds are currently the subject of numerous studies because in addition to their interest in treating a multitude of pathologies, they are also used in the preservation of edible foods for the food industry [1]. The extraction of antioxidants and polyphenols from barley seeds by industry generates nonexploitable wastes; therefore, barley seed extract and its biochar have rarely been proposed for adsorption applications. The aim of this work is to valorize these two materials in order to eliminate two dyes: malachite green and x-phenol red.
Natural substances called bioadsorbents (bioproducts) are applicable for water treatment due to the many advantages and interesting properties of these resources. They are abundant, renewable, biodegradable and inexpensive. From a chemical point of view, they contain macromolecular chains with numerous highly reactive chemical functions. Currently, there is an interest in preparing materials based on polysaccharides, and bioadsorption on these bioadsorbents appears to be a promising method [2,3]. During the last two decades, bioadsorption has proven to be an efficient waste treatment technology [4,5]. Scientists have successfully removed heavy metals and dyes from wastewater using biosorption [6,7]. Recently, there is interest in producing materials based on natural substances such as agricultural waste; in this sense, the bioadsorbents appear to be a very promising method for the adsorption of several dyes [8,9,10,11,12,13]. Similar research shows that activated carbon derived from the barley (Hordeum vulgare L.) husk can be used as an efficient and cost-effective adsorbent for the treatment of phenol-red-contaminated water. Due to their mutagenic and carcinogenic effects, effluents from the dye, paper and textile industries, contaminated with nondegradable organic dyes, not only pose a serious risk to human health but also adversely affect aquatic life. X-phenol red, a finishing textile dye and a pH indicator, is also used in most tissue culture media. The pH-dependent cytotoxicity of contaminants of phenol red for breast cancer cells has previously been reported by Grady et al. [14]. Malachite green is persistently present in the environment and acutely toxic to a wide range of aquatic and terrestrial animals. Several studies have shown that this dye is highly toxic to freshwater fish, both in acute and chronic exposure. Carcinogenesis, mutagenesis, chromosomal fractures, teratogenicity and reduced fertility have also been reported in rainbow trout following treatment with malachite green [15,16,17,18,19,20]. Biomaterials such as barley, due to its microporous structure, high specific surface area and reactivity, play an important role in the adsorption process to remove toxic organic and inorganic chemicals from contaminated water [13].
The aim of this research is to report the synthesis and characterization of barley (Hordeum vulgare L.) seeds and their biochar. The as-synthesized materials have been used as adsorbents for the removal of x-phenol red and malachite green carbinol dyes in an aqueous solution. The effects of various experimental parameters on adsorption of the dyes have been investigated.

2. Materials and Methods

2.1. Materials

The barley used in this study was collected from the northern region of Morocco. It is a biomaterial that is rich in carbon and oxygen as well as minerals. These materials are starch-enriched and deproteinized barley seeds, which we note hereafter by BS-HVL and BC-HVL. The biochar is a carbon-rich product (BC-HVL) which is heated at 600 °C in a closed container with little or no available air. The dyes used in this study are x-phenol red (C19H14O5S) (MW 354.37 g mol−1, Sigma-Aldrich, St-Louis, MO, USA) and malachite green carbinol (C23H25ClN2) (MW 364.9 g mol−1, Sigma-Aldrich, St-Louis, MO, USA). The concentration of unabsorbed dyes was determined at 435 nm and 635 nm, respectively, using a UV/visible spectrophotometer. The chemical structures of x-phenol red and malachite green carbinol dyes are given in Figure 1.

2.2. Characterization of BS-HVL and BC-HVL

The seeds and biochar of barley (Hordeum vulgare L.) were characterized by different analytical techniques: X-ray diffraction analysis (Bruker Corporation, MA, USA), scanning electron microscopy (SEM) analysis (Hitachi High Technologies, Tokyo, Japon), Fourier transform infrared spectroscopy (FTIR) analysis (Bruker Corporation, MA, USA) and atomic force microscopy (AFM) analysis was carried out using a Veeco (Plainview, NY, USA) (Figure 2, Figure 3, Figure 4, Figure 5, Figure 6, Figure 7, Figure 8, Figure 9 and Figure 10).

2.3. Adsorption Process

2.3.1. Adsorption Kinetics

The study of adsorption kinetics was carried out on barley seeds and biochar, operating under optimal conditions (pH 7 ± 0.3; adsorbent dose (0.01–0.02 mm) = 50 mg; dye concentration C0 = 50 mg L−1 stirring speed 150 rpm), the experiment matrix being adapted from other works [21]. In appropriate beakers, 50 mg of the adsorbent were mixed with 50 mL of the X-PR and MGC solution (C0 = 50 mg L−1). The suspension was stirred for 150 rpm at room temperature (21 °C). At previously defined time intervals (in the range of 0 to 120 min), the two adsorbents were separated from the liquid by centrifugation. The concentrations of the X-PR and MGC in the liquid phase were then determined by measuring the absorbance at 432 nm for X-PR and 617 nm for MGC following the reading on a calibration curve established from a range of X-PR and MGC concentrations from 0 to 50 mg·L−1. The amount of X-PR and MGC (qt) adsorbed by the two materials, as a function of time, was calculated according to the following formula:
q e = ( C 0 C e ) V m                
R % = ( C 0 C e ) C 0 100                      
where C0 is the concentration of the dye in (mg L−1) in the liquid phase, V is the volume (L) of the dye solution and m is the mass of the adsorbent (g).
The four models tested are: the pseudo-first-order model developed by Lagergren in 1898 [22], which proposed a pseudo-first-order equation, Equation (3), in order to clarify the adsorption of the liquid/solid system. The second-order model is then given by the linear expression Equation (4) [23]. Then, the Elovich model can be expressed by the linear formula Equation (5) [24], and finally the intraparticle diffusion model is given by Equation (6) [25]:
log ( q e q t ) = log ( q e ) K s 1 2.303 t                                
t q t = t q e + 1 K 2 q e 2                    
q e = 1 β   l n ( t ) + 1 β   l n   ( α β )                  
q e = K i   t + C                      
where:
  • qe is the amount adsorbed at equilibrium (mg g−1),
  • qt is the quantity adsorbed at time t (mg g−1),
  • KS1 is the rate constant of first order sorption (min−1),
  • Ki is the intraparticle diffusion rate constant,
  • The value of the ordinate at the origin C provides an indication of the thickness of the boundary layer,
  • K2 (g mg−1.min−1) is the adsorption rate,
  • α is the initial adsorption capacity (mg g−1 min),
  • β is the desorption constant (g mg−1),
  • t is the time (min).

2.3.2. Adsorption Isotherm

To obtain the adsorption isotherm, a series of beakers was used. Each beaker was filled with 50 mL of X-PR or MGC solution of varying concentrations: 0, 10, 20, 30, 40, 50, 60, 70, 80, 90 and 100 mg L−1. The study of the adsorption equilibrium was carried out under the same optimal conditions indicated above. After equilibrium, the particles of the adsorbent were separated by centrifugation, and the clarified solution was analyzed by determination of the equilibrium concentration (Ce) of X-PR and MGC using the same calibration curve as previously used. The amount of reagent adsorbed at equilibrium (qe, in mg g−1) was calculated by Equation (1). To determine the adsorption isotherm, four adsorption modules were tested: the Langmuir model, Freundlich model, Temkin model and Dubinin–Radushkevich model. The most applicable model in the adsorption of X-PR by BS-HVL are the models of Langmuir and Freundlich. On the other hand, the Freundlich model is the most applicable in the elimination of MGC by BC-HVL. The adsorption of the Langmuir isotherm represented was attained from the following equation:
q e = q m   K L C e 1 + K L C e                        
This equation can be reshaped and rearranged into the following linear equation [26]:
C e q e = C e q m + 1 q m K L                
where qe is the amount (mg g−1) of X-PR and MGC adsorbed at equilibrium, Ce is the equilibrium concentration (mg L−1), qm is the monolayer adsorption capacity (mg g−1) and KL is the Langmuir constant (L mg−1) related to the adsorption free energy.
An essential characteristic of the Langmuir isotherm can be expressed in terms of a dimension less constant called the separation factor and defined by the equation below [27,28]:
R L = 1 1 + K L C 0            
where:
  • C0 is the initial concentration of the adsorbate (mg L−1),
  • KL is the Langmuir constant (L mg−1),
  • RL > 1 indicates that the adsorption is unfavorable,
  • RL = 1 indicates that the adsorption is linear,
  • 0 < RL < 1 indicates that the adsorption is favorable,
  • RL = 0 indicates that the adsorption is irreversible.
In our case, the found values of RL are all between 0 and 1, which reveals favorable adsorption.
The linear form of Freundlich can be explained by the following equation:
ln ( q e ) = ln ( K f + 1 n )
The Slope of this line is 1/n which indicates adsorption intensity.

3. Results and Discussion

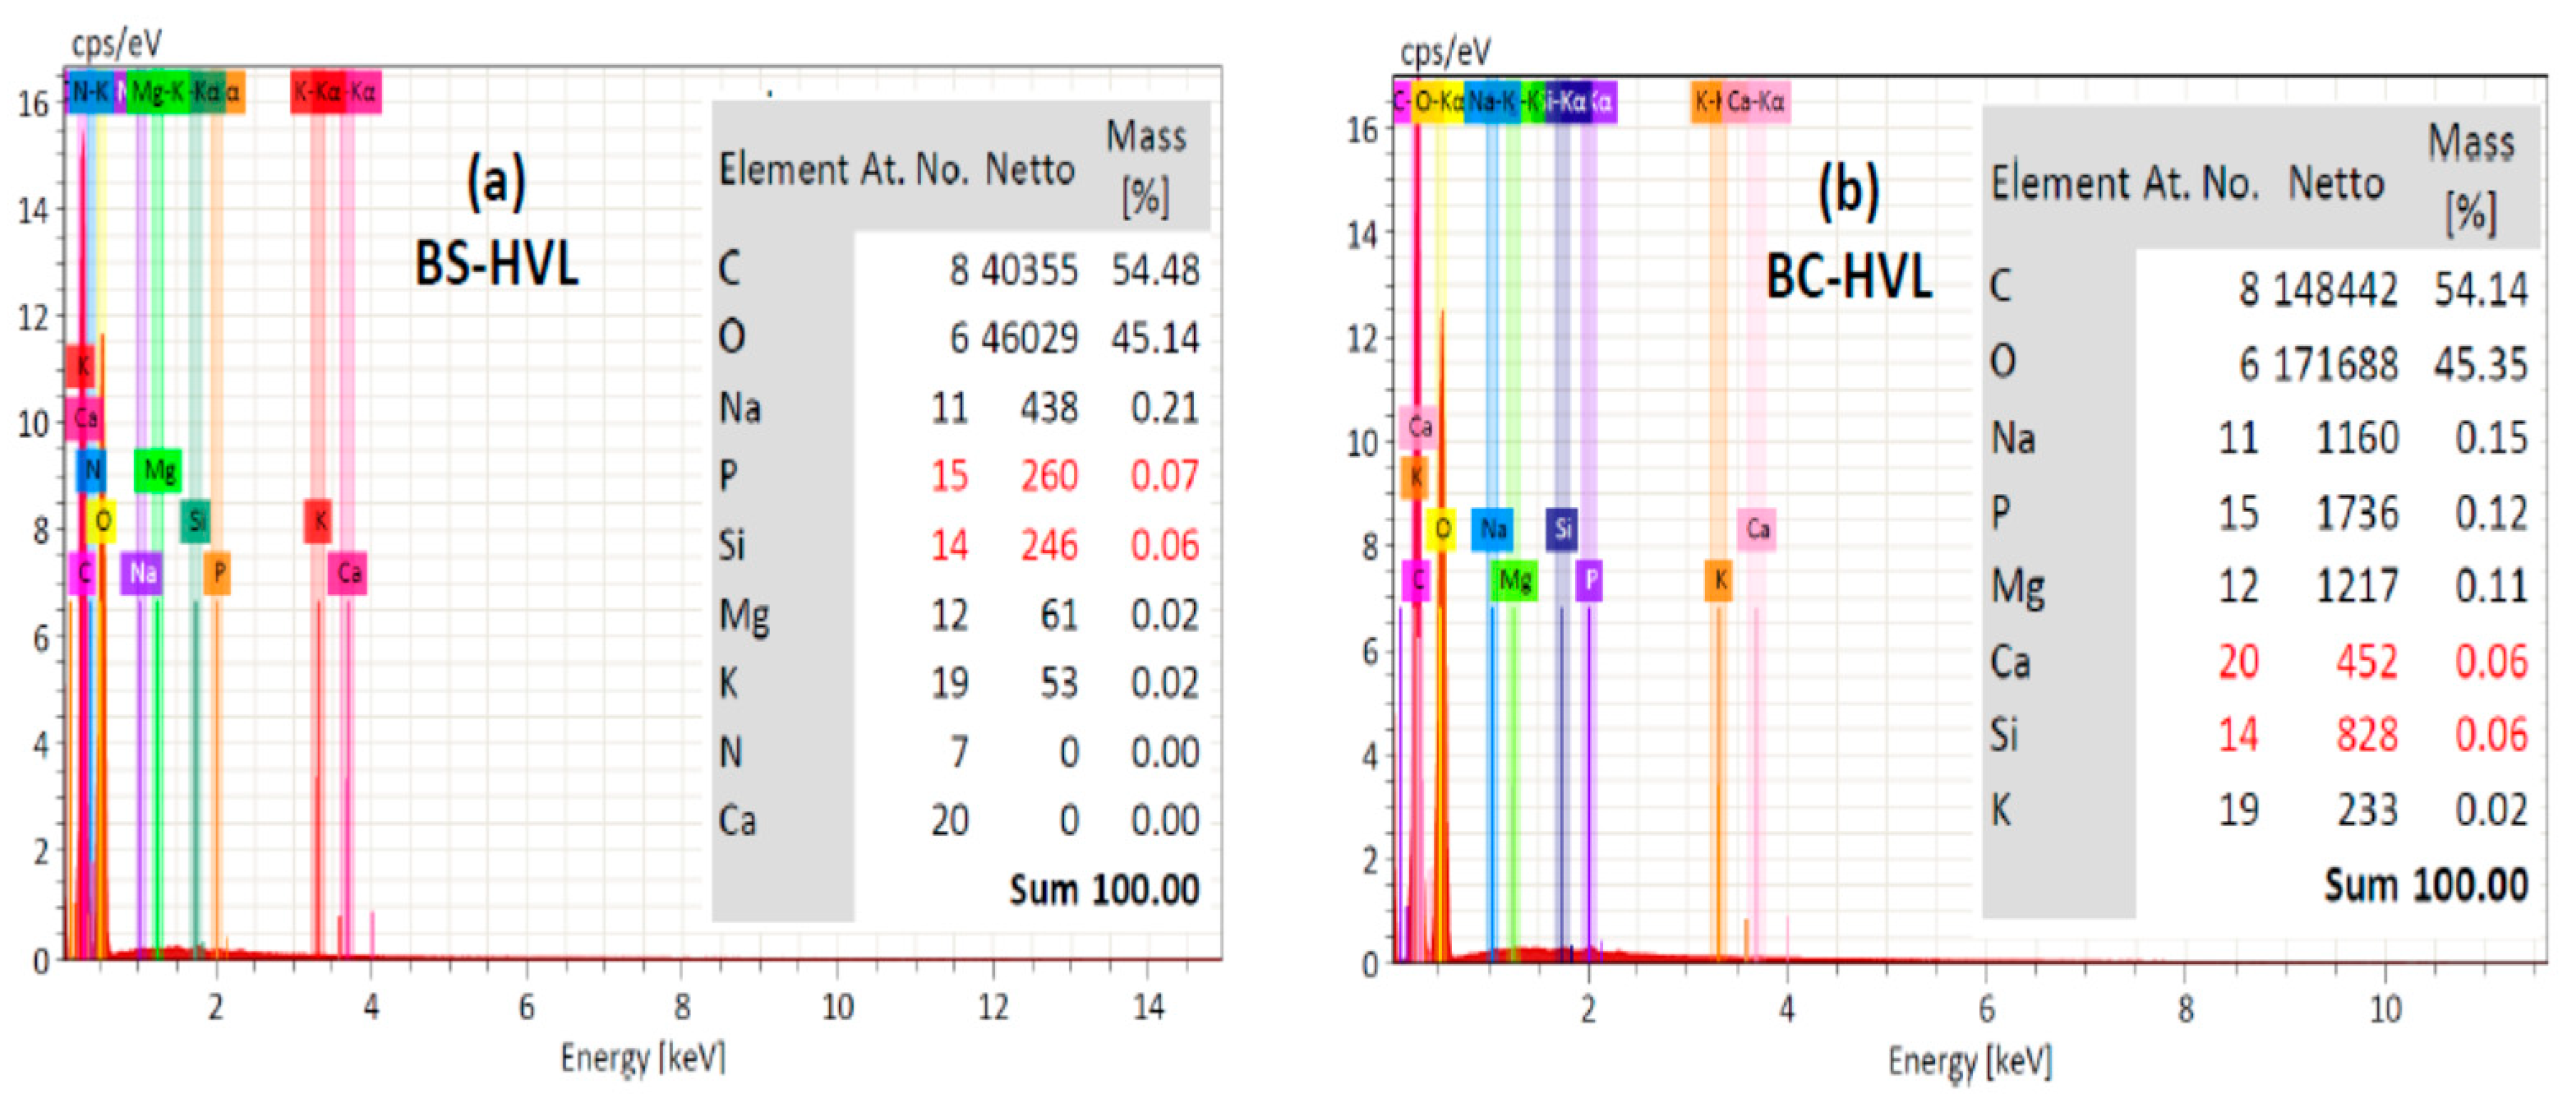
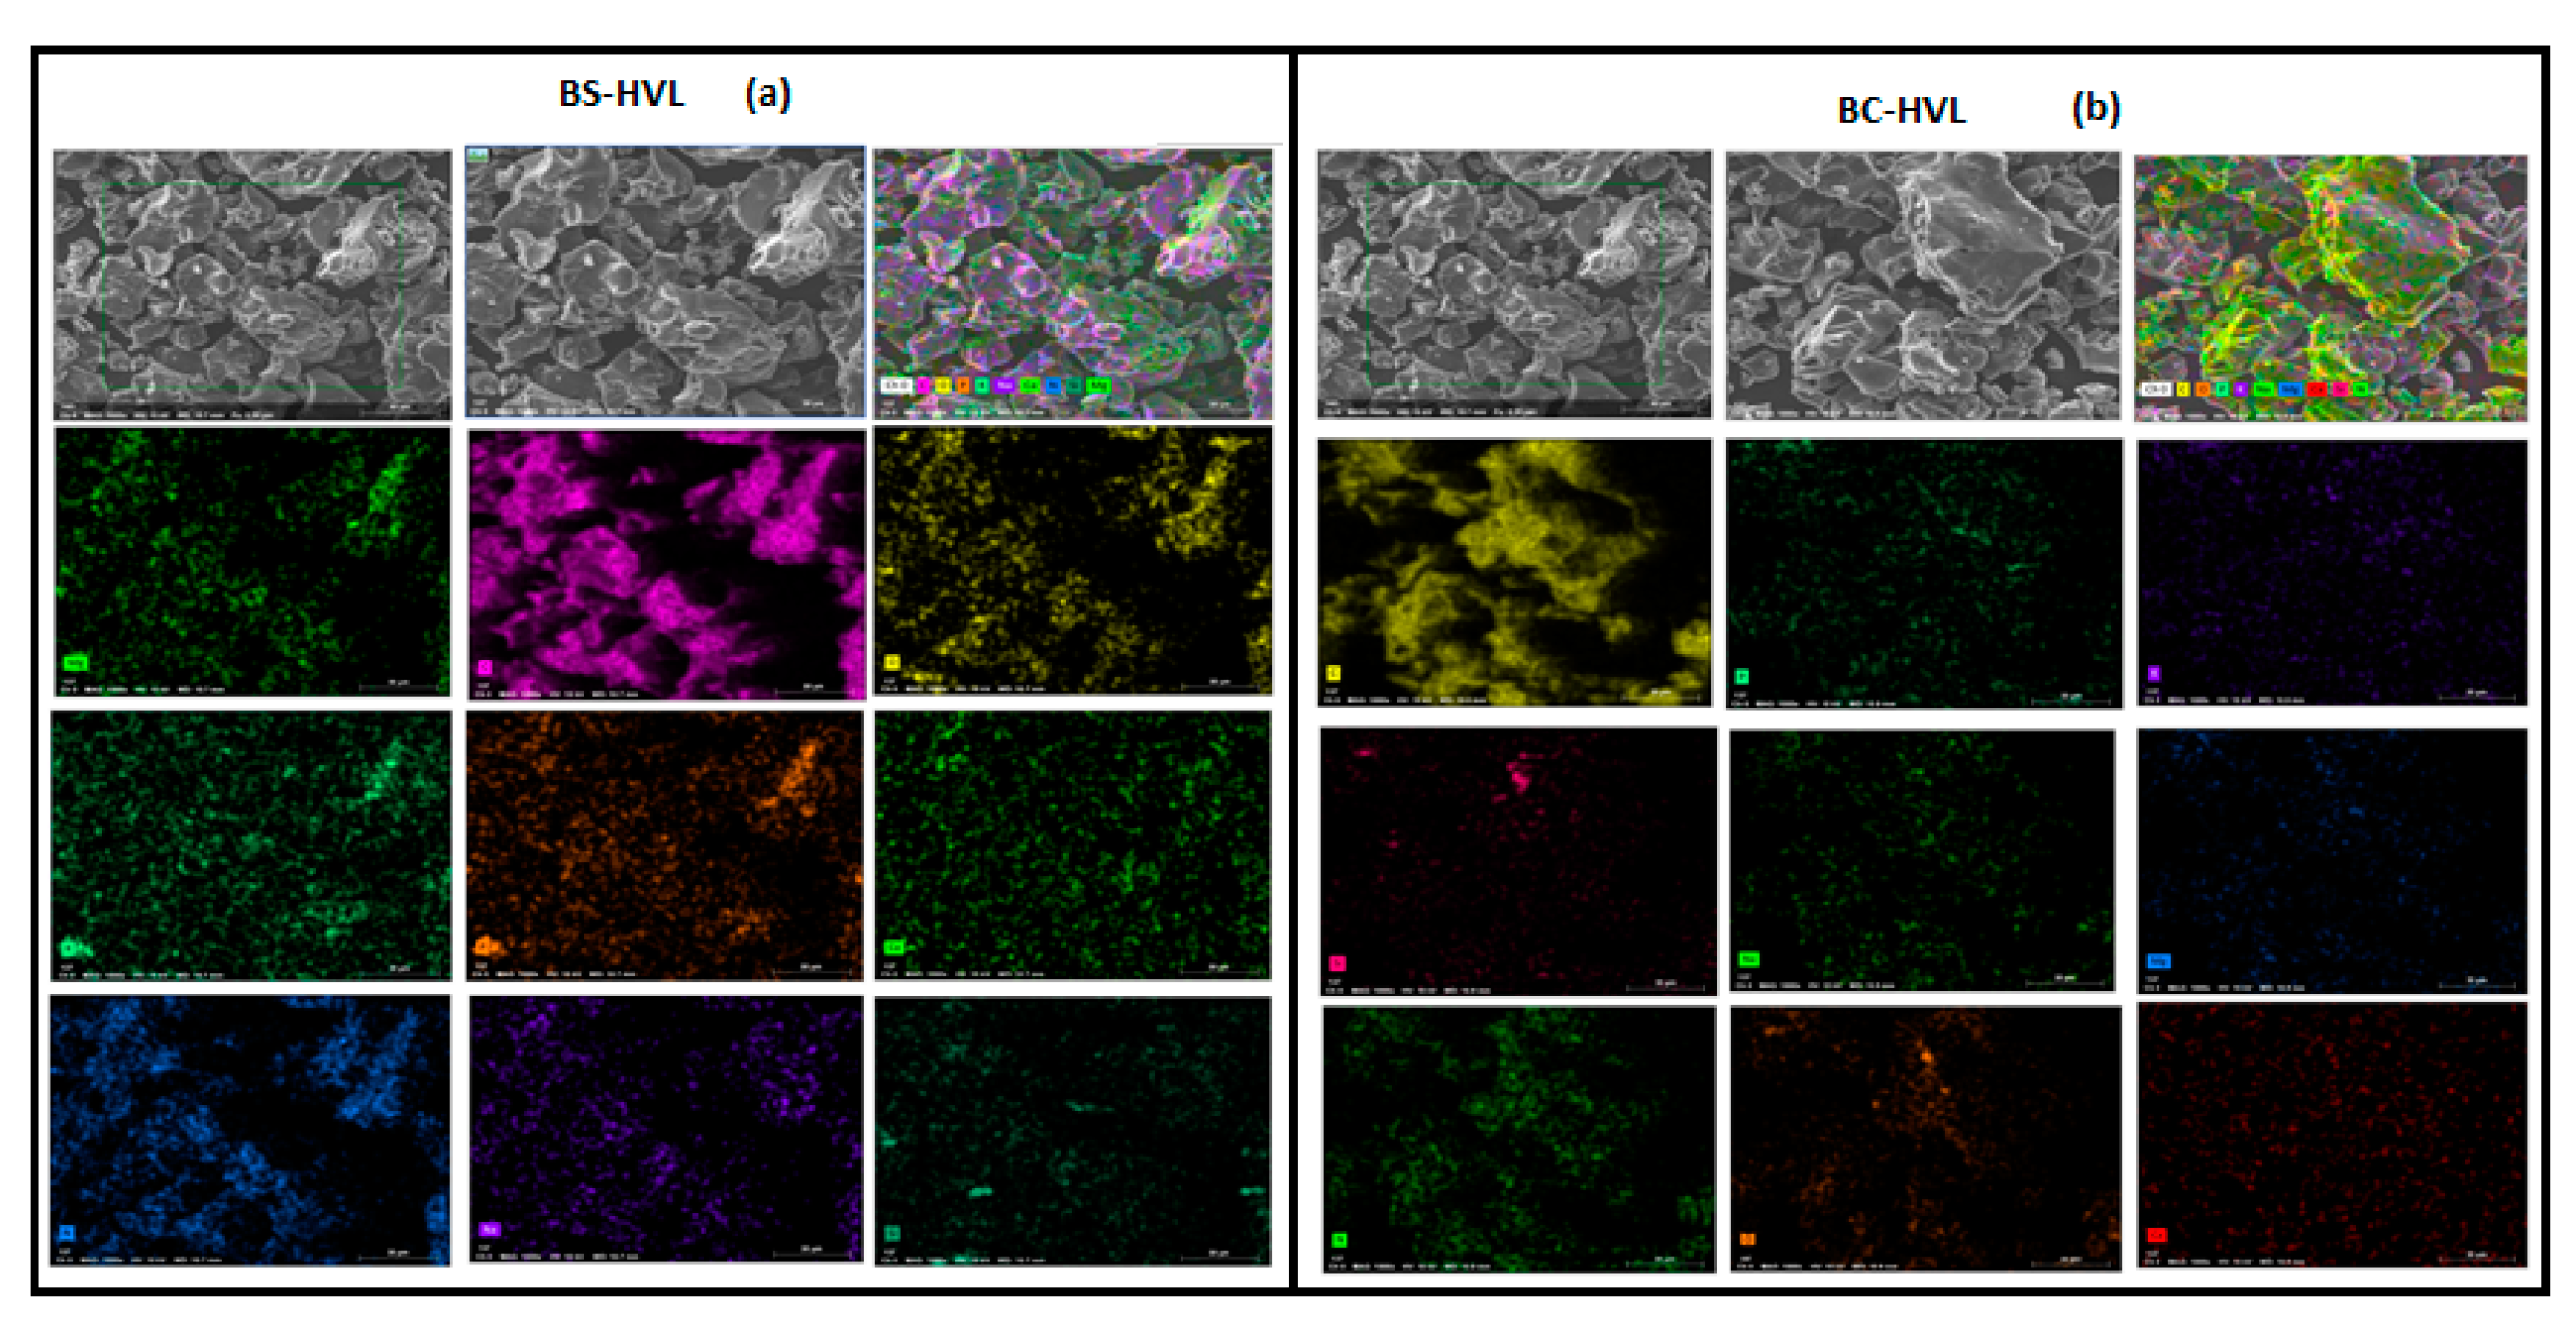
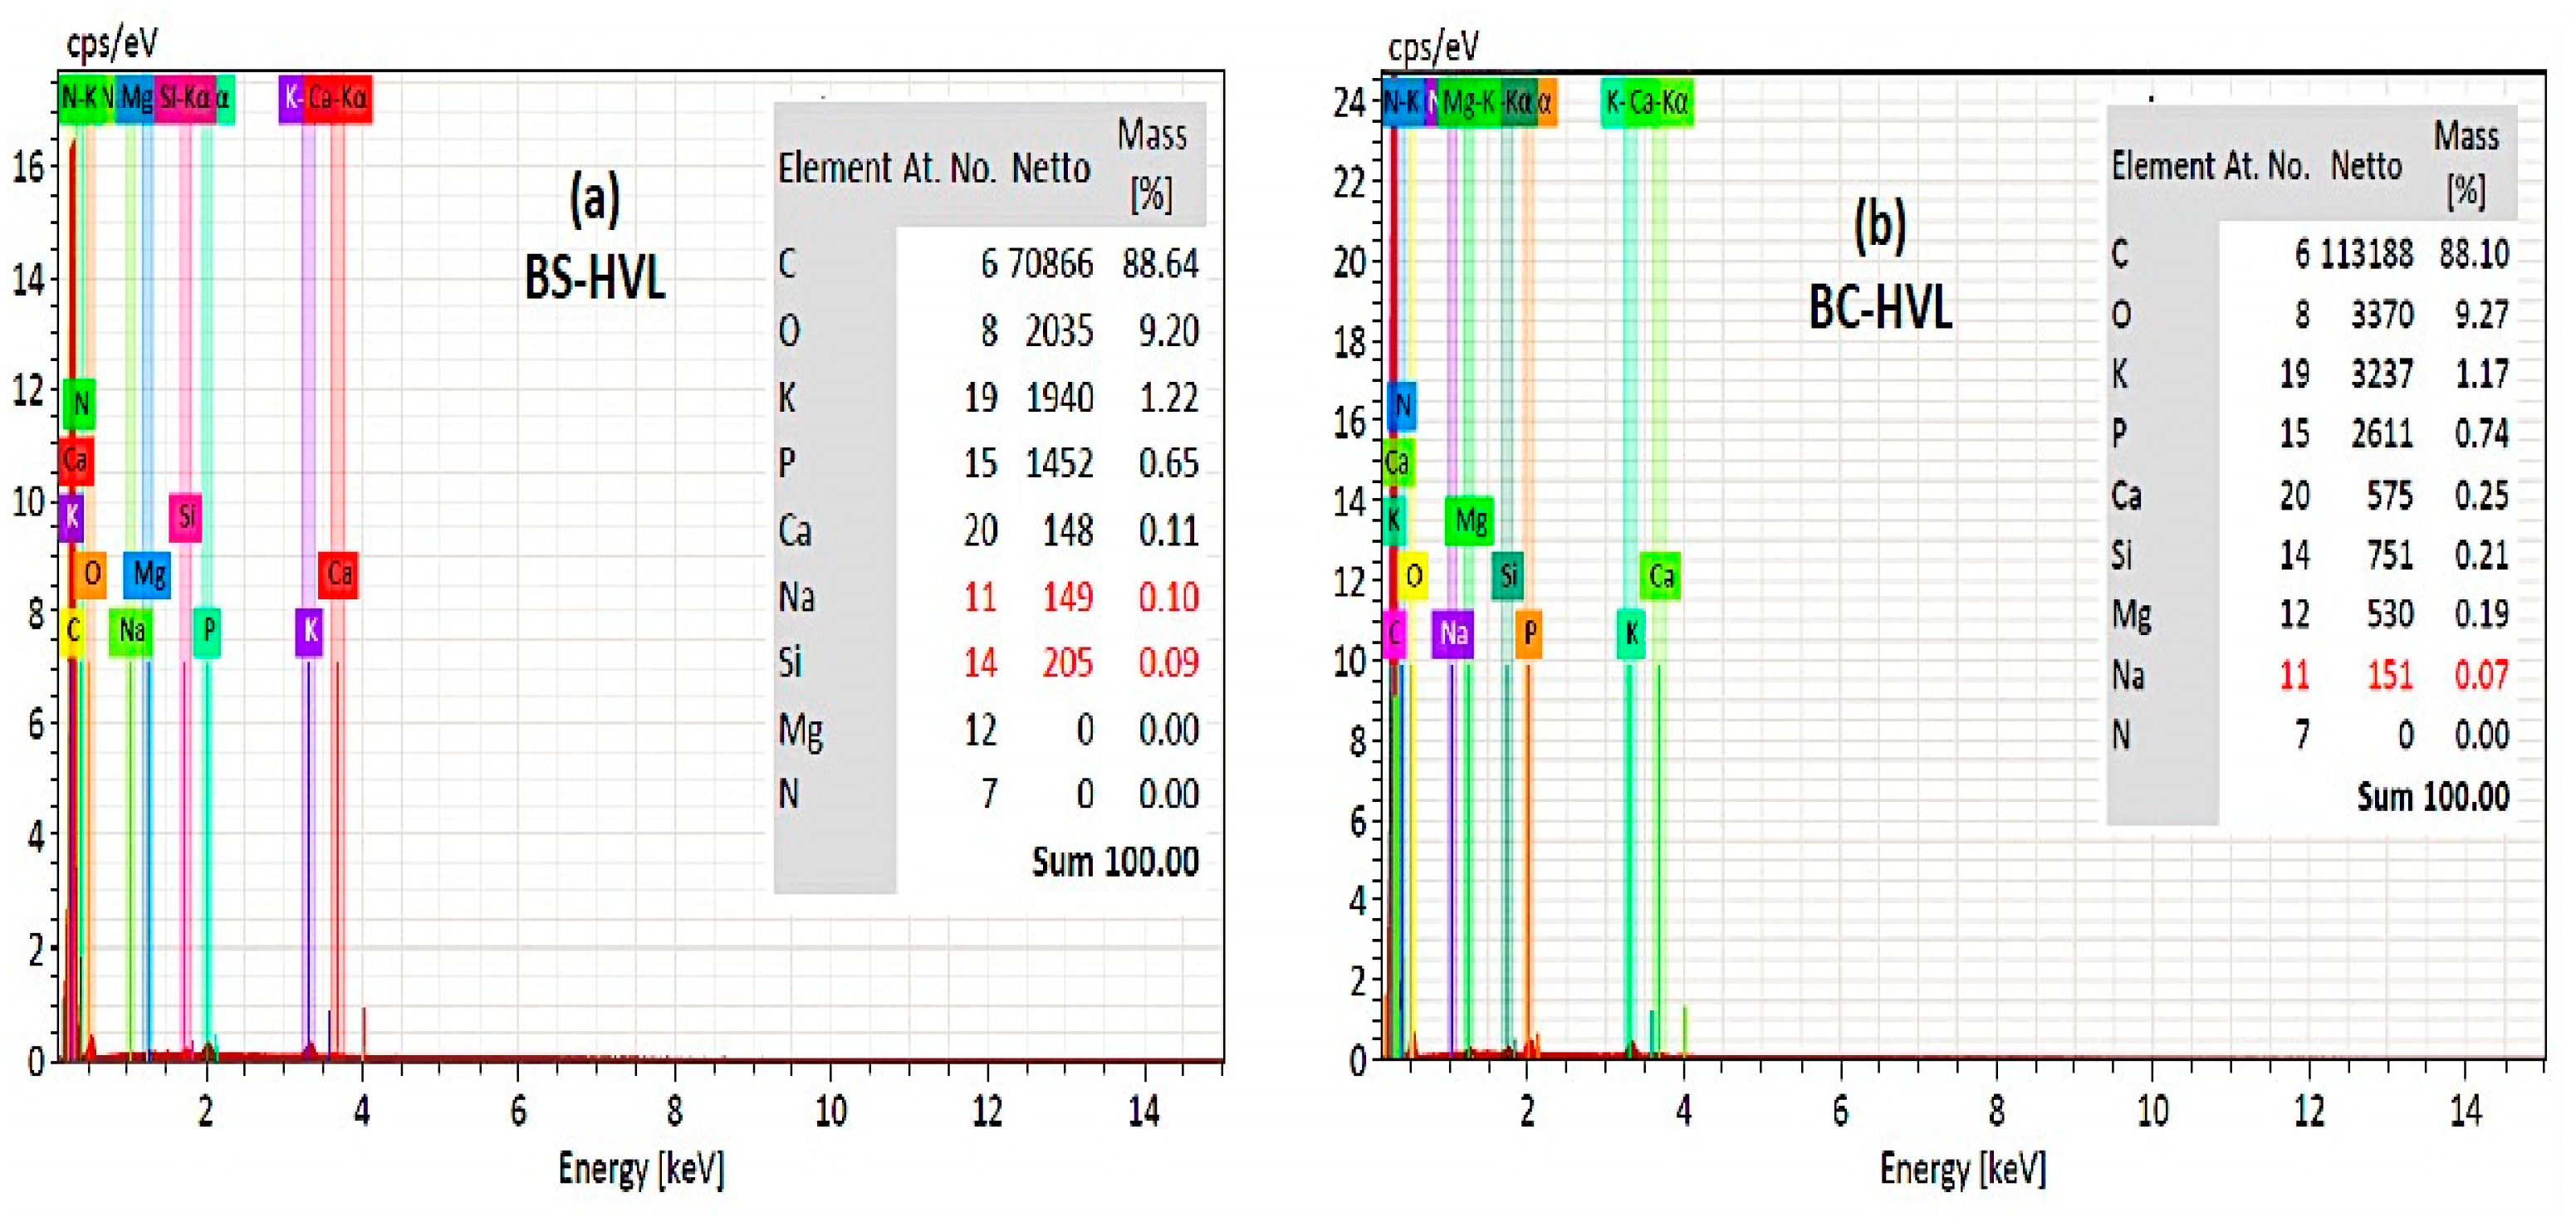
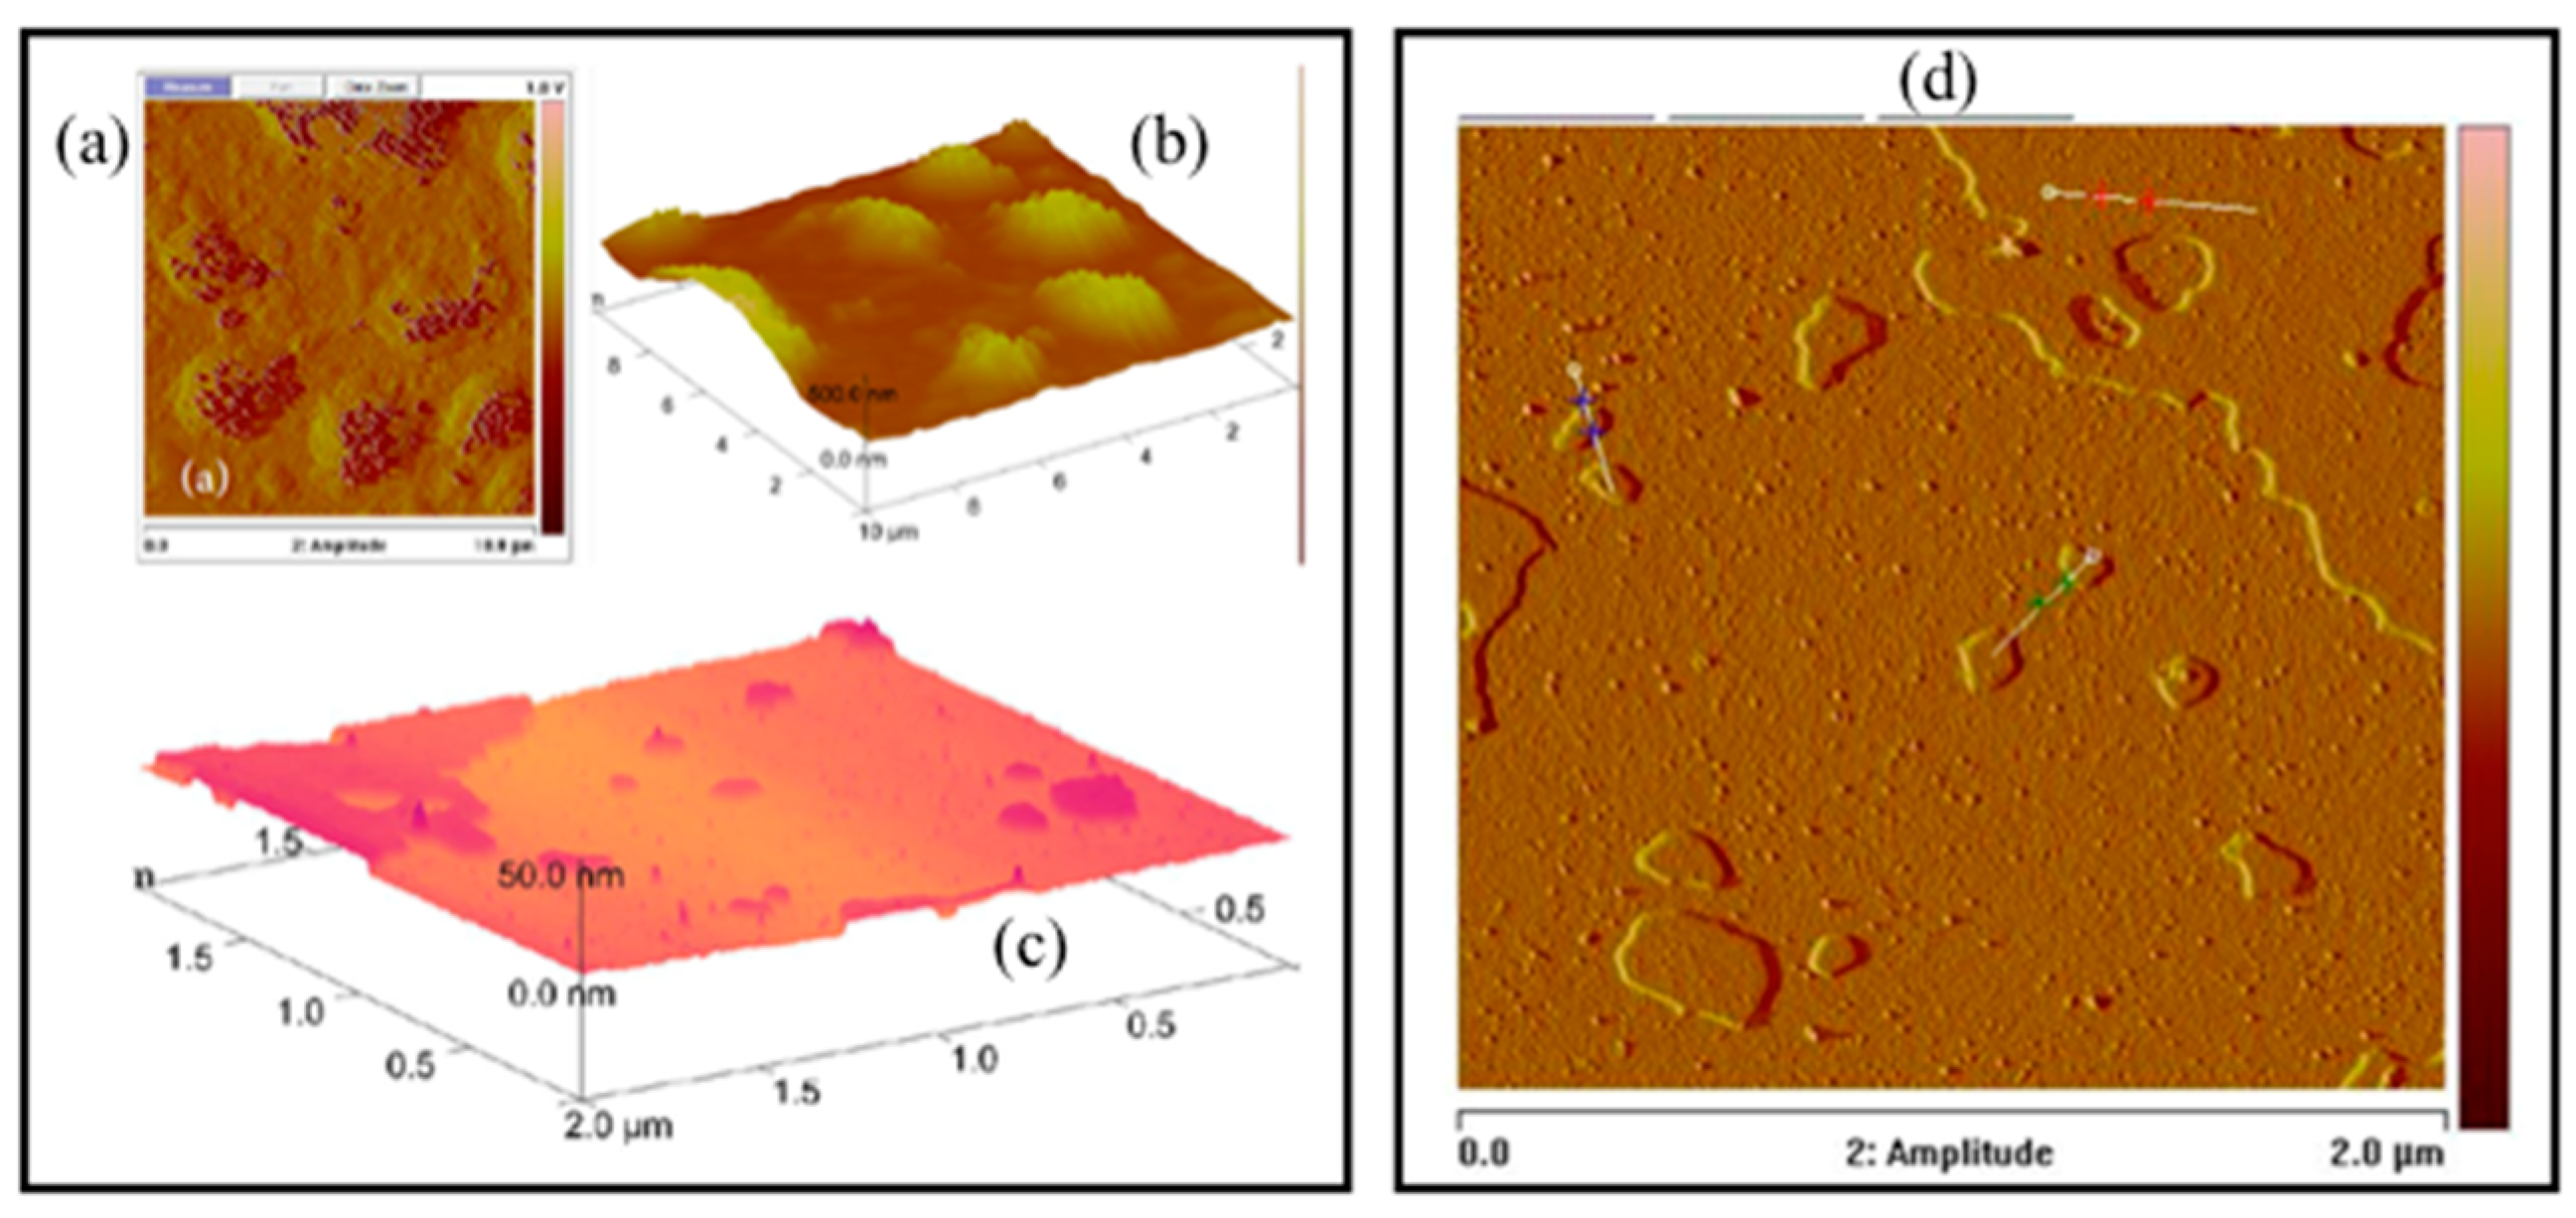
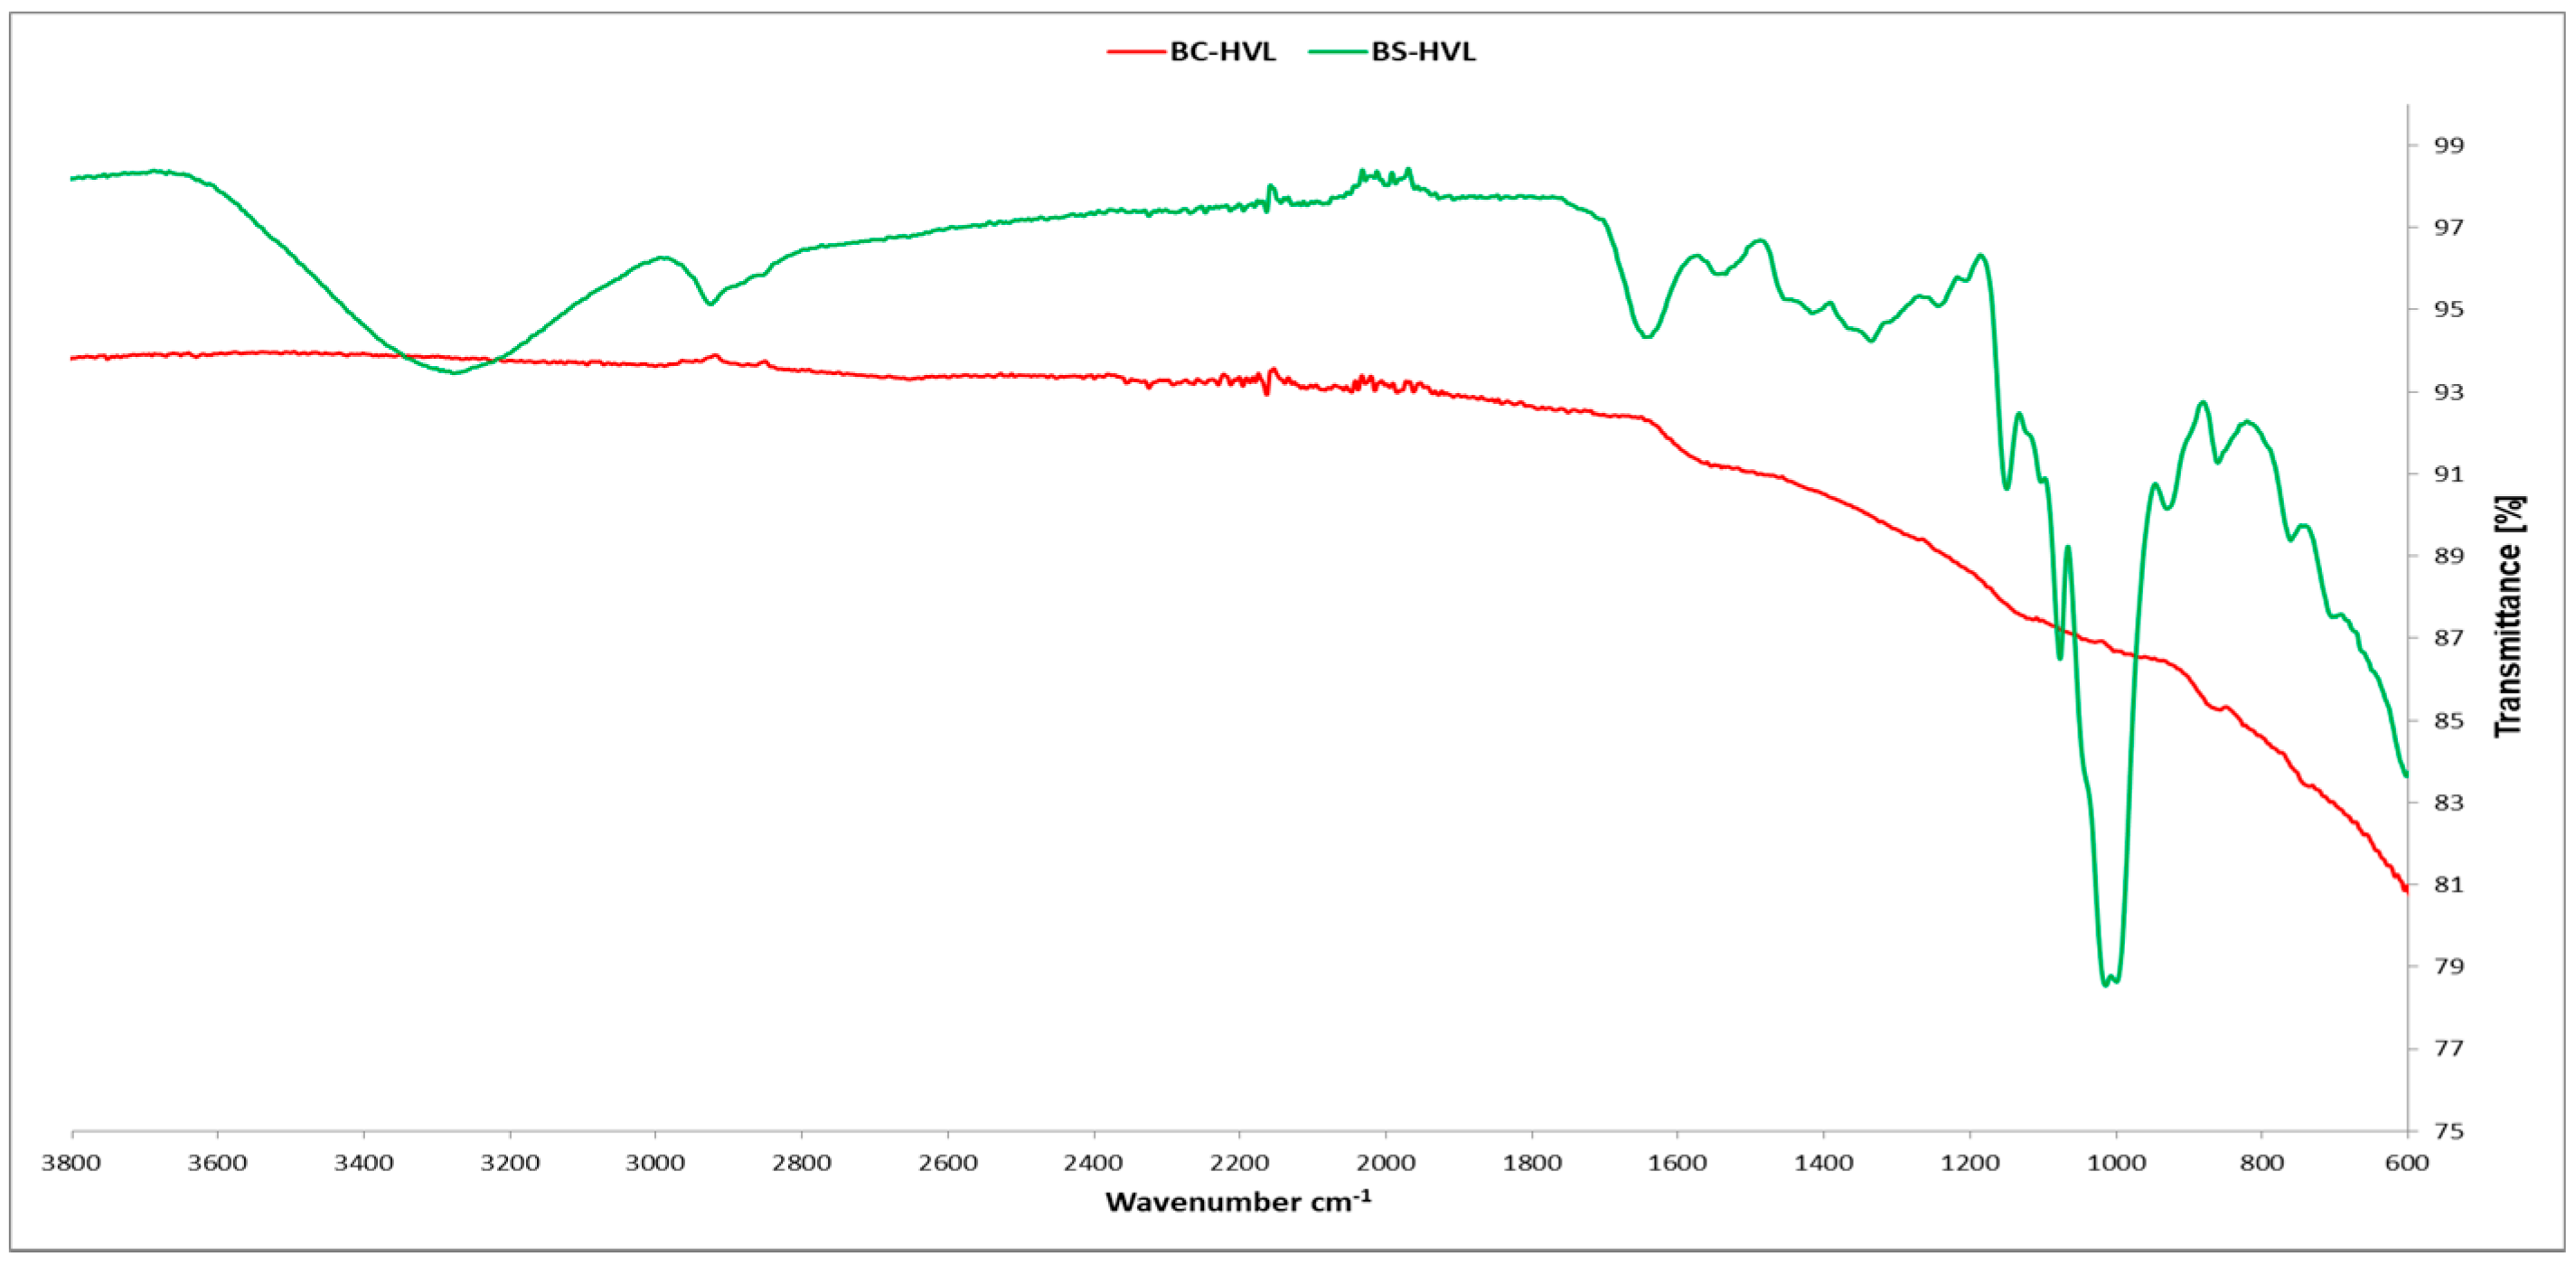
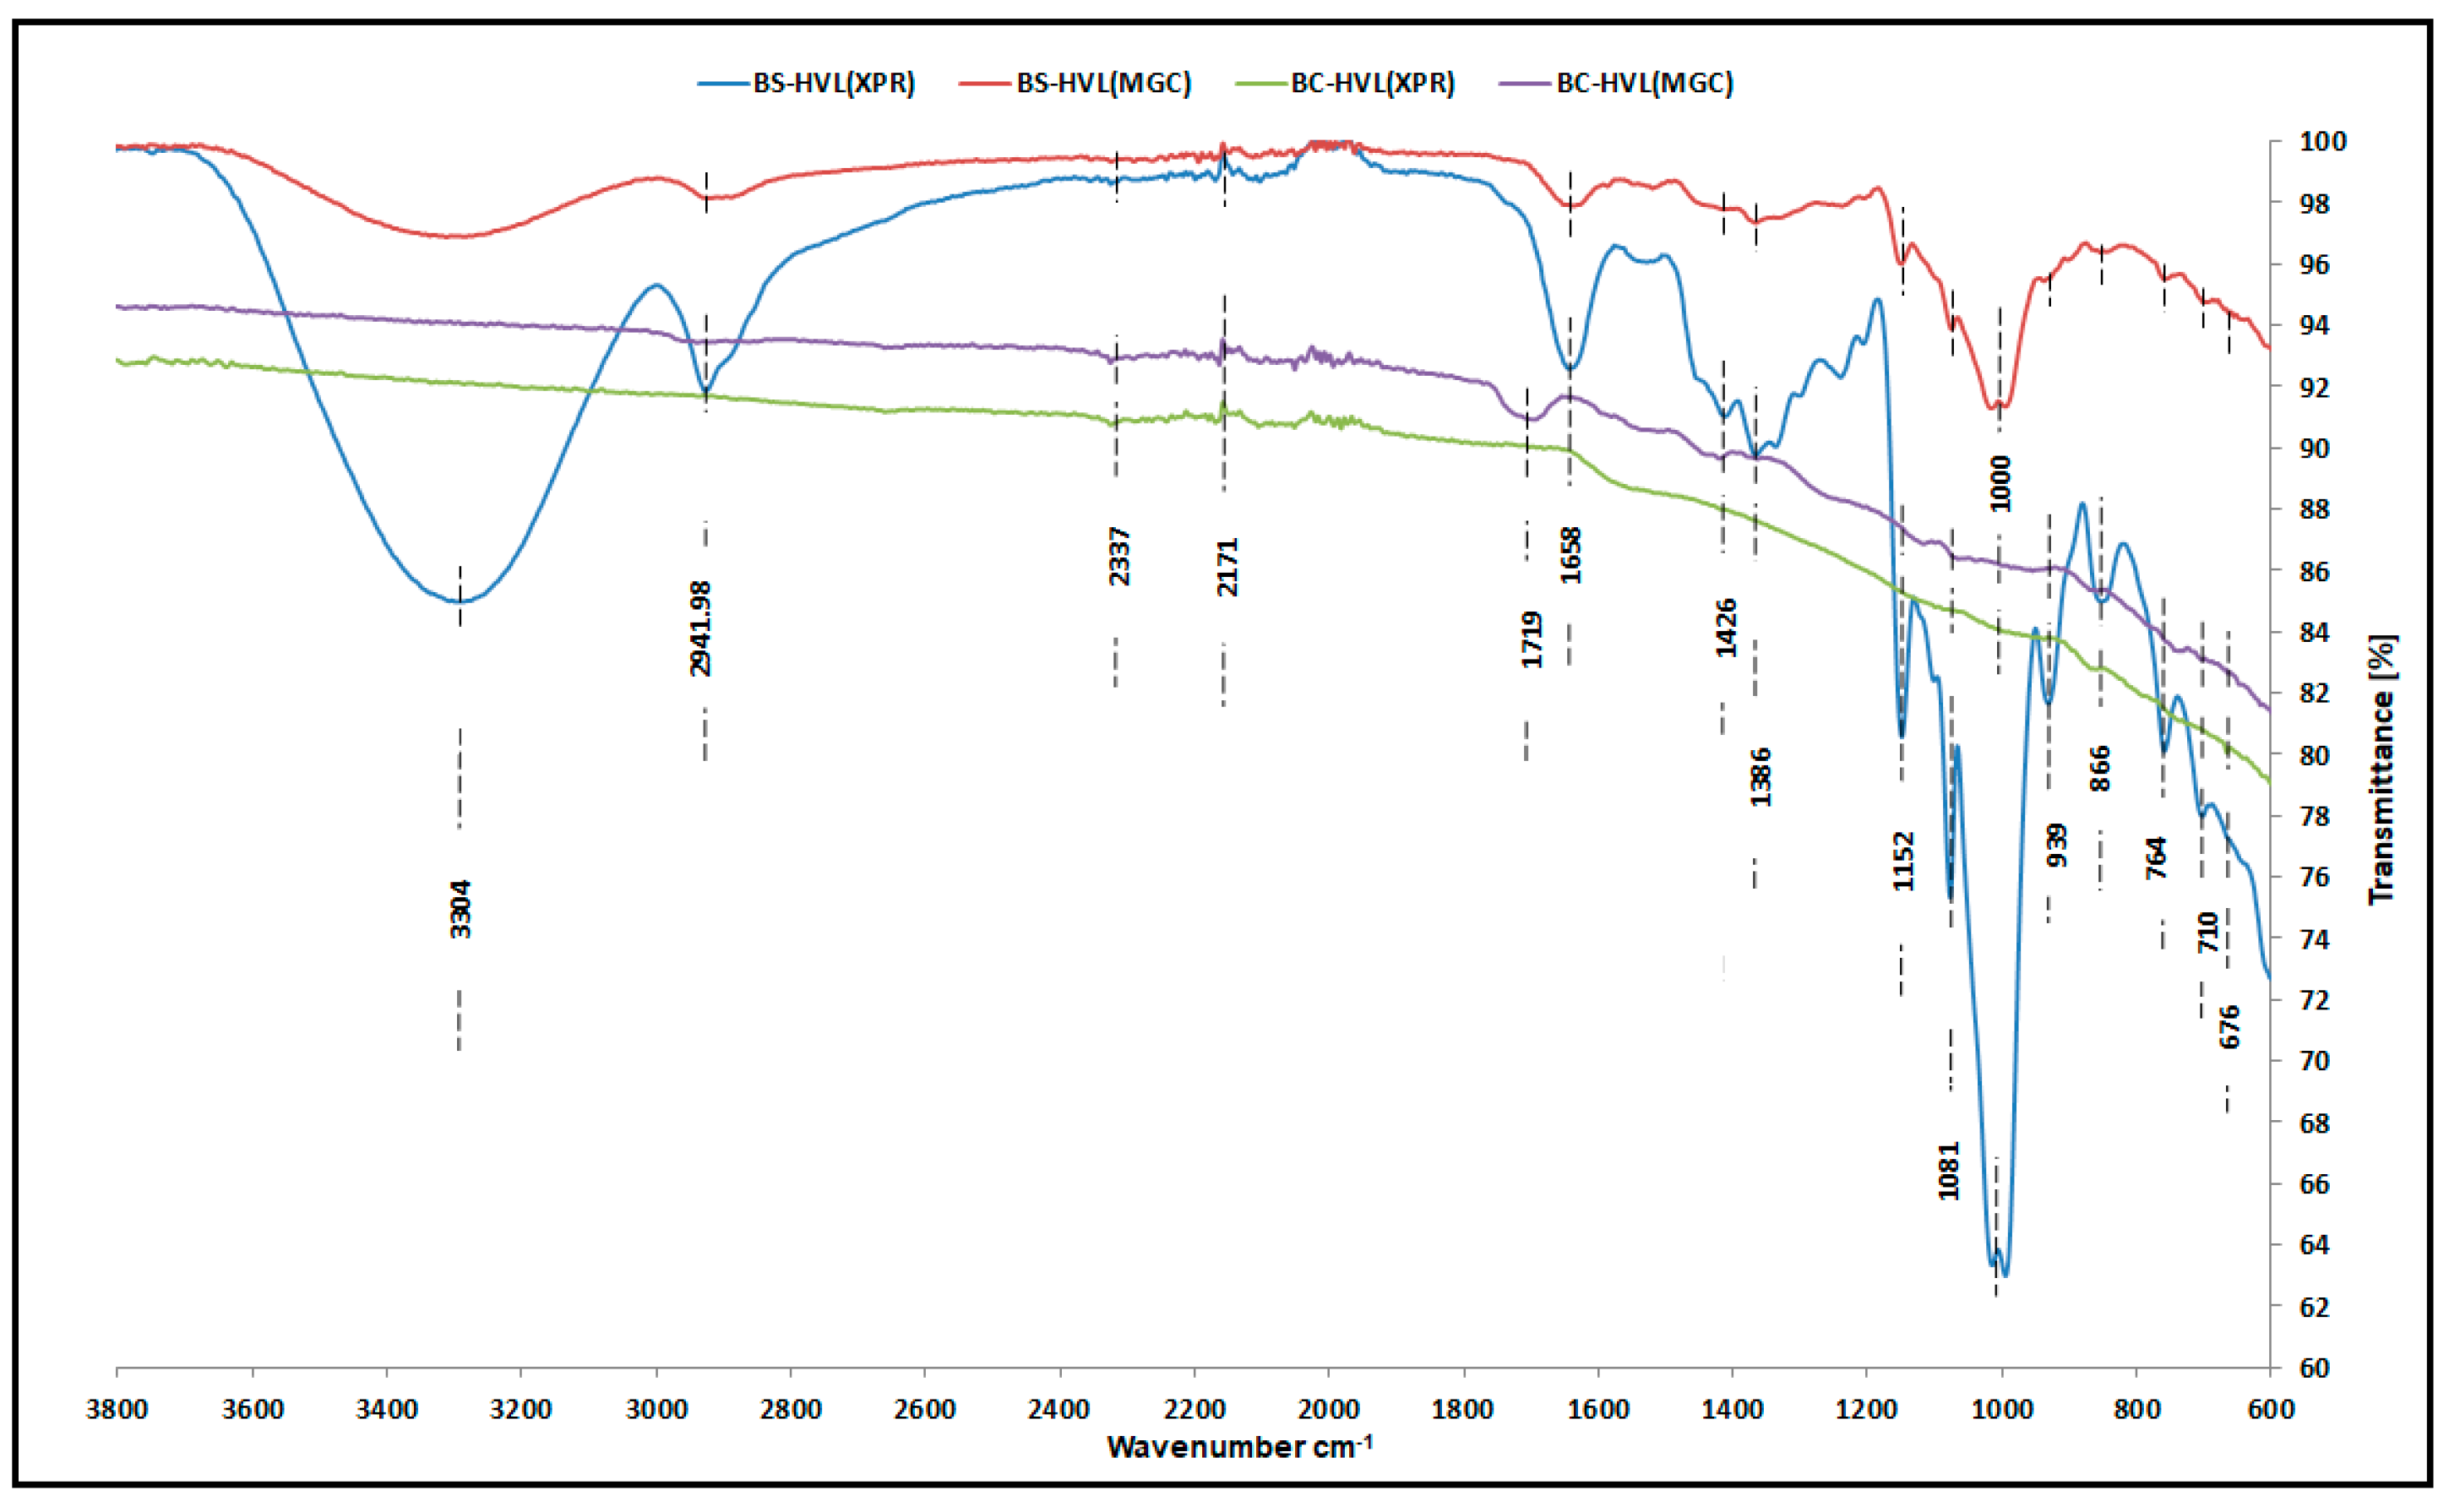
3.1. Interpretation of Analysis

The X-ray diffractograms of the BS-HVL and BC-HVL are shown in Figure 2 and Figure 3. Both materials show characteristic peaks at 2θ = 15°, 17°, 18°, 20° and 23° by diffraction of the (100), (020), (021), (110) and (200) planes of the hexagonal crystal lattice P31c(163) of sodium magnesium thiocyanate (Na4Mg(SCN)6) and crystals of magnesium iodide methanol (C6H24O6MgI2) and magnesium dodecanate (C24H46MgO4) and characteristic peaks at 2θ = 13°, 15°, 25° and 28.5° by diffraction of the (0–12), (100), (024) and (0–15) planes of the triclinic crystal lattice P-1(2) and other crystal structure of calcium pyrazolone trihydrate (C17H13CaClN4O7S2; 3H2O) and 1,3-Distearoyl-2-Palmitoylglycerol (C55H106O6) from the Triclinic P-1(2) crystal lattice. Most of the structure of BS-HVL and BC-HVL is amorphous, and the SEM might give a clear idea of the morphology of the investigated materials (Figure 5). This favors the adsorption of X-PR and MGC on both materials. The EDXA spectrum of BS-HVL (Figure 7a) also confirms the presence of a high percentage of carbon and oxygen in both materials, in addition to the presence of other elements such as K, P, Ca, Na and Si in BS-HVL. The EDXA spectrum of BC-HVL is shown in Figure 7b. After the adsorption of the X-PR and MGC dyes, the EDXA spectrum shows quite high percentages of carbon and oxygen, hence the fixation of both dyes inside the pores and on the surface of BS-HVL and BC-HVL. The SEM image also shows that the morphology of our material is modified after adsorption and the presence of the dye in the materials (Figure 6).
The images provided by the AFM analysis of the surface of the two materials give a clear idea that the surface of the seeds are rich with pillars (Figure 8a–c); on the other hand, biochar has a leash surface (Figure 8d). This difference between the natures of the surface can improve the adsorption capacity of the two colorants. Finally, the FTIR spectra of BS-HVL and BC-HVL were measured within the range of 500–4000 cm−1 and are displayed in Figure 6, which shows OH functions associating phenol and alcohol from 3200 to 3400 cm−1, C-H cycloalkane bonds from 2850 to 2925 cm−1, phosphine from 2280 to 2410 cm−1, N-H primary amines from 1550 to 1650 cm−1, C=O carboxylic acid from 1400 to 1450 cm−1, C-O primary alcohols from 1050 to 1080 cm−1, C-O ethers from 1000 to 1090 cm−1, Ar-C from 850 to 890 cm−1 and, finally, monosubstituted aromatics from 700 to 800 cm−1. After adsorption, the FTIR spectrum (Figure 10) shows the appearance of the new functions in the BC-HVL. This shows that the two biomaterials used to removal the X-PR and MGC are cost effective.

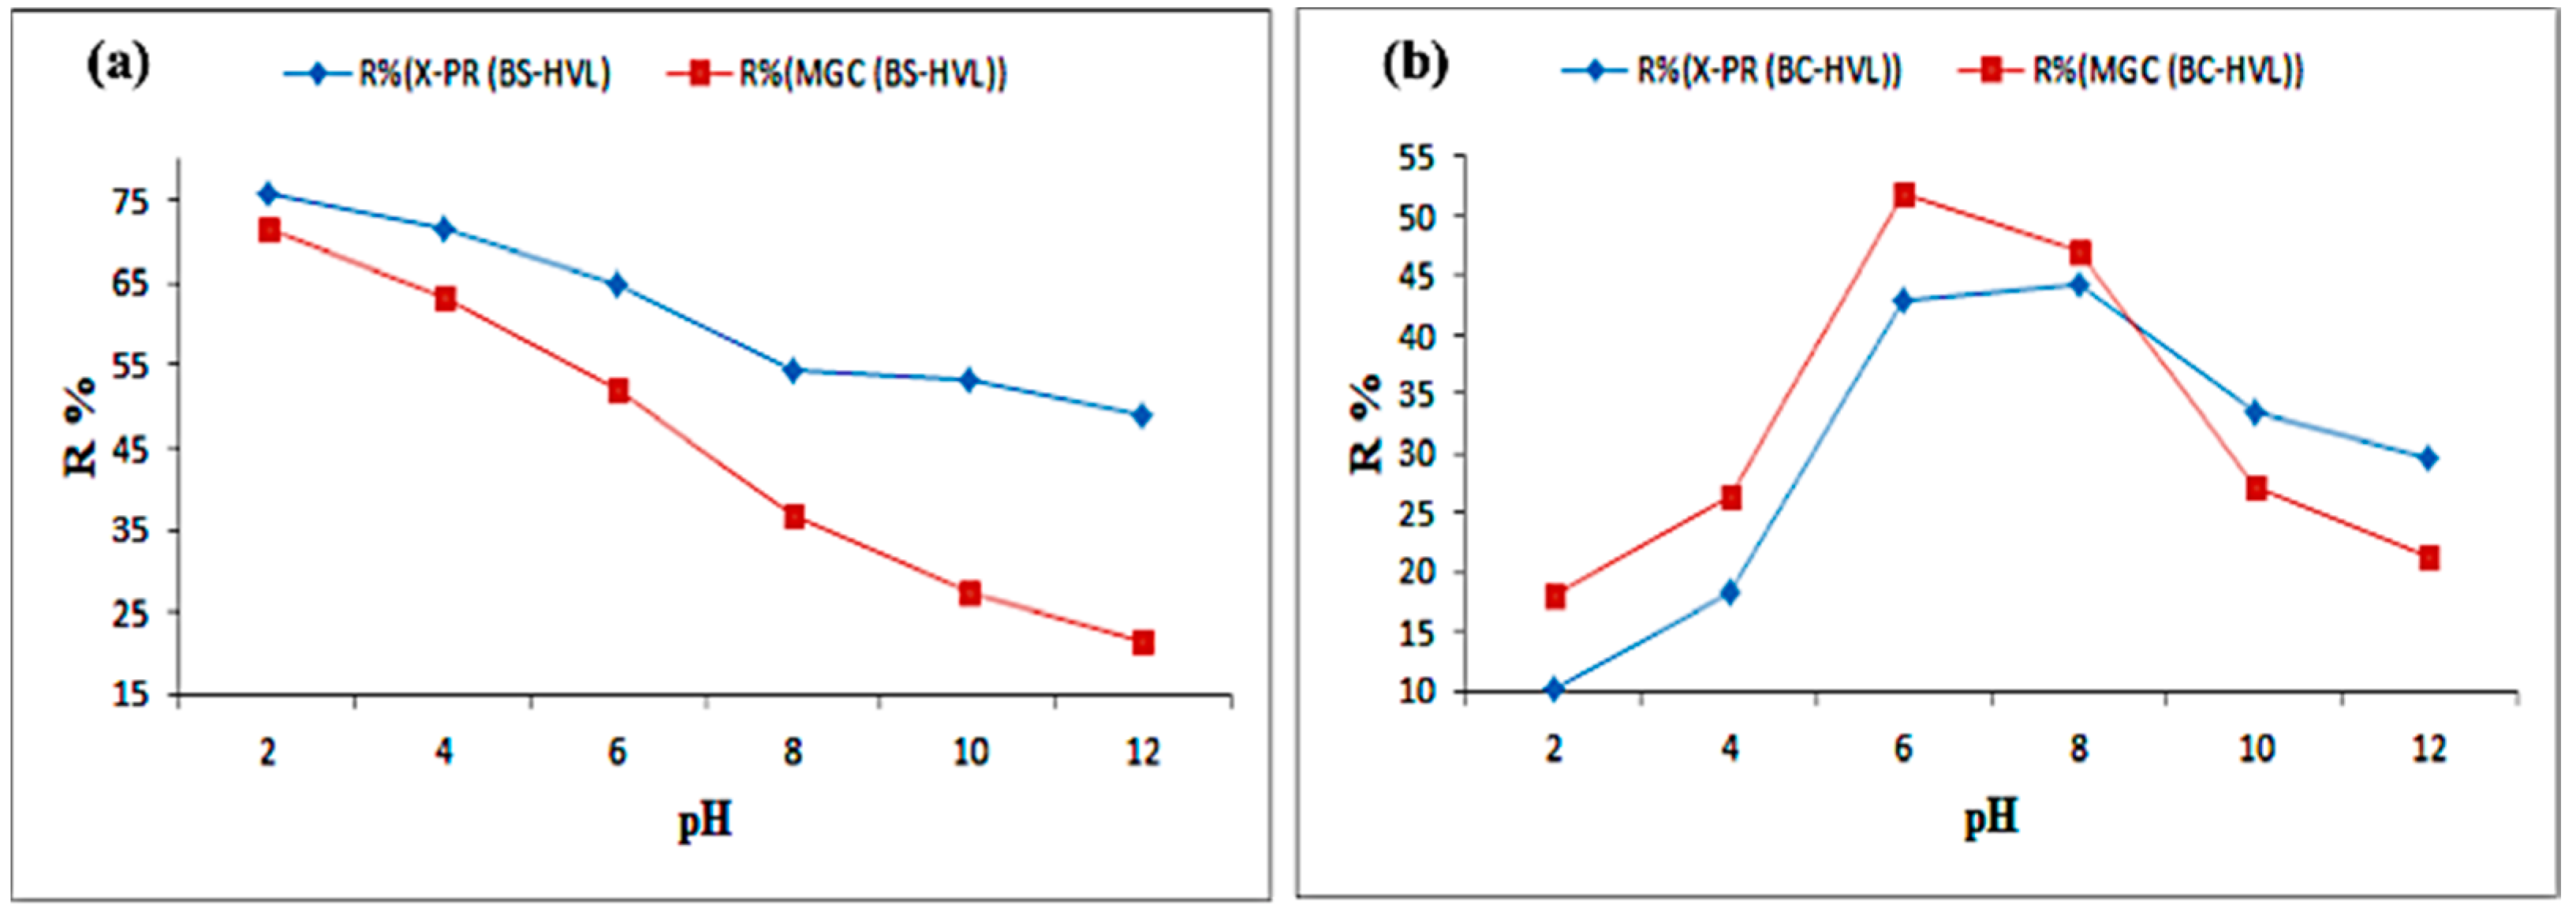
3.2. Effect of pH on the Adsorption Capacity of X-PR and MGC

According to Figure 11a, the effect of pH has a negative effect on the adsorption yield: when the pH increases, the yield decreases with the presence of H+ protons in the acidic medium and OH ions in the basic medium, which inhibits adsorption. Hydrogen and hydroxide ions are generally adsorbed quite strongly on the surface of the adsorbent. The number of active sites subsequently becomes small, and the adsorption of other ions becomes very difficult. Consequently, the adsorption of the two dyes decreases rapidly in the range from pH 2 to 8. For pH > 8, the decrease in adsorption becomes slower. On the other hand, for barley biochar BC-HVL (Figure 11b), the adsorption yield increases in the acidic medium because the level of H+ ions is very high and the charge transfer complexes are formed from weak interactions of donor and acceptor electrons that results in the formation of organometallic complexes in the environment.

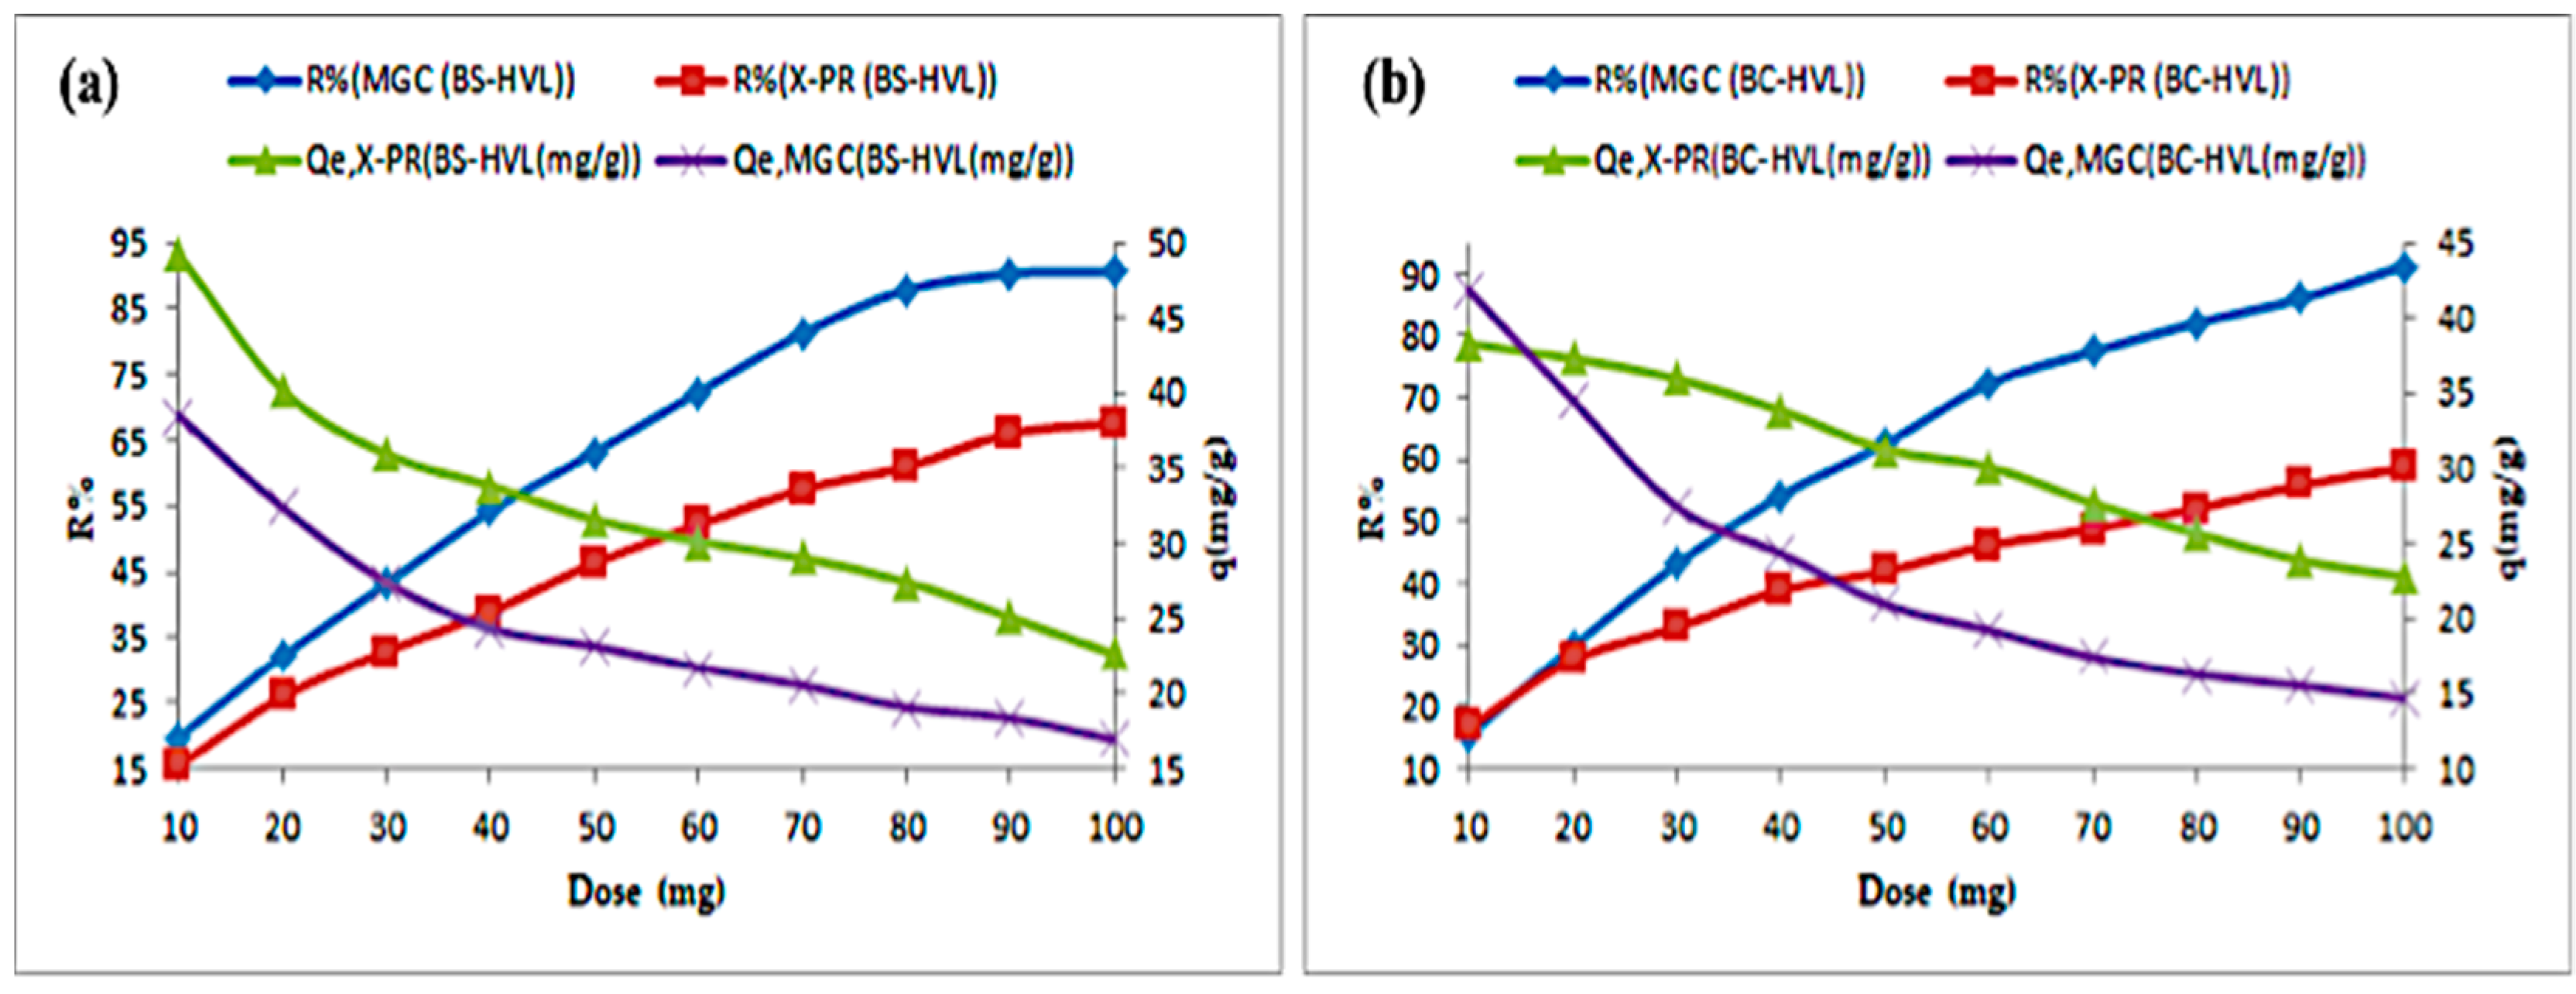
3.3. Effect of the Adsorbent Dose on the Adsorption Capacity of X-PR and MGC

The study of the effect of the dose on the adsorption rate of the two dyes X-PR and MGC under experimental conditions is given by Figure 12a,b for the two materials BS-HVL and BC-HVL. The adsorption of the two dyes increases with the increase of the adsorbent dose during its range of study. This is due to the increased number of free sites on the adsorbent surface. The increase is quite large in the range of 0.01 to 0.07 g, but for adsorbent masses higher than 0.07 g, the variation becomes very small.

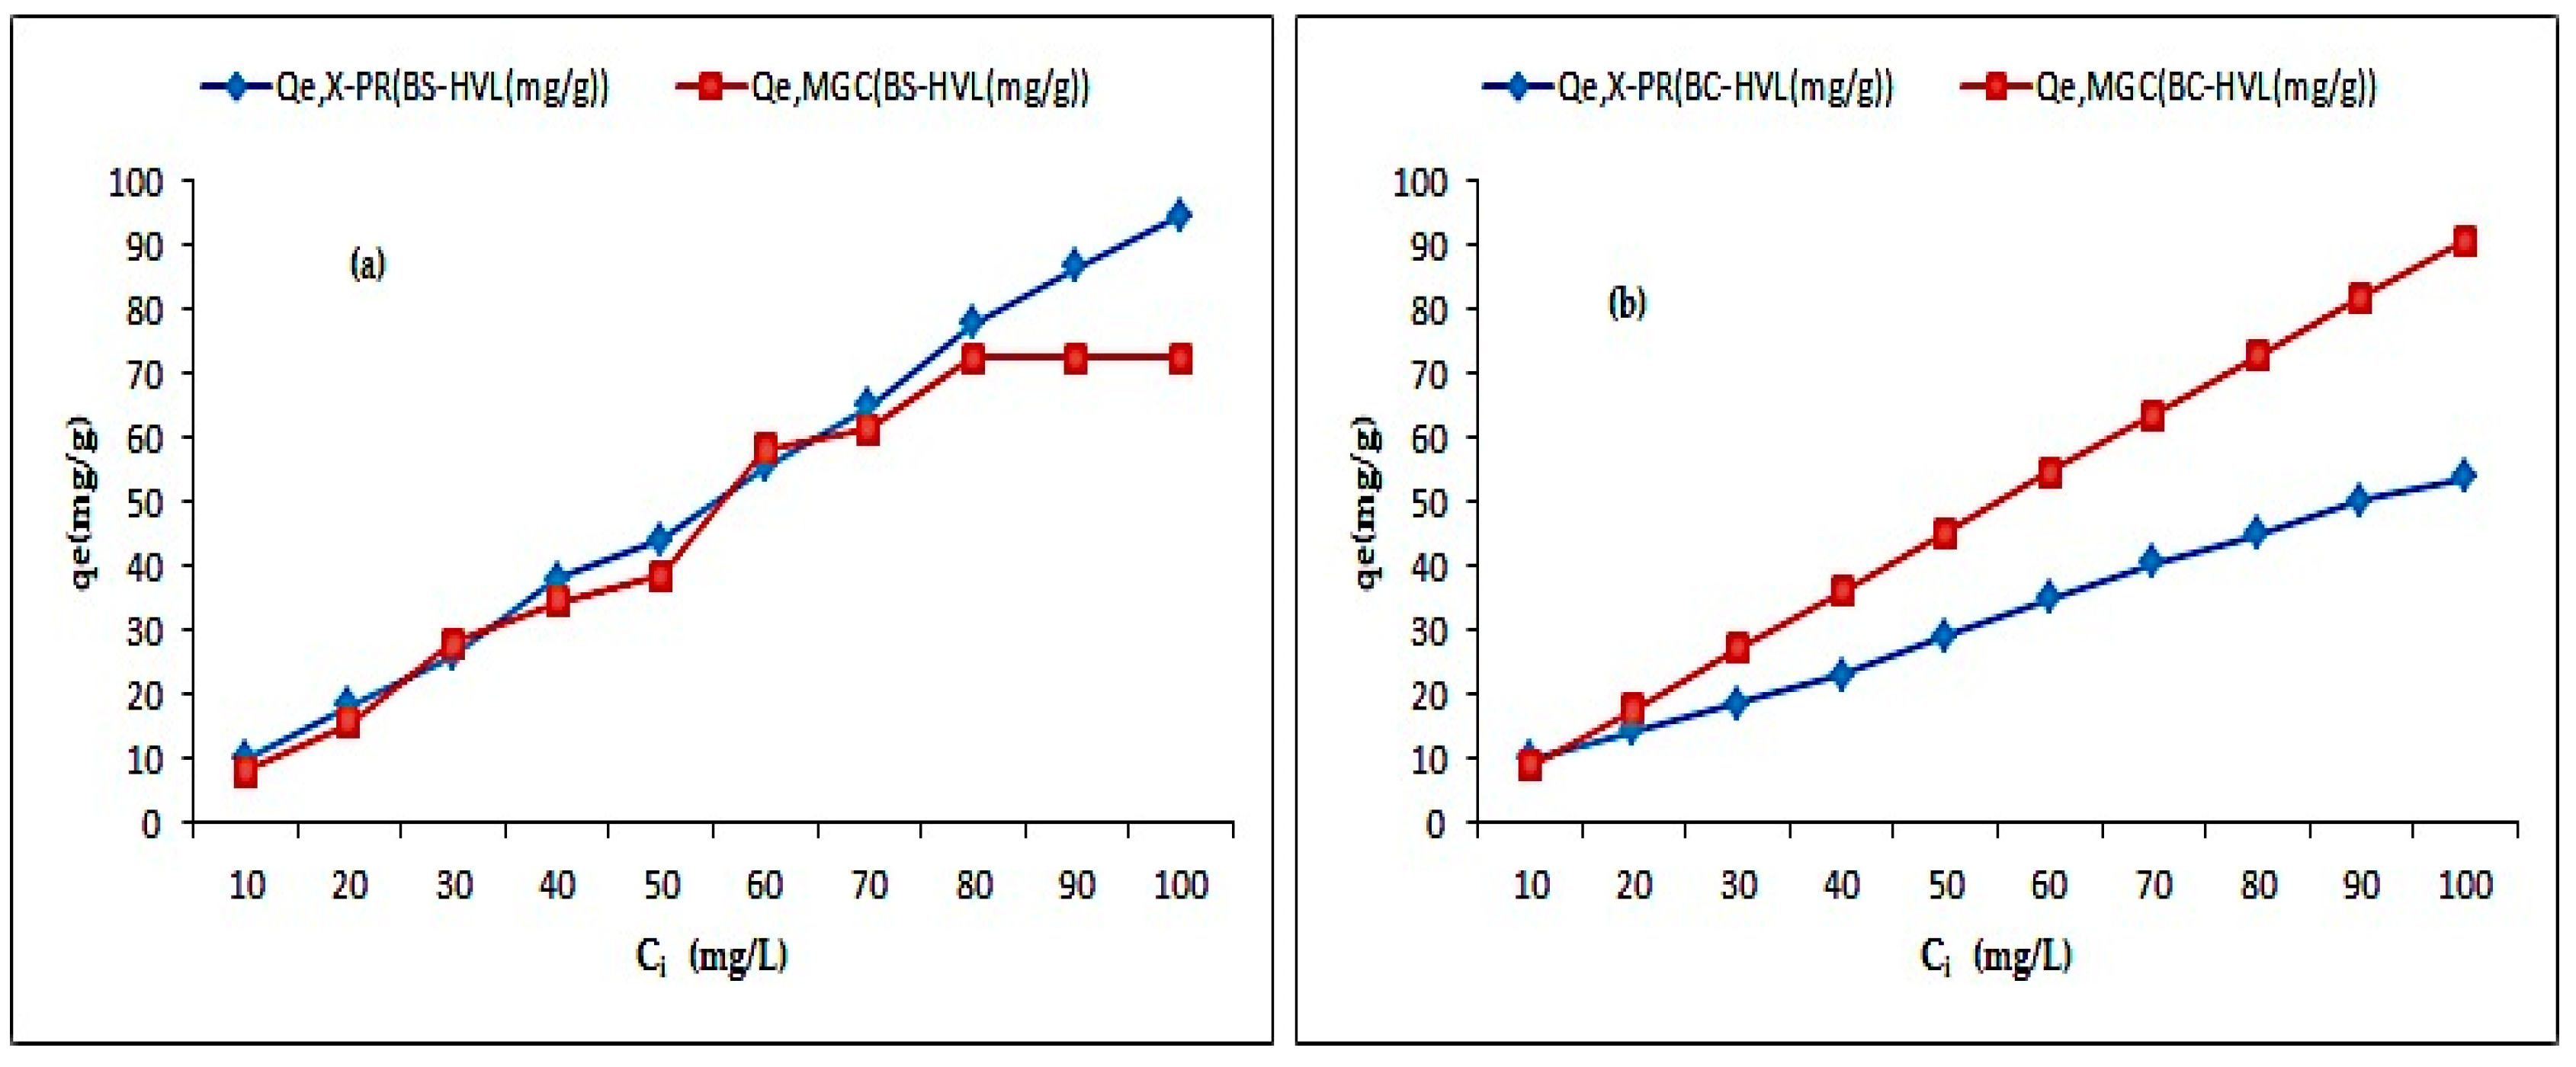
3.4. Effect of Initial Concentration

Figure 13 shows that when the dye concentration is increased, the adsorption efficiency of both dyes by both materials decreases [29,30]. The lowest dye removal was measured at an initial dye concentration from 10 to 100 mg L−1 and the dye removal efficiency is higher at low concentrations between 10 and 60 mg L−1, R% ≥ 86 for MGC and R% ≥ 56 for X-PR on BS-HVL and R% ≥ 20 for MGC and R% ≥ 18.5 for X-PR on BC-HVL. Therefore, the amounts adsorbed by BS-HVL are 9 to 94 mg g−1 and 7 to 74 mg g−1 for X-PR and MGC, respectively. Moreover, BC-HVL adsorbs 9.8 to 54 mg g−1 and 8.6 to 91 mg g−1 with X-PR and MGC, respectively.

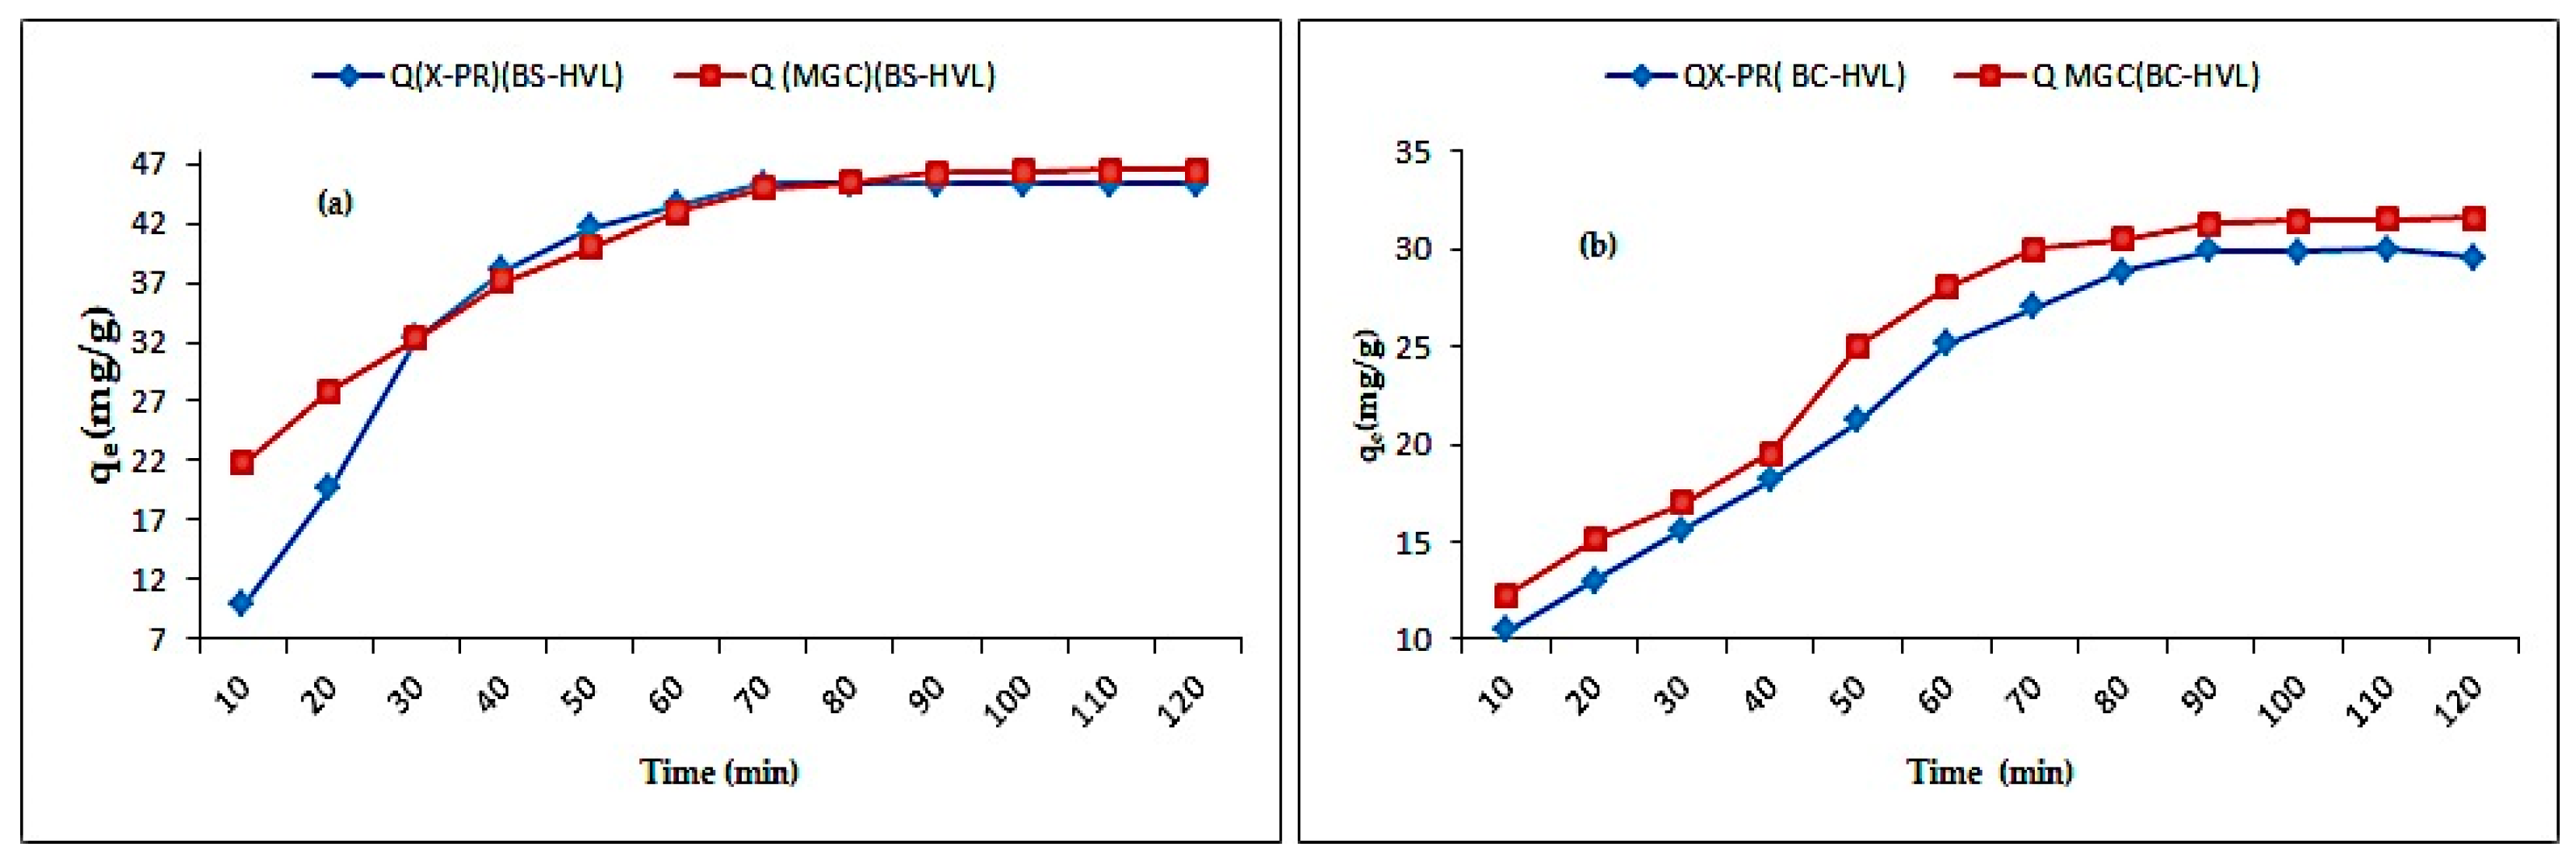
3.5. Effect of Contact Time

The adsorption kinetics within 60 min are very important. This corresponds to a sufficient contact time that is able to eliminate the maximum amount of dye before reaching the chemical equilibrium point. For the time 60 ≤ t ≤ 80, the elimination speed becomes very low and reaches equilibrium, hence the ideal contact time for this experiment at equilibrium is 90 min (Figure 14). The dye adsorption rate of BS-HVL is much faster than that of BC-HVL. The maximum amounts adsorbed at t ≤ 60 min are 25 mg g−1 and 28 mg g−1 for BC-HVL and 42.5 mg g−1 and 43 mg g−1 for BS-HVL by X-PR and MGC, respectively.

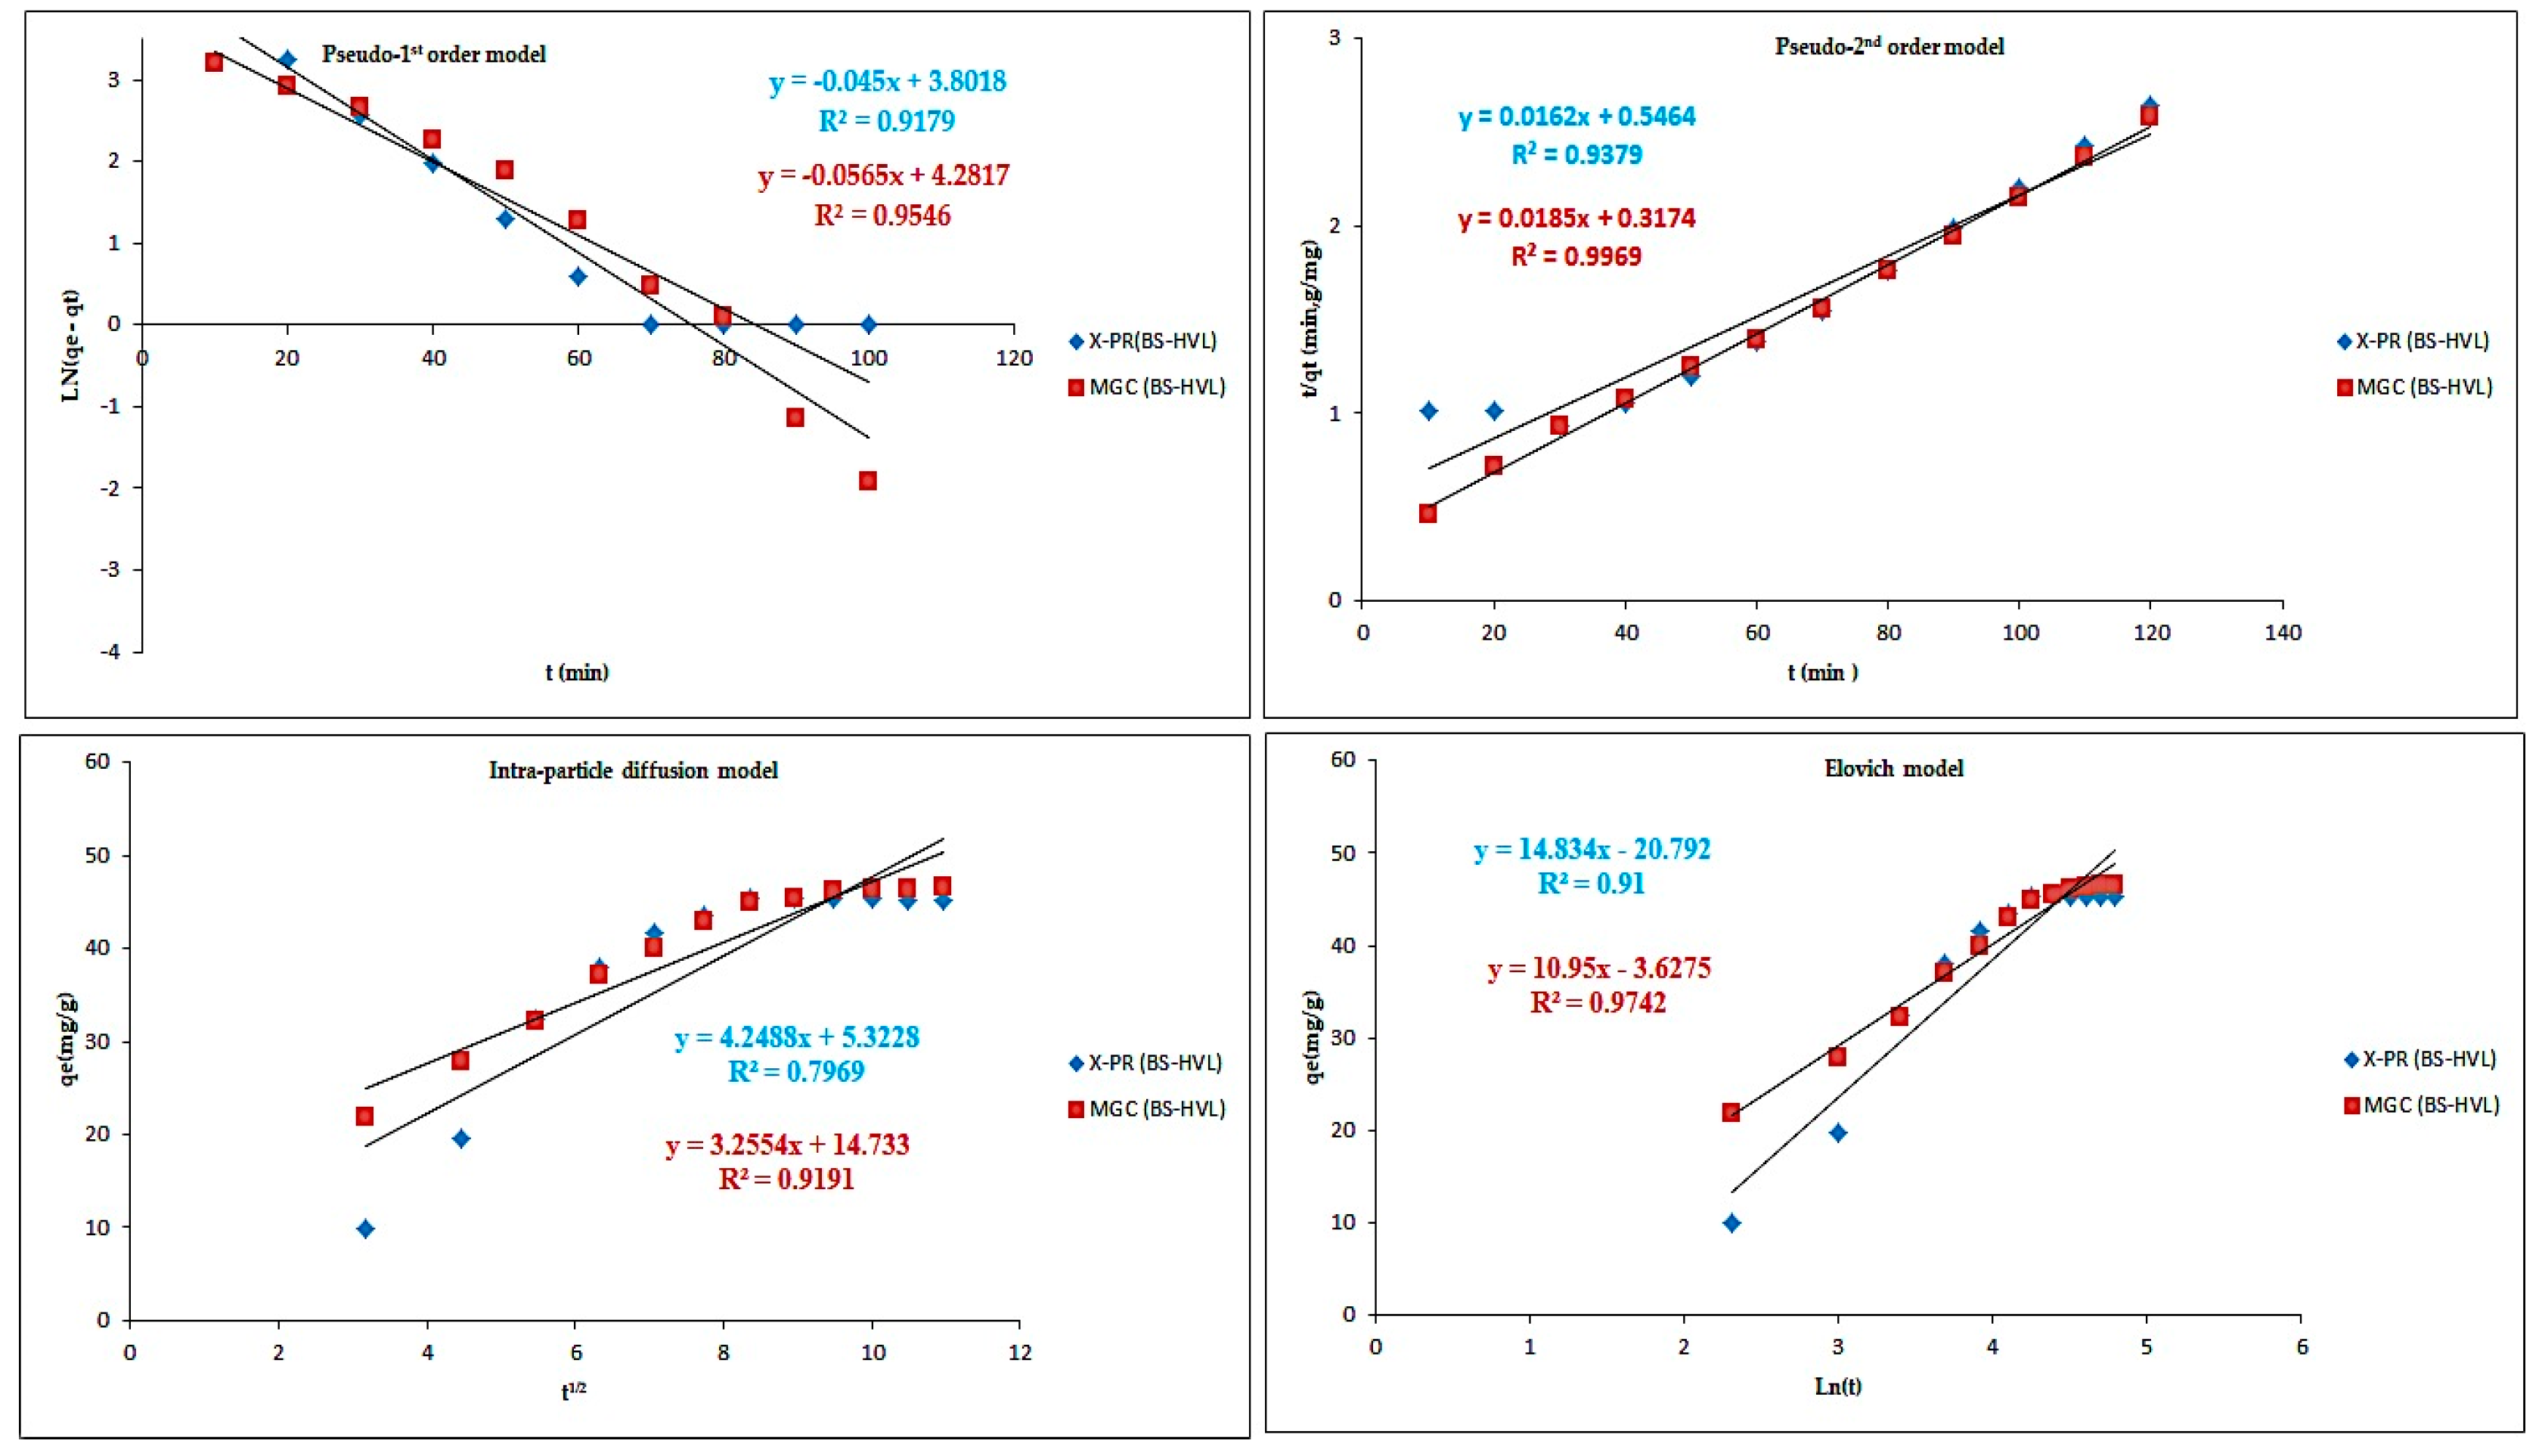
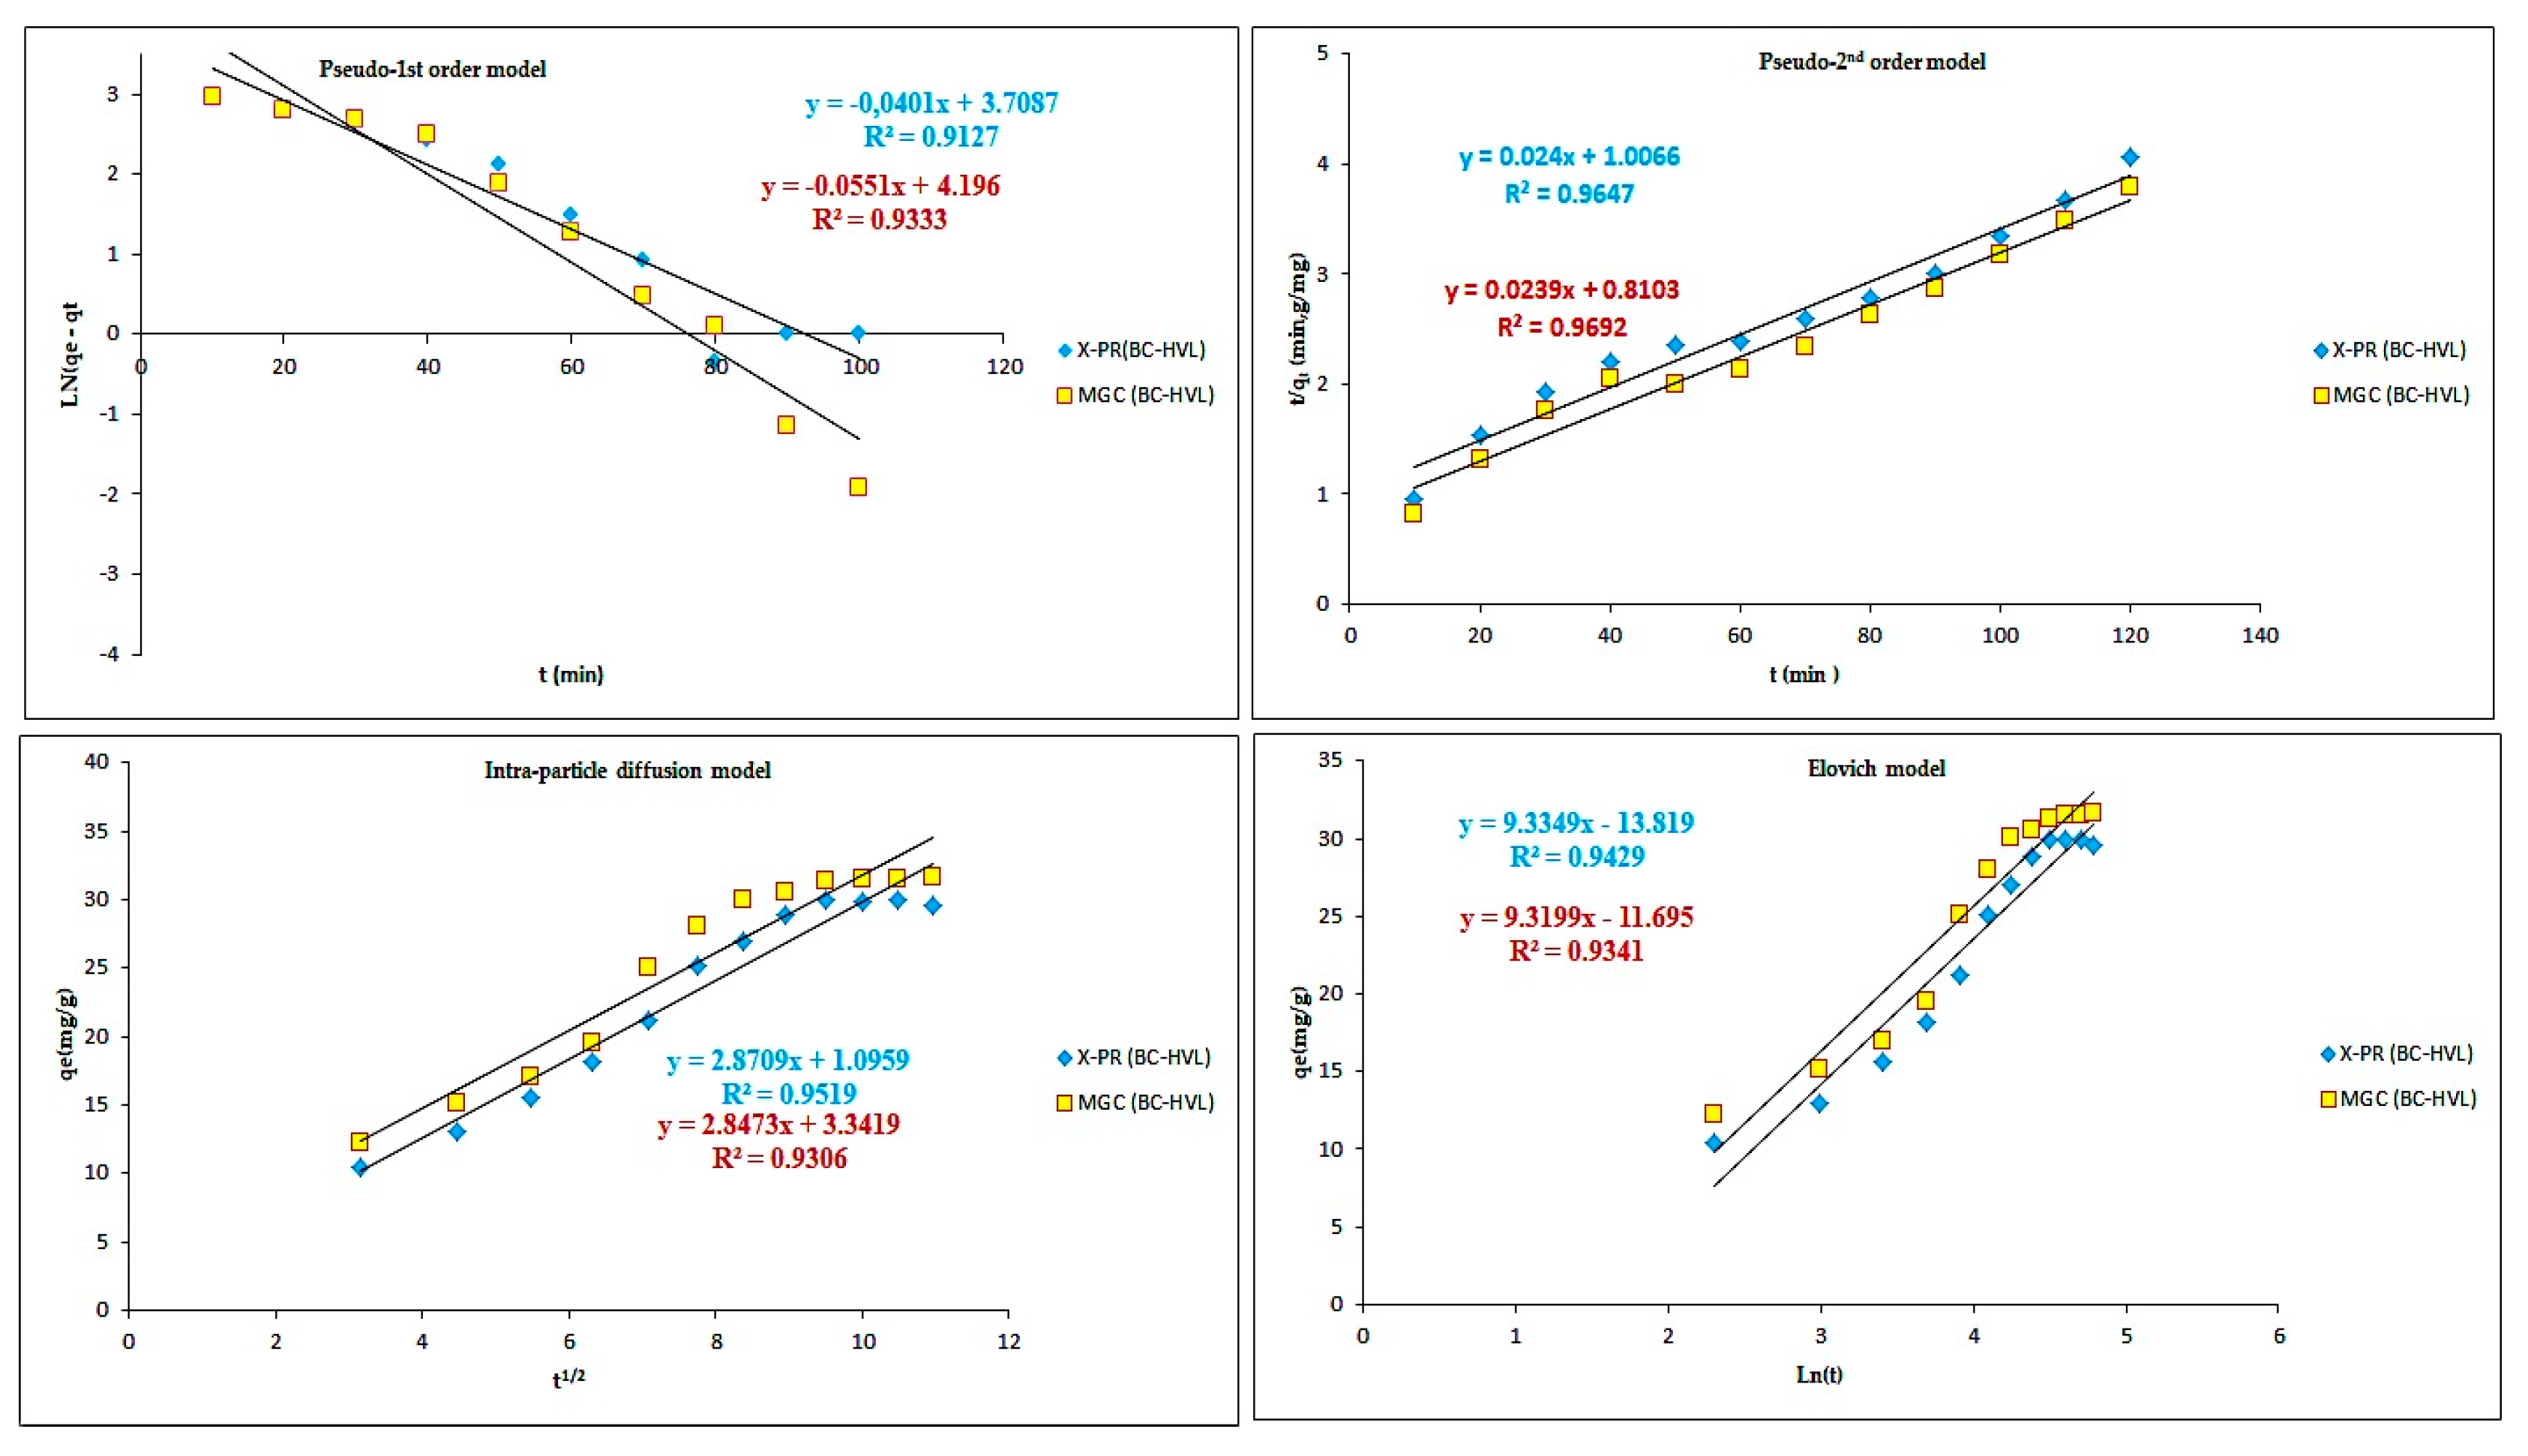
3.6. Adsorption Kinetics

These results show that the most appropriate model for the adsorption of the two dyes is the pseudo-second-order model. Figure 15 and Figure 16 show the adsorption kinetics obtained in this study, and Table 1 groups the results obtained by testing the four models.

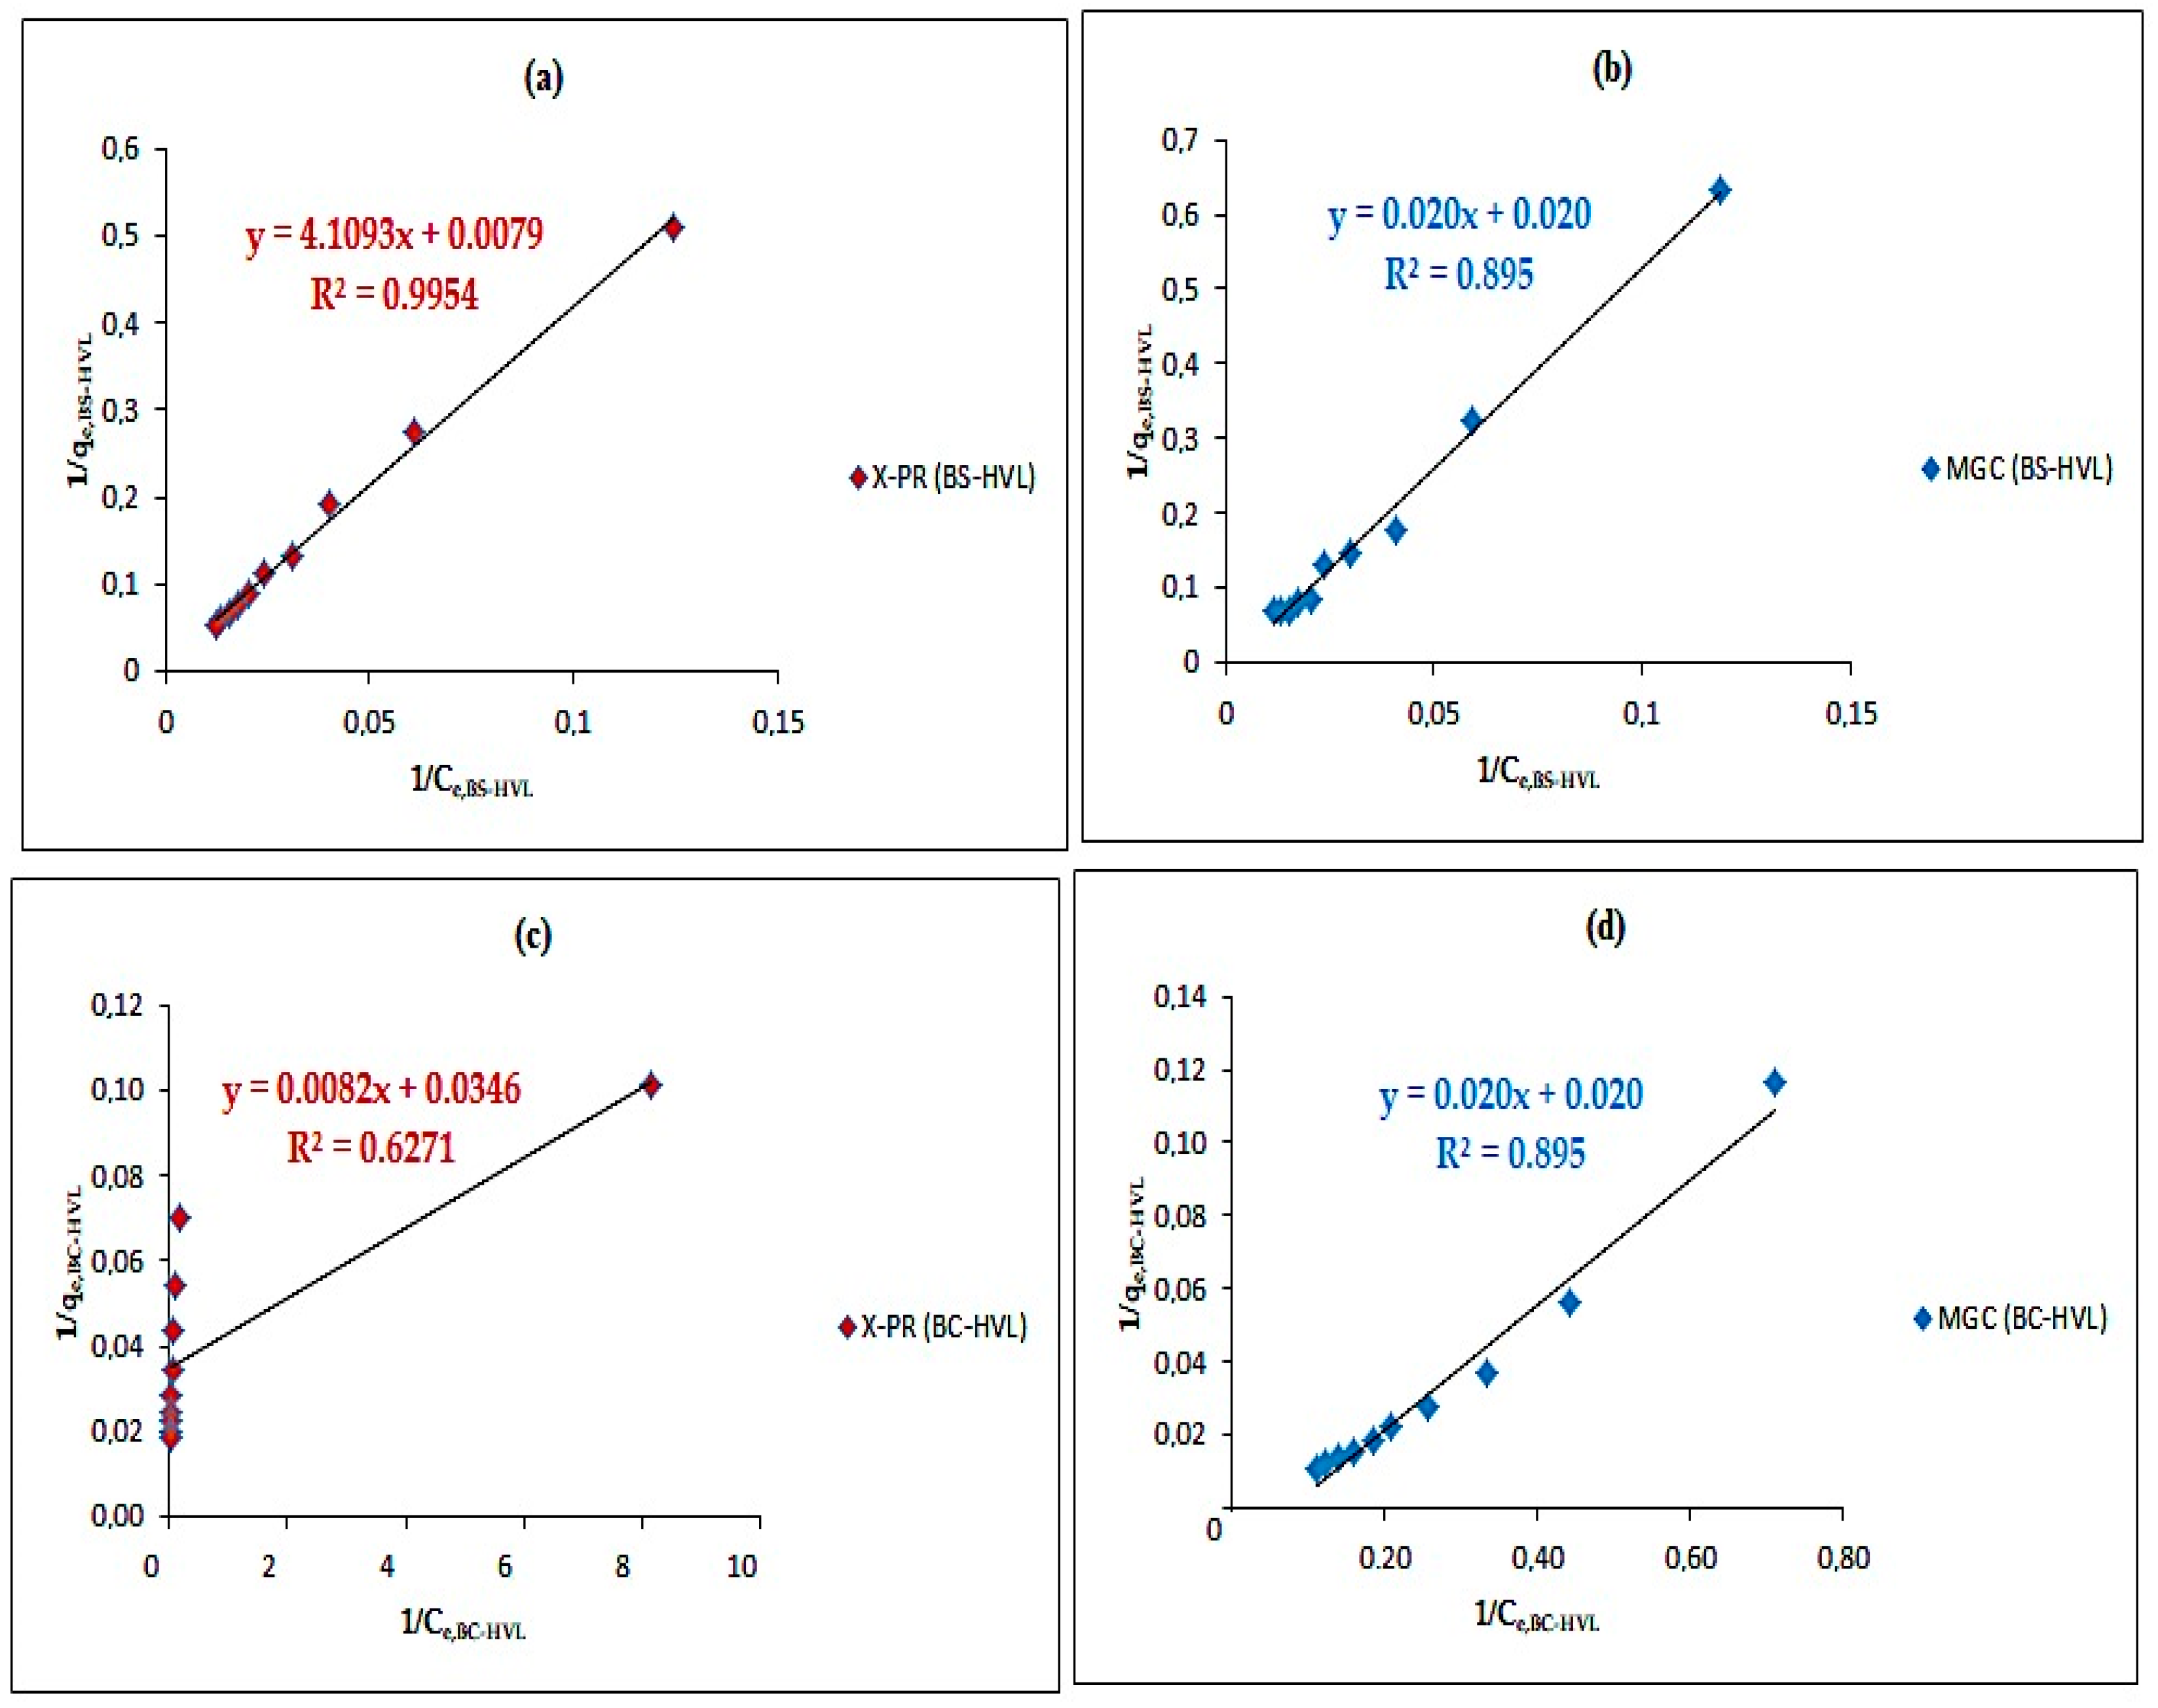
3.7. Adsorption Isotherms

In this study, the models studied are the Langmuir model, Freundlich model, Temkin model, and Dubinin–Radushkevich model. The most frequently established model for the study from the adsorption isotherms is the Langmuir model (Figure 17a–d); the results obtained are shown in Table 2.

3.8. Statistical Analysis

The results are reported as the means of four replicates. The data obtained were subjected to one-way analysis of variance (ANOVA) for assessing the significance of quantitative changes in the variables as a result of biochar treatments. The statistical analysis was done by the Statistical Package for Social Science (IBM SPSS Statistics 23.0, Chicago, IL, USA)
According to the statistical analysis (Table 3) of the effect of pH on the adsorption capacity, there is a significant difference (p < 0.05) between the means of the adsorption capacities of X-PR by the two materials BS-HVL and BC-HVL; on the other hand, there is no significant difference (p = 0.211) between the means of the adsorption capacities of MGC by the two studied materials (BS-HVL and BC-HVL). Furthermore, the statistical analysis of the effect of the dose shows that there is no significant difference (p > 0.05) between the means of the adsorption capacities of X-PR and MGC by the two materials BS-HVL and BC-HVL. On the one hand, the statistical analysis of the effect of the initial concentration shows that the test is insignificant at the 5% level, with no significant difference between the means of the adsorption capacities of X-PR and MGC by the two materials BS-HVL and BC-HVL. On the other hand, the statistical analysis of the effect of contact time shows that the test is highly significant at the 1% value; there is a significant difference between the mean adsorption capacities of X-PR and MGC by the two materials BS-HVL and BC-HVL. Moreover, the statistical analysis of the effect of temperature shows a highly significant test at the 5% threshold, indicating that there is a significant difference between the means of adsorption capacities of X-PR and MGC by the two materials BS-HVL and BC-HVL.

3.9. Comparison of Adsorption Capacity with Various Adsorbents

Table 4 shows the adsorption capacity of dyes and heavy metals in aqueous solutions by activated carbons of different biomass. The majority of the activated carbons used in the removal of the anionic dyes, cationic dyes and heavy metals have adsorbed quantities of less than 500 mg g−1, except that Rice straw charcoal has an adsorbed quantity equal to 620 mg g−1.

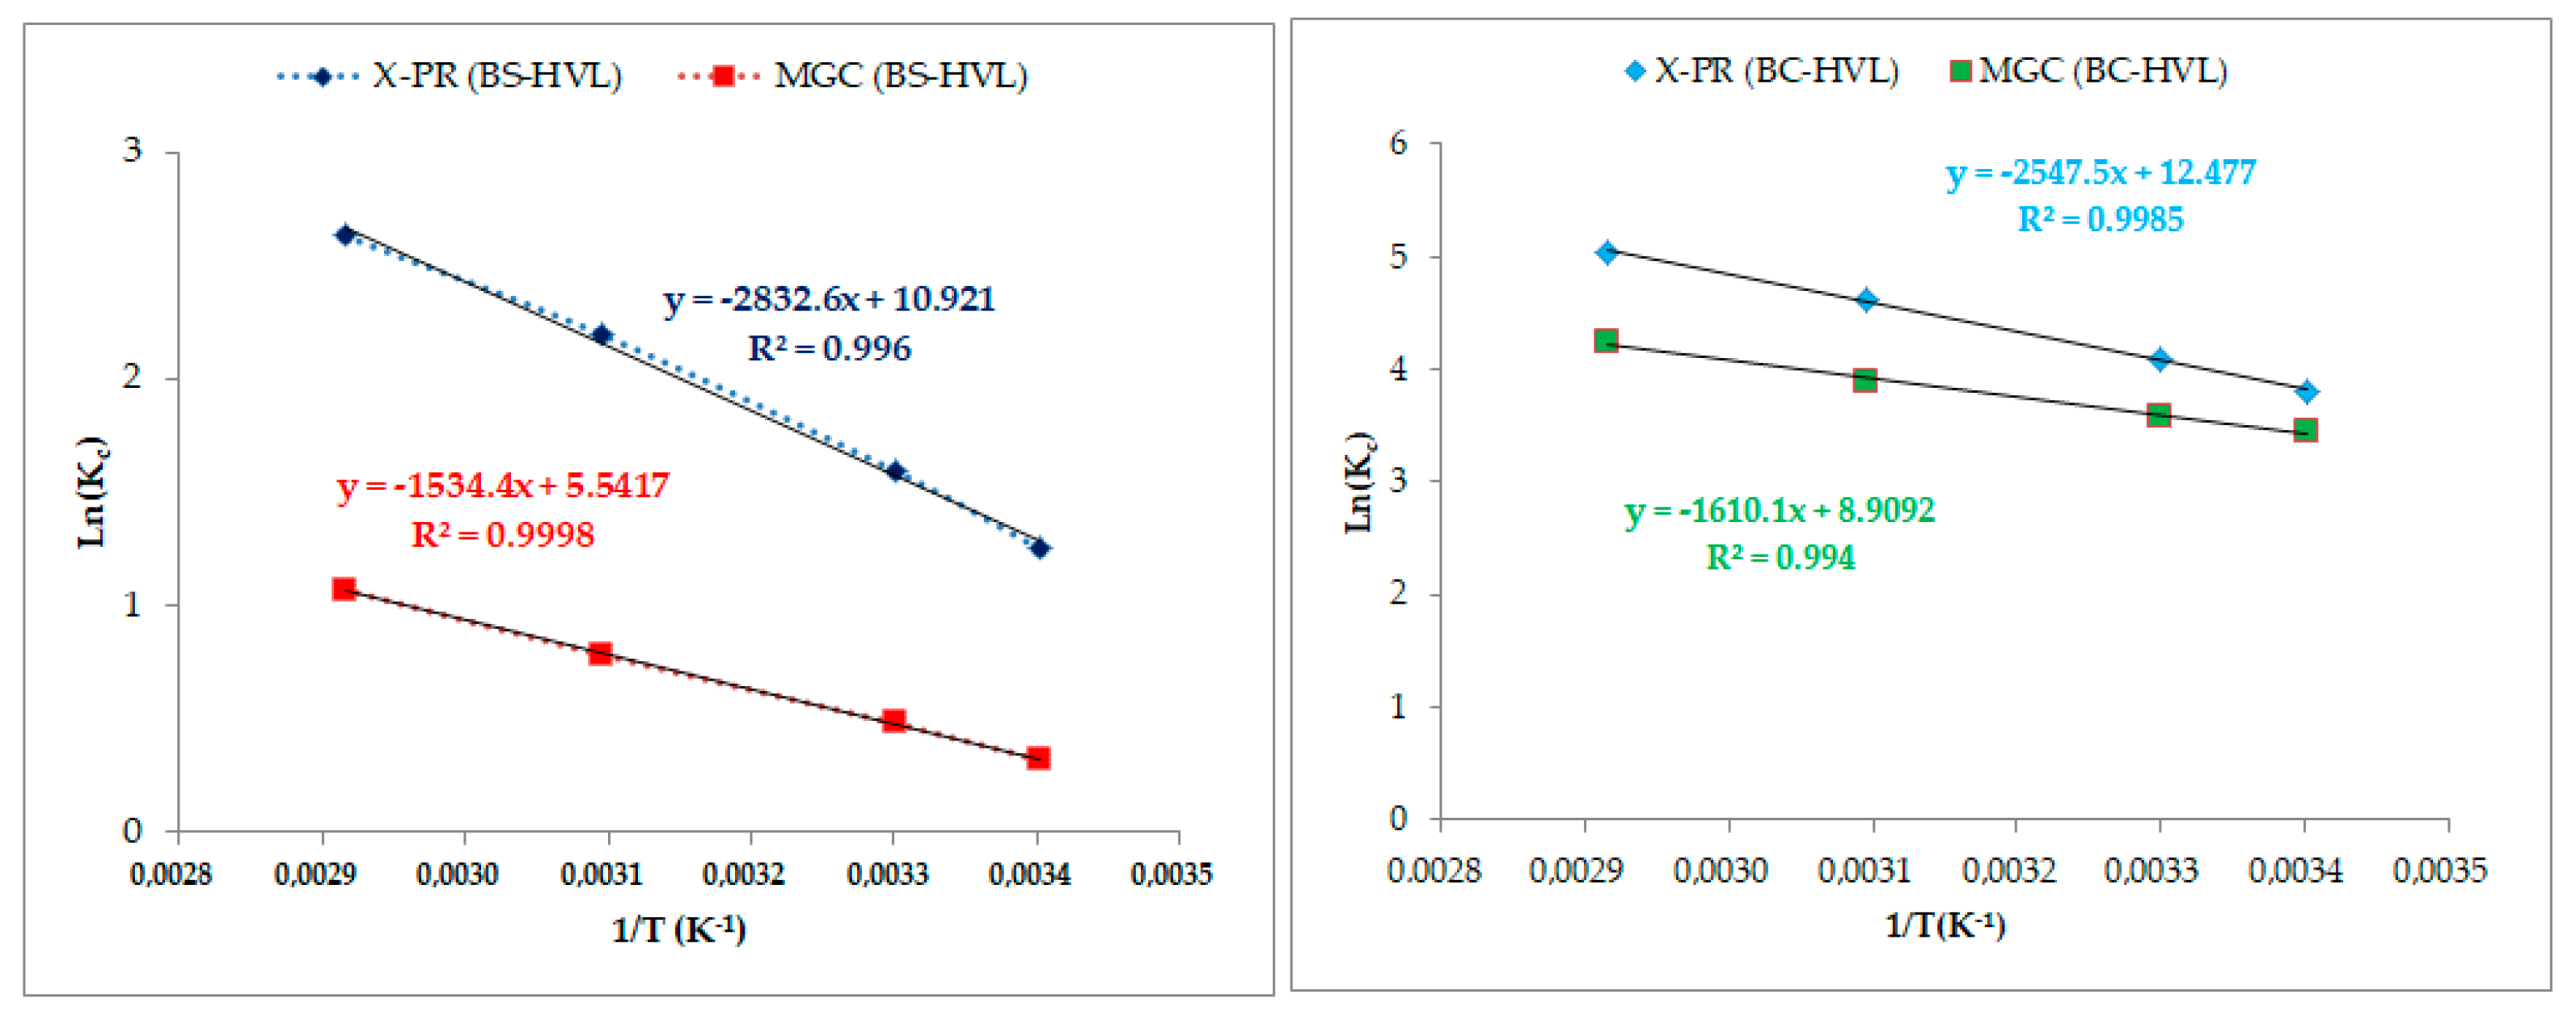
3.10. Adsorption Thermodynamics Studies

The thermodynamic parameters, such as the Gibbs free energy change (Δ), enthalpy (Δ) and entropy (Δ), were calculated using the following equations [42]:
K = Q e     C e            
The value of Δ can be determined from the following equation:
Δ G ° = R T   l n ( K )                
where K is the thermodynamic equilibrium constant.
The effect of temperature on thermodynamic constant is determined by the following equation:
d ( ln ( K ) ) dt = Δ H ° R T 2      
Integrating and rearranging Equation (14), we obtain
l n   ( K ) = Δ S ° R Δ H ° R T      
Additionally, Gibbs free energy is also given by
Δ G ° = Δ H ° T Δ S °              
The ∆ and ∆ values were calculated from the slope and intercept of the linear plot of ln(K) versus 1/T. Such parameters reflect the feasibility and spontaneous nature of the process [43]. Experiments were carried out using 50 mg L−1 dye solutions with 50 mg of BC-HVL or BS-HVL for 90 min at different temperatures. The apparent equilibrium constant K of the adsorption is calculated by Equation (10). The free energy of Gibbs of the adsorption Δ is calculated from Equation (11), the relationship between K and the temperature is given by the Van ’t Hoff equation [44] and the enthalpy and entropy can be gained from the slope and the interception of the Van ’t Hoff plot of ln(K) with respect to 1/T, which are shown in Figure 18.
The Temkin isotherm equation is
q e = B 1   l n   K T + B 1   l n ( C e )
The Dubinin–Radushkevich isotherm is expressed as follows:
l n ( q ) = l n ( q 0 ) K E 2
ε   =   RT   ln   ( 1 + 1 C e )
where ε is the Polanyi potential, K is the Dubinin–Radushkevich constant, R is the gas constant (8.31 Jmol−1 k−1), T is the absolute temperature and E is the mean adsorption energy.
In order to determine the thermodynamic parameters, the sorption studies were carried out at various temperatures (294, 303, 323 and 343 K). The values of ΔH° and ΔS° were calculated from the slope and intercept of plot between ΔG° vs. T. The calculated values of ΔH°, ΔS° and ΔG° are listed in Table 5. The negative free energy changes (ΔG°) at all the studied temperatures proposed that the adsorption of X-PR and MGC onto the BS-HVL and BC-HVL adsorbents was feasible and spontaneous thermodynamically. This shows an increased randomness at the solid solution interface throughout the fixation of the dye on the active sites of the adsorbent. The positive value of ΔH° further reveals that the adsorption is an endothermic process, demonstrating that the adsorption process decreases with an increase in temperature. The positive value of ΔS° infers that X-PR and MGC in the bulk phase (aqueous solution) were in a much more chaotic distribution in comparison to the relatively ordered state of the solid phase (surface of adsorbent). Additionally, the positive value of ΔS° represents a result of the affinity of the adsorbent for the two dyes.

4. Conclusions

In this work, we studied the possibility of using coproducts of plant origin as adsorbent systems for environmental pollutants. These materials are the starch-enriched and deproteinized barley seeds BS-HVL and BC-HVL. There are several reasons for using these materials. First, they may be used for the development of natural materials for specific applications in water depollution. The majority of organic flocculants, coagulants and adsorbents used in the field of water treatment are obtained from synthetic (petroleum) resources. The seeds we modified are abundant and cheap products, made from renewable, biodegradable and biocompatible agricultural raw materials. The second reason is in line with the development of sustainable chemistry. The BS-HVL and BC-HVL that were used are deproteinized fractions enriched with starch, a polysaccharide which presents very interesting modification chemistry. To simplify the optimization process, the effect of pH was first studied by a one-variable-at-a-time method, after which the influences of other parameters, such as sonication time, initial dye concentrations and adsorbent dosage were examined. The optimal conditions were pH 7, a dose of 0.05 g of BC-HVL or BS-HVL, a sonication time of 90 min, and initial concentrations of 50 mg L−1 for X-PR and MGC, respectively, which resulted in high removal percentages (91% for X-PR and 98% for MGC). In addition, the adsorption capacities were 71.6 mg g−1 and 44.8 mg g−1 for X-PR and 44.8 mg g−1 and 121.5 mg g−1 for MGC. The adsorption equilibrium study showed that both Langmuir and Freundlich models had adequate competence for the description and evaluation of the adsorption process. The kinetic study was performed at different time intervals. The results indicated that the adsorption processes can be fitted and predicted by the pseudo-second-order model with an adsorption capacity of 61.7 mg g−1 and 41.7 mg g−1 for X-PR and 54 mg g−1 and 41.8 mg g−1 for MGC. In a difficult economic context, characterized by increased competition on the polysaccharide market, cereal producers are wondering about the possibilities of novel applications for the products and wastes from this sector of activity.

Author Contributions

Conceptualization, F.E.M., F.C. and J.C.G.E.d.S.; methodology, F.E.M.; investigation, C.B., H.E.F., F.E.M., and M.H.Z.; resources, J.C.G.E.d.S.; data curation, F.E.M.; writing—original draft preparation, F.E.M.; writing—review and editing, F.C.; supervision, F.C., J.B., M.P.L. and J.C.G.E.d.S.; project administration, J.C.G.E.d.S. All authors have read and agreed to the published version of the manuscript.

Funding

This work was completed in the Faculty of Sciences of the University of Porto, within the framework of program Erasmus (Key Action 1, MOBILE+3). “Fundação para a Ciência e Tecnologia” (FCT, Portugal) is acknowledged for the project UIDB/00081/2020.

Institutional Review Board Statement

Not applicable.

Informed Consent Statement

Not applicable.

Data Availability Statement

Not applicable.

Conflicts of Interest

The authors declare no conflict of interest.

References

  1. EL Mansouri, F.; Palma Lovillo, M.; El Farissi, H.; Oufdou, H.; Brigui, J. Extraction, analysis of polyphenols and antioxidant properties of morrocan barley seed extracts (Hordeum vulgare L.). Mater. Today Proc. 2021, 43, 1896–1902. [Google Scholar] [CrossRef]
  2. Crini, G.; Badot, P.M. Traitement et Epuration des Eaux Industrielles Polluées; Presses Universitaires de Franche-Comté: Besançon, France, 2007; 353p. [Google Scholar]
  3. Crini, G. Non-conventional low-cost adsorbents for dye removal: A review. Bioresour. Technol. 2006, 97, 1061–1085. [Google Scholar] [CrossRef] [PubMed]
  4. Gupta, A.; Rastogi, V.K. Biosorption of lead (II) from aqueous solutions by non-living algal biomass Oedogonium sp. and Nostoc sp.—a comparative study. Colloids Surf. 2008, 64, 170–178. [Google Scholar] [CrossRef]
  5. Saini, J.; Garg, V.K.; Gupta, R.K.; Kataria, N. Removal of Orange G and Rhodamine B dyes from aqueous system using hydrothermally synthesized zinc oxide loaded activated carbon (ZnO-AC). J. Environ. Chem. Eng. 2017, 5, 884–892. [Google Scholar] [CrossRef]
  6. Gupta, A.; Rastogi, V.K.; Nayak, A. Biosorption of nickel onto treated alga (Oedo- gonium hatei): Application of isotherm and kinetic models. J. Colloid Interface Sci. 2010, 342, 533–539. [Google Scholar] [CrossRef]
  7. Gupta, P.R.; Gogate, H. Intensified removal of copper from waste water using activated watermelon based biosorbent in the presence of ultrasound. Ultrason. Sonochem. 2016, 30, 113–122. [Google Scholar] [CrossRef] [PubMed]
  8. Ghasemi, M.; Mashhadi, S.; Asif, M.; Tyagi, I.; Agarwal, S.; Kumar, V. Microwave-assisted synthesis of tetraethylenepentamine functionalized activated carbon with high adsorption capacity for Malachite green dye. J. Mol. Liq. 2016, 213, 317–325. [Google Scholar] [CrossRef]
  9. Parlayici, Ş. Alginate-coated perlite beads for the efficient removal of methylene blue, malachite green, and methyl violet from aqueous solutions: Kinetic, thermodynamic, and equilibrium studies. J. Anal. Sci. Technol. 2019, 10, 4. [Google Scholar] [CrossRef]
  10. Ismail, S.N.A.S.; Rahman, W.A.; Rahim, N.A.A.; Masdar, N.D.; Kamal, M.L. Adsorption of malachite green dye from aqueous solution using corn cob. AIP Conf. Proc. 2018, 2031, 020036. [Google Scholar]
  11. My Linh, N.L.; Duong, T.; Van Duc, H.; Thi Anh Thu, N.; Khac Lieu, P.; Van Hung, N.; Hoa, L.T.; Quang Khieu, D. Phenol Red Adsorption from Aqueous Solution on the Modified Bentonite. J. Chem. 2020, 2020, 1–14. [Google Scholar] [CrossRef]
  12. Masoudian, N.; Rajabi, M.; Ghaedi, M. Titanium oxide nanoparticles loaded onto activated carbon prepared from bio-waste watermelon rind for the efficient ultrasonic-assisted adsorption of congo red and phenol red dyes from wastewaters. Polyhedron 2019, 173, 114105. [Google Scholar] [CrossRef]
  13. Alebachew, N.; Yadav, O.P. Lokesh, Removal of Phenol Red Dye from Contaminated Water Using Barley (Hordeum vulgare L.) Husk-Derived Activated Carbon. Sci. Int. 2017, 5, 7–16. [Google Scholar]
  14. Grady, H.L.; Nonneman, D.J.; Rottinghaus, G.E.; Welshons, W.V. pH-dependent cytotoxicity of contaminants of phenol red for MCF-7 breast cancer cells. Endocrinology 1991, 129, 3321–3330. [Google Scholar] [CrossRef] [PubMed]
  15. Steffens, W.; Leider, U.; Wehring, D.; Hattop, W.H. Moglichkeiten und Gefahrn der Anwendung von Malachitgrun in der fischerei. Zeitshrift Fish. 1961, 10, 745–771. [Google Scholar]
  16. Werth, G.; Boiteaux, A. The toxicity of the triphenylmethane dyestuff malachite green, as an uncoupler of oxidative phosphorylation in vivo and in vitro. Arch. Toxicol. 1967, 23, 82–103. [Google Scholar]
  17. Meyer, F.P.; Jorgensen, T.A. Teratological and other effects of malachite green on the development of rainbow trout and rabbits. Trans. Am. Fish. Soc. 1983, 112, 818–824. [Google Scholar] [CrossRef]
  18. Srivastava, S.; Sinha, R.; Roy, D. Toxicological effects of malachite green. Aquat. Toxicol. 2004, 66, 319–329. [Google Scholar] [CrossRef]
  19. Hormazabal, V.; Steffenak, I.; Yndestad, M. A time and cost-effective assay for the determination of residues of malachite green in fish tissues by HPLC. J. Liquid Chromatogr. 1992, 15, 2035–2044. [Google Scholar] [CrossRef]
  20. Alderman, D.J.; Clifton-Hadley, R.S. Malachite green: A pharmacokinetic study in rainbow trout, Oncorhynchus mykiss (Walbaum). J. Fish Dis. 1993, 16, 297–311. [Google Scholar] [CrossRef]
  21. El Farissi, H.; Lakhmiri, R.; Albourine, A.; Safi, M. The adsorption of the orange acid dye 52 in aqueous solutions by the biochar of the seeds and shells of Cistus Ladaniferus. Int. J. Sci. Eng. Res. 2018, 9, 563–571. [Google Scholar]
  22. El Fargani, H.; Lakhmiri, R.; El Farissi, H.; Albourine, A.; Safi, M.; Cherkaoui, O. Modified Chitosan Immobilized on Modified Sand for Industrial Wastewater Treatment in Multicomponent Sorption: Shrimp Biowaste Processing. Chem. Mater. Res. 2017, 9, 20–42. [Google Scholar]
  23. El Farissi, H.; Lakhmiri, R.; Albourine, A.; Safi, M.; Cherkaoui, O. Removal of anionic dyes from aqueous solutions by cistus ladaniferus shells and their biochar: Isotherms, kinetic and thermodynamic studies. Int. J. Sci. Eng. Res. 2018, 9, 200–211. [Google Scholar] [CrossRef]
  24. El Farissi, H.; Lakhmiri, R.; Albourine, A.; Safi, M.; Cherkaoui, O. Adsorption study of charcoal of cistus ladaniferus shell modified by H3PO4 and NaOH used as a low-cost adsorbent for the removal of toxic reactive red 23 dye: Kinetics and thermodynamics. Mater. Today Proc. 2020. [Google Scholar] [CrossRef]
  25. Lagergren, S. Zur theorie der sogenannten adsorption gel osterstoffe. Kungliga Svenska Vetenskapsakademiens. Handlingar 1898, 124, 1–13. [Google Scholar]
  26. Ho, Y.S.; McKay, G. Pseudo-second order model for sorption processes. Process Biochem. 1999, 34, 451–465. [Google Scholar] [CrossRef]
  27. Chien, S.H.; Clayton, W.R. Application of Elovich equation to the kinetics of phosphate release and sorption in soils. Soil Sci. Soc. Am. J. 1980, 44, 265–268. [Google Scholar] [CrossRef]
  28. Urano, K.; Hirotaka, T. Process Development for Removal and Recovery of Phosphorus from Wastewater by a New Adsorbent. 2. Adsorption Rates and Breakthrough Curves. Ind. Eng. Chem. Res. 1991, 30, 1897–1899. [Google Scholar] [CrossRef]
  29. Langmuir, I. The adsorption of gases on plane surfaces of glass, mica and platinum. J. Am. Chem. Soc. 1918, 40, 1361–1403. [Google Scholar] [CrossRef] [Green Version]
  30. Das, S.K.; Bhowal, J.; Das, A.R.; Guha, A.K. Adsorption Behavior of Rhodamine B on Rhizopus oryzae Biomass. Langmuir 2006, 22, 7265–7272. [Google Scholar] [CrossRef]
  31. Sewu, D.D.; Boakye, P.; Woo, S.H. Highly efficient adsorption of cationic dye by biochar produced with Korean cabbage waste. Bioresour. Technol. 2017, 224, 206–213. [Google Scholar] [CrossRef]
  32. Popa, N.; Visa, M. The synthesis, activation and characterization of charcoal powder for the removal of methylene blue and cadmium from wastewater. Adv. Powder Technol. 2017, 28, 1866–1876. [Google Scholar] [CrossRef]
  33. Islam, M.T.; Hyder, A.G.; Saenz-Arana, R.; Hernandez, C.; Guinto, T.; Ahsan, M.A.; Alvarado-Tenorio, B.; Noveron, J.C. Removal of methylene blue and tetracycline from water using peanut shell derived adsorbent prepared by sulfuric acid reflux. J. Environ. Chem. Eng. 2019, 7, 102816. [Google Scholar] [CrossRef]
  34. Isa, K.M.; Daud, S.; Hamidin, N.; Ismail, K.; Saad, S.A.; Kasim, F.H. Thermogravimetric analysis and the optimisation of bio-oil yield from fixed-bed pyrolysis of rice husk using response surface methodology (RSM). Ind. Crops Prod. 2011, 33, 481–487. [Google Scholar] [CrossRef]
  35. Núñez-gómez, D.; Rodrigues, C.; Rubens, F. Adsorption of heavy metals from coal acid mine drainage by shrimp shell waste: Isotherm and continuous-flow studies. J. Environ. Chem. Eng. 2019, 7, 1–10. [Google Scholar] [CrossRef]
  36. Dash, S.; Chaudhuri, H.; Gupta, R.; Nair, U.G. Adsorption Study of Modified Coal Fly Ash with Sulfonic Acid as a Potential Adsorbent for the Removal of Toxic Reactive Dyes from Aqueous Solution: Kinetics and Thermodynamics. J. Environ. Chem. Eng. 2018, 6, 5897–5905. [Google Scholar] [CrossRef]
  37. El Farissi, H.; Lakhmiri, R.; Albourine, A.; Safi, M.; Cherkaoui, O. Removal of RR-23 dye from industrial textile wastewater by adsorption on cistus ladaniferus seeds and their biochar. J. Environ. Earth Sci. 2017, 7, 105–118. [Google Scholar]
  38. El Fargani, H.; Lakhmiri, R.; El Farissi, H.; Albourine, A.; Safi, M.; Cherkaoui, O. Removal of anionic dyes by silica-chitosan composite in single and binary systems: Valorization of shrimp co- product Crangon-Crangon and Pandalus Borealis. J. Mater. Environ. Sci. 2017, 8, 724–739. [Google Scholar]
  39. Chen, S.; Zhang, J.; Zhang, C.; Yue, Q.; Li, Y.; Li, C. Equilibrium and kinetic studies of methyl orange and methyl violet adsorption on activated carbon derived from Phragmites australis. Desalination 2010, 252, 149–156. [Google Scholar] [CrossRef]
  40. Zhao, D.; Zhang, W.; Chen, C.; Wang, X. Adsorption of Methyl Orange Dye Onto Multiwalled Carbon Nanotubes. Procedia Environ. Sci. 2013, 18, 890–895. [Google Scholar] [CrossRef] [Green Version]
  41. Nourmoradi, H.; Moghadam, K.F.; Jafari, A.; Kamarehie, B. Removal of Acetaminophen and Ibuprofen from Aqueous Solutions by Activated Carbon Derived from Quercus Brantii (Oak) Acorn as a Low-cost Biosorbent. J. Environ. Chem. Eng. 2018, 6, 6807–6815. [Google Scholar] [CrossRef]
  42. Jin, G.P.; Wang, X.L.; Fu, Y.; Do, Y. Preparation of tetraoxalyl ethylenediamine melamine resin grafted-carbon fibers for nano-nickel recovery from spent electroless nickel plating baths. Chem. Eng. J. 2012, 203, 440–446. [Google Scholar] [CrossRef]
  43. Mahjoub, B.; Ncibi, M.C.; Seffen, M. Adsorption of a Reactive Textile Dye on a Non-Conventional Biosorbent: The Fibers of Posidonia Oceanica (L.) Delile. Can. J. Chem. Eng. 2008, 86, 23–29. (In French) [Google Scholar] [CrossRef]
  44. Mane, V.S.; Vijay Babu, P.V. Studies on the adsorption of Brilliant Green dye from aqueous solution onto low-cost NaOH treated saw dust. Desalination 2011, 273, 321–329. [Google Scholar] [CrossRef]
Figure 1. The chemical structure of dyes (a) malachite green carbinol and (b) x-phenol red.
Applsci 11 05125 g001
Figure 2. X-ray diffractograms of BS-HVL (a) and BC-HVL (b).
Applsci 11 05125 g002
Figure 3. X-ray diffractograms of BS-HVL (a) and BC-HVL (b) with identifying crystals.
Applsci 11 05125 g003
Figure 4. SEM (scanning electron microscopy) micrographs before adsorption of the dye on BS-HVL (a) and BC-HVL (b).
Applsci 11 05125 g004
Figure 5. EDXA (energy dispersive X-ray analysis) diffractograms after adsorption of the dye on BS-HVL (a) and BC-HVL (b).
Applsci 11 05125 g005
Figure 6. SEM micrographs after adsorption with micrographs of element present in BS-HVL (a) and BC-HVL (b).
Applsci 11 05125 g006
Figure 7. EDXA (energy dispersive X-ray analysis) diffractograms after adsorption of the BS-HVL (a) and BC-HVL (b).
Applsci 11 05125 g007
Figure 8. AFM (atomic force microscopy) micrographs of BS-HVL (ac) and BC-HVL (d).
Applsci 11 05125 g008
Figure 9. FTIR (fourier transform infrared spectroscopy) spectra of BS−HVL and BC−HVL.
Applsci 11 05125 g009
Figure 10. FTIR spectra of BS−HVL (X−PR), BS−HVL (MGC), BC−HVL (X−PR) and BC−HVL (MGC) after adsorption showing the appearance of the new functional groups in the BC-HVL.
Applsci 11 05125 g010
Figure 11. (a,b): Effect of pH on the adsorption of dyes X-PR and MGC by BS-HVL and BC-HVL (t = 90 min; T = 21 ± 1 °C; mad = 50 mg; Co = 50 mg L−1 and stirring speed 150 rpm).
Applsci 11 05125 g011
Figure 12. Effect of the amount of adsorbent BS-HVL (a) and BC-HVL (b) on the adsorption of dyes X-PR and MGC (t = 90 min; T = 21 ± 1 °C; C0 = 50 mg L−1; stirring speed 150 rpm and pH = 7 ± 0.3).
Applsci 11 05125 g012
Figure 13. Effect of the initial dye concentration on the adsorption of X-PR and MGC by BS-HVL (a) and BC-HVL (b) (t = 90 min; T = 21 ± 1 °C; mad = 50 mg; stirring speed 150 rpm and pH = 7 ±0.3).
Applsci 11 05125 g013
Figure 14. Effect of contact time on the adsorption of the two dyes X-PR and MGC by BS-HVL (a) and BC-HVL (b) (T = 21 ± 1 °C; mad = 50 mg; Co = 50 mg L−1; stirring speed 150 rpm and pH = 7 ± 0.3).
Applsci 11 05125 g014
Figure 15. Kinetic models of the adsorption of the dyes X−PR and MGC by BS-HVL (T = 21 ± 1 °C; mad = 50 mg; Co = 50 mg L−1; stirring speed 150 rpm and pH = 7 ± 0.3).
Applsci 11 05125 g015
Figure 16. Kinetic models of the adsorption of the dyes X-PR and MGC by BC-HVL (T = 21 ± 1 °C; mad = 50 mg; C0 = 50 mg·L−1; stirring speed 150 rpm and pH = 7 ± 0.3).
Applsci 11 05125 g016
Figure 17. Langmuir isotherms for the adsorption of (a) X-PR and (b) MGC by BS-HVL (t = 90 min; T = 21 ± 1 °C; mad = 50 mg; stirring speed 150 rpm and pH = 7 ± 0.3). Langmuir isotherms for the adsorption of (c) X-PR and (d) MGC by BC-HVL (t = 90 min; T = 21 ± 1 °C; mad = 50 mg; stirring speed 150 rpm and pH = 7 ± 0.3).
Applsci 11 05125 g017
Figure 18. Representation of ln(Kc) as a function of 1/T for determining the thermodynamic parameters of component X-PR and MGC dyes on the BS-HVL and BC-HVL (t = 90 min; mad = 50 mg; C0 = 50 mg L−1, pH = 7 ± 0.3, stirring speed 150 rpm).
Applsci 11 05125 g018
Table 1. Adsorption kinetic constants of X-PR and MGC by BS-HVL (T = 21 ± 1 °C; mad = 50 mg; C0 = 50 mg L−1; stirring speed 150 rpm and pH = 7 ± 0.3).
Models BS-HVLBC-HVL
X-PRMGCX-PRMGC
Pseudo-first-orderR20.91790.95460.91270.9333
K1 (min−1)0.0450.05650.04010.0551
qe (mg g−1)44.781772.363340.800766.4201
Pseudo-second-orderR20.93790.99690.96470.9692
K2 (g mg−1 min−1)0.00050.00110.00060.0007
qe (mg g−1)61.728354.054041.666741.8410
ElovichR20.91010.97420.94290.9341
α (mg g−1 min−1)3.65287.86532.12512.6571
β (g mg−1)0.06740.09130.10710.1073
Intraparticle diffusionR20.79690.91910.95190.9306
Ki (mg g−1 min0.5)4.24883.25542.87093.3419
C (mg g−1)5.322814.7331.09593.3419
Table 2. Adsorption isotherms constants of X-PR and MGC on BS-HVL and BC-HVL (T = 21 ± 1 °C; t = 90 min, mad = 50 mg; stirring speed 150 rpm and pH = 7± 0.3).
ModelsConstantsBS-HVLBC-HVL
X-PRMGCX-PRMGC
LangmuirR20.99540.89530.62710.8954
RL0.1862–0.69580.0089–0.08230.0405–0.29680.0099–0.9091
KL (L mg−1)0.04371.1150.23691
qm (mg g−1)71.6425044.843121.95
FreundlichR20.99540.9770.75290.9927
KF (L mg−1)4.40175.190813.56376.2883
n0.99750.98763.53850.8011
TemkinR20.87930.91950.58010.9441
KT (L mg−1)0.10740.11170.11040.6773
B1 (J mol−1)7.4986.4276.687745.011
b325.3889380.1369365.318454.2787
Dubinin–
Radushkevich
R20.69430.76480.41480.8968
Kad (mol2 KJ−2)20 × 10−530 × 10−50.04 × 10−51 × 10−5
E (KJ mol−1)15.811412.909935.356370.7108
qm (mg g−1)11.580210.712431.500471.715
Table 3. Analysis of variance (F-test) of the effects on the adsorption of X-PR and MGC in the two biomaterials BS-HVL and BC-HVL.
Type of AnalysisParameter StudyType of SampleMeanStd. Error95% Confidence IntervalTest ANOVA
Lower BoundUpper BoundFSig.
Effect of pH on the adsorption capacity of X-PR and MGCAdsorption capacity, X-PR,
(mg g−1)
BS-HVL30.7372.24424.96636.508019.7350.001
S
BC-HVL14.9182.7647.81222.023
Adsorption capacity, MGC, (mg g−1)BS-HVL22.6904.10412.13933.2411.7840.211
NS
BC-HVL16.0112.8558.67023.353
Effect of adsorbent dose on adsorption yield of X-PR and MGCAdsorption yield,
X-PR, (%)
BS-HVL46.3005.62133.5859.020.3600.556
NS
BC-HVL42.1004.16532.6851.52
Adsorption yield,
MGC, (%)
BS-HVL63.3008.01345.1781.430.0340.855
NS
BC-HVL61.2008.02343.0579.35
Effect of concentration on the adsorption capacity of X-PR and MGCAdsorption capacity, X-PR, (mg g−1)BS-HVL51.5789.27022.28480.8713.5370.076
NS
BC-HVL31.8974.87216.49847.295
Adsorption capacity, MGC, (mg g−1)BS-HVL46.0727.71521.69170.4520.1050.749
NS
BC-HVL49.8598.77422.13177.587
Effect of contact time on adsorption capacity of
X-PR and MGC
Adsorption capacity, X-PR, (mg g−1)BS-HVL37.9203.66926.32349.51713.6700.001 S
BC-HVL23.2502.33315.87530.625
Adsorption capacity, MGC, (mg g−1)BS-HVL39.7502.65531.35848.14220.2780.000
S
BC-HVL25.332.33017.96532.695
Effect of temperature on adsorption of X-PR and MGCAdsorption capacity, X-PR, (mg g−1)BS-HVL43.021.09839.54846.49213.0030.011
S
BC-HVL49.31350.1048.96649.660
Adsorption capacity, MGC, (mg g−1)BS-HVL32.871.15829.21036.53075.5220.000
S
BC-HVL48.85100.11548.48449.217
Values are averages ± standard deviation of triplicate analysis. Data obtained were subjected to one-way analysis of variance (ANOVA). NS: nonsignificant (p > 0.05); S: significant (p < 0.05).
Table 4. The adsorption capacity of dyes and heavy metals in aqueous solutions by activated carbons of different biomass.
AdsorbateAdsorbent PollutantsDose (mg)C0
(mg L−1)
pHKineticIsothermqm
(mg g−1)
Ref.
Zinc oxide loaded activated char (ZnO-AC)OG
Rh-b
8–30507Pseudo-second-orderLangmuir153.8
128.2
[5]
Rice straw (RS) biochar
Wood chip (WC) biochar
CV-CR015007Pseudo-second-orderLangmuir620.3
195.6
[31]
Charcoal (tree branches)
(BCA-TiO2)
MB
Cd2+
**
**
0.4
600
7
8
Pseudo-second-order**200
250
[32]
Sulfonated peanut shell
(PNS-SO3H)
MB
TC
20900
ppm
10Pseudo-second-orderLangmuir1250
303
[33,34]
Shrimp shell (SS)
Coal acid mine drainage
(AMD)
Mn
Fe
**≤1
≤15
6–9
5–9
Pseudo-second-orderFrendlich17.43
3.87
[35]
Coal fly ash (CFA)MG
RG
40
30
100
ppm
8Pseudo-second-orderLangmuir233.3
381.7
[36]
Biomass CLS
Biochar (BCCLS)
RR-2350507Pseudo-second-orderLangmuir62.5
166.67
[37]
Biomass CLSh
Biochar (BCCLSh)
RR-2350507Pseudo-second-orderLangmuir90.91
354.82
[24]
Biochar BC CLS
Biochar (BCCLSh)
AO-52503007Pseudo-second-orderLangmuir333.33
500
[22]
Silica-Chitosan CompositeRR-23
RB19
40607Pseudo-second-orderLangmuir128.2
156.25
[38]
Chitosan Composite MCs/MSRR-23
RB19
Fe2+
70507Pseudo-second-orderLangmuir
Frendlich
Frendlich
71.94
175.44
62.11
[23]
Activated Carbon derived from Phragmites AustralisMO
MV
50
50
500
400
**Pseudo-second-orderLangmuir238.11
476.19
[39]
Carbon nanotubes (CNTs)MO200
mg L−1
10**Pseudo-second-orderLangmuir55.2[40]
Carbon of Quercus Brantii (Oak)ACT
IBP
1 g L−11007Pseudo-second-orderFreundlich45.45
96.15
[41]
BS−HVLX−PR50507Pseudo-second-orderLangmuir-Freundlich71.642This work
BS−HVLMGC50507Pseudo-second-orderFreundlich44.843
BS−HVLX−PR50507Pseudo-second-orderFreundlich44.843
BS−HVLMGC50507Pseudo-second-orderFreundlich121.95
** undetermined.
Table 5. Thermodynamic parameters for the adsorption of X-PR and MGC onto BS-HVL and BC-HVL (mad = 50 mg; C0 = 50 mg L−1; pH = 7 ± 0.3 and stirring speed 150 rpm).
ParametersBS-HVLBC-HVL
X-PRMGCX-PRMGC
ΔH° (kJ mol−1)23.5512.75721.17913.386
ΔS° (J mol−1 K−1)90.79746.074103.73474.759
ΔG° (kJ mol−1)T = 294 K−27.034−13.533−30.477−21.966
T= 303 K−27.942−13.948−31.410−22.639
T= 323 K−29.758−14.869−33.485−24.134
T= 343 K−30.666−15.791−35.560−25.629
Publisher’s Note: MDPI stays neutral with regard to jurisdictional claims in published maps and institutional affiliations.

