
Rotordynamic Analysis of Piezoelectric Gas Foil Bearings with a Mechanical Preload Control Based on Structural Parameter Identifications


Department of Mechanical System Design Engineering, Seoul National University of Science and Technology, Seoul 139-743, Korea
*
Author to whom correspondence should be addressed.
Appl. Sci. 2021, 11(5), 2330; https://doi.org/10.3390/app11052330
Submission received: 4 January 2021
/
Revised: 21 February 2021
/
Accepted: 26 February 2021
/
Published: 5 March 2021
(This article belongs to the Special Issue Turbomachinery: Design and Applied Sciences)
Abstract
:This paper presents a rotordynamic analysis and experimental characterization of a novel concept of a controllable gas foil bearing (C-GFB) with piezoelectric (PZT) actuators. The C-GFB consists of bump foil structures and three PZT actuators, and the PZT actuators push the bump foil structures in different displacements according to the driving voltage, enabling preload control. In order to predict the piezoelectric preload according to the driving voltage, an equivalent spring model for PZT actuators and foil structures is introduced. In addition, PZT parameters (a piezoelectric constant and stiffness) are measured through parameter identification tests using a latch. Next, static lubrication analysis for C-GFB reveals that the gas-film pressure reduces the effect of piezoelectric preload by up to a maximum of 11%, because the piezoelectric actuator has structural compliance so that it is structurally deformed by the pressure. Finally, nonlinear orbit simulation is performed, and the performance of real-time vibration control of C-GFB is evaluated. The real-time preload control is carried out at ~32.6 krpm, where the rotordynamic instability sufficiently occurs. As the driving voltage increases, the instability suppression and delay effect increase. In particular, when controlled at 150 V, the onset speed of the instability increases to 79.1 krpm. Consequently, this study demonstrates that the GFB with piezoelectric preloads is a simple, effective, and real-time method to improve the rotordynamic stability.
1. Introduction
Gas foil bearings (GFBs), i.e., bump-type hydrodynamic gas-lubricated bearings, exhibit a number of advantages over oil-lubricated bearings, such as fluid-film plain journal bearings or rolling element bearings. They do not require an oil lubrication system consisting of complex components that enable oil to circulate and lubricate bearings with low friction. Their outstanding characteristics include high-speed operations, extreme temperature capabilities, and reduced maintenance [1,2]. In addition, their compliant structure consisting of bump and top foils increases their load-carrying capacity [3] and provides additional dry-friction damping [4,5]. They also provide a variety of other advantages, such as simple design, light weight, high durability, and high-temperature operation.
Although GFBs exhibit these advantages, they undergo subsynchronous motion with highly fluctuating amplitude in some cases. This is defined as a dynamic problem linked intrinsically to the behavior of the fluid film within a bearing referred to as oil whirl and oil whip. This occurs typically when damped natural modes become unstable at the first critical speed [6,7]. Subsynchronous motion is the primary cause of rotordynamic instability. In certain cases, the nonlinearity of the compliant structure of the GFBs can cause rotordynamic instability [8]. Many studies have been conducted and various designs of GFBs have been proposed to prevent and resolve this instability.
Attempts have been made to modify the inner surface shape of the GFB to achieve improved performance. Kim and San Andrés [8] inserted three metal shims into bearing structures to introduce mechanical preloads. They examined the effects of the mechanical preloads on the rotordynamic behavior. It was revealed that preloads decrease the difference between two cross-coupled stiffness coefficients of the gas film, which results in reduced rotordynamic instability. Furthermore, the effects of the combination of mechanical preloads and bearing clearance were studied by Sim et al. [9]. They demonstrated that an optimal combination of preload and clearance exists with regard to rotordynamic stability and bearing friction. Similarly, Schiffmann et al. [10] studied an optimum bearing-preload pattern and demonstrated that the mechanical preload should be designed based on GFB design variables.
The principle underlying the mechanical preload is to develop a wedge shape between the bearing surface and a journal, and to enhance the hydrodynamic pressure at the preload locations. This results in increased direct stiffness and damping coefficients, and a variation in the journal equilibrium position (expressed as eccentricity and attitude angle). As a result, rotordynamic stability is improved. These solutions are simple and effective.
However, they also exhibit limitations, such as reduced bearing performance at low rotor speeds [11,12] owing to a decrease in film thickness, and the inability to respond instantaneously to variations in operation conditions such as rotor speed and external excitation.
Recently, several studies addressing these issues have been performed by introducing piezoelectric (PZT) actuators in gas bearings, which are referred to as active or controllable gas bearings.
Pfau and Markert [13] proposed an active oil bearing with film thickness adjustment using a PZT actuator. Its bearing consisted of two horizontal segments. The lower segment was fixed, whereas the upper segment was movable in a vertical direction by the actuator, with a maximum stroke of 200 μm. They controlled the actuator to obtain different mechanical preloads depending on the rotor speed and demonstrated that the control could effectively alter synchronous motions. Meanwhile, Sadri et al [14] used patch-type PZT actuators. These deform the supporting shells of the bearing substructure to control the radial clearance of GFBs. They focused on investigation for structural conformity of the bearing concept with the actuator activation, via an experimental approach to measure the inner shape of a deformed bearing.
Park and Sim [15] presented a controllable GFB concept that can control mechanical preloads as well as the bearing clearance via PZT actuators. The bearing consists of nine actuators located in the bearing housing in the circumferential direction and bearing guides that support the foil structures connected to the PZTs. The authors established an analytical model of the PZTs using the inverse piezoelectric effect. They applied it to the traditional prediction model of the GFB based on the Reynolds equation. They observed that in terms of bearing performance, the clearance control of the bearing significantly affected the variation in the direct stiffness and damping coefficients. Meanwhile, the preload control affected the cross-coupling effect considerably.
Feng et al. [11] introduced PZT actuators into GFBs to control mechanical preloads. A proposed bearing concept comprises six PZTs located in the bearing cartridge to produce deformation in their thickness directions, and three lever amplifiers to amplify the deformation of the actuators. A static load test on the bearing indicated that PZT control could produce mechanical preloads in tens of micrometers depending on the driving voltage of the actuators. Finally, the authors revealed that PZT control could alter the journal equilibrium position and dynamic force coefficients of the fluid film. After that, Guan et al. [12] applied the identical bearing concept to an impulse turbine and performed experiments to investigate the effect of PZT control on the amplitudes of oil whirl and oil whip vibrations. The results indicate that an increase in the driving voltage results in remarkably suppressed subsynchronous motions of the system.
This work aims to evaluate the feasibility and effectiveness of controllable gas foil bearings’ (C-GFB) control performance in real time. The PZT actuators are used as active mechatronic elements to control the mechanical preloads of the C-GFB. The equivalent spring model for PZT actuators and foil structures is introduced to predict top foil shape depending on the driving voltages of the actuators. The spring model is then coupled with a theoretical analysis model of GFBs for evaluating the effects of PZT actuator activations on bearing performance. Finally, nonlinear orbit simulation with the real-time PZT control is performed. In addition, the effectiveness and feasibility of the C-GFB for stabilizing the subsynchronous motions of the journal are discussed.
2. Concept and Design of C-GFB
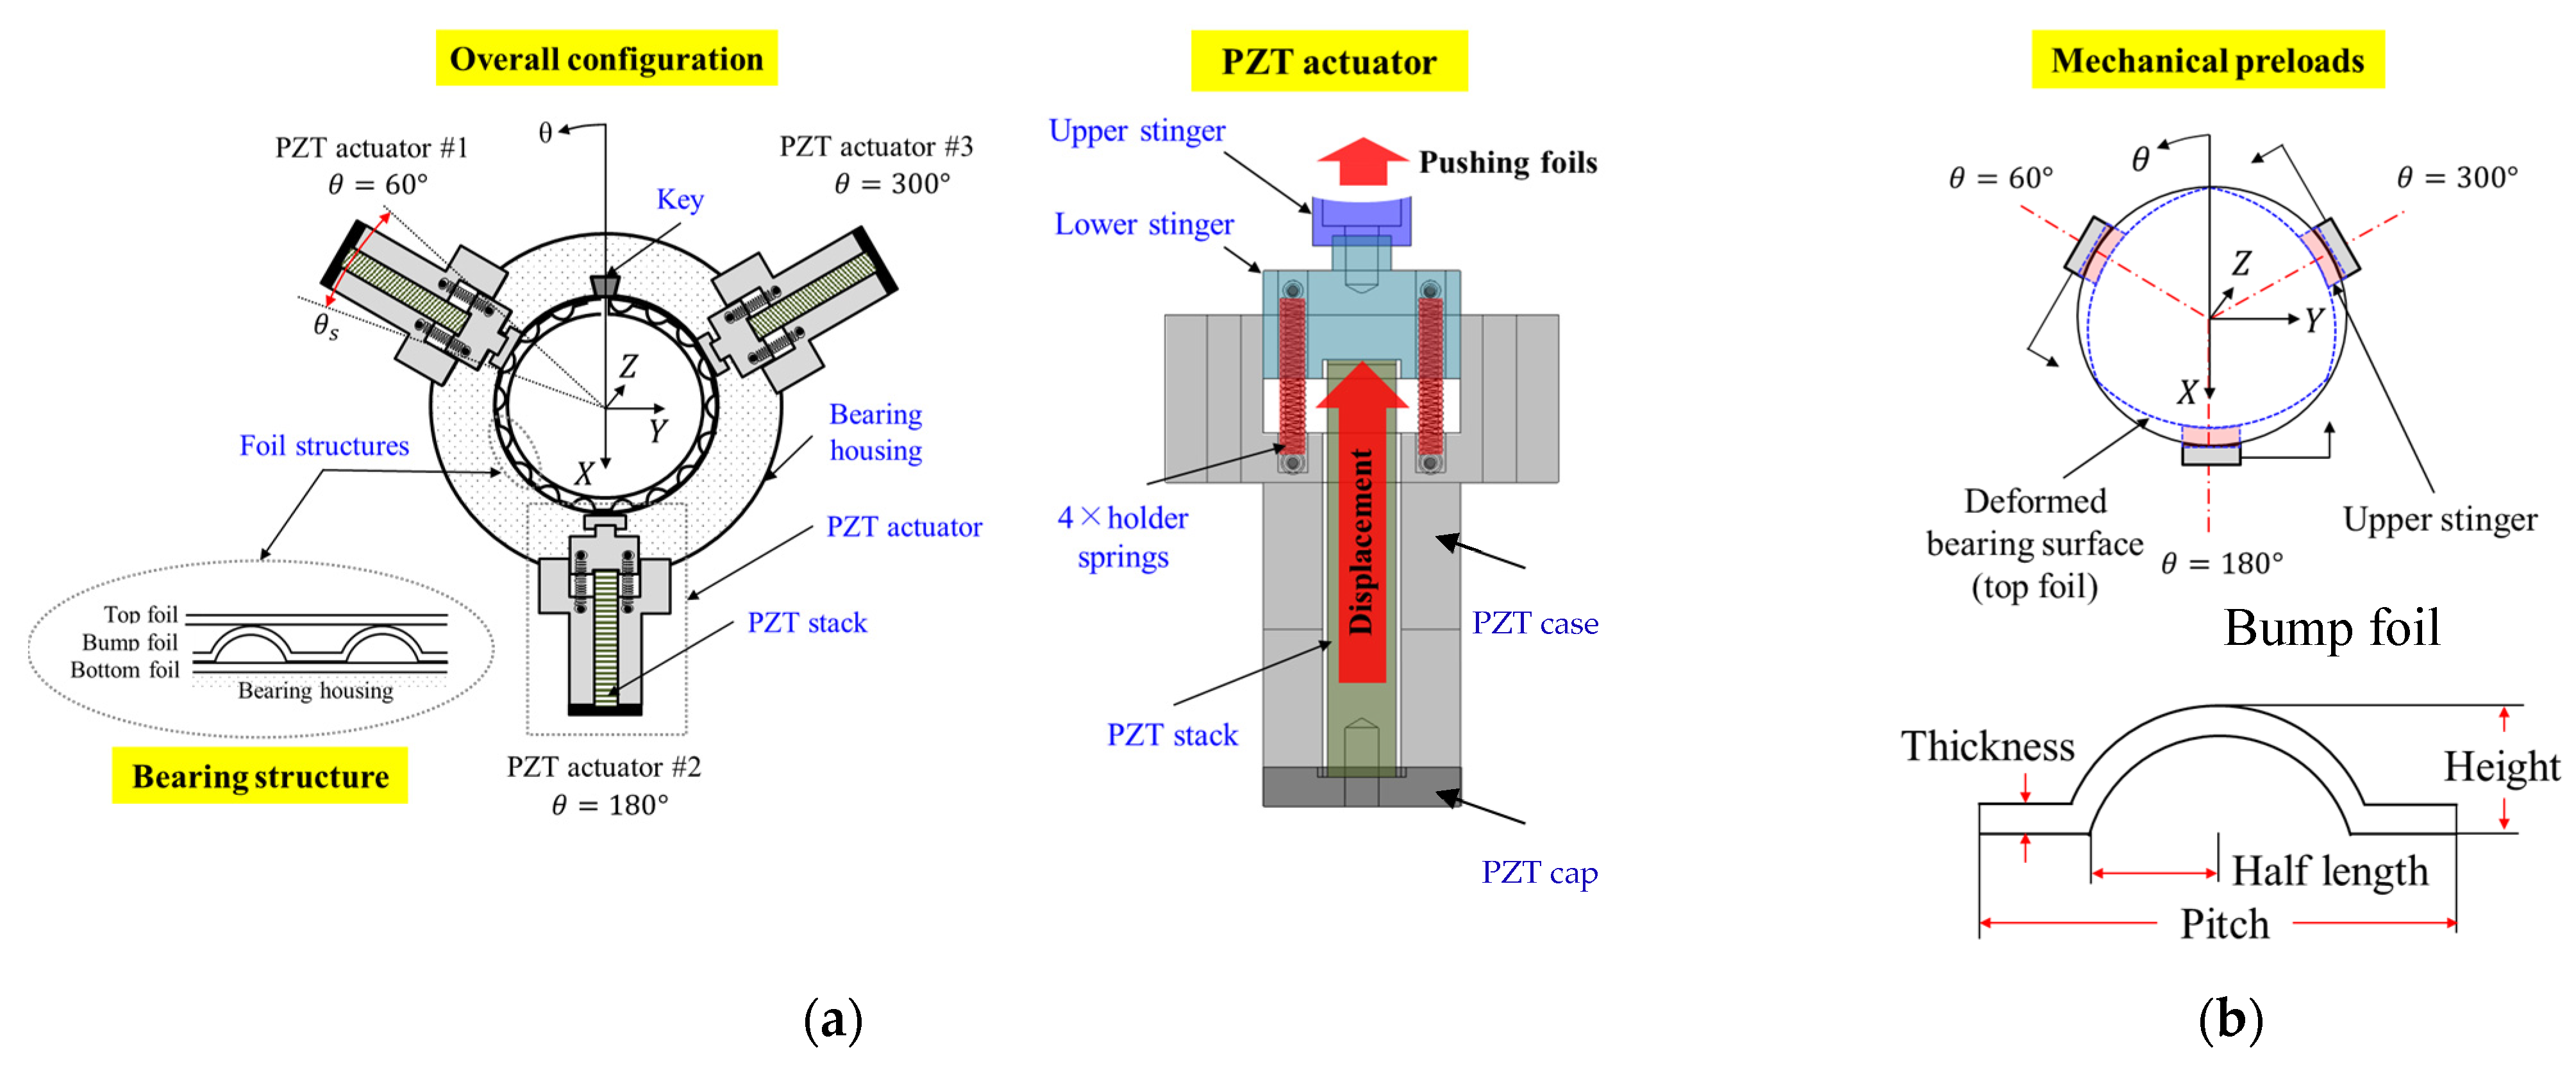
Figure 1 presents a detailed illustration of the proposed C-GFB with PZT actuators: (a) overall configuration of C-GFB with PZT actuators and (b) bearing preload principle when actuators are electrified with certain driving voltages. The origin of the stationary X, Y, Z coordinate system is located at the center of the bearing. The circumferential coordinate θ is defined counterclockwise from the negative X-axis. The detailed design parameters of the C-GFB are listed in Table 1.
The bearing consists of a bearing housing, bearing key, foil structures, and three PZT actuators. The foil structures are laminated structures including a top, bump, and bottom foil. A PZT actuator generates mechanical preloads with a PZT stack generating piezoelectric displacement in its thickness direction. The PZT actuators are assembled with the bearing housing at the angular locations of 60°, 180°, and 300°. The angular length of the upper stingers is 27.7°.
The PZT actuator is composed of the moving parts (upper and lower stingers) and the stationary parts (PZT case and PZT cap). The upper stinger is in contact with the foil structures and pushes the foils toward a bearing center when the PZT actuators are electrified with certain driving voltages, thereby providing a mechanical preload. The lower stinger is connected to the PZT case which is fixed to the bearing housing by four holder springs that provide the PZT stack with tension. The holder springs provide tension to allow the upper stinger to return to its original position when the stroke of the PZT stack decreases. This facilitates the moving parts to move accurately in line with the PZT displacement.
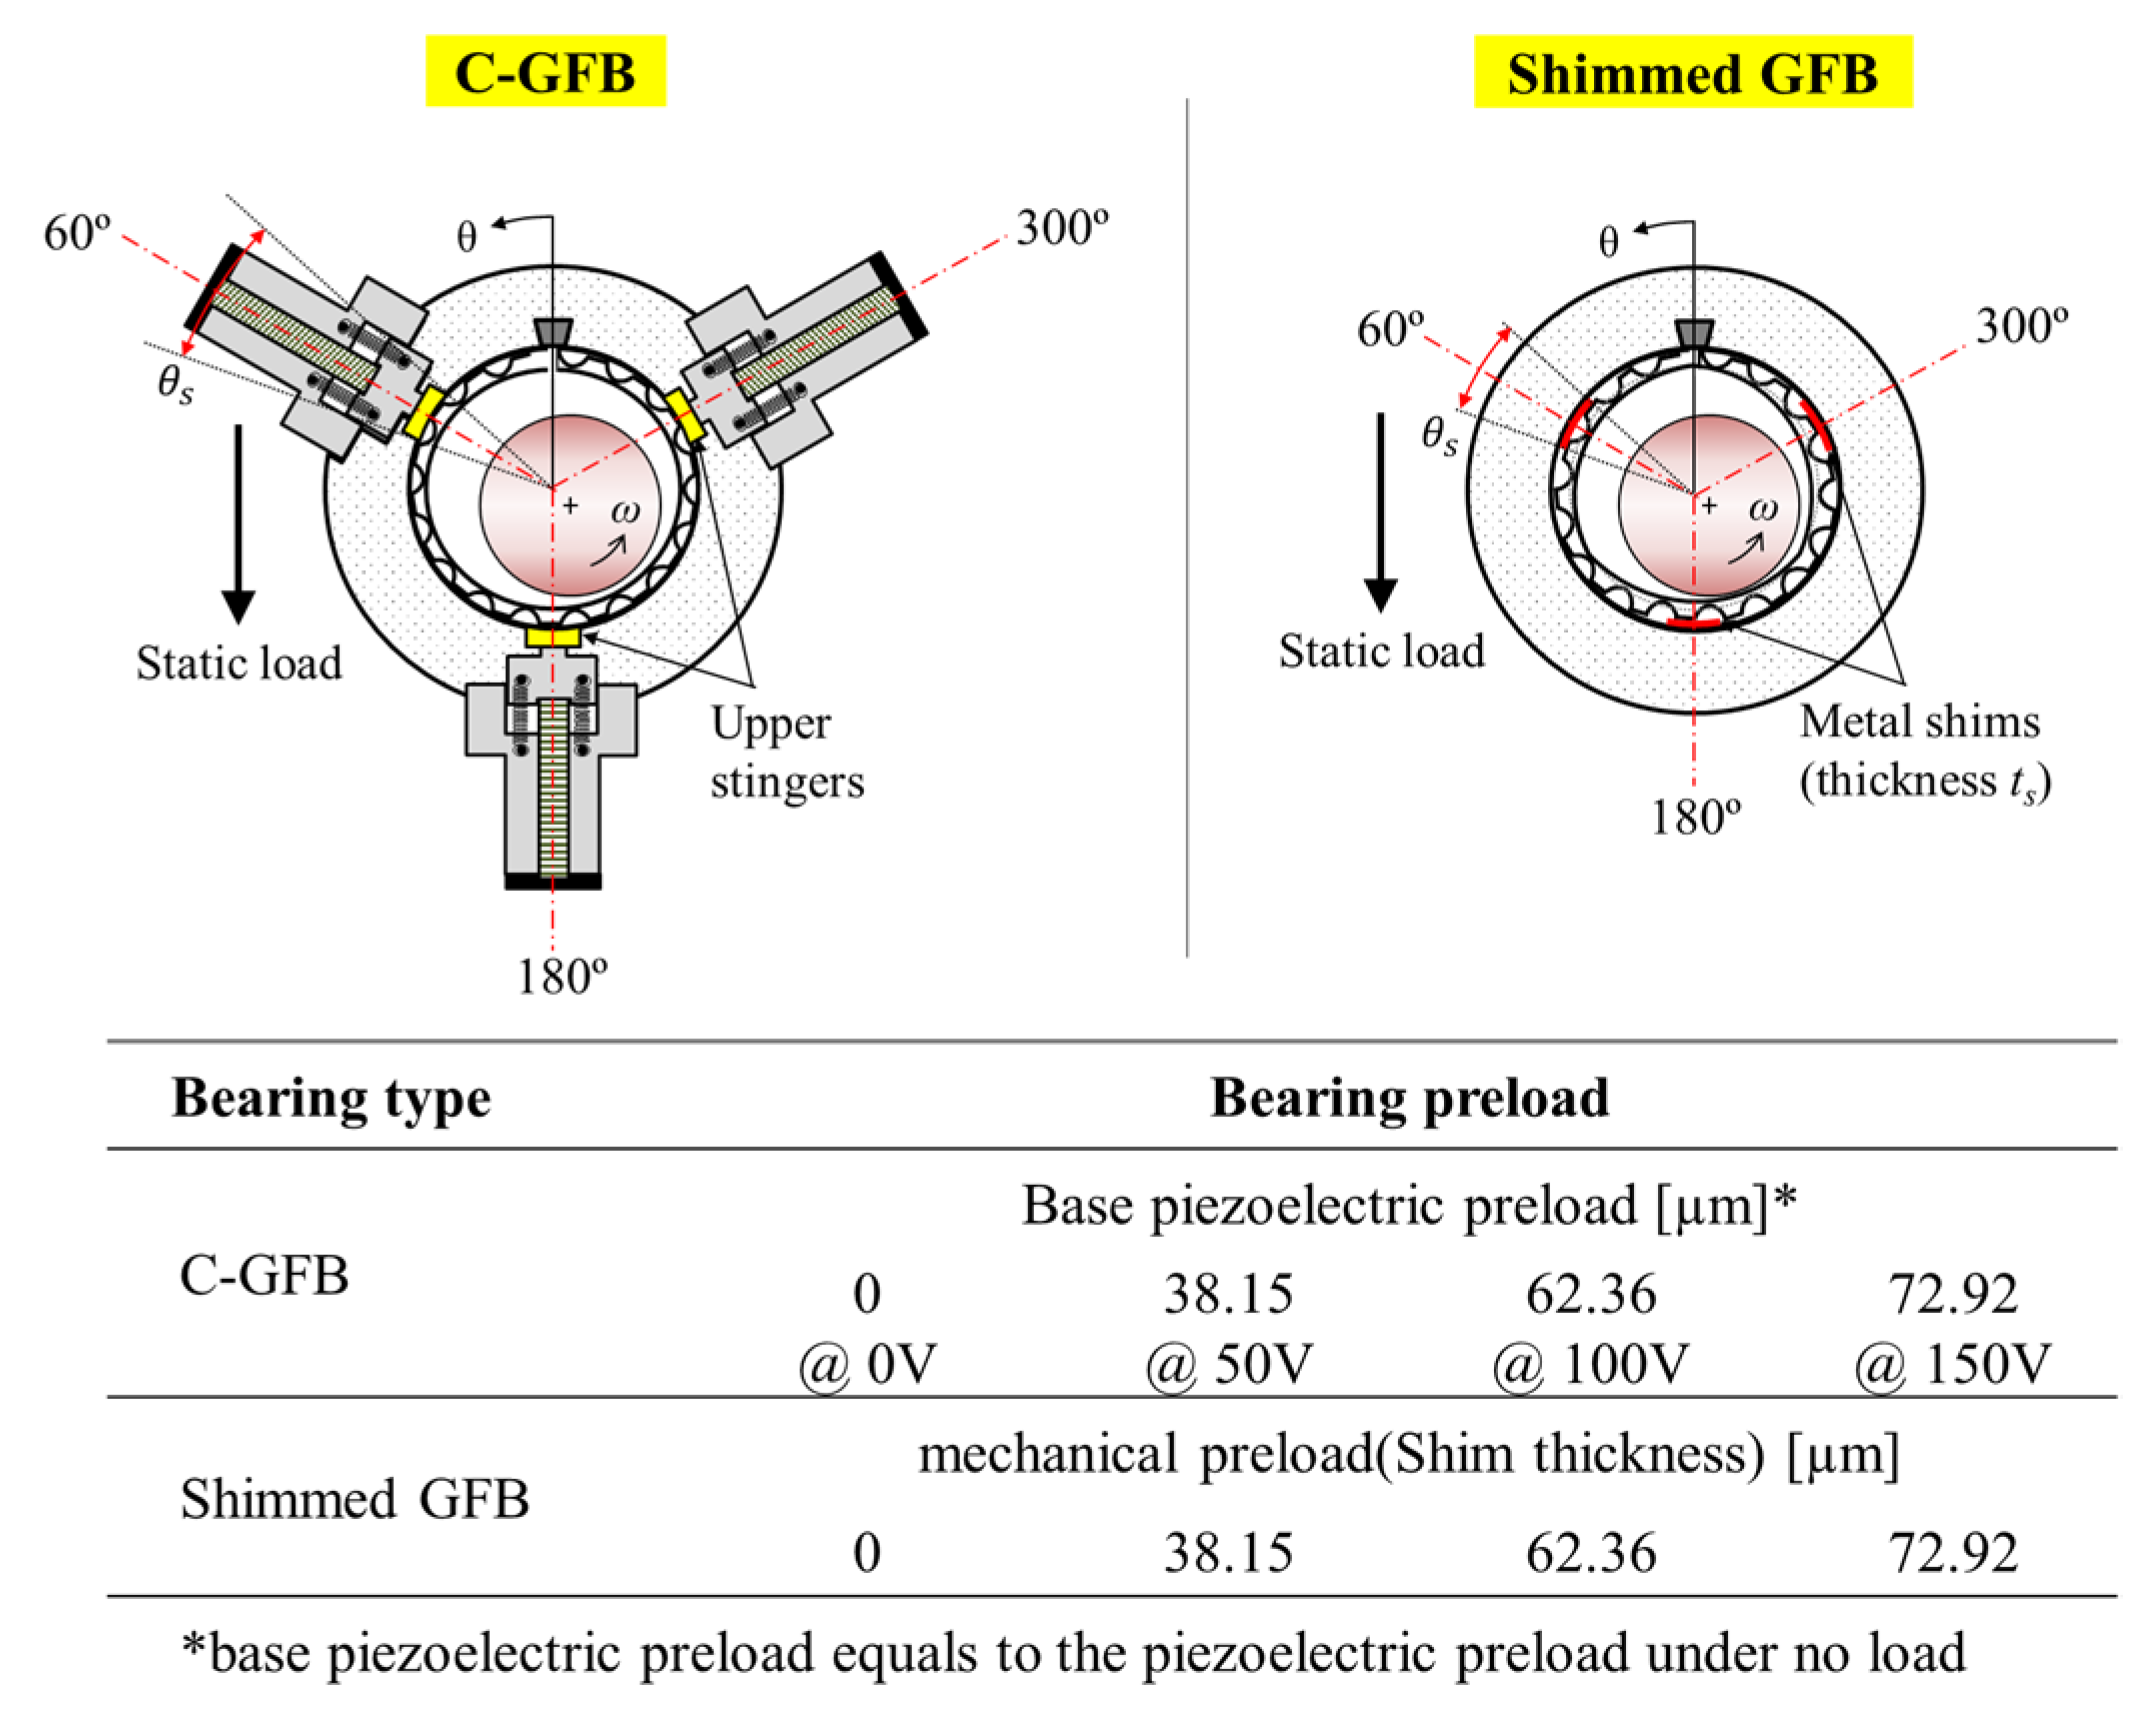
This mechanism of mechanical preload generated by the PZT actuator is analogous to the principle of shimmed gas foil bearings in which the mechanical preload is produced by three metal shims. The magnitude of mechanical preload is defined as the distance between the lobe arc center and bearing center in lobed GFBs [9], and as the inserted shim thickness in shimmed GFBs [8], as given in Figure 1b. Meanwhile, the mechanical preload magnitude is quantified by the displacement of PZT actuator toward the bearing center at each location.
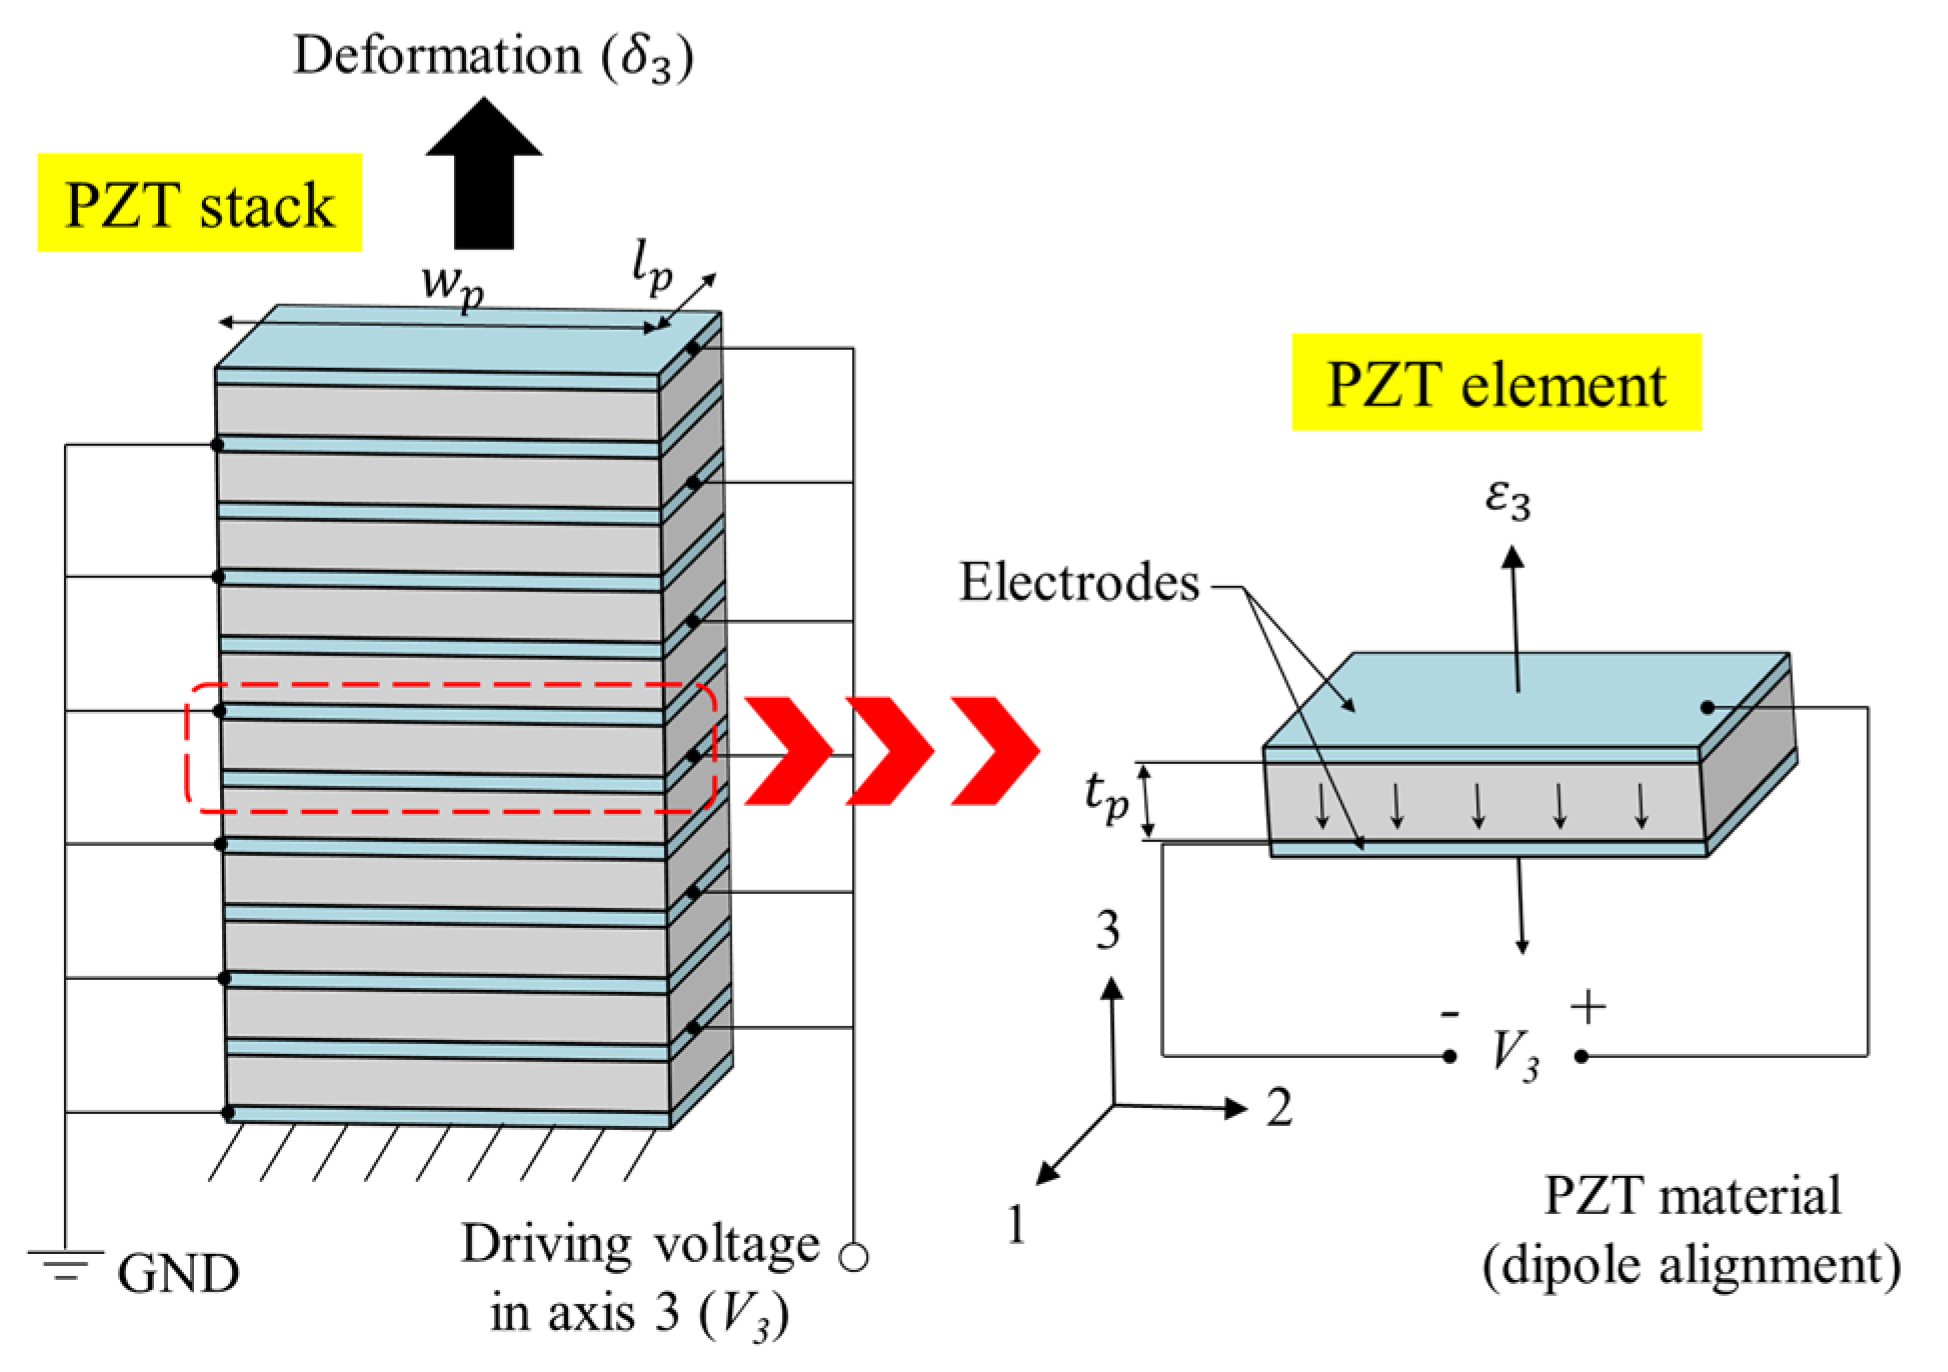
Figure 2 illustrates a schematic view of a PZT stack and a PZT element in axial configuration: (a) a PZT stack of ceramic PZT materials separated by metallic electrodes and (b) a unit PZT element composed of a material and two electrodes. A number of PZT elements constitute a PZT stack in the direction 3. Np layers of PZT materials and Np + 1 electrodes are stacked along axis 3. Local axes 1, 2, and 3 are placed along the length (lp), width (wp), and thickness (tp), respectively, of the PZT material. Note that the XYZ coordinate system is a global coordinate system in bearing units, and the 123 coordinate system is a local coordinate system in PZT element units.
The electrical input lines of all the PZT elements are connected in parallel to an external power source to apply an identical driving voltage (V3) to each element, generating a sizable piezoelectric deformation of the stack. In addition, the stack also has its own mechanical compliance, yielding a mechanical deformation under external loads.
3. Structural Model of PZT Actuator and Foil Structures
When PZT actuators are activated with certain driving voltages, their thicknesses are altered. Thereby, they experience structural and fluidic reaction forces caused by the holder springs, and the gas film in the bearing clearance. As a result, their displacements are reduced compared to the displacements in the free condition. Thus, different mechanical preloads are generated depending on the rotational speeds, static loads, and PZT actuator locations (60°, 180°, and 300°) during operation.
3.1. Constitutive Model of PZT Stack
An external load acting on the stacks and the piezoelectric deformation act only in the direction of axis 3 in Figure 2. In general, the shear stresses acting on the PZT material can be omitted [15]. Assuming the electric field in axis 3, the constitutive relation for a PZT material with regard to the linear inverse piezoelectric effect is expressed as:
where and represent the normal strain and stress of the PZT material in axis 3. and are the elastic modulus and thickness, respectively, of the PZT material, one layer of the PZT stack. is the driving voltage of the PZT material along axis 3. indicates the inverse piezoelectric coefficient.
The total deformation of the PZT stack with Np materials can be expressed by multiplying both sides of Equation (1) with the total PZT material thickness of :
The first term of the right-hand side indicates the mechanical deformation of the PZT stack caused by the normal stress , and is simplified using the structural stiffness per unit area of the PZT stack . The second term depicts the piezoelectric deformation caused by the inverse piezoelectric effect with the piezoelectric coefficient , and it is equal to the value for the no-load condition. Note that the linear piezoelectric deformation can be extended to a higher order polynomial function when nonlinearity is significant [16]. In this study, a second order polynomial of is adopted.
3.2. Structural Model of PZT Actuator and Foil Structures
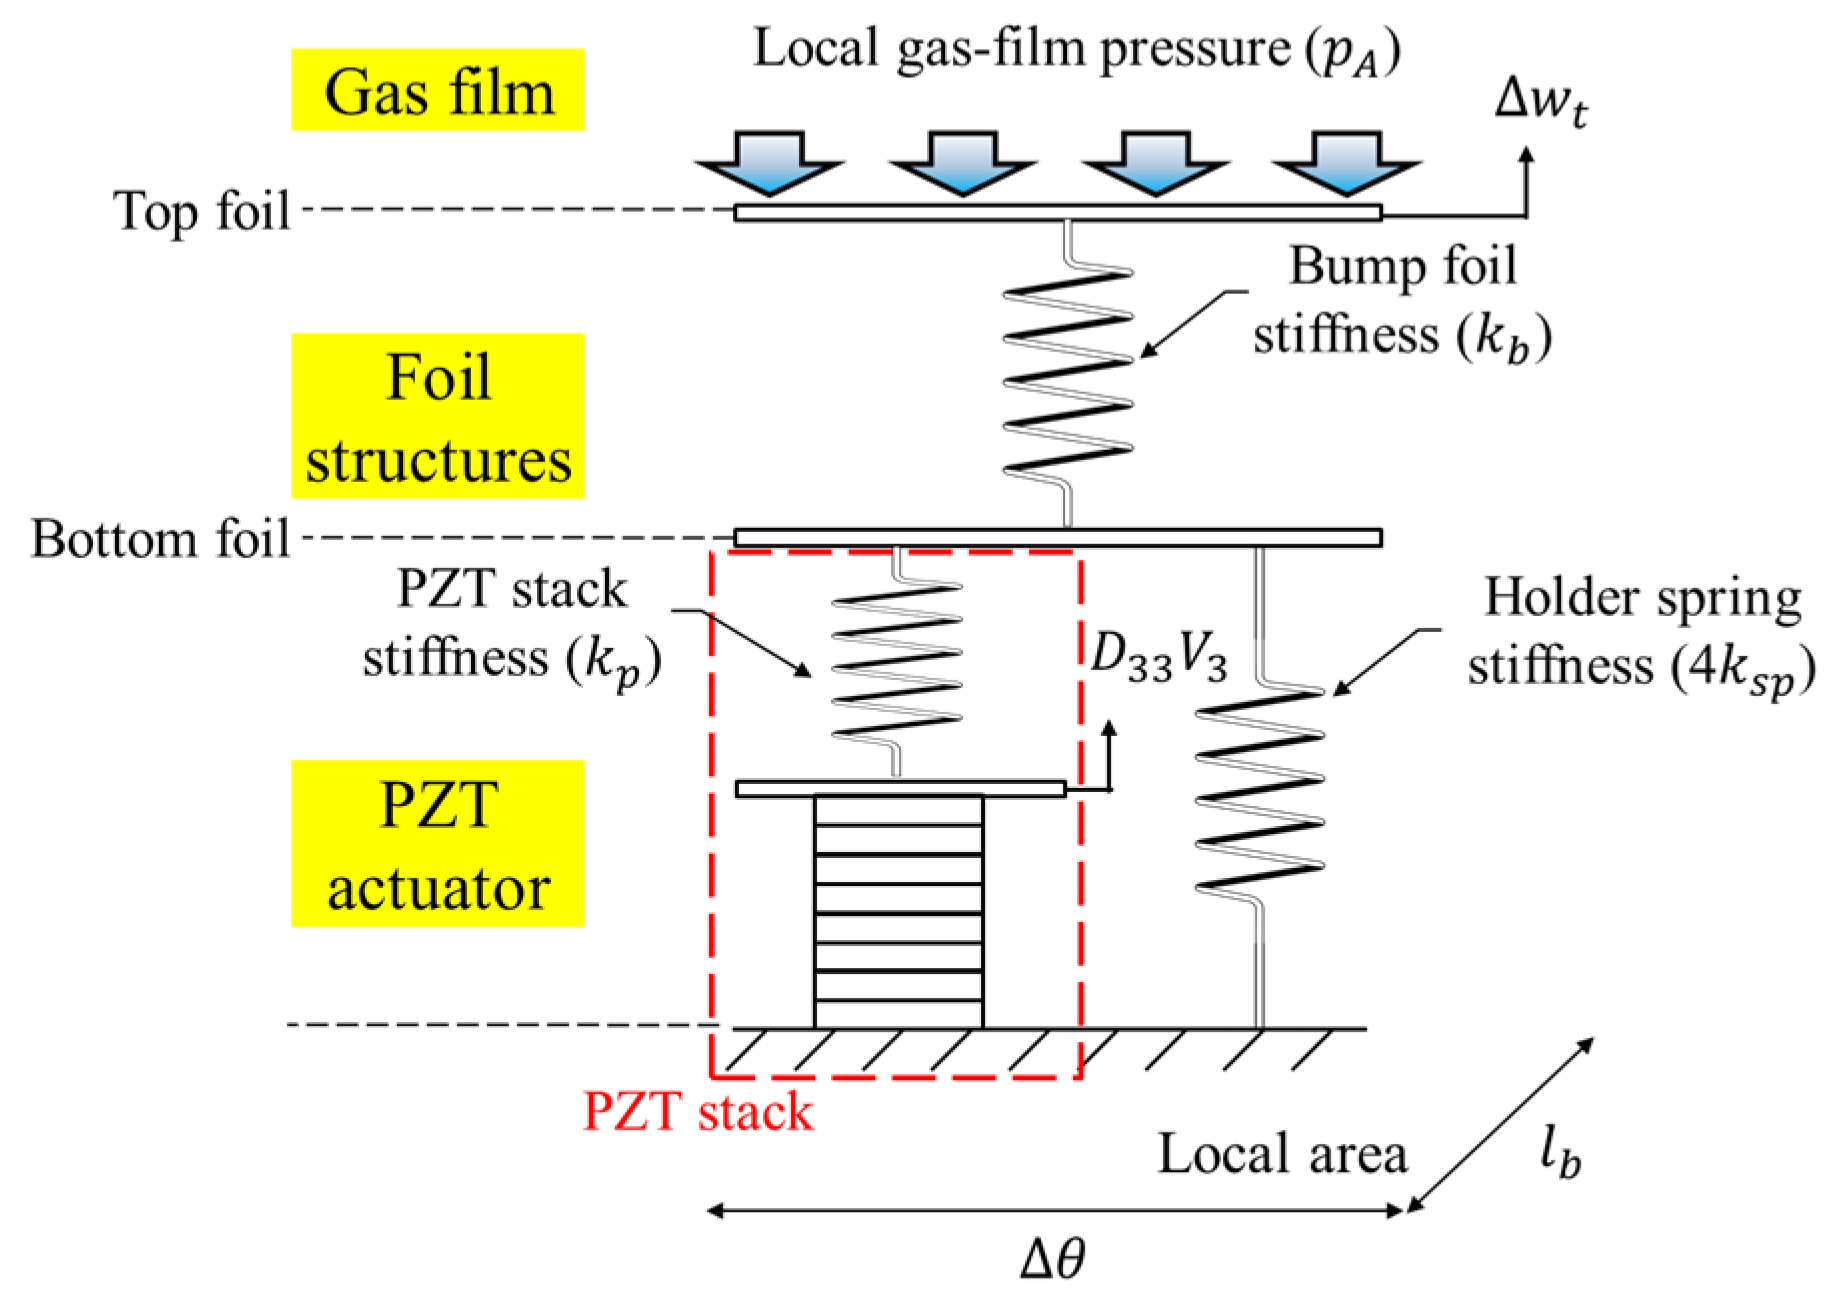
Figure 3 illustrates a schematic view of an equivalent spring model for the assembly of a PZT actuator and a foil structure. The PZT actuator, with the PZT stack and four holder springs, and the foil structure have stiffness coefficients per unit area of , , and , respectively. In the local area (), where indicates a discretized single grid in the angular direction of the bearing and stands for the bearing axial length, the PZT stack and holder springs are in parallel, whereas the bump foil and PZT actuator are in series. They deform when the local gas-film pressure acts on the local top foil; the pressure is regarded as the average gas-film pressure across the bearing axial length lb [15,17], i.e.,
The local top-foil displacement is the sum of deformations for the PZT actuator and bump, and is given as:
where
In particular, the PZT actuator has three components of deformations from stack piezoelectricity, stack stiffness, and holder spring stiffness. The no-load deformation of the PZT actuator is determined by the stiffness ratio of the PZT stack and holder springs under the fixed driving voltage. The holder spring for tightening the moving stinger to the stack has a slight pre-extension of , which is designed to be sufficiently so as small not to constrain the piezoelectric deformation. As a result, acts as a mechanical preload for conventional bump-type GFBs; therefore, it is called to the piezoelectric preload of C-GFBs in this paper. The piezoelectric preload is also variable depending on film pressures as well as applied voltages.
A complex stiffness of the bump foil is introduced to consider the dynamic effects of the bump foil structure. Here, the loss factor arises from the frictional motion between the bump foil and the surrounding structures plus the hysteresis damping effect that occurs during the repeated deformation–restoration process of the bump foil. The loss factor must be determined from characterization tests of the bump foil [17]; it ranges from 0.05 to 0.2 for dimensionless static loads of 0.03 to 0.14 [18], and 0.1 is used in this study. On the other hand, the loss factor of the PZT stacks and holder springs are not considered because the material damping is not significant.
Consequently, is a known parameter provided by the manufacturer, and can be calculated using Iordanoff’s formula for an individual bump foil under free-free condition [16]. However, the remaining parameters of , , and are unknown, and thus are identified via experiments. Note that the manufacturer provides a piezoelectric coefficient of , but it is not accurate for a system with significant nonlinearities.
4. Development of C-GFB and Parameter Identifications
The unknown parameters of PZT actuators, , , and , are identified by measuring the deformations of PZT stacks under external load and no-load conditions with various piezoelectric voltages applied. First of all, we fabricated a test C-GFB with PZT actuators, and identified its geometric bearing clearance.
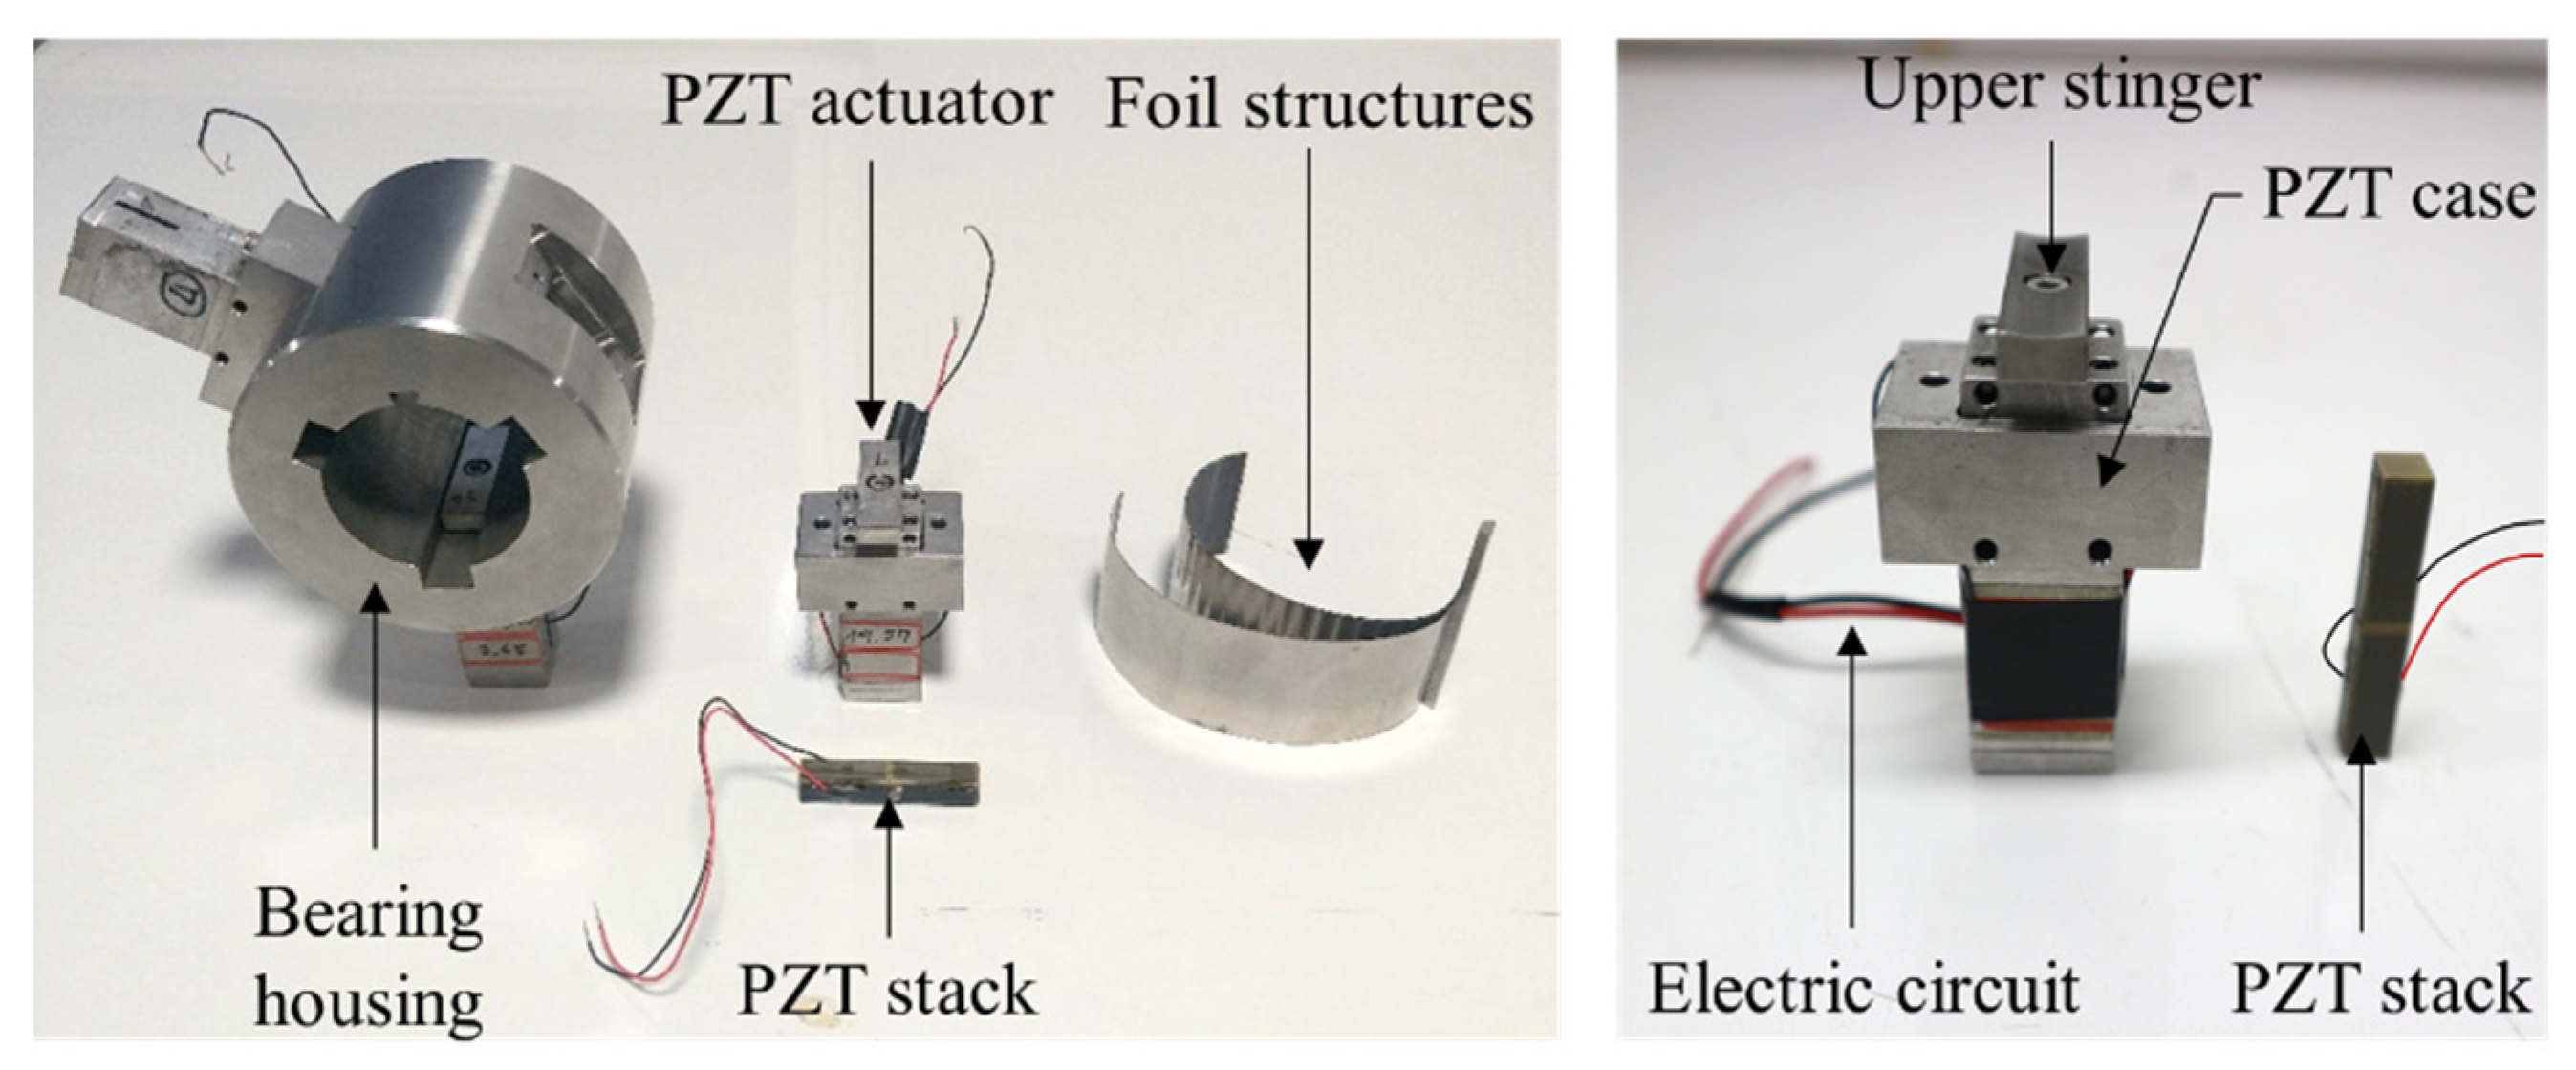
Figure 4 illustrates a fabricated C-GFB with PZT actuators. The dimensions of the bearing and PZT actuators are listed in Table 1. The stiffness coefficient per unit area of the holder springs () is specified as 3.95 × 10⁶ N/m3, which is calculated by dividing the stiffness of 1.4 × 10⁶ N/m by the contact area between the upper stinger and the bottom foil of 3.54 × 10⁻⁴ m2. All the parts of the bearing, except for the PZT stack and foil structures, were fabricated via precision machining. Meanwhile, the Mos2 lubricant coatings with thickness of 0.02 mm are sprayed on one end-surface of the top foil to reduce bearing friction and wear, particularly in the low-speed regions.
The bump foil is fabricated by the press process using a flat-shaped tool (die) with a forming load of 40 MPa. This is because, when analyzing the moldability of the bump foil according to the forming loads, 40 MPa was the most suitable pressure. Note that DellaCorte et al. [19] reported that a load of at least 28 MPa is required to achieve the designed bump shapes. The bump, top, and bottom foil layers are affixed to the bearing key, which is inserted into a slot inside the bearing housing.
The bearing housing was manufactured to have the inner radius of 20.945 mm for an assumed rotor radius of 20 mm, considering the designed foil structure thickness of 0.782 mm with the top, fabricated bump, and bottom foils, yielding a geometric radial bearing clearance of 0.163 mm. However, we used 0.100 mm as a nominal bearing clearance for simulations in this paper, based on experimental experiences that the large bearing clearance causes excessive rotordynamic instability for a rotor with the radius of 20 mm up to a rotating speed of 90 krpm [20]. Note that the bearing clearance is sometimes able to be adjusted by inserting thin foils over the circumference to stabilize rotordynamic responses during experiments.
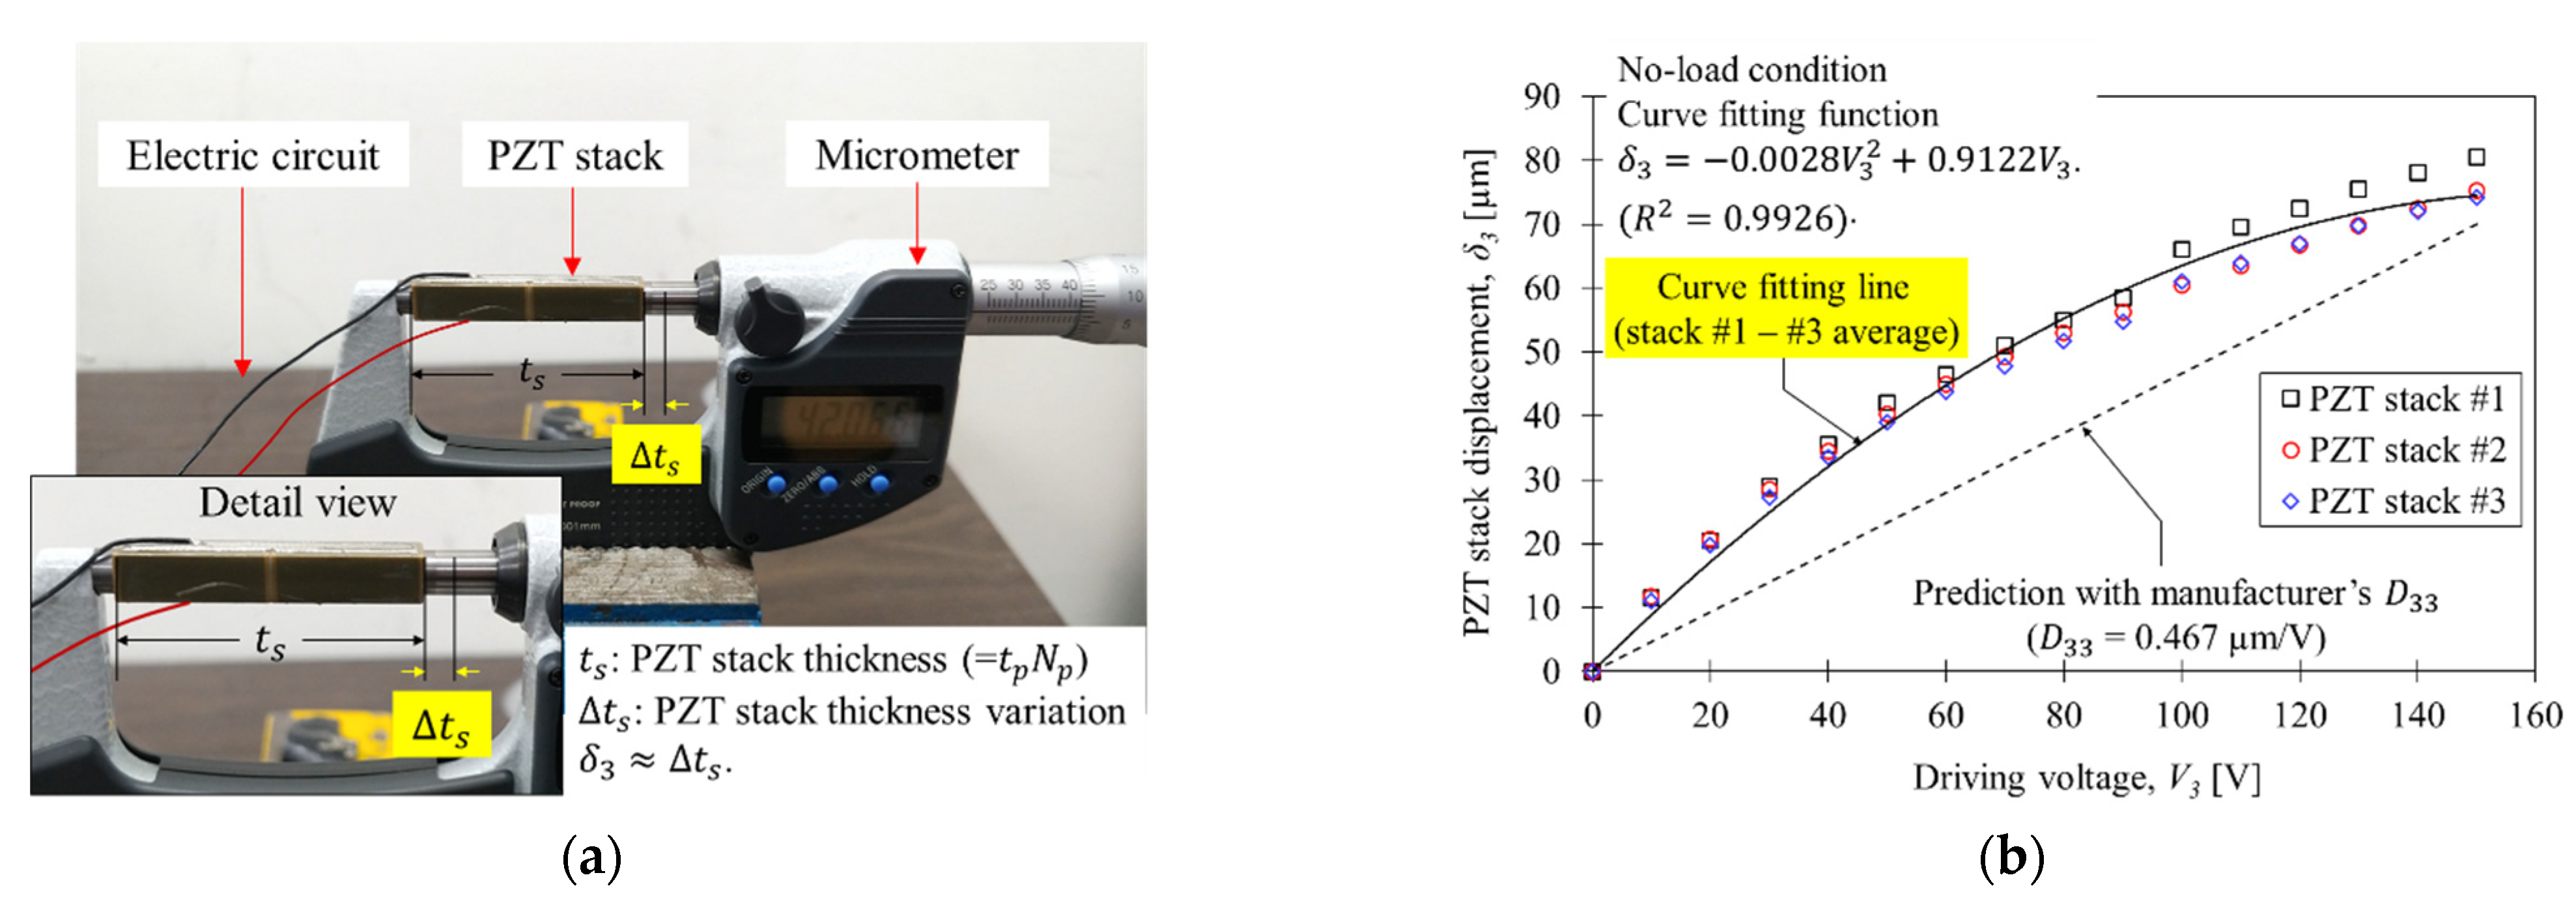
Figure 5 illustrates the PZT coefficient measurement of the PZT stack: (a) depicts the measurement setup with a micrometer, and (b) presents measured PZT deformations versus applied driving voltages. The measurement is performed in the no-load condition, i.e., Equation (3) yields or depending on the system linearity. The micrometer measures the thickness variation of the PZT stacks with respect to the applied driving voltages. The thickness variation can be regarded as the PZT stack displacement .
In Figure 5b, the dashed line represents the predicted PZT stack displacement with the manufacturer of 0.467 µm/V for a linear system. Overall, the measured displacements of the PZT stacks #1–#3 do not agree with the predicted curve. Furthermore, they exhibit significant nonlinear behavior. This result demonstrates why the PZT coefficient measurement is necessary, although its ideal value is provided by the manufacturer. Consequently, a second-order polynomial function is used to express a representative curve for the relationship between the PZT stacks’ displacement and driving voltage. The function is , with . Thus, and .
Meanwhile, the PZT stacks generate marginally different displacements. The maximum displacements range from 72 to 78 µm at a driving voltage of 150 V. This is considered to be adequate to alter the mechanical preloads of the bearing given that the nominal bearing clearance for simulations is 100 µm in this paper.
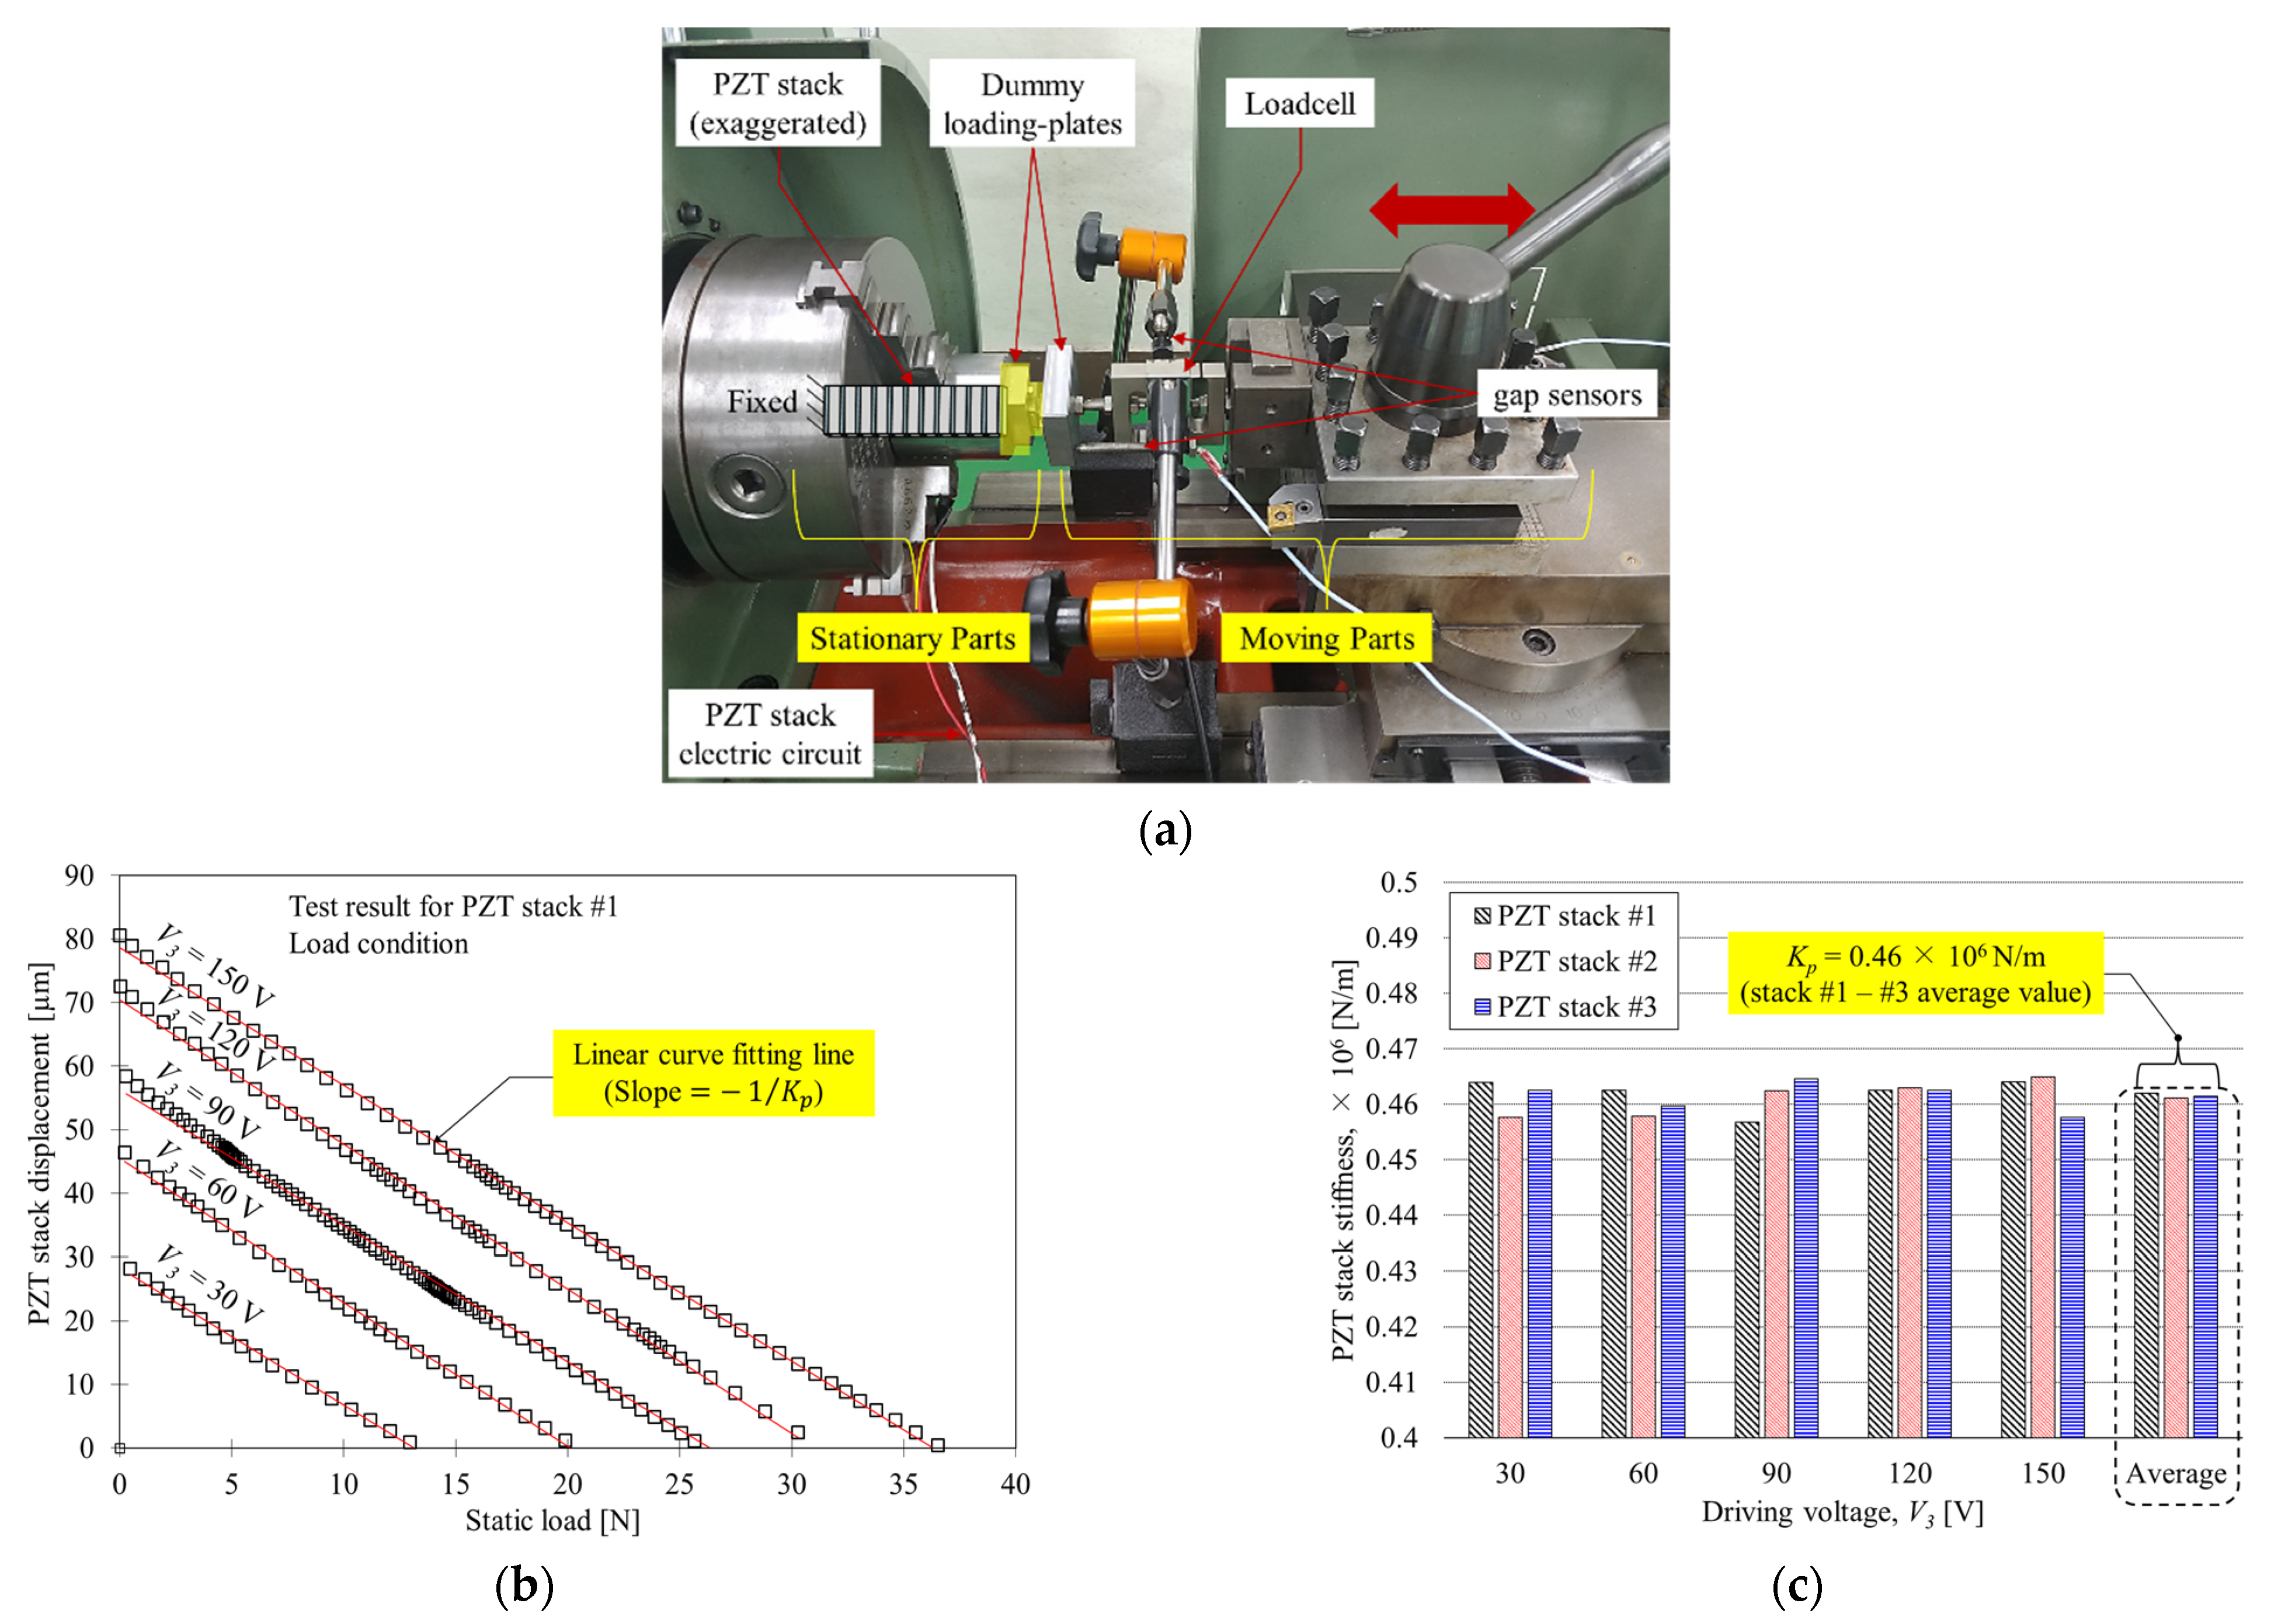
Figure 6 illustrates the structural stiffness measurement of the PZT stacks: (a) presents the measurement setup using a lathe, (b) illustrates measured PZT stack displacement versus applied static load with different driving voltages of PZT stack #1, and (c) illustrates the estimated PZT stack stiffness for all the PZT stacks.
The measurement is carried out in the condition wherein the PZT stacks are subjected to a static load. The load is applied to one end of the PZT stack using a lathe, and the other end is fixed. The load is measured via a strain gauge-type load cell. The displacement of the PZT stack is measured by two eddy current gap-sensors by recording the dummy loading-plates’ displacement. The two measured displacement are averaged.
The result for PZT stack #1 indicates that the stack displacements vary linearly across the entire static load range for all the driving voltages. In addition, they particularly exhibit a highly similar slope under different driving voltages. This implies that a relationship between PZT stack displacement and applied static load can be considered constant for the tested loads and voltages.
The first-order curve fitting is used to estimate the slopes of the curve, which can be regarded as , where is the PZT stack stiffness with the unit N/m. The average value of for stacks #1–#3 is 0.46 N/m, as shown in Figure 6c. The is calculated to be 1.30 N/m3 by dividing by the area of contact between the upper stinger and the bottom foil, 3.54 m2. Table 2 lists the identified parameters of the equivalent spring model.
5. Performance Analysis of C-GFB
In this section, the effects of the mechanical preloads introduced by the electrified PZT actuators on the C-GFB’s static and dynamic performance are analyzed via the model prediction for C-GFB lubrication. The performance prediction model coupled with the equivalent spring model of PZT actuators and foil structures is presented. Under specified static load and rotational speed, the static performance includes the gas-film pressure and thickness distributions, and the journal equilibrium position. Meanwhile, the dynamic performance indicates the journal trajectory within the bearing clearance.
5.1. Static Analysis of Bearing Performance
An unsteady compressible Reynolds equation for an isothermal and isoviscous ideal gas with the normalized terms P = p/pa, H = h/C, ν = ωe/ω, Λ = 6µωR2/paC2, and τe = ωet is expressed as
where ω is the rotational speed, ωe is the excitation frequency, P is the normalized gas-film pressure, and H is the normalized gas-film thickness.
The film thickness considering journal eccentricities, mechanical preloads due to PZT actuators, and bump deflection is as follows:
where εX = eX/C and εY = eY/C; is the approximated preload function caused by the piezoelectric preload , composed of the piezoelectric and structural deformations as given in Equation (3b), C is the nominal radial clearance, and is the local mechanical deformation of the bump foil.
Approximated preload function: Among the several methods for approximating the mechanical preloads in bump-type GFBs based on the variation in film thickness ([8,17]), the fully sinusoidal approximated model [15] is adopted for determining the approximated preload function for C-GFBs considering:
where is the angular position of n-th PZT actuator:
Structural stiffness function: A structural stiffness function is defined as a total assembly stiffness of the PZT actuators and foil structure along the circumferential coordinate, composed of , , and . Overall, the function is identical to kb, while a combined stiffness of the bump foil and of PZT actuators applies at the upper stinger locations. It can be expressed by performing simple mathematical operations on Equation (3b) as follows:
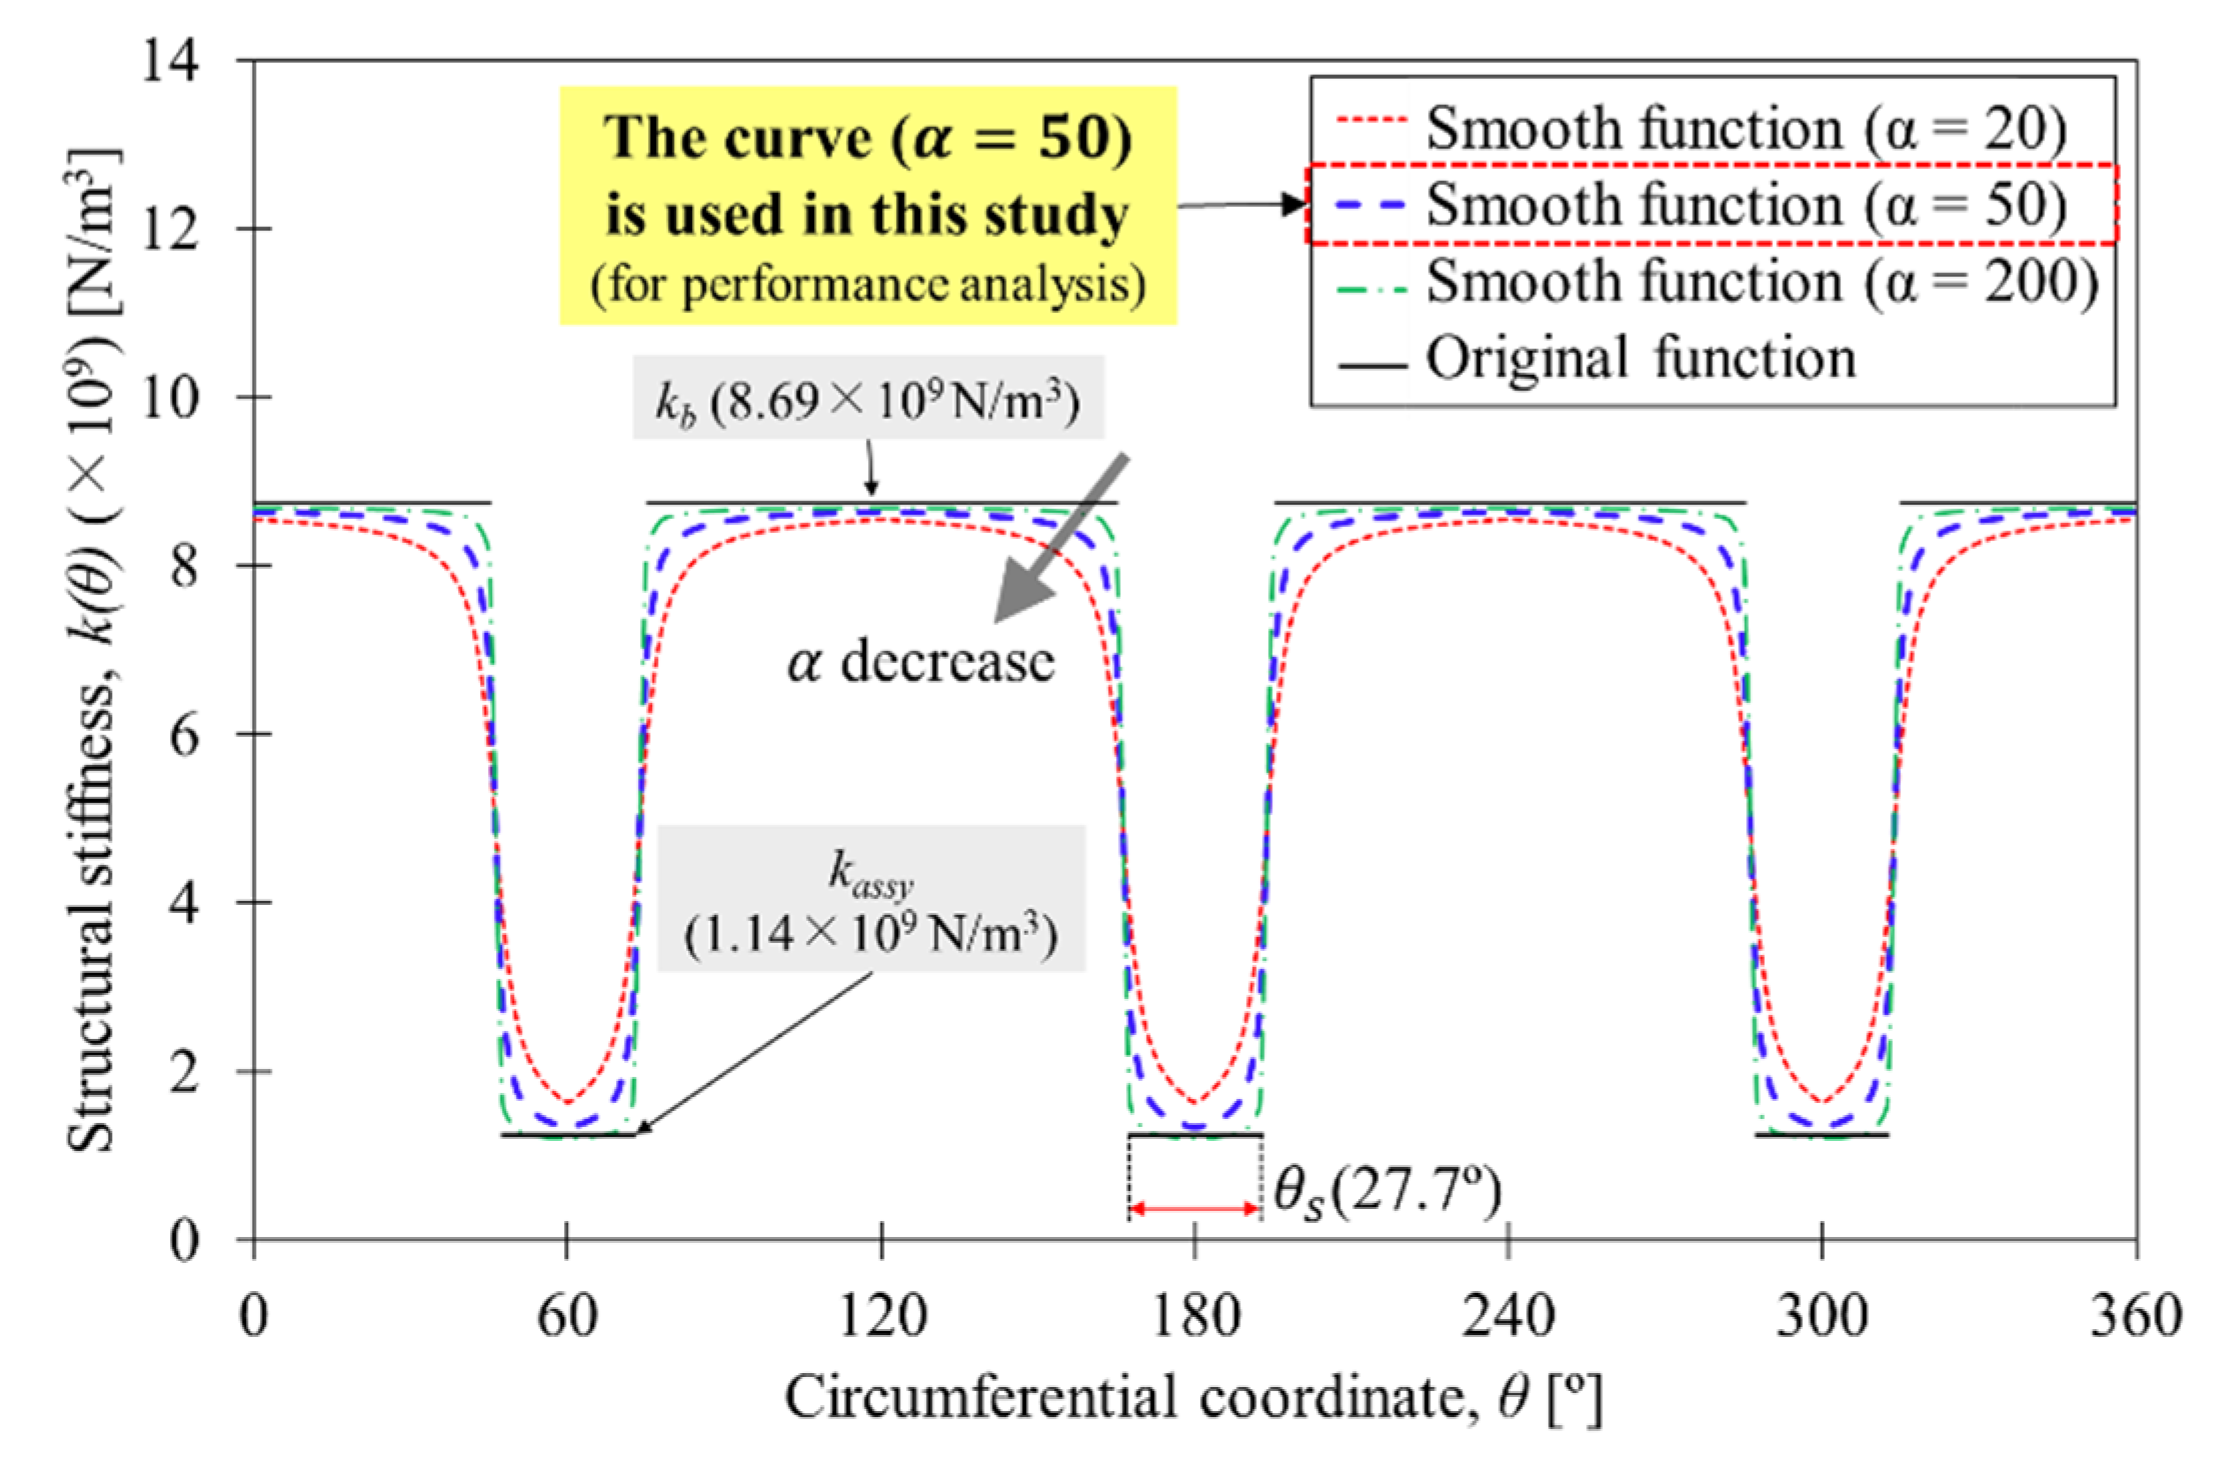
A discontinuity exists in the structural stiffness function at each end of the upper stingers. In this study, an arc tangent function is introduced to smooth the structural stiffness function at each end of the upper stingers, as follows:
where
is the angular length of the mechanical preload. represents a smoothness constant, such that a large value results in an accurate albeit insufficiently smooth function, whereas a small value results in a sufficiently smooth albeit inaccurate function [22].
Figure 7 shows predicted structural stiffness function versus circumferential coordinate with respect to smoothness constant. The stiffness values of = 8.69 × 10⁹ N/m3 and = 1.14 × 10⁹ N/m3 are calculated from Table 2. Notably, the original curve exhibits discontinuous variations at each end of the upper stingers, while small smoothness constant values yield smooth but inaccurate curves. We used = 50 in this study.
5.2. Orbit Simulation for Journal
The orbit simulation seeks to predict the journal trajectory when the journal rotates in the bearing, by solving the journal dynamic motions, top foil deflections, and unsteady compressible Reynolds equation simultaneously.
The equation of the radial motion of the journal in the X, Y coordinate system is expressed as
where , mr is the journal mass, is the imbalance radius, is the rotational speed, and is the gravity constant. and are dynamic bearing reaction forces caused by the gas-film pressure, which is calculated from the unsteady compressible Reynolds equation with the top foil deflections at each time step. The reaction forces are computed by integrating the gas-film pressure of the fluid film (p) over the bearing surface. These are as follows:
where pa is the ambient pressure. Z = represents the two axial ends of the bearing.
The synchronous excitation of the journal is omitted in the initial computational process when searching for an equilibrium position. That is, the imbalance mass and radius are set to zero as the journal center position converges to what is regarded as the equilibrium position of the journal. After the equilibrium position is defined, the imbalance is set to a certain value to excite the journal with the synchronous frequency. This excitation force causes the journal to form orbits around its equilibrium position.
The detailed computational procedure for the static analysis is described in Ref. [15] and for the orbit simulation in Ref. [23]. Most of the computational procedure for the static analysis in this study, except for the gas-film and structural stiffness definition, is based on Park and Sim’s work [15]; the in-house simulation code is used for the numerical calculations.
6. Results and Discussion
In this section, we conducted the static and dynamic bearing performance prediction with base piezoelectric preloads—that is, the piezoelectric preloads under no external load condition, and calculated from ; see Equation (3b).
As a result, the base preloads are 38.15, 62.36, and 72.92 µm at 50, 100, and 150 V, respectively. The PZT stack displacements of was estimated from the curve fitting of the measurements in Figure 5b, such as 38.61, 63.22, and 73.83 µm at 50, 100, and 150 V, respectively. Note that the PZT actuator has slightly higher deformations than the stack due to the holder spring effect .
We used a structural loss factor of 0.1 for the bump foil, a static load of 8.8 N on the bearing along the X-axis, and a nominal radial bearing clearance of 100 µm, referring to the rotor-bearing specifications of the rotordynamic test rig in Refs. [15,20].
6.1. Static Analysis
The static performance of the C-GFBs is compared with that of the shimmed GFBs to investigate the effects of structural compliance of the PZT actuators on the bearing performance. It is assumed that three metal shims, that are inserted between the foil structures and bearing housing, have an identical configuration to the C-GFB: the angular width of 27.7° and locations of 60°, 180°, and 300°, whereas the thicknesses are set to the base piezoelectric deformations of the PZT actuators, given in Figure 8. Note that the mechanical preloads of shimmed GFBs do not undergo reductions in structural stiffness in the shim regions, unlike the piezoelectric preloads of C-GFBs, due to the metal shim’s rigidity.
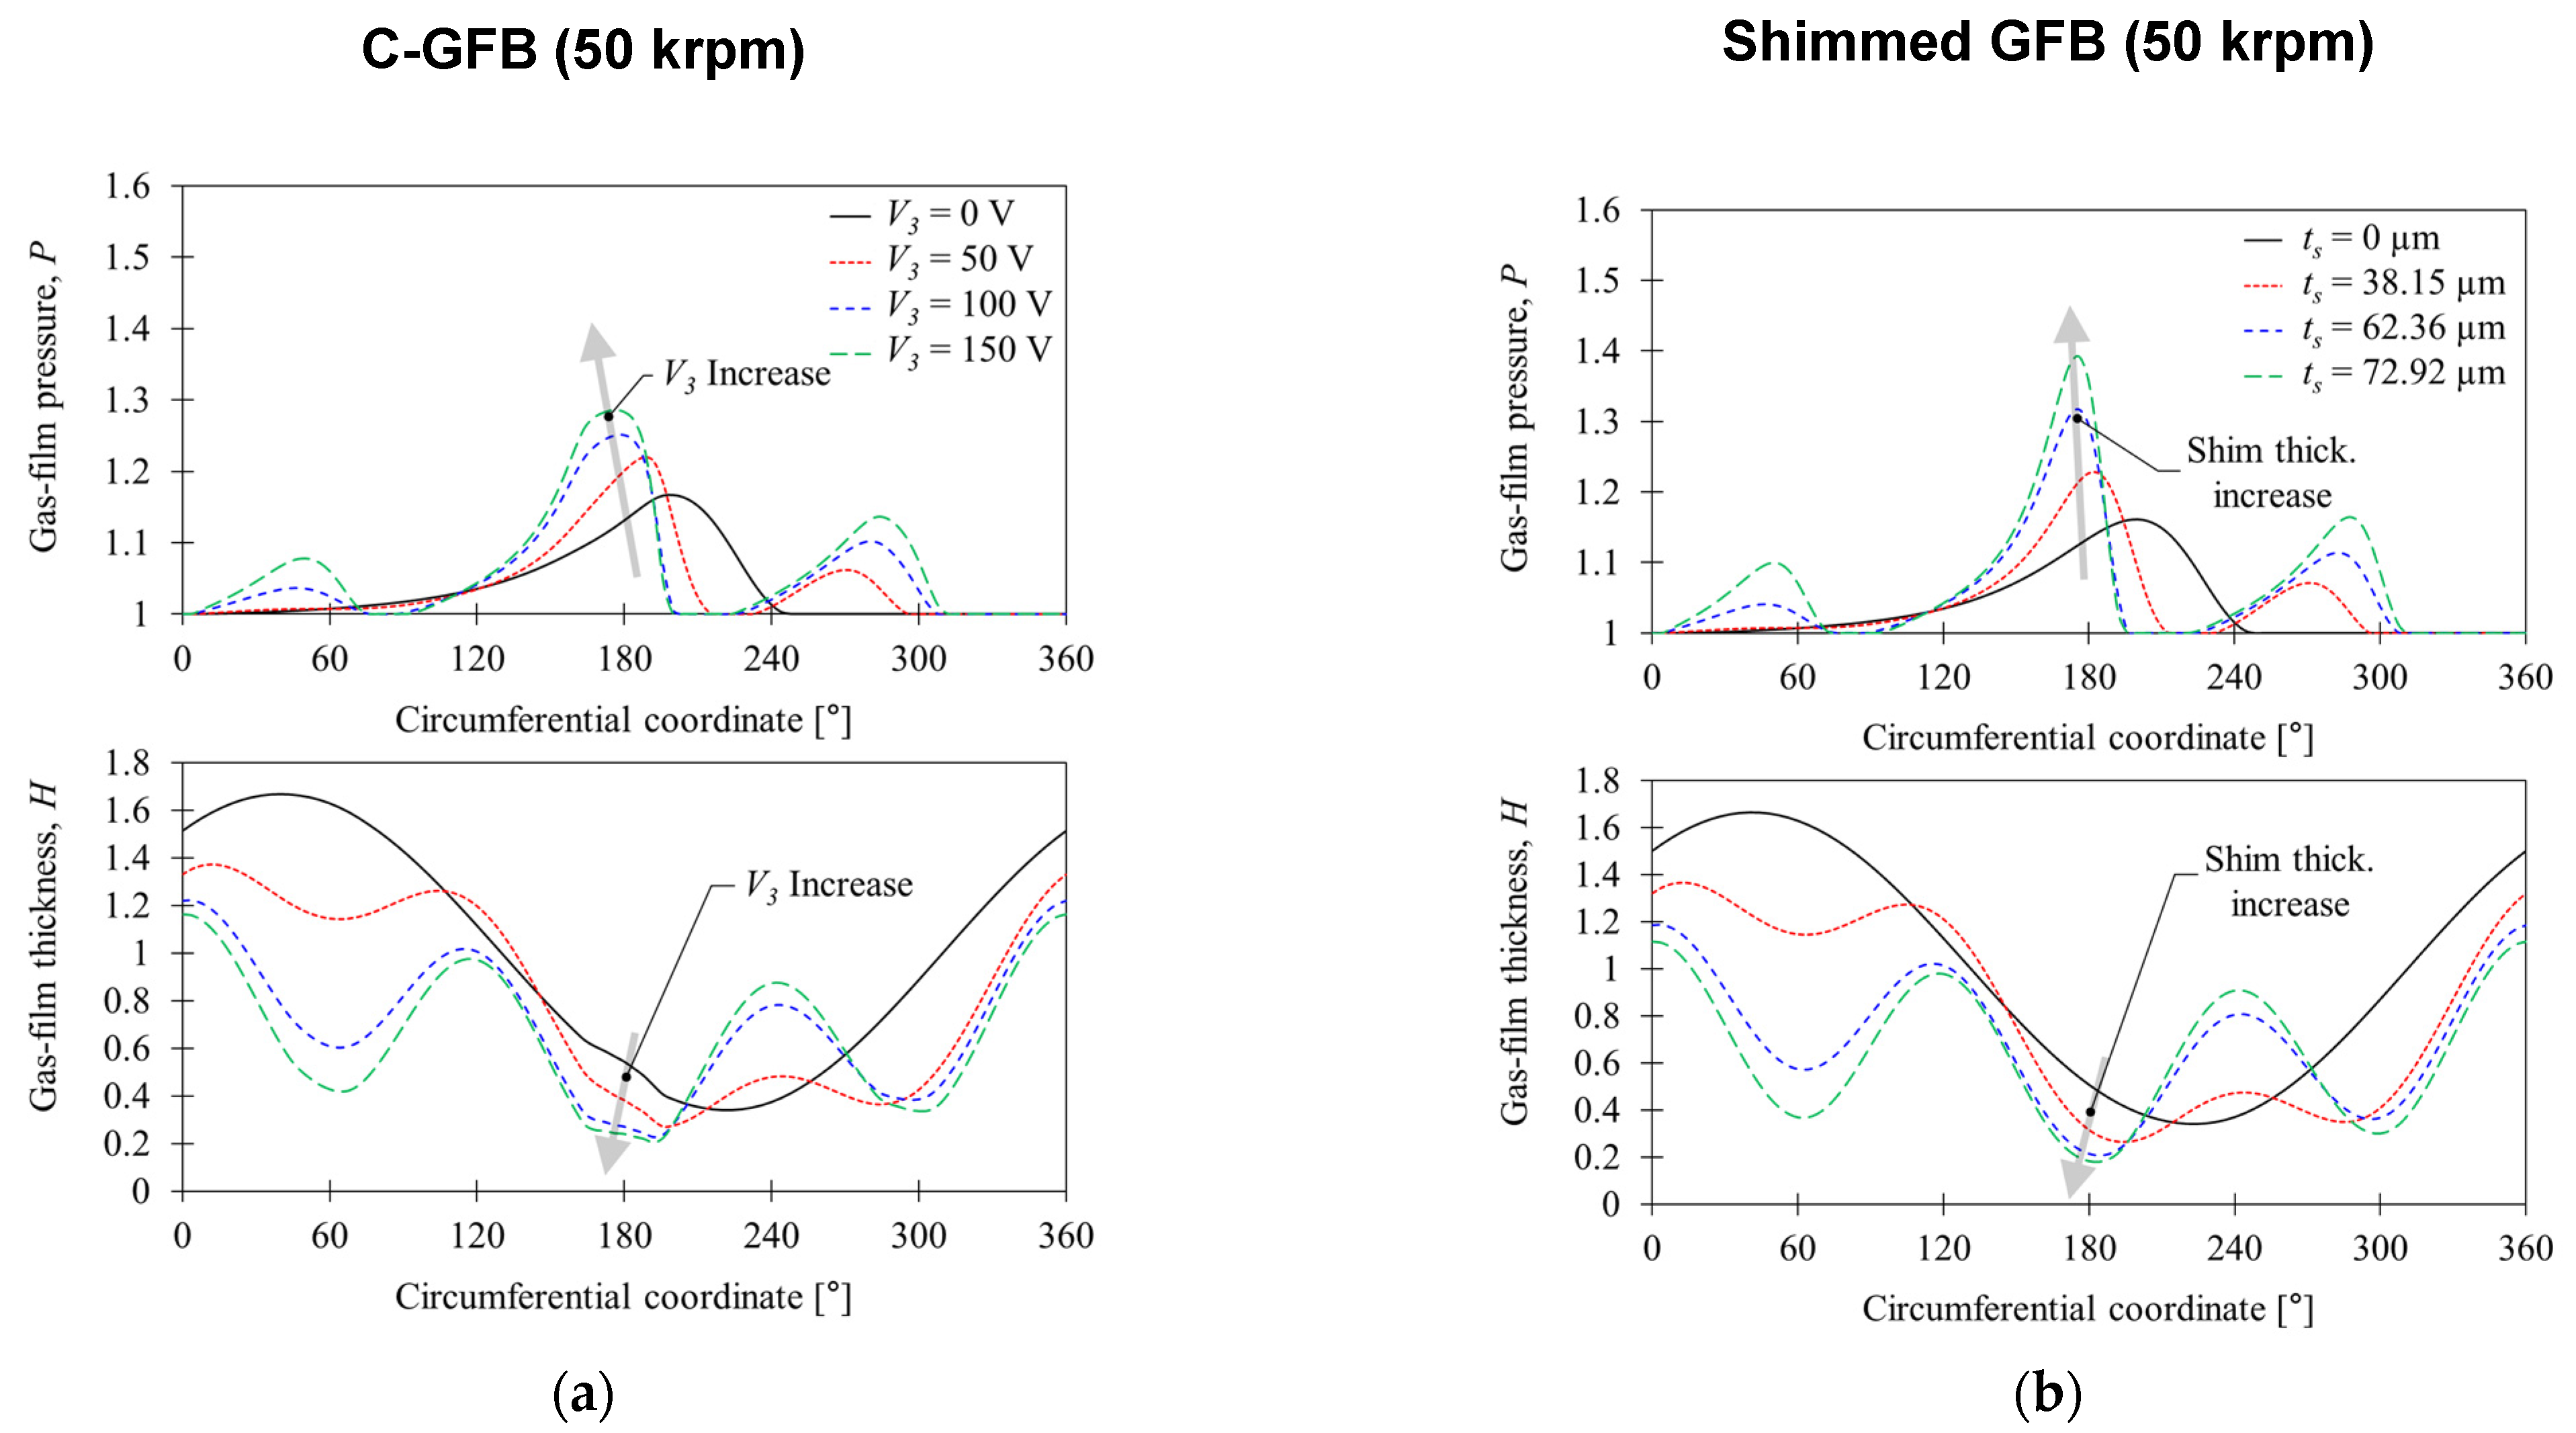
Figure 9 illustrates the predicted mid-plane gas film pressure and thickness distributions of (a) C-GFB and (b) shimmed GFB under a rotational speed of 50 krpm. Both the C-GFB and shimmed GFB exhibit typical pressure and film thickness distributions of circular GFB without preload at the driving voltage of 0 V and shim thickness of 0.
Meanwhile, three pressure peaks are generated due to the preload effects, i.e., gas-film wedge effects, of significant thickness reductions in the gas film around three preload regions for both the C-GFB and shimmed GFB, increasing with the strength of the preload. However, the C-GFB exhibits smaller pressure peaks and higher minimum film thickness than the shimmed GFB. The difference is particularly evident at the PZT actuator #2 (180°) at the loaded region. This observation implies that the mechanical compression of the piezoelectric preloads occurs to a significant level owing to the gas-film pressure due to the PZT stack compliance.
As a result, the PZT actuators enhance the gas-film pressure in the upper stinger regions. However, this is accompanied by the mechanical deflection caused by the gas-film pressure, which results in the generation of pressure peaks smaller than those on the shimmed GFB.
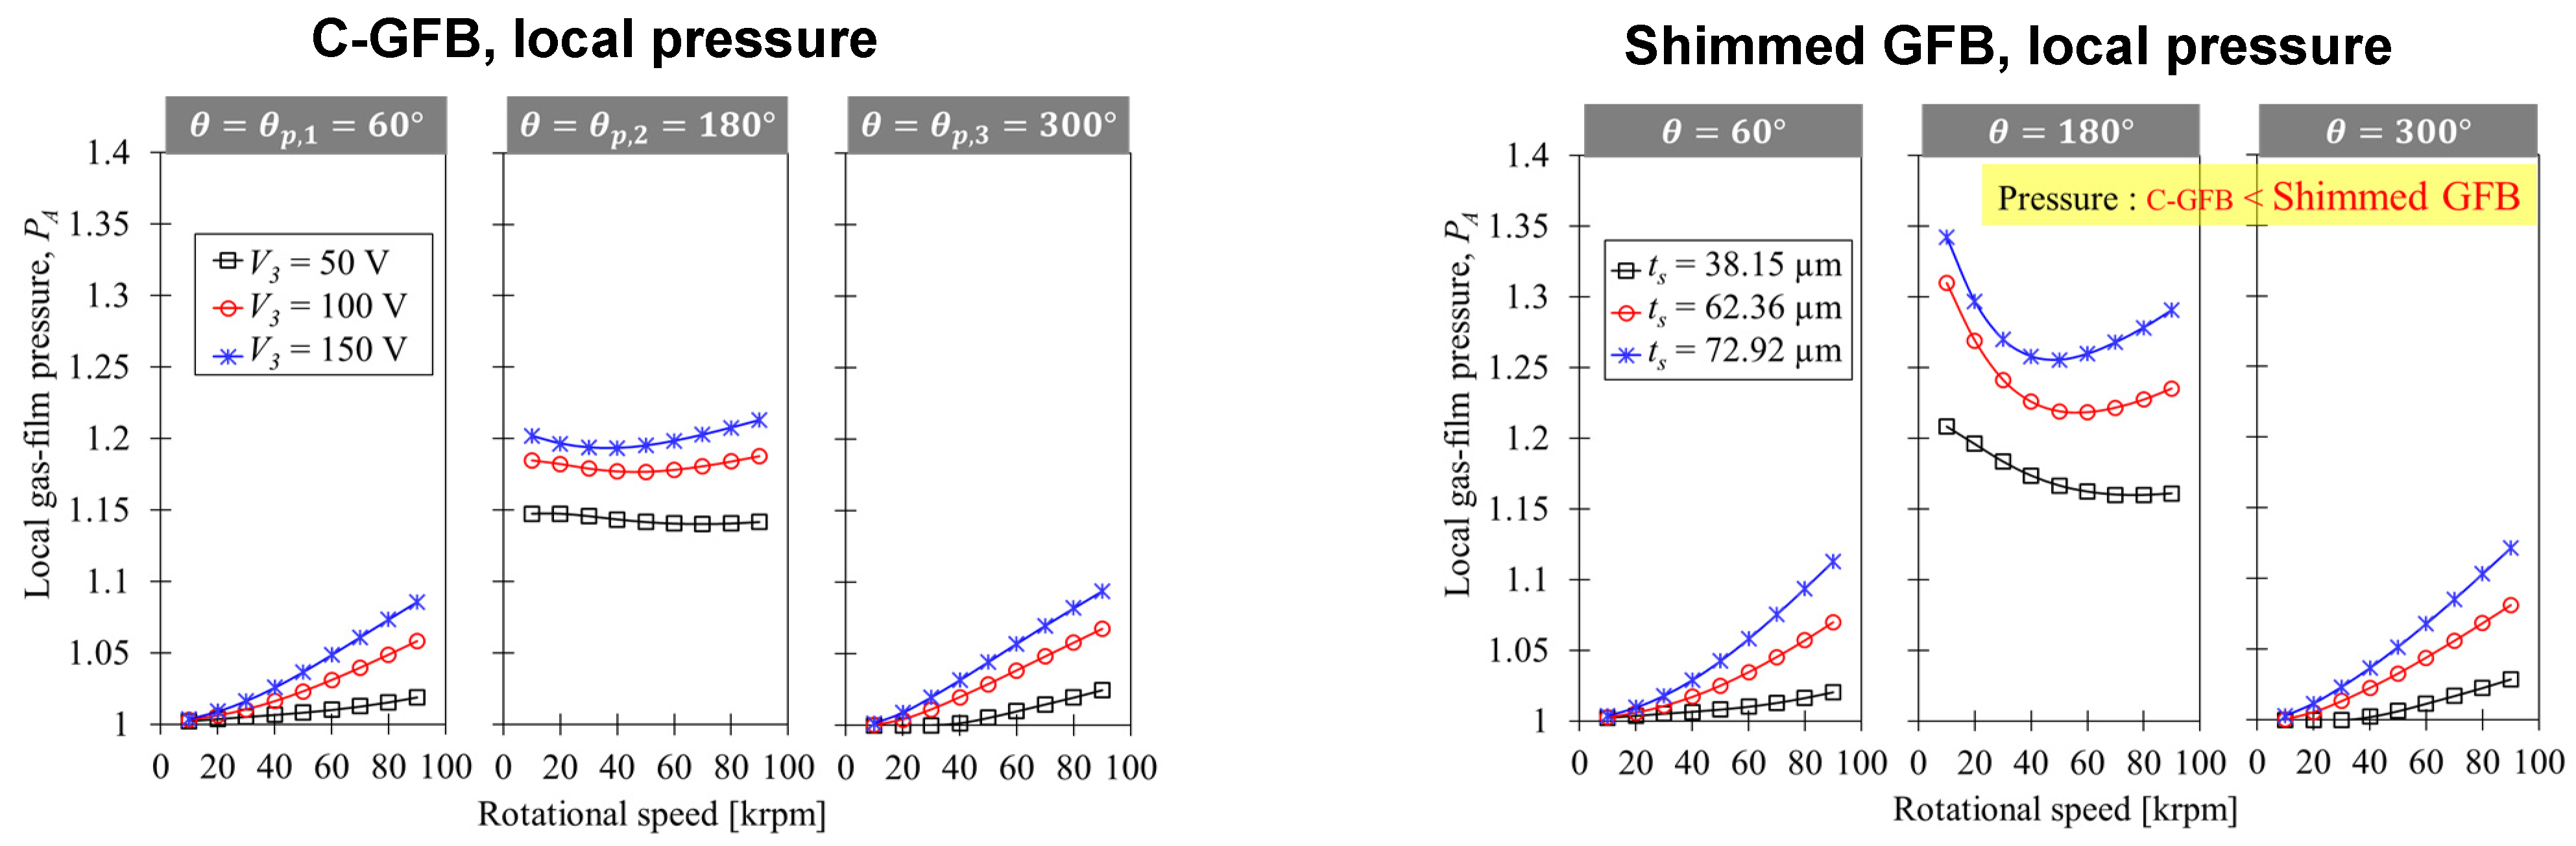
Figure 10 illustrates the predicted local gas-film pressure versus rotational speeds at the mechanical preload locations for the C-GFB and shimmed GFB. The rotational speed ranges from 10 to 90 krpm. As expected, all the pressures of both GFBs tend to increase with higher driving voltages and shim thicknesses as well as higher rotational speeds. The pressures at the loaded location (θ = 180°) exhibit the highest level due to the minimized film thickness. The C-GFB exhibits lower pressure distribution than the shimmed GFB with smaller piezoelectric preloads due to the compression of PZT actuators.
In particular, the pressures at θ = 180° tend to firstly decrease then increase from the rotating speed of 10 to 90 krpm, due to the combined effects of the rotational speed and journal center position. The higher rotational speed generates a higher-pressure distribution because the flow rate of the air in the bearing clearance also increases. In addition, the journal generally increases due to the higher-pressure distribution, and its equilibrium position moves toward the bearing center, while also increasing the gas film thickness around θ = 180° so that the pressure at the location reduces. This tendency is higher in the shimmed GFB.
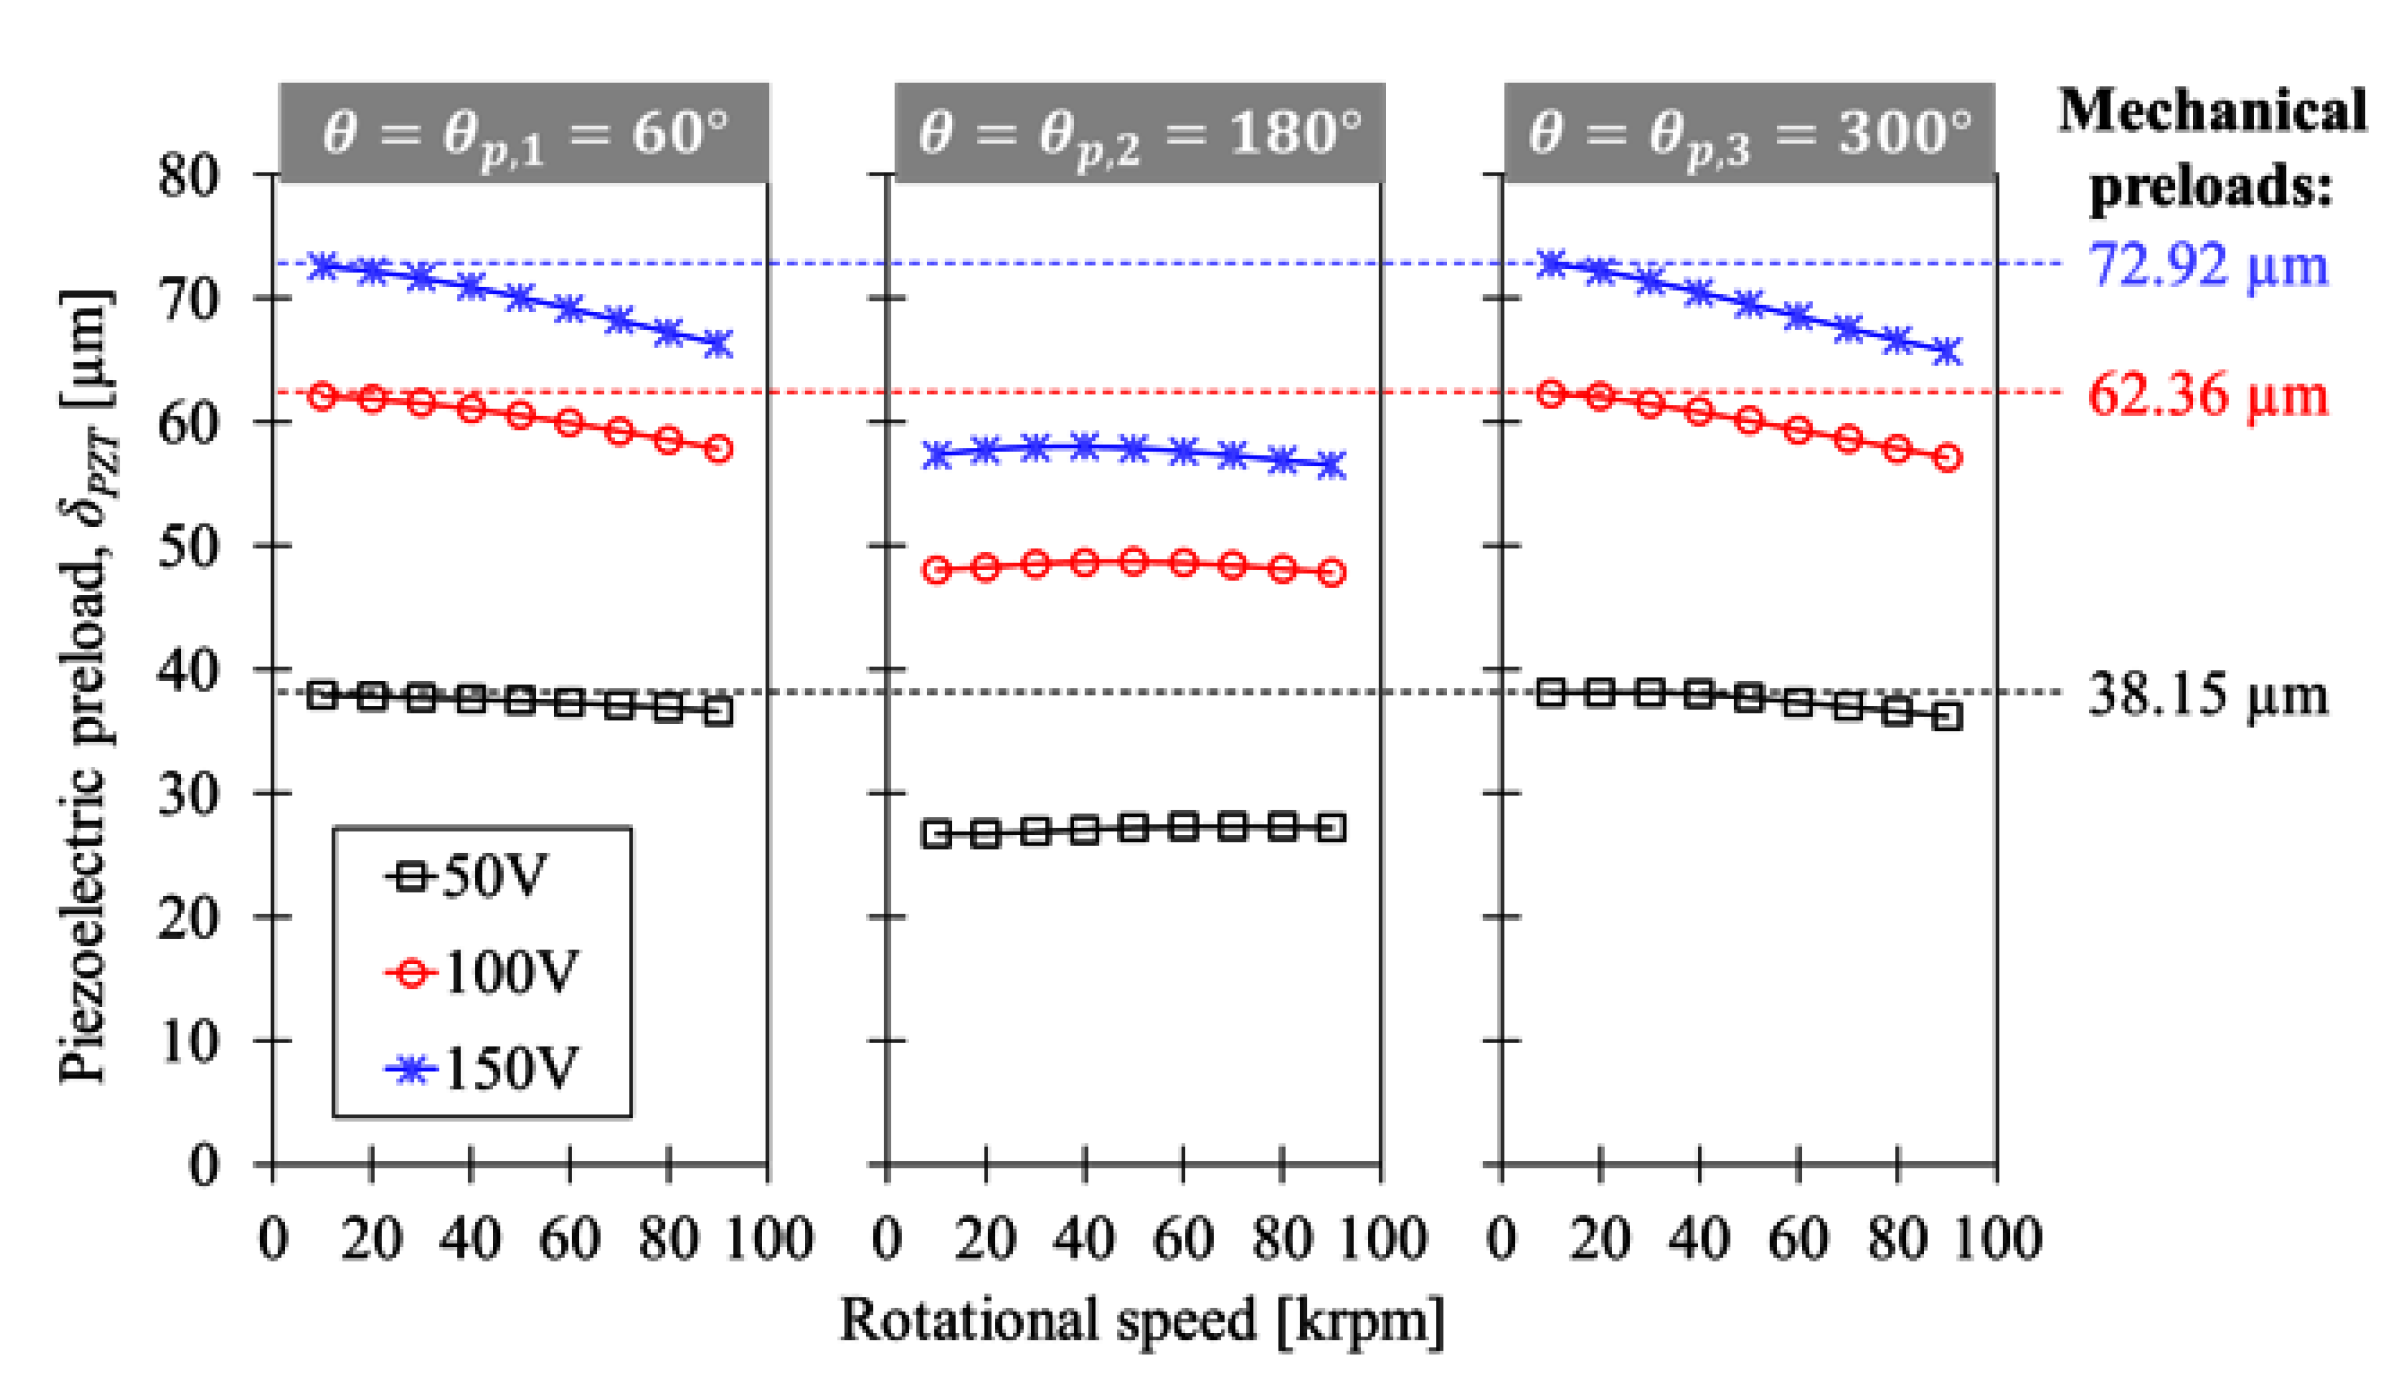
Figure 11 illustrates the predicted piezoelectric preloads versus rotational speeds at the preload locations for the C-GFB. Note that the peak gas-film pressures at the preload locations push the PZT actuators upwards, as well as the foil structure. Therefore, the compliant piezoelectric preloads show opposite trends to the gas-film pressures as the rotational speed increases. Overall, the preload effects of the C-GFB are smaller than the mechanical preload effects of the shimmed GFB, in particular, at the loaded region θ = 180°.
This result implies that the gas-film pressure can reduce the piezoelectric preload of the C-GFB owing to the low structural stiffness, particularly in the case of high-speed and high-driving voltage operation. In this scenario, the C-GFB performance may become significantly different from that of the shimmed GFB. For the C-GFB case in this study, the base piezoelectric preload under no-load condition of 72.92 µm under driving voltage of 150 V is reduced differently at each preload location of 60°, 180°, and 300°, and eventually becomes 65.36, 54.06, and 64.62 µm, respectively, at the rotational speed of 90 krpm.
As a result, the mechanical deflection reduces the preload effects of the PZT actuators and hinders the pressure generation locally during bearing operation. This is because it alleviates the wedge effect of the bearing surface. This is a significant discrepancy between the C-GFB and traditional shimmed GFBs during operation, in terms of the generation of preload. The result indicates that the PZT stack stiffness should be carefully designed and selected in the bearing design process, to maximize the control effects of the PZT actuators.
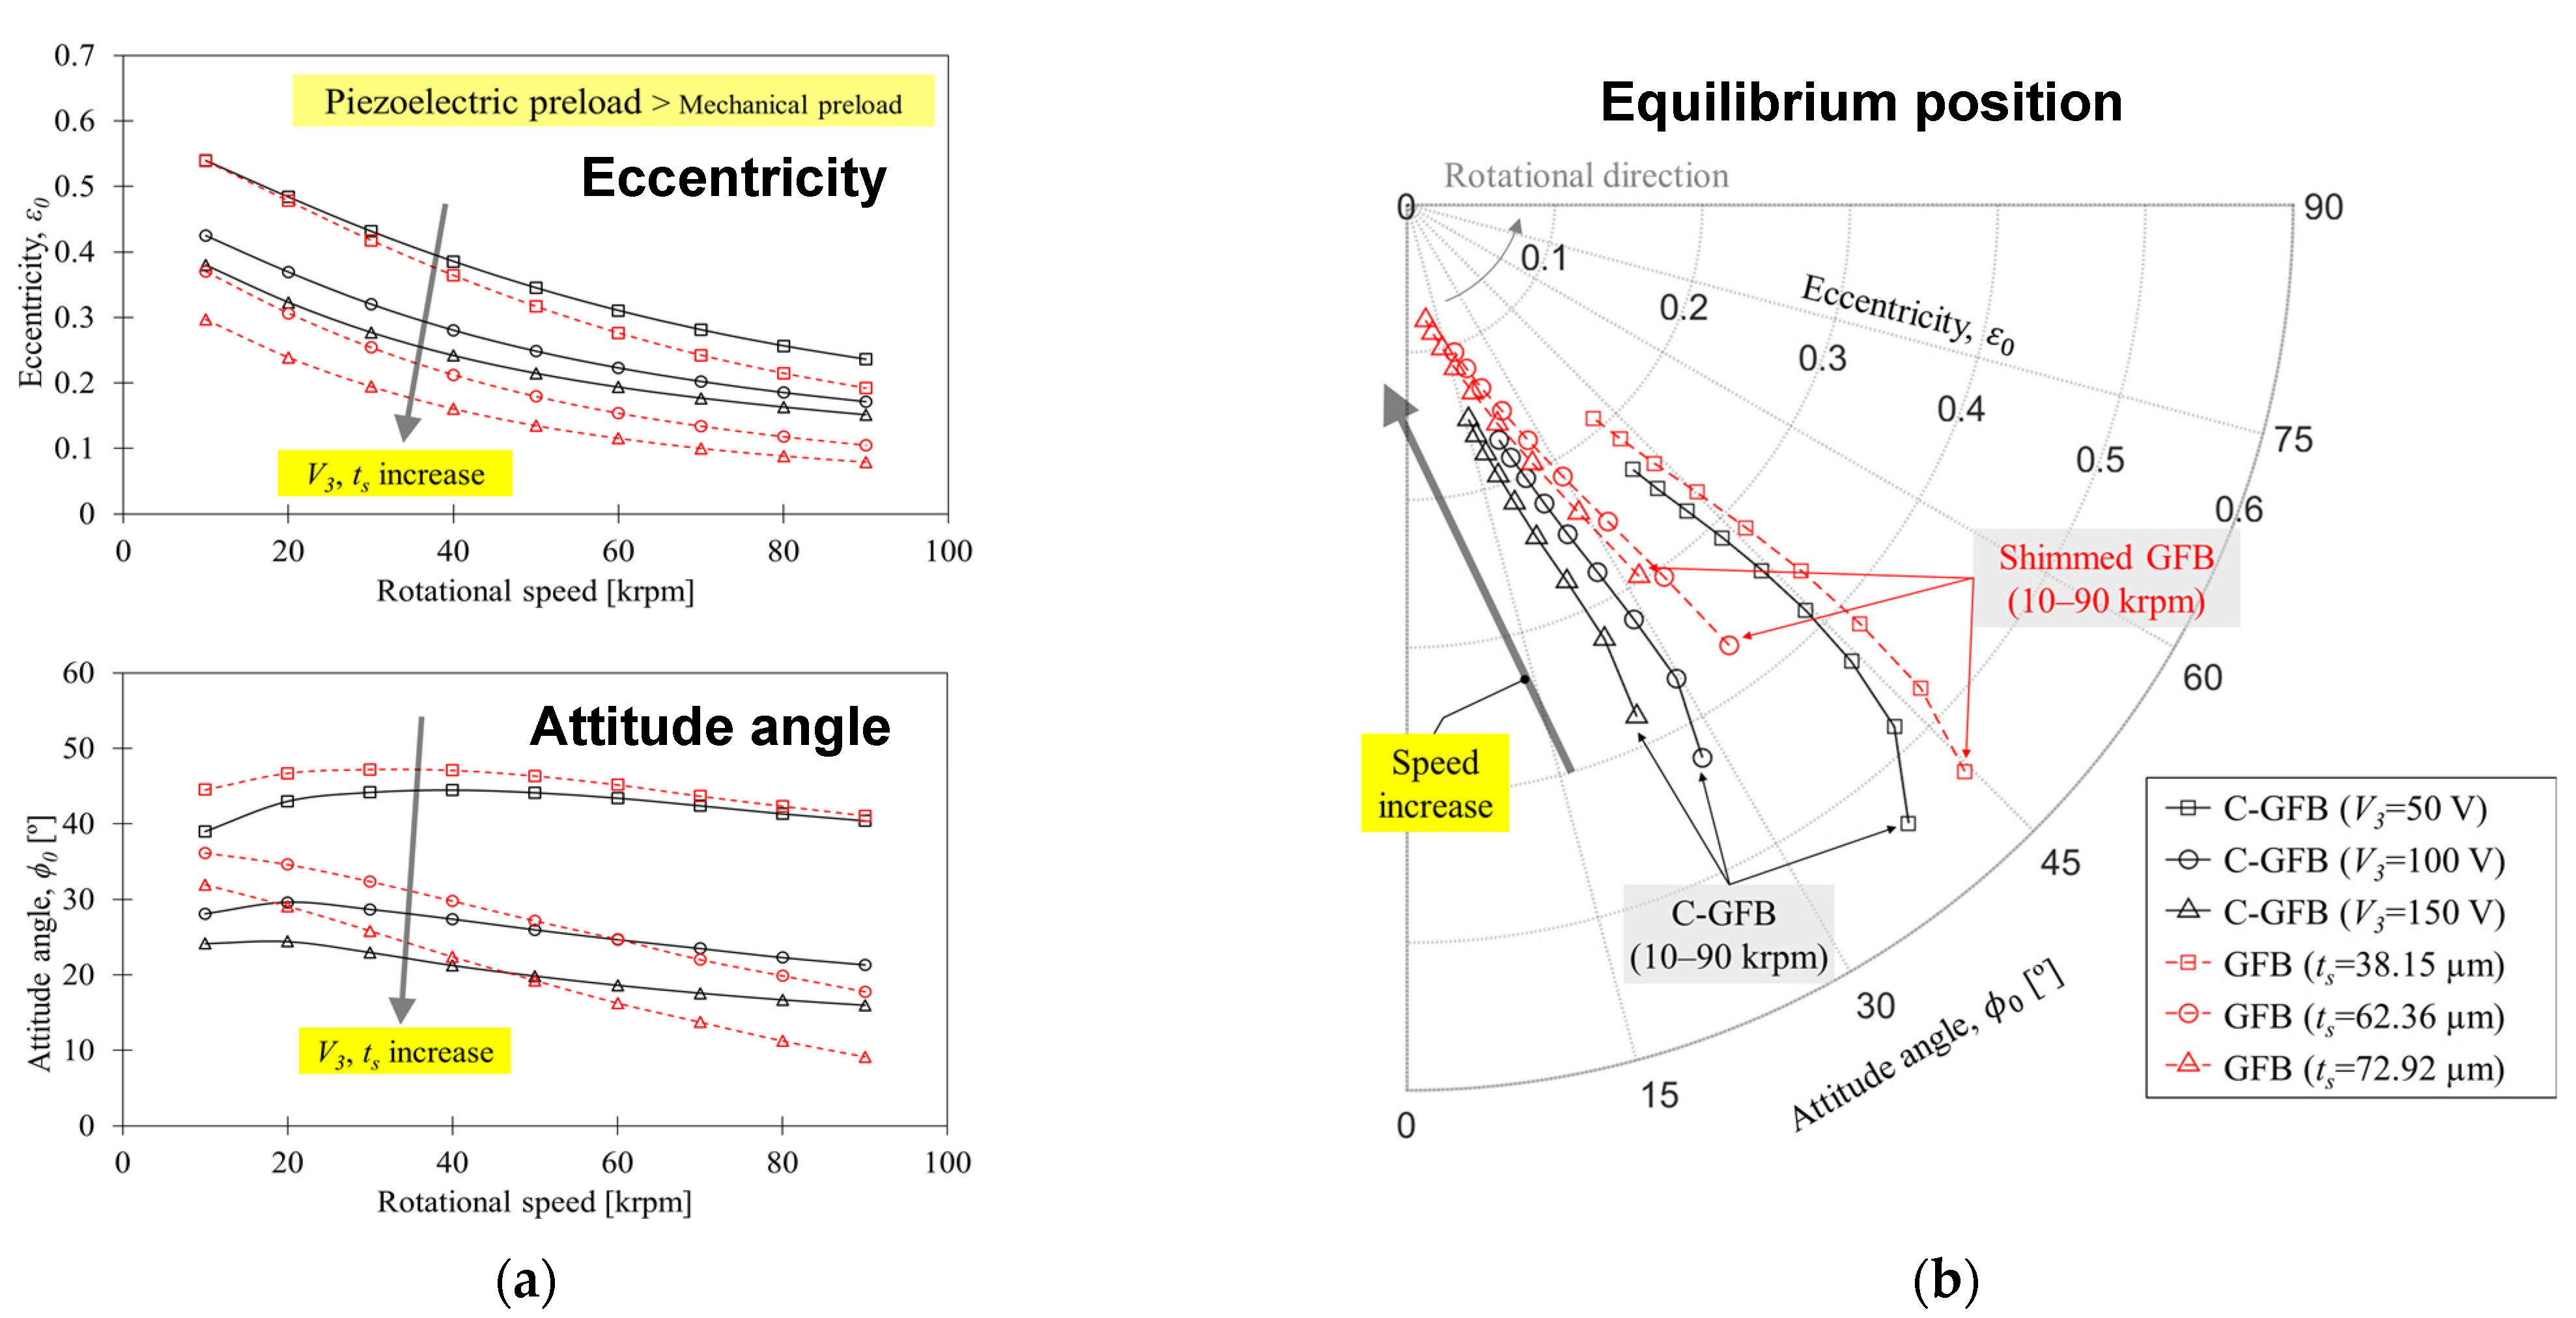
Figure 12 illustrates the predicted journal eccentricity and attitude angle versus rotational speeds. The journal eccentricity is normalized with the relation , and the journal attitude angle is defined as . The eccentricity decreases overall, and the attitude angle displays a decreasing trend with increasing rotational speeds. Notably, the C-GFB exhibits higher eccentric steady-state operation from the bearing center with greater eccentricities than the shimmed GFB due to decreases in the piezoelectric preload of the C-GFB, in particular at θ = 180°. This is because it is a key location for determining the journal eccentricity, from among the presented three PZT actuator locations. Meanwhile, the C-GFBs have larger attitude angles than the shimmed GFBs, particularly at the high speed region aside from the case of 50 V, where the lubricant begins to stiffen and the dominance of the foil structures increases. Note that small journal attitude angles generally imply reduced cross-coupled effects in the gas film, thereby exhibiting higher rotordynamic stability.
6.2. Orbit Simulation
The nonlinear orbit response of the C-GFB is carried out with an imbalance amount of 8.5 g from the rotating speed of 3 krpm up to 90 krpm with a constant acceleration of 500 rad/s2. The PZT actuators are controlled with the ramp input from 0 to 50, 100, and 150 V at the initiation of unstable motions, to investigate the capability of the C-GFBs to stabilize the unstable motions in real time. This is the major focus in the orbit simulation.
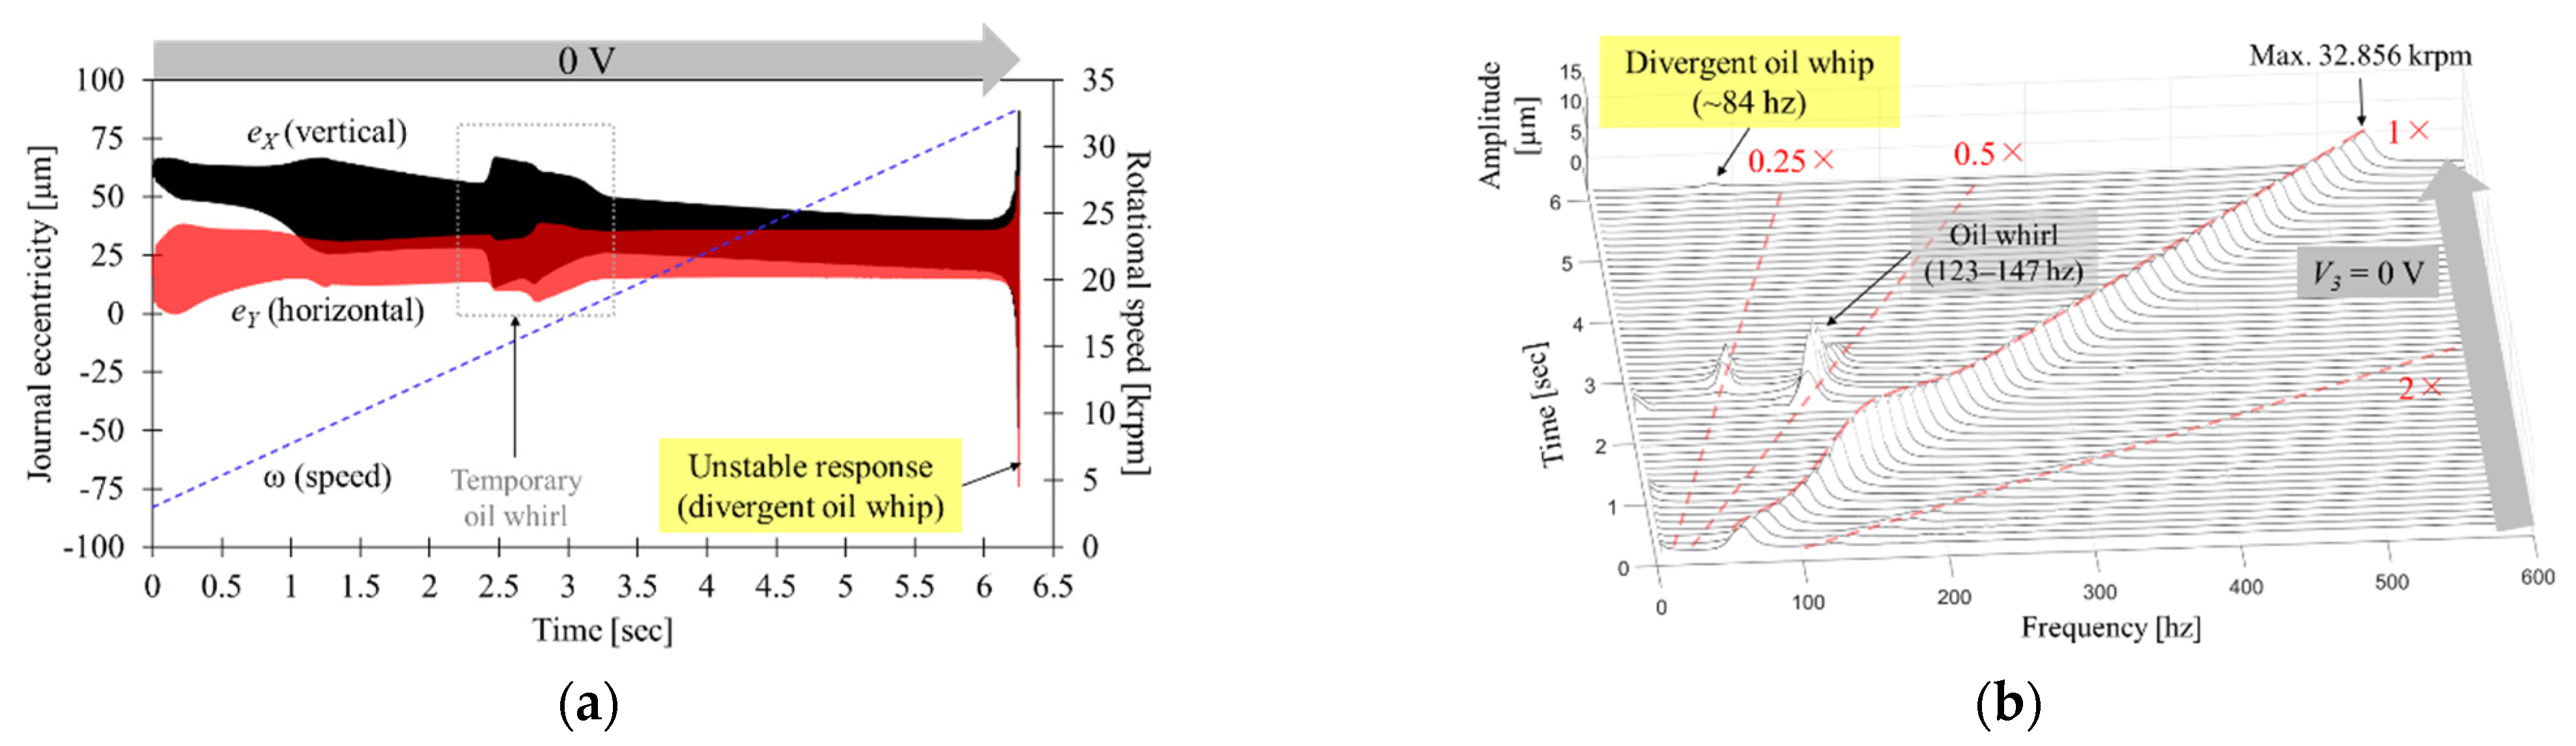
Figure 13 shows the predicted transient responses of journal eccentricities (eX, eY) and corresponding rotational speed when the driving voltage is maintained at 0 V. The result reveals that the journal responses become unstable at ~15 krpm with whirl frequencies of 123–147 Hz and disappear at ~19 krpm, considered as oil whirl motions, and finally diverge at 33 krpm because of excessive oil whip motions. Note that the divergent oil whip appears to be stable in the waterfall plot owing to the limited time resolution of the short time Fourier transform of the plot.
Note that the oil whirl and oil whip are probably the most common causes of the subsynchronous instability of hydrodynamic journal bearings. Typically, the oil whirl exhibits whirl frequency tracks at approximately one-half of the rotational speed. Meanwhile, the oil whip phenomenon exhibits the locked whirl frequency at a certain frequency related to the system’s natural frequency. This is because the oil whip occurs on those machines that are subject to oil whirl when the oil whirl frequency coincides with and becomes locked into the system’s natural frequency [6,7].
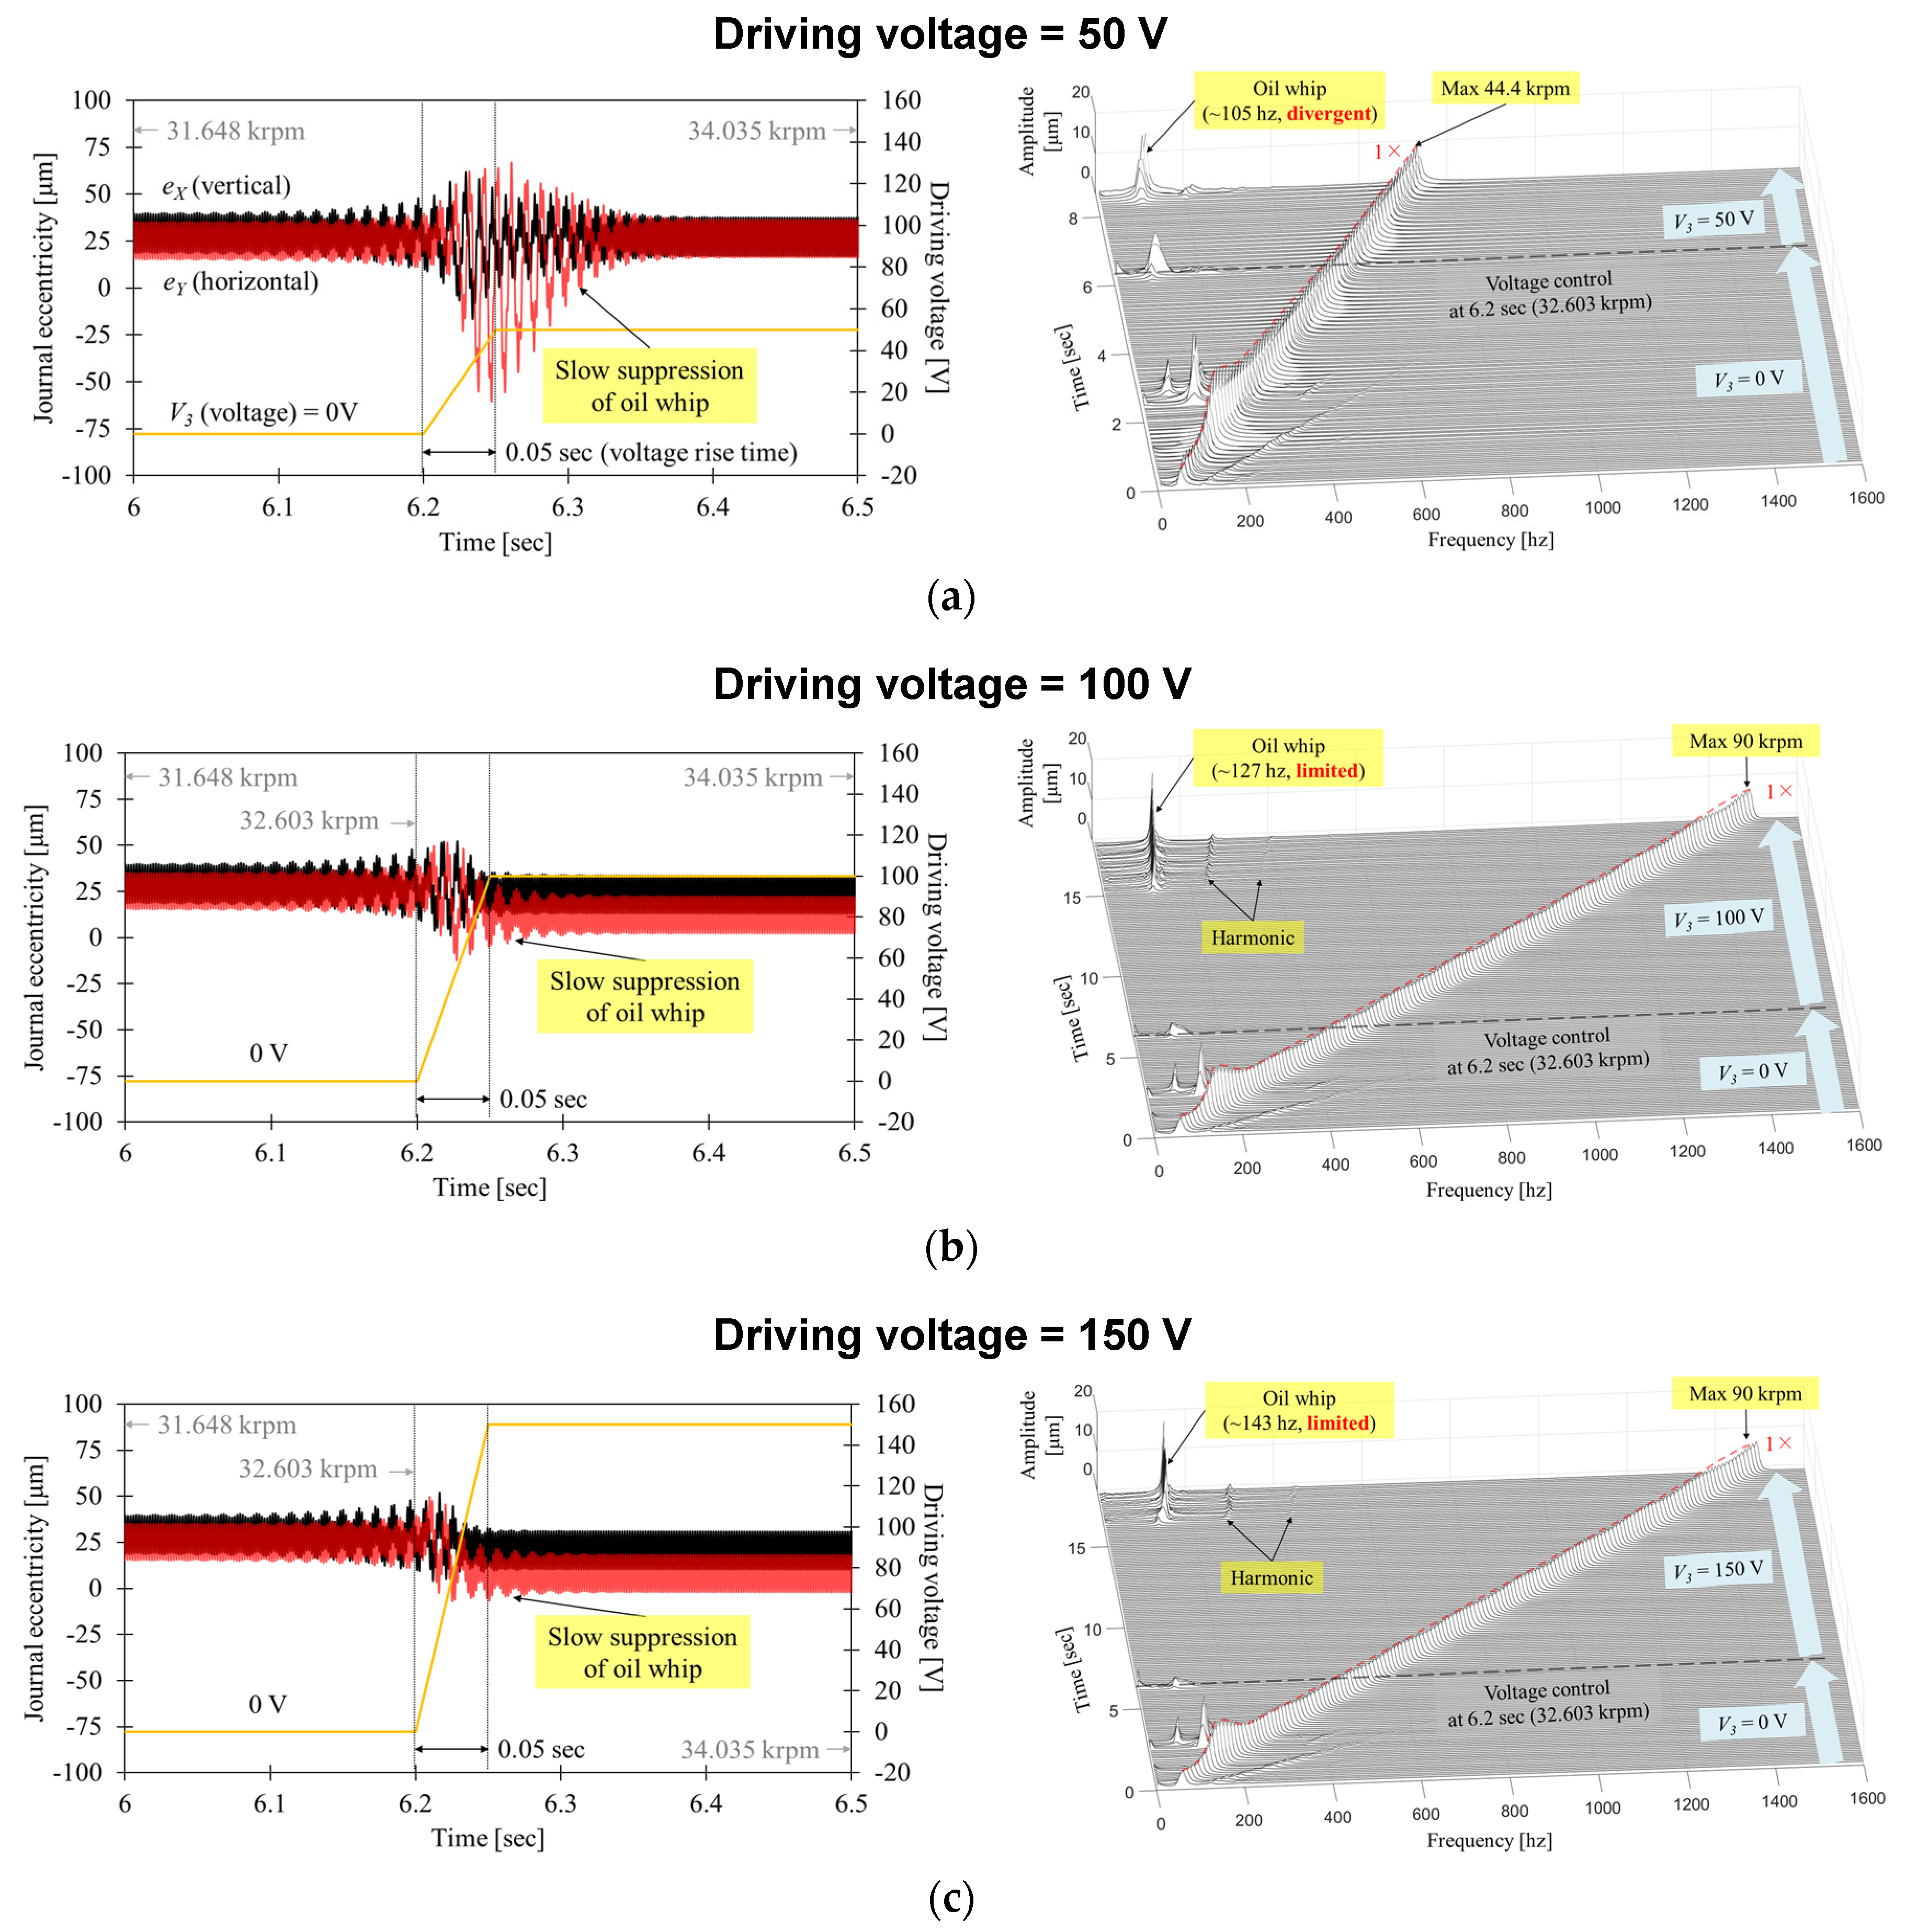
Figure 14 illustrates the predicted journal transient responses of C-GFBs with respect to various driving voltages of (a) 50 V control, (b) 100 V control, and (c) 150 V control during the speed-up simulation. The driving voltage is controlled with the ramp input from 6 to 6.5 s at the initiation of unstable responses, with a rotational speed of 32.6 krpm.
It is evident that after the real-time voltage control, the originally diverging subsynchronous motions are perfectly suppressed after a few seconds. Moreover, the journal equilibrium position moves close to the bearing center immediately. Notably, high voltage control results in relatively fast stabilization and significant variations in the journal equilibrium position.
The predicted journal transient responses are analyzed with waterfall plots for the vertical responses. The horizontal responses are omitted for brevity. The journal response in the case of the 50 V control exhibits a large subsynchronous instability with a frequency of approximately 105 Hz. It finally diverges at the rotational speed of 44.4 krpm. Meanwhile, the 100 and 150 V cases display relatively stable responses until the maximum speed of 90 krpm. These display limited oil whip motions, which do not diverge within the analysis speed range.
Notably, the whirl frequencies of the oil whip are approximately 105, 127, and 143 Hz when the driving voltage is 50, 100, and 150 V, respectively. A tendency of increasing whirl frequencies with bearing preloads was also reported by Ref. [8] in the rotordynamic experiment of shimmed GFBs, and Ref. [12] in the nonlinear rotordynamic analysis of an active GFB. It is noteworthy that the piezoelectric preload control of C-GFBs causes the gas-film to be stiff or soft depending on the voltage level. This implies that it is capable of controlling the gas-film stiffness, which mainly determines the frequency and shape of the subsynchronous motion modes [24].
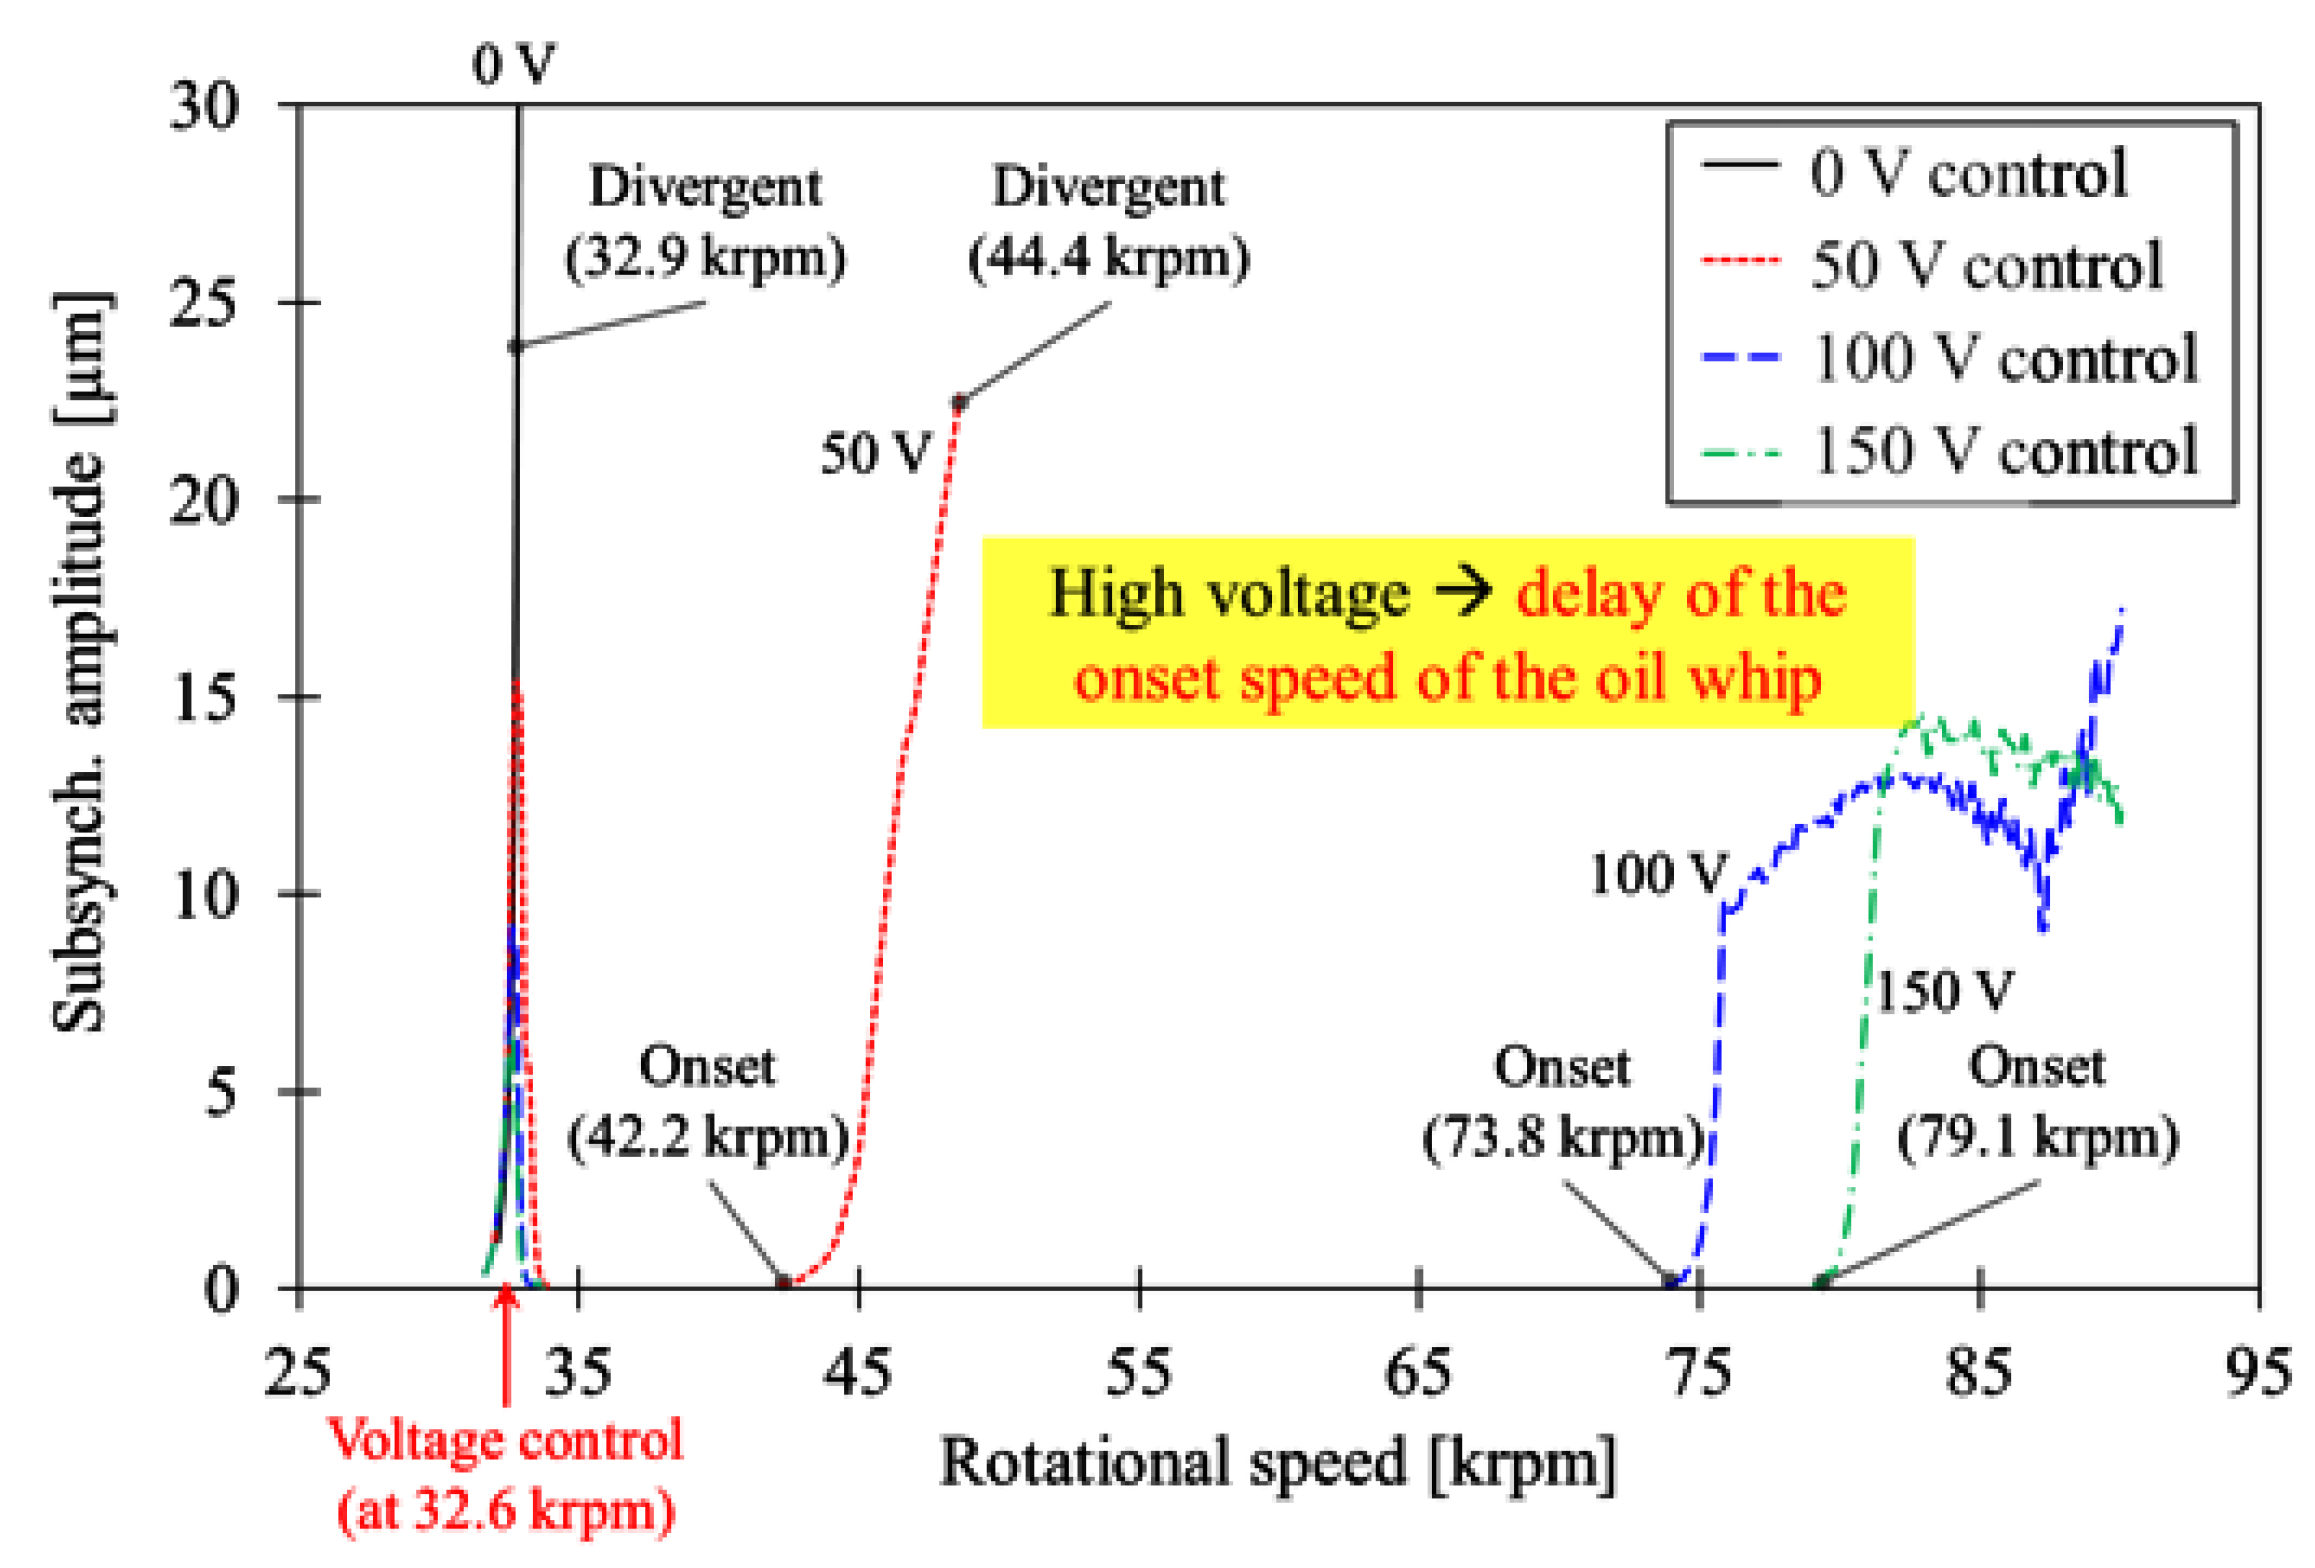
Figure 15 illustrates the filtered subsynchronous amplitudes of the journal vertical motions extracted for all the above transient responses, specifically oil whip motions. As the rotational speed increases, the oil whips initiate again. The onset speed varies according to the voltage level. It is evident that a high driving voltage results in a significant delay in the onset speed of oil whip, showing better rotordynamic performance.
7. Conclusions
This paper proposes a novel concept of the bump-type GFB with the ability to control bearing preloads and piezoelectric preloads in real time for stabilizing rotordynamic instability.
The bearing has three PZT actuators located in the circumferential direction and connected to the bearing housing at 60°, 180°, and 300°. Hydrodynamic wedge effects can be obtained by adjusting the driving voltages of the PZT actuators. An equivalent spring model of the PZT actuators and foil structures is introduced to predict the piezoelectric preloads of C-GFBs. The model is based on a constitutive equation of PZT stacks and stiffness mechanism of the PZT actuator and the bump foil. Structural characterization aids in identifying the unknown parameters of the mechanical and piezoelectric properties of PZT actuators, , , and . The first-order curve fitting is used to estimate the nonlinear PZT stack displacement; with .
The static performance analyses are carried out for the C-GFB with driving voltages of 0, 50, 100, and 150 V, and the results are compared with the shimmed GFBs. The analysis result indicates that the high driving voltage generates large peaks in the gas-film pressure, showing a favorable indication in terms of the stabilization of the performance. However, the reduction in the piezoelectric preloads, especially at the loaded region θ = 180°, is caused by the peak gas-film pressure at the preload locations, which is a significant discrepancy between the C-GFB and traditional shimmed GFBs during operation, in terms of the generation of preload. It turns out that the PZT stack stiffness should be carefully designed to maximize the piezoelectric preload effects of C-GFBs.
The nonlinear orbit simulation with real-time preload control is performed during the speed-up process from 3 to 90 krpm. Note that real-time control is the exceptional capability of the C-GFB that distinguishes it from conventional GFBs. The real-time control at 32.6 krpm stabilizes the growing oil whip immediately. In particular, a high voltage damps the oil whip relatively rapidly and alters the journal equilibrium position close to the bearing center.
Consequently, the piezoelectric-preload control alters static and dynamic characteristics of gas film by changing the voltage in real time, implying that the control can be used to shift the oil whip by certain degrees to prevent additional resonance of the other components of the system that may be affected by rotor vibration as well as delaying the onset speed of the oil whip. We expect that C-GFBs are highly effective lubrication elements suitable for several applications, in that they can adjust bearing configurations in real time according to varied system requirements and conditions by controlling the driving voltage of PZT actuators.
Author Contributions
Conceptualization, K.S.; methodology, J.P.; model development, J.P.; experimental parameter identification, J.P. and D.K.; formal analysis, J.P.; model prediction, J.P.; writing—original draft preparation, J.P. and D.K.; writing—review, K.S.; visualization, J.P.; supervision, K.S.; project administration, K.S.; funding acquisition, K.S. All authors have read and agreed to the published version of the manuscript.
Funding
This research was funded by the Korea Institute of Energy Technology Evaluation and Planning (KETEP) and the Ministry of Trade, Industry & Energy (MOTIE) of the Republic of Korea (No. 2018201010633B).
Institutional Review Board Statement
Not applicable.
Informed Consent Statement
Not applicable.
Data Availability Statement
Not applicable.
Conflicts of Interest
The authors declare no conflict of interest.
Nomenclature
| Nominal radial clearance of bearing (m) | |
| D33 | PZT coefficient of PZT stack (m/V) |
| d33 | PZT coefficient of PZT material (m/V) |
| Ep | Elastic modulus of the PZT material (N/m2) |
| Dynamic bearing reaction forces (N) | |
| Normalized gas-film thickness, | |
| PZT stack stiffness (N/m) | |
| Structural assembly stiffness (N/m3) | |
| Bump foil stiffness per unit area (N/m3) | |
| Complex bump foil stiffness per unit area (N/m3) | |
| PZT stack stiffness per unit area (N/m3) | |
| Holder spring stiffness per unit area (N/m3) | |
| Structural stiffness function (N/m3) | |
| lb | Axial bearing length (m) |
| lp | PZT material length (m) |
| Number of PZT stacked materials | |
| Journal mass (kg) | |
| Normalized gas-film pressure, | |
| R | Journal radius (m) |
| Piezoelectric preload function (m) | |
| tp | PZT material thickness (m) |
| Imbalance radius (m) | |
| Driving voltage of PZT material (V) | |
| wp | PZT material width (m) |
| X, Y, Z | Stationary coordinate systems in a bearing (m) |
| Constant related to function smoothness | |
| Bump foil loss factor, | |
| Gas-film pressure (N/m2) | |
| Local gas-film pressure (N/m2) | |
| Ambient pressure (N/m2) | |
| Piezoelectric preload (m) | |
| Deformation of bump foil (m) | |
| PZT stack displacement (m) | |
| PZT material strain | |
| εX, εY | Normalized journal eccentricities |
| Circumferential coordinate system (rad) | |
| Preload locations, n = 1, 2, 3 (rad) | |
| Angular length of the upper stinger (rad) | |
| Bearing number, | |
| local top-foil displacement (m) | |
| Air viscosity (Pa s) | |
| Excitation frequency ratio, | |
| PZT material stress (N/m2) | |
| Rotational speed (rad/s) | |
| Excitation frequency (rad/s) | |
| 1, 2, 3 | Local axes placed in PZT material |
References
- Agrawal, G.L. Foil Air/Gas Bearing Technology—An Overview. In Proceedings of the ASME International Gas Turbine and Aeroengine Congress and Exhibition, Orlando, FL, USA, 2–5 June 1997. [Google Scholar]
- Radil, K.C.; DellaCorte, C. Foil Bearing Starting Considerations and Requirements for Rotorcraft Engine Applications; Techreport 4873; NASA: Cleveland, OH, USA, 2009. [Google Scholar]
- Heshmat, H.; Walowit, J.A.; Pinkus, O. Analysis of Gas-Lubricated Foil Journal Bearings. J. Lubr. Technol. 1983, 105, 647–655. [Google Scholar] [CrossRef]
- Simek, J. Application of a New Type of Aerodynamic Tilting Pad Journal Bearing in Power Gyroscope. Eng. Mech. 2012, 19, 359–368. [Google Scholar]
- Arora, V.; Van Der Hoogt, P.J.M.; Aarts, R.G.K.M.; De Boer, A. Identification of stiffness and damping characteristics of axial air-foil bearings. Int. J. Mech. Mater. 2011, 7, 231–243. [Google Scholar] [CrossRef] [Green Version]
- Genta, G. Dynamics of Rotating Systems; Springer: New York, NY, USA, 2005; Chapter 8. [Google Scholar]
- Childs, D. Turbomachinery Rotordynamics; Wiley: New York, NY, USA, 1993; Chapter 3. [Google Scholar]
- Kim, T.H.; Andrés, L.S. Effects of a Mechanical Preload on the Dynamic Force Response of Gas Foil Bearings: Measurements and Model Predictions. Tribol. Trans. 2009, 52, 569–580. [Google Scholar] [CrossRef]
- Sim, K.; Lee, Y.-B.; Kim, T.H. Effects of Mechanical Preload and Bearing Clearance on Rotordynamic Performance of Lobed Gas Foil Bearings for Oil-Free Turbochargers. Tribol. Trans. 2013, 56, 224–235. [Google Scholar] [CrossRef]
- Schiffmann, J.; Spakovszky, Z.S. Foil Bearing Design Guidelines for Improved Stability. ASME J. Tribol. 2013, 135, 011103. [Google Scholar] [CrossRef] [Green Version]
- Feng, K.; Guan, H.-Q.; Zhao, Z.-L.; Liu, T.-Y. Active bump-type foil bearing with controllable mechanical preloads. Tribol. Int. 2018, 120, 187–202. [Google Scholar] [CrossRef]
- Guan, H.-Q.; Feng, K.; Cao, Y.-L.; Huang, M.; Wu, Y.-H.; Guo, Z.-Y. Experimental and theoretical investigation of rotordynamic characteristics of a rigid rotor supported by an active bump-type foil bearing. J. Sound Vib. 2020, 466, 115049. [Google Scholar] [CrossRef]
- Pfau, B.; Markert, R. A Two-Lobe Journal Bearing with Adjustable Gap Geometry for Vibration Reduction of Flexible Rotors. J. Tech. Mech. 2017, 37, 109–119. [Google Scholar]
- Sadri, H.; Schlums, H.; Sinapius, M. Investigation of Structural Conformity in a Three-Pad Adaptive Air Foil Bearing With Regard to Active Control of Radial Clearance. ASME J. Tribol. 2019, 141, 1–21. [Google Scholar] [CrossRef]
- Park, J.; Sim, K. A Feasibility Study of Controllable Gas Foil Bearings with Piezoelectric Materials via Rotordynamic Model Predictions. ASME J. Eng. Gas Turbines Power 2018, 141, 021027. [Google Scholar] [CrossRef]
- Odegard, G.M. Constitutive modeling of piezoelectric polymer composites. Acta Mater. 2004, 52, 5315–5330. [Google Scholar] [CrossRef] [Green Version]
- Kim, T.H.; Andrés, L.S. Heavily Loaded Gas Foil Bearings: A Model Anchored to Test Data. ASME J. Eng. Gas Turbines Power 2008, 130, 012504. [Google Scholar] [CrossRef]
- Rubio, D.; Andrés, L.S. Structural Stiffness, Dry Friction Coefficient, and Equivalent Viscous Damping in a Bump-Type Foil Gas Bearing. ASME J. Eng. Gas Turbines Power 2007, 129, 494–502. [Google Scholar] [CrossRef]
- DellaCorte, C.; Radil, K.C.; Bruckner, R.J.; Howard, S.A. Design, fabrication, and performance of open source generation I and II compliant hydrodynamic gas foil bearings. Tribol. Trans. 2008, 51, 254–264. [Google Scholar] [CrossRef]
- Sim, K.; Park, J. Performance Measurements of Gas Bearings With High Damping Structures of Polymer and Bump Foil Via Electric Motor Driving Tests and One Degree-of-Freedom Shaker Dynamic Loading Tests. ASME J. Eng. Gas Turbines Power 2017, 139, 092504. [Google Scholar] [CrossRef]
- Iordanoff, I. Analysis of an Aerodynamic Compliant Foil Thrust Bearing: Method for a Rapid Design. ASME J. Tribol. 1999, 121, 816–822. [Google Scholar] [CrossRef]
- Mostaghel, N.; Davis, T. Representations of Coulomb Friction for Dynamic Analysis. Earthq. Eng. Struct. Dyn. 1997, 26, 541–548. [Google Scholar] [CrossRef]
- Kim, D. Parametric Studies on Static and Dynamic Performance of Air Foil Bearings with Different Top Foil Geometries and Bump Stiffness Distributions. ASME J. Tribol. 2007, 129, 354–364. [Google Scholar] [CrossRef]
- Guo, Z.; Feng, K.; Liu, T.; Lyu, P.; Zhang, T. Nonlinear dynamic analysis of rigid rotor supported by gas foil bearings: Effects of gas film and foil structure on subsynchronous vibrations. J. Mech. Syst. Signal. 2018, 107, 549–566. [Google Scholar] [CrossRef]
Figure 1.
Schematic views of a controllable gas foil bearing (C-GFB) with the ability of mechanical-preload control: (a) overall configuration of C-GFB with piezoelectric (PZT) actuators and (b) bearing preload principle when actuators are electrified with certain driving voltages.
Figure 1.
Schematic views of a controllable gas foil bearing (C-GFB) with the ability of mechanical-preload control: (a) overall configuration of C-GFB with piezoelectric (PZT) actuators and (b) bearing preload principle when actuators are electrified with certain driving voltages.

Figure 2.
Schematic diagram of a PZT stack and a PZT element in axial configuration: a stack of ceramic PZT materials separated by metallic electrodes, an element with a PZT material and electrodes.
Figure 2.
Schematic diagram of a PZT stack and a PZT element in axial configuration: a stack of ceramic PZT materials separated by metallic electrodes, an element with a PZT material and electrodes.

Figure 3.
Equivalent spring model for PZT actuators and foil structures in the local area () when local gas-film pressure acts on the local top foil.
Figure 3.
Equivalent spring model for PZT actuators and foil structures in the local area () when local gas-film pressure acts on the local top foil.

Figure 4.
Photographic images of the fabricated C-GFB with PZT actuators.

Figure 5.
PZT coefficient (, ) measurement: (a) measurement setup for PZT stacks’ displacements, (b) the measured PZT stack displacement and curve fitting functions with respect to driving voltages.
Figure 5.
PZT coefficient (, ) measurement: (a) measurement setup for PZT stacks’ displacements, (b) the measured PZT stack displacement and curve fitting functions with respect to driving voltages.

Figure 6.
Measurement of structural stiffness () of PZT stacks: (a) test rig for recording PZT stack displacement and applied static load, (b) measured PZT stack displacement versus static loads for stack #1, and (c) estimated PZT stack stiffness for stacks #1, #2, and #3.
Figure 6.
Measurement of structural stiffness () of PZT stacks: (a) test rig for recording PZT stack displacement and applied static load, (b) measured PZT stack displacement versus static loads for stack #1, and (c) estimated PZT stack stiffness for stacks #1, #2, and #3.

Figure 7.
Predicted structural stiffness function () versus circumferential coordinate, with respect to constant value related to function smoothness.
Figure 7.
Predicted structural stiffness function () versus circumferential coordinate, with respect to constant value related to function smoothness.

Figure 8.
Comparison of C-GFB to shimmed GFB with identical mechanical preloads.

Figure 9.
Predicted mid-plane gas film pressure and thickness distributions of (a) C-GFB and (b) shimmed GFB under a rotational speed of 50 krpm.
Figure 9.
Predicted mid-plane gas film pressure and thickness distributions of (a) C-GFB and (b) shimmed GFB under a rotational speed of 50 krpm.

Figure 10.
Predicted local gas-film pressure versus rotational speeds with respect to circumferential locations for C-GFB and shimmed GFB.
Figure 10.
Predicted local gas-film pressure versus rotational speeds with respect to circumferential locations for C-GFB and shimmed GFB.

Figure 11.
Predicted piezoelectric preloads versus rotational speeds with respect to preload locations of for the C-GFB.
Figure 11.
Predicted piezoelectric preloads versus rotational speeds with respect to preload locations of for the C-GFB.

Figure 12.
Predicted journal eccentricity and attitude angle for C-GFB and shimmed GFB: (a) eccentricity and attitude angle, and (b) equilibrium position.
Figure 12.
Predicted journal eccentricity and attitude angle for C-GFB and shimmed GFB: (a) eccentricity and attitude angle, and (b) equilibrium position.

Figure 13.
Predicted journal responses of C-GFB with driving voltage of 0 V during the speed-up simulation starting from 3 krpm: (a) transient response and rotational speed, (b) waterfall plot for vertical journal motion (eX).
Figure 13.
Predicted journal responses of C-GFB with driving voltage of 0 V during the speed-up simulation starting from 3 krpm: (a) transient response and rotational speed, (b) waterfall plot for vertical journal motion (eX).

Figure 14.
Predicted journal transient responses of C-GFBs with respect to various driving voltages of (a) 50 V control, (b) 100 V control, and (c) 150 V control during the speed-up simulation.
Figure 14.
Predicted journal transient responses of C-GFBs with respect to various driving voltages of (a) 50 V control, (b) 100 V control, and (c) 150 V control during the speed-up simulation.

Figure 15.
Filtered subsynchronous amplitudes of journal vertical motions (oil whip) during the speed-up process.
Figure 15.
Filtered subsynchronous amplitudes of journal vertical motions (oil whip) during the speed-up process.


Table 1.
Design properties of C-GFB with PZT actuators.
| Part | Parameter | Value | Unit |
|---|---|---|---|
| PZT stack | Thickness, | 42.00 | mm |
| Width() × length() | 5 × 5 | mm | |
| Max. driving voltage range, | 150 | V | |
| Piezoelectric coefficient (manufacturer’s data), | 0.467 | µm/V | |
| Foil structure | Number of foil strip | 1 | |
| Foil Thickness (top, bump/bottom) | 0.147, 0.127 | mm | |
| Bump Height | 0.508 | mm | |
| Bump Pitch | 4.572 | mm | |
| Bump Half length | 1.810 | mm | |
| Foil structure thickness | 0.782 | mm | |
| Foil Young’s modulus | 214 | GPa | |
| Foil Poisson’s ratio | 0.29 | ||
| Foil material | Inconel X750 | ||
| Structural loss factor of foil structure | 0.1 | ||
| Bearing | Journal diameter | 40.00 | mm |
| Bearing Axial length | 35.00 | mm | |
| Nominal radial clearance | 0.10 | mm | |
| Number of preloads | 3 | ||
| Preload angular location | 60, 180, 300 | ° | |
| Preload arc length | 27.7 | ° |
Table 2.
Identified parameters of equivalent spring model of PZT actuator and foil structures.
| Part | Symbol | Value | Note |
|---|---|---|---|
| PZT coefficient of a PZT stack [µm/V] | measured | ||
| measured | |||
| PZT stack stiffness per unit area [N/m3] | measured | ||
| Holder spring stiffness per unit area [N/m3] | Provided | ||
| Bump foil stiffness per unit area [N/m3] | calculated from Ref. [21] |
Publisher’s Note: MDPI stays neutral with regard to jurisdictional claims in published maps and institutional affiliations. |
© 2021 by the authors. Licensee MDPI, Basel, Switzerland. This article is an open access article distributed under the terms and conditions of the Creative Commons Attribution (CC BY) license (http://creativecommons.org/licenses/by/4.0/).
Share and Cite
MDPI and ACS Style
Park, J.; Kim, D.; Sim, K. Rotordynamic Analysis of Piezoelectric Gas Foil Bearings with a Mechanical Preload Control Based on Structural Parameter Identifications. Appl. Sci. 2021, 11, 2330. https://doi.org/10.3390/app11052330
AMA Style
Park J, Kim D, Sim K. Rotordynamic Analysis of Piezoelectric Gas Foil Bearings with a Mechanical Preload Control Based on Structural Parameter Identifications. Applied Sciences. 2021; 11(5):2330. https://doi.org/10.3390/app11052330
Chicago/Turabian StylePark, Jisu, Donghee Kim, and Kyuho Sim. 2021. "Rotordynamic Analysis of Piezoelectric Gas Foil Bearings with a Mechanical Preload Control Based on Structural Parameter Identifications" Applied Sciences 11, no. 5: 2330. https://doi.org/10.3390/app11052330
Note that from the first issue of 2016, this journal uses article numbers instead of page numbers. See further details here.