Article

NIRS Estimation of Drought Stress on Chemical Quality Constituents of Taro (Colocasia esculenta L.) and Sweet Potato (Ipomoea batatas L.) Flours

by
Carla S. S. Gouveia
1,2,*,
Vincent Lebot
3 and
Miguel Pinheiro de Carvalho
1,2
1
ISOPlexis Genebank, Faculty of Life Sciences, Campus da Penteada, University of Madeira, 9020-105 Funchal, Madeira, Portugal
2
CITAB, Centre for the Research and Technology of Agro-Environmental and Biological Sciences, University of Trás-os-Montes e Alto Douro, 5000-801 Vila Real, Portugal
3
CIRAD, Centre de Coopération International pour la Recherche Agronomique et le Développement, P.O. Box 946, Port-Vila 678, Vanuatu
*
Author to whom correspondence should be addressed.
Appl. Sci. 2020, 10(23), 8724; https://doi.org/10.3390/app10238724
Submission received: 27 October 2020 / Revised: 2 December 2020 / Accepted: 3 December 2020 / Published: 5 December 2020
(This article belongs to the Special Issue Applications of Optical Spectroscopy in Plant Sciences)

Abstract

:
Taro (Colocasia esculenta (L.) Schott) and sweet potato (Ipomoea batatas (L.) Lam.) are important food crops worldwide, whose productivity is threatened by climatic constraints, namely drought. Data calibration, validation, and model development of high-precision near-infrared spectroscopy (NIRS) involving multivariate analyses are needed for the fast prediction of the quality of tubers and shoots impacted by drought stress. The main objective of this study was to generate accurate NIRS models for quality assessment of taro and sweet potato accessions (acc.) subjected to water scarcity conditions. Seven taro and eight sweet potato acc. from diverse geographical origins were evaluated for nitrogen (N), protein (Pt), starch (St), total mineral (M), calcium oxalate (CaOx), carbon isotope discrimination (Δ13C), and nitrogen isotopic composition (δ15N). Models were developed separately for both crops underground and aboveground organs. N, Pt, St, and M models could be used as quality control constituents, with a determination coefficient of prediction (r2pred) between 0.856 and 0.995. δ13C, δ15N, and CaOx, with r2pred between 0.178 and 0.788, could be used as an informative germplasm screening tool. The approach used in the present study demonstrates NIRS’s potential for further research on crop quality under drought.

1. Introduction

Tropical tuber crops, such as taro [Colocasia esculenta (L.) Schott] and sweet potato [Ipomoea batatas (L.) Lam.], are widely consumed, with significant food and nutritional security contribution in developing countries [1,2,3,4].
Taro belongs to the family Araceae and needs relatively high-water availability (up to 3500 mm) to achieve optimum growth and production [2,3,5]. Taro corms could be processed into fresh or fermented paste, flour, chips, flakes, and beverages, and contain beneficial nutritional components, such as a good amount of dietary fiber, highly digestible starch granules, and mucilage [2,3]. Taro leaves are also a good source of protein and minerals, consumed as a steamed or boiled vegetable [2,5].
Sweet potato, belonging to the family Convolvulaceae, requires up to 1000 mm of rainfall or irrigation water supply for the good development of the storage root tubers. Sweet potato leaves and storage roots (often called tubers) have remarkable importance in diverse uses from feed consumption and industrial sectors, such as animal feed, flour, starch, glucose, candy, noodles, natural colorants, and alcohol [2,5]. The leaves are a good source of protein and minerals, and the tubers are mainly composed of carbohydrates consisting of starch and sugars [5].
The raw consumption of both taro and sweet potato crops is avoided as they contain different oxalic acid concentration as crystals of calcium oxalate (CaOx) in their tissues, especially under stress conditions (e.g., drought), which negatively affects their nutritional value and quality [6,7,8].
Protein (Pt), nitrogen (N), starch (St), total minerals (M), crude fiber (Fb), and CaOx are the major quality constituents analyzed by laboratories for both crops, either grown under non-stress conditions [7,9,10,11,12,13,14,15,16,17,18], or low-input [19], different irrigation [20], rain-fed [21,22,23], or other environmental conditions [4,5,24,25,26]. Taro growth [27,28] and sweet potato quality under drought conditions have recently been studied [29]. However, the analytical process for the major crop quality constituents is still constrained by cumbersome laboratory protocols.
Near-infrared spectroscopy (NIRS) is a fast and reliable spectral technique that allows the screening of numerous varieties, recommended for plant breeding and improvement programs [18,30,31]. Due to its speed of analysis, the accuracy of results, versatility, ease of sample preparation, multiple sample determination in a single operation, without using any chemical reagents allied to a low-cost technique, NIRS has been widely used to characterize several parameters in biological samples [30,31]. The introduction of several new features over the conventional NIR spectroscopy in the last decade led to its development, passing from the optical light beam scatters to the recent inputs of hyperspectral sample surface imaging [32]. NIR spectroscopy uses high-precision spectral techniques that evolve complex computations, operating chemometric algorithms for preprocessing and multivariate data analysis [32,33].
Beyond quality control through the quantification of major chemical constituents, it is essential to link complex phenotypes and chemotypes to plant breeding in changing environments, especially under drought stress [34,35]. Drought stress is not static and affects crops with variable length and severity over their life cycle as one of the main collateral consequences of climate change, leading to changes in chemical composition, productivity, and quality of harvest products as a physiological crop response to stress [36,37]. Depending on drought conditions, there are direct correlations between major quality constituents and phenotype [37].
The quality constituents of taro and sweet potato underground organs [starch and total sugars (as carbohydrates), N, Pt, and M] have been predicted by conventional NIRS [10,16,17,18]. Other components, such as crude fiber and carbon isotope discrimination (Δ13C) in cereals [38,39] and compound feeds [40], as well as carbon and nitrogen isotopic compositions (δ13C and δ15N) in plant tissues [41], were also predicted by conventional NIRS. Hitherto, the application of NIRS modeling to register the influence of drought stress on the quality constituents of both the under and aboveground crop plant organs is rather limited. No study has shown its application in the evaluation of the quality changes related to the physiological response of taro and sweet potato crops to stress conditions, when subjected to water scarcity. In current breeding programs, it is crucial to use fast tools for phenotyping the recurrent selected quality traits, linked with a fast-physiological response to stress. NIRS can be used for the prediction analysis of major quality constituents and can replace the costly laboratory analysis, and contribute to predicting crop physiological responses to drought. The development of NIRS technological application for such purposes could ease the detection of plant response to water scarcity through physiologic and quality traits that could be used for research, or breeders, and agri-food companies.
The main objectives of the present study were (1) to develop accurate NIR prediction models of chemical quality constituents (N, Pt, St, Fb, M, CaOx, δ13C, Δ13C, δ15N, and total carbon (TC)), using the flour of the underground and aboveground organs of taro and sweet potato crops subjected to drought stress; and (2) to clarify the relationships between phenotype drought response, chemotype, and other major chemical quality constituents, using the generated NIR models to help monitor their tolerance or susceptibility to drought stress.

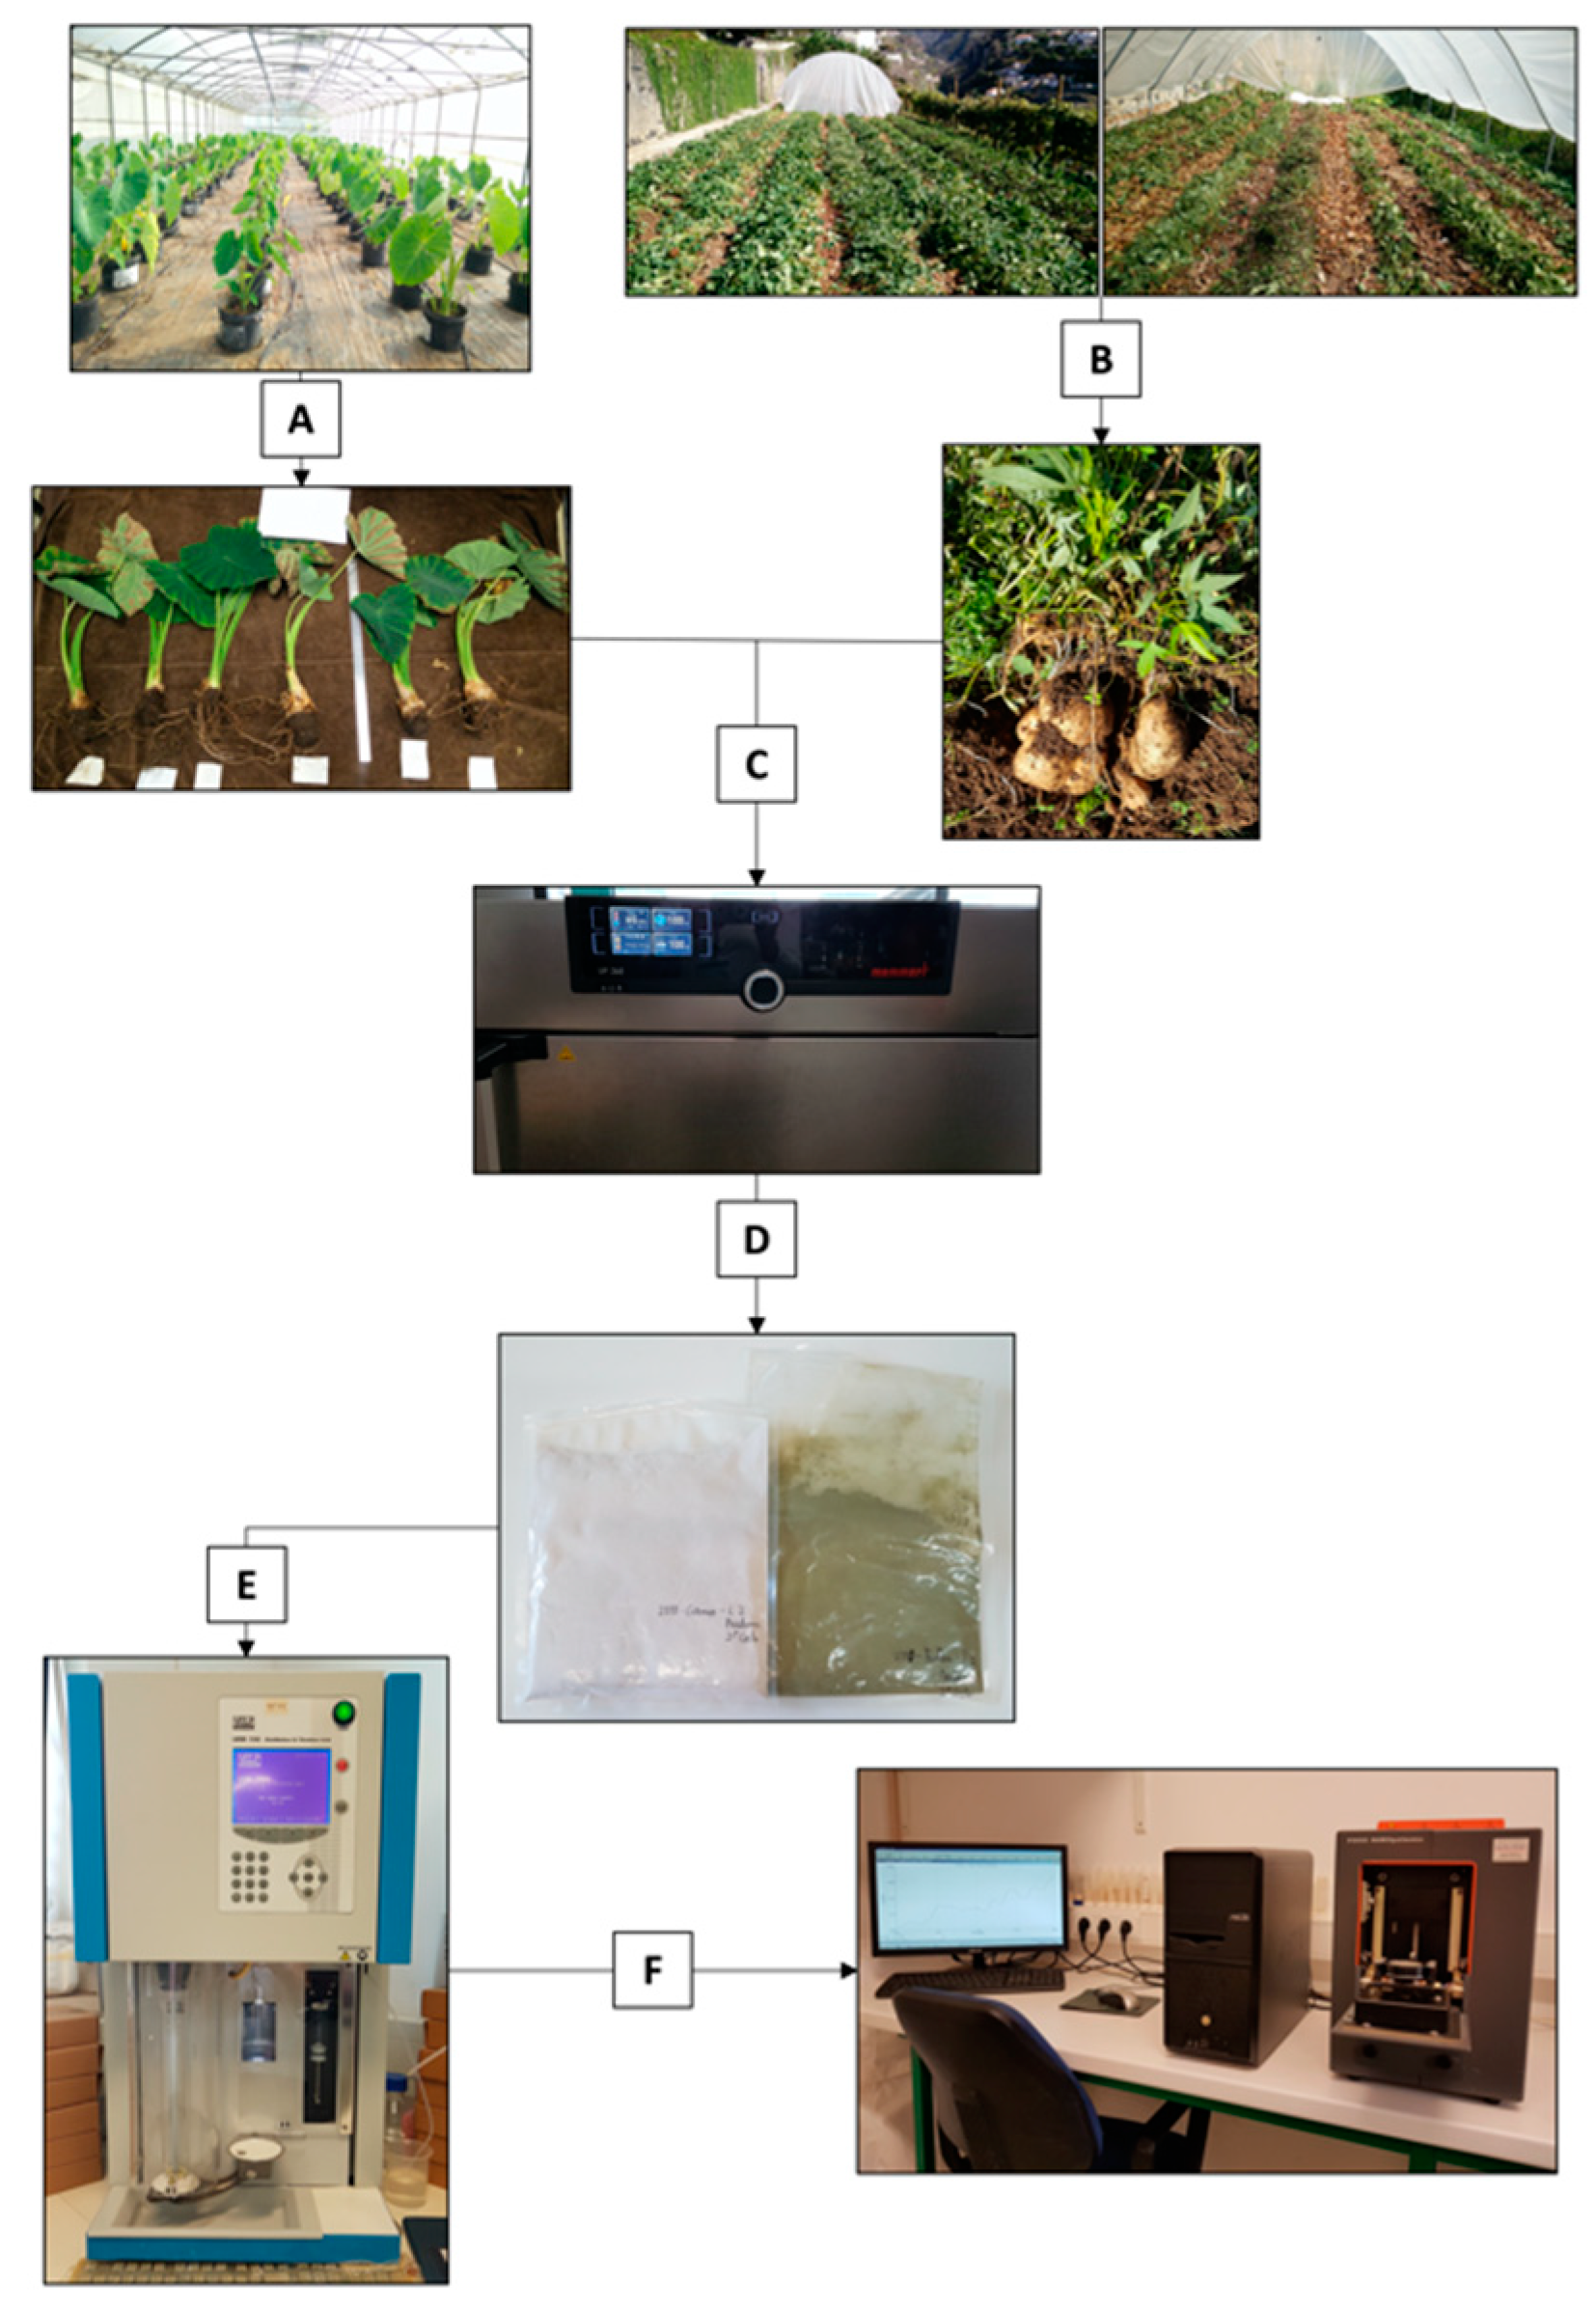
2. Materials and Methods

2.1. Sample Preparation and Chemical Analysis

Seven taro and eight sweet potato accessions (acc.) were cultivated in six plots (three experimental replicates for control, and three experimental replicates for drought) to determine their physiological response to water scarcity (Table 1).
The taro assay (Figure 1) was performed in an open greenhouse at the Preces experimental station (32°39′ N, 16°58′ W, 188 m a.s.l., CȦmara de Lobos, Madeira, Portugal), with the implementation of drought conditions for seven months, for two agronomic trials in 2015 and 2017 [42]. Similarly, the sweet potato assay (Figure 1) was established at the ISOPlexis experimental field (32°39′ N, 16°55′ W, 174 m a.s.l., Funchal, Madeira, Portugal), in randomly split-plot field design, with water scarcity conditions applied for three months, for two trials in 2017 and 2018 [43]. The trials were established on soil free of chemical contaminants, without the addition of any fertilizers or phytopharmaceutical products.
At the end of each trial, 336 taro corm and shoot (petioles and leaves) and 384 sweet potato storage root and shoot (stem, stalk, and leaves) samples were harvested from the control and drought plots. All samples were cleaned under running water, weighed with a scale (Sartorius Basic BA2100S, Göttingen, Germany), sliced (2–3 mm thick) with a mandolin slicer, dehydrated using an air oven at 65 °C during 48 h (Memmert UF260, Schwabach, Germany), and finely milled (IKA-Werke M20, Staufen, Germany). The flour was placed into bags (Termofilm PA/PE), vacuum-sealed (Audionvac VMS153, Weesp, The Netherlands), and stored at −35 °C (Liebherr ProfiLine GGPV6570, Schwabach, Germany) until analysis.
The flours from the 1st trial were chemically evaluated and used as reference values for the above and underground organs, for the following constituents: nitrogen (N), protein (Pt), starch (St), crude fiber (Fb), total minerals (M), calcium oxalate (CaOx), carbon isotopic composition (δ13C), carbon isotope discrimination (Δ13C), nitrogen isotopic composition (δ15N), and total carbon (TC) content.
Nitrogen and protein content were determined by the Kjeldahl method, using a distillation and titration automatic unit (Velp Scientifica UDK 152, Milan, Italy), with the factor Nx6.25 applied to convert the total nitrogen to crude protein content [44]. Starch was determined according to Hodge and Hofreiter [45] using a spectrophotometer UV/Vis (Shimadzu, 2401 PC, Kyoto, Japan) with the UV Probe 2.52 software. Total mineral or ash content was gravimetrically determined using a furnace at 550 °C (Ney Vulcan Model 3-550, Yucaipa, CA, USA) [44]. Crude fiber was determined by a raw fiber extractor (Velp Scientifica FIWE 6, Usmate, Italy), according to the modified Scharrer method [46]. Calcium oxalate was obtained by extraction with boiling sulfuric acid (H2SO4, 20%) [47] and calculated from consumption of permanganate potassium (KMnO4, 0.05M) [23,48]. The isotopes δ13C, Δ13C, δ15N, and TC were determined at the Natural Resources Analytical Laboratory at the University of Alberta (Edmonton, Canada), using the micro-chemical method [49], and the Delta V Advantage Continuous Flow Isotope Ratio Mass Spectrometer (CF-IRMS, Thermo Finnigan Corp, Bremen, Germany).

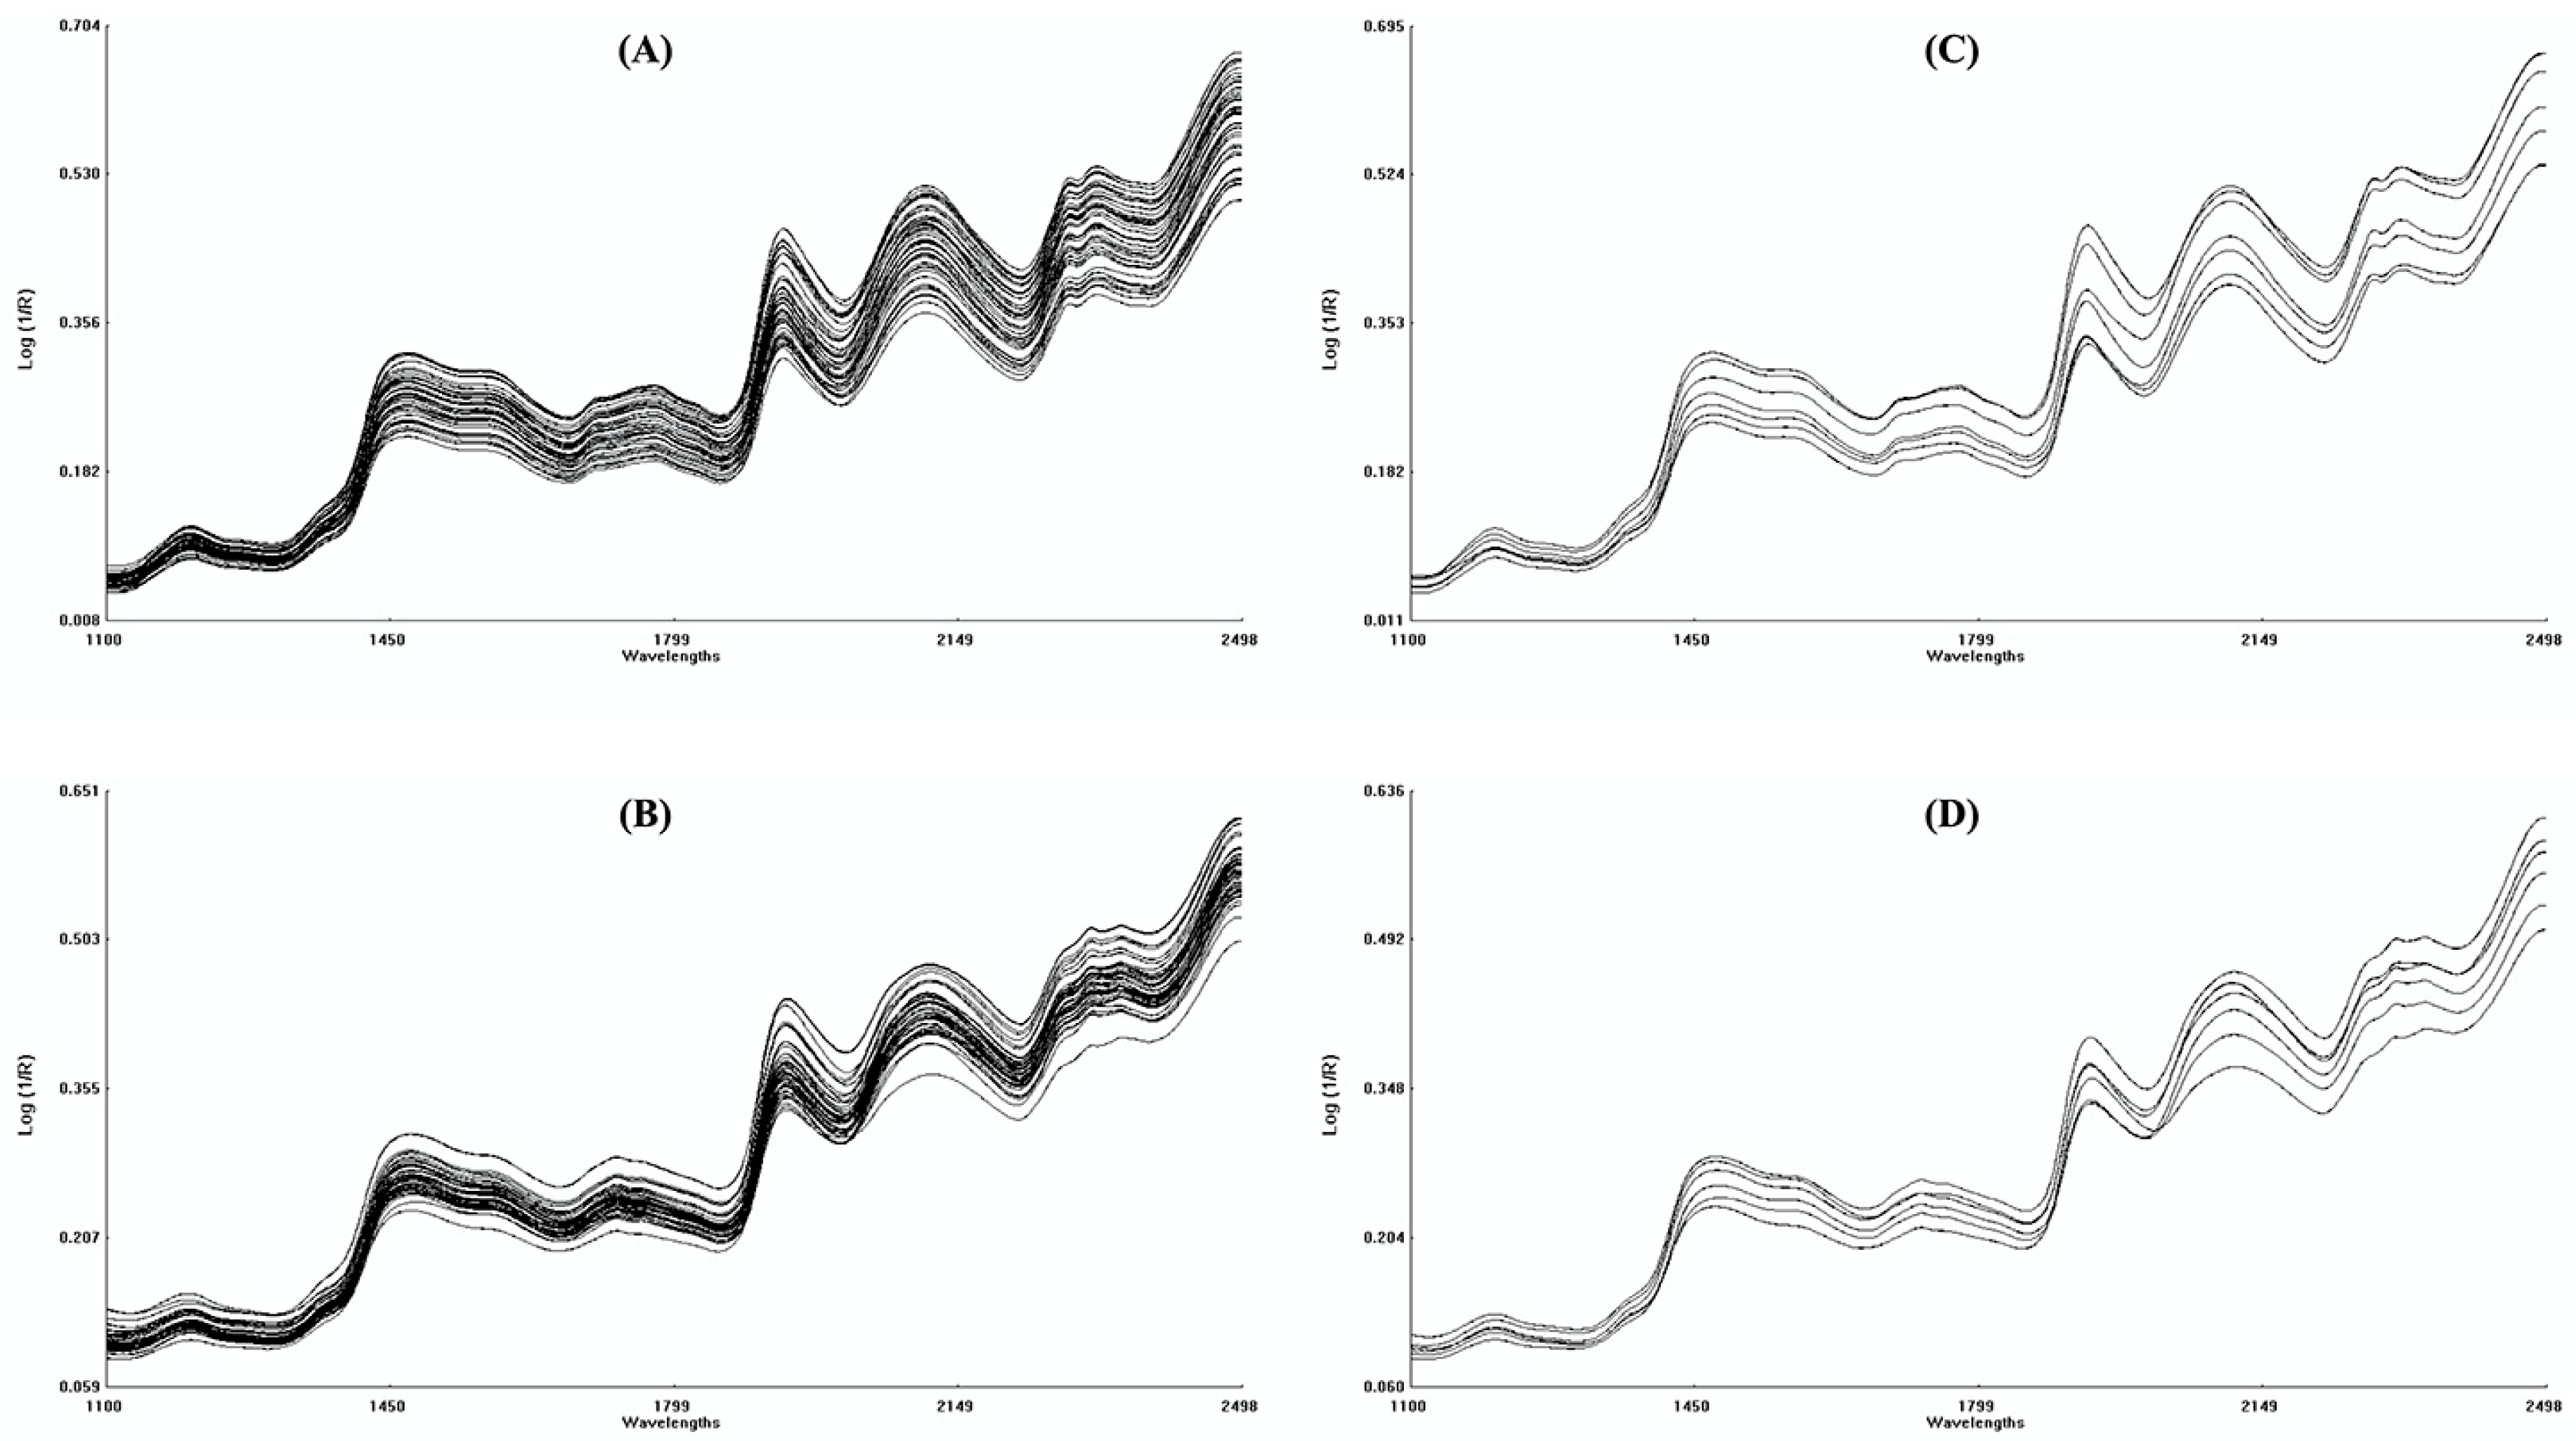
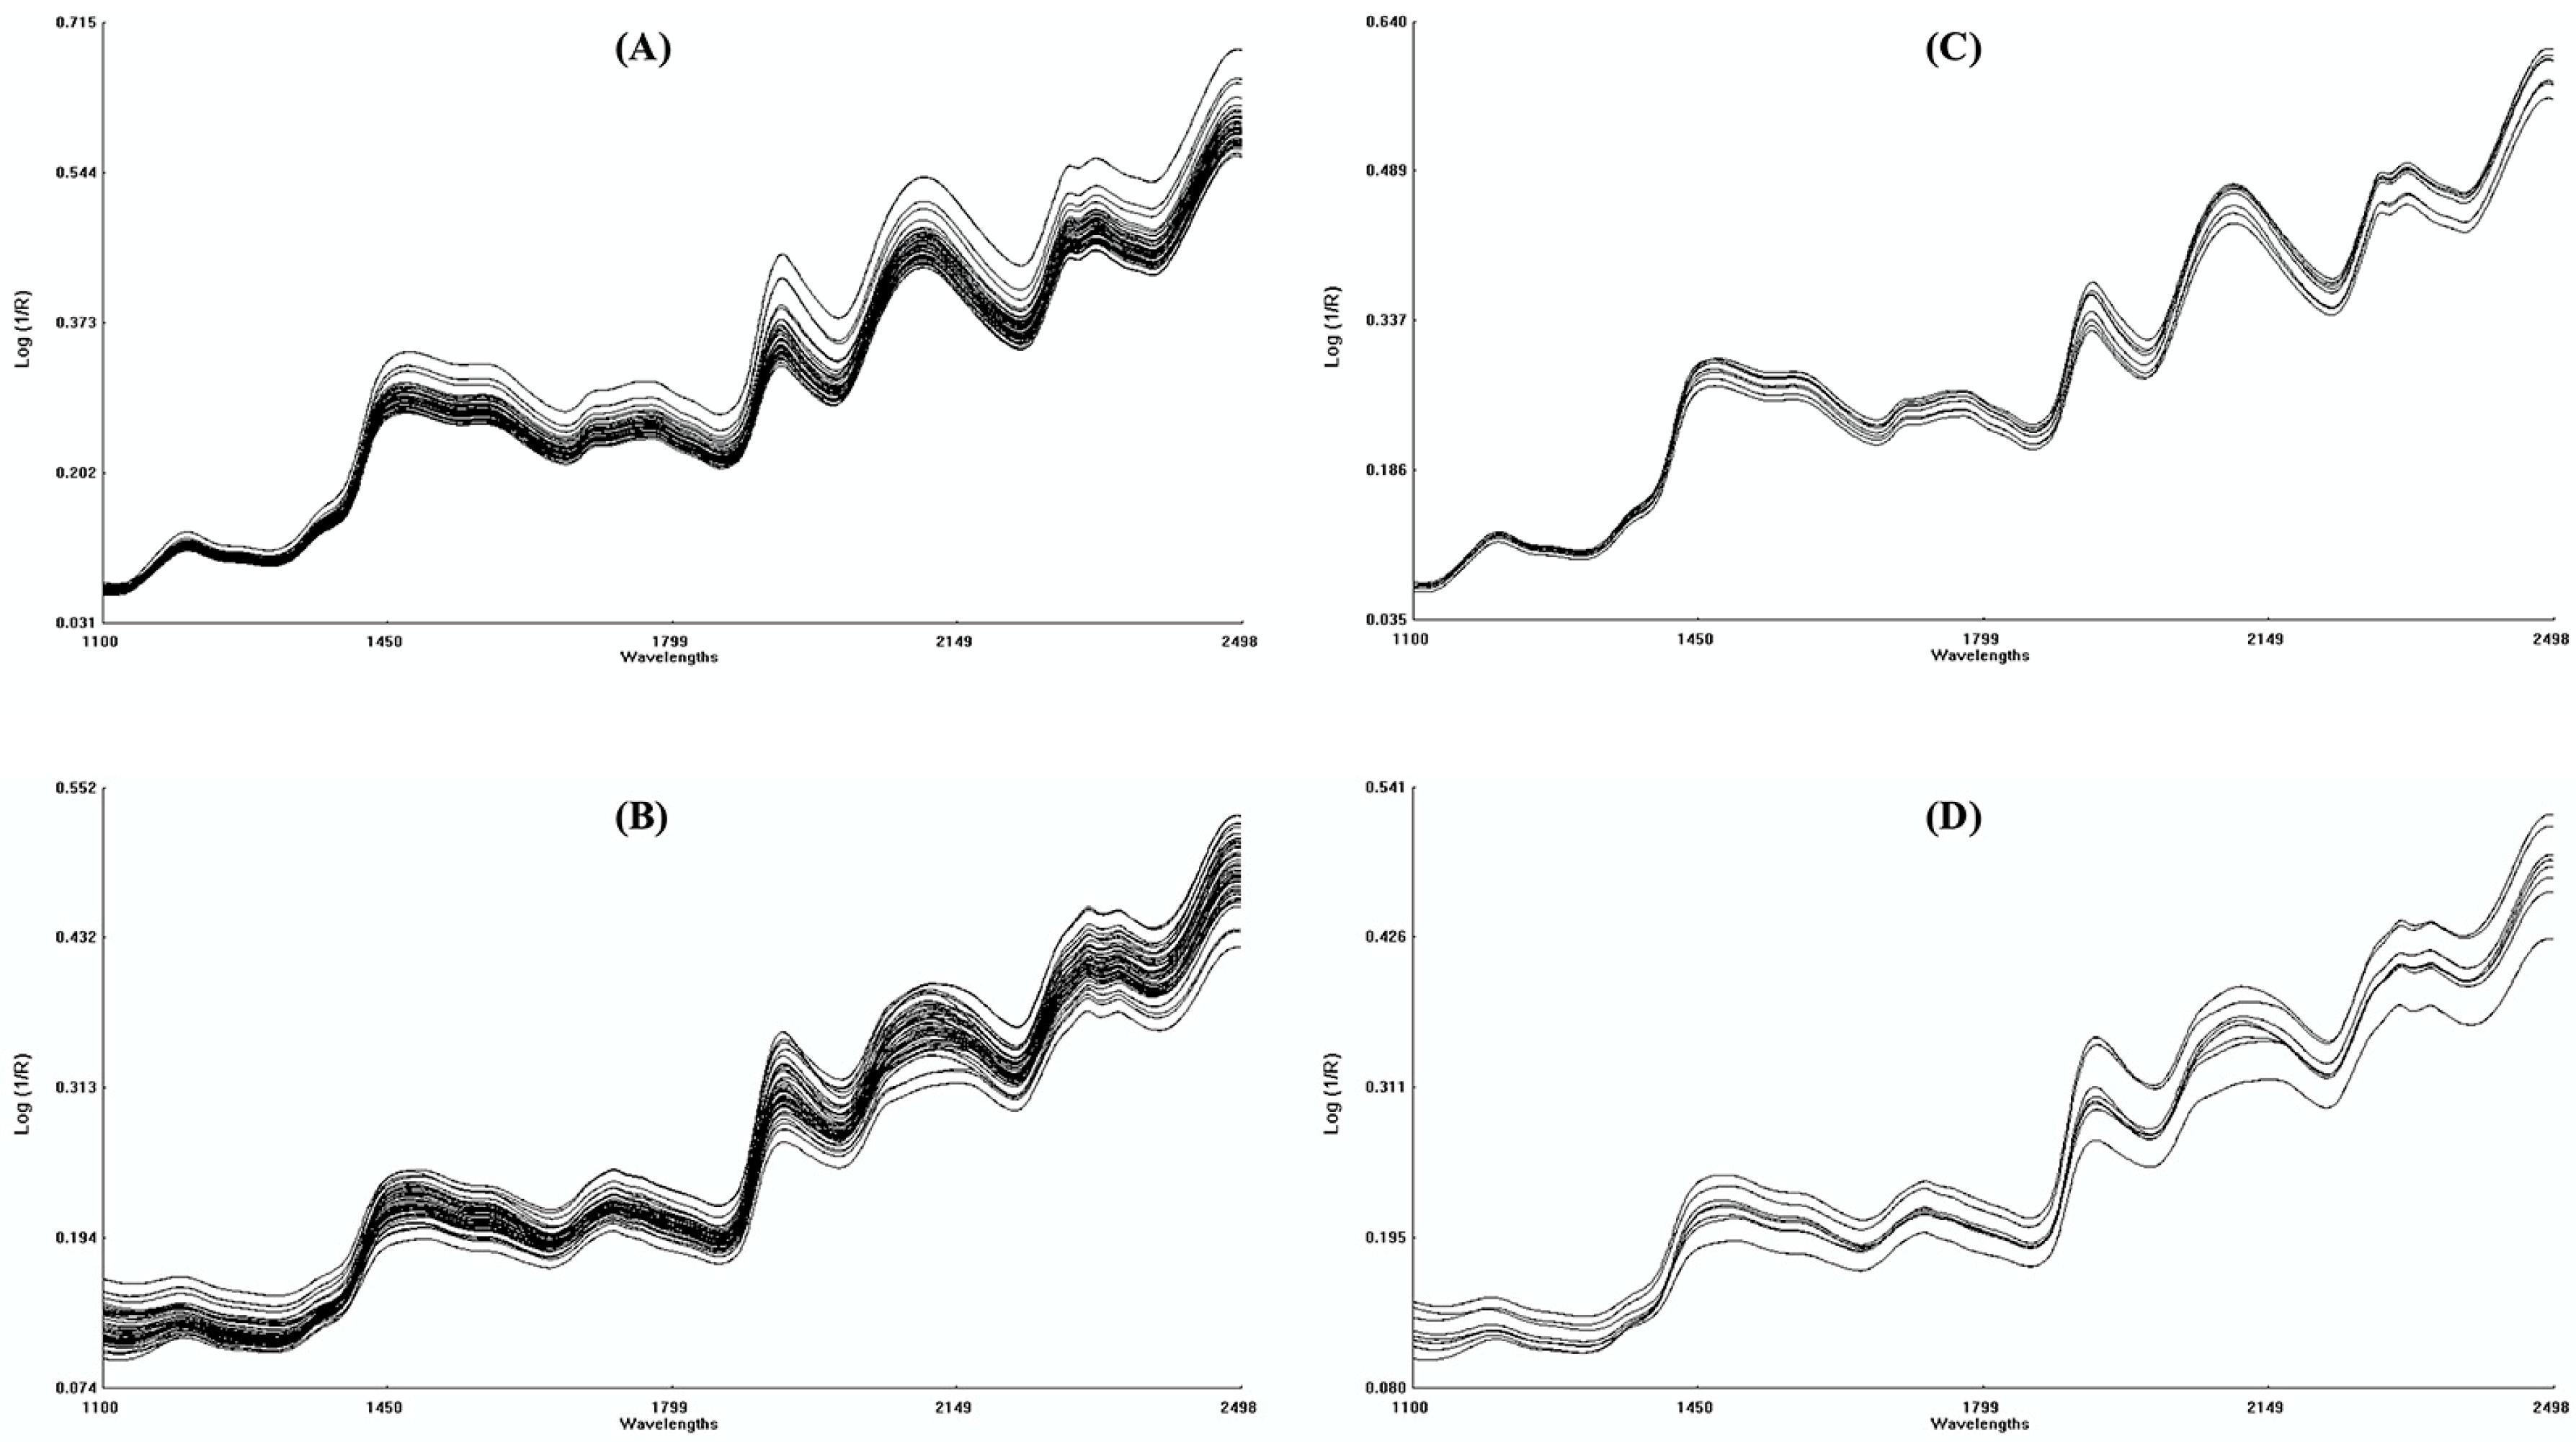
2.2. NIRS Measurements, Data Pretreatment and Analysis

Flour samples from the above and underground organs of both crops studied were inserted into a spectrometer cell (small ring cup, 50 mm diameter) and tightly compressed with the cell disposable backs to remove the air between the flour particles. The NIR spectra were recorded using a NIRSystems 5000-M (FOSS, Silver Spring, MD, USA), through the WinISI II software version 1.5e (FOSS, USA). The absorbance values were recorded between 1100 and 2498.2 nm in reflectance mode, as log 1/R (where R is the reflectance of the sample), at every 2 nm. All samples’ spectra were recorded in triplicate, with 25 scans on average per sample.
Partial least squares (PLS) multivariate data analysis was performed between NIR spectra and reference values to develop prediction models for each trait in the study. Chemical quality analysis data, randomly selected from 75% of the sample flours from the 1st trial, were used as references to construct the calibration models. A spectral pretreatment, based on standard normal variate (SNV) and detrend corrections, was performed with the PLS regression model using the 1st spectrum derivative. PCA was also used to define the spectral boundaries of both crop sample spectra, through their average structure and distribution, with spectral outlier removal based on Mahalanobis distance (H) > 3.
Full cross-validation was performed as leave-one-out for all calibration models to determine the number of factors for model calibration. One sample prediction was repeated until all the calibration samples were predicted, measuring the difference between actual and predicted values calculated throughout whole cross-validation calibrations. The calibration models were evaluated by the standard error of calibration (SEC), standard error of cross-validation (SECV), determination coefficient of cross-validation (r2cv), and ratio performance to deviation (RPD = SD/SECV).
The calibration models were then validated with an independent set of samples. The performance for each calibration model by predicting the remaining 25% of the sample flours from the 1st trial was evaluated through the standard error of prediction (SEP) and the determination coefficient of prediction (r2pred). This indicates whether the reference values and NIR prediction performance is reliable enough to be used with good accuracy to predict the quality constituents of the sample flours obtained from the 2nd trial. A robust fitting prediction model indicates higher r2pred and RPD, associated with the lower SEC, SECV, and SEP values [10,18,50].

2.3. Statistical Analysis

The results were expressed on a dry weight basis (DW) as the mean ± standard deviation (SD) for control vs. drought plots of three independent experimental replicates per accession. The reference and predicted values obtained for taro and sweet potato organs for both control and drought conditions were submitted to: a Kolmogorov–Smirnov non-parametric normality test to examine if the variables in the study are normally distributed; Levene’s test or equal variance test to examine the data homoscedasticity—both tests were performed with an assumption of normal distribution to apply the one-way analysis of variance (ANOVA) to determine statistically significant differences (p ≤ 0.05) between the means of control and drought independent groups; and the Pearson correlation coefficient (r) to measure of the strength and direction of the association between the variables (SPSS Statistics software version 26 for Mac).

3. Results and Discussion

3.1. NIRS Calibration and Validation of PLS Models

3.1.1. Taro

The actual or reference values of taro flour samples from the first trial for control and drought conditions were obtained by chemical quality analysis (and are presented in Table S1, as the variation in primary constituents within each acc.). Overall, an average increase in the N, Pt, Fb, and M content was recorded in both shoot and corm organs under stress. The M-corm increase under drought conditions was significantly different from the control (p ≤ 0.05). An average slight decrease in St, Δ13C, and δ15N content was also registered in both organs under such conditions. In this particular case, drought significantly decreases (p ≤ 0.05) the δ15N-shoot content when compared with control conditions. Still, from these primary chemical constituents, St is the most abundant constituent produced in corms, followed by Pt, M, and Fb. On the contrary, the shoots have Pt as the main abundant constituent, followed by St, M, and Fb. Therefore, the St-corm and Pt-shoot are chemotypes for representing the most abundant constituents produced by taro organs in both control and drought conditions, ranging from 48.44 to 45.18 g/100g DW, and from 11.48 to 12.44 g/100g DW, respectively [34].
The Pearson correlation coefficient (r) from the reference values is shown in 35 significant correlations overall among these quality constituents, of which 12 were strongly correlated with |r| ≥ 0.50 (Table S2). These correlations observed between primary chemical constituents allow the quality identification between acc. under drought, which could be important for selecting the best ones for breeding purposes [17].
The strongest significant correlations were observed between St-corm and Fb-corm (−0.87), followed by Pt-corm and N-corm (0.85). The St-corm also showed a moderate correlation with Pt-corm (−0.46) and M-corm (−0.48), whose relationship between constituents agrees with previous studies on 315 taro acc. from various geographical origins [17]. On the other hand, the CaOx-shoot had a positive significant correlation with St-shoot (0.52), which in turn was negatively correlated with Pt-shoot content (−0.39), also confirming previous studies on taro’s oxalate quantitation [47]. The Δ13C-corm showed a moderate correlation with CaOx-corm (0.40) and Δ13C-shoot (0.41). Meanwhile, δ15N-corm showed a weak correlation with N-corm (0.31).
This set of correlation coefficients indicates that increased chemotype St-corm contents under drought will reduce fiber, protein, and minerals. Therefore, the higher chemotype Pt-shoot content will consequently present higher CaOx-shoot and lower St-shoot content with drought conditions. This could assist taro breeders in their choice and selection of the best ones for taro breeding programs [39]. However, the chemotypes St-corm and Pt-shoot presented distinct correlations (r) according to their origin (Table S2). The St-corm from the Canary Islands acc. showed negative correlation with Pt-shoot (−0.78) and Fb-corm (−0.76), while the St-corm from Madeira Island acc. had a negative correlation with Fb-corm (−0.93). The Pt-shoot only showed correlation with CaOx-shoot (0.64) for the SPC accessions. This is a strong indication that we might observe a distinct genetic variation to stress response, as no differences between control and drought conditions could be identified.
The chemical reference values for each plant organ from the first trial were used to implement the calibration set. Another set of flour samples from the first trial were held and used as an independent validation set. NIRS spectra were obtained for corms (Figure 2A) and shoots (Figure 2B) calibration sets, and for the independent validation test sets for corms (Figure 2C) and shoots (Figure 2D). The spectra were composed mainly of groups of peaks located, respectively, at 1200, 1465, 2050, 2140, 2314, and 2350 nm. These peaks are associated with C-H, O-H, and N-H stretching-bending vibrational modes, mainly related to starch and proteins [17].
The comparison between the calibration models created from the chemical analysis and the NIR spectra allowed the implementation of PLS equations and the prediction of the ten quality constituents with results presented in Table 2.
The St-corm model showed the highest SEC, SECV, and SEP values of 0.982, 1.048, and 0.767, respectively. Meanwhile, the r2cv (0.964), r2pred (0.977), and RPD (5.22) values indicate good predictive potential for the starch model in corm flours. The Δ13C-corm model had an excellent prediction application, according to the r2pred (0.977) and RPD (2.83) values. However, the Δ13C-shoot model showed a rough prediction with RPD (1.94) and r2cv (0.740), still with r2pred (0.910) value showing a satisfactory prediction [17,42]. Hence, we could identify the equations with the poorest performance, showing the lowest r2cv, r2pred, and RPD values, with 0.564, 0.717, and 1.53 for δ15N-corm, and with 0.574, 0.873, and 1.53 for δ13C-shoot, respectively. Even with the r2pred slightly higher than 0.71, the RPD (1.53) values indicate that both δ15N-corm and δ13C-shoot constituents could not be satisfactorily predicted [16]. The CaOx acridity models had low and quite similar SEC and SECV values, with good RPD values in both corm and shoot models, with 0.027, 0.028, 3.58, and with 0.038, 0.040, 2.70, respectively. While the CaOx-shoot model showed the lower r2pred (0.498), and even an acceptable RPD value (2.70), this validation set was not robust enough to have a good determination coefficient for acridity prediction. These δ15N-corm, δ13C-shoot and CaOx-shoot prediction constituents should be only used as an informative tool in germplasm screening, and not for quantitation.
The remaining models—moisture, Pt, Fb and M—showed good quantitative predictions, with r2cv and r2pred higher than 0.863. They also showed high RPD values, ranging between 2.14 and 11.56 for the corm moisture and protein models, and between 2.21 and 5.97 for the shoot moisture and protein models. The simultaneous prediction of the St, Pt, Fb, and M chemical constituents on a single taro sample, could allow a fast estimation of the variety chemotype and quality with acceptable accuracy [17].

3.1.2. Sweet Potato

The sweet potato reference values of the first trial, for both control and water scarcity conditions, were chemically determined (Table S3). On average, drought determined the decrease in the tuber and shoot Pt, N, CaOx, Δ13C and δ15N content. However, this decrease was significant (p ≤ 0.05) for Pt-shoot, N-shoot, and for Δ13C and δ15N in both organs. Contrariwise, δ13C and TC increased slightly with drought in both organs. The δ13C increase under stress conditions was significantly different (p ≤ 0.05) from the control. However, M and St showed an opposite variation between the sweet potato organs. Still, from these major constituents, St is the most abundant constituent produced in tubers, followed by the Pt and M. Instead, the shoots show Pt as the main abundant constituent, followed by M and St. The St-tuber and Pt-shoot are chemotypes because they are the constituents with the highest concentration in sweet potato organs [34]. St-tuber showed an average range of 43.39 and 42.33 g/100 g DW, while Pt-shoot ranged significantly (p ≤ 0.05) between 16.36 and 13.04 g/100 g DW when under stress.
The overall Pearson correlations displayed 62 significant correlations in the first trial, among the quality constituents of sweet potato’s tuber and shoot organs, of which 29 were highly correlated (|r| ≥ 0.50) (Table S4). For example, the highest significant correlations were registered for δ13C-tuber with Δ13C-shoot (−0.93) and δ13C-shoot (−0.88), and for M-shoot with Pt-shoot (0.89) and St-shoot (−0.79). Still, Pearson correlations performed according to the acc.’s locality show differences (Table S4) due to different genotypic responses to drought. The chemotype Pt-shoot had greater correlations than St-tuber chemotype, with the St-tuber not showing significant correlation among the acc. of Canary Islands and Guinea-Bissau. Instead, the ones from Madeira Island had significant and negative correlation for St-tuber with M-tuber (−0.76), TC-shoot (−0.59), and St-shoot (−0.48), and positive to M-shoot (0.58). On the other hand, the Pt-shoot had greater significate correlations in those three locations, among them with M-shoot for Canary Islands (0.94), Guinea-Bissau (0.86), and Madeira Island (0.82).
The creation of PLS equations from both the calibration models and chemical analysis (used as a reference method) from the sweet potato flour organs was performed through NIRS spectra collected from tubers (Figure 3A) and shoots (Figure 3B) calibration sets. NIRS spectra of the validation sets were also obtained for the tubers (Figure 3C) and shoots (Figure 3D) independent samples from the first trial. Overall, NIR spectra peaks for both sweet potato plant organs lead mainly to starch (1460, 1930, 1966, and 2286 nm) and proteins (2176, 2296, and 2466 nm). These peaks result from overlapping absorption by mostly overtones and combinations of vibrational modes comprising C-H, O-H, and N-H stretching-bending vibrations [10,18].
Good fitting prediction models amongst the quality constituents were recorded in this study, with low SEC and SECV, and with high r2cv, r2pred, and RPD values (Table 3), which agrees with previous studies [10,16,18,51]. The TC-tuber and δ15N-tuber models were the exceptions, showing the lowest prediction performance through the smallest r2cv (0.687, 0.727, respectively), r2pred (0.705, 0.769), and RPD (1.79, 1.92) values. The δ13C-tuber and δ13C-shoot models had the lowest discrimination in the prediction of the independent samples, showing only 17.8% and 57.9% prediction confidence, with r2pred of 0.178 and 0.579, respectively. The Δ13C also showed low discrimination in the prediction of the validation set for both organs, showing r2pred of 0.629 and 0.580 for tubers and shoots, respectively. Low discrimination was expected, since NIRS is hardly efficient for constituents representing less than 1% of the dry matter weight. In contrast, the M-tuber and M-shoot equations proved to be excellent predictive models. They show high r2cv and r2pred values, similar SEC and SECV values, and RPD values of 5.40 and 8.16 for M-tuber and M-shoot, respectively.
The nitrogen and protein models were also demonstrated to be excellent predictive models in both organs, with very high r2cv, r2pred, and RPD values, and low average difference between SEC, SECV, and SEP values, which indicates a robust fitting. Previous studies [10,16] also observed good predictive performance for nitrogen and protein constituents in sweet potato tubers.
The acridity prediction by CaOx constituent was shown to be a good model for CaOx-shoot, and an approximate model for CaOx-tuber, with RPD values of 2.74 and 2.41, respectively. It also showed SEC, SECV, and SEP similarity within the models, and quantitatively approximate r2cv and r2pred values. Lastly, the starch models showed a better prediction performance in St-shoot than in St-tuber, with RPD values of 5.03 and 2.56, respectively. This difference in prediction performance among the tissues could be due to the starch content being almost ten times lower in shoots than in tubers, allowing improved discrimination [18].
The models generated allow the reading of one unique sweet potato sample to predict the St, Pt, and M major chemical constituents and thus provide a quick assessment of the variety, chemotype, and quality with good accuracy [16].

3.2. Variability of Chemical Constituents

3.2.1. Taro

Taro’s reference values from the first trial allowed the creation of prediction equations by NIRS, with the immediate and simultaneous estimation for each acc. quality and chemotype from the second trial (Table S1).
Overall, drought leads to the increase in Pt, N, Fb, and M in both taro corm and shoot organs for both trials, with different levels of significance (Table S1). However, these primary constituents showed stronger correlations in the second trial (Table S5), compared to the first trial (Table S2). Taking into consideration the most abundant constituents, the chemotype St-corm was highly correlated with Fb-corm (−0.93), M-corm (−0.72), and Pt-corm (−0.70), while the chemotype Pt-shoot was strongly correlated with Fb-shoot (−0.76) and moderately correlated with St-shoot (0.48) (Table S5).
The corms from the second trial show the highest significant (p ≤ 0.01) Fb accumulation compared to the control. Fb is the indigestible portion of the plant’s total carbohydrate content, which consists mainly of cellulose and lignin present in the cell walls, whose provides the plant stems with rigidity and stiffness during drought [52]. The corms from both trials had the significantly highest M accumulation (p ≤ 0.05), compared with shoots. Meanwhile, N increase was only significative (p ≤ 0.05) in corms from the second trial. M and N increase photosynthesis and protein synthesis as plant responses to drought, allocating nutrients between the plant organs [42,53].
Drought increased CaOx-corm in both trials, but a CaOx-shoot increase only occurred in the second trial. The increase in this insoluble oxalate could help the plant osmoregulation under water scarcity conditions, through the adjustment of oxalic acid synthesized by photosynthesis oxidative processes or carbohydrate metabolism [47].
However, we also observed the decrease in St, Δ13C, and δ15N in both taro organs, and in both trials, with significance for the δ15N-shoot (p ≤ 0.05) in the first trial, and St-corm (p ≤ 0.01) from the second trial. The slight decrease in St may be due to the mobilization of the reserves in a plant attempting to provide energy and metabolites to subcellular structure protection against water deficit to avoid the need to allocate biomass reserves [47]. The reduction in Δ13C and δ15N could be related to physiological integrators of stress in taro subjected to drought scarcity [54,55,56,57]. The obtained Δ13C-shoot content indicates relative stomata opening during stress. Since the Δ13C-shoot content fell minimally, no considerable changes should be expected in the 13C depletion, related to CO2 fixation (carboxylation), which in turn leads to only a slightly heavier or richer 13C content during drought, in both trials, with a less negative δ13C value [55]. The δ15N indicates the plant N metabolism and the growing conditions by the fractionations of 15N and 14N during the nitrogen trial processes, whose variation between the organs could be attributed to tissue reallocation of N under drought [54,56]. A decrease in the whole-plant δ15N abundance in both trials was observed. This could indicate a good drought response, with the most 15N-enriched plants having the most positive δ15N abundance [57].
According to the geographical origin of acc. (Table 1), acc. 2216 from Madeira Island had the most resilient response to drought during the first trial, showing higher productive capacity in both environments, with greater total plant biomass and water use efficiency [54]. This resiliency could be due to its chemical constitution, by showing the highest whole-plant Pt, Fb, and M content, and the lowest St content loss to cope with drought [42,47]. Advantageously, NIRS models applied for these major quality constituents allowed a good accuracy with fast and explicit predictive quantitation for the classification of the studied taro acc. according to their tolerance or susceptibility to water scarcity, at both the under and aboveground organ level. The prediction of the second trial estimates that acc. 2016 had the best tolerant response to drought, by keeping practically the same variation within those primary constituents (Table S1). This could indicate a plausible link within the taro phenotype’s response to stress with its chemotype and other major chemical quality constituents.

3.2.2. Sweet Potato

The quality traits varied between the sweet potato organs, under influence of water scarcity, either in the reference values of the first trial, or in the predicted values by NIRS of the second trial (Table S3).
Taking into consideration the major constituents, M, St and Pt, in both trials, the water scarcity conditions triggered opposite responses. Pearson correlation shown a weaker relationship between these constituents in the second trial compared to the first trial (Table S6 and Table S4, respectively). Still, both trials registered an accumulation of M-tuber and St-shoot, and a decrease in M-shoot and St-tuber, the variation of which was only significant (p ≤ 0.01) in the shoots. Pt also decreased in both trials and organs, with the exception of the Pt-tuber, which increased in the 2nd trial (Table S3).
The average M-tuber increase and M-shoot significant (p ≤ 0.01) decrease in both trials may have been due to the limitation of macro and micronutrient uptake from water-scarce soil. In such conditions, the mineral allocation into the shoots could be reduced, with lower M-shoot allocation registered in the first trial [43,58].
The scarcity significantly decreased the N-shoot and Pt-shoot in both trials. However, the N-tuber and Pt-tuber also decreased during the first trial but registered an average significant (p ≤ 0.05) increase in the second trial. N is one of the essential primary macronutrients, the uptake of which, as a result of primary assimilation, is strongly compromised during drought stress, with δ15N indicating the N fractionation during the N cycle processes [57,58,59]. The average content of the shoots δ15N and Δ13C had the same pattern, by significantly (p ≤ 0.05) decreasing its content in both trials. The reduction in δ15N-shoot is a signal of less N retention in aboveground tissue due to drought [59]. The lower Δ13C-shoot indicates a low 13C depletion, through partial stomatal closure, leading to a slight variation in the TC as 13C fixation due to stress [59].
Both trials showed that stress increased St-shoot and consequently decreased St-tuber. Starch is deposited in the leaf chloroplasts during daylight carbon dioxide fixation in photosynthesis to be broken down to sucrose during the night, which is then mobilized and converted into storage starch in the tubers [60]. The slight downregulation of photosynthesis, possibly due to the partial stomatal closure, still allowed an accumulation of starch at the shoot level, with the second trial registering significantly (p ≤ 0.01) greater St-shoot accumulation. It still allowed good photosynthesis activity and avoided the starch degradation into sugars, reducing its mobilization into tubers. However, in such conditions, the carbohydrate metabolism and photosynthesis oxidative processes can produce oxalic acid, forming insoluble salts when combined with free calcium, as CaOx insoluble druse crystals [61]. We observed that the whole-plant CaOx average content decreased in the first trial, with an increase in the second trial. The CaOx increase in the second trial could be due to the plant needing to isolate the excess of calcium accumulated in its tissues [62]. The oscillation in the CaOx formation in stress was probably due to the plant ion balance, leading to the fluctuation of druse crystal formation, according to the availability of free calcium [8,63].
Acc. 3124 from Guinea-Bissau had one of the best physiological responses to water scarcity during the first trial, namely the highest total plant biomass content and the best water use efficiency [52]. The fact that it showed the combination of high St-tuber, M-shoot, and Pt-shoot content indicates that it had one of the best nutrient allocations into the shoot and tuber starch storage under stress. Excellent predictive NIR models were generated for the major quality constituents St, Pt, and M for the whole-plant sweet potato acc., which could be a fast tool to be used in the continuous monitoring of drought response, according to its tolerance or susceptibility. Acc. 3124 showed good to moderate stress tolerance response in the second trial, mainly due to lesser M and Pt shoot content, indicating a more limiting nutrient diffusion into plants, but still keeping the best starch accumulation in tubers. Still, we could find a reasonable connection within the sweet potato phenotype response and its chemotype and other major chemical quality constituent values obtained for drought.

4. Conclusions

NIRS represents a rapid and cost-effective analytical tool when the predictive models are accurate enough. The models for nitrogen, protein, starch, fiber, and total minerals quality constituents of taro and sweet potato showed good prediction accuracy. The TC-tuber in sweet potato and CaOx-shoot in taro, the δ15N in the underground organs and the δ13C in the vegetative parts of both crops showed the poorest prediction performances. However, these last constituent predictions could be used as an informative tool in germplasm screening. The present models could be applied in further research on crop quality subjected to water scarcity conditions. Additional work is needed to improve the existing models with new data from new drought trials. The development of more robust NIRS models for all constituents will improve their efficiency and reliability for assessing crop quality and phenotyping plants subjected to water scarcity.

Supplementary Materials

The following are available online at https://www.mdpi.com/2076-3417/10/23/8724/s1, Table S1: Taro quality constituents of the flour obtained by laboratory reference analysis (1st trial) and NIRS prediction (2nd trial) for both corms and shoots submitted to control and drought conditions, Table S2: Pearson correlations of taro corms and shoots, from the 1st agronomic trial, Table S3: Sweet potato quality constituents of the flour obtained by laboratory reference analysis (1st trial) and NIRS prediction (2nd trial) for both tuber and shoot organs, under control and drought conditions, Table S4: Pearson correlations of sweet potato tubers and shoots, from the 1st agronomic trial, Table S5: Pearson correlations of taro corms and shoots, from the 2nd agronomic trial, Table S6: Pearson correlations of sweet potato tubers and shoots, from the 2nd agronomic trial.

Author Contributions

Conceptualization, V.L. and M.P.d.C.; methodology, C.S.S.G.; investigation, C.S.S.G.; data curation, C.S.S.G.; writing—original draft preparation, C.S.S.G.; writing—review and editing, V.L., M.P.d.C. and C.S.S.G.; software, C.S.S.G.; supervision, V.L. and M.P.d.C.; funding acquisition, C.S.S.G. and M.P.d.C. All authors have read and agreed to the published version of the manuscript.

Funding

This research was funded by Programa Operacional Madeira 14–20, Portugal 2020 and the European Union through the European Regional Development Fund, grant number M1420-01-0145-FEDER-000011, [CASBio] and Carla Gouveia was funded by ARDITI—Agência Regional para o Desenvolvimento da Investigação Tecnologia e Inovação, Portugal 2020 and the European Union through the European Social Fund, grant number M1420-09-5369-FSE-000001.

Acknowledgments

The authors would like to thank José G.R. de Freitas, Humberto G.M. de Nóbrega, and José F.T. Ganança (ISOPlexis Genebank, Madeira University, Portugal), for providing valuable assistance with the drought assay design, the management of the field trials and meaningfully contributed to the harvest and samples preparation. The authors are grateful to Jan J. Slaski (InnoTech Alberta, Canada) for coordinating the isotopic compositions. The authors also acknowledge the support by National Funds FCT—Portuguese Foundation for Science and Technology, under the projects UIDB/04033/2020 and UIDP/04033/2020.

Conflicts of Interest

The authors declare no conflict of interest. The funders had no role in the design of the study; in the collection, analyses, or interpretation of data; in the writing of the manuscript, or in the decision to publish the results.

References

  1. FAOSTAT Database. 2019. Available online: www.fao.org (accessed on 21 September 2019).
  2. Laxminarayana, K.; Mishra, S.; Soumya, S. Good Agricultural Practices in Tropical Root and Tuber Crops. In Tropical Roots and Tubers–Production, Processing and Technology; Sharma, H.K., Njintang, N.Y., Singhal, R.S., Kaushal, P., Eds.; John Wiley & Sons: Oxford, UK, 2016; pp. 192–204. [Google Scholar]
  3. Sharma, H.K.; Kaushal, P.; Singh, B. Taro Flour, Achu and Starch. In Tropical Roots and Tubers–Production, Processing and Technology; Sharma, H.K., Njintang, N.Y., Singhal, R.S., Kaushal, P., Eds.; John Wiley & Sons: Oxford, UK, 2016; pp. 326–327. [Google Scholar]
  4. Bradbury, J.H.; Holloway, W.D. Chemistry of tropical root crops: Significance for nutrition and agriculture in the Pacific. In Australian Centre for International Agricultural Research (ACIAR); (Monograph No. 6); ACIAR Monograph Series: Canberra, Australia, 1988; pp. 18, 160. [Google Scholar]
  5. Lebot, V. Tropical Root and Tuber Crops: Cassava, Sweet Potato, Yams and Aroids; Atherton, J., Rees, A., Eds.; CAB International: Cambridge, UK, 2009; Volume xvi, pp. 134–135, 167–168, 325–329, 351. [Google Scholar]
  6. Woolfe, J.A. Sweet Potato: An Untapped Food Resource; Woolfe, J.A., Ed.; Cambridge University Press: Cambridge, UK, 1992; pp. 61–62. [Google Scholar]
  7. Oscarsson, K.V.; Savage, G.P. Composition and availability of soluble and insoluble oxalates in raw and cooked taro (Colocasia esculenta var. Schott) leaves. Food Chem. 2007, 101, 559–562. [Google Scholar] [CrossRef]
  8. Franceschi, V.R.; Horner, H.T. Calcium oxalate crystals in plants. Bot. Rev. 1980, 46, 361–427. [Google Scholar] [CrossRef]
  9. Mulugeta, M.; Tebeka, T. Proximate and some minerals analysis of Colocasia esculenta (taro) tuber in Southern Ethiopia. Int. J. Pharm. Pharm. Res. Hum. J. 2017, 10, 1–12. [Google Scholar]
  10. Magwaza, L.S.; Naidoo, S.I.M.; Laurie, S.M.; Laing, M.D.; Shimelis, H. Development of NIRS models for rapid quantification of protein content in sweet potato [Ipomoea batatas (L.) Lam.]. LWT Food Sci. Technol. 2016, 72, 63–70. [Google Scholar] [CrossRef]
  11. Temesgen, M.; Retta, N.; Tesfaye, E. Effect of pre-curding on nutritional and anti-nutritional composition of taro (Colocasia esculenta L.) leaf. Int. J. Food Sci. Nutr. 2016, 1, 5–11. [Google Scholar]
  12. Kumoro, A.C.; Putri, R.D.A.; Budiyati, C.S.; Retnowati, D.S. Kinetics of calcium oxalate reduction in taro (Colocasia esculenta) corm chips during treatments using baking soda solution. Procedia Chem. 2014, 9, 102–112. [Google Scholar] [CrossRef] [Green Version]
  13. Alcantara, R.M.; Hurtada, W.A.; Dizon, E.I. The nutritional value and phytochemical components of taro [Colocasia esculenta (L.) Schott] powder and its selected processed foods. J. Nutr. Food Sci 2013, 3, 207. [Google Scholar] [CrossRef] [Green Version]
  14. Fai, F.Y.; Danbature, W.L.; Yahaya, A.; Usman, Y.M. Proximate and some minerals analysis of Colocasia esculenta (taro) leaves. J. Med. Biol. Sci. 2013, 3, 8–14. [Google Scholar]
  15. Amon, A.S.; Soro, R.Y.; Koffi, P.K.B.; Dué, E.A.; Kouamé, L.P. Biochemical characteristics of flours from ivorian taro (Colocasia esculenta, Cv Yatan) corm as affected by boiling time. Adv. J. Food Sci. Technol. 2011, 3, 424–435. [Google Scholar]
  16. Lebot, V.; Ndiaye, A.; Malapa, R. Phenotypic characterization of sweet potato [Ipomoea batatas (L.) Lam.] genotypes in relation to prediction of chemical quality constituents by NIRS equations. Plant Breed. 2011, 130, 457–463. [Google Scholar] [CrossRef]
  17. Lebot, V.; Malapa, R.; Bourrieau, M. Rapid estimation of taro (Colocasia esculenta) quality by near-infrared reflectance spectroscopy. J. Agric. Food Chem. 2011, 59, 9327–9334. [Google Scholar] [CrossRef] [PubMed]
  18. Lebot, V.; Champagne, A.; Malapa, R.; Shiley, D. NIR determination of major constituents in tropical root and tuber crop flours. J. Agric. Food Chem. 2009, 57, 10539–10547. [Google Scholar] [CrossRef] [PubMed]
  19. Motsa, N.M.; Modi, A.T.; Mabhaudhi, T. Sweet potato response to low-input agriculture and varying environments of KwaZulu-Natal, South Africa: Implications for food security strategies. Acta Agric. Scand. Sect. B Soil Plant Sci. 2015, 65, 329–340. [Google Scholar] [CrossRef]
  20. Ekanayake, I.J.; Collins, W. Effect of irrigation on sweet potato root carbohydrates and nitrogenous compounds. Food Agric. Environ. 2004, 2, 243–248. [Google Scholar]
  21. Ishida, H.; Suzuno, H.; Sugiyama, N.; Innami, S.; Tadokoro, T.; Maekawa, A. Nutritive evaluation on chemical components of leaves, stalks and stems of sweet potatoes (Ipomoea batatas poir). Food Chem. 2000, 68, 359–367. [Google Scholar] [CrossRef]
  22. Ravindran, V.; Ravindran, G.; Sivakanesan, R.; Rajaguru, S.B. Biochemical and nutritional assessment of tubers from 16 cultivars of sweet potato (Ipomoea batatas L.). J. Agric. Food Chem. 1995, 43, 2646–2651. [Google Scholar] [CrossRef]
  23. Holloway, W.D.; Argall, M.E.; Jealous, W.T.; Lee, J.A.; Bradbury, J.H. Organic acids and calcium oxalate in tropical root crops. J. Agric. Food Chem. 1989, 37, 337–341. [Google Scholar] [CrossRef]
  24. Tattiyakul, J.; Pradipasena, P.; Asavasaksakul, S. Taro Colocasia esculenta (L.) Schott amylopectin structure and its effect on starch functional properties. Starch/Staerke 2007, 59, 342–347. [Google Scholar] [CrossRef]
  25. Tattiyakul, J.; Asavasaksakul, S.; Pradipasena, P. Chemical and physical properties of flour extracted from taro Colocasia esculenta (L.) Schott grown in different regions of Thailand. SenseAsia 2006, 32, 279–284. [Google Scholar]
  26. Ejoh, A.R.; Mbiapo, F.T.; Fokou, E. Nutrient composition of the leaves and flowers of Colocasia esculenta and the fruits of Solanum melongena. Plant Foods Hum. Nutr. 1996, 49, 107–112. [Google Scholar] [CrossRef]
  27. Ganança, J.F.T.; Freitas, J.G.R.; Nóbrega, H.G.M.; Rodrigues, V.; Antunes, G.; Gouveia, C.S.S.; Rodrigues, M.; Chaϊr, H.; de Carvalho, M.Â.A.P.; Lebot, V. Screening for drought tolerance in thirty three taro cultivars. Not. Bot. Horti Agrobot. Cluj Napoca 2018, 46, 65–74. [Google Scholar] [CrossRef]
  28. Ganança, J.F.T.; Freitas, J.G.F.; Nóbrega, H.G.M.; Rodrigues, V.; Antunes, G.; Rodrigues, M.; de Carvalho, M.Â.A.P.; Lebot, V. Screening of elite and local taro (Colocasia esculenta) cultivars for drought tolerance. Procedia Environ. Sci. 2015, 29, 41–42. [Google Scholar] [CrossRef] [Green Version]
  29. Zhang, H.; Zhu, L.; Zhang, C.; Ning, Y.; Zhang, Y. Effect of water stress on dry mass accumulation and allocation in sweet potato based on stable isotope analysis. Can. J. Plant Sci. 2015, 95, 263–271. [Google Scholar] [CrossRef]
  30. Williams, P. Grains and Seeds. In Near-Infrared Spectroscopy in Food Science and Technology; Ozaki, Y., McClure, W.F., Christy, A.A., Eds.; Wiley-Interscience: Hoboken, NJ, USA, 2007; pp. 165–217. [Google Scholar]
  31. Siesler, H.W.; Ozaki, Y.; Kawata, S.; Heise, H.M. Near-Infrared Spectroscopy–Principles, Instruments, Applications; WILEY-VCH Press: Weinheim, Germany, 2002. [Google Scholar]
  32. Pasquini, C. Near infrared spectroscopy: A mature analytical technique with new perspectives—A review. Anal. Chim. Acta 2018, 1026, 8–36. [Google Scholar] [CrossRef] [PubMed]
  33. Cabrera-Bosquet, L.; Crossa, J.; von Zitewitz, J.; Serret, M.D.; Araus, J.L. High-throughput phenotyping and genomic selection: The frontiers of crop Breeding converge. J. Integr. Plant Biol. 2012, 54, 312–320. [Google Scholar] [CrossRef] [Green Version]
  34. Champagne, A.; Legendre, L.; Lebot, V. Chemotype profiling to guide breeders and explore traditional selection of root crops in Vanuatu, South Pacific. J. Agric. Food Chem. 2009, 57, 10363–10370. [Google Scholar] [CrossRef]
  35. Desjardins, A.Z. Natural product chemistry meets genetics: When is a genotype a chemotype? J. Agric. Food Chem. 2008, 56, 7587–7592. [Google Scholar] [CrossRef]
  36. Hatfield, J.L. Climate change: Challenges for future crop adjustments. In Climate Change and Plant Abiotic Stress Tolerance; Tuteja, N., Gill, S.S., Eds.; Wiley-Blackwell: Weinheim, Germany, 2014; p. 4. [Google Scholar]
  37. Wang, Y.; Frei, M. Stressed food—The impact of abiotic environmental stresses on crop quality. Agric. Ecosyst. Environ. 2011, 141, 271–286. [Google Scholar] [CrossRef]
  38. Ferrio, J.P.; Bertran, E.; Nachit, M.; Royo, C.; Araus, J.L. Near infrared reflectance spectroscopy as a potential surrogate method for the analysis of Δ13C in mature kernels of durum wheat. Aust. J. Agric. Res. 2001, 52, 809–816. [Google Scholar] [CrossRef]
  39. Bruno-Soares, A.M.; Murray, I.; Paterson, R.M.; Abreu, J.M.F.F. Use of near infrared reflectance spectroscopy (NIRS) for the prediction of the chemical composition and nutritional attributes of green crop cereals. Anim. Feed Sci. Technol. 1998, 75, 15–25. [Google Scholar] [CrossRef]
  40. de Boever, J.L.; Cottyn, B.G.; Vanacker, J.M.; Boucqué, C.V. The use of NIRS to predict the chemical composition and the energy value of compound feeds for cattle. Anim. Feed Sci. Technol. 1995, 51, 243–253. [Google Scholar] [CrossRef]
  41. Kleinebecker, T.; Schmidt, S.R.; Fritz, C.; Smolders, A.J.P.; Holzel, N. Prediction of δ13C and δ15N in plant tissues with near-infrared reflectance spectroscopy. New Phytol. 2009, 184, 732–739. [Google Scholar] [CrossRef] [PubMed]
  42. Gouveia, C.S.S.; Ganança, J.F.T.; de Nóbrega, H.G.M.; de Freitas, J.G.R.; Lebot, V.; de Carvalho, M.Â.A.P. Phenotypic flexibility and drought avoidance in taro (Colocasia esculenta (L.) Schott). Emir. J. Food Agric. 2020, 32, 150–159. [Google Scholar] [CrossRef]
  43. Gouveia, C.S.S.; Ganança, J.F.T.; de Nóbrega, H.G.M.; de Freitas, J.G.R.; Lebot, V.; de Carvalho, M.Â.A.P. Drought avoidance and phenotypic flexibility of sweet potato (Ipomoea batatas (L.) Lam.) under water scarcity conditions. Not. Bot. Horti Agrobot. Cluj Napoca 2019, 47, 1037–1046. [Google Scholar] [CrossRef]
  44. AOAC. Official Methods of Analysis; AOAC International Publisher: Gaithersburg, MD, USA, 2005. [Google Scholar]
  45. Hodge, J.E.; Hofreiter, B.T. Analysis and preparation of sugars. In Methods in Carbohydrate Chemistry, 6th ed.; Whistler, R.L., Miller, J.N.B., Eds.; Academic Press: New York, NY, USA, 1962; pp. 356–378. [Google Scholar]
  46. ISO. Agricultural Food Products. Determination of Crude Fibre Content-Modified Scharrer, Method 6541; International Organization of Standardization: Geneva, Switzerland, 1981. [Google Scholar]
  47. Gouveia, C.S.S.; Ganança, J.F.T.; Lebot, V.; de Carvalho, M.Â.A.P. Quantitation of oxalates in corms and shoots of Colocasia esculenta (L.) Schott under drought conditions. Acta Physiol. Plant. 2018, 40, 124. [Google Scholar] [CrossRef]
  48. Dye, W.B. Chemical studies on Halogeton Glomeratus. Weeds 1956, 1, 55–60. [Google Scholar] [CrossRef]
  49. AOAC. Micro-chemical Determination of Carbon, Hydrogen, and Nitrogen, Automated Method, Method 972.43. In Official Methods of Analysis; AOAC International Publisher: Arlington, VA, USA, 2000. [Google Scholar]
  50. Ceballos, H.; Sánchez, T.; Chávez, A.L.; Iglesias, C.; Debouck, D.; Mafla, G.; Tohme, J. Variation in crude protein content in cassava (Manihot esculenta Crantz) roots. J. Food Compos. Anal. 2006, 19, 589–593. [Google Scholar] [CrossRef]
  51. Ding, X.; Ni, Y.; Kokot, S. NIR spectroscopy and chemometrics for the discrimination of pure, powdered, purple sweet potatoes and their samples adulterated with the white sweet potato flour. Chemom. Intell. Lab. Syst. 2015, 144, 17–23. [Google Scholar] [CrossRef]
  52. Katoch, R. Analytical Techniques in Biochemistry and Molecular Biology; Springer: New York, NY, USA, 2011; pp. 264, 303, 326. [Google Scholar]
  53. Van den Boogaard, R.; Kostadinova, S.; Veneklaas, E.; Lambers, H. Association of water use efficiency and nitrogen use efficiency with photosynthetic characteristics of two wheat cultivars. J. Exp. Bot. 1995, 46, 1429–1438. [Google Scholar] [CrossRef]
  54. Gouveia, C.S.S.; Ganança, J.F.T.; Slaski, J.; Lebot, V.; Pinheiro de Carvalho, M.Â.A. Stable isotope natural abundances (δ13C and δ15N) and carbon-water relations as drought stress mechanism response of taro (Colocasia esculenta L. Schott). J. Plant Physiol. 2019, 232, 100–106. [Google Scholar] [CrossRef]
  55. Ivlev, A.A. Global redox cycle of biospheric carbon: Interaction of photosynthesis and earth crust processes. BioSystems 2015, 137, 1–11. [Google Scholar] [CrossRef] [PubMed]
  56. Serret, M.D.; Yousfi, S.; Vicente, R.; Piñero, M.C.; Otálora-Alcón, G.; del Amor, F.M.; Araus, J.L. Interactive effects of CO2 concentration and water regime on stable isotope signatures, nitrogen assimilation and growth in sweet pepper. Front. Plant Sci. 2018, 8, 1–18. [Google Scholar] [CrossRef] [PubMed] [Green Version]
  57. Robinson, D. δ15N as an integrator of the nitrogen cycle. Trends Ecol. Evol. 2001, 16, 153–162. [Google Scholar] [CrossRef]
  58. Duman, F. Uptake of mineral elements during abiotic stress. In Abiotic Stress Responses in Plants: Metabolism, Productivity and Sustainability; Ahmad, P., Prasad, M.N.V., Eds.; Springer: New York, NY, USA, 2012; pp. 270–271. [Google Scholar]
  59. Gouveia, C.S.S.; Ganança, J.F.T.; Slaski, J.; Lebot, V.; de Carvalho, M.Â.A.P. Variation of carbon and isotope natural abundances (δ15N and δ13C) of whole-plant sweet potato (Ipomoea batatas L.) subjected to prolonged water stress. J. Plant Physiol. 2019, 243, 153052. [Google Scholar] [CrossRef] [PubMed]
  60. Zeeman, S.C.; Kossmann, J.; Smith, A.M. Starch: Its metabolism, evolution, and biotechnological modification in plants. Annu. Rev. Plant Biol. 2010, 61, 209–234. [Google Scholar] [CrossRef] [Green Version]
  61. Gouveia, C.S.S.; Ganança, J.F.T.; Lebot, V.; de Carvalho, M.Â.A.P. Changes in oxalate composition and other nutritive traits in root tubers and shoots of sweet potato (Ipomoea batatas L. [Lam.]) under water stress. J. Sci. Food Agric. 2020, 100, 1702–1710. [Google Scholar] [CrossRef]
  62. Schadel, W.E.; Walter, W.M., Jr. Calcium oxalate crystals in the roots of sweet potato. J. Am. Soc. Hortic. Sci. 1980, 105, 851–854. [Google Scholar]
  63. Nakata, P.A. Advances in our understanding of calcium oxalate crystal formation and function in plants. Plant Sci. 2003, 164, 901–909. [Google Scholar] [CrossRef]
Figure 1. Taro and sweet potato crops were submitted to drought stress for two agronomic trials in distinct experimental sites, but they share the same steps from harvest until analysis. A—harvest of the plants of the taro drought assays performed in an open greenhouse in 2015 and 2017, B—harvest of the plants of the sweet potato drought trials implemented in a split-plot field design in 2017 and 2018, C—oven-drying the underground and aboveground plant organs at 65 °C for 48 h, D—milling the dried samples and placing them into vacuum-sealed bags stored at −35 °C, E—flours from the 1st drought assay were chemically evaluated for quality constituents, F—NIR prediction of the quality constituents of the sample flours obtained from the 2nd drought assay.
Applsci 10 08724 g001
Figure 2. NIR spectra of the seven taro accessions, with 126 corm (A) and 120 shoot (B) samples, and external set validation with 21 samples for corms (C) and 18 shoot samples (D). Wavelengths from 1100 to 2498.2 nm of the NIR range.
Applsci 10 08724 g002
Figure 3. NIR spectra of the eight sweet potato accessions, with 129 root (A) and 135 shoot (B) samples, and 24 external set validation for both root (C) and shoot (D) samples. Wavelengths from 1100–2498.2 nm of the NIR range.
Applsci 10 08724 g003
Table 1. Accessions analyzed for quality traits as actual reference (calibration) and near-infrared spectroscopy (NIRS) prediction.
Accession ID 1NameLocalityOriginCategory
Taro [Colocasia esculenta (L.) Schott]
2056ListadoLa PalmaCanary Islands—Spain (CAN)Local
2061Blanco SauceroLa PalmaCanary Islands—Spain (CAN)Local
2210RoxoPorto MonizMadeira Island—Portugal (MAD)Local
2216BrancoSanta CruzMadeira Island—Portugal (MAD)Local
2232PExPH 15-6 BL/HW/08HawaiiFiji—Pacific Community (SPC)Breeding lines
2234C3-22 BL/PNG/11Papua New GuineaFiji—Pacific Community (SPC)Breeding lines
2239Karang CE/MAL/10MalaysiaFiji—Pacific Community (SPC)Breeding lines
Sweet potato [Ipomoea batatas (L.) Lam.]
1036BrasileiraCâmara de LobosMadeira Island—Portugal (MAD)Local
10385 BicosSantanaMadeira Island—Portugal (MAD)Local
2927de FlorPorto MonizMadeira Island—Portugal (MAD)Local
3126InglesaPorto MonizMadeira Island—Portugal (MAD)Local
2937RojaTenerifeCanary Islands—Spain (CAN)Local
2938CubanaTenerifeCanary Islands—Spain (CAN)Local
3124VermelhaBafatáGuinea-Bissau (GUI)Local
3125BrancaBafatáGuinea-Bissau (GUI)Local
1 Identification number code used by the ISOPlexis Genebank (Madeira, Portugal).
Table 2. Quality constituent statistics for calibration and independent validation models of taro (Colocasia esculenta (L.) Schott) flour accessions subjected to water scarcity.
Calibration SetValidation
Independent Set
Taro ModelsnOutliersMeanSDPLS TermsSECSECVr2cvRPDnr2predSEP
Moisture, g/100g DW
Corm10567.5841.35290.5920.6330.7832.14210.8940.433
Shoot102117.8942.35291.0111.0630.7952.21180.8380.837
Protein, g/100g DW
Corm10554.7051.46090.1190.1260.99311.56210.9950.191
Shoot102411.5422.14590.3630.3590.9725.97180.8830.693
Nitrogen, g/100g DW
Corm10530.7540.23190.0200.0210.99211.07210.9950.031
Shoot10251.8560.34090.0590.0590.9705.79180.9530.058
Starch, g/100g DW
Corm105347.0215.46990.9821.0480.9645.22210.9770.767
Shoot102310.9552.99990.4830.5240.9695.72180.9840.805
Crude Fiber, g/100g DW
Corm10560.4350.10890.0190.0190.9685.59210.9850.018
Shoot102141.6460.22790.0530.0570.9394.01180.9800.031
Minerals, g/100g DW
Corm10544.4831.02690.1700.1760.9705.83210.9860.122
Shoot10259.7071.04990.2850.3340.8983.14180.9500.245
CaOx, g/100g DW
Corm10590.2490.10190.0270.0280.9223.58210.7210.046
Shoot10240.2410.10790.0380.0400.8632.70180.4980.056
δ13C, ‰ DW
Corm1053−26.1830.78890.2500.2850.8682.76210.9770.177
Shoot1020−26.3041.07790.6420.7040.5741.53180.8730.420
Δ13C, ‰ DW
Corm105318.6620.83090.2630.2930.8742.83210.9770.156
Shoot102718.8041.07490.5030.5520.7401.94180.9100.411
δ15N, % DW
Corm10504.6340.86490.4730.5640.5751.53210.7170.488
Shoot10240.2410.10780.0380.0400.8632.70180.7110.549
Table 3. Quality constituent statistics for calibration and independent validation models of sweet potato (Ipomoea batatas (L.) Lam.) accessions flour under drought conditions.
Calibration SetValidation Independent Set
Sweet Potato ModelsnOutliersMeanSDPLS TermsSECSECVr2cvRPDnr2predSEP
Moisture, g/100g DW
Tuber10575.0661.53990.6700.7610.7552.02240.5320.822
Shoot11106.1141.08390.6160.7010.5841.54240.4950.945
Protein, g/100g DW
Tuber10596.0381.26290.1120.1140.99211.10240.9940.099
Shoot111914.4803.16090.2180.2440.99412.96240.9950.274
Nitrogen, g/100g DW
Tuber105110.9730.20390.0220.0240.9868.47240.9940.016
Shoot11192.3180.50690.0350.0390.99412.96240.9950.044
Starch, g/100g DW
Tuber105342.5094.12291.4301.6080.8472.56240.8560.944
Shoot11144.9442.59990.4870.5170.9615.03240.9810.323
Minerals, g/100g DW
Tuber10584.3360.48290.0820.0890.9665.40240.8680.158
Shoot111811.2661.80090.2150.2210.9858.16240.9920.171
CaOx, g/100g DW
Tuber10580.0580.03490.0120.0140.8262.41240.8650.020
Shoot11130.0990.07990.0270.0290.8662.74240.9600.014
Total carbon, g/100g DW
Tuber105640.3410.33390.1730.1850.6871.79240.7050.176
Shoot111641.5100.57290.2200.2380.8262.40240.9140.232
δ13C, ‰ DW
Tuber1056−25.0651.16190.3060.3640.9013.19240.1780.602
Shoot1116−26.6111.25790.2570.2650.9564.75240.5790.311
Δ13C, ‰ DW
Tuber105617.5051.21190.3190.3800.9013.18240.6290.174
Shoot111619.1211.31490.2690.2770.9564.75240.5800.325
δ15N, % DW
Tuber10504.5861.12090.5330.5840.7271.92240.7690.499
Shoot11154.1851.09790.2600.2740.9384.01240.7880.345
Publisher’s Note: MDPI stays neutral with regard to jurisdictional claims in published maps and institutional affiliations.

