Article

Aflatoxins in Milk and Dairy Products: Occurrence and Exposure Assessment for the Serbian Population

1
Department of Food Safety and Quality Management, Faculty of Agriculture, University of Belgrade, 11080 Belgrade, Serbia
2
Center for Food Analysis, Zmaja od Noćaja 11, 11000 Belgrade, Serbia
3
Centro Tecnológico de la Carne de Galicia, Rúa Galicia Nº 4, Parque Tecnológico de Galicia, San Cibrao das Viñas, 32900 Ourense, Spain
4
Zooprophylactic Institute of Puglia and Basilicata, Via Manfredonia, 20, 71121 Foggia, Italy
5
Department of Animal Origin Food Products Technology, Faculty of Agriculture, University of Belgrade, 11080 Belgrade, Serbia
*
Authors to whom correspondence should be addressed.
Appl. Sci. 2020, 10(21), 7420; https://doi.org/10.3390/app10217420
Submission received: 3 October 2020 / Revised: 19 October 2020 / Accepted: 21 October 2020 / Published: 22 October 2020
(This article belongs to the Special Issue Advanced Analysis Techniques of Food Contaminants and Risk Assessment)

Abstract

:

Featured Application

The present study assesses the exposure of aflatoxin M1 (AFM1) intake based on the consumption of milk and dairy products by adult consumers in Serbia. It presents one of the pillars in quantitative measurement of health risks associated with aflatoxins. Results may be used by various stakeholders in the dairy chain continuum to assist in making decisions or recommendations, and when risk mitigation strategies are required.

Abstract

The main objective of this study was to assess the exposure associated with aflatoxin M1 (AFM1) of the adult population in Serbia from consumption of milk and dairy products. This assessment was performed using concentration values of AFM1 in raw milk (385 samples) and dairy products (556 samples) based on the analyses conducted in the period between 2015 and 2018. In parallel, a dairy products consumption survey was completed during 2018 based on ‘one-day’ and ‘seven-day’ recall methods. In order to estimate the intake of AFM1 from the consumption of dairy products for both recall methods, a Monte Carlo simulation was conducted. The study revealed that pasteurized milk and yogurt are dairy products mostly consumed by the Serbian adult population. Estimated daily intake of AFM1 was in the range of 62–74 × 10−3 ng/kg bw/day, depending on the recall methods and scenarios employed. Although the results show moderate exposure risks compared to similar studies worldwide, climatic conditions and weather extremes that have occurred recently may have negatively influenced the contamination of feed and, consequently, AFM1 contamination of milk. As a result, it is justifiable to promote continuous monitoring in feed and dairy supply chains in Serbia and provide an update of exposure assessment.

1. Introduction

Aflatoxins (AFs) are secondary metabolites produced by Aspergillus flavus, Aspergillus parasiticus, and Aspergillus nominus fungi [1] and are some of the most studied mycotoxins in scientific literature [2]. Since they are mainly associated with the dairy supply chain and due to their adverse health impacts, there presence is analyzed throughout the chain, from feed (aflatoxin B1, AFB1) to dairy products (aflatoxin M1, AFM1). It is known that climatic conditions (hot and humid environments) are favorable for the growth of Aspergillus species and production of the toxins [3]. The importance of studying this mycotoxin becomes more pronounced bearing in mind that milk and dairy products are consumed extensively worldwide [4].
The International Agency for Research on Cancer classified aflatoxins (both AFB1 and AFM1) as carcinogenic substances for humans [5], with carcinogenic, mutagenic and teratogenic effects [6]. Although both mutagenic and carcinogenic potencies of AFM1 are less when compared to AFB1, the carcinogenic damage caused by AFM1 still categorizes it in class 1 of human carcinogenic compounds [7]. Due to its severe impact on human health, no tolerable daily intake is defined [8] and the rule of the thumb is “that the concentration of such compounds in food should be as low as reasonably achievable” [9]. In order to combat these hazards, regulators prescribe maximum levels (ML) of these mycotoxins in feed, raw milk and dairy products.
When dairy animals are fed with contaminated feed, the AFB1 is partly degraded by the forestomach before reaching the circulatory system but the remaining part is transformed into its derivative forms—mainly AFM1 [8]. Elevated levels of feed contamination are achieved due to bad management practices of feed ingredients in the feed supply chain during harvesting, storing, or processing [10]. Besides inadequate agricultural practices, unfavorable climatic conditions can also trigger the growth of AFB1 [11].
The permissible limits for ML of AFB1 in complete feeding stuffs for dairy animals in the European Union (EU) is set at 5 μg kg−1 [12] while in the US it is set at 20 μg kg−1 [10]. In parallel, the EU defined ML of AFM1 in milk and dairy products at 0.05 μg kg−1 for raw milk, heat-treated milk and milk for the production of milk-based products [13,14], with the US having a higher value of 0.5 μg kg−1 [15]. Serbia as an EU membership candidate committed to harmonize its legislation with the EU acquis communautaire [16] and regarding AFM1 tried to follow the EU, setting the value at 0.05 μg kg−1 for both raw milk and dairy products. However, due to a higher level of concentration that occurred during 2013, Serbia increased the ML to 0.5 μg kg−1 but because of great media attention retrieved the value back to 0.05 μg kg−1 in 2014 [17]. Finally, during 2015 this value was set at 0.25 μg kg−1 [18] and is still in force nowadays. Regarding AFB1 associated with feedstuffs for dairy animal, the ML value in Serbia is the same as in the EU at 5 μg kg−1 [18]. As for final products some countries, like Italy, prescribe provisional limits for mozzarella cheese (0.040 μg kg−1) and hard cheese (0.045 μg kg−1) [19].
The previous aflatoxin crisis in Serbia that was reported during 2013–2014 due to high AFB1 contamination initiated regulatory measures and increased food safety awareness [2,17]. It is of note that within the Rapid Alert System for Food and Feed (RASFF) database, AF contamination of maize was observed 18 times in the period 2012–2015 in several European countries, among which Serbia was mentioned four times [20]. Because of these activities, dairy plants have implemented strict control of raw milk and dairy products decreasing the number of products exceeding ML throughout the feed and dairy supply chain. Also, it is important to mention that dairy plants need to have an operative food safety system in place. These measures have resulted in the decrease of exposure risks to AFM1 contamination associated with consumption of milk and dairy products.
Since milk and dairy products are of great economic and nutritional importance, the safety of these products is important for all actors in the dairy value chain from farmers and dairy producers to final consumers raising health issues as a top priority. This is pronounced since aflatoxins have demonstrated to withstand sterilization and pasteurization of milk [21]. Since milk and dairy products play a role in human diets worldwide, numerous studies analyzed the occurrence of aflatoxins in these products [22,23,24].
According to the World Health Organization (WHO), exposure assessment is a ‘qualitative and/or quantitative evaluation of the likely intake of a chemical agent via food, as well as exposure from other sources if relevant.’ [25]. To perform such an analysis, it is typical to combine contamination values and food consumption data to obtain an estimation of the exposure level [26]. The importance of understanding consumption patterns is encouraged by the European Food Safety Agency [27] since consumption plays a significant role in further impact assessment and enables estimations of different nutrients and food hazards on consumer health [28]. Exposure to AFM1 is a result of consuming milk and dairy products and high(er) milk/dairy consumptions are recognized as the most important factors by all demographic groups [4]. This is pronounced as the intake of milk and dairy products is correlated with beneficial health impacts linked with type 2 diabetes and cardiovascular diseases [29].
Therefore, the aim of this study was to provide a quantitative assessment of exposure to AFM1 through the consumption of milk and dairy products in Serbia. This objective was fulfilled by combining concentration values of this mycotoxin in milk and dairy products in the period 2015–2018 and by using data from a food consumption survey performed in 2018.

2. Materials and Methods

2.1. Sampling and Preparation

A total of 747 feed for dairy animals, 385 raw milk and 556 dairy products (pasteurized milk, yogurt, different types of cheese, milk powder, sour-cream, ice-cream) were analyzed during the period 2014–2018 (feed) and 2015–2018 (raw milk and dairy products). Animal feed samples were analyzed for the presence of AFB1. These samples were sent to the laboratory by manufacturers of animal feed from different regions of Serbia. Milk and dairy products were collected from different regions of the Serbian market and stored at temperature below 8 °C or frozen at −20 °C until further analysis for AFM1. According to laboratory procedure, all samples were run in duplicate. Standard deviation among replicates (repeatability) was kept under 6%, to avoid additional testing. The samples were collected from different sources throughout the observation period.

2.2. Analyses of Dairy Products

Determination of AFB1 in feed and AFM1 in both raw milk and dairy products was performed by the enzyme-linked immunosorbent assay (ELISA) method using standard validated commercial kits (Tecna, Italy, Code MA220 and MA418, respectively), according to the manufacturer’s instructions.
For determining AFB1, the assay was performed in plastic microwells that have been coated with anti-AFB1 antibodies. In the premixing wells, enzyme-labelled aflatoxins and the standard solutions or samples were mixed and then transferred into the anti-aflatoxin microtiter plate. During the first incubation, free aflatoxin in the standard solution/sample and enzyme-labeled aflatoxin compete for the anti-aflatoxin antibody binding sites on the solid phase. Any unbound enzyme conjugate and aflatoxin molecules were then removed in a washing step. The bound enzyme activity was determined adding a fixed amount of a chromogenic substrate. The enzyme converted the colourless chromogen into a blue product. The addition of the stop reagent led to a color change from blue to yellow. The absorbance was measured by a microplate reader (EZ Read 400, Biochrom, Cambridge, UK) at 450 nm. The color development is inversely proportional to the AFB1 concentration in the sample. Results of analyses were calculated from a semi-logarithmic standard curve.
For determining AFM1, the assay was performed in plastic microwells coated with anti-AFM1 antibodies. AFM1 standard solutions and samples were added to the microwells. After two incubations, explained in [2], the enzyme converts the colorless chromogen into a blue product during the third incubation. The addition of the stop reagent leads to a color change and is the same as for AFB1, the absorbance was measured by a microplate reader and results were calculated from a semi-logarithmic standard curve.
All analyses were performed in an ISO/IEC 17,025 accredited laboratory in line with recommendations laid down in EU regulation [14]. This routine method is used daily and fits the purpose for performing lots of samples simultaneously.
The analytical quality was assured by the use of certified reference materials FAPAS T04252 (animal feed), T04224 and T04201 (maize) with certified AFB1 content, and FAPAS T04120QC and T04224QC (milk powder) with certified AFM1 content. The quality of the results was tested through participation in a FAPAS proficiency tests for both AFs achieving Z-score values within acceptable range (−2 < Z < 2). Limits of detection for the two AFs were 1 μg kg−1 (AFB1) and 0.005 μg kg−1 (AFM1). Limits of quantification for the two mycotoxins were 2 μg kg−1 (AFB1) and 0.02 μg kg−1 (AFM1). For further statistical analyses, values below limit of quantification (LOQ) were censored and substituted with a constant value of LOQ/2 as one of recommended methods dealing with left-censored values [30].

2.3. Consumption of Dairy Products

When performing national food consumption studies, it is important to define the sample size and to develop a questionnaire used as a tool for collecting data. As defined by the European Food Safety Authority (EFSA), such a tool should enable analysis of frequencies and amounts of food consumed (EFSA, 2009).
For the purpose of the survey, 1000 citizens were interviewed in 2018, out of which 17 of them have not consumed any dairy product in the last 7 days, so all further calculations were based on responses from 983 dairy product consumers. The tested population sample was predetermined in terms of age (adult population was considered 18 years or older), and location with large cities as places of residence [31]. Interviewees were informed about the objective of the survey as well as basic principles of anonymity, confidentiality and data protection for which they gave their verbal consent [9]. Collection of data was obtained through face-to-face interviews mainly outdoors or by using existing professional/family networks, and by further dissemination of the questionnaire through such networks.
The questionnaire consisted of three sets of questions. The first set was designed to generate basic demographic data of the interviewees, namely gender, age, height and body weight (bw) (Table 1). Based on height and weight, it was possible to calculate the body mass index (BMI) using the following equation: BMI = weight [kg]/height2 [m2] (Brouwer-Brolsma et al., 2018). The second part of the questionnaire gave the respondents the opportunity to define their consumption patterns of dairy products focused on frequency of consumption. Finally, the last set of questions was designed to analyze consumption of 14 different types of dairy products based on two periods: ‘yesterday’ (one-day recall) and ‘in the last seven days’ (seven-day recall). Although the 1-day recall method is the most common method used, EFSA advises that additional recording days may be more effective in evaluating dietary exposure to food and its contaminants [32]. To cross-check the results, it is not uncommon to combine both in order to capture habitual intake [9].
For both recall methods, interviewees were asked to state the type and quantity of consumed products. To avoid potential bias in recalling consumed quantities, prior to the survey authors made photographs of the products with determined mass/volume of product portions as visual aid. The selected 14 dairy products were as follows: raw milk, pasteurized milk, fermented dairy products (liquid and solid yogurt), powders (milk powder, whey powder), cheeses (white cheese, feta cheese, Mozzarela, Caciocavallo, Trapist and Gauda), sour cream and ice cream.

2.4. Data Processing and Statistical Methods

Based on AFM1 concentration, raw milk and dairy products were categorized into five classes in line with current legislation in the EU [13] and Serbia [18] and the approach presented in the work of Tomašević et al. [2]. Extra class (E) is classified as raw milk with AFM1 not exceeding ≤0.025 μg kg−1, classes I and II are defined as groups with AFM1 between 0.026–0.05 μg kg−1 (in line with EU regulation) and AFM1 between 0.051–0.25 μg kg−1 (in line with Serbian regulation), respectively. The last two classes III and IV defined AFM1 limits between 0.251–0.5 μg kg−1 and above 0.5 μg kg−1. The percentage of raw milk and dairy products, which belonged to a specific class, were expressed in Table 1.
Similar to the approach presented in the work of Tomašević et al. [2] and taking into account regulation in force related to AFB1 concentration in feed for dairy animals, five classes were defined. The percentage of feed for dairy animals belonging to a specific class were also displayed in Table 1.

2.5. Exposure Assessment

The exposure to AFM1 through dairy product consumption was calculated using data from the consumption survey, mycotoxin concentration and body weight. Depending on the recall methods, the following equations were used [9,31]:
1-day recall:
EDI = i = 1 n D i   bw C t
7-day recall:
EDI = i = 1 n W i   7 1 bw C t
EDI is the estimated daily intake of AFM1 [μg kg−1 bw/day]. Di is the quantity of dairy products consumed based on the ‘1-day’ recall [kg]; ‘n’ stands for number of consumers. Wi is the quantity of dairy products consumed based on the ‘7-day’ recall [kg]; ‘n’ stands for number of consumers. Body weight (bw) is expressed in [kg]. Ct is the concentration of AFM1 in dairy products [μg kg−1].

2.6. Statistical Methods

Descriptive statistics was used to summarize demographic data obtained from the food consumption study and describes the demographic patterns. Classes of feed, raw milk and various dairy products were expressed as percentages. The chi-square test for association was used in analyzing possible relationships between classes (of feed, raw milk and dairy products) and seasons. The same test was used to identify potential relationships between milk and yogurt consumption patterns and demographic characteristics of the sample. Yate’s correction was employed when the sample size was less than five. The level of statistical significance was set at 0.05. Statistical processing was performed using Microsoft Excel 365 and SPSS Statistics 17.0.
For calculating EDI, the authors employed a Monte Carlo simulation with 100,000 iterations to estimate the intake of AFM1 from consumption of milk and dairy products. When developing probabilistic models for dietary exposure assessment, Monte Carlo simulation is one of the tools most often used. It is recommended by the World Health Organisation (WHO) [33] and the European Food Safety Authority [27]. Lindboe, et al. [34] promote use of Monte Carlo in various assessments to account for the variability of biological systems. It has been used in different health risk assessments such as in calculating exposure to nickel [35], methyl-mercury [36] or deoxynivalenol and zearalenone [31].
Minitab was used for distribution fitting of body weight, daily and weekly intake of dairy products and Monte Carlo simulation. As for AFM1 concentration, two scenarios were used: Scenario 1—calculating exposure based on the mean value since, over time, it is expected that an individual will be exposed to this concentration of the mycotoxin in dairy products [33] and Scenario 2—by taking into account distribution of mean values by classes of AFM1 in dairy products. For both scenarios, values of AFM1 concentration were extracted from Table 1. Distribution fitting showed normal distribution for body weight and positively skewed distributions of daily/weekly intake of dairy products. To perform Monte Carlo simulation, based on the distribution results and scenarios employed, all data were randomized 100,000 times and EDIs were calculated. The uncertainty of Monte Carlo simulation was derived from the confidence intervals (95% CIs) of the mean values [37].

3. Results

3.1. Aflatoxin Concentration in Feed, Raw Milk and Dairy Products

Occurrence of aflatoxins in feed, raw milk and dairy products is presented in Table 1. Based on the results of feed analyses during the period 2014–2018, the values showed that incidence of AFB1 contamination of the samples with content exceeding EU and Serbian regulation was 4.6% (highest during winter and autumn −9.0% and 5.9%, respectively). Concentration above US ML was observed in 0.4% of the samples. However, in our case, the results for feedstuffs for dairy animals indicated that there was no statistically significant association between the feed classes based on the AFB1 and seasons, Table 12 = 17.268; df = 12; p > 0.05). However, multiple comparisons between seasons reveals statistically significant difference comparing samples within EU/Serbian ML and exceeding ML (χ2 = 12.36; df = 3; p < 0.05). Seasonal variation analysis is important due to the fact that optimal environmental conditions for A. flavus are temperatures between 25 °C and 42 °C, and water activity of 0.78 under dry conditions [38]. Previous experiences showed that severe drought summers (like in 2012) caused contamination of both feed and milk product in south-east parts of Europe, like Serbia, Croatia, and North Macedonia [39]. The same study revealed correlation between low precipitation during summer and concentration of AFB1 in maize as the main feed ingredient in Serbia.
A total of 385 raw milk samples were examined for AFM1 during the period between 2015 and 2018. Occurrence and seasonal variations are presented in Table 1. It is revealed that incidence of contamination of raw milk samples with AFM1 above the EU ML was 46.2%, with 21.3% exceeding Serbian regulation. Compared to previous studies from Serbia on AFM1 in raw milk, during 2013–2014, total samples exceeding EU ML was 56.3% [2] while in 2015 it was 44.9% [17], showing similar trends. The results also indicated that there was a statistically significant association between the raw milk classes based on the AFM1 and seasons, Table 12 = 99.686; df = 12; p < 0.05). It was shown that during autumn and spring, farms delivered an inferior quality of raw milk compared to summer and winter, in terms of aflatoxin contamination. Multiple comparisons between seasons revealed statistically significant difference comparing samples within Serbian ML and exceeding ML (χ2 = 55.038; df = 3; p < 0.05).
Regarding dairy products the results are promising, indicating high level of incoming control at dairy plants. As shown in Table 1, out of 556 samples tested during the period 2015–2018, only 1.3% exceeded EU ML with only 0.1% exceeding ML specified in Serbian regulation. Average values were in the range between 0.013 and 0.018 μg kg−1. This showed significant improvement compared to the period 2013–2014 when over 30% of samples had values over 0.05 μg kg−1 [2] and 4.2% of samples analyzed during 2015 [17]. Concerning seasonal variations, there was a statistically significant association observed between the milk classes and seasons (χ2 = 34.635; df = 12; p < 0.05). However, multiple comparisons between seasons revealed no statistically significant difference comparing samples within Serbian ML and exceeding ML (χ2 = 1.235; df = 3; p > 0.05).

3.2. Consumption of Milk and Dairy Products

The demographic profile of the sample is presented in Table 2 and shows that females prevailed compared to the male population. Age distribution indicated that over 40% of those interviewed were above 50 years of age followed by younger consumer (below 34 years of age) with slightly above 30%. The remaining share was population between 35 and 49 years old. Average body weight of all interviewees was slightly above 71 kg which corresponds to EFSA assumptions that, when unknown, average body weight of an European adult citizen is 70 kg [40]. Over one third of the interviewed population were overweight/obese since their BMI value was over 24.9. Average daily intake of milk and dairy products is estimated around 0.27 kg (based on a ‘7-day recall’) or 0.32 kg (based on a ‘1-day recall’). One of the biggest European studies on dairy consumption revealed that average daily consumption of dairy products fall in the range of 0.19–0.48 kg [41]. The same study showed that lower dairy consumptions were observed in Greece and Italy compared to Spain and the Netherlands with higher average daily consumption.
The top three dairy products consumed by the Serbian adult population were pasteurized milk (29.76%), yogurt (27.99%) and white cheese (13.46%). Other dairy products were consumed by fewer than 10% (calculated based on reported quantities, data not shown). Since these two products prevail, Table 3 and Table 4 display frequencies of their consumption. This pattern corresponded to the overall European dairy consumption pattern with milk and yogurt constituting the most common dairy products [41]. In Serbia, yogurt is a liquid fermented milk product produced by the activity of symbiotic cultures such as Streptococcus thermophilus and Lactobacillus delbrueckii subsp. bulgaricus [42]. Although some authors prefer stating that fermentation has the potential to reduce AFM1 due to its pH value, formation of organic acids, fermentation of by-products, or presence of lactic acid bacteria [2,43], Arab et al. [44] in their review paper stated that regarding reduction of AFM1 due to fermentation is controversial since four factors directly affect this reduction: concentration of AFM1, fermentation condition, factors related to casein and analytical method employed.
Regarding pasteurized milk (Table 3), it is obvious that there is statistically significant difference in consumption patterns between males and females (χ2 = 54.066; p < 0.05) and between age groups (χ2 = 68.256; p < 0.05). Male population consumed pasteurized milk more frequently (40% daily), while females consumed milk several times a week. Based on 7-day recall data, males consumed 1025 mL of milk compared to females who consumed 1113 mL a week. Average milk consumption was 1075 mL a week (153.6 mL/day). Compared to other European countries, milk consumption ranged between 100 and 115 mL/day in Greece, Germany and France, followed by Italy with 145 mL/day, Denmark with 205 mL/day and Spain with over 300 mL/day [41]. Age distribution showed that over 50% of the younger population (below 34 years of age) consumed milk on a daily basis. In Serbia and Greece youngsters consume between 200 mL and 300 mL of milk a day [9].
The consumption pattern for yogurt (Table 4) revealed statistically significant differences among genders (χ2 = 12.38; Yates’ χ2 = 11.248); p < 0.05) with no differences observed between age groups (p > 0.05). It is interesting that there were no statistically significant differences between consumption patterns of both milk and yogurt comparing populations within a healthy weight range (BMI between 14.5 and 24.9) and overweight/obesity (BMI ≥ 24.9). On the other hand, some authors indicated a positive association between milk/yogurt consumption and healthy eating habits [45].
Similar to the milk consumption pattern, daily consumption of yogurt was a more frequent routine observed with males compared to females. Regarding quantities, average consumption of yogurt associated with Serbian population was 877 mL/week. Gender comparison showed that males consumed 891 mL/week opposed to females with 867 mL/week.

3.3. Exposure Assessment

Figure 1 displays estimated total daily intake of AFM1 after a Monte Carlo simulation for two recall methods and two scenarios. Results showed that mean values were more dependent on the recall method as opposed to the scenarios employed. Mean AFM1 exposure of the Serbian population (Figure 1, Table 5), depended on the recall number of days and scenario employed was in the range between 62–74 × 10−3 ng/kg bw/day. On the other side, maximal values (Table 5) were determined by the scenario applied and distributions span from 0.00397–0.75724 ng/kg bw/day (7 d, scenario 1) to 0.00323–7.05512 ng/kg bw/day (7 d, scenario 2). Figure 1 shows an asymmetrical distribution shape slightly tailed where the data reflected a non-normal shape with exponential decreasing: the probability of exposure (presented as frequencies of exposure) decreased as the exposure value increased. Also, EDIs reflected the asymmetrical scattering of the data (Table 5).
Kos et al. [46] assumed in 2013 that exposure to AFM1 from milk was 0.21 ng/kg bw/day. Our results are promising compared to a study using data from 2014 and 2015 performed by Milićević et al. [47] where exposure to AFM1 from milk in Serbia was between 0.18 and 0.20 ng/kg bw/day. When comparing exposure assessments with other countries, results from Serbia should be compared to those obtained from regions with climate conditions suitable for growth of AFs [9]. Values from this study are higher than in Italy or Spain where exposure assessments revealed a range between 0.025 and 0.328 ng/kg bw/day and a value of 0.039 ng/kg bw/day, respectively [8,48]. In parallel, our results are in line with the estimations from the French and Brazilian studies estimating 0.09 and 0.08 ng/kg bw/day [22,49].
The result of uncertainty analysis of Monte Carlo variation (Table 5) shows that for EDI of AFMI, 95% CI of the mean value is 73.3–76.6 × 10⁻³ ng/kg bw/day (1-day recall, both scenarios) and 61.8–64.8 × 10⁻³ ng/kg bw/day (7-day recall, both scenarios).

4. Discussion

Serbian legislation concerning aflatoxins in the dairy supply chain (from crops and feed to raw milk and final products) is mainly in line with EU regulation. For feedstuff used by dairy animals, the ML is fully harmonized with the EU legislation. However, for raw milk and dairy products, the ML limit in Serbia is five time higher than in the EU. Results presented in Table 1 show that almost half of the samples were above ML in the EU and almost one quarter below the Serbian ML. However, this is under control due to strict incoming control in dairy plants. It can be observed that the share of unsafe samples decreased from 46.2%/21.3% (raw milk compared to EU/Serbian ML) to 1.3%/0.1% (final dairy product compared to EU/Serbian ML). Compared with previous studies, average concentration of AFM1 in raw milk decreased from 0.282 μg kg−1 [2] to average value of 0.142 μg kg−1 (Table 1). A similar trend can be observed with final products where AFM1 concentration dropped from 0.268 μg kg−1 [2] and 0.019 μg kg−1 [17] to 0.016 μg kg−1 (Table 1).
It is obvious that controls (both incoming and final) within dairy plants play an essential role in preventing highly contaminated products entering the market. Good manufacturing practices in dairy plants as the final barriers are recognized as the most influential parameter. A survey on food safety management systems in dairy plants of Serbia showed that the majority have some type of a food safety system in place. The most important incentive for implementing such systems was in increasing and improving the safety and quality of dairy products [50]. Also, all dairy plant need to have an operative HACCP (Hazard Analysis and Critical Control Point)-based food safety system in place [51].
Regarding feed, the contamination of crops used as feed ingredients can occur in the field during the pre-harvest phase, during harvest, or in post-harvest stages [10]. Since AFM1 originates from AFB1 occurring in feed, it is obvious that agricultural practices are essential in keeping the level of aflatoxin throughout the dairy supply chain below ML. Two important facts need to be mentioned. First is the structure of average agricultural holding where the size of an average farm in Serbia is around 3 ha and most of these individual farms base their production only on meeting their own needs, with limited knowledge on agricultural practices [52]. The second issue is that HACCP-based food safety systems in dairy plants are mandatory [51] while implementation of good agricultural practices at farm level are voluntary.
Climatic condition is another factor that may affect AFs growth during pre-harvest and harvest stages, but can be fully controlled with the use of appropriate agricultural practices. Interrelation between climate conditions and crop productivity is dependent on the type of crop employed, climatic specifics of the region, type of soil, agricultural practices and exposure of crops to climatic conditions [53]. The climate of Serbia is considered as moderate-continental, being influenced by its geographic location and relief. All four seasons were equally pronounced with the mean annual air temperature between 11 °C and 12 °C, with average summer during summers between 21 °C and 22 °C and during winters between 0 °C and 2 °C (RHSS 2013). In case of normal weather conditions, crop production shows optimal yields.
However, Europe as a continent with Serbia being a part of it, is suffering from anthropogenic influences which cause climate change in terms of temperature and precipitation patterns [54]. The main climate change effects on crop production recognized in Europe are: (i) temperature and rainfall changes; (ii) distribution, phenology and abundance of plant species; (iii) possibilities of extreme climate effects; (iv) yield changes in crop production; (vi) increased need for irrigation; (vii) occurrence of plant pests and diseases/disease vectors and hosts [55]. These changes affect crop production from slight temperature increases to extreme weather conditions and regardless of agricultural practices in place, they have an effect on quantity, quality and food safety. Janić Hajnal et al. [39] highlights that it is necessary to monitor AFB1 in maize/feed in Serbia due to observed weather conditions changes favorable for growth of Aspergillus in recent years. In the last decade, the following extreme climate events have been recorded in Serbia: severe cold weather in February 2012, mid January 2017 and snow in April 2017 as well as heavy rains in May 2014, March and May 2016 (RHSS 2020). The strong rains in 2016 and cold weather in 2017 may have been triggers for increasing levels of AFB1 (Table 1).
Based on the fact that exposure to AFM1 is associated with two factors—the quantity of milk/dairy products consumed and the concentration of AFM1 in final products, this paper reveals one important conclusion: regardless of the concentration of AFB1 in feed, final products are within limits outlined in Serbian legislation throughout the entire year. However, since there is no tolerable daily intake defined for AFM1, and in order not to restrict milk/dairy consumption to citizens due to beneficial nutritional effects of these products, it is necessary to keep the concentration of aflatoxins in feed/food as low as possible. Therefore, focus needs to be shifted to feed production where good agricultural practice (on the field) and good storage practice (in the mills) have to be elevated to higher standards.
Regarding the uncertainty of this study, it is of a moderate level due to the following assumptions: sample size, type of dairy products analyzed, aflatoxins in focus, and specification that values below LOQ are counted as LOQ/2 [31]. Monte Carlo uncertainty analysis of 95% CI of the mean values shows that such results have little effect on the upper percentile exposures.

5. Conclusions

The study revealed that pasteurized milk (1075 mL/week) and yogurt (877 mL/week) are dairy products mostly consumed by the Serbian adult population. Depending on the recall methods and scenarios employed, EDI of AFM1 was in the range of 62–74 × 10−3 ng/kg bw/day. Also, this study confirmed that the concentration of AFM1 in milk and dairy products is within prescribed limits, regardless of seasonal variation. Even though the problem with AFM1 contamination may be considered as solved, there are still improvements that can produce safer products, mainly in feed production.
Understanding dietary patterns on one side, and seasonal variation that enhance growth of AFB1 in feed can help in developing prediction models contributing to the human health impact prevention of diseases caused by AFM1. Additional studies should be focused on infants and young children as this population is considered vulnerable to AFM1 mainly due to their dietary habits and meals with higher level of milk/dairy products.
Knowing that aflatoxin contamination varies between harvests and is influenced by agricultural practices and seasonal variation, it is important to improve agricultural practices at farms to avoid/decrease occurrence of AFB1. This can enable effective disease-management strategies for combating AFB1 at its source. Since exposure is associated with consumption patterns, the authors believe that further research should be focused on developing a risk-based quality plan for monitoring these toxins throughout the dairy chain continuum and re-assessing the risks to the population.

Author Contributions

Conceptualization, I.D. and I.T.; methodology, I.D.; software, I.T.; laboratory analyses J.P., M.J., A.R.-D. and M.S.; validation, J.P.; writing—review and editing, J.M.L. and M.I.; supervision, J.M.L. and M.I. All authors have read and agreed to the published version of the manuscript.

Funding

This research received no external funding.

Conflicts of Interest

The authors declare no conflict of interest.

References

  1. WHO. Evaluation of Certain Mycotoxins in Food: Fifty-Sixth Report of the Joint FAO/WHO Expert Committee on Food Additives; FAO: Rome, Italy, 2002. [Google Scholar]
  2. Tomašević, I.; Petrović, J.; Jovetić, M.; Raičević, S.; Milojević, M.; Miočinović, J. Two year survey on the occurrence and seasonal variation of aflatoxin M1 in milk and milk products in Serbia. Food Control 2015, 56, 64–70. [Google Scholar] [CrossRef]
  3. Karami-Osboo, R.; Mirabolfathy, M.; Kamran, R.; Shetab-Boushehri, M.; Sarkari, S. Aflatoxin B1 in maize harvested over 3 years in Iran. Food Control 2012, 23, 271–274. [Google Scholar] [CrossRef]
  4. Prandini, A.; Tansini, G.; Sigolo, S.; Filippi, L.; Laporta, M.; Piva, G. On the occurrence of aflatoxin M1 in milk and dairy products. Food Chem. Toxicol. 2009, 47, 984–991. [Google Scholar] [CrossRef] [PubMed]
  5. Anttila, A.; Bhat, R.V.; Bond, J.A.; Borghoff, S.J.; Bosch, F.X.; Carlson, G.P.; Castegnaro, M.; Cruzan, G.; Gelderblom, W.C.; Hass, U. IARC monographs on the evaluation of carcinogenic risks to humans: Some traditional herbal medicines, some mycotoxins, naphthalene and styrene. IARC Monogr. Eval. Carcinog. Risks Hum. 2002, 82, 275–300. [Google Scholar]
  6. IARC. Chemical agents and related occupations: A review of human carcinogens. Int. Agency Res. Cancer 2012, 100, 225–248. [Google Scholar]
  7. Fallah, A.A.; Barani, A.; Nasiri, Z. Aflatoxin M1 in raw milk in Qazvin Province, Iran: A seasonal study. Food Addit. Contam. Part B 2015, 8, 195–198. [Google Scholar] [CrossRef]
  8. Serraino, A.; Bonilauri, P.; Kerekes, K.; Farkas, Z.; Giacometti, F.; Canever, A.; Zambrini, A.V.; Ambrus, Á. Occurrence of Aflatoxin M1 in Raw Milk Marketed in Italy: Exposure Assessment and Risk Characterization. Front. Microbiol. 2019, 10, 2516. [Google Scholar] [CrossRef]
  9. Udovicki, B.; Djekic, I.; Kalogianni, E.P.; Rajkovic, A. Exposure Assessment and Risk Characterization of Aflatoxin M1 Intake through Consumption of Milk and Yoghurt by Student Population in Serbia and Greece. Toxins 2019, 11, 205. [Google Scholar] [CrossRef] [Green Version]
  10. Alvarado, A.M.; Zamora-Sanabria, R.; Granados-Chinchilla, F. A focus on aflatoxins in feedstuffs: Levels of contamination, prevalence, control strategies, and impacts on animal health. Aflatoxin Control Anal. Detect. Health Risks 2017, 116–152. [Google Scholar] [CrossRef] [Green Version]
  11. Battilani, P.; Toscano, P.; Van der Fels-Klerx, H.; Moretti, A.; Leggieri, M.C.; Brera, C.; Rortais, A.; Goumperis, T.; Robinson, T. Aflatoxin B 1 contamination in maize in Europe increases due to climate change. Sci. Rep. 2016, 6, 24328. [Google Scholar] [CrossRef] [Green Version]
  12. EC. Directive 2002/32/EC of the European Parliament and of the Council of 07 May 2002 on undesirable substances in animal feed. Off. J. Eur. Union 2002, 140, 1–28. [Google Scholar]
  13. EC. Commission Regulation (EC) No 1881/2006 of 19 December 2006 setting maximum levels for certain contaminants in foodstuffs. Off. J. Eur. Union 2006, 364, 5–24. [Google Scholar]
  14. EC. Commission Regulation (EC) No 401/2006 of 23 February 2006 laying down the methods of sampling and analysis for the official control of the levels of mycotoxins in foodstuffs. Off. J. Eur. Union 2006, 70, 12–34. [Google Scholar]
  15. US. Sec. 527.400 Whole Milk, Low Fat Milk, Skim Milk—Aflatoxin M1 (CPG 7106.10); Food and Drug Administration, Ed.; FDA/ORA Compliance Policy Guides: Rockville, MD, USA, 2005. [Google Scholar]
  16. Smigic, N.; Rajkovic, A.; Djekic, I.; Tomic, N. Legislation, standards and diagnostics as a backbone of food safety assurance in Serbia. Br. Food J. 2015, 117, 94–108. [Google Scholar] [CrossRef]
  17. Miocinovic, J.; Keskic, T.; Miloradovic, Z.; Kos, A.; Tomasevic, I.; Pudja, P. The aflatoxin M1 crisis in the Serbian dairy sector: The year after. Food Addit. Contam. Part B 2017, 10, 1–4. [Google Scholar] [CrossRef] [PubMed]
  18. Serbia. Regulation on the permissible limits for maximum level of residues in food and feed/Pravilnik o maksimalno dozvoljenim količinama ostataka sredstava za zaštitu bilja u hrani za životinje i o hrani i hrani za životinje za koju se utvrđuju maksimalno dozvoljene količine ostataka sredstava za zaštitu bilja. In 29/14, 37/14—Amendments, 39/14, 72/14, 80/15, 84/15, 35/16, 81/16, 21/17 and 81/17; Official Gazette of the Republic of Serbia; Government of the Republic of Serbia: Belgrade, Serbia, 2014; Volume No 29/2014. [Google Scholar]
  19. Iammarino, M. L’aflatossina M1 nella filiera lattiero-casearia: Aspetti sanitari, legislativi ed ispettivi. Alimenta 2016, XXIV, 153–158. [Google Scholar]
  20. RASFF. Rapid Alert System for Food and Feed (RASFF); European Commision: Brussels, Belgium, 2020. [Google Scholar]
  21. Chavarría, G.; Granados-Chinchilla, F.; Alfaro-Cascante, M.; Molina, A. Detection of aflatoxin M1 in milk, cheese and sour cream samples from Costa Rica using enzyme-assisted extraction and HPLC. Food Addit. Contam. Part B 2015, 8, 128–135. [Google Scholar] [CrossRef] [PubMed]
  22. Shundo, L.; Navas, S.A.; Lamardo, L.C.A.; Ruvieri, V.; Sabino, M. Estimate of aflatoxin M1 exposure in milk and occurrence in Brazil. Food Control 2009, 20, 655–657. [Google Scholar] [CrossRef]
  23. Zheng, N.; Wang, J.-Q.; Han, R.-W.; Zhen, Y.-P.; Xu, X.-M.; Sun, P. Survey of aflatoxin M1 in raw milk in the five provinces of China. Food Addit. Contam. Part B 2013, 6, 110–115. [Google Scholar] [CrossRef] [PubMed]
  24. Suriyasathaporn, W.; Nakprasert, W. Seasonal patterns of aflatoxin M1 contamination in commercial pasteurised milk from different areas in Thailand. Food Addit. Contam. Part B 2012, 5, 145–149. [Google Scholar] [CrossRef]
  25. FAO/WHO. Application of Risk Analysis to Food Standards Issues: Report of the Joint FAO/WHO; FAO/WHO, Food and Agriculture Organization of the United Nations & World Health Organization: Geneva, Switzerland, 1995. [Google Scholar]
  26. Pacin, A.M.; Resnik, S.L.; Martinez, E.J. Concentrations and exposure estimates of deoxynivalenol in wheat products from Argentina. Food Addit. Contam. Part B Surveill. Commun. 2011, 4, 125–131. [Google Scholar] [CrossRef] [PubMed]
  27. EFSA. Overview of the procedures currently used at EFSA for the assessment of dietary exposure to different chemical substances. EFSA J. 2011, 9, 1–33. [Google Scholar]
  28. Vilone, G.; Comiskey, D.; Heraud, F.; O’Mahony, C. Statistical method to assess usual dietary intakes in the European population. Food Addit. Contam. Part A Chem. Anal. Control Expo. Risk Assess 2014, 31, 1639–1651. [Google Scholar] [CrossRef]
  29. Thorning, T.K.; Raben, A.; Tholstrup, T.; Soedamah-Muthu, S.S.; Givens, I.; Astrup, A. Milk and dairy products: Good or bad for human health? An assessment of the totality of scientific evidence. Food Nutr. Res. 2016, 60, 32527. [Google Scholar] [CrossRef] [PubMed] [Green Version]
  30. Beal, S.L. Ways to fit a PK model with some data below the quantification limit. J. Pharmacokinet. Pharmacodyn. 2001, 28, 481–504. [Google Scholar] [CrossRef] [PubMed]
  31. Djekic, I.; Udovicki, B.; Kljusurić, J.G.; Papageorgiou, M.; Jovanovic, J.; Giotsas, C.; Djugum, J.; Tomic, N.; Rajkovic, A. Exposure assessment of adult consumers in Serbia, Greece and Croatia to deoxynivalenol and zearalenone through consumption of major wheat-based products. World Mycotoxin J. 2019, 12, 431–442. [Google Scholar] [CrossRef]
  32. EFSA. General principles for the collection of national food consumption data in the view of a pan-European dietary survey. EFSA J. 2009, 7, 1–51. [Google Scholar]
  33. FAO/WHO. Principles and Methods for the Risk Assessment of Chemicals in Food. In Environmental Health Criteria 240; Food and Agriculture Organization of the United Nations & World Health Organization: Geneva, Switzerland, 2009. [Google Scholar]
  34. Lindboe, M.; Henrichsen, E.; Høgåsen, H.; Bernhoft, A. Lead concentration in meat from lead-killed moose and predicted human exposure using Monte Carlo simulation. Food Addit. Contam. Part A 2012, 29, 1052–1057. [Google Scholar] [CrossRef]
  35. Wang, W.; Zhang, Z.; Yang, G.; Wang, Q. Health risk assessment of Chinese consumers to nickel via dietary intake of foodstuffs. Food Addit. Contam. Part A Chem. Anal. Control Expo. Risk Assess 2014, 31, 1861–1871. [Google Scholar] [CrossRef]
  36. Cardoso, C.; Lourenco, H.; Afonso, C.; Nunes, M.L. Risk assessment of methyl-mercury intake through cephalopods consumption in Portugal. Food Addit. Contam. Part A Chem. Anal. Control Expo. Risk Assess 2012, 29, 94–103. [Google Scholar] [CrossRef]
  37. Sun, J.; Wu, Y. Evaluation of dietary exposure to deoxynivalenol (DON) and its derivatives from cereals in China. Food Control 2016, 69, 90–99. [Google Scholar] [CrossRef]
  38. Santin, E. Mould growth and mycotoxin production. In The Mycotoxin Blue Book; Diaz, D.E., Ed.; University Press: Nottingham, UK, 2005; pp. 225–234. [Google Scholar]
  39. Janić Hajnal, E.; Kos, J.; Krulj, J.; Krstović, S.; Jajić, I.; Pezo, L.; Šarić, B.; Nedeljković, N. Aflatoxins contamination of maize in Serbia: The impact of weather conditions in 2015. Food Addit. Contam. Part A 2017, 34, 1999–2010. [Google Scholar] [CrossRef] [PubMed]
  40. EFSA. Guidance on selected default values to be used by the EFSA Scientific Committee, Scientific Panels and Units in the absence of actual measured data. EFSA J. 2012, 10, 2579. [Google Scholar]
  41. Hjartåker, A.; Lagiou, A.; Slimani, N.; Lund, E.; Chirlaque, M.; Vasilopoulou, E.; Zavitsanos, X.; Berrino, F.; Sacerdote, C.; Ocke, M. Consumption of dairy products in the European Prospective Investigation into Cancer and Nutrition (EPIC) cohort: Data from 35955 24-hour dietary recalls in 10 European countries. Public Health Nutr. 2002, 5, 1259–1271. [Google Scholar] [CrossRef] [Green Version]
  42. Djekic, I.; Miocinovic, J.; Pisinov, B.; Ivanovic, S.; Smigic, N. Quality characteristics of selected dairy products in Serbia. Mljekarstvo 2013, 63, 228–236. [Google Scholar]
  43. Govaris, A.; Roussi, V.; Koidis, P.; Botsoglou, N. Distribution and stability of aflatoxin M1 during production and storage of yoghurt. Food Addit. Contam. 2002, 19, 1043–1050. [Google Scholar] [CrossRef]
  44. Arab, M.; Sohrabvandi, S.; Mortazavian, A.M.; Mohammadi, R.; Tavirani, M.R. Reduction of aflatoxin in fermented milks during production and storage. Toxin Rev. 2012, 31, 44–53. [Google Scholar] [CrossRef]
  45. Brouwer-Brolsma, E.M.; Sluik, D.; Singh-Povel, C.M.; Feskens, E.J.M. Dairy shows different associations with abdominal and BMI-defined overweight: Cross-sectional analyses exploring a variety of dairy products. Nutr. Metab. Cardiovasc. Dis. 2018, 28, 451–460. [Google Scholar] [CrossRef] [Green Version]
  46. Kos, J.; Lević, J.; Đuragić, O.; Kokić, B.; Miladinović, I. Occurrence and estimation of aflatoxin M1 exposure in milk in Serbia. Food Control 2014, 38, 41–46. [Google Scholar] [CrossRef]
  47. Milićević, D.R.; Spirić, D.; Radičević, T.; Velebit, B.; Stefanović, S.; Milojević, L.; Janković, S. A review of the current situation of aflatoxin M1 in cow’s milk in Serbia: Risk assessment and regulatory aspects. Food Addit. Contam. Part A 2017, 34, 1617–1631. [Google Scholar] [CrossRef]
  48. Cano-Sancho, G.; Sanchis, V.; Marín, S.; Ramos, A. Occurrence and exposure assessment of aflatoxins in Catalonia (Spain). Food Chem. Toxicol. 2013, 51, 188–193. [Google Scholar] [CrossRef] [PubMed]
  49. Leblanc, J.-C.; Tard, A.; Volatier, J.-L.; Verger, P. Estimated dietary exposure to principal food mycotoxins from the first French Total Diet Study. Food Addit. Contam. 2005, 22, 652–672. [Google Scholar] [CrossRef] [PubMed]
  50. Tomasevic, I.; Smigic, N.; Djekic, I.; Zaric, V.; Tomic, N.; Miocinovic, J.; Rajkovic, A. Evaluation of food safety management systems in Serbian dairy industry. Mljekarstvo 2016, 66, 48–58. [Google Scholar]
  51. Serbia. Food Safety Law; Official Gazette of the Republic of Serbia; Government of the Republic of Serbia: Belgrade, Serbia, 2009; Volume No. 41/09.
  52. Serbia. Statistical Yearbook of the Republic of Serbia for 2018; Statistical Office of the Republic of Serbia: Belgrade, Serbia, 2019.
  53. Porter, J.R.; Xie, L.; Challinor, A.J.; Cochrane, K.; Howden, S.M.; Iqbal, M.M.; Travasso, M.; Barros, V.; Field, C.; Dokken, D. Food security and food production systems. In Climate Change 2014: Impacts, Adaptation, and Vulnerability. Part A: Global and Sectoral Aspects. Contribution of Working Group II to the Fifth Assessment Report of the Intergovernmental Panel on Climate Change; Cambridge University Press: Cambridge, UK; New York, NY, USA; pp. 485–533.
  54. Olesen, J.E.; Trnka, M.; Kersebaum, K.C.; Skjelvåg, A.O.; Seguin, B.; Peltonen-Sainio, P.; Rossi, F.; Kozyra, J.; Micale, F. Impacts and adaptation of European crop production systems to climate change. Eur. J. Agron. 2011, 34, 96–112. [Google Scholar] [CrossRef]
  55. Kovats, R.S.; Valentini, R.; Bouwer, L.M.; Georgopoulou, E.; Jacob, D.; Martin, E.; Rounsevell, M.; Soussana, J.F. Climate Change 2014: Impacts, Adaptation, and Vulnerability. Part B: Regional Aspects; Cambridge University Press: Cambridge, UK; New York, NY, USA, 2014. [Google Scholar]
Figure 1. Comparison of estimated total daily intake of AFM1 after a Monte Carlo simulation of 100,000 iterations. (a) 1-day recall—Scenario 1; (b) 1-day recall—Scenario 2; (c) 7-day recall—Scenario 1; (d) 7-day recall—Scenario 2.
Applsci 10 07420 g001
Table 1. The frequencies of feed (2014–2018) and raw milk and other dairy products (2015–2018) samples in Serbia classified in aflatoxin B1 (AFB1) and aflatoxin M1 (AFM1) concentration categories, and the proportions exceeded the maximum levels under European Union (EU), Serbian, and United States regulations.
SeasonsNumber of Samples Frequencies of Samples and Percentages Classified in AFB1 Concentration (μg kg−1) CategoriesTotal % Exceeding EU/Serbian MLTotal % Exceeding US MLMean Median 95th
≤2.52.51–5.05.01–10.010.01–20.0>20(>5 μg kg−1)(>20 μg kg−1)
Feed for dairy animalsWinter 170149 (87.6%)11 (6.5%)5 (2.9%)5 (2.9%)0 (0%)9.01.32.243 1.007.11
Spring 232214 (92.2%)12 (5.2%)2 (0.9%)3 (1.3%)1 (0.4%)2.60.41.676 1.003.45
Summer189176 (93.1%)9 (4.8%)3 (1.6%)1 (0.5%)0 (0%)2.10.01.537 1.003.00
Autumn 156131 (84.0%)11 (7.1%)6 (3.8%)6 (3.8%)2 (1.3%)5.90.02.459 1.0010.25
Total 747670 (89.7%)43 (5.8%)16 (2.1%)15 (2%)3 (0.4%)4.60.41.933 1.005.00
Mean ± SD 1.247 ± 0.4344.316 ± 4.0887.747 ± 1.55314.695 ± 3.11726.187 ± 3.237
Raw milkSeasonsNumber of samplesFrequencies of samples and percentages classified in AFM1 concentration (μg kg−1) categoriesTotal % exceeding EU MLTotal % exceeding Serbian MLMeanMedian95th
≤0.0250.026–0.050.051–0.250.251–0.5>0.5(>0.05 μg kg−1)(>0.25 μg kg−1)
Winter 5930 (50.8%)14 (23.7%)10 (16.9%)5 (8.5%)0 (0%)25.48.50.057 0.0130.281
Spring 8055 (68.8%)4 (5.0%)14 (17.5%)4 (5.0%)3 (3.8%)26.38.80.081 0.0130.393
Summer5524 (43.6%)14 (25.5%)17 (30.9%)0 (0%)0 (0%)30.90.00.050 0.0300.173
Autumn 19140 (20.9%)26 (13.6%)55 (28.8%)39 (20.4%)31 (16.2%)65.436.60.220 0.1300.685
Total 385149 (38.7%)58 (15.1%)96 (24.9%)48 (12.5%)34 (8.8%)46.221.30.142 0.0400.630
Mean ± SD 0.013 ± 0.0010.035 ± 0.0070.125 ± 0.0550.341 ± 0.0710.660 ± 0.119
Various dairy products ≤0.0250.026–0.050.051–0.250.251–0.5>0.5(>0.05 μg kg−1)(>0.25 μg kg−1)MeanMedian95th
Winter 9178 (85.7%)7 (7.7%)6 (6.6%)0 (0%)0 (0%)4.00.00.018 0.0130.050
Spring 124117 (94.4%)3 (2.4%)4 (3.2%)0 (0%)0 (0%)2.00.00.015 0.0130.025
Summer9290 (97.8%)2 (2.2%)0 (0%)0 (0%)0 (0%)0.00.00.013 0.0130.013
Autumn 249215 (86.3%)32 (12.9%)1 (0.4%)1 (0.4%)0 (0%)0.50.20.016 0.0130.029
Total 556500 (89.9%)44 (7.9%)11 (2.0%)1 (0.2%)0 (0%)1.30.10.016 0.0130.029
Mean ± SD 0.013 ± 0.0010.029 ± 0.0050.083 ± 0.0290.330 ± 0.0100.0 ± 0.0
Legend: ML—maximum level; SD—standard deviation; 95th—95th percentile.
Table 2. Demographic profile of the sample (n = 983).
Total
GenderMale404 (41.1%)
Female 579 (58.9%)
AgeLess than 34 years306 (31.1%)
35–49 years272 (27.7%)
Over 50 years405 (41.2%)
Weight Below 70 kg460 (46.8%)
Above 70 kg523 (53.2%)
Body mass index (BMI)14.5 ≤ BMI ≤ 24.9645 (65.6%)
BMI ≥24.9338 (34.4%)
Average body weight [kg]71.21 ± 10.54
Average intake of dairy products—1-day recall [kg]0.32 ± 0.19
Average intake of dairy products—7-day recall [kg]1.92 ± 1.10
Average daily intake of dairy products per body weight
[g/per kg bw]
Male3.49 ± 2.17
Female 4.22 ± 2.33
Total 3.92 ± 2.29
n —represents the number of respondents; (%) represents their share in the sample.
Table 3. Consumption pattern of pasteurized milk in Serbia (n = 521).
CountryTwice a DayOnce a Day5–6 Times a Week3–4 Times a WeekTwice a WeekOnce a Week or RareTotal
Gender
Male40 (17.9%)52 (23.3%)37 (16.6%)25 (11.2%)32 (14.3%)37 (16.6%)223 (100%)
Female9 (3.0%)40 (13.4%)53 (17.8%)71 (23.8%)70 (23.5%)55 (18.5%)298 (100%)
χ2 = 54.066; p < 0.05
Age
Below 34 years a39 (19.7%)39 (19.7%)40 (20.2%)36 (18.2%)24 (12.1%)20 (10.1%)198 (100%)
35–49 years b5 (4.6%)15 (13.8%)14 (12.8%)13 (11.9%)33 (30.3%)29 (26.6%)109 (100%)
Over 50 years b5 (2.3%)38 (17.8%)36 (16.8%)47 (22.0%)45 (21.0%)43 (20.1%)214 (100%)
χ2 = 68.256; p < 0.05
BMI
14.5 ≤ BMI ≤ 24.937 (10.2%)64 (17.7%)62 (17.1%)74 (20.4%)69 (19.1%)56 (15.5%)362 (100%)
BMI ≥ 24.912 (7.5%)28 (17.6%)28 (17.6%)22 (13.8%)33 (20.8%)36 (22.6%)159 (100%)
χ2 = 6.851; p > 0.05
(n) represents the frequency of consumption of pasteurized milk during the observed period; (%) represents their share in the sample. Note: Items denoted with different letters in superscript (a,b) are significantly different at the level of 5%.
Table 4. Consumption pattern of yogurt in Serbia (n = 601).
CountryTwice a DayOnce a Day5–6 Times a Week3–4 Times a WeekTwice a WeekOnce a Week or RareTotal
Gender
Male4 (1.6%)53 (21.8%)79 (32.5%)35 (14.4%)48 (19.8%)24 (9.9%)243 (100%)
Female6 (1.7%)51 (14.2%)97 (27.1%)79 (22.1%)89 (24.9%)36 (10.1%)358 (100%)
χ2 = 12.38; (Yates’ χ2 = 11.248); p < 0.05
Age
Below 34 years3 (1.8%)41 (24.0%)45 (26.3%)25 (14.6%)37 (21.6%)20 (11.7%)171 (100%)
35–49 years5 (2.4%)35 (16.7%)65 (31.1%)43 (20.6%)44 (21.1%)17 (8.1%)209 (100%)
Over 50 years2 (0.9%)28 (12.7%)66 (29.9%)46 (20.8%)56 (25.3%)23 (10.4%)221 (100%)
χ2 = 14.046; (Yates’ χ2 = 11.517); p > 0.05
BMI
14.5 ≤ BMI ≤ 24.95 (1.3%)67 (17.5%)106 (27.7%)73 (19.1%)91 (23.8%)40 (10.5%)382 (100%)
BMI ≥ 24.95 (2.3%)37 (16.9%)70 (32.0%)41 (18.7%)46 (21.0%)20 (9.1%)219 (100%)
χ2 = 2.417; (Yates’ χ2 = 1.532); p > 0.05
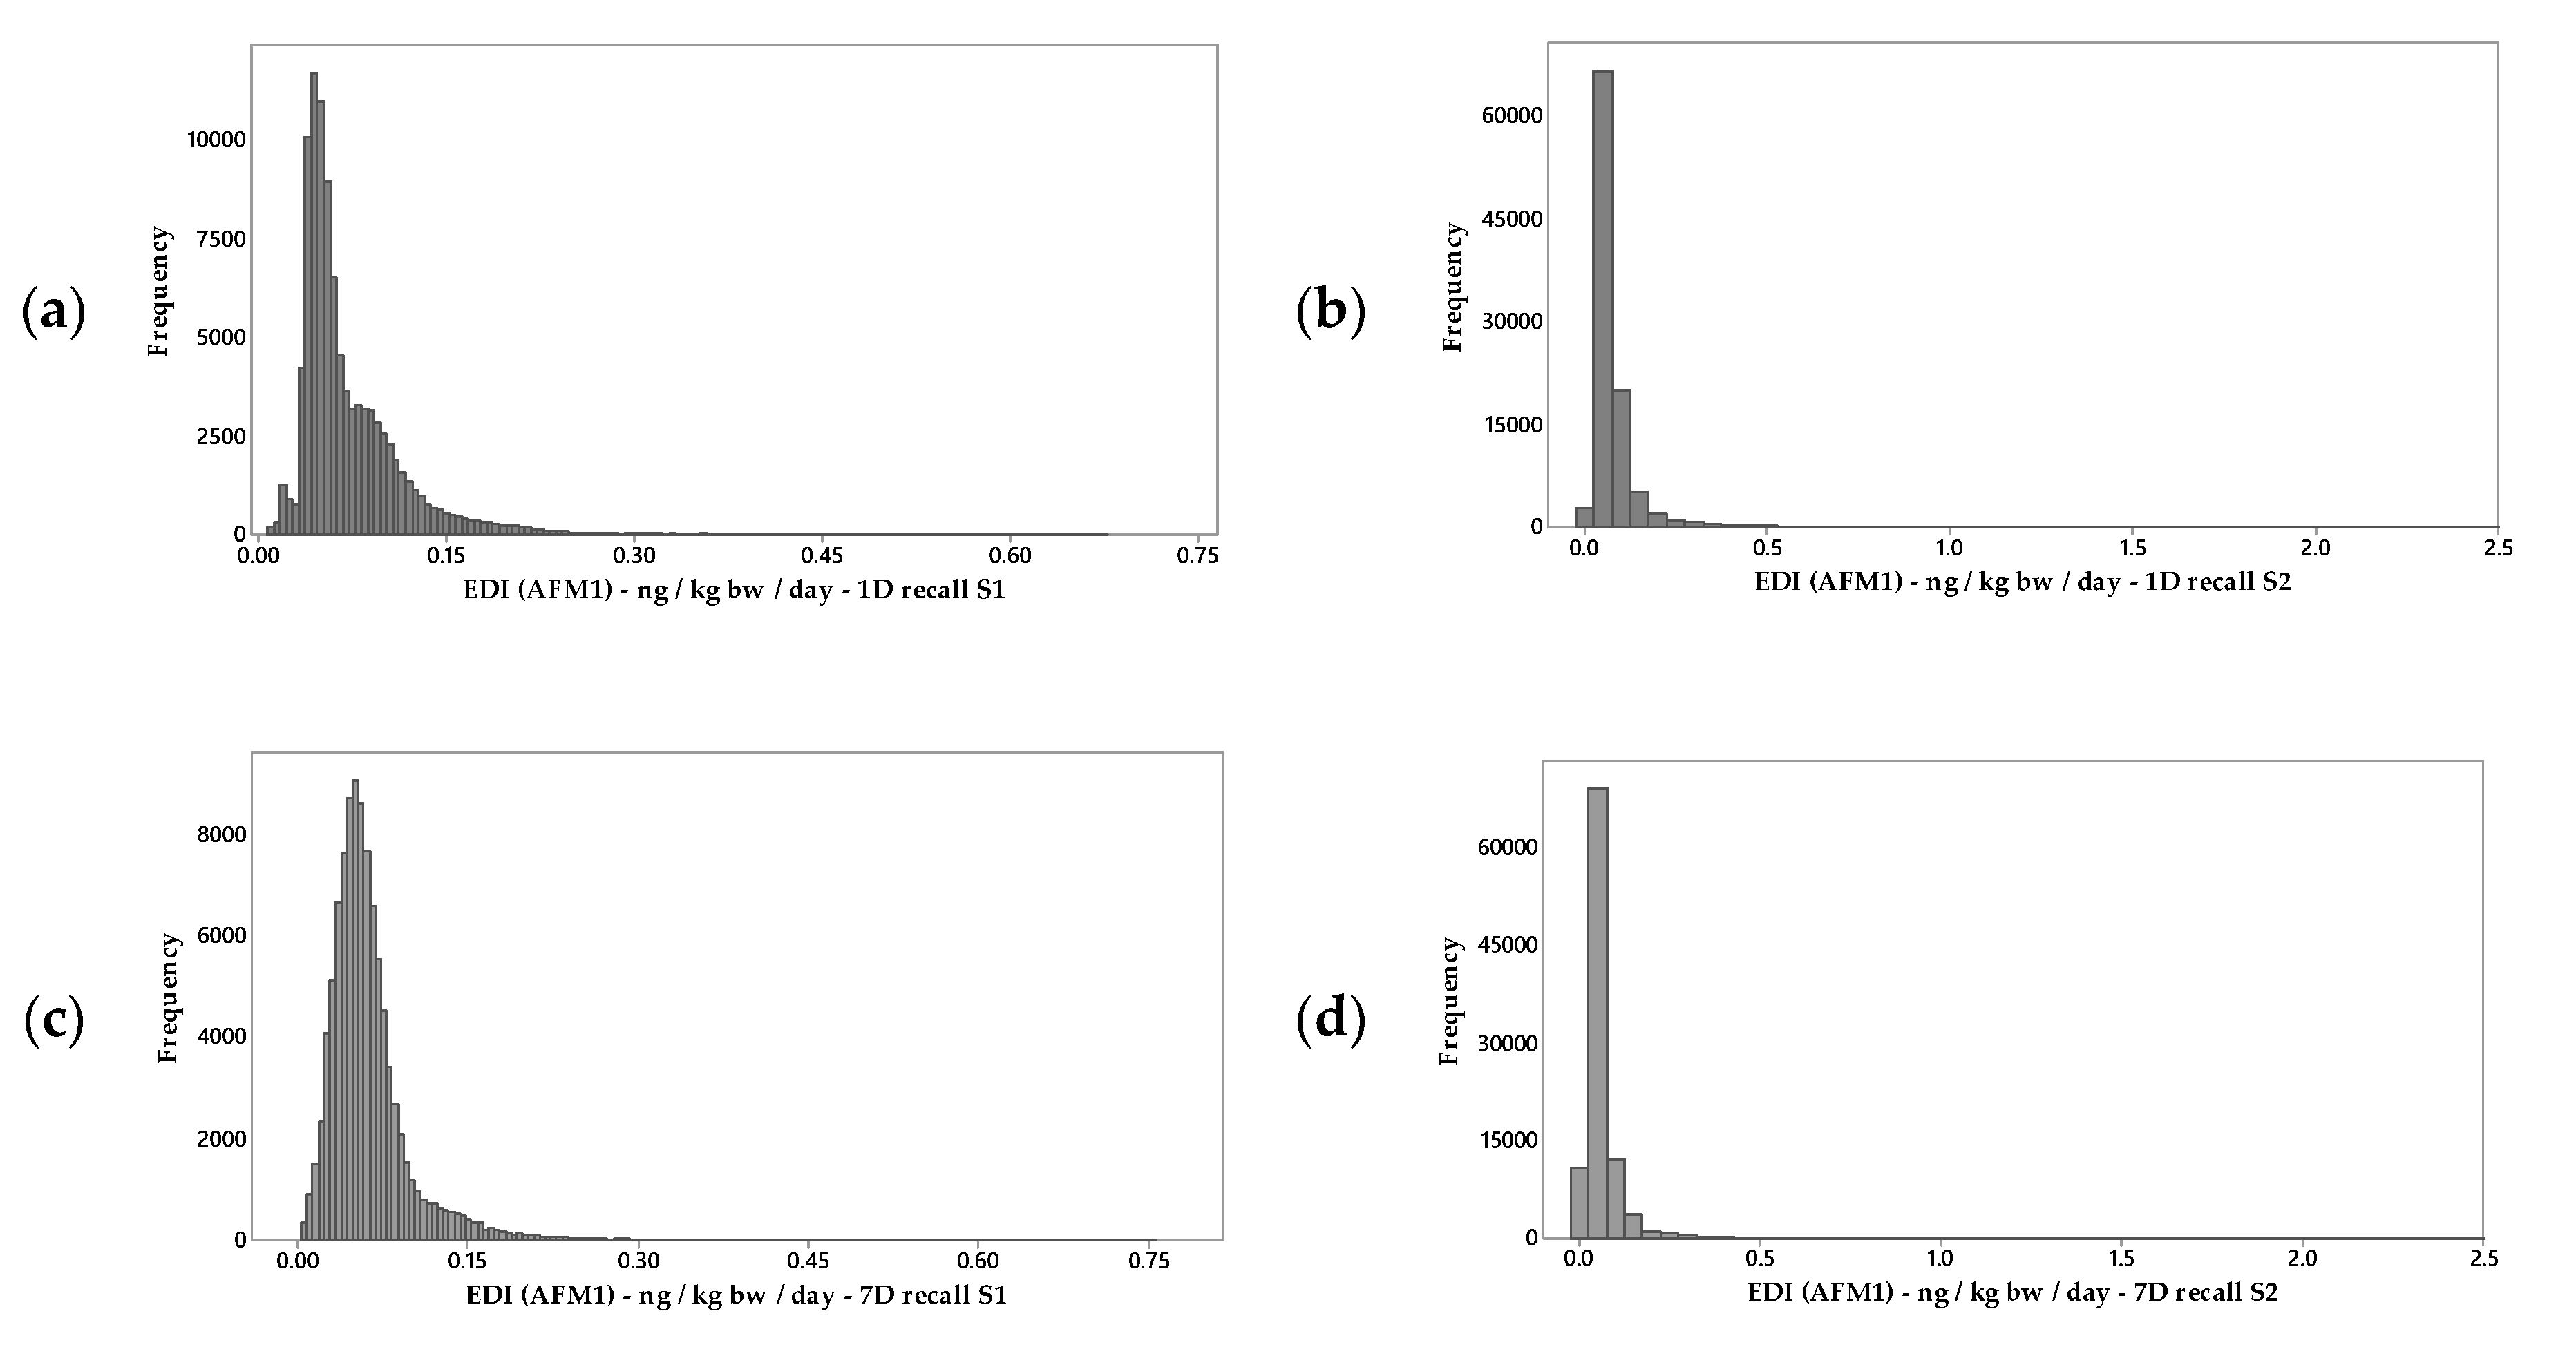
(n) represents the frequency of consumption of yogurt during the observed period; (%) represents their share in the sample. Note: Items denoted with different letters are significantly different at the level of 5%.
Table 5. Estimated daily intake (EDI) of AFM1.
AFM1 IntakeAFM1 ng/kg bw/day (1-Day Recall)AFM1 ng/kg bw/day (7-Day Recall)
Scenario 1Scenario 2Scenario 1Scenario 2
Mean 0.073620.075920.062070.06420
Minimum 0.007820.006580.003970.00323
1st quartile 0.045590.038450.040260.03445
3rd quartile 0.089260.082550.072570.06642
Maximum 0.673816.652350.757247.05512
95% confidence interval of mean0.07333–0.073900.07527–0.076580.06184–0.062300.06362–0.06478
All values are calculated based on the Monte Carlo simulation.
Publisher’s Note: MDPI stays neutral with regard to jurisdictional claims in published maps and institutional affiliations.

