Ammonia Gas Sensors: Comparison of Solid-State and Optical Methods


1
Institute of Optoelectronics, Military University of Technology, 00-908 Warsaw, Poland
2
Institute of Experimental Physics, Faculty of Physics, University of Warsaw, 02-093 Warsaw, Poland
3
Faculty of Electronics, Telecommunications and Informatics, Gdansk University of Technology, 80-233 Gdansk, Poland
*
Author to whom correspondence should be addressed.
Appl. Sci. 2020, 10(15), 5111; https://doi.org/10.3390/app10155111
Submission received: 19 June 2020
/
Revised: 10 July 2020
/
Accepted: 24 July 2020
/
Published: 25 July 2020
(This article belongs to the Special Issue Photonic Technology for Precision Metrology)
Abstract
:High precision and fast measurement of gas concentrations is important for both understanding and monitoring various phenomena, from industrial and environmental to medical and scientific applications. This article deals with the recent progress in ammonia detection using in-situ solid-state and optical methods. Due to the continuous progress in material engineering and optoelectronic technologies, these methods are among the most perceptive because of their advantages in a specific application. We present the basics of each technique, their performance limits, and the possibility of further development. The practical implementations of representative examples are described in detail. Finally, we present a performance comparison of selected practical application, accumulating data reported over the preceding decade, and conclude from this comparison.
Keywords:
ammonia detection; NH3; MOX sensors; polymer sensors; laser absorption spectroscopy; CRDS; CEAS; MUPASS; PAS1. Introduction
Ammonia is a highly toxic chemical substance, common in biological processes, and applied in technical installation processes (cooling systems, chemical industry, and motor vehicles). The American Conference of Industrial Hygienists has set a limit to ammonia concentration in air of 25 ppm for long-term exposure (8 h) and 35 ppm for short-term ones (15 min) [1]. In medicine, the concentration of ammonia in the breath between 2500 and 5000 ppb is directly related to organ dysfunction and diabetes [2]. Therefore, the design of novel techniques and sensors which allow accurate and fast in-situ detection of trace ammonia concentration is highly desirable. Such sensors should satisfy the specific requirements: high sensitivity, enhanced selectivity, short response time, reversibility, high reliability, low energy consumption, low cost, safety, broad range of measurement at various operation temperatures, etc.
The issue of ammonia detection by gas sensors has attracted many researchers. A recent review paper about ammonia sensing focused on chemical mechanisms of gas sensing by solid-state or electrochemical sensors, with limited details about optical methods [3]. In our studies, we focus on optical methods, developed in our research teams. Moreover, another way of solid-state sensors modulation by UV irradiation was proposed and discussed. This method was advanced in the research teams preparing this review. These problems have not been considered in such a way in other papers about gas sensing.
Very advanced approaches like gas chromatography–mass spectrometry (GC-MS) and selective ion flow tube–mass spectrometry (SIFT-MS) are accurate for NH3 measurement, but their use is complicated and require qualified staff, laborious samples preparation procedures, and time consuming measurements, as well as not-compact and expensive instruments which are difficult to maintain. Many applications require faster and easier tools. Therefore, solid and optical detection methods are rapidly developing (Figure 1). In this paper, much attention was paid on the optical sensors.
We would like to underline that we preselected the considered ammonia gas sensors and there are other promising technologies which can be effectively used for ammonia sensing because of low production costs or measurement methods. Good examples are biosensors utilizing bacteria cultures or nanotechnology [4,5,6,7,8].
2. Solid-State Ammonia Sensors
Solid-state ammonia sensors can be divided into two groups considered in our paper: metal oxide-based sensors and conducting polymer sensors [3].
Metal oxide-based sensors (MOX) belong to the most investigated groups. Their main features offer simplicity, comprehensive detection action, miniature dimensions, flexibility in fabrication, long life expectancy, low cost, and serviceableness for alarm warning applications. MOX sensors change DC (static) resistance when exposed to ambient gas or humidity. Any change of MOX sensor resistance can trigger an alarm when toxic gas appears in an ambient atmosphere.
There is a variety of sensitive materials and methods of their preparation for NH3 detection. Metal oxides, like SnO2, ZnO, WO3, TiO2, and MoO3, are most widely utilized for this purpose. They are classified into n-type and p-type [3]. Usually, the n-type semiconducting metal oxides are used for gas sensors due to their higher sensitivity [9]. The sensor comprises of grains of various diameter with a large active surface area. Smaller grains enable better sensing properties due to the larger ratio of active surface to the sensor volume. Atoms of oxygen are bound to the grains. When these atoms are displaced by other species present in ambient atmosphere, a potential barrier between the grains changes. As a result, the DC (static) resistance between the sensor’s terminals changes.
Although the metal oxide sensors have attractive properties, their main disadvantage is a low selectivity in detecting of one particular component in a gas mixture [10]. Moreover, MOX sensors operate at elevated temperatures (up to a few hundreds of Celsius degrees), which requires additional energy for heating. Careful selection of ingredients, accelerating adsorption–desorption processes due to catalytic properties, helps to lower operating temperature and to enhance gas selectivity, pointing at selected gases. The sensor exhibits limited specificity for NH3 and can be affected by acetone, ethanol, hydrogen, methane, nitric oxide, and nitrogen dioxide [11]. Artificial neural networks, conductance scanning at periodically varied temperature, as well as principle component or support vector machine analysis help to develop selective sensor systems, but only to some extend [12,13]. The algorithms support to determine even particular components of the gas mixtures. The average detection limit of these sensors ranges from 25 ppb to 100 ppm (Table 1). The selectivity can be further improved by noble metals doping [9,10] or selecting appropriate operating temperature [14]. Unfortunately, even these actions give limited results and require additional advances.
Another approach improving gas sensitivity and selectivity by MOX sensors utilize low-frequency noise (flicker noise) which can be more sensitive to the ambient atmosphere than DC resistance only [15,16]. This idea was proposed more than two decades ago and is still developed. DC resistance gives a single value due to a change of potential barrier at the presence of ambient gases. At the same time, the potential barrier fluctuates slowly, and these fluctuations are observed as flicker noise of the resistance fluctuations. Therefore, low-frequency noise measured as a power spectral density can be more informative than the value of DC resistance only. We confirmed experimentally that a single MOX sensor could detect two toxic gases, NH3 and H2S, by applying low-cost measurement set-up and flicker noise measurements [17]. MOX sensors are made of porous materials, which generate quite intense flicker noise components. Low-frequency noise is observed up to a few kHz at least and, therefore, can be measured using common electronic circuits (e.g., low-noise operational amplifiers and A/D converters sampling the signals up to tens of kHz only).
Some materials used for MOX sensors are photocatalytic (e.g., WO3, TiO2, Au nanoparticles functionalized with organic ligands). These materials can be modulated by UV-light irradiation (e.g., applying low-cost UV LEDs of different emitted wavelengths) [18]. UV light generates ions O2−, which are weakly bound to the surface of the grains and therefore enhance gas sensitivity. We confirmed experimentally that this modulation improves sensitivity at low gas concentrations and can be utilized for the detection of selected organic vapors (e.g., formaldehyde, NO2 [18]).
The MOX sensors exhibit a temporal drift and ageing of their sensitivity. This detrimental effect can be reduced by algorithms of signal processing or by measuring the derivative parameters (e.g., change of DC resistance only) at relatively short time intervals [19,20]. Such effects are induced by the structure and technology of the MOX sensors, which comprise of grains of different size and morphology. Some ambient gases can be stably adsorbed by the grains and induce the ageing and drift of sensitivity. These effects can be reduced by pulse heating or intense UV irradiation, used for sensor cleansing [21].
Improvement in gas sensing stability can be reached by applying the materials of very repeatable structures. Two-dimensional materials (MoS2, WS2, phosphorene, graphene, carbon nanotubes) are of high interest for gas sensing due to their unique properties (high ratio of the sensing area to volume) and repeatable morphology (e.g., graphene layers) [22]. The sensors provide an opportunity to detect even a single gas molecule adsorbed by the active surface. An electronic device, using single-layer graphene for the gate of the field-effect transistor, can detect low gas concentrations and give repeatable results. Recent experimental studies confirmed that 1/f noise in such device has a component, called Lorentzian, of the frequency characteristic for the ambient gas (e.g., C4H8O, CH3OH, C2H3N, CHCl3) [23]. Moreover, the experiments gave repeatable results for different samples of electronic devices. We expect that such sensors should detect NH3 molecules at very low concentrations in a similar way as the organic gases mentioned above. It was experimentally confirmed that the oxidized graphene sensor is suitable for NH3 detection [24].
These impressive results were achieved for the structures, which are very repeatable and can be spoiled only by some limited impurities situated on the two-dimensional layers. Unfortunately, their production is expensive and requires specialized equipment. We may expect that low-cost MOX gas sensors might be produced using a mixture of graphene flakes decorated with the nanoparticles of the selected material for gas sensing. These sensors might be less sensitive than the presented electronic device. However, the morphology of repeatable two-dimensional structures should enhance their sensing properties in conjunction with very low costs and simplified technology of production. Further, gas sensing improvement can be achieved by UV-light irradiation because graphene is a photocatalytic material.
Flexible gas sensing materials are of great interest for emerging applications in wearable electronic devices for portable health monitoring applications. Detection of NH3 is one of the hot topics in this area because ammonia may cause severe harm to the human body and is the most common air contaminant emitted from various sources (e.g., at the decomposition of protein products). The gas sensing materials should be transparent, mechanically durable, and operate at room temperature. New structures of low-cost ammonia gas sensors were proposed recently [25,26,27,28]. These structures comprise different materials, including two-dimensional reduced graphene oxide [26], one-dimensional nanostructures (nanowires) [27], or polymers [25,28]. The sensors are chemo-resistive and, therefore, can be used in wearable or handheld portable applications. Moreover, their resistance can be monitored by utilizing triboelectric charging in self-powered wearable applications.
The second group of solid-state ammonia sensors consists of conducting polymer sensors. They represent important class of functional organic materials for next-generation sensors. Their features of high surface area, small dimensions, and unique properties have been used for various sensor constructions. Many remarkable examples have been reported over the past decade. The enhanced sensitivity of conducting polymer nanomaterials toward various chemical/biological species and external stimuli made them ideal candidates for incorporation into the design of the sensors. However, the selectivity and stability can be further improved.
Advances in nanotechnology allow the fabrication of various conducting polymer nanomaterials [29]. Among the conducting polymers, polyaniline (PANI), polypyrrole (PPy), polythiophene (PTh), and poly (butyl acrylate) (PBuA) or poly (vinylidene fluoride) (PVDF) are the most frequently used in the ammonia sensor as the active layer [30,31,32]. Gas sensors with conducting polymer are based on amperometric, conductometric, colorimetric, gravimetric, and potentiometric measuring techniques. However, their selectivity and stability should be also improved.
Some recently reported solid-state ammonia sensors are summarized in Table 1.
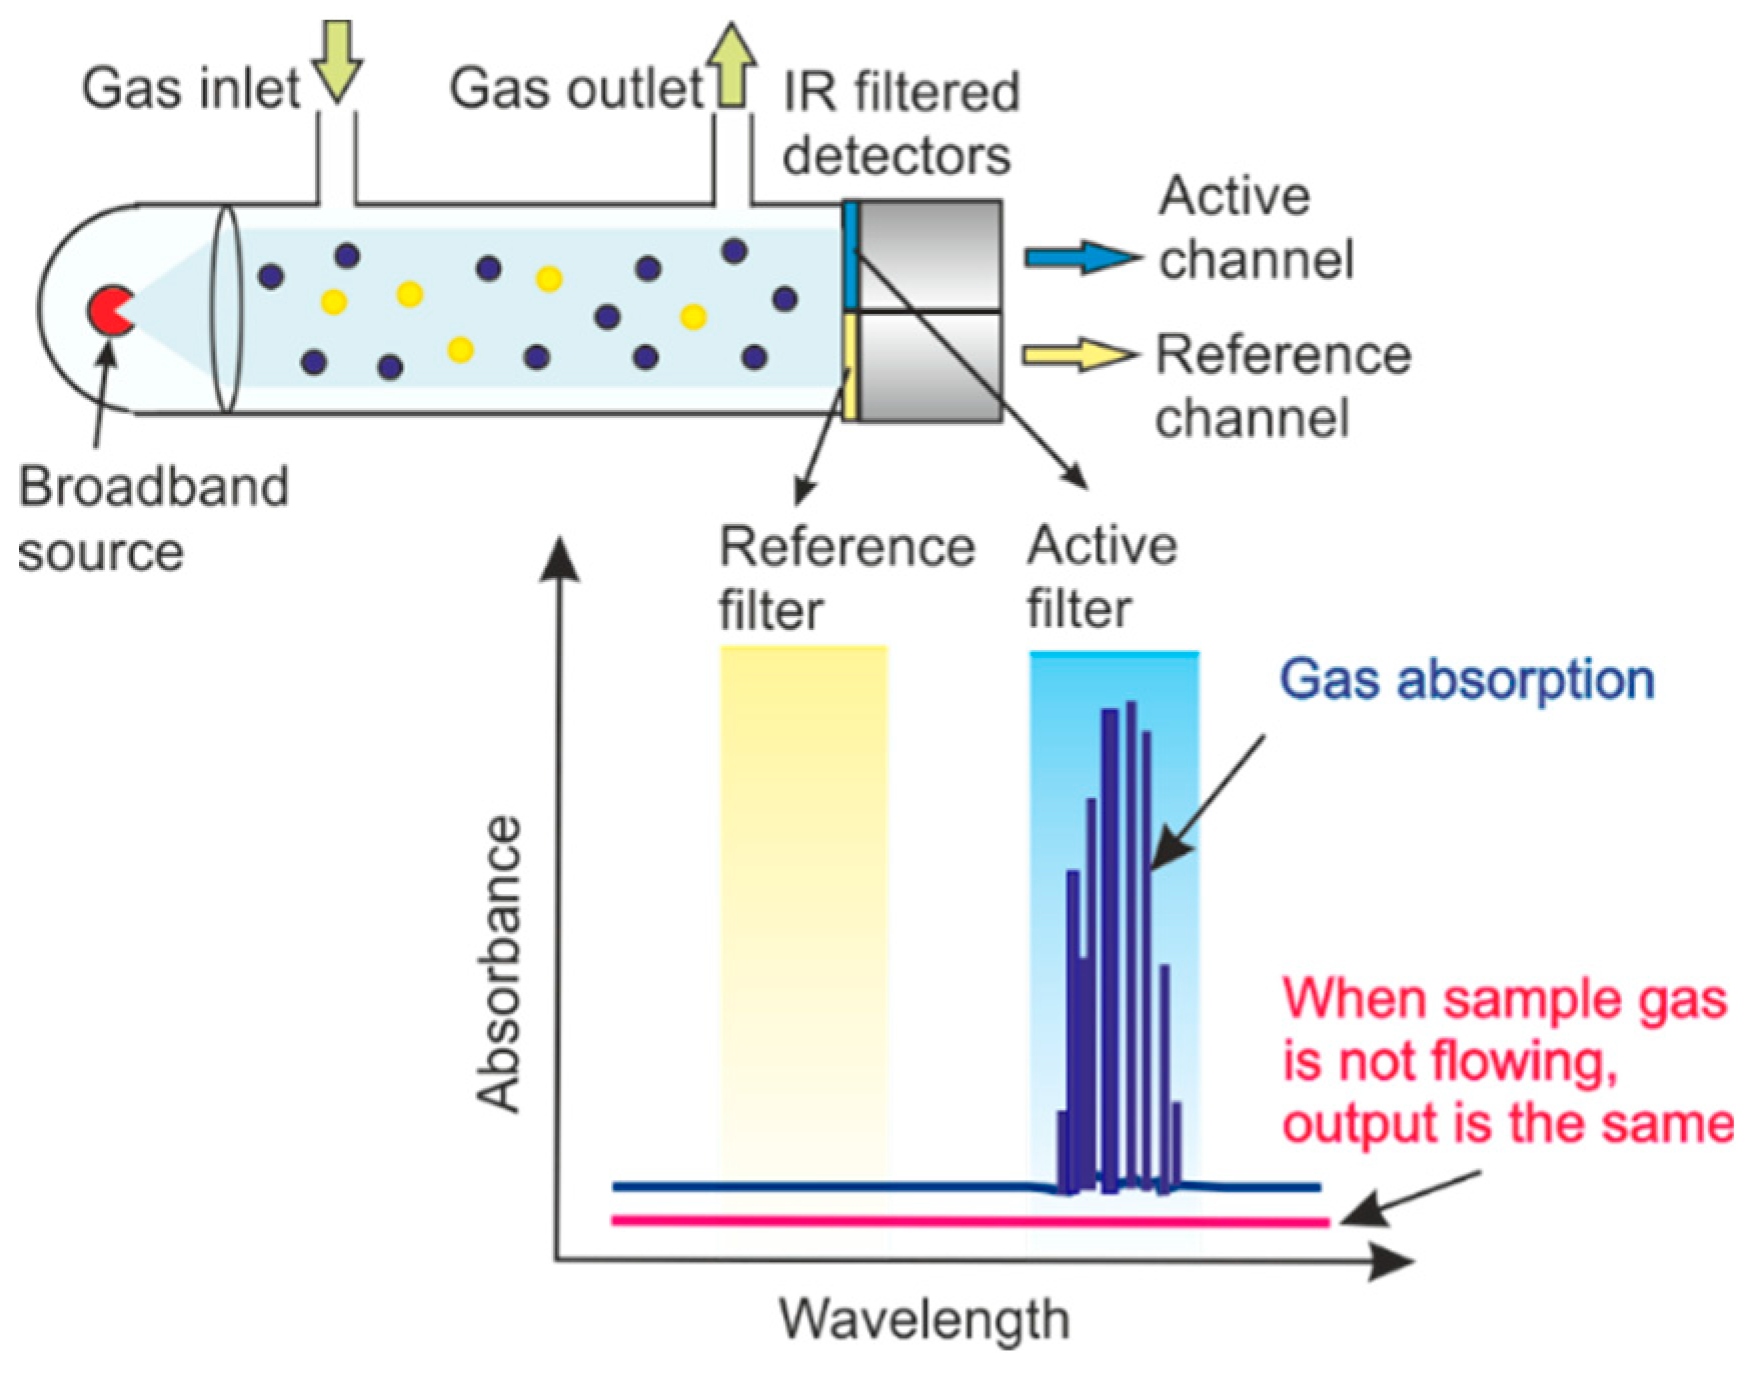
Colorimetric sensors utilize optical measurements of the sample (porous matrix) interacting with the ambient gas. Therefore, we present these gas sensors in the group of solid-state sensors. They are used for the measurement of NH3 in blood, urine, and wastewater. Colorimetric gas sensors are based on the change in color of a chemochromic reagent incorporated in a porous matrix such as porphyrin-based or pH indicator-based films. To detect this change in color, three basic components are needed: a light source, the chemochromic substance, and the light sensor. Liu et al. [43] has developed a solid-state, portable, and automated device capable to measure total ammonia amount in liquids, including the biological samples (e.g., urine). The idea of operation of the colorimetric sensor is shown in Figure 2. A horizontal gas flow channel passing through the sensing chamber, a red LED light source, and four photodiodes (a sensing-reference pair and a sensing-reference backup pair) were applied. The target gas is exposed to the sensor which then exhibits a color change proportional to the NH3 concentration. The photodiodes convert the color change to electronic signals. Such a sensor is of high sensitivity, short response time, and fast reversibility for NH3 gas concentrations ranging from 2 ppm to 1000 ppm.
3. Optical Methods
Most of the optical approaches to ammonia detection are based on the effects of absorption and luminescence, more rarely on the refraction or the light reflection.
In an optical absorption technique, the measured gas is contained in the sensor chamber. The radiation passing through the chamber can be absorbed by gas molecules. Measuring the light absorption at the specific wavelength (λ), with possibly no other gas species absorbing in this spectral range, the concentration (N) of ammonia can be determined. The concentration estimation follows the Beer–Lambert absorption law
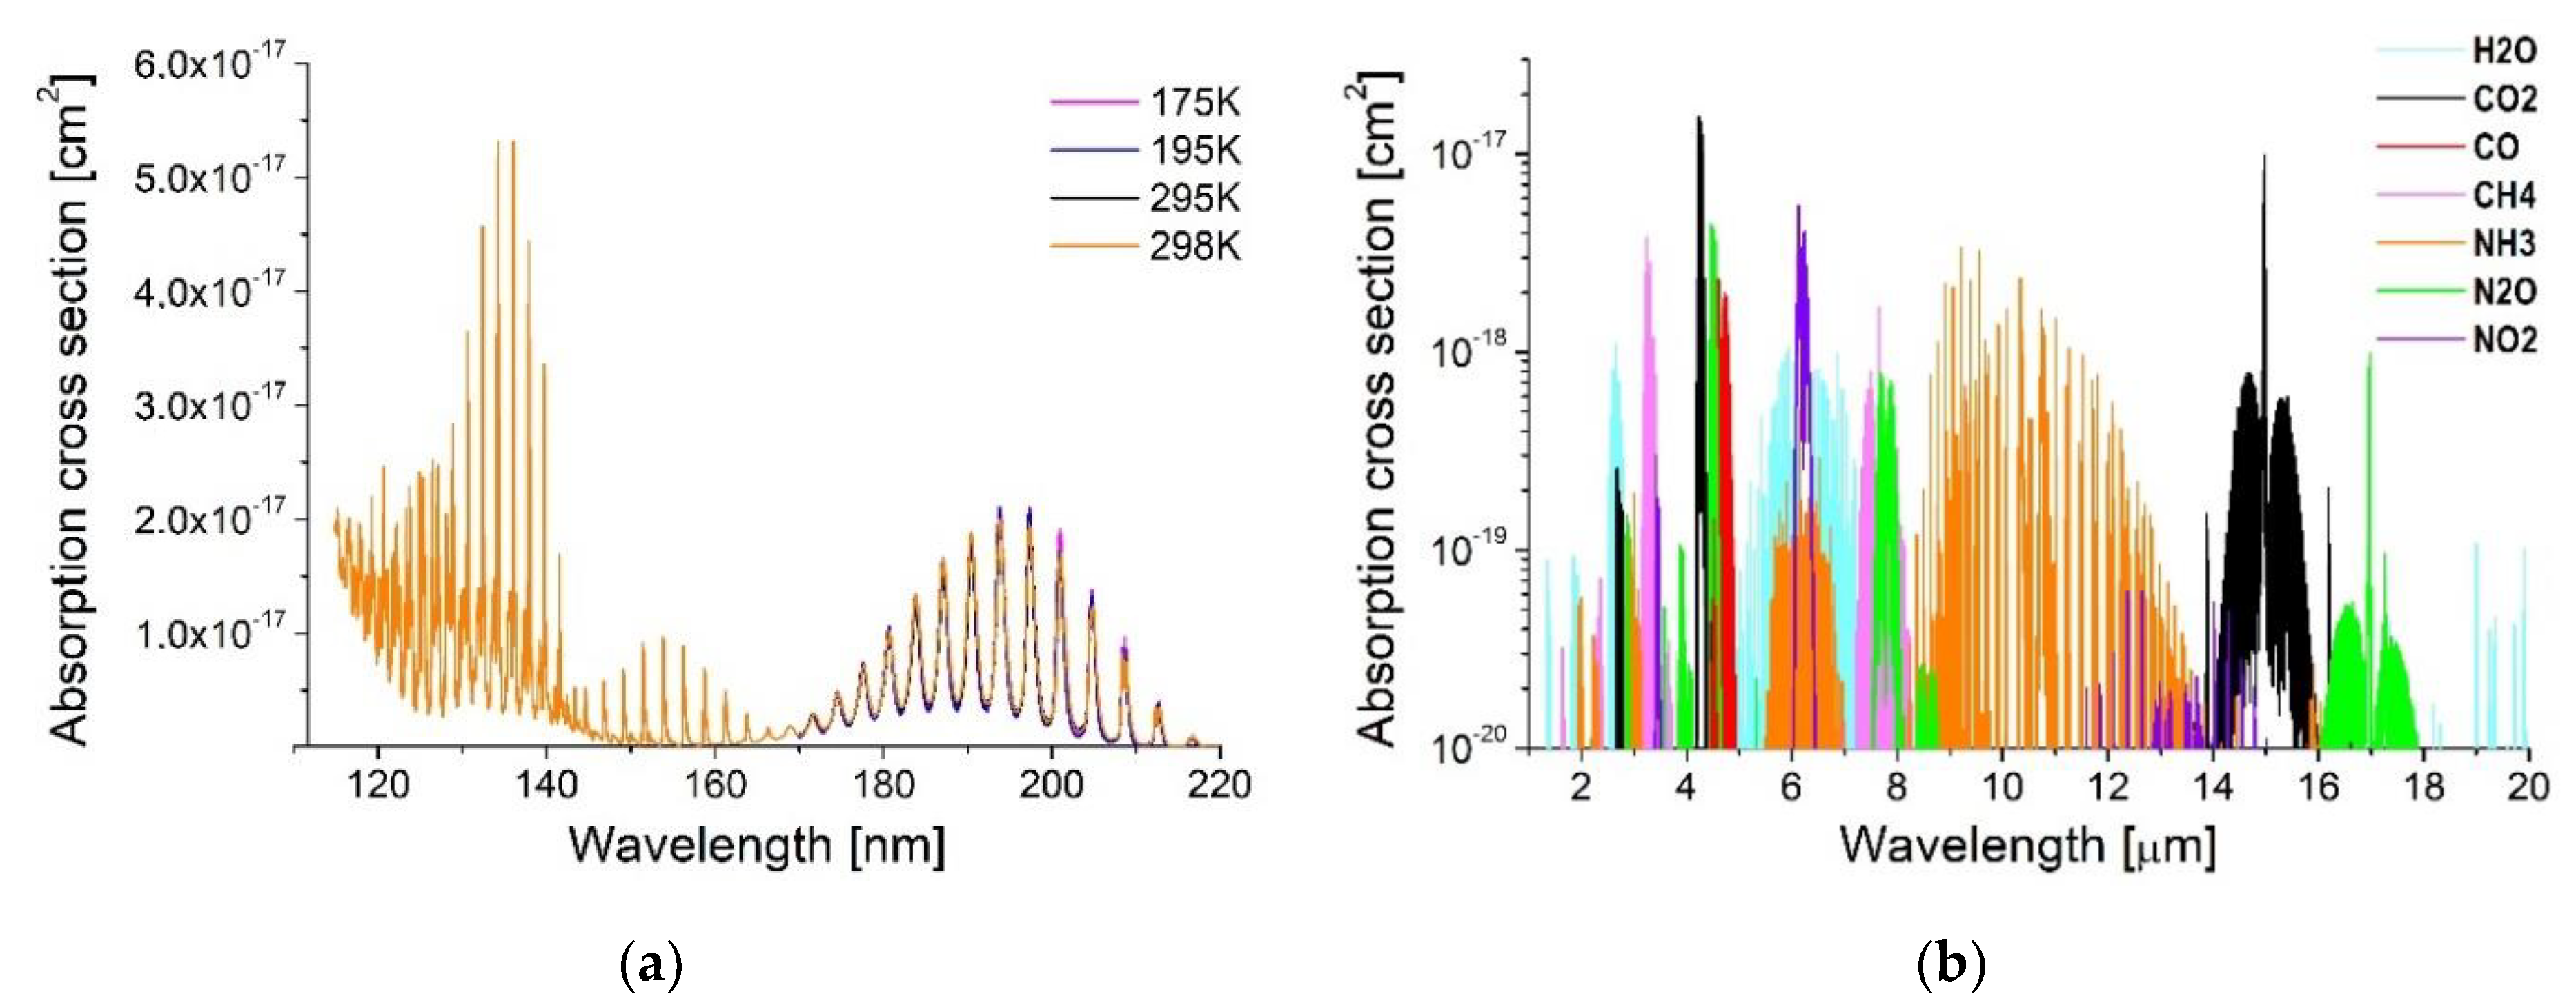
where α(λ) is the absorption coefficient defined as the logarithmic ratio of the incident (I0) and the transmitted (I) light intensities, L denotes the light path length in the chamber, and σ(λ) denotes the absorption cross section. Ammonia exhibits UV and IR absorption bands around 135 nm, 155 nm, 195 nm, 1.5 µm, 2 µm, 3 µm, 4 µm, 6 µm, around 11 µm, and 16 µm (Figure 3). The cross-section (σ), defining the system sensitivity, is the highest in the UV region. It is about 10-times larger than at the 11 µm region (e.g., ~10−18 cm2) and even 105-times larger than in other NIR ranges [44].
Unfortunately, in the UV and NIR range, there is a problem with interferences by water vapor and N2O or NO2 molecules, which occur at high concentrations in air. Their absorption bands might overlap with NH3 spectra disturbing the measurements. Therefore, the selection of proper spectral range is crucial for successful optical detection.
Nondispersive infrared (NDIR) sensing belongs to simplest approaches of NH3 detection. Figure 4 shows a schematic diagram of such a gas sensor. It usually consists of a broadband source (cheaper and smaller black body emitters or IR LEDs), absorption cell, optical filters, and detectors. Radiation from the broadband source passes through the chamber and two filters. The first filter covers the absorption band of the target gas (named active channel), while the other covers a non-absorbed spectral range (the reference channel). Transmission bands of the filters should not overlap with absorption bands of the other gases present in the chamber. Thus, absorption in the active channel is proportional to NH3 concentration. The light transmitted through the reference channel is not attenuated. Therefore, it is used to compensate instabilities of the light source. The sensitivity of NDIR is influenced by the intensity of the source, the optical waveguide and detector parameters. The disadvantage of this technique is the low precision of the detecting small signal changes at an eventual large background, which results in low selectivity and a high detection limit.
There are various methods to improve the performance of NDIR sensors. For example, Max-IR Labs utilizes the NDIR technique together with fiber-optic evanescent wave spectroscopy (FEWS) for ammonia detection [47]. The IR radiation is transmitted through a silver-halide (AgClxBr1-x) optical waveguide without cladding and the detection performed by means of the evanescent field (Figure 5). The maximum of the peak due to ammonia absorption was observed at 1450 cm−1. Such a sensor allows NH3 detection beyond a 1 ppm limit.
Laser spectroscopy is the best choice for trace gas analysis among optical approaches. It is characterized by high sensitivity and selectivity. Ammonia can be detected using tunable laser absorption spectroscopy (TLAS), multi-pass optical cell (MUPASS), cavity ring down spectroscopy (CRDS), cavity-enhanced absorption spectroscopy (CEAS), and photoacoustic (PAS) approach.
TLAS is a very interesting technique for ammonia concentration measuring using tunable diode lasers. The advantage of TLAS over other techniques consists in its ability to achieve low detection limits by using optical path extension techniques and improving the signal-to-noise ratio (SNR).
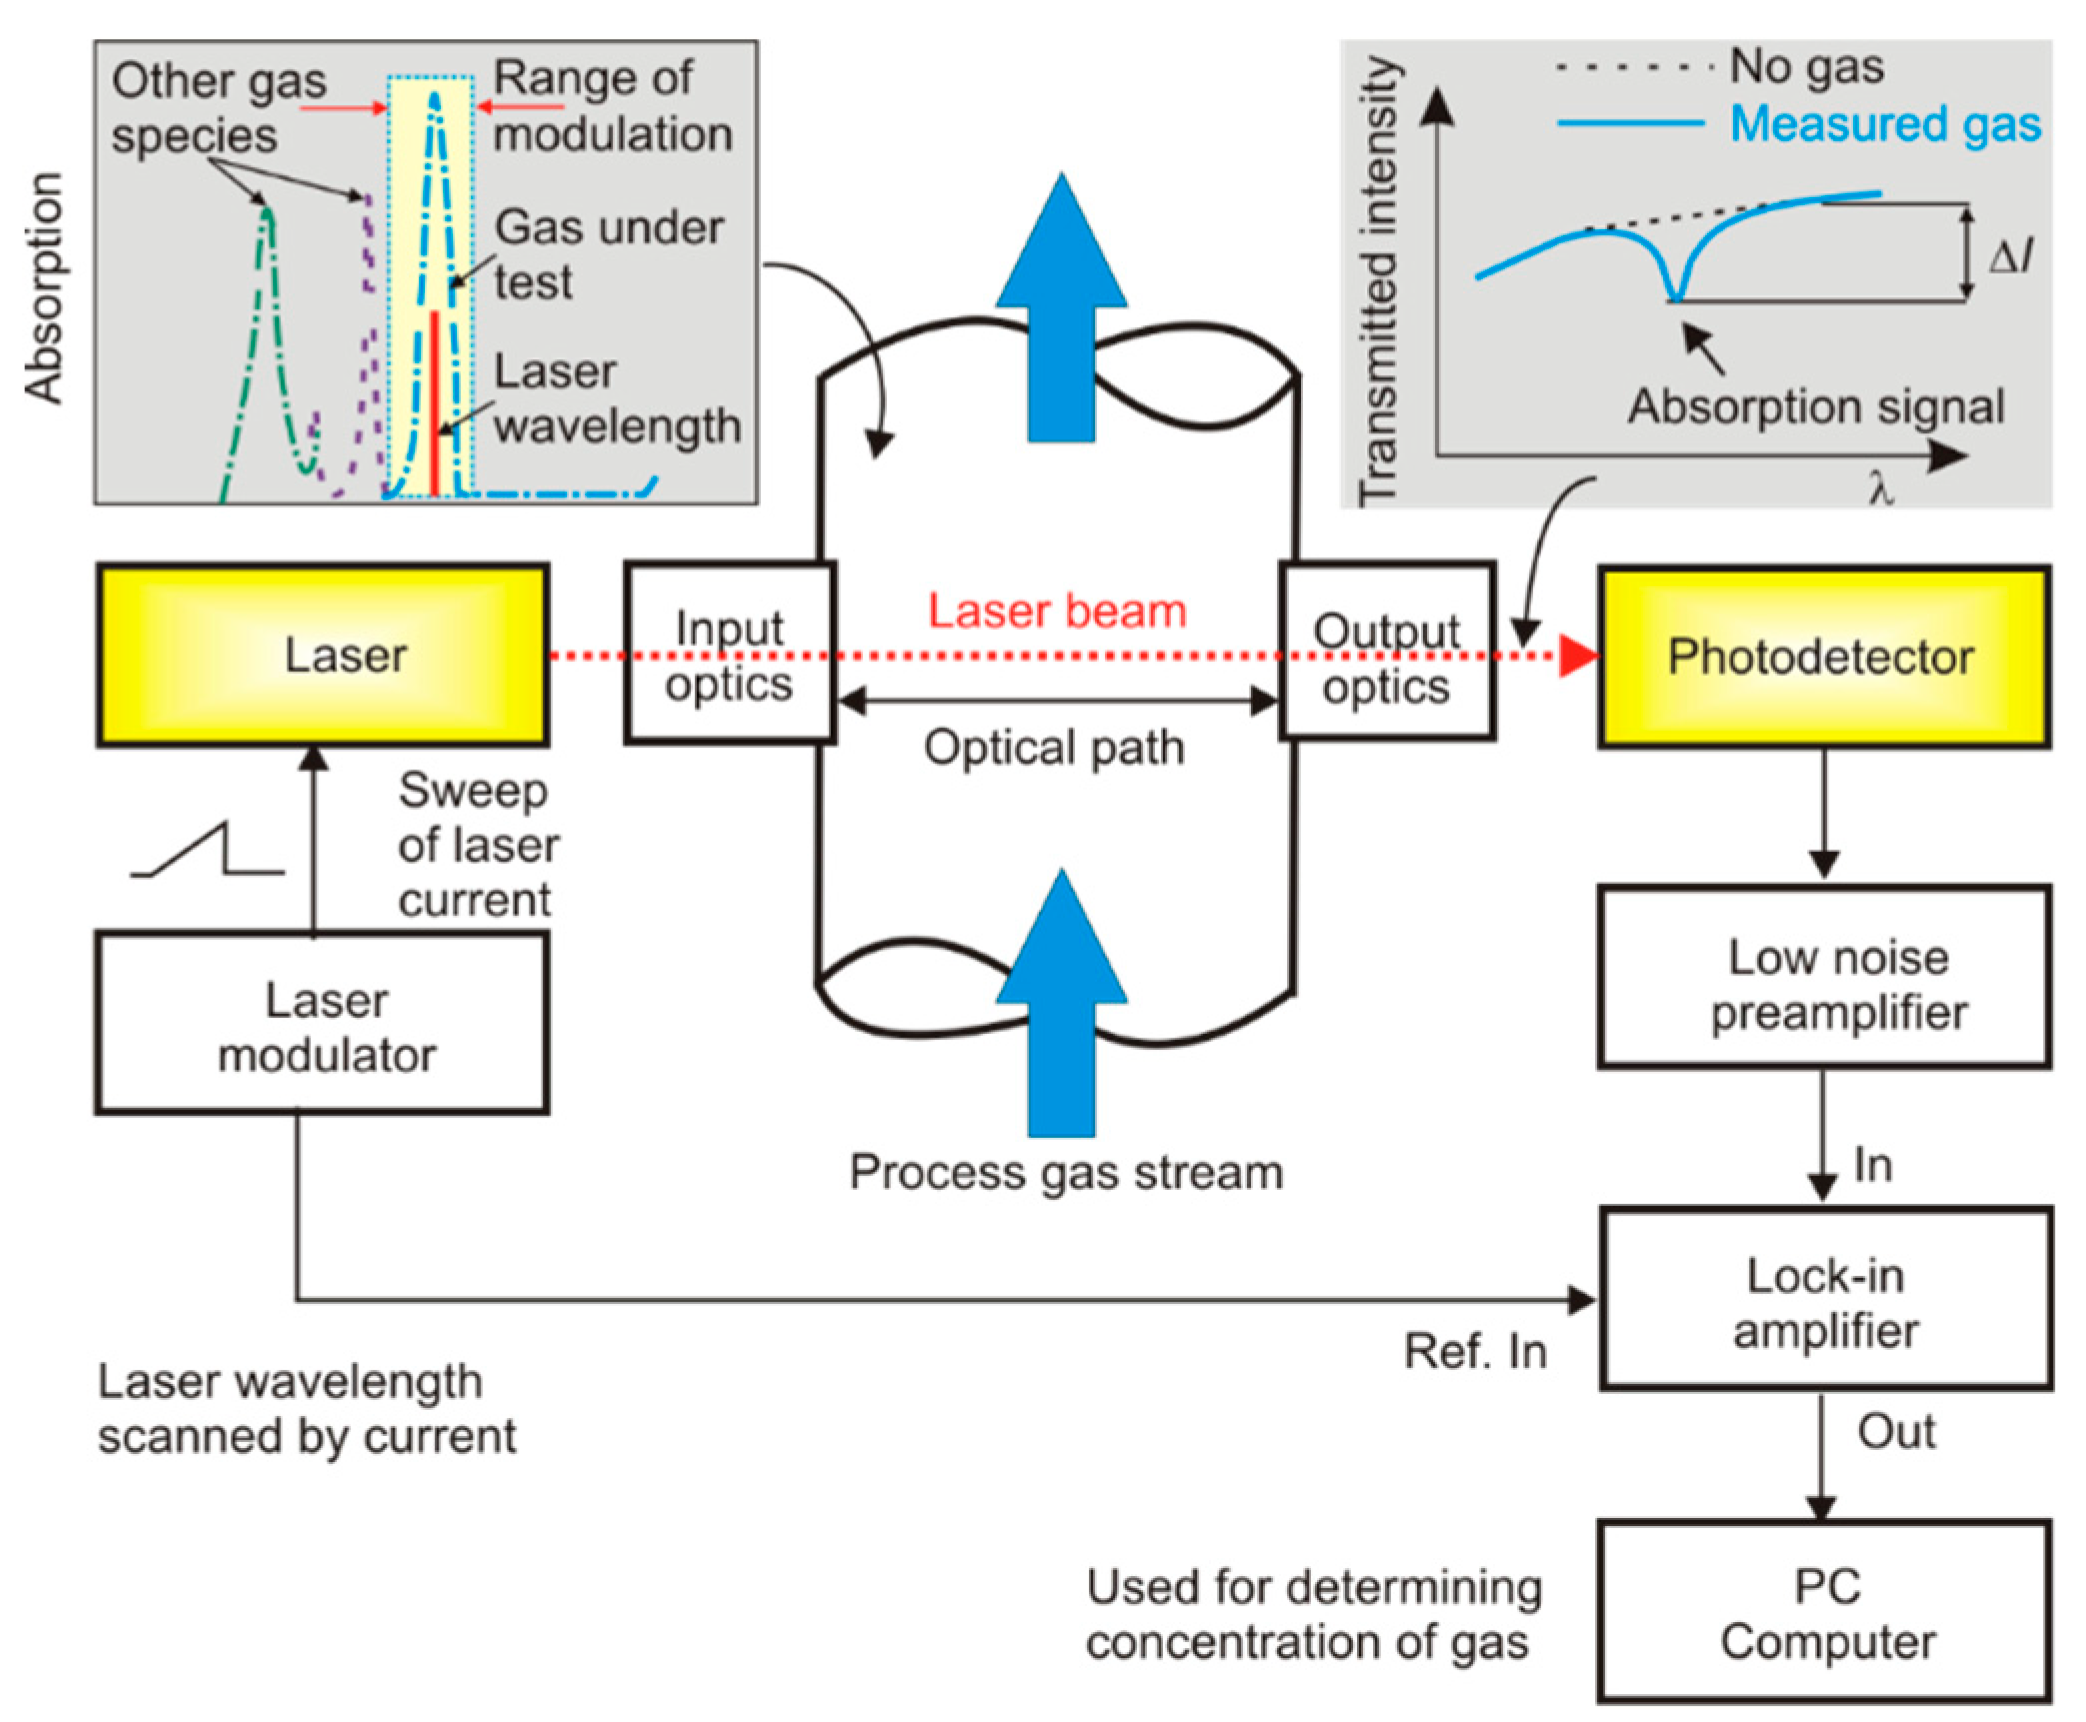
A single-pass TLAS system, operating in direct absorption measurement mode, consists of a tunable laser, transmitting optics, sample cell, receiving optics, photodetector, and a signal detection circuit (Figure 6). The optics matches the laser and photodetector to the gas inside the sample cell. A thermoelectric controller (TEC) is used to set the laser-operating temperature to a value where the desired wavelength can be reached due to injection current tuning. The injection current is usually scanned periodically with a ramp signal, which leads to laser wavelength scanning. The amplitude of the scan should cover the absorption transition of interest. Laser radiation passes through the absorption cell and the transmitted signal is measured using the photodetector. In absence of the absorption, the detector signal represents laser power changes vs. the current. When absorption occurs, a dip in transmission is observed. Ratio of the signals registered at the line center corresponding to the case without absorption (I0) and with absorption (I1) can be used to calculate the gas concentration according to the formula (1).
Based on TLAS, different components such as NH3, CO, O2, CH4, H2O, CO2, and HCl can be detected with high selectivity and sensitivity. TLAS has been employed for various applications, including industrial process monitoring and its control, environmental monitoring, combustion and flow analyses, trace species measurements, and so on. However, the sensitivity of this technique is usually limited to the absorption coefficient value of ~10−2–10−3 cm−1 (Equation (1)).
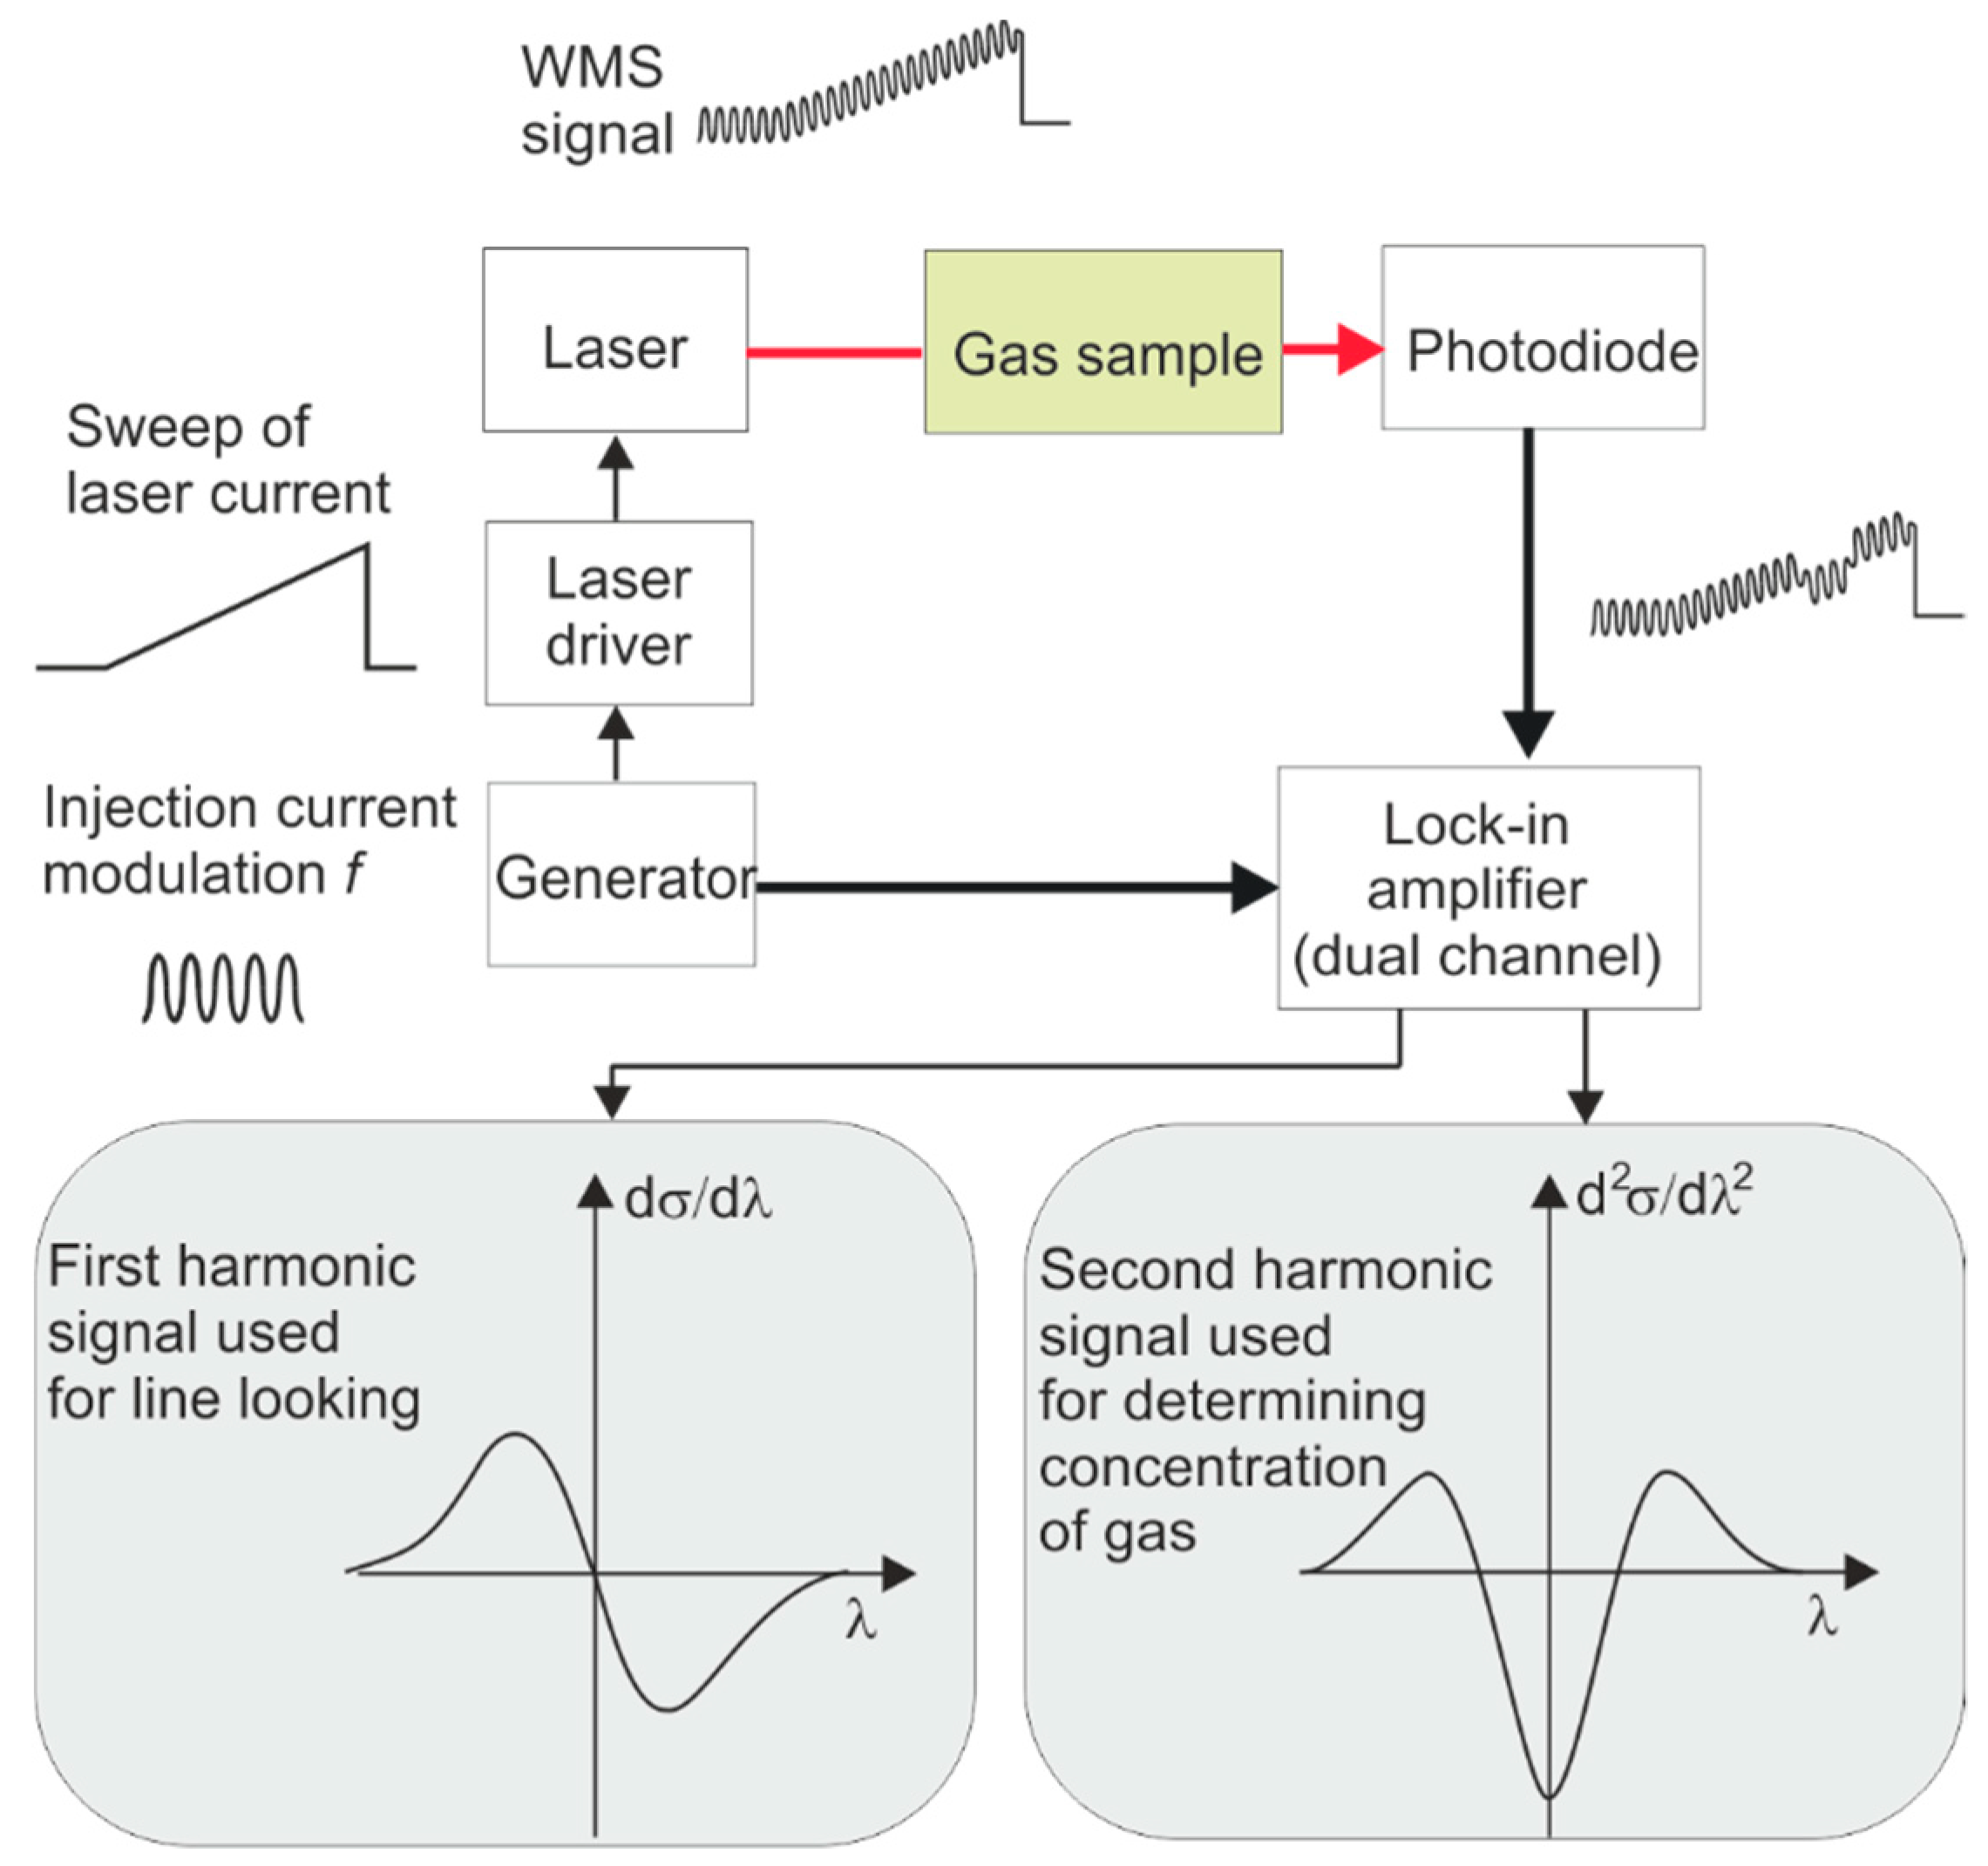
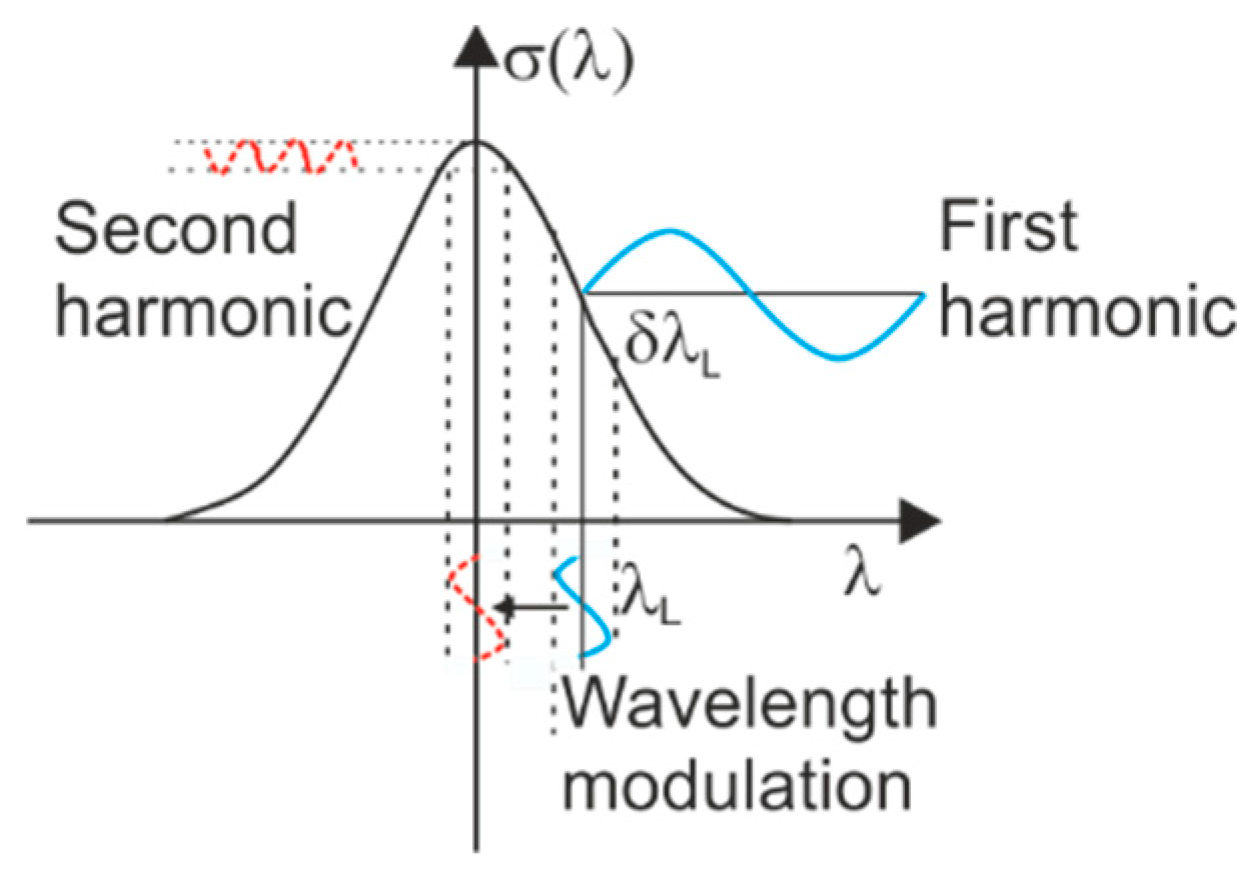
Wavelength modulation spectroscopy (WMS) is a useful technique providing SNR improvement, which is used in high sensitivity applications [48]. Small modulation (with frequency f ≈ 1–20 kHz) is added to the laser current scan, which is provided in a similar way as in TLAS (Figure 7). The transmitted signal, detected by the photodiode, is fed to a lock-in amplifier. As the laser is scanned across an absorption line profile, the transmitted on-absorption signal changes at the frequency of 2f, while the transmitted off-absorption signal changes at the frequency of f (Figure 8).
Application of high frequency minimizes 1/f noise. Therefore, setting the lock-in band around second harmonic ensures that the sensor becomes more suitable for high sensitivity applications compared to the standard TLAS approach. Typical sensitivity limits the absorption coefficient achievable with WMS and is about 10−4 cm−1. Better limits, about 10−5–10−7 cm−1, can be obtained for balanced detection-based WMS [49]. This method involves an electrical circuit that subtracts the photocurrents of two detectors: one of them registers the reference laser intensity while the other measures the signal passing through the absorption cell. That provides opportunity to reject common mode laser noise.
Small absorptions, which occur due to low densities of molecules in the samples or due to weak line strengths, are usually compensated by extending the optical path with multi-pass cells (White or Herriott) or cavity-enhanced methods. They enable the optical path to be extended. If instead of a single-pass chamber we apply the multi-pass cell (Figure 9), the sensitivity of the sensor would be improved by the factor of the optical path lengthening. A key parameter of multi-pass cells is the ratio of path length to volume. Moreover, this system provides an opportunity for the simultaneous application of the WMS approach and 2f detection.
Unlike conventional configurations, which involve at least a pair of mirrors separated by exactly defined distances, circular multi-pass cells have been developed (Figure 10) [50]. Thanks to the single piece, the cell is especially robust against thermal expansion. Minimizing the cell size is desired for the development of fast and portable gas sensors.
Cavity ring-down spectroscopy (CRDS) exploits the sample cells in the form of optical cavities (resonators) built with mirrors of very high reflectivity. A simplified scheme of such experiment is presented in Figure 11. Laser pulse injected into the cavity through one of the mirrors is then reflected many times among them. Its wavelength must be tuned to the NH3 spectral line in order to measure the absorption coefficient of ammonia contained inside. The light transmitted through the exit mirror is monitored by a detector. Analysis of the output signal by the acquisition system provides opportunity to determine the Q-factor of the cavity which is limited due to diffraction and mirror losses as well as due to the light absorption or scattering inside the cell. As far as the Q-factor is inversely proportional to the signal decay time, its value is found due to analysis of the photoreceiver signal by the acquisition system. The majority of the approaches exploit a two-step procedure consisting of the decay time measurement: first, when the cavity is empty (), and then, when the cavity is filled with the tested gas (). These decay times depend on the mirror reflectivity, resonator length, and extinction factor (absorption and scattering of light in the cavity) [51]. Comparing both decay times, the absorber concentration can be found.
where c is the light speed and σ(λ) is the absorption cross-section.
There are various approaches to CRDS with pulsed lasers or with continuously operating AM modulated ones. Using these techniques, the absorption coefficients α = σN < 10−9 cm−1 can be observed. The detection limit is mainly related to the resonator quality (determined by ), but also by the precision of decay time measurement. The advantage of CRDS over other absorption spectroscopy approaches consists not only in dominant sensitivity. Their superiority also results from minimized impacts of light source intensity fluctuations or detector sensitivity changes on the measurement results.
This method is extremely sensitive but requires that the laser frequency is precisely matched to the cavity mode. In this way, it is possible to obtain a high Q-factor of the resonator and efficient storage of optical radiation. On the other hand, small mechanical instabilities cause changes in the cavity mode frequency and significant output signal fluctuations, which is the main disadvantage of this method [52]. It can be minimalized by use of cavity length stabilization [53,54], or by application of the cavity with dense mode structure, called cavity-enhanced absorption spectroscopy (CEAS) [55].
In CEAS, the off-axis arrangement of the laser and cavity is applied. Similarly, to the conventional CRDS system, the light is repeatedly reflected by the mirrors. However, the reflected beams, which correspond to different trips, are spatially separated inside the resonator. The use of highly reflecting mirrors provides huge extension of the effective optical path. As result, either a dense mode structure of low finesse occurs, or the mode structure does not establish at all. In this way, sharp resonances of the cavity are avoided, so the system is much less sensitive to mechanical instabilities. The CEAS sensors attain the detection limit of about 10−9 cm−1 [56]. Detailed information about CRDS and CEAS techniques is presented in the authors’ papers [57,58,59].
Among the so-called in-situ sensors, photoacoustic spectroscopy (PAS) belongs to the most popular one. In PAS, conversion of laser light energy into an acoustic wave is applied. The gas sample, placed in photoacoustic chamber, is irradiated by optical radiation, AM modulated with acoustic frequency. The laser wavelength is matched to the absorption line of a molecule of interest. If the absorber is present in the cell, a portion of optical radiation is converted onto heat energy. Then, a local and periodic growth of temperature and pressure occurs (Figure 12). The resulting acoustic wave is detected at modulation frequency by a very sensitive microphone placed in the chamber. The PAS signal, which is proportional to the absorber concentration (N), is given by
where Po denotes average laser power, Q is the quality factor of the resonant cell, f is the frequency of modulation, V is the gas volume, A is the cross-sectional area, and η is the system efficiency factor (e.g., microphone efficiency and loss factors).
The microphone output signal is recorded using a low-noise preamplifier and a lock-in voltmeter. The strongest effect is achieved when the modulation frequency is matched to the resonance of the photoacoustic chamber. In order to increase the signal, various constructions of photoacoustic cells (acoustic resonators with higher Q-factor) are applied.
The improvement of this technique, which allows to achieve very high detection sensitivity, is the quartz-enhanced photoacoustic spectroscopy (QEPAS). The basic principle of operation is similar, but here the laser beam is focused between the U-shaped prongs of a resonant piezo-quartz fork [60]. This type of acoustic transducer is sensitive to signals generated by asymmetric prongs oscillations caused by acoustic wave, induced by the AM-modulated laser radiation. External sources of interference do not provide output signals because they cause symmetrical oscillations. Similarly to the conventional PAS system, in QEPAS set-ups, the measurements are performed with a wavelength modulation technique using the 2f detection [61]. Combined with the high Q-factor of the quartz fork, it gives the opportunity to build ultra-compact sensors that reach detection limits comparable to that of CEAS. In case of ammonia, it corresponds to a few ppb or even sub-ppb level.
Recently reported parameters of some optical ammonia sensors are given in Table 2.
Among many applications, the ammonia sensors for medical purpose are an important part of such detectors. The normal concentration of ammonia in the breath of a healthy man is in the range of 0.25–2.9 ppm [70]. An excessive concentration might suggest renal failure, Helicobacter Pyroli, diabetes, and oral cavity disease [71,72]. The main problem in the construction of ammonia sensors for breath analysis does not consist in extreme sensitivity but in high selectivity. More than 3000 various constituents were already detected in exhaled air [73]. Their absorption spectra might overlap the spectral fingerprint of the ammonia and disturb the measurement. Water vapor and carbon dioxide are the main interferences since their concentrations can reach up to 5% in breath, and thus it exceeds the ammonia density by many orders of magnitude. Carbon monoxide and methane should also be taken into account.
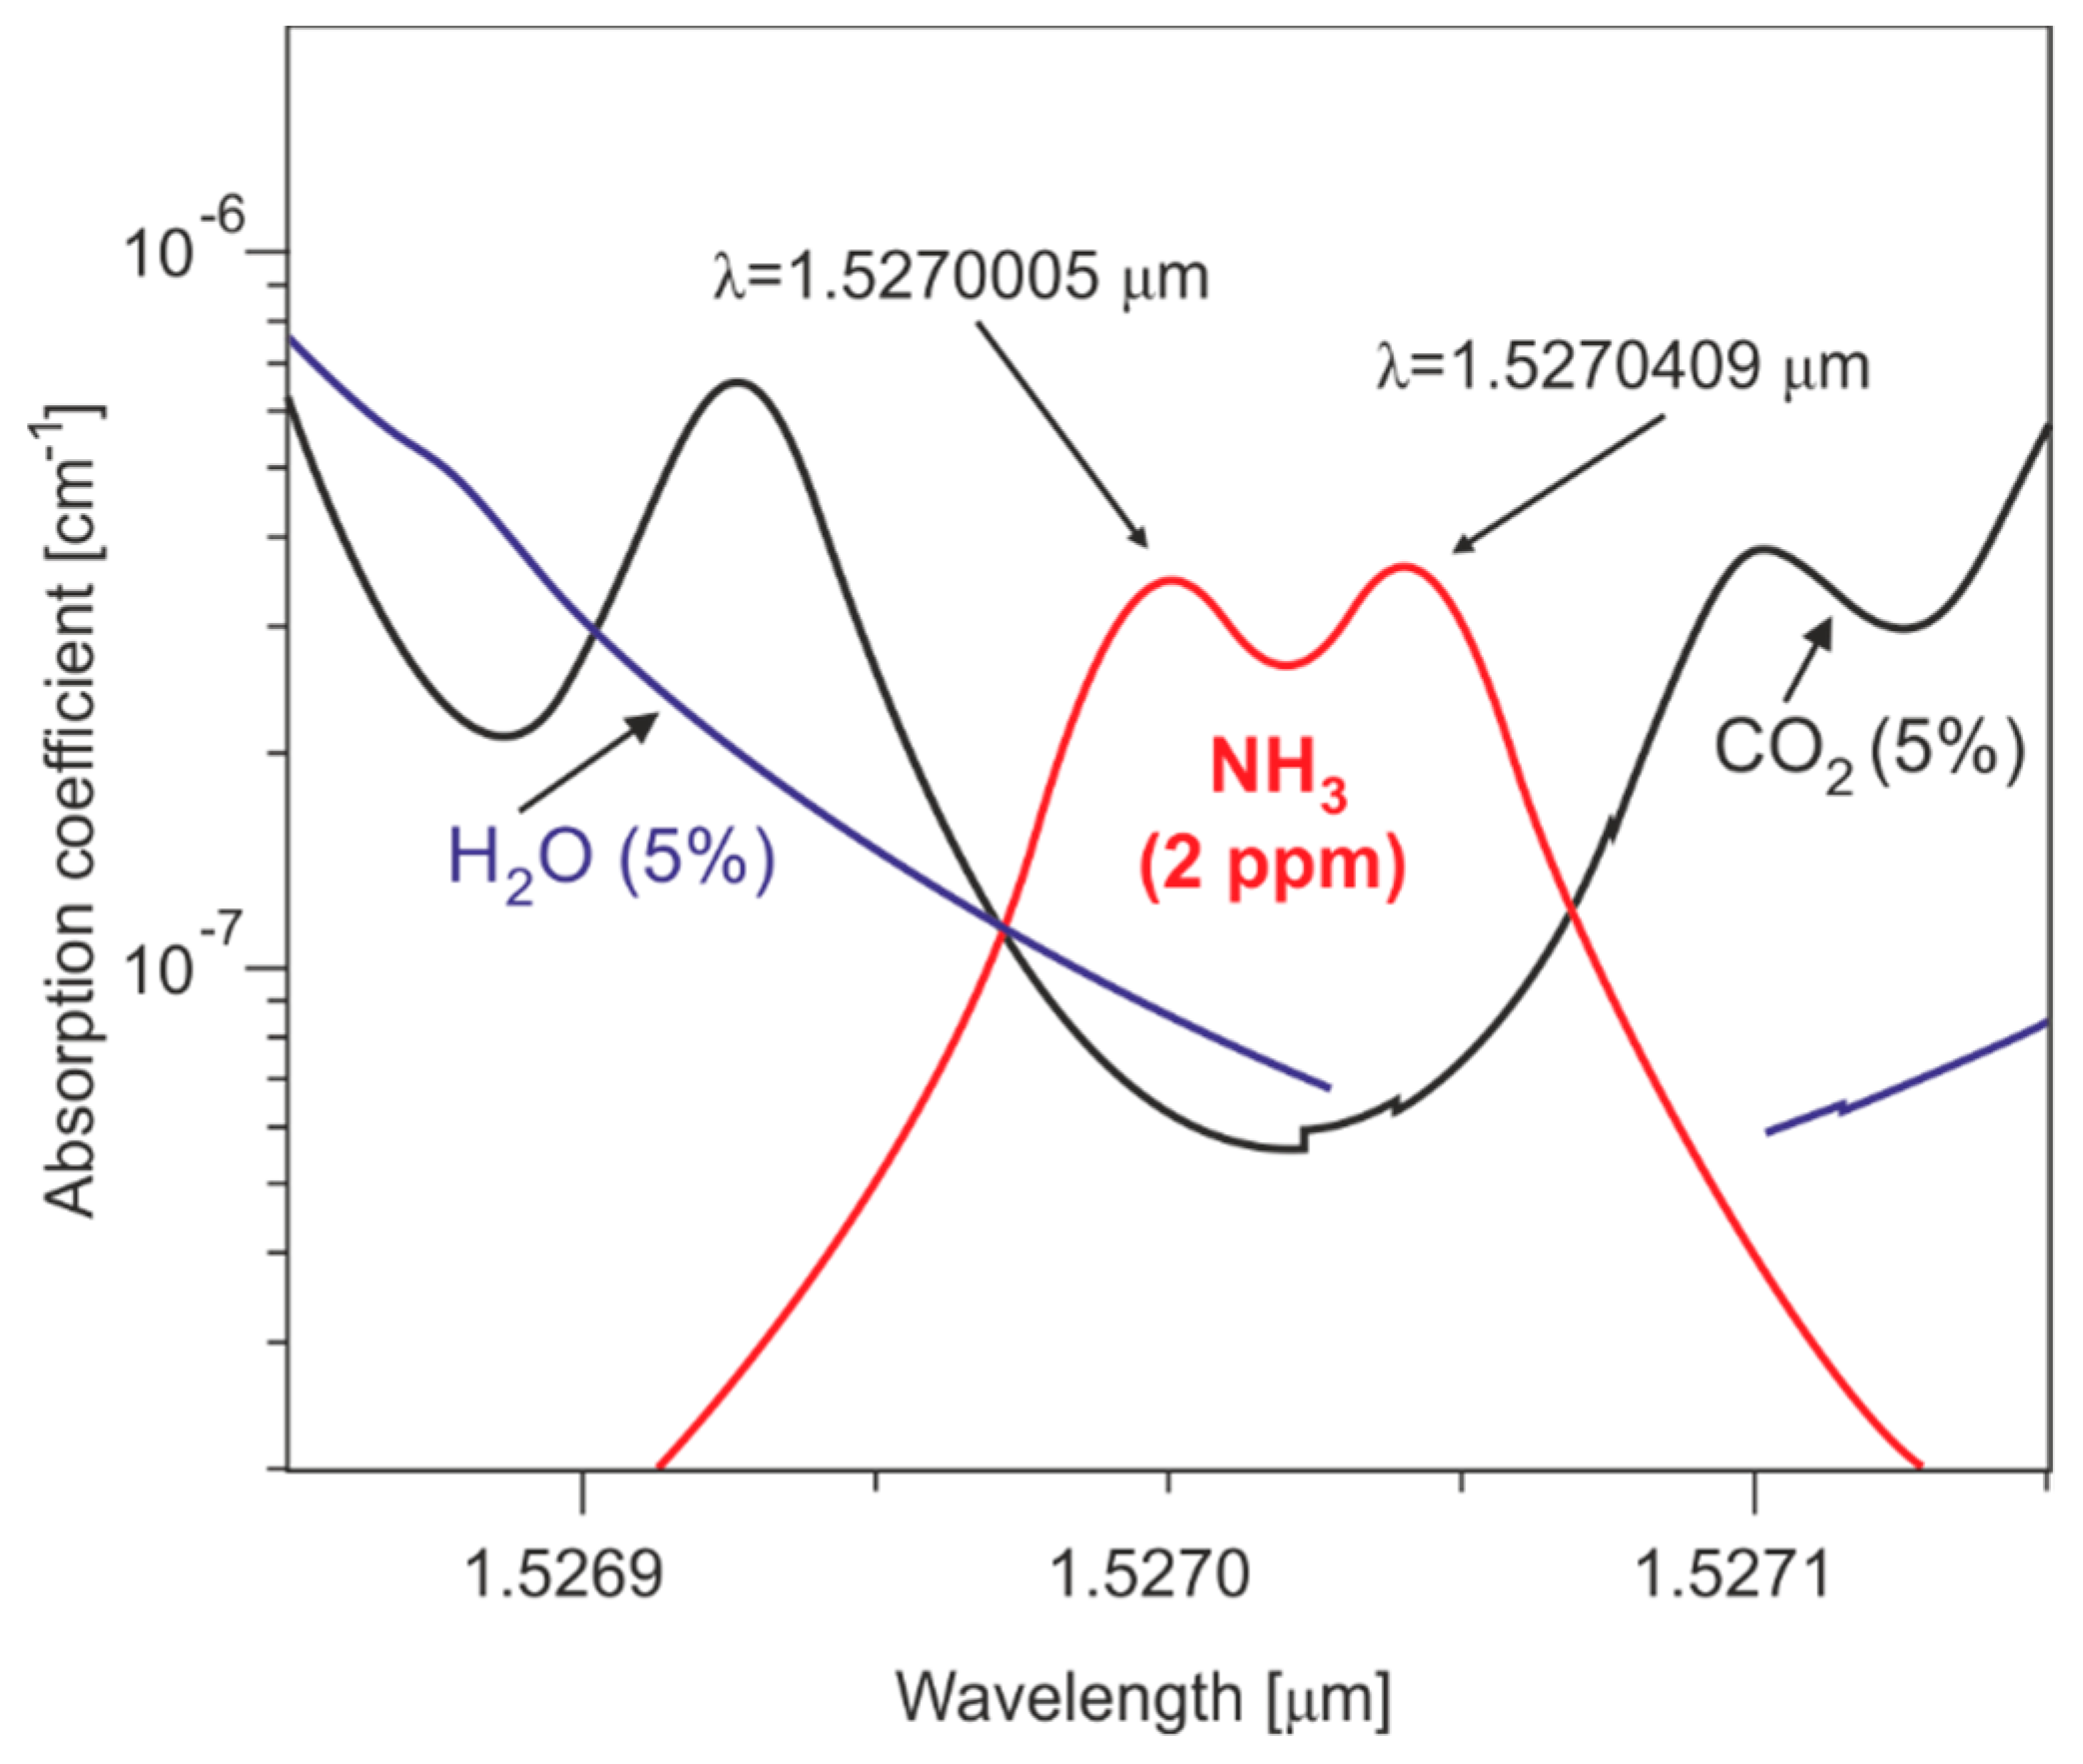
As it was mentioned above, the highest sensitivities of ammonia detection using laser absorption spectroscopy can be achieved in UV and in a range of 10–11 μm, due to the largest values of the absorption cross-sections. However, the detection at the wavelengths used in telecommunication 1.4–1.6 μm is more convenient because of a large variety of relatively cheap laser sources, optical elements, and photodetectors. The measurements of ammonia around 1.51 μm with the detection limit of 4 ppm was already demonstrated using the CEAS technique [74]. We found that suitable wavelengths for ammonia detection are also the lines at 1.5270005 µm and 1.5270409 µm (Figure 13). The single-mode laser wavelength was controlled with the HighPrecision lambdameter (model WS6) ensuring precision in a short time (1 min) of 0.0005 nm. The NH3 absorption coefficient (at 2 ppm) reaches here about 3.5∙10−6 cm−1, and experimental techniques like MUPASS–WMS can be effectively used. In this range, carbon dioxide and water vapor interference is about eight times weaker.
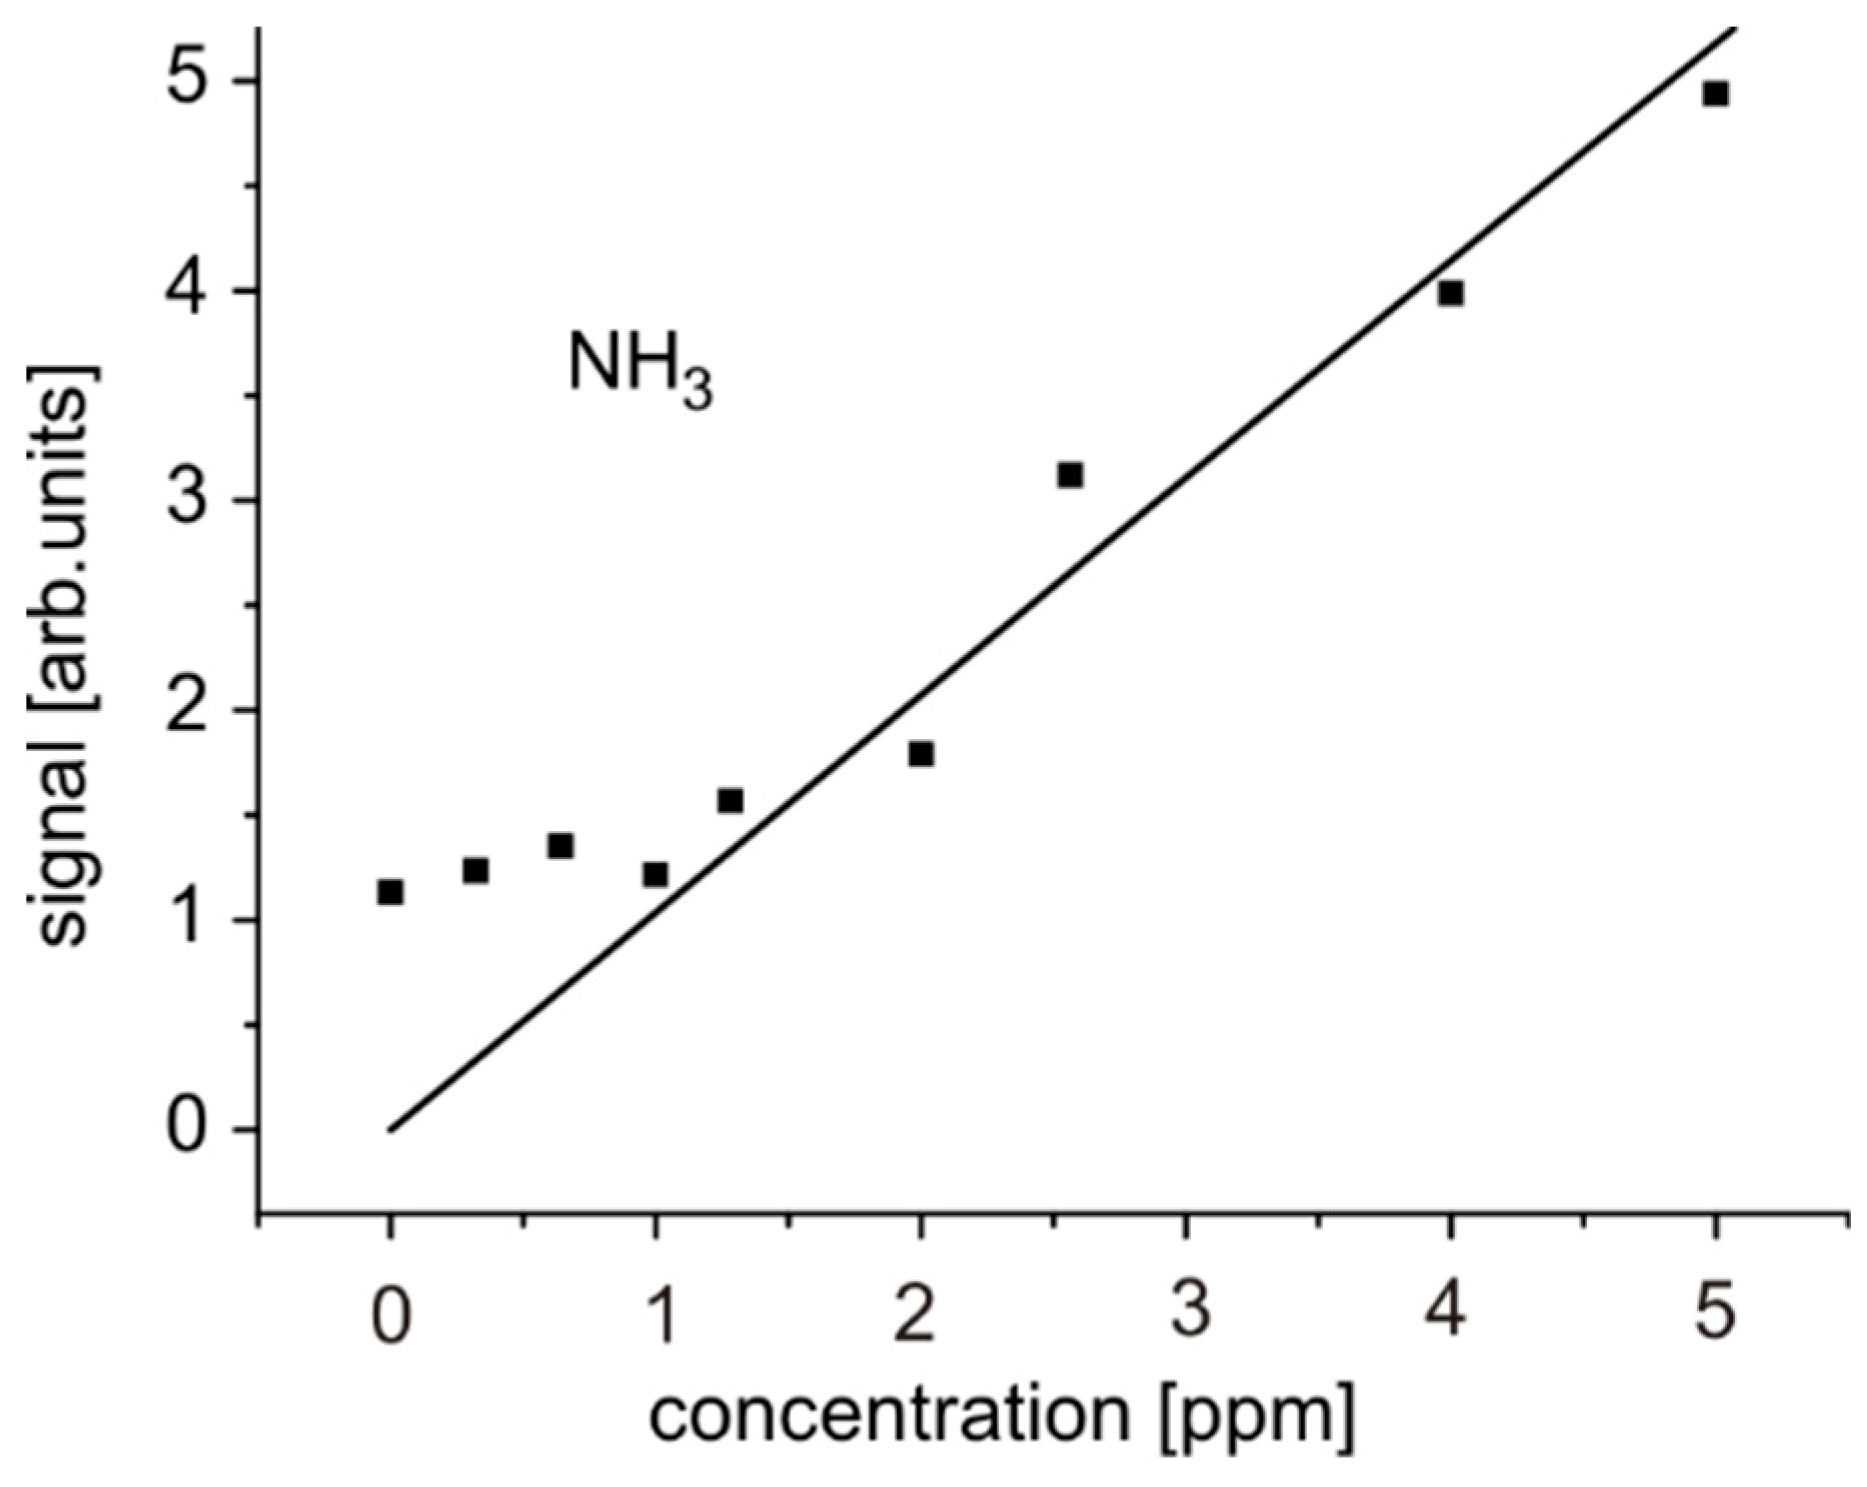
Our ammonia sensor used the MUPASS–WMS approach (Figure 9). A single-mode diode laser (Toptica, model DL100, 20 mW) was applied as a light source. Output signals were integrated over 1 min. Results of sensor investigation are presented in Figure 14. It provides proper results for NH3 concentrations of up to about 1 ppm. For lower values, the deviation from a linear characteristic is observed. This is probably a result of poor regulation of reference concentration inside the sensor due to NH3 deposit on the walls of the system, which causes a systematic error of measured data. In order to avoid the concentration measurement disturbed by NH3 molecules adsorbed on the walls (and then desorbed), the sensor was kept at a temperature of 50 °C.
Nevertheless, due to the proper choice of spectral lines, we achieved a good immunity of the detection against H2O and CO2 at the concentrations which might occur in breath (Figure 13). The detection limit of 1 ppm was better than in other experiments preformed at a spectral range of 1.5 μm [74]. Our multi-pass sensor is suitable for rough monitoring of ammonia in the exhaled air and for detection of morbid states (>1.5 ppm).
4. Conclusions
Based on the analysis, it can be concluded that the further development of in-situ ammonia detection technologies will focus on the improvement of sophisticated laboratory equipment, e.g., the mass spectrometers and lasers. One can expect the development of sensors dedicated to a specific application. This article focuses on the second group of the sensors in which two technologies with high potential for application and development have been distinguished: solid-state ammonia sensors and laser absorption spectroscopy. Metrological and operational parameters of such sensors largely depend on the application. Basically, they must be characterized by fast operation, the largest measuring range and the highest measurement precision, high reliability, selectivity, as well as small dimensions, and low cost. Sensors belonging to the former group can detect the ammonia with a concentration of several ppm within tens of seconds. Their advantage consists in very small dimensions and very low cost. Materials engineering and nanotechnology are key technologies for the development of this sensor group. We underlined that recent advances in materials and measurement methods enhance gas detection by such low-cost gas sensors in portable applications. We are conscious that our research presents a limited number of NH3 gas sensors. This issue is a hot topic in the gas sensing area, and other attractive sensors were developed recently (e.g., capacitive sensors [76], colorimetric sensing materials [77], or advanced MOX sensors [78]). The latter group of sensors can detect up to four orders of lower ammonia in fractions of a second. However, their costs are much higher, mainly due to the lasers and high-quality optical components. The further improvement of these sensors is much more dependent on the development of lasers [79] than photodetectors [80], because they are already at a very high level. It mainly concerns a progress in lasers for mid-infrared radiation, since one can expect the highest sensitivity and selectivity in this spectral range. However, miniaturization, reliability, and reduction of production costs are still a current challenge for all optical sensor components. It should be also mentioned that MOX sensors can utilize optical methods in some sense by applying UV light to improve the sensitivity and selectivity of gas detection. Therefore, both types of gas sensors start to interlace MOX and optical sensors technologies to reduce costs and popularize their applications. We believe that different types of gas sensors find complementary areas of new applications.
Author Contributions
Z.B.: conceptualization, writing—original draft, visualization. T.S.: writing—review & editing, investigation. J.S.: writing—review & editing, investigation. J.W.: formal analysis, investigation, writing—review & editing. All authors have read and agreed to the published version of the manuscript.
Funding
The publication was supported by The Polish National Centre for Research and Development as part of the “Sense” project, ID 347510.
Conflicts of Interest
The authors declare no conflict of interest.
References
- Manap, H.; Mazlee, N.N.; Suzalina, K.; Najib, M.S. An open-path optical fibre sensor for ammonia measurement in the ultraviolet region. ARPN J. Eng. Appl. Sci. 2016, 11, 10940–10943. [Google Scholar]
- Solga, S.F.; Mudalel, M.L.; Spacek, L.A.; Risby, T.H. Fast and accurate exhaled breath ammonia measurement. J. Vis. Exp. 2014, 88, 51658. [Google Scholar] [CrossRef] [Green Version]
- Kwak, D.; Lei, Y.; Maric, R. Ammonia gas sensors: A comprehensive review. Talanta 2019, 204, 713–730. [Google Scholar] [CrossRef] [PubMed]
- Zhang, Q.; Ding, J.; Kou, L.; Kui, W. A potentiometric flow biosensor based on ammonia-oxidizing bacteria for the detection of toxicity in water. Sensors 2013, 13, 6936–6945. [Google Scholar] [CrossRef]
- Bollmann, A.; Revsbech, N.P. An NH4+ biosensor based on ammonia-oxidizing bacteriafor use under anoxic conditions. Sens. Actuators B Chem. 2005, 105, 412–418. [Google Scholar] [CrossRef]
- Bianchi, R.C.; Rodrigo da Silva, E.; Dall’Antonia, L.H.; Ferreira, F.F.; Alves, W.A. A nonenzymatic biosensor based on gold electrodes modified with peptide self-assemblies for detecting ammonia and urea oxidation. Langmuir 2014, 30, 11464–11473. [Google Scholar] [CrossRef]
- Khan, I.R.; Mohammad, A.; Asiri, A.M. (Eds.) Advanced Biosensors for Health Care Application, 1st ed.; Elsevier: Amsterdam, The Netherlands; Cambridge, UK; Oxford, UK, 2019. [Google Scholar] [CrossRef]
- Nasiri, N.; Clarke, C. Nanostructured gas sensors for medical and health applications: Low to high dimensional materials. Biosensors 2019, 9, 43. [Google Scholar] [CrossRef] [Green Version]
- Kim, H.J.; Lee, J.H. Highly sensitive and selective gas sensors using p-type oxide semiconductors: Overview. Sens. Actuators B Chem. 2014, 192, 607–627. [Google Scholar] [CrossRef]
- Srivastava, V.; Jain, K. Highly sensitive NH3 sensor using Pt catalyzed silica coating over WO3 thick films. Sens. Actuators B Chem. 2008, 133, 46–52. [Google Scholar] [CrossRef]
- Georges, J. Determination of ammonia and urea in urine and of urea in blood by use of an ammonia-selective electrode. Clin. Chem. 1979, 25, 1888–1890. [Google Scholar] [CrossRef]
- Timmer, B.; Olthuis, W.; Van Den Berg, A. Ammonia sensors and their applications—A review. Sens. Actuators B Chem. 2005, 107, 666–677. [Google Scholar] [CrossRef]
- Lentka, Ł.; Smulko, J.M.; Ionescu, R.; Granqvist, C.G.; Kish, L.B. Determination Of Gas Mixture Components Using Fluctuation Enhanced Sensing And The LS-SVM Regression Algorithm. Metrol. Meas. Syst. 2015, 22, 341–350. [Google Scholar] [CrossRef] [Green Version]
- Korotcenkov, G.; Cho, B.K. Engineering approaches for the improvement of conductometric gas sensor parameters: Part 1. Improvement of sensor sensitivity and selectivity (short survey). Sens. Actuators B Chem. 2013, 188, 709–728. [Google Scholar] [CrossRef]
- Kish, L.B.; Vajtai, R.; Granqvist, C.G. Extracting information from noise spectra of chemical sensors: Single sensor electronic noses and tongues. Sens. Actuators B Chem. 2000, 71, 55–59. [Google Scholar] [CrossRef]
- Dziedzic, A.; Kolek, A.; Licznerski, B. Noise and nonlinearity of gas sensors–preliminary results. In Proceedings of the 22nd International Spring Seminar on Electronics Technology, Dresden-Freital, Germany, 18–20 May 1999; pp. 99–104. [Google Scholar]
- Kotarski, M.; Smulko, J. Hazardous gases detection by fluctuation-enhanced gas sensing. Fluct. Noise Lett. 2010, 9, 359–371. [Google Scholar] [CrossRef]
- Trawka, M.; Smulko, J.; Hasse, L.; Granqvist, C.G.; Annanouch, F.E.; Ionescu, R. Fluctuation enhanced gas sensing with WO3-based nanoparticle gas sensors modulated by UV light at selected wavelengths. Sens. Actuators B Chem. 2016, 234, 453–461. [Google Scholar] [CrossRef]
- Kwiatkowski, A.; Chludziński, T.; Smulko, J. Portable exhaled breath analyzer employing fluctuation-enhanced gas sensing method in resistive gas sensors. Metrol. Meas. Syst. 2018, 25, 551–560. [Google Scholar]
- Gutierrez-Osuna, R. Pattern analysis for machine olfaction: A review. IEEE Sens. J. 2002, 2, 189–202. [Google Scholar] [CrossRef] [Green Version]
- Balandin, A.A.; Rumyantsev, S. Low-Frequency Noise in Low-Dimensional van der Waals Materials. arXiv 2019, arXiv:1908.06204. [Google Scholar]
- Donarelli, M.; Ottaviano, L. 2d materials for gas sensing applications: A review on graphene oxide, MoS2, WS2 and phosphorene. Sensors 2018, 18, 3638. [Google Scholar] [CrossRef] [Green Version]
- Rumyantsev, S.; Liu, G.; Potyrailo, R.A.; Balandin, A.A.; Shur, M.S. Selective sensing of individual gases using graphene devices. IEEE Sens. J. 2013, 13, 2818–2822. [Google Scholar] [CrossRef]
- Bannov, A.G.; Prášek, J.; Jašek, O.; Shibaev, A.A.; Zajíčková, L. Investigation of Ammonia Gas Sensing Properties of Graphite Oxide. Procedia Eng. 2016, 168, 231–234. [Google Scholar] [CrossRef]
- Cai, J.; Zhang, C.; Khan, A.; Liang, C.; Li, W.D. Highly transparent and flexible polyaniline mesh sensor for chemiresistive sensing of ammonia gas. RSC Adv. 2018, 8, 5312–5320. [Google Scholar] [CrossRef] [Green Version]
- Duy, L.T.; Trung, T.Q.; Dang, V.Q.; Hwang, B.U.; Siddiqui, S.I.Y.; Yoon, S.K.; Chung, D.Y.; Lee, N.E. Flexible transparent reduced graphene oxide sensor coupled with organic dye molecules for rapid dual-mode ammonia gas detection. Adv. Funct. Mater. 2016, 26, 4329–4338. [Google Scholar] [CrossRef]
- Tang, N.; Zhou, C.; Xu, L.; Jiang, Y.; Qu, H.; Duan, X. A Fully Integrated Wireless Flexible Ammonia Sensor Fabricated by Soft Nano-Lithography. ACS Sens. 2019, 4, 726–732. [Google Scholar] [CrossRef]
- Kumar, L.; Rawal, I.; Annapoorni, S. Flexible room temperature ammonia sensor based on polyaniline. Sens. Actuators B Chem. 2017, 240, 408–416. [Google Scholar] [CrossRef]
- Yoon, H. Current Trends in Sensors Based on Conducting Polymer Nanomaterials. Nanomaterials 2013, 3, 524–549. [Google Scholar] [CrossRef] [Green Version]
- Sonkusare, G.; Tyagi, S.; Kumar, R.; Mishra, S.; Author, C. Room Temperature Ammonia Gas Sensing Using Polyaniline Nanoparticles Based Sensor. Int. J. Mater. Sci. 2017, 12, 283–291. [Google Scholar] [CrossRef]
- Šetka, M.; Drbohlavová, J.; Hubálek, J. Nanostructured polypyrrole-based ammonia and volatile organic compound sensors. Sensors 2017, 17, 562. [Google Scholar] [CrossRef]
- Bai, H.; Shi, G. Gas sensors based on conducting polymers. Sensors 2007, 7, 267–307. [Google Scholar] [CrossRef] [Green Version]
- Qi, Q.; Wang, P.; Zhao, J.; Feng, L.; Zhou, L.; Xuan, R.; Liu, Y.; Li, G. SnO2 nanoparticle-coated In2O3 nanofibers with improved NH3 sensing properties. Sens. Actuators B Chem. 2014, 194, 440–446. [Google Scholar] [CrossRef]
- Su, P.G.; Yang, L.Y. NH3 gas sensor based on Pd/SnO2/RGO ternary composite operated at room-temperature. Sens. Actuators B Chem. 2016, 223, 202–208. [Google Scholar] [CrossRef]
- Wu, H.; Ma, Z.; Lin, Z.; Song, H.; Yan, S.; Shi, Y. High-sensitive ammonia sensors based on tin monoxide nanoshells. Nanomaterials 2019, 9, 388. [Google Scholar] [CrossRef] [PubMed] [Green Version]
- Tian, J.; Yang, G.; Jiang, D.; Su, F.; Zhang, Z. A hybrid material consisting of bulk-reduced TiO2, graphene oxide and polyaniline for resistance based sensing of gaseous ammonia at room temperature. Microchim. Acta 2016, 183, 2871–2878. [Google Scholar] [CrossRef]
- Wozniak, L.; Kalinowski, P.; Jasinski, G.; Jasinski, P. FFT analysis of temperature modulated semiconductor gas sensor response for the prediction of ammonia concentration under humidity interference. Microelectron. Reliab. 2018, 84, 163–169. [Google Scholar] [CrossRef]
- Zhang, T.; Nix, M.B.; Yoo, B.Y.; Deshusses, M.A.; Myung, N.V. Electrochemically functionalized single-walled carbon nanotube gas sensor. Electroanalysis 2006, 18, 1153–1158. [Google Scholar] [CrossRef]
- Liu, C.; Tai, H.; Zhang, P.; Ye, Z.; Su, Y.; Jiang, Y. Enhanced ammonia-sensing properties of PANI-TiO2-Au ternary self-assembly nanocomposite thin film at room temperature. Sens. Actuators B Chem. 2017, 246, 85–95. [Google Scholar] [CrossRef]
- Li, Y.; Gong, J.; He, G.; Deng, Y. Fabrication of polyaniline/titanium dioxide composite nanofibers for gas sensing application. Mater. Chem. Phys. 2011, 129, 477–482. [Google Scholar] [CrossRef]
- Patil, U.V.; Ramgir, N.S.; Karmakar, N.; Bhogale, A.; Debnath, A.K.; Aswal, D.K.; Gupta, S.K.; Kothari, D.C. Room temperature ammonia sensor based on copper nanoparticle intercalated polyaniline nanocomposite thin films. Appl. Surf. Sci. 2015, 339, 69–74. [Google Scholar] [CrossRef]
- Wu, Z.; Chen, X.; Zhu, S.; Zhou, Z.; Yao, Y.; Quan, W.; Liu, B. Enhanced sensitivity of ammonia sensor using graphene/polyaniline nanocomposite. Sens. Actuators B Chem. 2013, 178, 485–493. [Google Scholar] [CrossRef]
- Liu, N.Y.; Cay-Durgun, P.; Lai, T.; Sprowls, M.; Thomas, L.; Lind, M.L.; Forzani, E.A. Handheld, Colorimetric Optoelectronic Dynamics Analyzer for Measuring Total Ammonia of Biological Samples. IEEE J. Transl. Eng. Health Med. 2018, 6, 1–10. [Google Scholar] [CrossRef] [PubMed]
- Fischbacher, B.; Lechner, B.; Brandstätter, B. Ammonia distribution measurement on a hot gas test bench applying tomographical optical methods. Sensors 2019, 19, 896. [Google Scholar] [CrossRef] [PubMed] [Green Version]
- Limão-Vieira, P.; Jones, N.C.; Hoffmann, S.V.; Duflot, D.; Mendes, M.; Lozano, A.I.; Ferreira da Silva, F.; García, G.; Hoshino, M.; Tanaka, H. Revisiting the photoabsorption spectrum of NH3 in the 5.4–10.8 eV energy region. J. Chem. Phys. 2019, 151, 184302. [Google Scholar] [CrossRef]
- Chen, F.; Judge, D.; Wu, C.Y.R.; Caldwell, J. Low and room temperature photoabsorption cross sections of NH3 in the UV region. Planet. Space Sci. 1998, 47, 261–266. [Google Scholar] [CrossRef]
- Roodenko, K.; Hinojos, D.; Hodges, K.L.; Veyan, J.F.; Chabal, Y.J.; Clark, K.; Katzir, A.; Robbins, D. Non-dispersive infrared (NDIR) sensor for real-time nitrate monitoring in wastewater treatment. In Proceedings of the Optical Fibers and Sensors for Medical Diagnostics and Treatment Applications XIX, San Francisco, CA, USA, 2–3 February 2019; Volume 15, p. 10872. [Google Scholar] [CrossRef]
- Klein, A.; Witzel, O.; Ebert, V. Rapid, Time-Division multiplexed, Direct Absorptionand wavelength modulation-spectroscopy. Sensors 2014, 14, 21497–21513. [Google Scholar] [CrossRef] [PubMed] [Green Version]
- Mitra, C.; Sharma, R. Diode Laser-Based Sensors for Extreme Harsh Environment Data Acquisition. In High Energy and Short Pulse Lasers; InTech: London, UK, 2016; p. 13. [Google Scholar] [CrossRef] [Green Version]
- IRcell–Long Path in a Compact Design. Available online: https://dea47l1p89u26.cloudfront.net/wp-content/uploads/2017/12/IRcell-green-product.jpg (accessed on 20 February 2020).
- O’neill, H.; Gordon, S.; O’Neill, M.; Gibbons, R.; Szidon, J. A computerized classification technique for screening for the presence of breath biomarkers in lung cancer. Clin. Chem. 1988, 34, 1613–1618. [Google Scholar] [CrossRef] [PubMed]
- Berden, G.; Peeters, R.; Meijer, G. Cavity ring-down spectroscopy: Experimental schemes and applications. Int. Rev. Phys. Chem. 2010, 19, 565–607. [Google Scholar] [CrossRef]
- Cygan, A.; Lisak, D.; Masłowski, P.; Bielska, K.; Wójtewicz, S.; Domysławska, J.; Trawiński, R.S.; Ciuryło, R.; Abe, H.; Hodges, J.T. Pound-Drever-Hall-locked, frequency-stabilized cavity ring-down spectrometer. Rev. Sci. Instrum. 2011, 82, 063107. [Google Scholar] [CrossRef]
- Cygan, A.; Wójtewicz, S.; Domysławska, J.; Masłowski, P.; Bielska, K.; Piwiński, M.; Stec, K.; Trawiński, R.S.; Ozimek, F.; Radzewicz, C.; et al. Spectral line-shapes investigation with Pound-Drever-Hall-locked frequency-stabilized cavity ring-down spectroscopy. Eur. Phys. J. Spec. Top. 2013, 222, 2119–2142. [Google Scholar] [CrossRef]
- Engeln, R.; Berden, G.; Peeters, R.; Meijer, G. Cavity enhanced absorption and cavity enhanced magnetic rotation spectroscopy. Rev. Sci. Instrum. 1998, 69, 3763–3769. [Google Scholar] [CrossRef] [Green Version]
- Wojtas, J.; Czyzewski, A.; Stacewicz, T.; Bielecki, Z. Sensitive detection of NO2 with cavity enhanced spectroscopy. Opt. Appl. 2006, 36, 461–467. [Google Scholar]
- Wojtas, J.; Mikolajczyk, J.; Nowakowski, M.; Rutecka, B.; Medrzycki, R.; Bielecki, Z. Applying CEAS method to UV, VIS, and IR spectroscopy sensors. Bull. Pol. Acad. Sci. Tech. Sci. 2011, 59, 415–418. [Google Scholar] [CrossRef] [Green Version]
- Stacewicz, T.; Wojtas, J.; Bielecki, Z.; Nowakowski, M.; Mikołajczyk, J.; Mędrzycki, R.; Rutecka, B. Cavity ring down spectroscopy: Detection of trace amounts of substance. Opto-Electron. Rev. 2012, 20. [Google Scholar] [CrossRef]
- Wojtas, J.; Bielecki, Z.; Stacewicz, T.; Mikołajczyk, J.; Nowakowski, M. Ultrasensitive laser spectroscopy for breath analysis. Opto-Electron. Rev. 2012, 20. [Google Scholar] [CrossRef]
- Zheng, H.; Liu, Y.; Lin, H.; Liu, B.; Gu, X.; Li, D.; Huang, B.; Wu, Y.; Dong, L.; Zhu, W.; et al. Quartz-enhanced photoacoustic spectroscopy employing pilot line manufactured custom tuning forks. Photoacoustics 2020, 17, 100158. [Google Scholar] [CrossRef]
- Hu, L.; Zheng, C.; Zheng, J.; Wang, Y.; Tittel, F.K. Quartz tuning fork embedded off-beam quartz-enhanced photoacoustic spectroscopy. Opt. Lett. 2019, 44, 2562–2565. [Google Scholar] [CrossRef] [Green Version]
- Owen, K.; Farooq, A. A calibration-free ammonia breath sensor using a quantum cascade laser with WMS 2f/1f. Appl. Phys. B Lasers Opt. 2014, 116, 371–383. [Google Scholar] [CrossRef]
- Shadman, S.; Rose, C.; Yalin, A.P. Open-path cavity ring-down spectroscopy sensor for atmospheric ammonia. Appl. Phys. B Lasers Opt. 2016, 122, 1–9. [Google Scholar] [CrossRef]
- Maithani, S.; Mandal, S.; Maity, A.; Pal, M.; Pradhan, M. High-resolution spectral analysis of ammonia near 6.2 μm using a cw EC-QCL coupled with cavity ring-down spectroscopy. Analyst 2018, 143, 2109–2114. [Google Scholar] [CrossRef]
- Manne, J.; Lim, A.; Jäger, W.; Tulip, J. Off-axis cavity enhanced spectroscopy based on a pulsed quantum cascade laser for sensitive detection of ammonia and ethylene. Appl. Opt. 2010, 49, 5302–5308. [Google Scholar] [CrossRef]
- Lewicki, R.; Jahjah, M.; Ma, Y.; Stefanski, P.; Tarka, J.; Razeghi, M.; Tittel, F.K. Current status of mid-infrared semiconductor-laser-based sensor technologies for trace-gas sensing applications. Wonder Nanotechnol. Quantum Optoelectron. Devices Appl. 2013, 23, 597–632. [Google Scholar] [CrossRef]
- Lewicki, R.; Kosterev, A.A.; Bakhirkin, Y.A.; Thomazy, D.M.; Doty, J.; Dong, L.; Tittel, F.K.; Risby, T.H.; Solga, S.; Kane, D.; et al. Real Time Ammonia Detection in Exhaled Human Breath with a Quantum Cascade Laser Based Sensor. In Conference on Lasers and Electro-Optics/International Quantum Electronics Conference; OSA: Washington, DC, USA, 2009; p. CMS6. [Google Scholar] [CrossRef]
- Bielecki, Z.; Stacewicz, T.; Wojtas, J.; Mikołajczyk, J. Application of quantum cascade lasers to trace gas detection. Bull. Pol. Acad. Sci. Tech. Sci. 2015, 63, 515–525. [Google Scholar] [CrossRef]
- Mikołajczyk, J.; Bielecki, Z.; Stacewicz, T.; Smulko, J.; Wojtas, J.; Szabra, D.; Lentka, Ł.; Prokopiuk, A.; Magryta, P. Detection of gaseous compounds with different techniques. Metrol. Meas. Syst. 2016, 23, 205–224. [Google Scholar] [CrossRef]
- Wang, C.; Sahay, P. Breath Analysis Using Laser Spectroscopic Techniques: Breath Biomarkers, Spectral Fingerprints, and Detection Limits. Sensors 2009, 9, 8230–8262. [Google Scholar] [CrossRef]
- Kearney, D.J.; Hubbard, T.; Putnam, D. Breath ammonia measurement in Helicobacter pylori infection. Dig. Dis. Sci. 2002, 47, 2523–2530. [Google Scholar] [CrossRef]
- Smith, D.; Wang, T.; Pysanenko, A.; Španěl, P. A selected ion flow tube mass spectrometry study of ammonia in mouth- and nose-exhaled breath and in the oral cavity. Rapid Commun. Mass Spectrom. 2008, 22, 783–789. [Google Scholar] [CrossRef]
- Buszewski, B.; Grzywinski, D.; Ligor, T.; Stacewicz, T.; Bielecki, Z.; Wojtas, J. Detection of volatile organic compounds as biomarkers in breath analysis by different analytical techniques. Bioanalysis 2013, 5, 2287–2306. [Google Scholar] [CrossRef]
- Thorpe, M.J.; Balslev-Clausen, D.; Kirchner, M.S.; Ye, J. Cavity-enhanced optical frequency comb spectroscopy: Application to human breath analysis. Opt. Express 2008, 16, 2387. [Google Scholar] [CrossRef] [Green Version]
- Stacewicz, T.; Bielecki, Z.; Wojtas, J.; Magryta, P.; Mikołajczyk, J.; Szabra, D. Detection of disease markers in human breath with laser absorption spectroscopy. Opto-Elektron. Rev. 2016, 24, 29–41. [Google Scholar] [CrossRef]
- Assen, A.H.; Yassine, O.; Shekhah, O.; Eddaoudi, M.; Salama, K.N. MOFs for the Sensitive Detection of Ammonia: Deployment of fcu-MOF Thin Films as Effective Chemical Capacitive Sensors. ACS Sens. 2017, 2, 1294–1301. [Google Scholar] [CrossRef]
- Zhang, J.; Ouyang, J.; Ye, Y.; Li, Z.; lin, Q.; Chen, T.; Zhang, Z.; Xiang, S. Mixed-Valence Cobalt(II/III) Metal–Organic Framework for Ammonia Sensing with Naked-Eye Color Switching. ACS Appl. Mater. Interfaces 2018, 10, 27465–27471. [Google Scholar] [CrossRef] [PubMed]
- Galstyan, V.; Bhandari, M.P.; Sberveglieri, V.; Sberveglieri, G.; Comini, E. Metal Oxide Nanostructures in Food Applications: Quality Control and Packaging. Chemosensors 2018, 6, 16. [Google Scholar] [CrossRef] [Green Version]
- Gutowski, P.; Sankowska, I.; Słupiński, T.; Pierścińska, D.; Pierściński, K.; Kuźmicz, A.; Gołaszewska-Malec, K.; Bugajski, M. Optimization of MBE Growth Conditions of In0.52Al0.48As Waveguide Layers for InGaAs/InAlAs/InP Quantum Cascade Lasers. Materials 2019, 12, 1621. [Google Scholar] [CrossRef] [PubMed] [Green Version]
- Rogalski, A.; Kopytko, M.; Martyniuk, P.; Hu, W. Comparison of performance limits of HOT HgCdTe photodiodes with 2D material infrared photodetectors. Opto-Electron. Rev. 2020, 28, 82–92. [Google Scholar] [CrossRef]
Figure 1.
Ammonia detection technology.

Figure 2.
The schematic of the colorimetric optoelectronic ammonia sensor [43].
Figure 2.
The schematic of the colorimetric optoelectronic ammonia sensor [43].

Figure 3.
Absorption cross-section of ammonia for different temperatures in UV [45,46] (a). Absorption cross-section of selected molecules existing in standard conditions (1 atm, 288.2 K) calculated on the basis of the HITRAN database in IR range (b).

Figure 4.
Design and principle of operation of the nondispersive infrared (NDIR) sensor.

Figure 5.
Diagram of the sensor based on NDIR and fiber-optic evanescent wave spectroscopy (FEWS) principles.
Figure 5.
Diagram of the sensor based on NDIR and fiber-optic evanescent wave spectroscopy (FEWS) principles.

Figure 6.
Block diagram and principle of operation of the typical tunable laser absorption spectroscopy (TLAS) sensor.
Figure 6.
Block diagram and principle of operation of the typical tunable laser absorption spectroscopy (TLAS) sensor.

Figure 7.
The principle of operation of the sensor using a combination of TLAS and wavelength modulation spectroscopy (WMS) techniques.
Figure 7.
The principle of operation of the sensor using a combination of TLAS and wavelength modulation spectroscopy (WMS) techniques.

Figure 8.
Idea of first and second harmonic detection with tunable diode lasers.

Figure 9.
Scheme of a multi-pass experimental system for multi-pass optical cell (MUPASS)–WMS spectroscopy.
Figure 9.
Scheme of a multi-pass experimental system for multi-pass optical cell (MUPASS)–WMS spectroscopy.

Figure 10.
The circular multi-pass—small volume cell.

Figure 11.
Idea of the cavity ring down spectroscopy (CRDS).

Figure 12.
Idea of photoacoustic spectroscopy.

Figure 13.
Absorption spectra of ammonia, H2O, and CO2 around 1.527 µm [75].
Figure 13.
Absorption spectra of ammonia, H2O, and CO2 around 1.527 µm [75].

Figure 14.
Results of ammonia measurement with MUPASS–WMS system [75].
Figure 14.
Results of ammonia measurement with MUPASS–WMS system [75].


Table 1.
Parameters of some solid-state ammonia sensors.
| Sensor Material | Detection Limit | Response Time | Recovery Time | Operation Temperature | Reference |
|---|---|---|---|---|---|
| Metal Oxide | |||||
| SnO2/In2O3 | 100 ppb | ~0.1 min | 10 s | RT | [33] |
| SnO2/Pd/RGO | 2 ppm | 7 min | 50 min | RT | [34] |
| SnO | 5 ppm | <2 min | 30 s | RT | [35] |
| TiO2/GO/PANI | 100 ppm | ~0.5 min | 17 s | RT | [36] |
| SnO2 (type GGS10331) | 5 ppm | <1 min | ~few minutes | 300–500 °C | [37] |
| Conducting Polymer | |||||
| PANI/SWNT | 50 ppb | ~few minutes | ~few hours | RT | [38] |
| PANI-TiO2-gold | 10 ppm | - | - | RT | [39] |
| PANI/TiO2 | 25 ppb | <1.5 min | - | RT | [40] |
| PANI/Cu | 1 ppm | ~0.1 min | 160 s | RT | [41] |
| PANI/graphene | 1 ppm | <1 min | 23 s | RT | [42] |
Where: GO—graphene oxide, RGO—reduced graphene oxide, RT—room temperature, PANI—polyaniline, PPy—polypyrrole, SWNT—single-walled carbon nanotubes.
Table 2.
Parameters of some optical ammonia sensors.
| Sensing Methods | Detection Limit | Radiation Source | Wavelength | Other Parameter | Reference |
|---|---|---|---|---|---|
| NDIR | 1 ppm | Deuterium lamp | Filter 200–225 nm | λcenter = 205 nm FWHM = 10 nm | [44] |
| MUPASS-WMS | 7 ppb | QCL | 1103.44 cm−1 | Eff. path length—76.45 m | [62] |
| CRDS-cw (open-path) | 1.3 ppb | QCL-DFB | 10.33 µm | R = 0.9995, L = 50 cm | [63] |
| CRDS | 0.74 ppb | QCL (cw-EC) | 6.2 µm | R = 0.9998, L = 50 cm, p = 115 Torr | [64] |
| CEAS | 15 ppb | QCL-DFB (pulsed) | 967.35 cm−1 | L = 53 cm, ti = 5–10 ns | [65] |
| PAS | 0.7 ppb | EC-QCL | 10.36 µm | p = 220 Torr | [66] |
| QEPAS | <10 ppb | QCL (cw-EC) | 10.6 µm | Ammonia detection in exhaled breath | [67] |
QCL—quantum cascade laser, PAS—photoacoustic spectroscopy, CRDS—cavity ring down spectroscopy, QEPAS—quartz-enhanced photoacoustic spectroscopy, WMS—wavelength modulation spectroscopy, R—reflectivity of mirrors, L—optical cavity length, EC—external cavity, p—pressure. Other methods of gas detection were described in our earlier studies [68,69].
© 2020 by the authors. Licensee MDPI, Basel, Switzerland. This article is an open access article distributed under the terms and conditions of the Creative Commons Attribution (CC BY) license (http://creativecommons.org/licenses/by/4.0/).
Share and Cite
MDPI and ACS Style
Bielecki, Z.; Stacewicz, T.; Smulko, J.; Wojtas, J. Ammonia Gas Sensors: Comparison of Solid-State and Optical Methods. Appl. Sci. 2020, 10, 5111. https://doi.org/10.3390/app10155111
AMA Style
Bielecki Z, Stacewicz T, Smulko J, Wojtas J. Ammonia Gas Sensors: Comparison of Solid-State and Optical Methods. Applied Sciences. 2020; 10(15):5111. https://doi.org/10.3390/app10155111
Chicago/Turabian StyleBielecki, Zbigniew, Tadeusz Stacewicz, Janusz Smulko, and Jacek Wojtas. 2020. "Ammonia Gas Sensors: Comparison of Solid-State and Optical Methods" Applied Sciences 10, no. 15: 5111. https://doi.org/10.3390/app10155111
Note that from the first issue of 2016, this journal uses article numbers instead of page numbers. See further details here.