The Transformation by Catalysis of Prebiotic Chemical Systems to Useful Biochemicals: A Perspective Based on IR Spectroscopy of the Primary Chemicals II. Catalysis and the Building of RNA


Abstract
:1. Introduction
The SET Model Exemplified
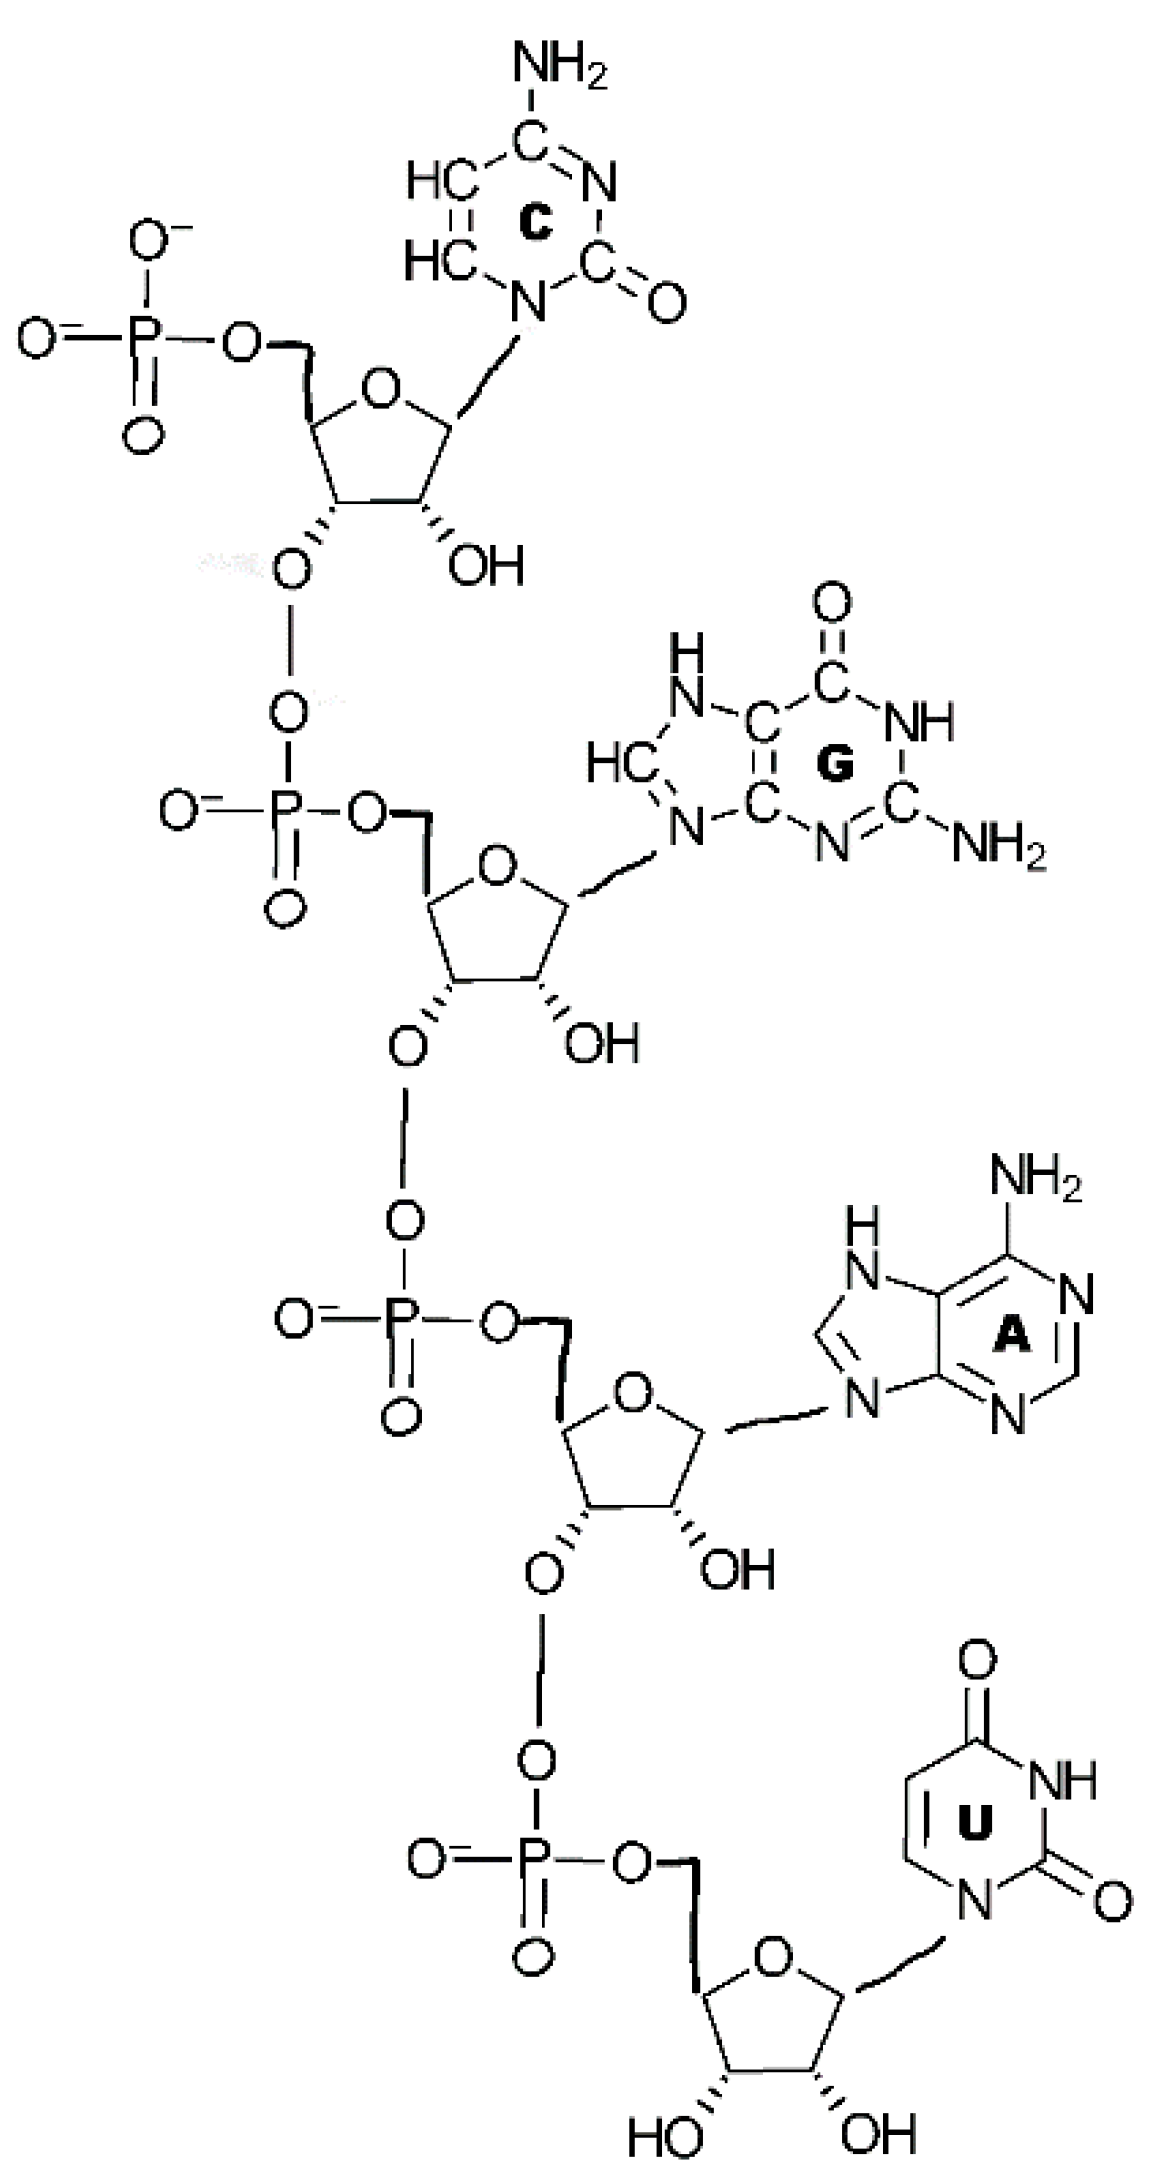
2. The Formation of the Constituents of RNA
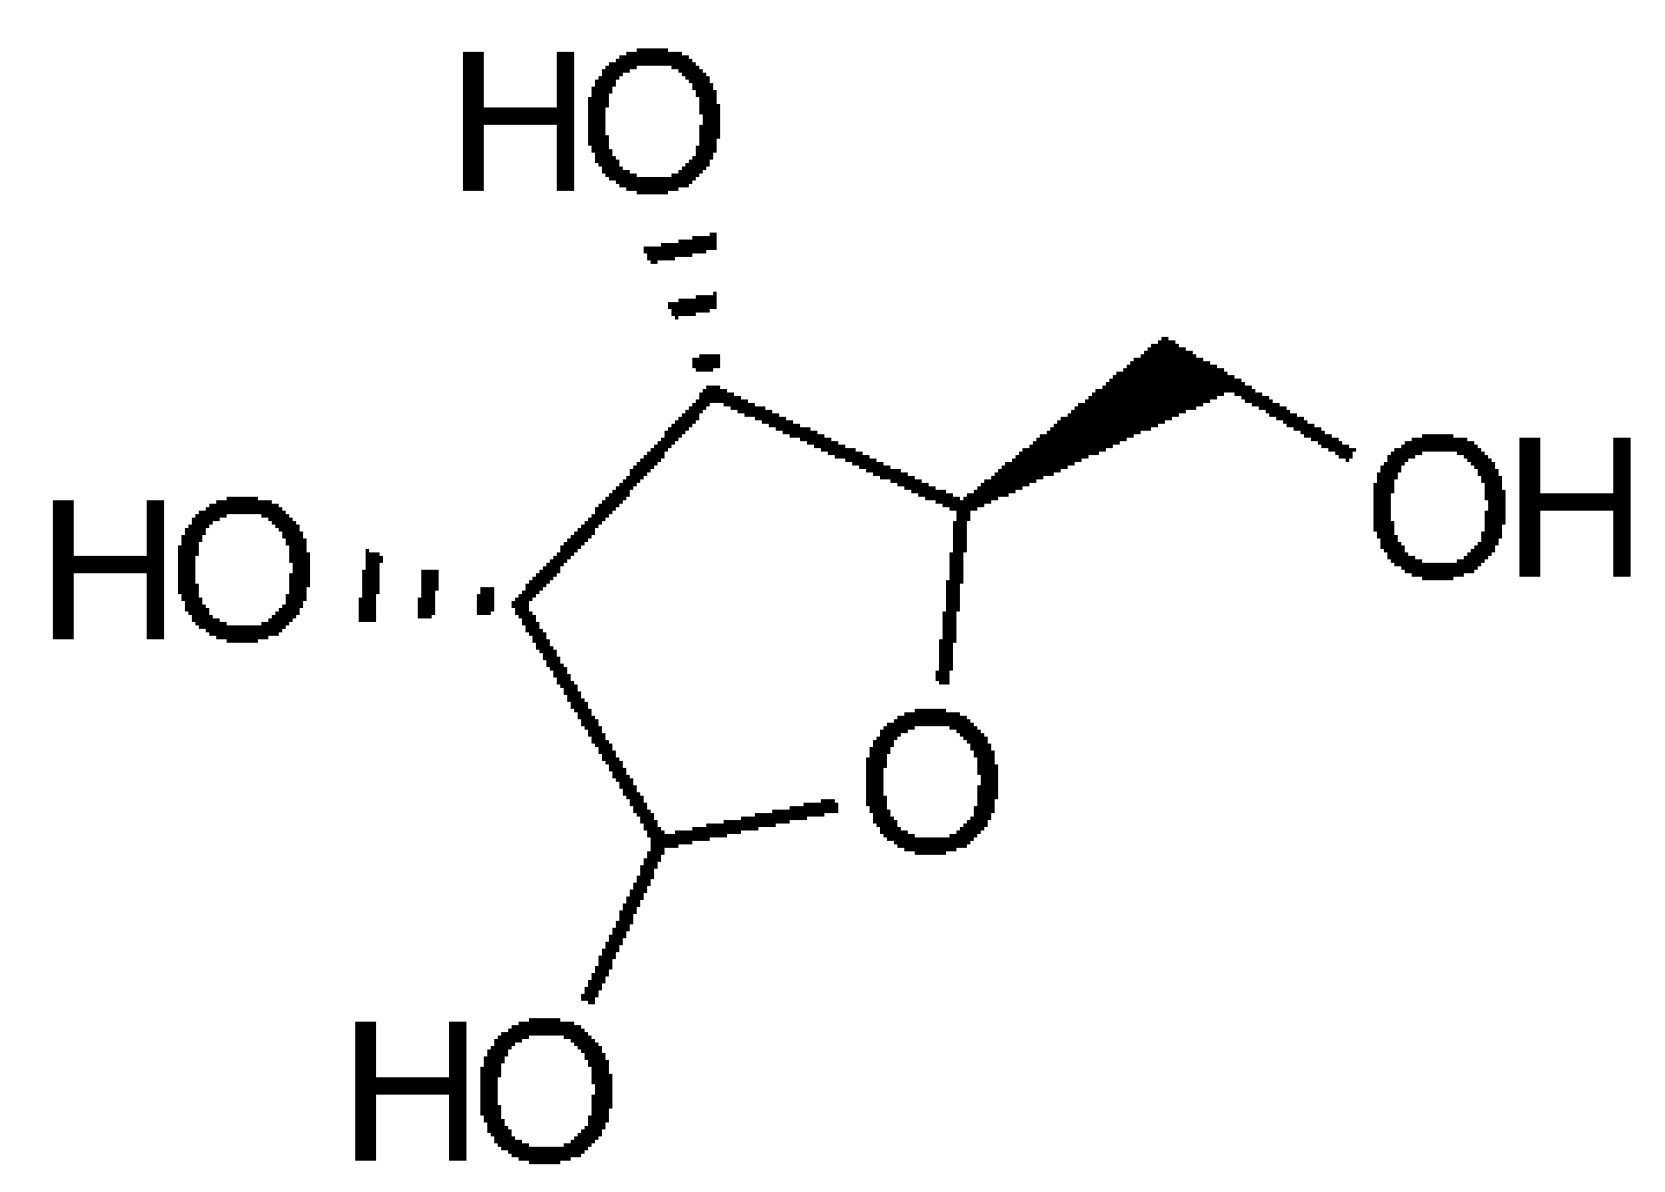
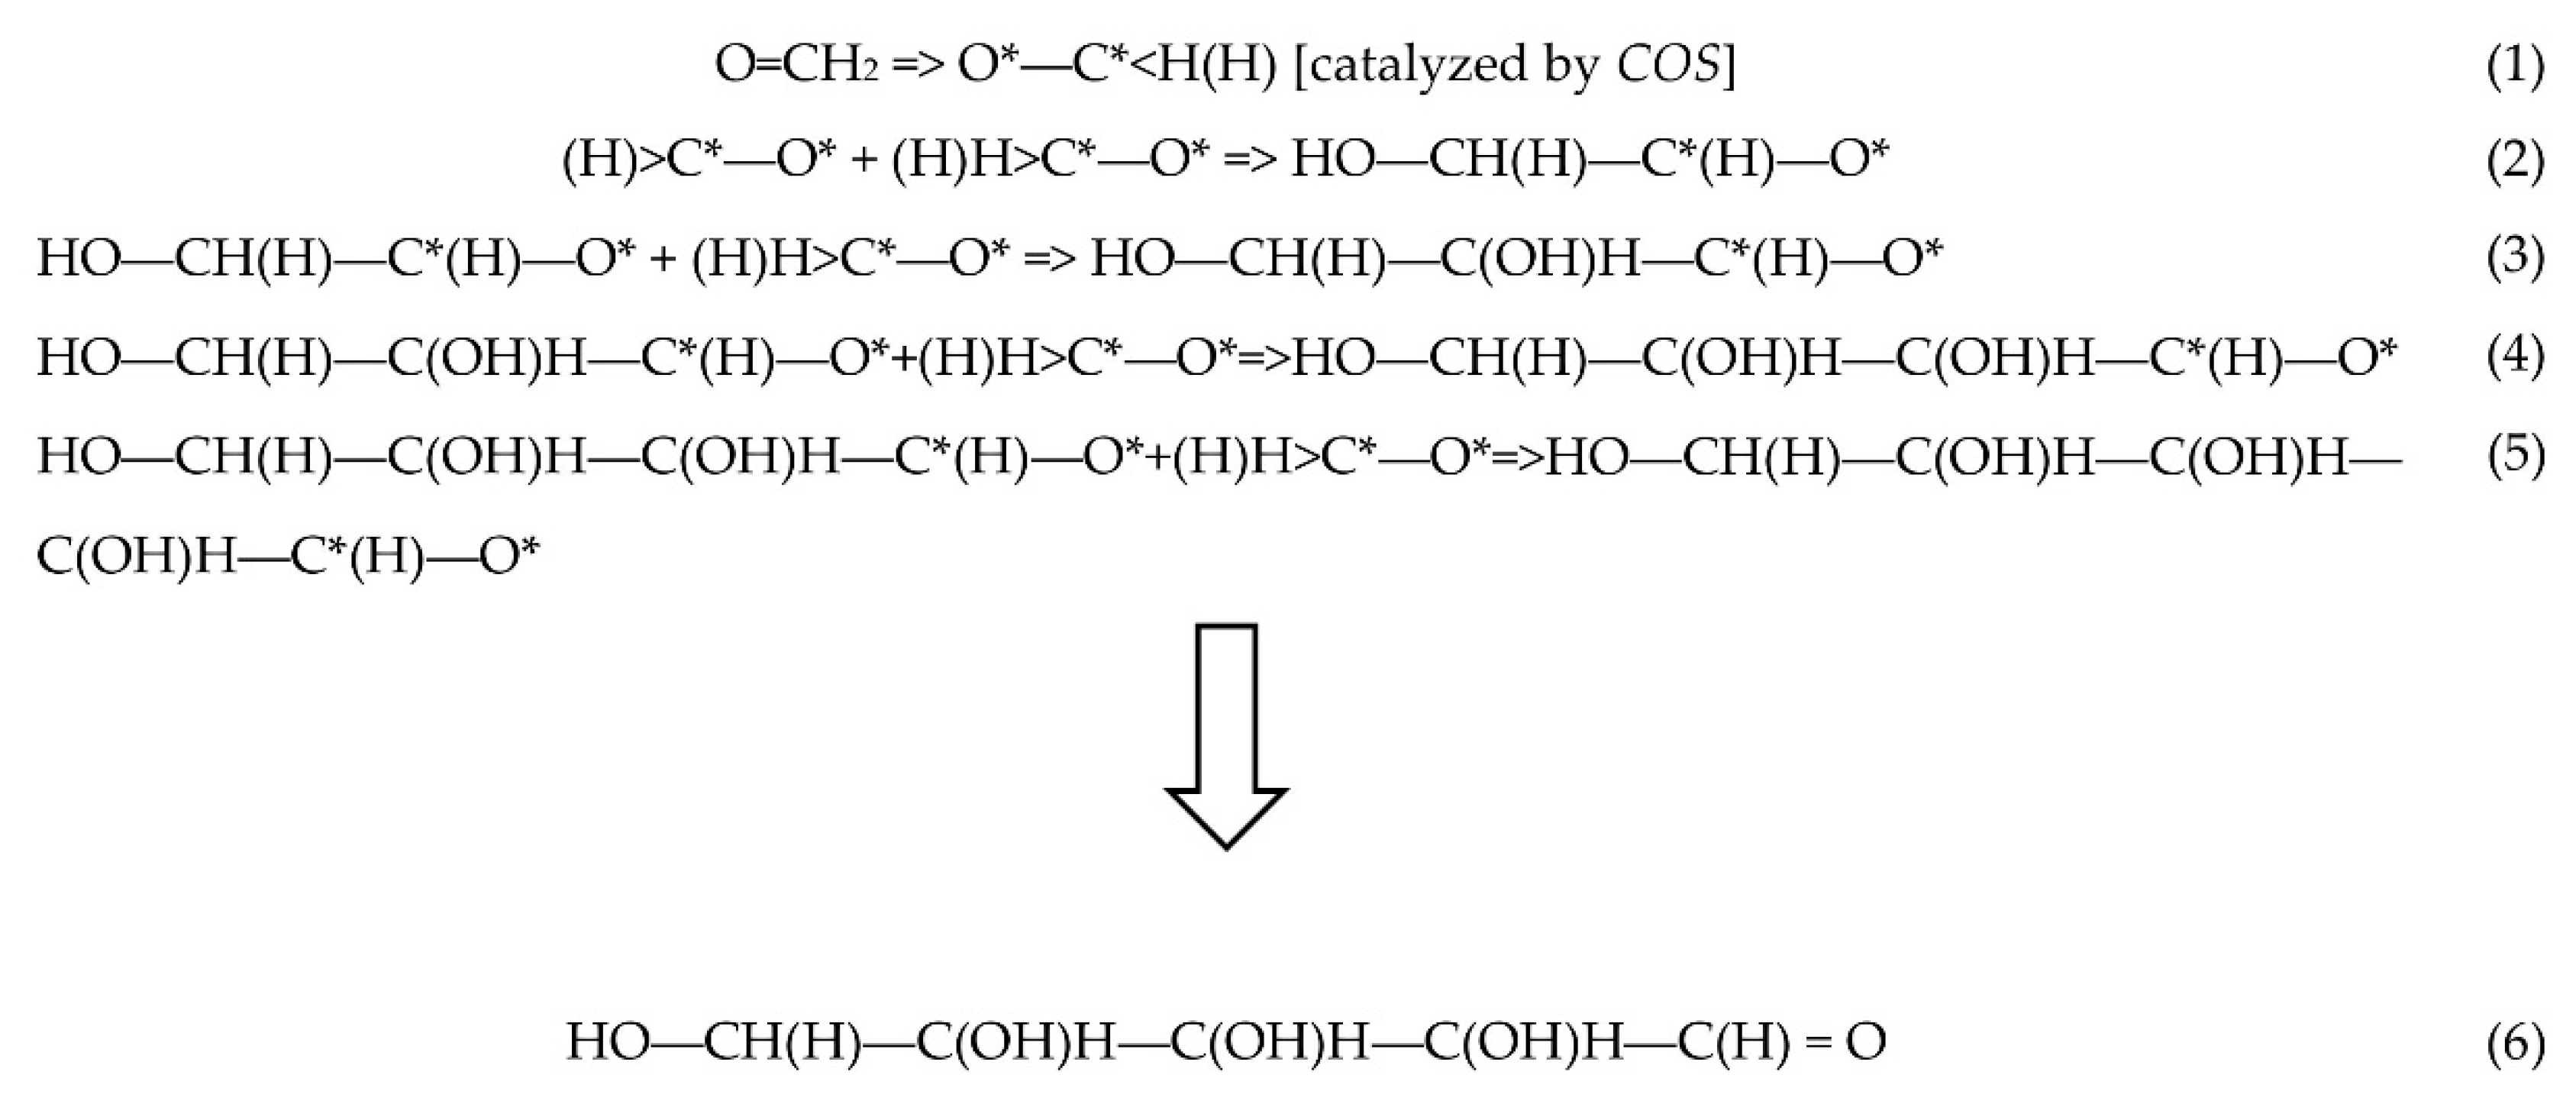
A SET Approach to the Synthesis of Ribose
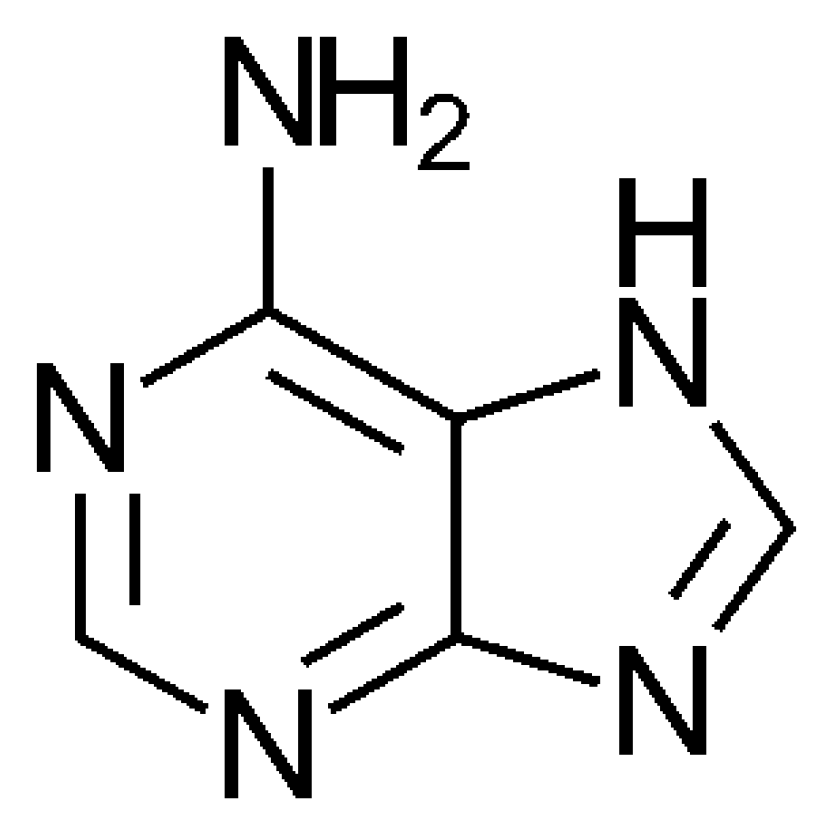
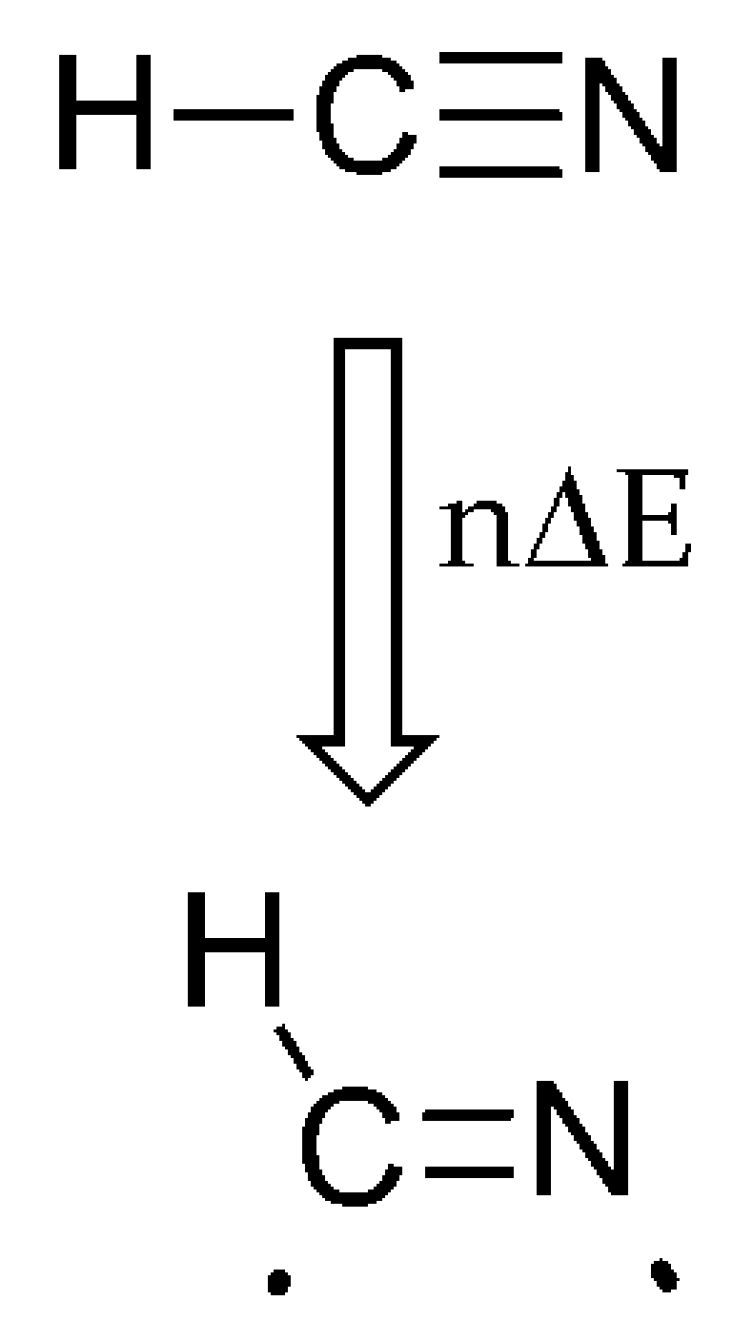
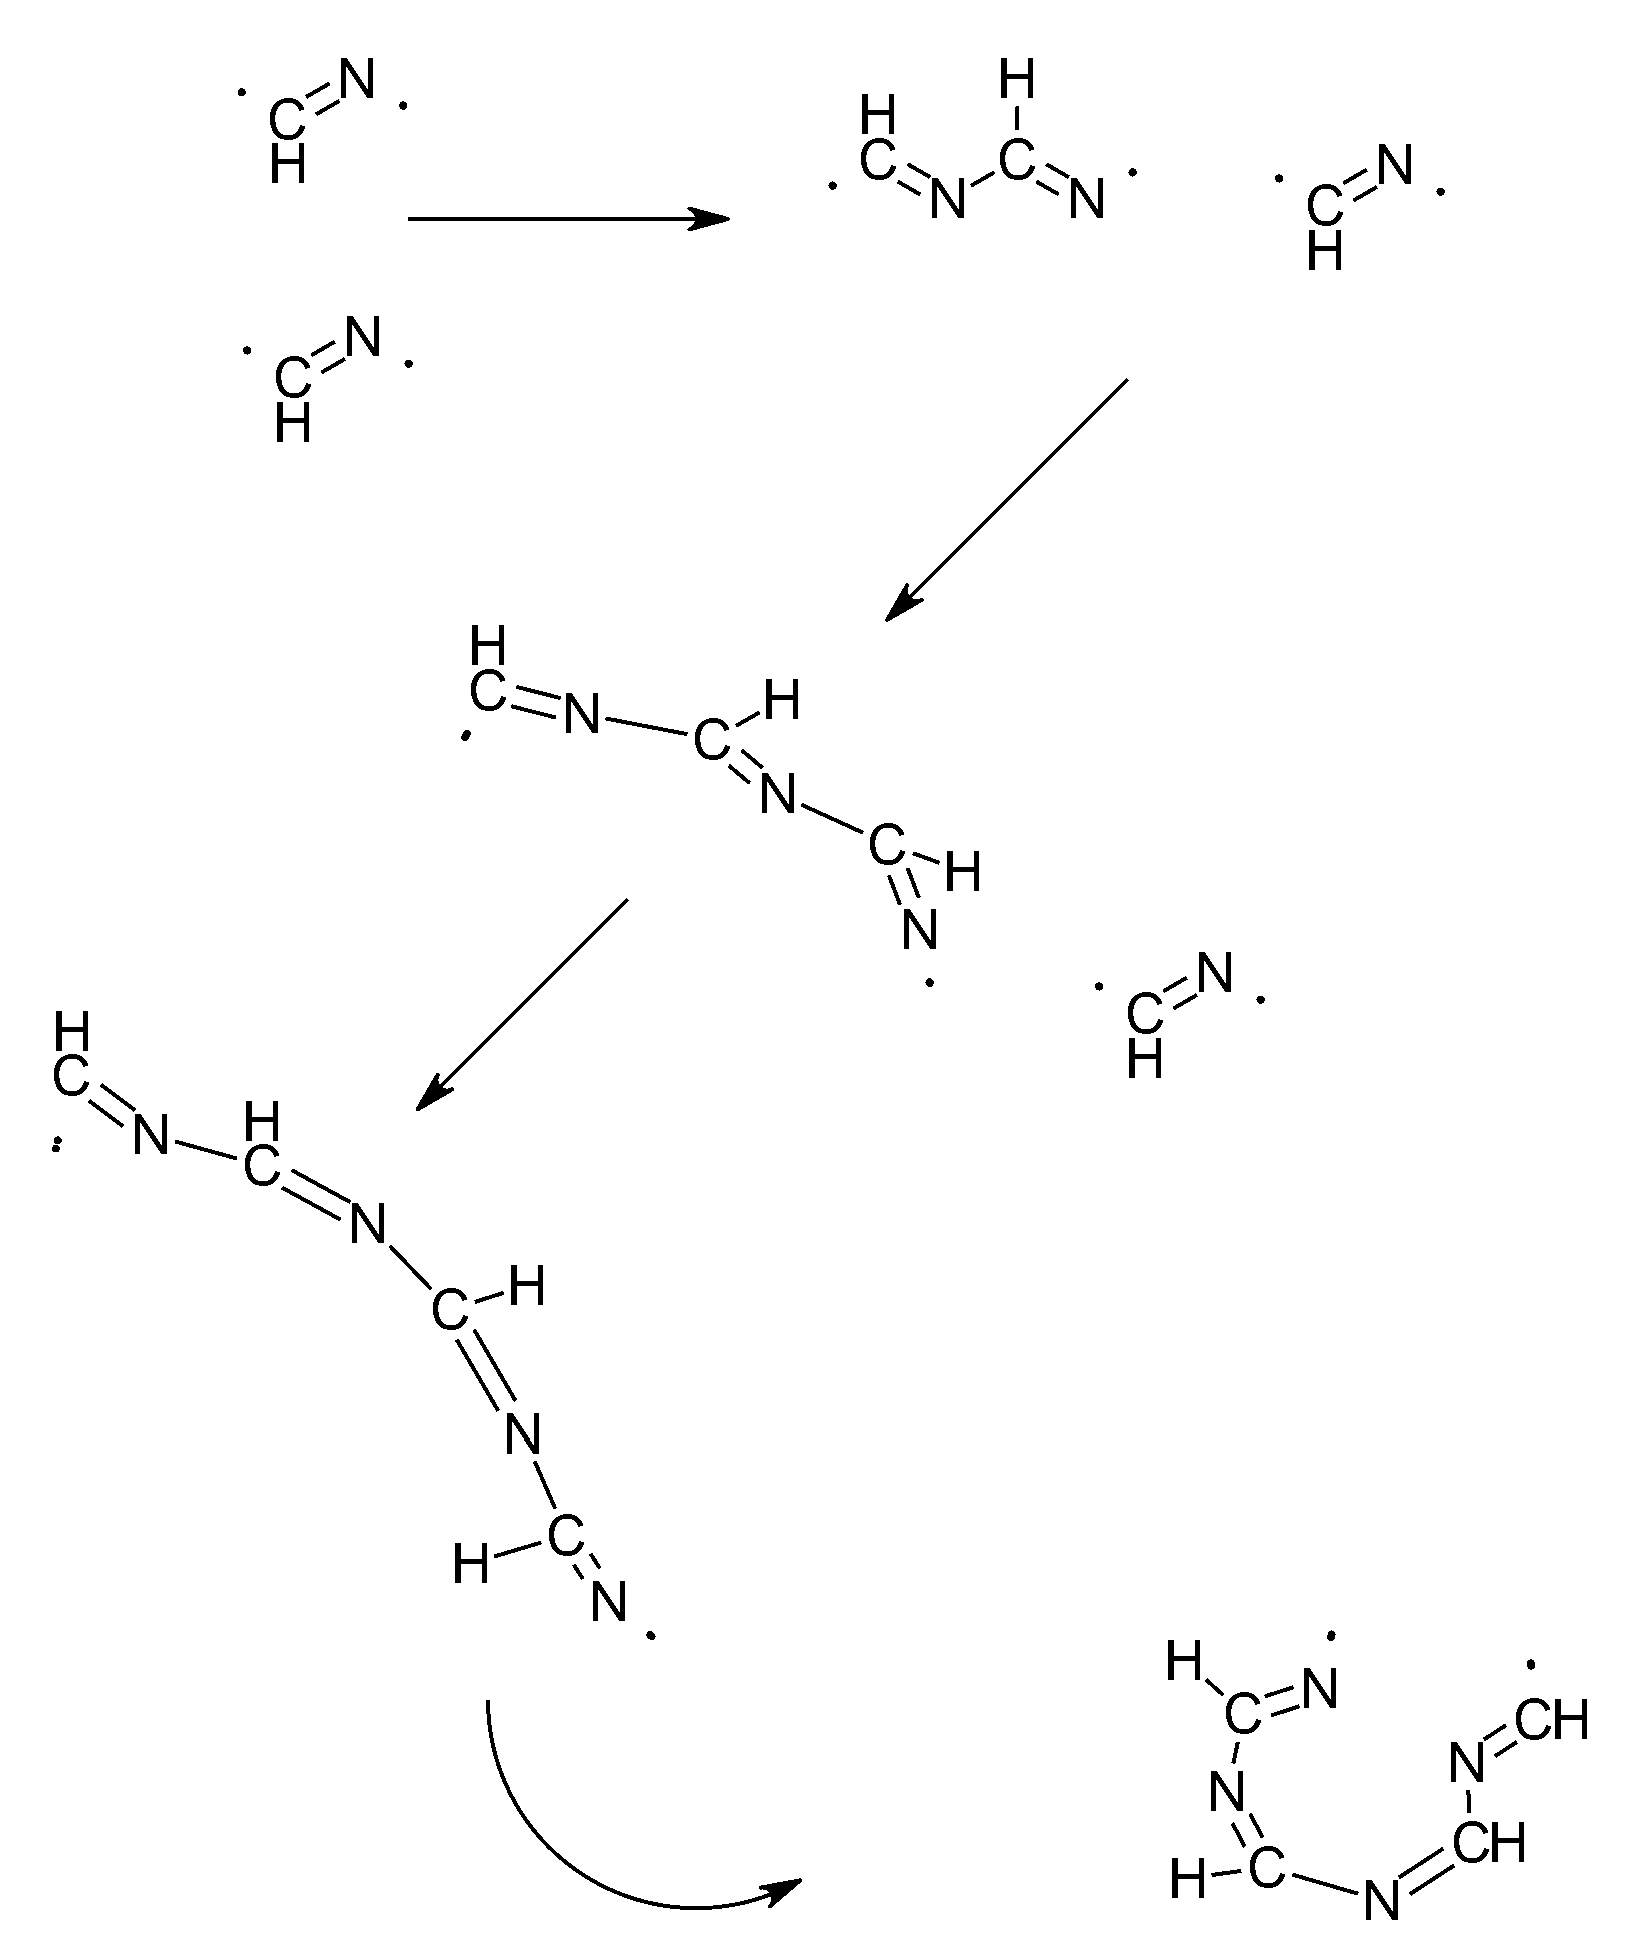
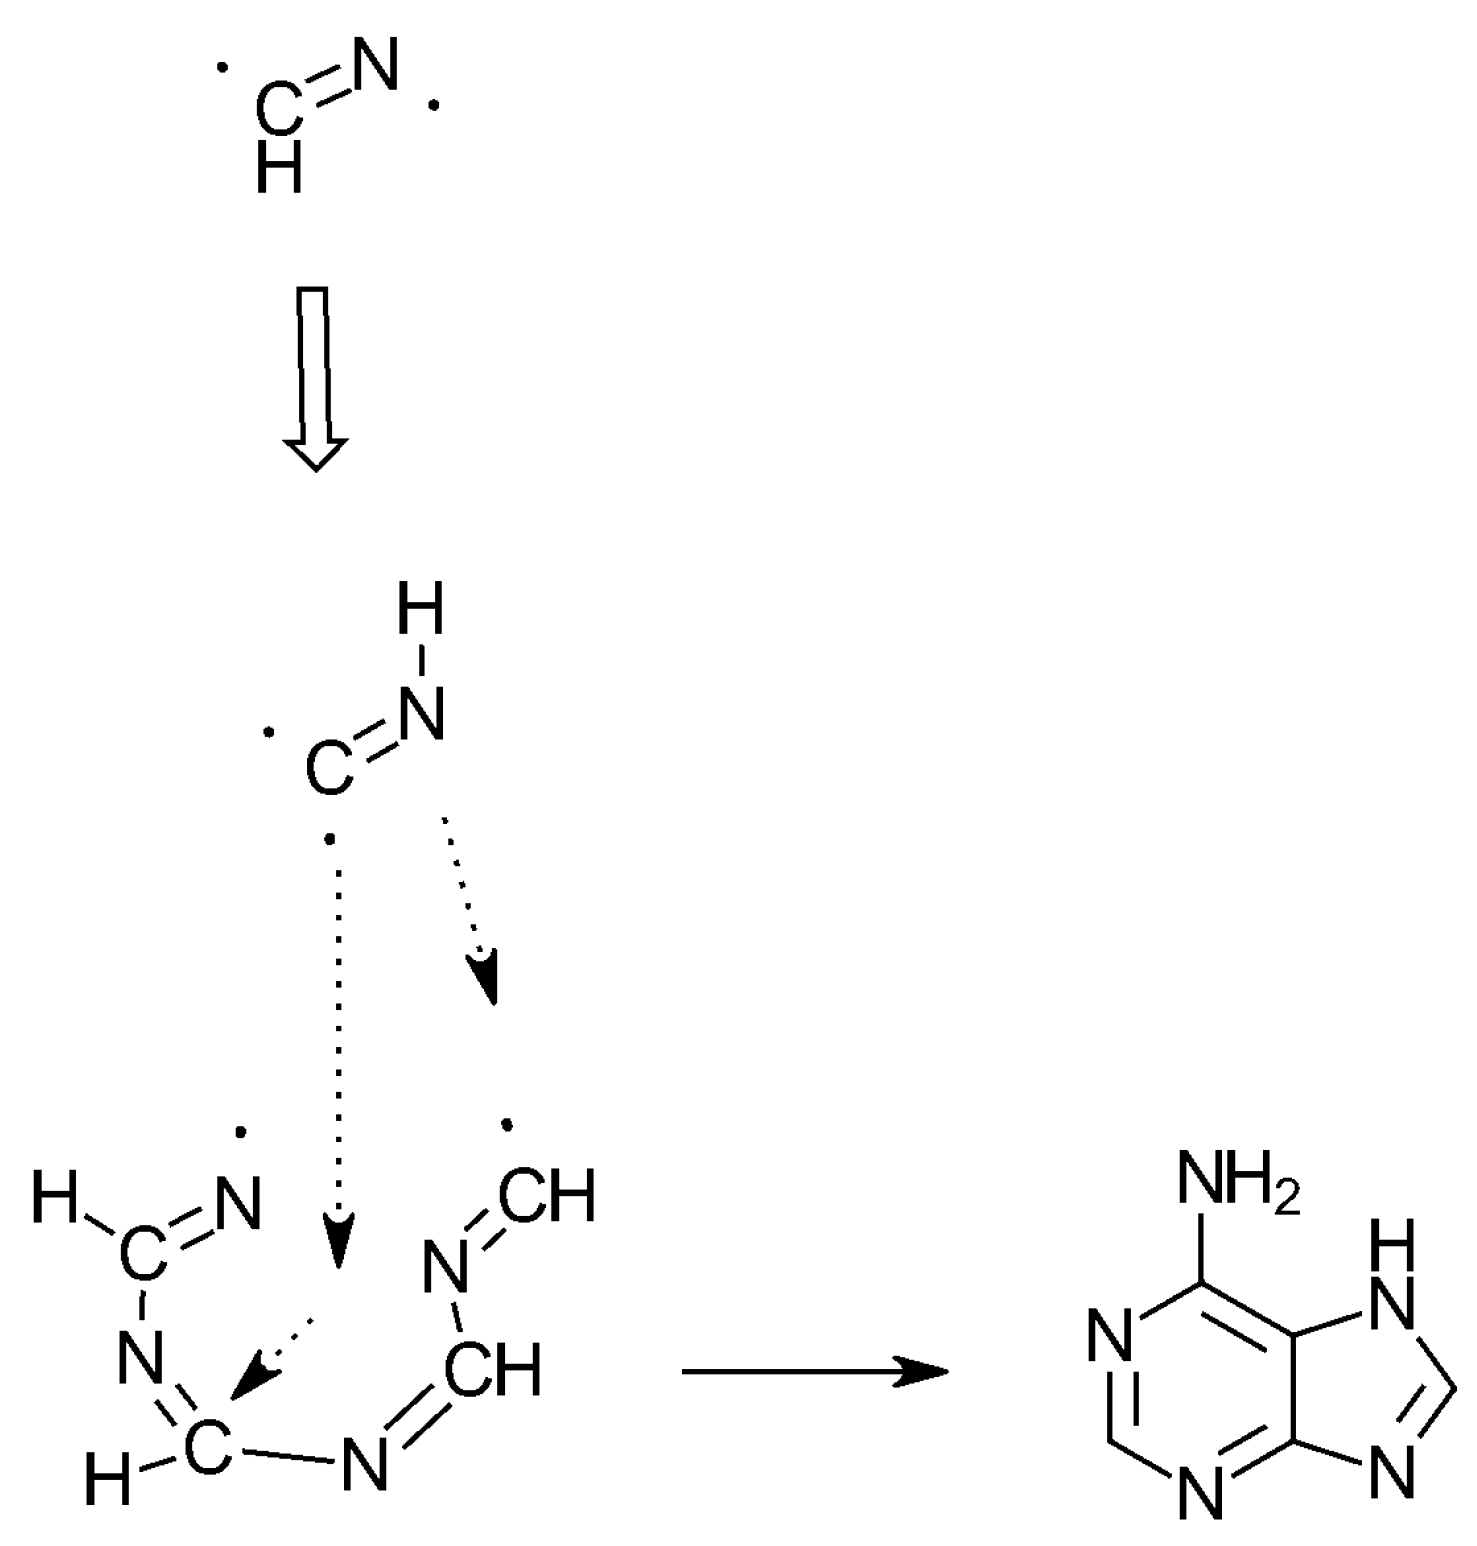
3. The SET Synthesis of Adenine from Hydrogen Cyanide (HCN)
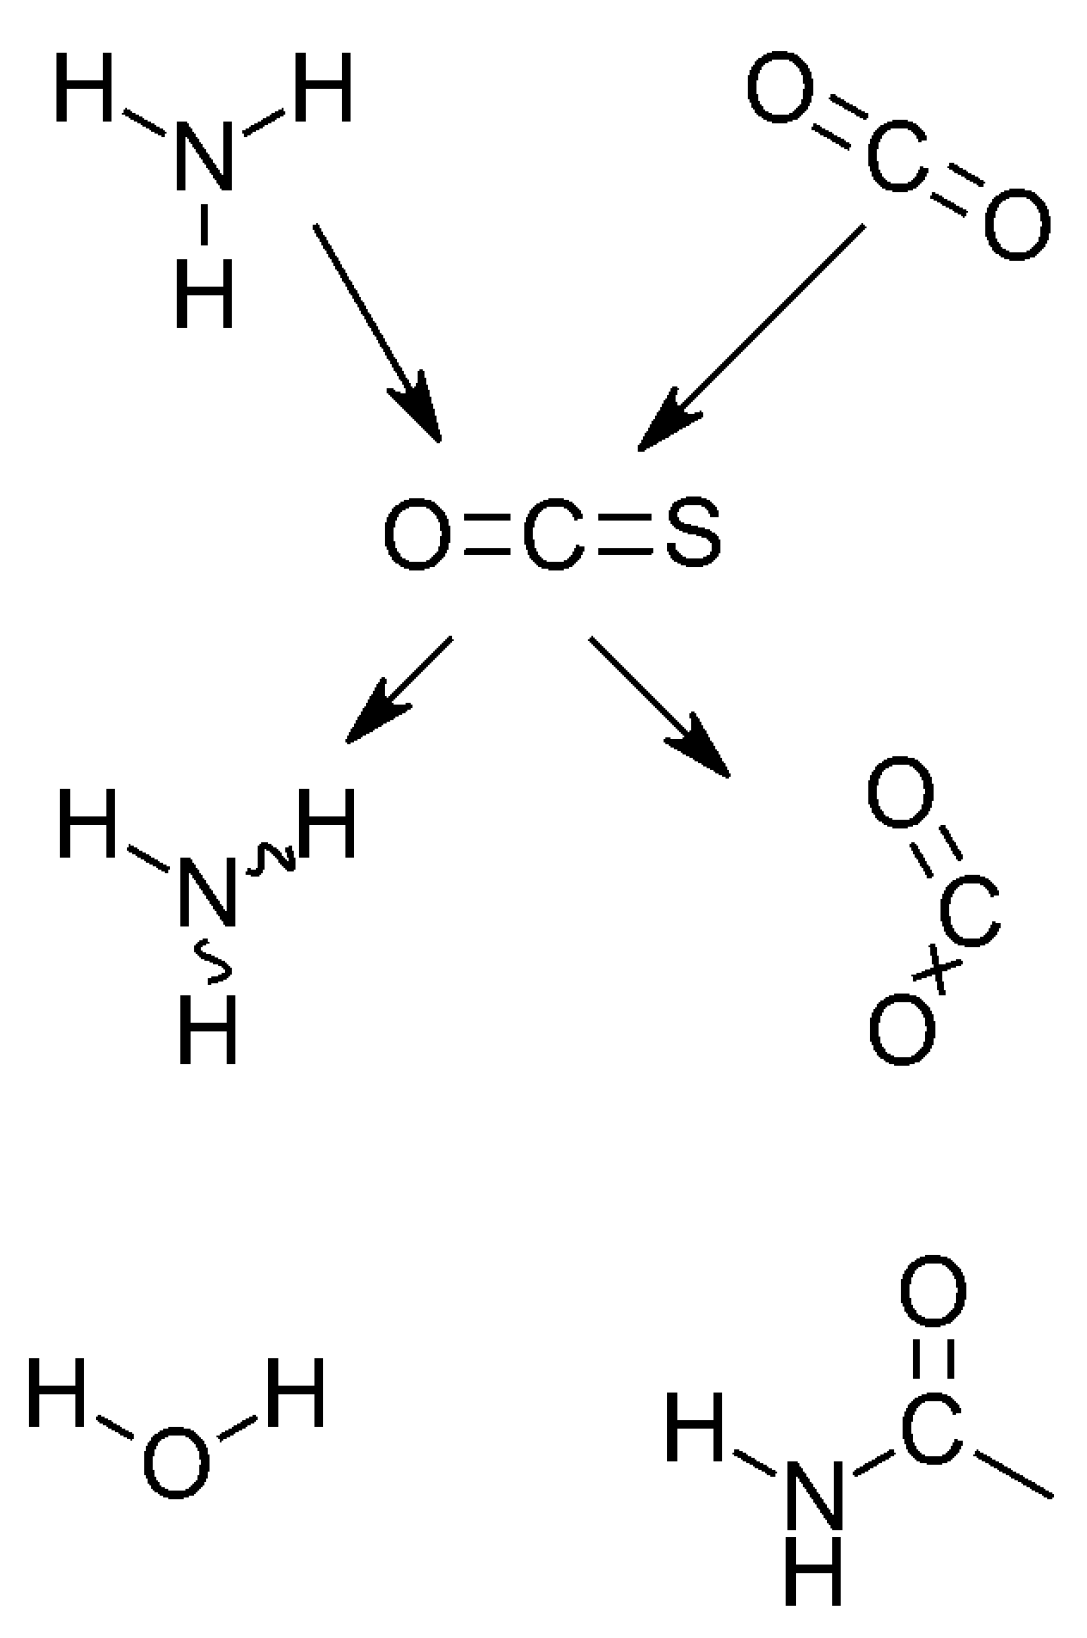
3.1. Splitting One Oxygen Atom From CO2
3.1.1. Carbon Dioxide Degradation
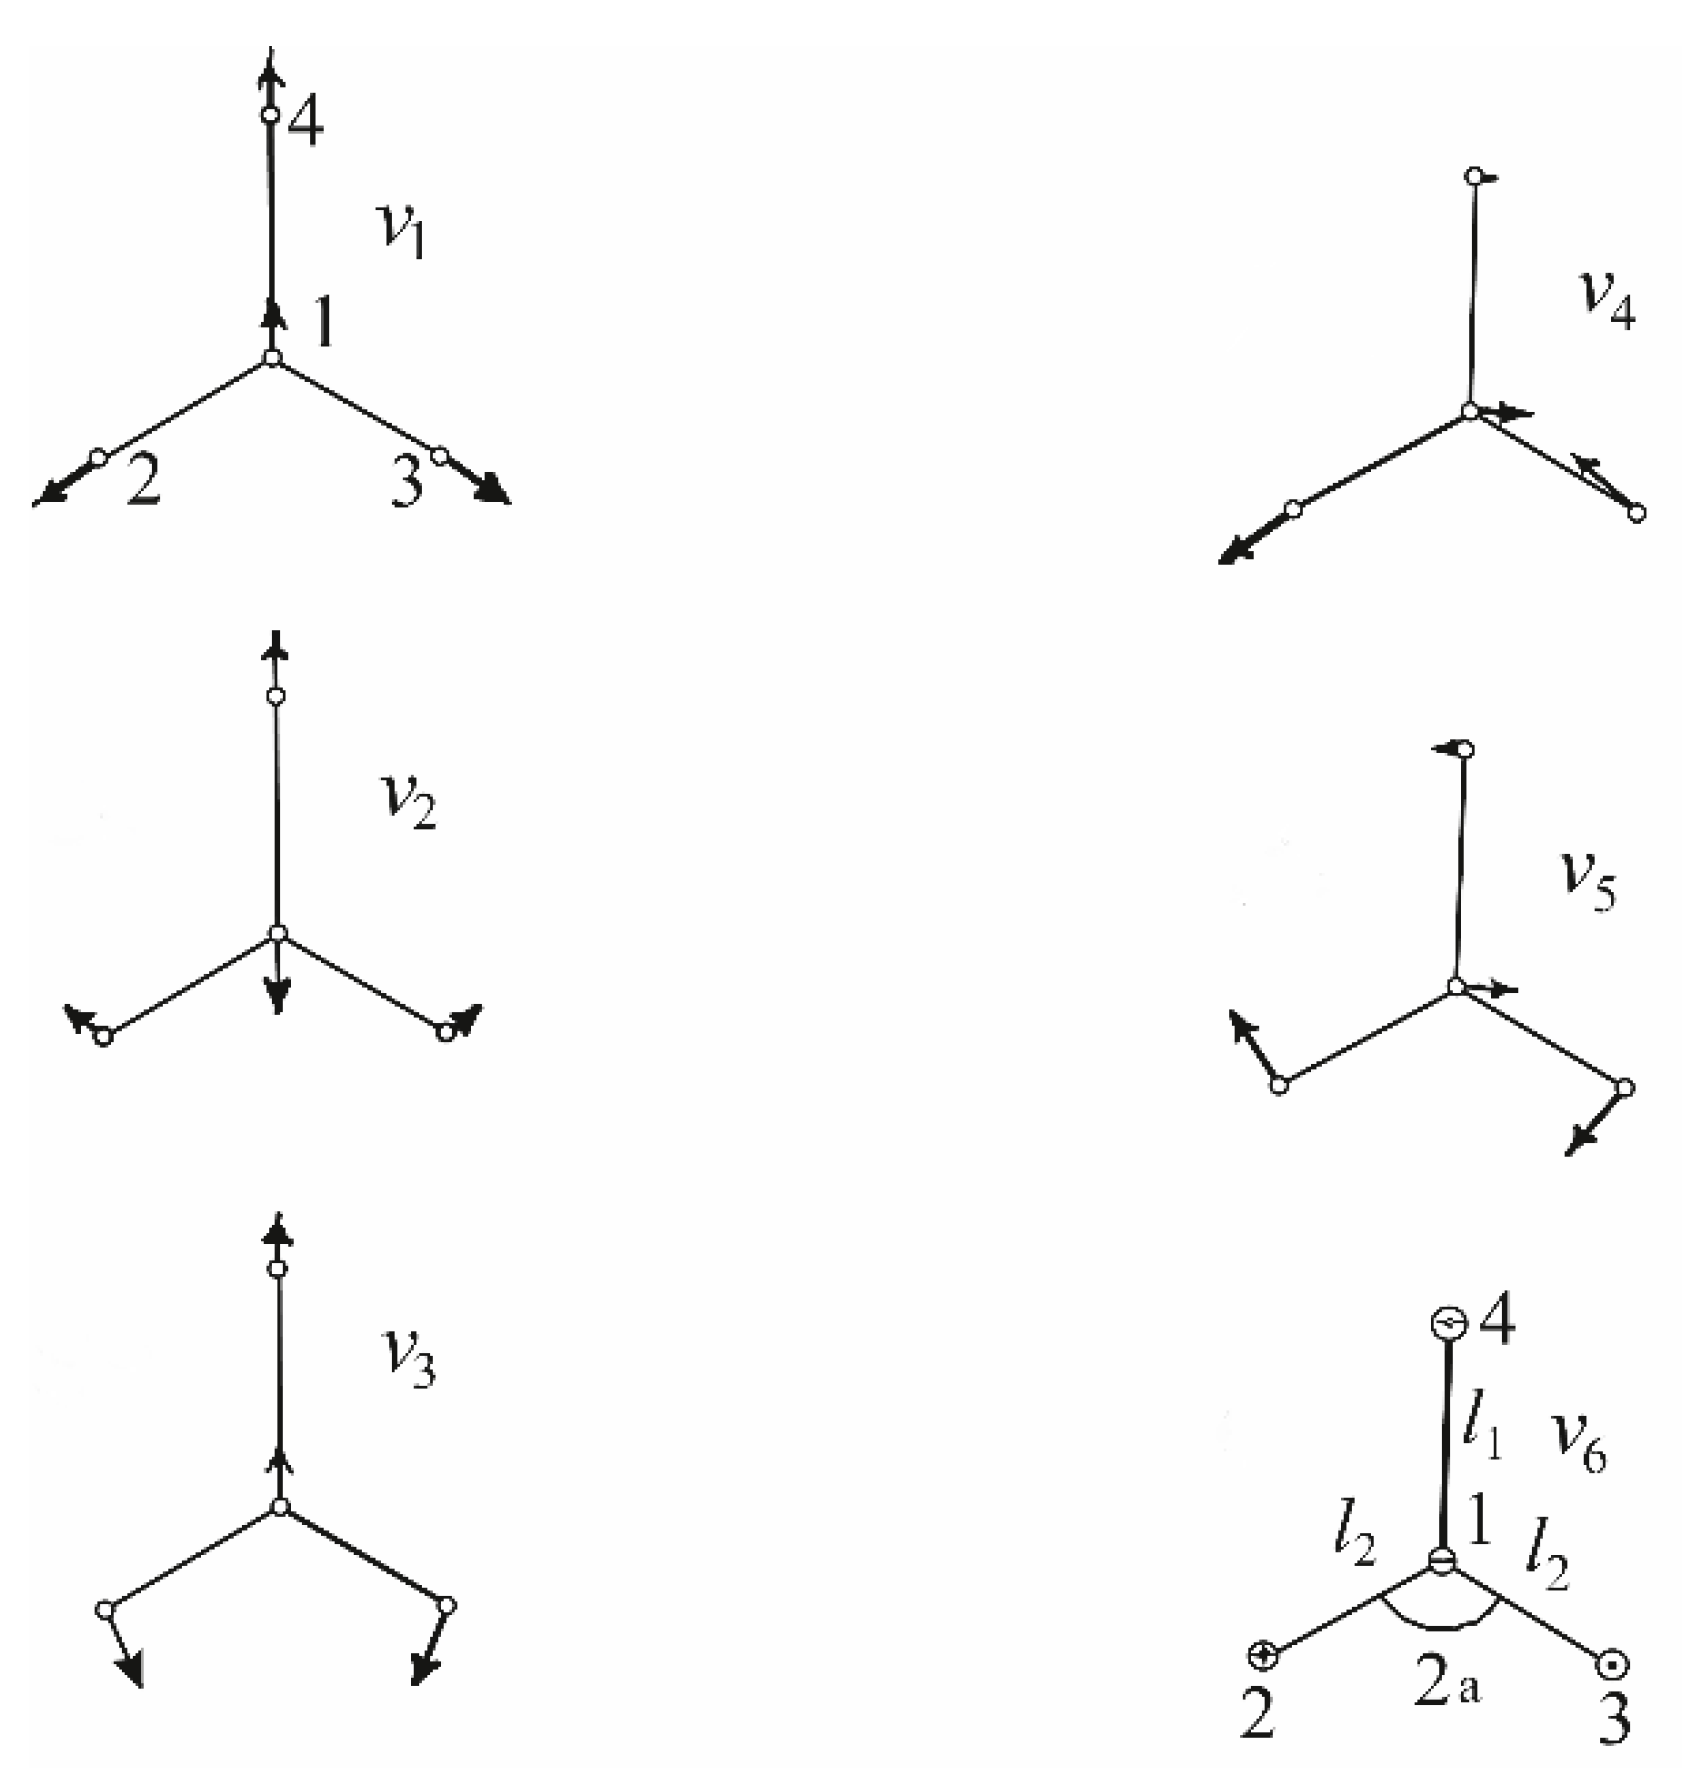
3.1.2. Ammonia Vibration Modes
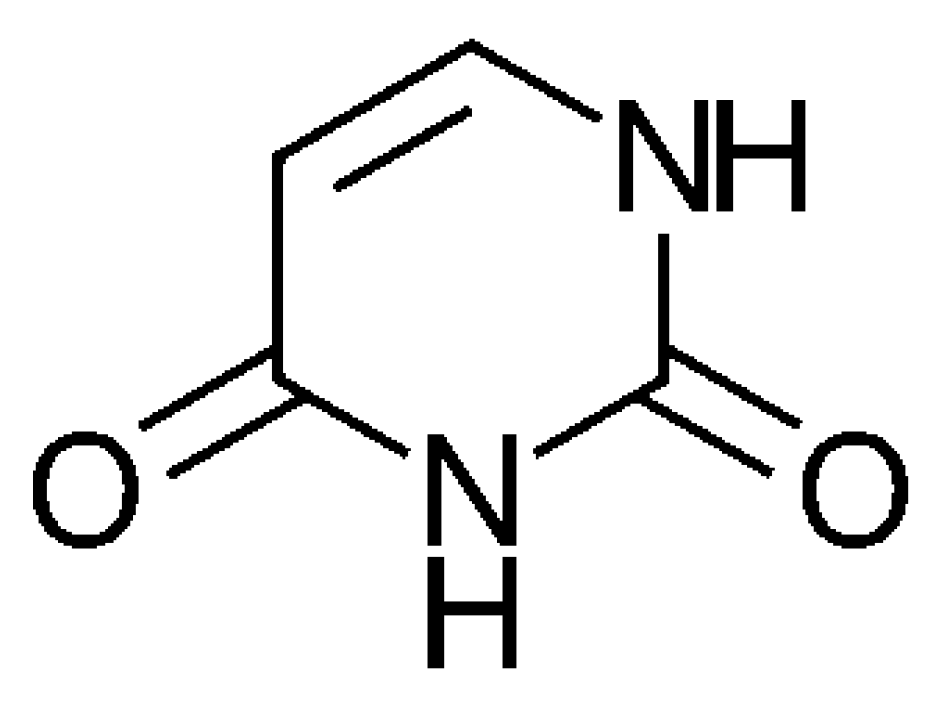
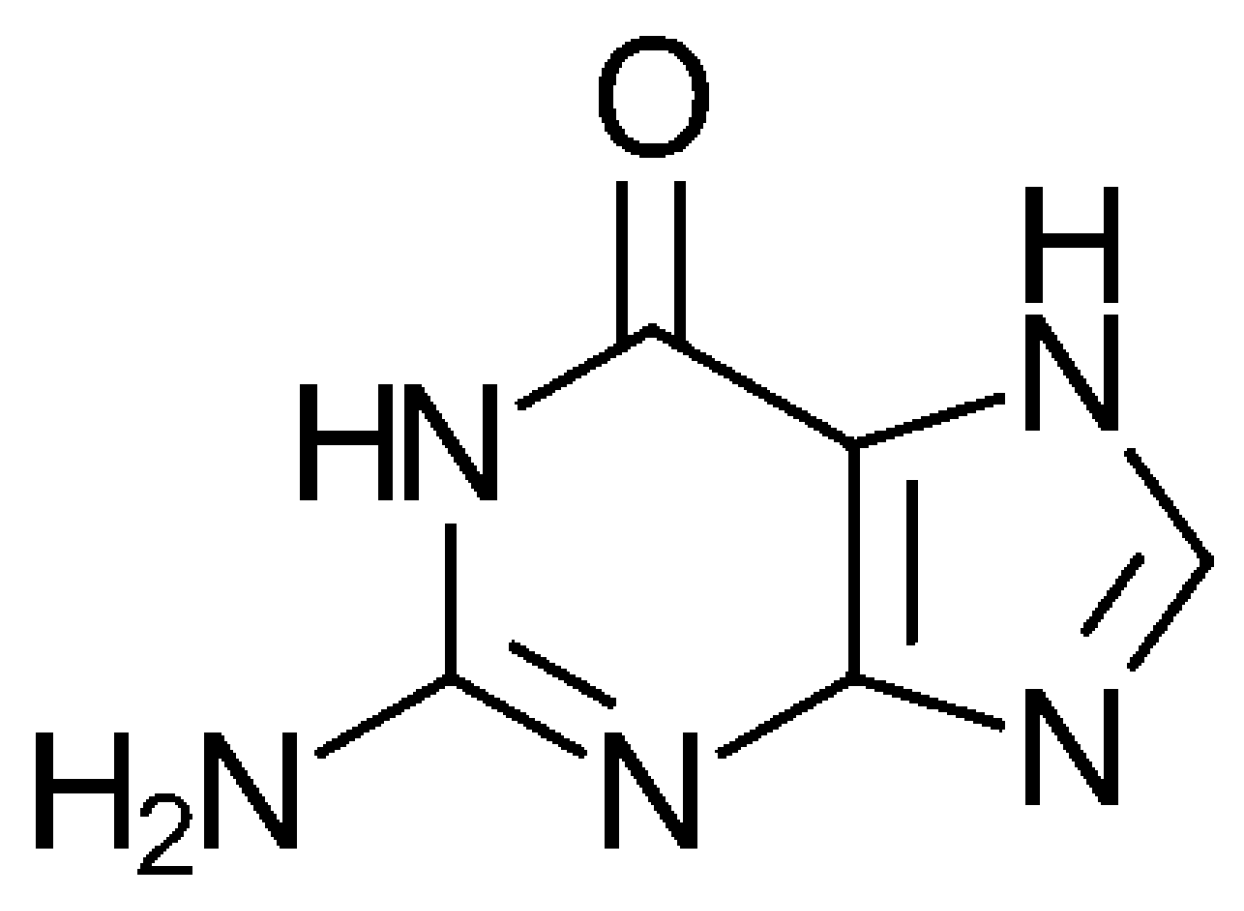
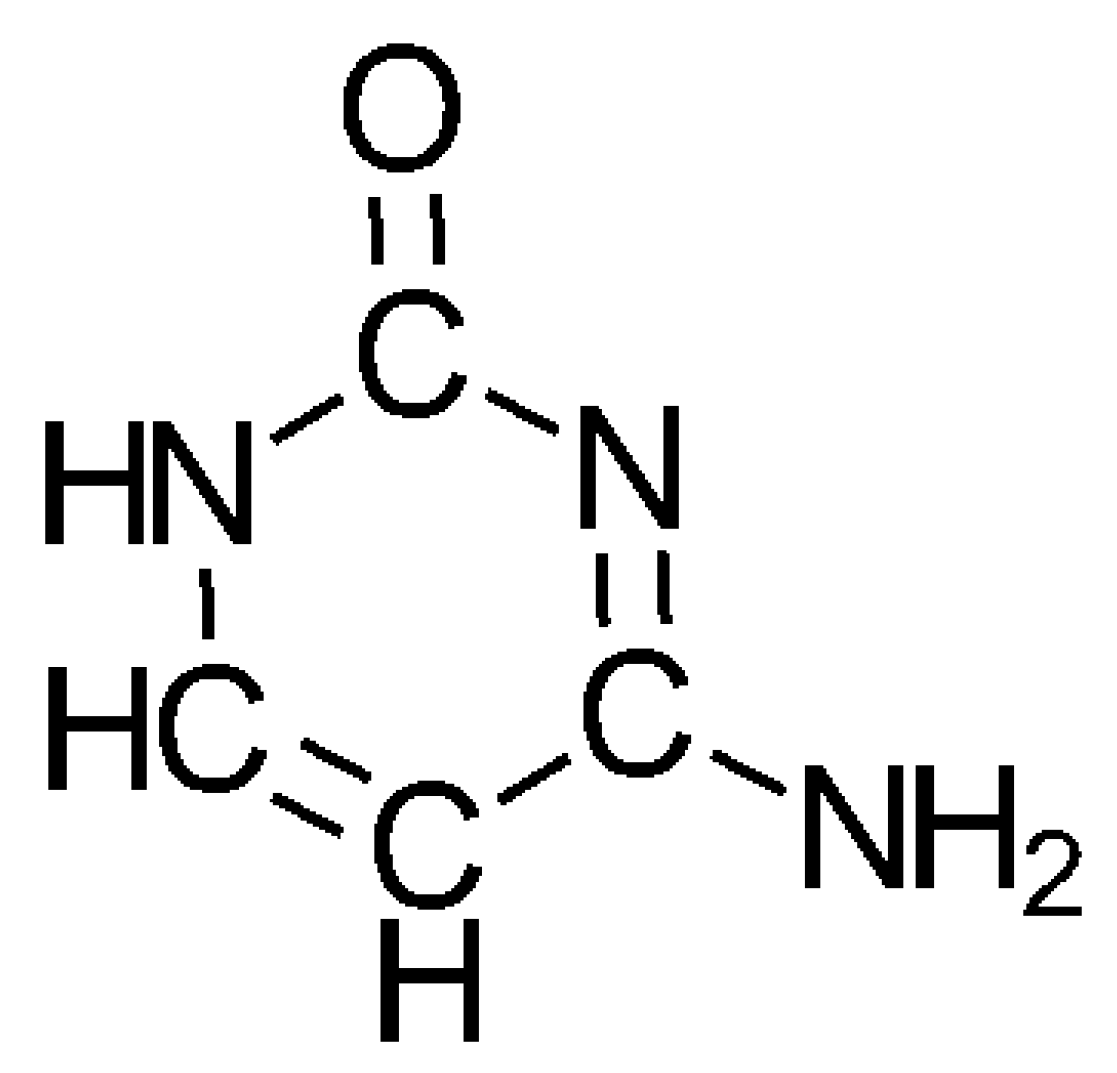
3.2. The Formation of the Oxygen-Containing Nucleobases Uracil, Guanine, and Cytosine from a SET Point of View
4. Additions to the Ribose Structure
4.1. Phosphorylation of Carbohydrates, e.g., Glucose and Ribose
4.1.1. Glucose
4.1.2. Ribose
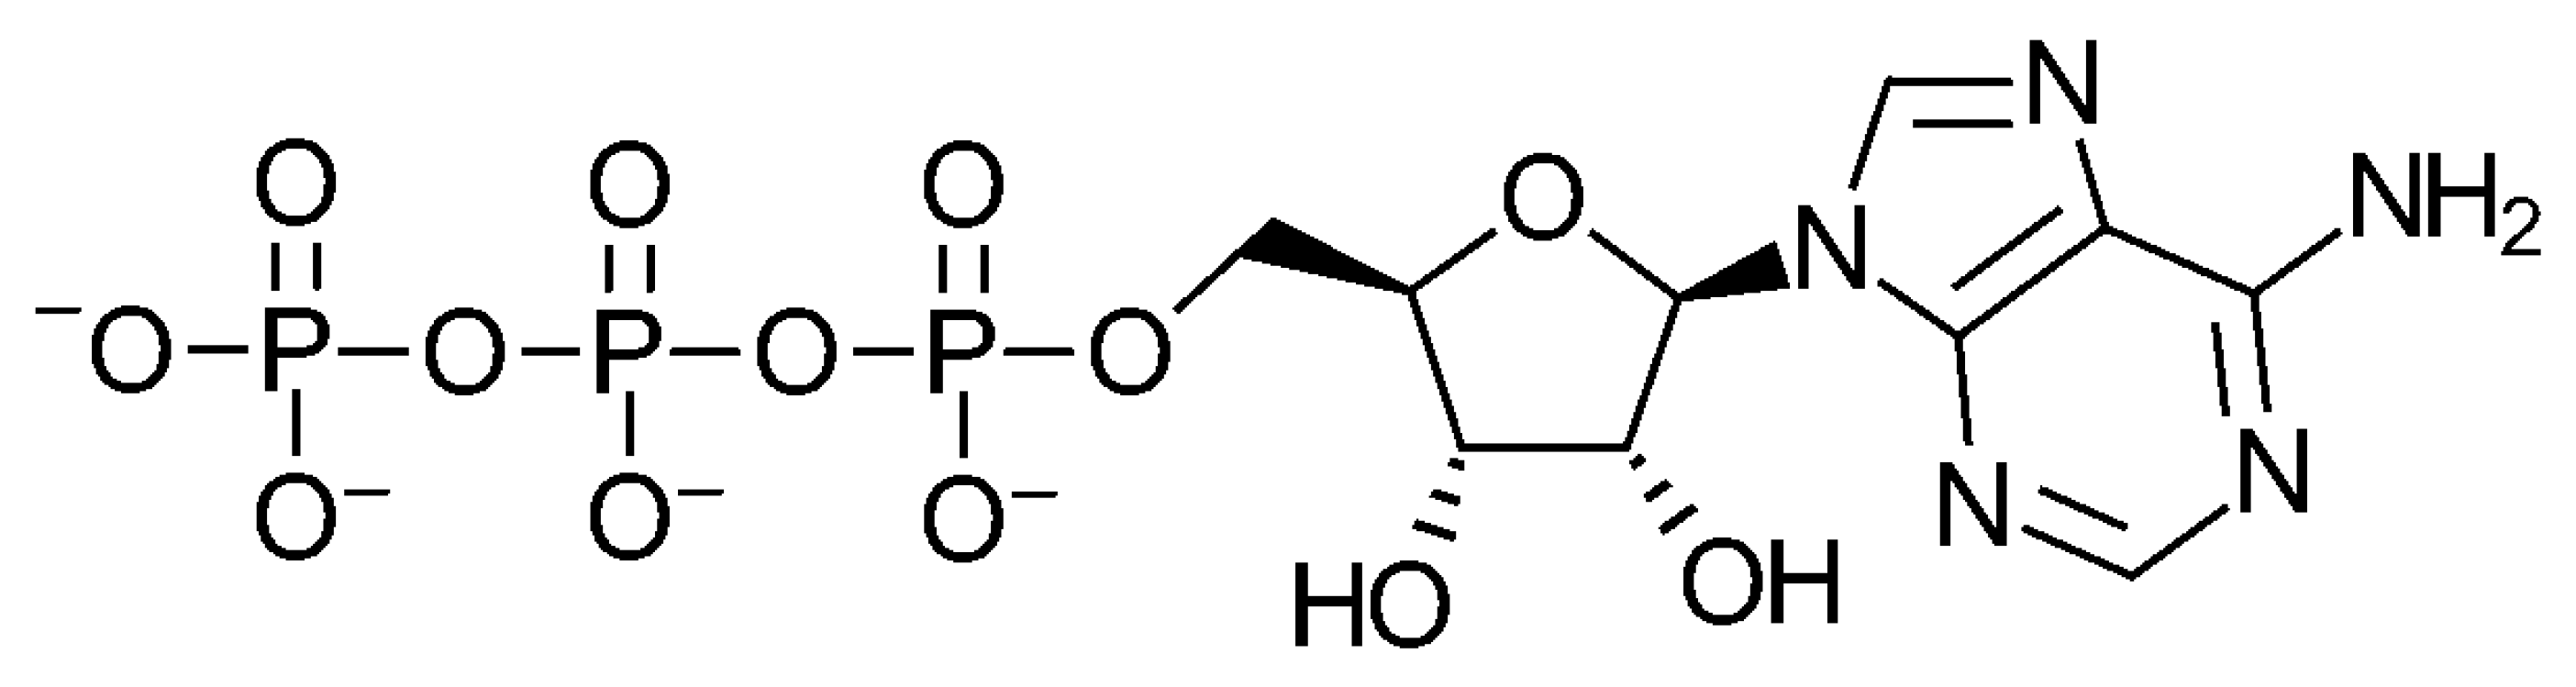
4.2. The Attachment of Adenine to Ribose
4.3. Total Synthesis
5. Conclusions
Author Contributions
Funding
Acknowledgments
Conflicts of Interest
References
- Larsson, R.; Malek, A. The transformation by catalysis of prebiotic systems to useful biochemicals: A perspective based on IR spectroscopy of the primary chemicals. I. The Synthesis of Peptides by the Condensation of Amino Acids. Appl. Sci. 2019, 10, 928. [Google Scholar] [CrossRef] [Green Version]
- Larsson, R. A Model of Selective Energy Transfer at the Active Site of the Catalyst. J. Mol. Catal. 1989, 55, 70–83. [Google Scholar] [CrossRef]
- Larsson, R. Concluding remarks on the theory of selective energy transfer and exemplification on a zeolite kinetics study. Monatsh. Chem. 2013, 144, 21–28. [Google Scholar] [CrossRef]
- Larsson, R. A SET Approach to the Interplay of Catalysts and Reactants. Catalysts 2018, 8, 97. [Google Scholar] [CrossRef] [Green Version]
- Kittel, C.; Knight, W.D.; Ruderman, M.A. Mechanics; Berkeley Physics Course; McGraw-Hill: New York, NY, USA, 1966; Volume 1, Chapter 7. [Google Scholar]
- Larsson, R. On the Stepwise Change of the Activation Energy of Catalytic Reactions. Z. Phys. Chemie, Leipzig 1987, 268, 721–732. [Google Scholar] [CrossRef]
- NIST Chemistry Webbook. Available online: http://webbook.nist.gov/chemistry (accessed on 14 November 2014).
- Herzberg, G. Spectra of Diatomic Molecules, 1st ed.; Van Nostrand Co., Inc.: New York, NY, USA, 1950. [Google Scholar]
- Keane, M.A.; Larsson, R. Isokinetic behavior in gas phase catalytic hydrodechlorination of chlorobenzene over supported nickel. J. Mol. Catal. 2007, 268, 87–94. [Google Scholar] [CrossRef]
- Herzberg, G. Molecular Spectra and Molecular Structure, II. Infrared and Raman Spectra of Polyatomic Molecules; D van Nostrand Company, Inc.: Princeton, NJ, USA, 1962. [Google Scholar]
- Oró, J. Mechanism of Synthesis of Adenine from Hydrogen Cyanide under Possible Primitive Earth Conditions. Nature 1961, 191, 1193–1194. [Google Scholar] [CrossRef]
- Voet, A.B.; Schwartz, A.W. Prebiotic adenine synthesis from HCN. Evidence for a newly discovered major pathway. Bioorg. Chem. 1983, 12, 8–17. [Google Scholar] [CrossRef]
- Jung, S.H.; Choe, J.C. Mechanisms of prebiotic adenine synthesis from HCN by oligomerization in the gas phase. Astrobiology 2013, 13, 465–475. [Google Scholar] [CrossRef]
- Frost, R.L.; Xi, Y.; Scholtz, R.; Lopez, A.; Belatti, F.M. Vibrational spectroscopic characterization of the phosphate mineral hureaulite–(Mn,Fe)5(PO4)2(HPO4)2*4 (H2O). Vib. Spectrosc. 2013, 66, 69–75. [Google Scholar] [CrossRef] [Green Version]
- Mejoo, S.; Maneeprakorn, W.; Winotai, P. Phase and thermal stability of nanocrystalline hydroxyapatite prepared via microwave heating. Thermochim. Acta 2006, 447, 115–120. [Google Scholar] [CrossRef]
- Kovacs, A.; Ivanov, A.Y. Vibrational Analysis of D-Glucose Trapped in Ar-Matrix. J. Phys. Chem. B 2009, 113, 2151–2159. [Google Scholar] [CrossRef] [PubMed]
- Ibrahim, M.; Alaam, M.; El-Haes, H.; Jalbout, A.F.; de Leon, A. Analysis of the structure and vibrational spectra of glucose and fructose. Ecletica Quimica 2006, 31, 15–21. [Google Scholar] [CrossRef]
- Vasko, P.D.; Blackwell, J.; Koenig, J.L. Infrared and Raman Spectroscopy of Carbohydrates. Part II: Normal Coordinate Analysis of D-Glucose. Carbohydr. Res. 1972, 23, 407–416. [Google Scholar] [CrossRef]
- Carmona, P.; Molina, M. Raman and infrared spectra of D-ribose and D-ribose 5- phosphate. J. Raman Spectrosc. 1990, 21, 395–400. [Google Scholar] [CrossRef]
- Mathlouthi, M.; Seuvre, A.M.; Koenig, J.L.F.T.-I.R. Laser-Raman spectra of D-Ribose and 2-Deoxy-D-erythro-Pentose (2-Deoxy-D-Ribose). Carbohydr. Res. 1983, 122, 31–47. [Google Scholar] [CrossRef]
- Tipson, R.S.; Isbell, H.S. Infrared Absorption Spectra in the Study of Mutarotational Equilibria of Monosacharides. J. Res. NBS—A Phys. Chem. 1962, 66A, 31–58. [Google Scholar] [CrossRef]
- Lopes, R.P.; Valero, R.; Tomkinson, J.; Marques, M.P.M.; de Carvalino, L.A.E.B. Applying vibrational spectroscopy to the study of nucleobases—Adenine as a case-study. New J. Chem. 2013, 37, 2691–2699. [Google Scholar] [CrossRef] [Green Version]
- De Duve, C. Vital Dust: Life as a Cosmic Imperative; Basic Books: New York, NY, USA, 1995. [Google Scholar]
- Luisi, P.L.; Walde, P.; Oberholzer, T. Enzymatic RNA synthesis in self-reproducing vesicles: An approach to the construction of a minimal synthetic cell. Ber. Bunsenges. Phys. Chem. 1994, 98, 1160–1165. [Google Scholar] [CrossRef]
- Adamala, K.; Szostak, J.W. Nonenzymatic Template-Directed RNA Synthesis Inside Model Protocells. Science 2013, 242, 1098–1100. [Google Scholar] [CrossRef] [Green Version]
- Powner, M.W.; Gerland, B.; Sutherland, J.D. Synthesis of activated pyrimidine ribonucleotides in prebiotically plausible conditions. Nature 2009, 459, 239–242. [Google Scholar] [CrossRef] [PubMed]
- Patel, B.H.; Percivalle, C.; Ritson, D.J.; Duffy, C.D.; Sutherland, J.D. Common origins of RNA, protein, and lipid precursors in a cyanosulfidic protometabolism. Nat. Chem. 2015, 7, 301–307. [Google Scholar] [CrossRef] [PubMed] [Green Version]


| Assignment | ν cm−1 | R.C. = 2079/ν | Δ% | ω/ν |
|---|---|---|---|---|
| ν 6 | 1167 | 1.781 | 3.1 | 7:4 |
| ν 5 | 1280 | 1.624 | 4.3 | 5:3 |
| ν 3 | 1503 | 1.383 | 5.0 | 4:3 |
| ν 2 | 1743.6 | 1.192 | 0.67 | 6:5 |
| 2 ν 6 | 2081 | - | 0.1 | 1:1 |
| ν 1 | 2780 | 0.748 | 0.27 | 3: 4 |
| ν 4 | 2874 | 0.723 | 7.2 | 3:4 |
| 2ν 3 | 2973 | 0.699 | 6.9 | 2:3 |
| Uracil | Empirical Formula | C4H4N2O2 | |
|---|---|---|---|
| Substance added | Resulting Structure | Resulting empirical formula | Remaining formula |
| Two peptide groups |  | C2H2N2O2 | C2H2 |
 |  | C4H4N2O2 | H2 |
| Guanine | Empirical Formula | C5H5N5O | |
|---|---|---|---|
| Added substance | Resulting Structure | Resulting empirical formula | Remaining formula |
| One peptide group |  | CHNO | C4H4N4 |
| 3 HCN |  | C4H4N4O | HCN |
| HNC |  | - | - |
| - |  | C5H5N5O | - |
| Cytosine | Empirical Formula | C4H5N3O | |
|---|---|---|---|
| Added substance | Resulting Structure | Resulting empirical formula | Remaining formula |
| One peptide group |  | CHNO | C3H4N2 |
| HCN |  | C2H2N2O | C2H3N |
| NH3 =NH + H2 |  | C2H3N3O | C2H2 + H2 |
 |  | C4H5N3O | 2 H2 |
| Assignment | Glucose | Phosphate | References |
|---|---|---|---|
| PO43−/HPO42− asymmetric stretching | - | 1044 | [14] |
| PO43−asymmetric stretching. | - | 1046 | [15] |
| C-O-H | 1047 | - | [16] |
| ν CO + ν CC | 1050 | - | [17] |
| CO (79%) + CC (19%) PED | 1047 | - | [18] |
| Mean value | 1048 | 1045 | - |
| Row | Assignment | Ribose | Phosphate | R.C. | Δ ‰ | Reference |
|---|---|---|---|---|---|---|
| 1 | PO4 3−/HPO4 2− asymmetric stretching | - | 1044 | 1.991 | 4.5 | [14] |
| 2 | PO4 3− asymmetric stretching | - | 1046 | 1.988 | 6.0 | [15] |
| 3 | νC-O + ν(C–C),etc. | 1044 * | - | 1.982 | 9.0 | [19] |
| 4 | δ(O-C-H) | 1035 | - | 2.009 | 4.5 | [20] |
| 5 | Not assigned | 1041 | - | 1.997 | 1.5 | [21] |
| Mean value | 1040 | 1045 | - | - | - |
| Number | Assignment * | IR Vibration Frequency, cm−1 | Resonance Condition (R. C.) | Ideal Value | Deviation Δ (o/oo) |
|---|---|---|---|---|---|
| 1 | ν (N9-H) | 3016 | 0.689 | - | - |
| 2 | δ (N9-H) + 7 extra terms | 1603 | 1.297 | 1.333 | 27 |
| 3 | δ (N9-H) + 10 extra terms | 1508 | 1.379 | 1.333 | 35 |
| 4 | δ (N9-H) + 8 extra terms | 1450 | 1.434 | 1.500 | 44 |
| 5 | δ (N9-H) + 9 extra terms | 1367 | 1.521 | 1.500 | 14 |
| Reactant | Critical Vibration cm−1 | Route of Attack | ω/ν | Deviation o/oo | Product | Reference |
|---|---|---|---|---|---|---|
| H2CO | ν2 = 1743.6 | Double bond splitting | 6:5 | 6 | Ribose C5H5O5 | [10] Table 2 |
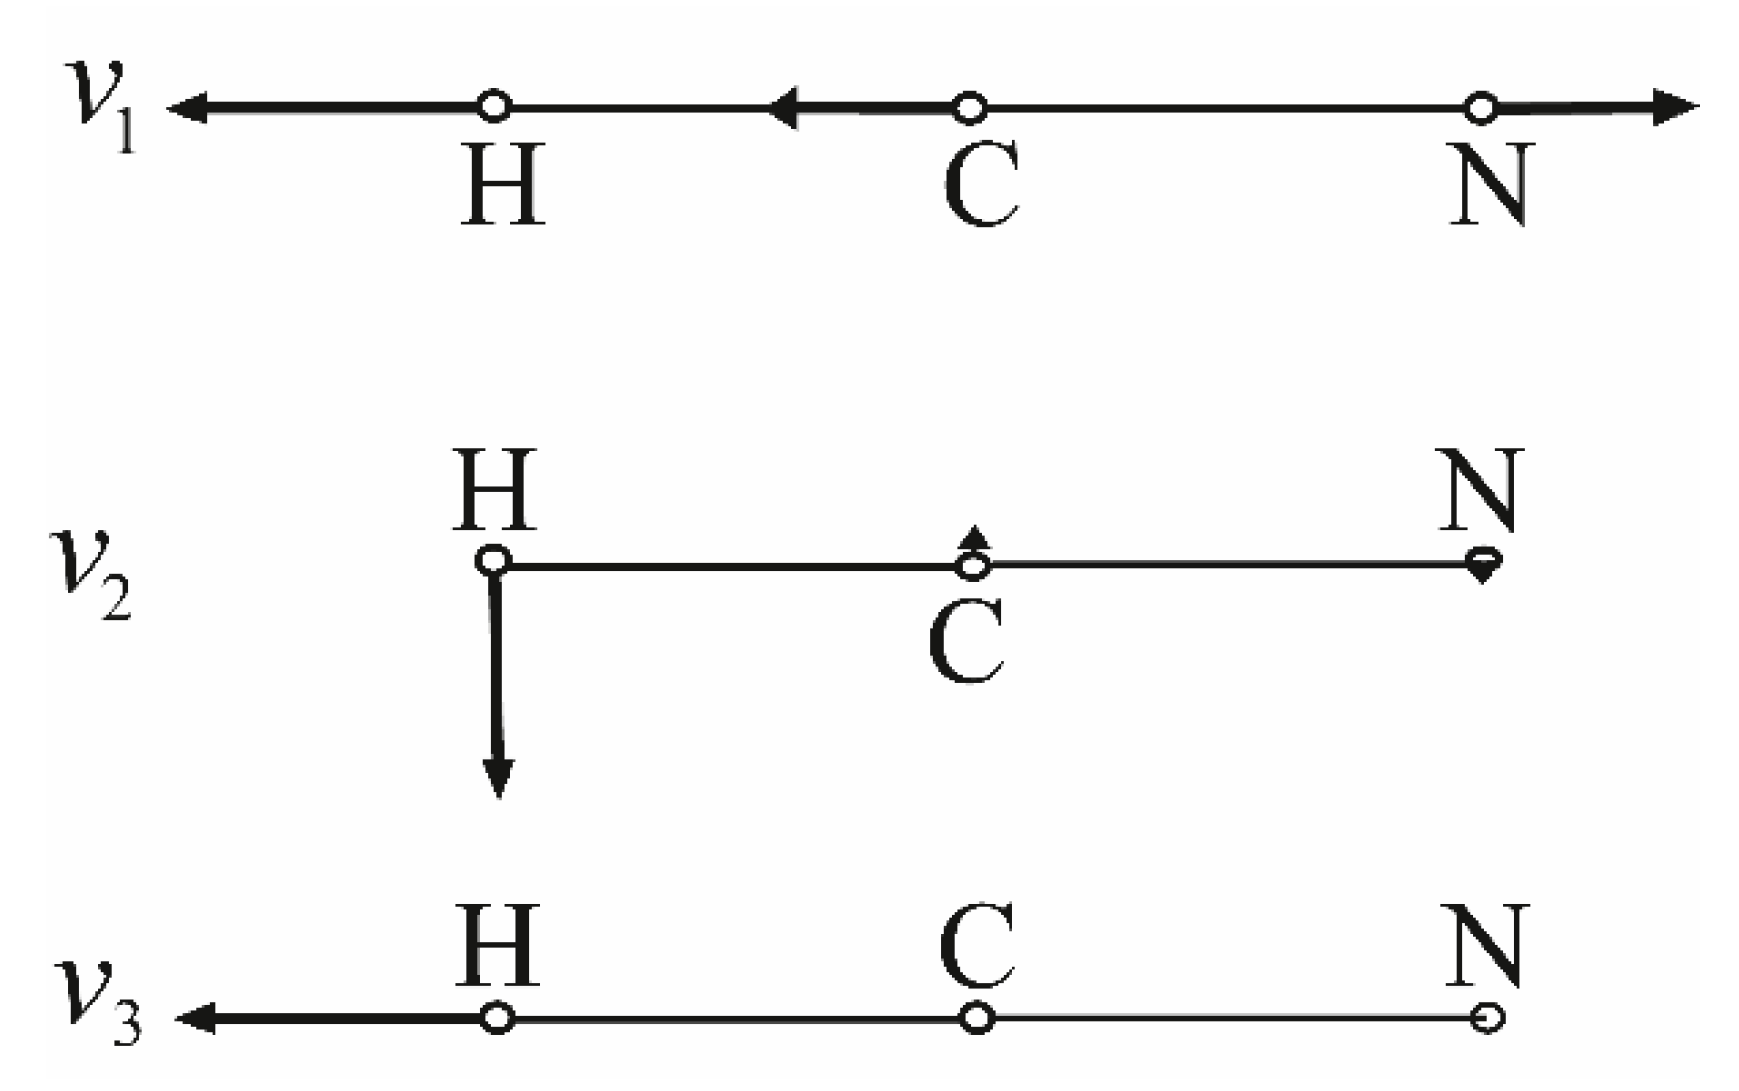
| HCN | ν1 = 2089 | Triple bond splitting | 1:1 | 5 | Adenine | Scheme 3 and Scheme 4 |
| CO2 | ν 6 + ν 10 = 2076.5 | Vibration energy transfer | 1:1 | 1 | CO + O | [10] Figure 6 |
| NH3 | ν 2(a) + 2 ν 4(e) = 4176 | Vibration energy transfer | 1:2 | 4 | NH + H2 | [10] Figure 6 |
| C2H4 | ν 9CH(b2u) = 3105.5 | Double bond splitting | 2:3 | 4 | C2H2 + H2 | Table 2 (in [10]) |
| PO43− glucose | 1045 1048 | Molecular Interaction | 2:1 2:1 | 1048/1045 = 1.0048 5 o/oo | Phospho-glucose- | [4] Table 5 |
| PO43− ribose | 1045 1040 | Molecular interaction | 2:1 2 = 1 | 1045/1040 = 1.0048 5 o/oo | Phospho-ribose | [19,20] Table 6 |
| Ribose adenine | 1040 1386 | Molecular interaction | 2:1 3:2 2/1.5 = 4:3 | 1386/1040 = 1.327 5 o/oo | Adenine-ribose | [22] Table 7 |
| Amino- acetate (Cu2+) COS | 1058 2079 | Molecular interaction | 1:2 1:1 | 2 × 1058 = 2116 2116/2079 = 1.0178 9 o/oo | -NH-CO-(Condensation of amino acids) | [1] |
© 2020 by the authors. Licensee MDPI, Basel, Switzerland. This article is an open access article distributed under the terms and conditions of the Creative Commons Attribution (CC BY) license (http://creativecommons.org/licenses/by/4.0/).
Share and Cite
Larsson, R.; Malek, A.; Odenbrand, I. The Transformation by Catalysis of Prebiotic Chemical Systems to Useful Biochemicals: A Perspective Based on IR Spectroscopy of the Primary Chemicals II. Catalysis and the Building of RNA. Appl. Sci. 2020, 10, 4712. https://doi.org/10.3390/app10144712
Larsson R, Malek A, Odenbrand I. The Transformation by Catalysis of Prebiotic Chemical Systems to Useful Biochemicals: A Perspective Based on IR Spectroscopy of the Primary Chemicals II. Catalysis and the Building of RNA. Applied Sciences. 2020; 10(14):4712. https://doi.org/10.3390/app10144712
Chicago/Turabian StyleLarsson, Ragnar, Abdul Malek, and Ingemar Odenbrand. 2020. "The Transformation by Catalysis of Prebiotic Chemical Systems to Useful Biochemicals: A Perspective Based on IR Spectroscopy of the Primary Chemicals II. Catalysis and the Building of RNA" Applied Sciences 10, no. 14: 4712. https://doi.org/10.3390/app10144712