Article

Laboratory Evaluation of the Permeability Durability of Utilization of Oil Shale Waste as Fine Aggregate in Open Grade Friction Course in Seasonal Frozen Regions

1
School of Transportation, Jilin University, Changchun 130022, China
2
School of Transportation, Changchun College of Architecture, Changchun 130604, China
*
Author to whom correspondence should be addressed.
Appl. Sci. 2020, 10(1), 419; https://doi.org/10.3390/app10010419
Submission received: 7 November 2019 / Revised: 3 January 2020 / Accepted: 3 January 2020 / Published: 6 January 2020
(This article belongs to the Section Materials Science and Engineering)

Abstract

:
Open graded friction course (OGFC), as a highly permeable mixture, has the characteristics of good friction and splash-and-spray reduction during rainstorms. The limitations of the use of such mixtures include the fact that they are affected by poor durability, including strength and permeability durability issues. In a previous study, oil shale waste, as a fine aggregate in the mixture (with a particle size less than 4.75 mm), could effectively improve the overall properties of OGFC, but the permeability durability was not clear. Thus, a comprehensive investigation of the permeability durability of oil shale waste as a fine aggregate is essential to achieving a better understanding in order to promote its engineering application. In this paper, the long-term permeability when using oil shale waste as a fine aggregate in OGFC was systematically investigated based on a self-developed laboratory physical clogging procedure. The test results illustrated the effectiveness of the utilization of oil shale waste as a fine aggregate in terms of permeability durability. A comprehensive index of the clogging coefficient containing mass, porosity and permeability coefficient was proposed based on gray relation entropy theory, the physical clogging model of COF-OGFC (OGFC containing oil shale waste filler) was established and the clogging speed of COF-OGFC was quantified based on the Mistcherlich growth model. The analysis showed that there is an essential difference in the clogging behavior of permeable pavement in the spring and summer. The maximum clogging degree of the permeable pavement in summer is about 40% higher than that in spring, while the clogging rate is much lower than in the spring, at only about 14%, which indicates that the clogging behavior of permeable asphalt pavement in spring is mostly in the rapid clogging mode, and that in summer is mostly in a slow deposition clogging mode. Moreover, the test results showed that the most important influences on the spring clogging behavior of COF-OGFC were the sandy clogging materials and particle sizes ranging from 150 μm to 1180 μm, which can be used to provide a reference for the design of anti-slip sand.

1. Introduction

Permeable asphalt pavements, as part of sustainable drainage systems (SUDSs), have emerged as a topic of considerable interest in recent years [1,2,3,4]. The main objectives of permeable pavement are to increase groundwater recharge, reduce surface runoff, treat stormwater, and prevent the pollution of receiving water bodies through surface runoff [5,6,7,8,9]. Permeable asphalt pavement refers to a new type of asphalt mixture surface layer materials with a porosity of about 20% after compaction, with drainage paths inside [10,11]. The permeable structure is a “framework–pore” structure formed by interlocked large-size gravel [12,13,14,15].
However, a limitation of the use of such mixtures is that they are affected by poor durability. Specifically, there is a strength durability issue and a permeability durability issue. The strength durability issue refers to the relatively low strength and low stiffness of the permeable pavement. Draindown, a separation of asphalt mastic from the course skeleton, can occur during storage or transport, which results in a thin binder coating that is inadequate to prevent particles from being dislodged by traffic. The thin binder film can also age rapidly, aggravating the raveling problem. Sometimes, the failure occurs when the pavement is only six to eight years old, and such a short life is difficult to accept. Furthermore, permeable asphalt pavement is prone to clogging by sediments over time, which slows the permeability rate [16,17]. The clogging behavior is characterized by an increase in the quantity of sediments and particulate matter retained on the pavement surface [18]. The clogging behavior of permeable asphalt pavement is a very complex and random process, and the asphalt paving community has made a great effort to investigate the clogging phenomenon from the formation mechanism to prevention methods [19,20,21,22,23,24,25]. Sanudo-Fontaneda et al. proposed an “end-of-life” concept based on the long-term hydrological performance of permeable pavement systems in northern Spain. The research showed that, after 10 years of operation without maintenance, the bays constructed using porous mixtures were completely clogged, reaching the end of their operational life after nine years [26]. Razzaghmanesh and Beecham investigated this mechanism through surface infiltration methods, the use of embedded sensors, and the development of modelling tools. The conclusion showed a relationship between surface infiltration rates and the age of the pavement and local climatic conditions, including rainfall intensity [27]. Kazemi et al. conducted three different maintenance methods to restore the surface infiltration performance of the clogged permeable pavements. The research results indicated that the most effective maintenance treatment was determined to be a combination of hydro pressure washing and vacuuming to clean the permeable pavement surfaces [28].
In order to effectively improve the durability of permeable pavement, researchers all over the world have conducted a large number of fruitful studies [29,30,31,32,33,34,35,36]. In a previous study, in order to determine a promising solution to minimize environmental pollution by sinking the accumulation of waste materials and improve the strength durability of permeable pavement, a novel OGFC material, named COF-OGFC, using oil shale waste as a fine aggregate in OGFC, was designed to meet the requirements of sponge city construction in Siping City (Jilin province, China). The test results showed that the overall properties of COF-OGFC were about 30% better than those of a conventional asphalt mixture, and it could effectively reduce construction costs and environmental pollution by industrial waste [37,38]. However, the permeability durability when using oil shale waste as a fine aggregate in OGFC in seasonal frozen regions is unclear.
In this study, the long-term permeability when using oil shale waste as a fine aggregate in OGFC in seasonal frozen regions was systematically investigated based on a self-developed laboratory physical clogging procedure, and the summer and spring physical clogging model of COF-OGFC was established based on the Mistcherlich growth model. Moreover, the effect of the particle size of clogging materials on the clogging of COF-OGFC in the spring-thawing season was discussed based on the gray relation entropy theory, which is essential to achieving a better understanding to promote its engineering application.

2. Materials

2.1. Asphalt

The asphalt used in this study is AH-90 base asphalt, which was acquired from the Panjin Petrochemical industry. The technical parameters of AH-90 base asphalt are summarized in Table 1.

2.2. Oil Shale Waste

Oil shale waste (OSW) is an acidic inorganic material formed by oil shale after dry distillation or combustion. OSW has the characteristics of porosity and high activity. The oil shale waste selected in this paper is the waste residue generated after the combustion of the Huadian Longteng Power Plant in Jilin Province China. The color of oil shale waste is gray–brown, and it has a layered joint structure of shale and a large number of flake particles [38]. The technical parameters of oil shale waste are shown in Table 2.
Oil shale waste is a barren raw material with a small amount of residual carbon, which is similar to volcanic ash. The main chemical composition of oil shale waste is SiO2, Al2O3, Fe2O3, MgO, and CaO, while the remainder is mostly ash. In the waste, SiO2 mainly exists in the form of quartz, and Al2O3 mainly exists in the form of kaolinite. Oil shale waste has strong acidity, and the pH value of oil shale waste is generally around 3.5–4.5. The composition of oil shale waste is more complex, and the composition of oil shale waste in different regions is not equal. There are also some toxic and harmful substances such as chromium, lead, and cadmium in oil shale waste in some regions. The main chemical composition of oil shale waste used in this study is shown in Table 3. Table 3 shows that the oil shale waste still retains some of the characteristics of the rock, and its main component is SiO2, which accounts for 55.38% of the total. This means that the oil shale waste can be used as a filler to reinforce bitumen. The other components are Al2O5, Fe2O3, MgO, etc., which indicates that the oil shale waste has a function. In conclusion, oil shale waste, like other silicon inorganic asphalt modifiers such as silica, diatomite, asbestos, etc., can be used for asphalt modification in terms of chemical composition [38].
The microscopic appearance of oil shale waste is shown in Figure 1. After magnifying observation, it was found that the surface of oil shale waste is rough, that oil shale waste has a large number of micron-sized pores, and the edge of the pores is surrounded by mossy and petal-like protrusions. Such a unique microscopic appearance can achieve a larger bonding area when combined with asphalt, reduce the content of surplus asphalt, and effectively reshape the combination mode of asphalt and aggregate [37].

2.3. Aggregate

The aggregate used in the paper was the granite produced from the Jiutai stone factory, and the technical parameters of the aggregate and mineral powder are shown in Table 4 and Table 5.

2.4. Preparation of OGFC Containing OSW Filler

In a previous study, the preparation process of OGFC containing OSW filler (COF-OGFC) was optimized based on response surface methodology. The whole preparation procedure of OGFC containing OSW filler can generally be divided into five stages, as follows [38].
Step 1: Since the oil shale waste has a high moisture absorption rate, the oil shale waste should be pretreated before utilization. The pretreatment procedure of oil shale waste includes two steps of drying and smashing.
Step 2: According to the gradation, the oil shale waste with a particle size of 0.075–4.75 mm and the coarse aggregate with a particle size of 4.75–19 mm are mixed at 153 °C for the first mixing. The gradation of OGFC used in this study is shown in Figure 2.
Step 3: The base asphalt is heated to about 135 °C to ensure that the asphalt is completely melted and in a flowing state, and 2.5 wt% silane coupling agent stock solution (KH550, Shanghai Yiyan Co., Ltd., China) of asphalt is directly mixed into the base asphalt and manually stirred for 3 min.
Step 4: The silane coupling agent modified asphalt and the mixtures containing oil shale waste and coarse aggregate are mixed at 153 °C for the second mixing. The optimized bitumen–aggregate ratio is 5.18%.
Step 5: The mineral powder and the mixtures containing modified asphalt, oil shale waste and coarse aggregate are mixed at 153 °C for the final mixing. Then, the prepared mixture is processed into Marshall test pieces with 50 double-sided compactions according to GB/T 0709-2011.
Moreover, two types of OGFC were used for the comparison: a conventional OGFC mixture with “Pan Jin” base asphalt (OGFC), and a modified OGFC with Styrene-Butadiene-Styrene modified asphalt (SBS-OGFC). All asphalt mixtures were specified based on the Technical Specifications for the Construction of Highway Asphalt Pavement in China (JTG F40-2004), and the optimum asphalt content of OGFC and SBS-OGFC was found to be 4.8% and 4.1% for the control mixture.

3. Tests and Methodology

3.1. Methodology

3.1.1. Gray Relation Entropy Theory

The clogging behavior of the permeable asphalt pavement during the spring–summer season is a process in which the clogging materials gradually enter the interior of the pavement, fill the pores, and block the drainage path. The clogging phenomenon will cause a continuous increase of the mass and a gradual decrease of the porosity and permeability coefficient of the road surface layer. Only one indicator is not sufficient to fully describe the clogging process of permeable asphalt pavement. Therefore, gray relation entropy theory was employed to seek an objective and effective comprehensive index of the clogging coefficient containing mass, porosity, and permeability coefficient indexes to determine the clogging state of permeable asphalt pavement.
The German physicist R. Clausius developed the ratio of the absorbed thermal temperature to the irreversible process of mass as indicative of entropy. In 1948, Shannon introduced the concept of entropy to the information theory and used entropy to measure the uncertainty, stability and the quantity of the information. The relationship between entropy and the degree of order is that a system with high entropy is in low order or high disorder. In contrast, a high order system has low entropy. Thus, based on the relationship between entropy and order, the entropy value can be used to describe the order degree of the clogging state and to estimate its evolution direction [39,40,41].
According to the principle of grey system theory, the clogging state is considered as a type of grey system due to the randomness and uncertainty when applying the clogging coefficient and the information of the mass, porosity, and permeability coefficient. Based on the consistency of clogging time, the grey relation coefficient is used to quantitatively describe the relativity between the clogging coefficient and mass, porosity, and permeability coefficient. However, the application of the clogging coefficient has multi-phase characters, and there is a difference between the clogging coefficient of various phases. More specifically, there are a large number of calculated grey relational coefficients, and one single grey relational coefficient cannot reflect the change discipline of the whole clogging state. In this article, the result of the grey relational coefficient is denoted by entropy, and the evolution direction is judged by the entropy change of different periods.
It is assumed that the system has n evaluation targets, and each evaluation target has m evaluation indicators. The evaluation of each target with each evaluation indicator can be expressed as an eigenvector matrix.
[ X 1 X 2 X 3 X 4 ] = [ x 11 x 12 x 1 n x 21 x 22 x 2 n x m 1 x m 2 x m n ]
Transform the eigenvector matrix; let x i j = x i j j = 1 n x i j , then a new eigenvector matrix can be obtained.
X = [ X 1 X 2 X 3 X 4 ] = [ x 11 x 12 x 1 n x 21 x 22 x 2 n x m 1 x m 2 x m n ]
Since j = 1 n x i j = 1   ( i = 1 , 2 , , m ) , if X i is regarded as a random variable, then x i j is the probability distribution of X i . The Theil index T = 1 n j = 1 n x j x ¯ l n x j x ¯ is introduced, where x ¯ is the mean of n indicator values. The index of the i-th indicator is as follows:
T i = l n n + j = 1 n x i j j = 1 n x i j l n x i j j = 1 n x i j ( i = 1 , 2 , , m ) .
If x i j = 0 , it can be subjected to coordinate translation processing. x i j = x i j + σ , σ 0 . According to the above index, T i , the weight coefficient of the ith indicator can be defined as follows.
w i = T i i = 1 m T i   ( i = 1 , 2 , , m )
The comprehensive value of the evaluation target j is as follows.
G j = i = 1 m w i x i j = i = 1 m T i i = 1 m T i x i j

3.1.2. Mistcherlich Growth Model

For the prediction of the clogging state of permeable asphalt pavement, our predecessors have also undertaken a great deal of related research and put forward some valuable regression analysis methods. In the regression analysis, the trend of the data is generally estimated first, and a suitable mathematical model is employed for the establishment of the model. Then, the parameters of the model are estimated according to the data, and inspection methods are used to determine the correlation between models and eliminate inaccurate data. Finally, the evolution direction can be predicted based on the amendment model.
The curve shape of the Mistcherlich growth model is similar to the “shoulder shape”, which is an approximate “S” type curve [42]. The Mistcherlich growth model is more suitable for describing a growth process which begins to grow faster, and then tends to slow down. The Mistcherlich growth model has no inflection point and is equivalent to an ideal growth curve. The general formula of the Mistcherlich growth model is as follows:
y = A ( 1 e k t )
The Mistcherlich growth model has three major properties:
(1)
The existence of two asymptotes: when t , y A and when t 0 , y 0 ;
(2)
y is a monotonically increasing function of t,
d y d t = d d t [ A ( 1 e k t ) ] > 0
where A and K are both greater than 0, so y is a monotonically increasing function of t;
(3)
It has no inflection points.
By double derivate the Mistcherlich growth model, the following formula can be obtained.
d y 2 d t 2 = k 2 A e k t 0
During the spring–summer physical clogging process, the trend of the clogging coefficient of the three asphalt mixtures is that it increases rapidly at first and then enters a stable stage. Moreover, the growth of the clogging materials is a cumulative process, and there is no sudden inflection point. Therefore, the Mistcherlich growth model was employed for the prediction of the physical clogging process during the spring and summer season. In order to obtain a more accurate clogging model, the modified Mistcherlich growth model was selected. This model has one more parameter than the Mistcherlich growth model, which is more suitable for the asymptotic regression model. The relation function of the modified Mistcherlich growth model can be expressed as follows.
y ( t ) = a b e c t
In the spring and summer clogging model of permeable asphalt pavement, index a represents the maximum degree of clogging, index b represents the maximum clogging increase, and index c represents the clogging rate.

3.2. Laboratory Physical Clogging Procedure

In rainy weather, permeable asphalt pavement is prone to clogging by pavement surface dust, clay particles, rubber particles produced by wheel wear and fine aggregate produced by the crushing of the pavement aggregate, which slows the permeability rate. Moreover, in the seasonal frozen region, anti-slip sand is spread on the permeable pavement surface to prevent the vehicle slippage caused by snow in winter, as shown in Figure 3.
In the spring season, the snow on the pavement surface melts rapidly, and the anti-slip sand is continuously brought into the internal pores of the permeable asphalt pavement under the action of the water flow force and lifting force, which would easily cause an accumulation and blockage inside the pavement surface. In order to promote the application of COF-OGFC in the permeable pavement industry in seasonal frozen regions, it is necessary to evaluate the permeability durability of COF-OGFC. Therefore, a laboratory physical clogging procedure was designed based on the typical clogging characteristics of summer and spring seasons.

3.2.1. Statistics of Clogging Materials

The particle size and coverage density of clogging materials are the two main key factors affecting the physical clogging procedure of permeable pavement. Thus, the clogging materials at different times, different regions, and different pavement types were collected in Siping, China. The collection locations are summarized in Table 6.
The clogging materials collection procedure is detailed as follows. First, a 1 × 1 m measurement area was drawn with a steel ruler at the collection point. Secondly, the clogging materials were collected from the periphery to the center with a brush, and branches, scraps, and cigarettes were removed with a twig before the residual clogging materials were placed in a sealed bag for further study. The clogging materials collection process was carried out separately during the spring season and summer season. Clogging materials include pavement surface dust, clay particles, rubber particles produced by wheel wear, and fine aggregate produced by the crushing of the pavement aggregate. For grit, dust, and rubber particles that have no expansibility, the particle size remains unchanged in the natural environment, so the particle size of those clogging materials is the key factor affecting the clogging behavior of permeable pavement. For clay particles with hydrophilicity and moisture swelling, the clay particles swell when encountering rainfall, which will seriously affect the effective void and reduce the permeability of permeable pavement. Moreover, the clogging behavior is also related to the shape and surface characteristics of the clogging material. The clogging material with a surface close to a spherical shape or a smooth surface flows more easily out from the connected pores, and the clogging material with a sharp edge or rough surface is more likely to remain in the pores and cannot easily flow. Considering the actual size of the clogging material, the size of the clogging material can be determined through a laboratory sieving method. The particle size score table of clogging materials is shown in Table 7.

3.2.2. Experimental Procedure

In this paper, a dynamic water scouring application device (SAD) was used to apply various dynamic water scouring intensities on to the paver surface. The purpose of the SAD was to simulate in-field scenarios of dynamic scouring of surface runoff and to adequately mobilize clogging materials over the paver surface. In order to meet the above requirement, dynamic water scouring intensities were simulated using a high-pressure water gun. The high-pressure water gun was attached to a custom frame and a 100 mm polyvinyl chloride pipe which was connected to the water mains, as shown in Figure 4. In order to simulate the speed of the vehicle, four cylindrical steel structures without a top surface were fixed on a custom frame, while the rotation speed of the cylindrical structures could be controlled through the motor. The cylindrical structure with hole diameters of 2 mm had a diameter of 102 mm and a height of 65 mm, which guarantees that a Marshall test piece can be contained, and the water flow can be discharged smoothly through the holes.
In order to establish the connection between the laboratory dynamic water scouring application device and the actual condition of the pavement, a piezoresistive dynamic water pressure sensor was embedded in the Hui-wu expressway (in Songyuan, Jilin, China) to collect the dynamic water scouring pressure of the pavement. The collected water scouring pressure data are shown in Figure 5.
According to the collected data, adjusting the pressure of the water gun and the rotation speed of the cylindrical structure to realize the laboratory scouring test, the corresponding relationship between the vehicle, water gun pressure, and the rotation speed of the cylindrical structure is shown in Table 8.
The details of the physical clogging procedure are described below.
Step 1: Marshall specimens were prepared by the compaction method according to T 0702, and the side of the specimens was coated with butter and wrapped with a plastic film.
Step 2: The treated Marshall specimens were placed in the cylindrical structure, and the synthetic clogging materials were spread uniformly on the upper surface of the Marshall specimens. According to the statistics regarding the clogging materials’ coverage density, the average coverage density of the eight collection locations is defined as the final clogging materials’ coverage density for the physical clogging procedure.
Step 3: We sprayed the upper surface of the Marshall specimens with clean water for 2 min to pre-soak the clogging materials.
Step 4: We started SAD to simulate in-field scenarios of dynamic scouring of surface runoff. The water gun pressure was set to 2561.6 KPa and the rotation speed of the cylindrical structure was set to 420 rad/min to simulate the dynamic scouring of surface runoff at an 80 km speed. According to the statistics, the average daily traffic volume of a single lane in Siping City is about 2000. Thus, the scouring time of one day was calculated as 4.8 min in the laboratory.
As described above, a complete spring physical clogging cycle is completed. Due to the different days of saturated pavement in spring and summer seasons, the total cycles of summer and spring clogging procedures were selected as 20 and 50, respectively, based on the statistical data. Then, after different cycles, clogged Marshall specimens were collected for permeability quality evaluation test to explore the clogging potential of OGFC containing OSW filler during the spring and summer seasons.

3.3. Permeability Quality Evaluation Test

Under the dynamic scouring of surface runoff, the clogging materials fill the internal pores of the pavement, which will cause a decrease of the porosity and permeability coefficient of the pavement surface. Thus, the change of mass, the change of porosity, and the change of permeability coefficient were defined as three indexes to evaluate the clogging behavior of OGFC containing OSW filler during the spring and summer seasons. After the physical clogging procedure, the clogged Marshall specimens were collected for surface cleaning and drying, and then the mass, porosity and permeability coefficient of the Marshall specimens were measured. The porosity of the Marshall specimens was measured according to Chinese standards T 0706-2011. The constant head permeability test was conducted to measure the permeability coefficient of the permeable asphalt mixture in accordance with Chinese standards JTG D50-2006, and the permeability coefficient (K) was obtained by using Equation (1).
K 20 = Q L A t Δ t
where Q refers to the quality of the water permeating through the specimen during t time (cm3); L: infiltration length (cm); A: cross-sectional area of the specimen (cm2); t: infiltration time (s); ∆t: water head difference (cm).

4. Results and Discussion

4.1. Statistical Results of Clogging Materials

4.1.1. Coverage Density of Clogging Materials

The coverage density of the clogging materials can be calculated based on the mass of clogging materials collected, and the clogging materials’ coverage density at different collection locations is shown in Figure 6.
It can be seen from Figure 6 that the clogging materials’ coverage density in the urban area is generally higher than that of the suburban area. This may be due to the better environmental protection in the suburbs, the lower traffic volume and the cleaner pavement surface. The clogging materials’ coverage density for the pavement in spring is higher than that in the summer, which may be due to the untimely cleaning of clogging materials caused by snowfall and the throwing of “anti-slip” sand.

4.1.2. Particle Size of Clogging Materials

A sieving analysis test was carried out for the collected clogging materials, and the test results are summarized in Table 9 and Table 10.
It can be seen from Table 9 and Table 10 that the particle size distribution of the clogging materials in spring and summer seasons shows a large difference. In the summer season, the proportion of coarse sand and very coarse sand is small, the proportion of medium sand, fine sand, very fine sand, and silt is large, and more than 90% of clogging materials has a particle size below 600 μm. However, the proportion of fine sand, medium sand, coarse sand, and very coarse sand in clogging materials in the spring season is large, the proportion of very fine sand and silt is small, and only about 40% of clogging materials have a particle size below 600 μm. The reason for the existence of clogging materials with a large particle size in the spring-thawing season is that the clogging materials cannot be cleaned daily, and most clogging materials are frozen on the road surface. Secondly, throwing “anti-slip” sand on the pavement surface in winter is also an important factor causing the general increase of the particle size of the clogging materials.
The particle size of the clogging materials for the concrete pavement is generally smaller than for the asphalt pavement, and the proportion of very fine sand for the clogging materials for the concrete pavement is higher than that for the asphalt pavement, which may be due to the smooth surface of the concrete pavement and the sufficient compaction of the vehicle. The particle size of clogging materials in the non-overloaded case is generally smaller than that of the heavy-duty road. This may be due to the higher cleaning frequency of the non-overloaded road. In conclusion, the particle size distribution of clogging materials is related to the average daily traffic, region, environment, season, pavement type, and pavement surface roughness.
Based on the above analysis of the clogging materials, the average value of the clogging material gradation of the eight collection locations in spring and summer seasons was defined as the synthetic gradation of clogging materials. Due to the small amount of collected clogging materials, sieved granite was used to synthesize the spring clogging materials according to the synthetic gradation. The gradations of clogging materials used in this study are indicated in Figure 7.

4.2. Permeability Quality Evaluation Test Results

The permeability coefficient of three permeable asphalt mixtures with different cycles is shown in Figure 8.
As shown in 
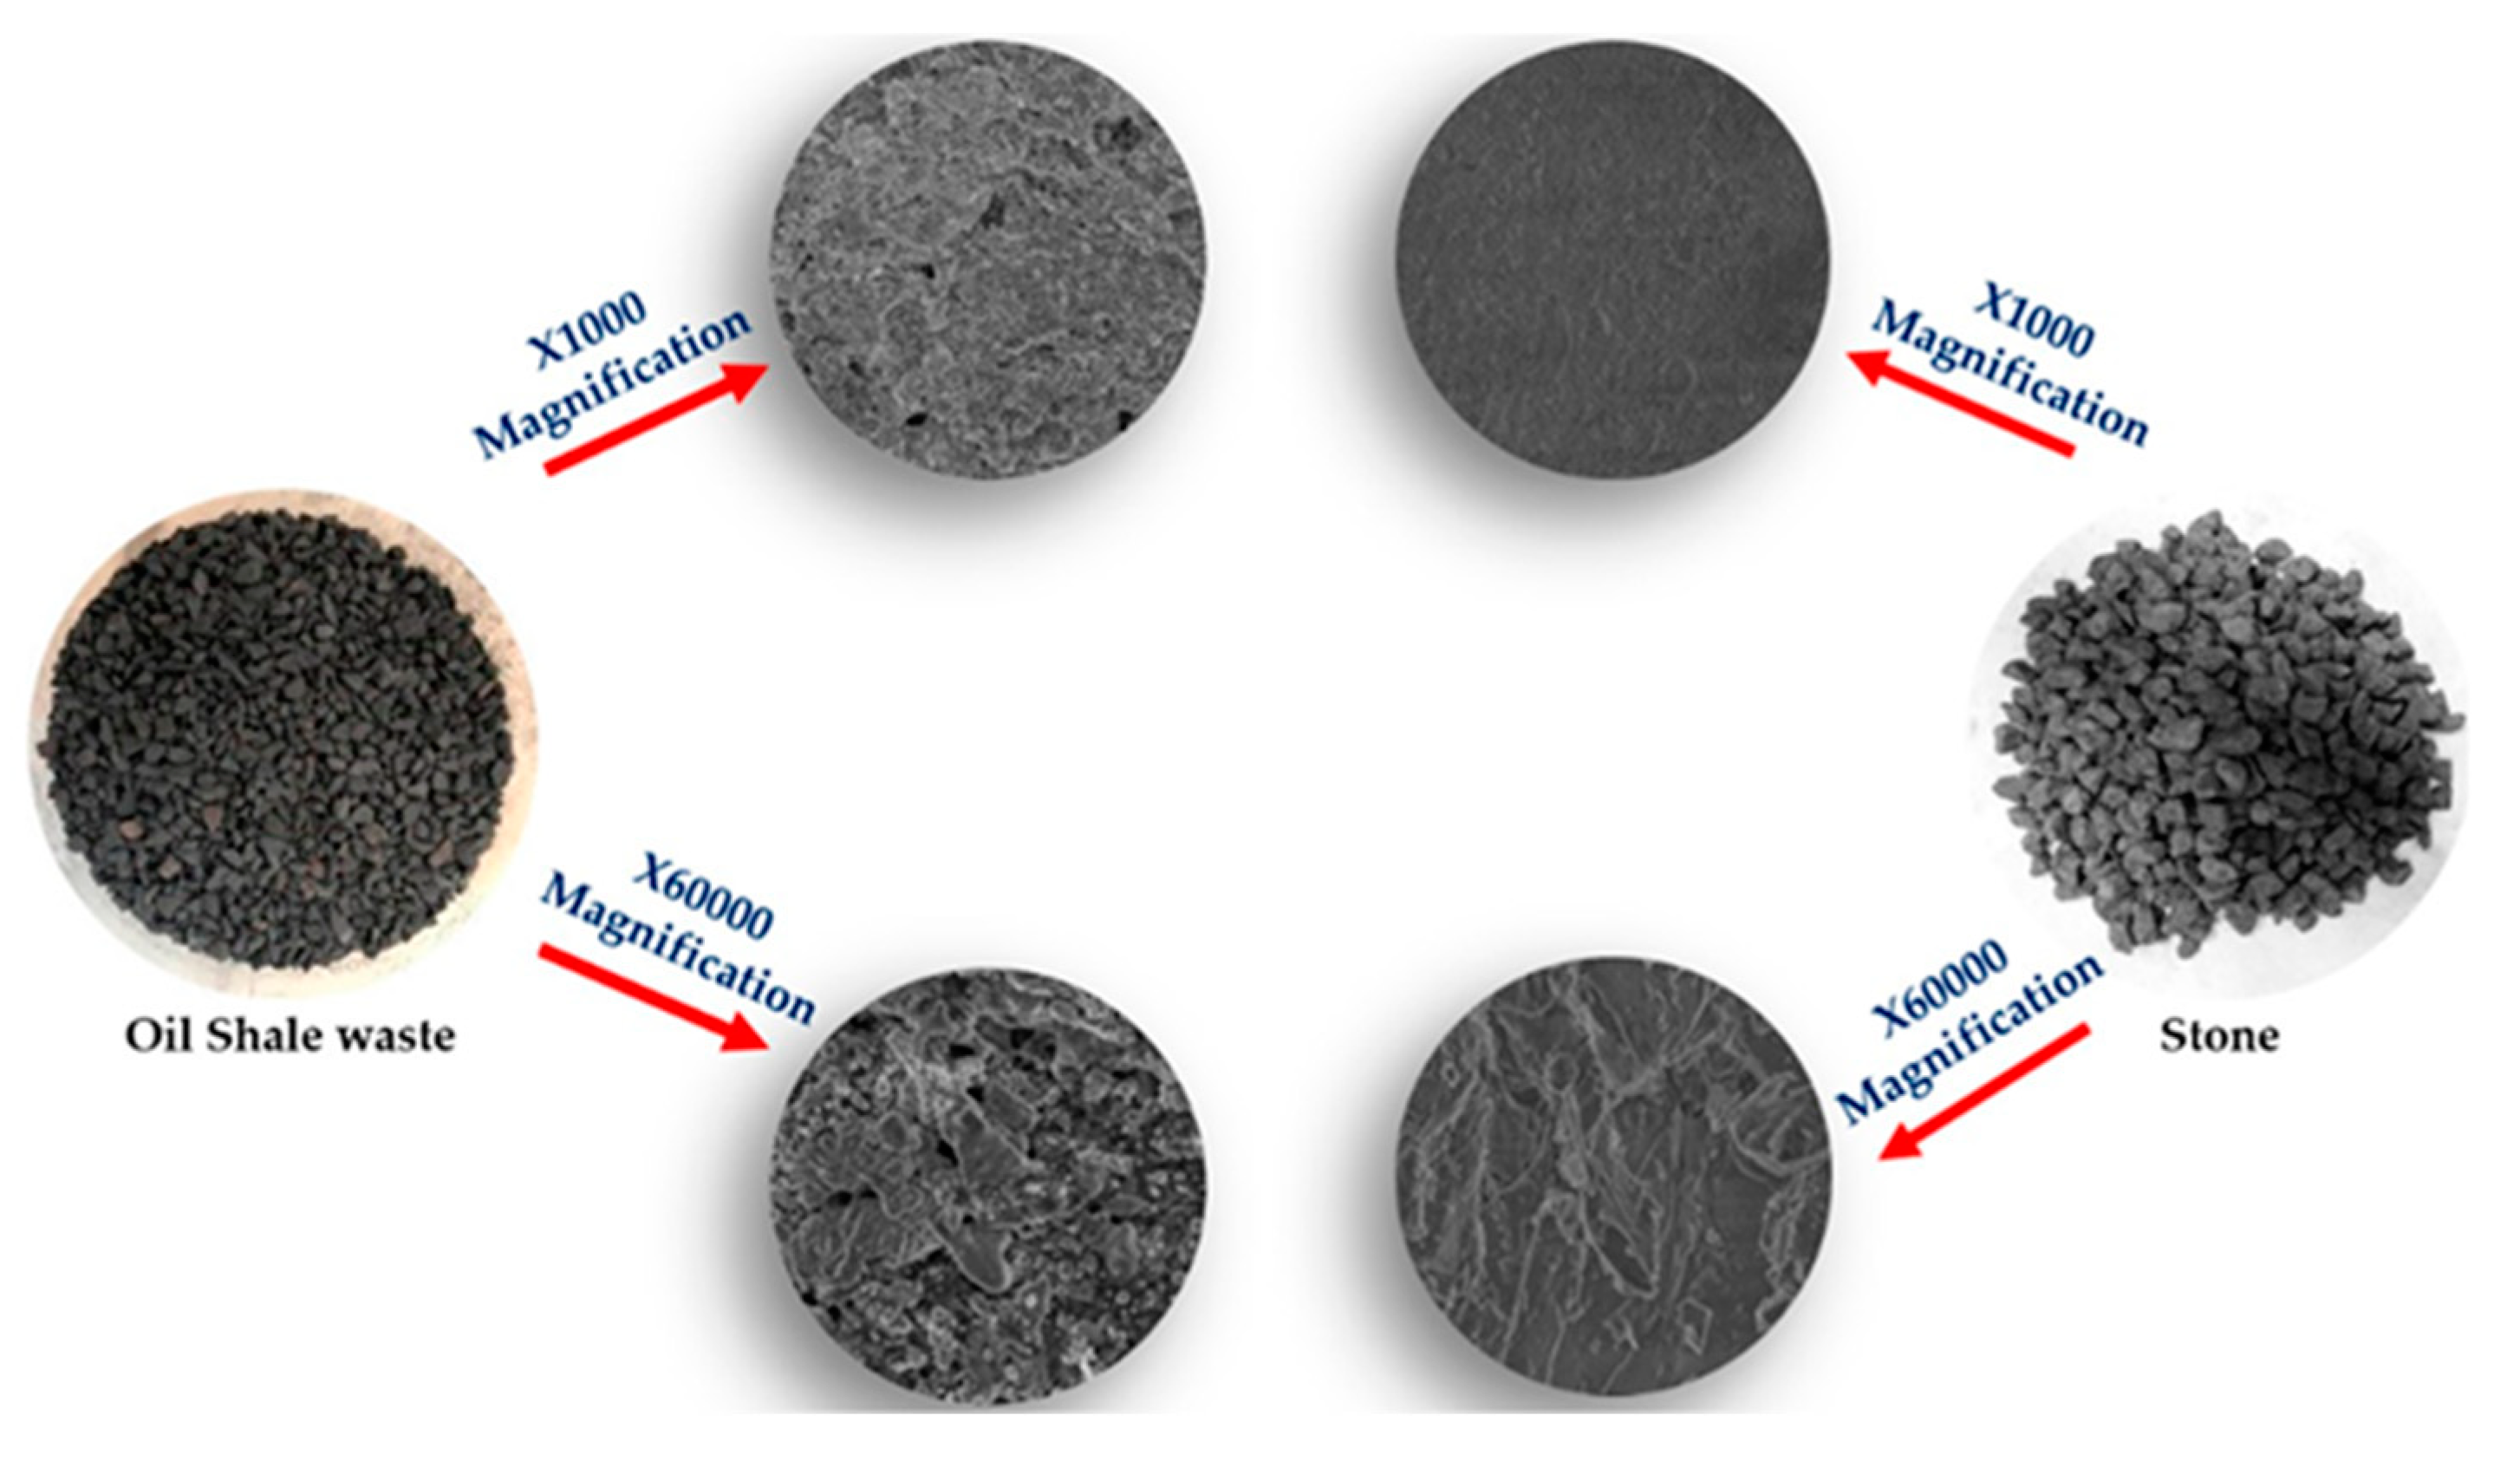
Figure 8, it can be determined that the permeability coefficients of OGFC, SBS-OGFC, and COF-OGFC were 0.19 cm/s, 0.28 cm/s and 0.24 cm/s at the start of the clogging procedure. It is generally believed that, for permeable asphalt pavement, the smaller the asphalt content, the greater the number of connected pores and the better the permeability. The asphalt contents of OGFC, SBS-OGFC and COF-OGFC were 4.8%, 4.2%, and 5.18%, respectively. SBS-OGFC has the smallest asphalt content, so it has the largest permeability coefficient of the three asphalt mixtures. Interestingly, the asphalt content of COF-OGFC is higher than that of OGFC, but the permeability coefficient is larger than that of OGFC. This is because the oil shale waste has a large specific surface area, dense pore structure and various mesoporous shapes, which means a larger adsorption area and lower probability of redundant asphalt blocking the effective pore. The permeability coefficient of the three mixtures decreased rapidly with the increase of the spring clogging cycles. After eight spring clogging cycles, the permeability coefficients of the OGFC, SBS-OGFC, and COF-OGFC mixtures were 0.11 cm/s, 0.128 cm/s, and 0.122 cm/s, respectively. According to the technical requirements and practical experience of permeable asphalt mixture, it is recommended that the permeability coefficient of the surface layer should be greater than or equal to 0.12 cm/s. Thus, the permeable function of the three permeable asphalts no longer meets the requirements after approximately eight spring clogging cycles. It can be seen from Figure 8b that the permeability coefficient of the three permeable asphalt mixtures decreases with the increase of summer clogging cycles, and the declining trend seems to taper. After 50 summer clogging cycles, the permeability coefficients of the OGFC, SBS-OGFC, and COF-OGFC mixtures were 0.062 cm/s, 0.057 cm/s, and 0.069 cm/s, respectively, and after 20 spring clogging cycles, the permeability coefficients of the OGFC, SBS-OGFC, and COF-OGFC mixtures were 0.064 cm/s, 0.057 cm/s, and 0.072 cm/s, respectively. This also showed that there is a significant difference between the spring clogging behavior and summer clogging behavior of permeable pavement in seasonally frozen regions. The spring clogging behavior belongs to a rapid clogging mechanism, while the summer clogging behavior belongs to a slow clogging mechanism. This may be related to the coverage density of clogging materials, the particle size distribution of the clogging materials, and the porosity change caused by a F-T environment.
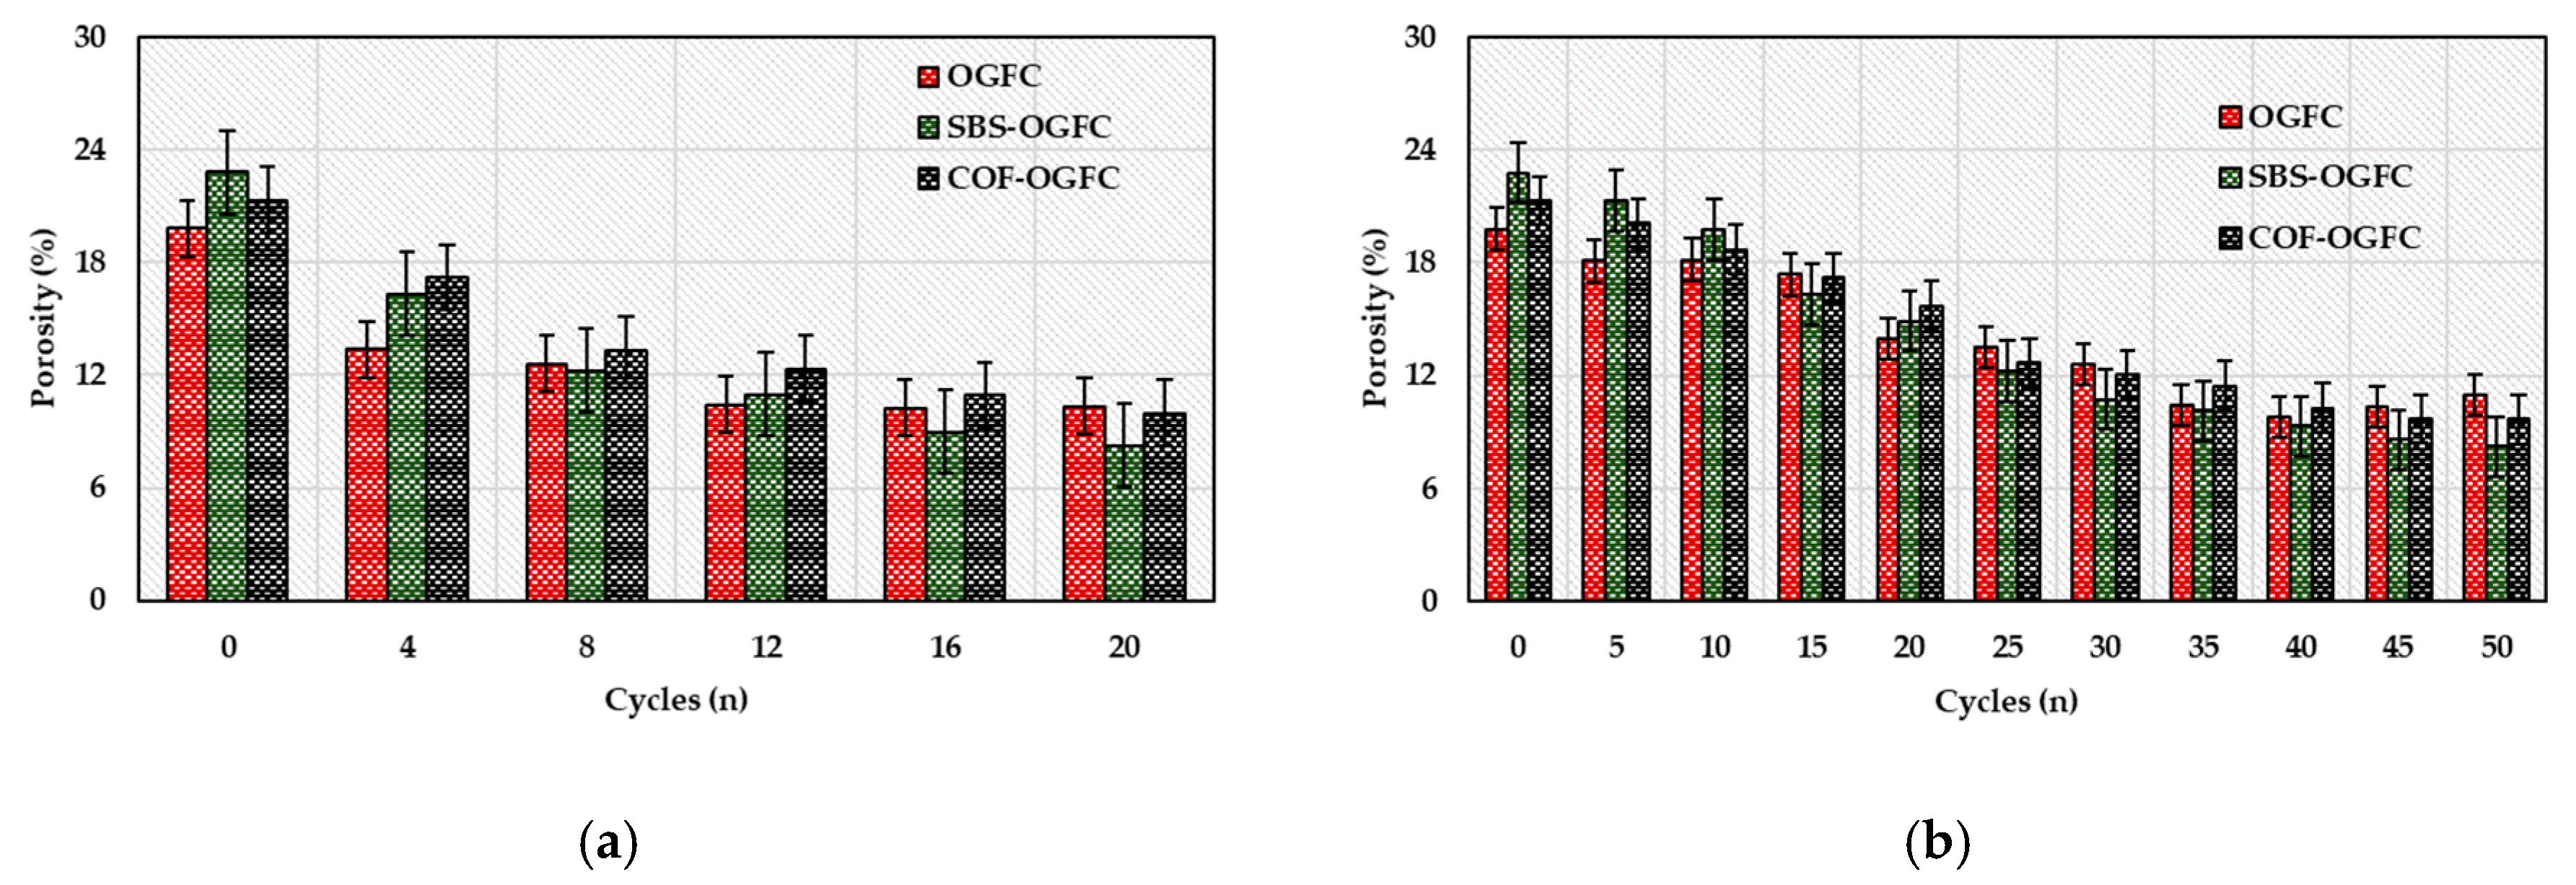
The porosity of the three permeable asphalt mixtures with different cycles is shown in Figure 9.
It can be readily observed from Figure 9a that the porosities of OGFC, SBS-OGFC, and COF-OGFC were 19.8%, 22.8%, and 21.3%, respectively, before the physical clogging procedure, which met the requirements of the Chinese standard (i.e., porosity of permeable asphalt pavement ≥ 18%). The sequence of the porosity of the three asphalt mixtures before the physical clogging procedure was SBS-OGFC > COF-OGFC > OGFC, which is consistent with the results of the permeability coefficient. The porosity of the three permeable asphalt mixtures decreased rapidly with the increase of cycles. After 20 spring clogging cycles, the porosities of OGFC, SBS-OGFC, and COF-OGFC were 10.34%, 8.27%, and 9.97%, respectively. The decrease of the porosity of the three mixtures was mainly concentrated in the first eight spring clogging cycles, which is consistent with the declining trend of the permeability coefficient. This also indicated that the porosity of the permeable pavement has a significant correlation with the permeability coefficient. The largest decrease in the porosity of the the three asphalt mixtures was for SBS-OGFC. This is because SBS-OGFC has the largest porosity, and the probability of triggering the clogging behavior is much higher than for the other two mixtures. It can be seen from Figure 9b that the porosity of the three mixtures decreased with the increase of summer clogging cycles. After 40 summer cycles, the porosity of the three asphalt mixtures began to stabilize, which indicated that the clogging materials in the permeable asphalt mixture almost reached saturation. After 50 summer clogging cycles, the porosities of OGFC, SBS-OGFC, and COF-OGFC were 11%, 8.23%, and 9.69%, respectively, and after 20 spring clogging cycles, the porosities of OGFC, SBS-OGFC, and COF-OGFC were 10.34%, 8.27%, and 9.97%, respectively. This indicated that after 20 spring clogging cycles, or 50 summer clogging cycles, the clogging materials in the permeable asphalt pavement reached saturation, which means the “End-of-Life” of the permeable asphalt pavement.
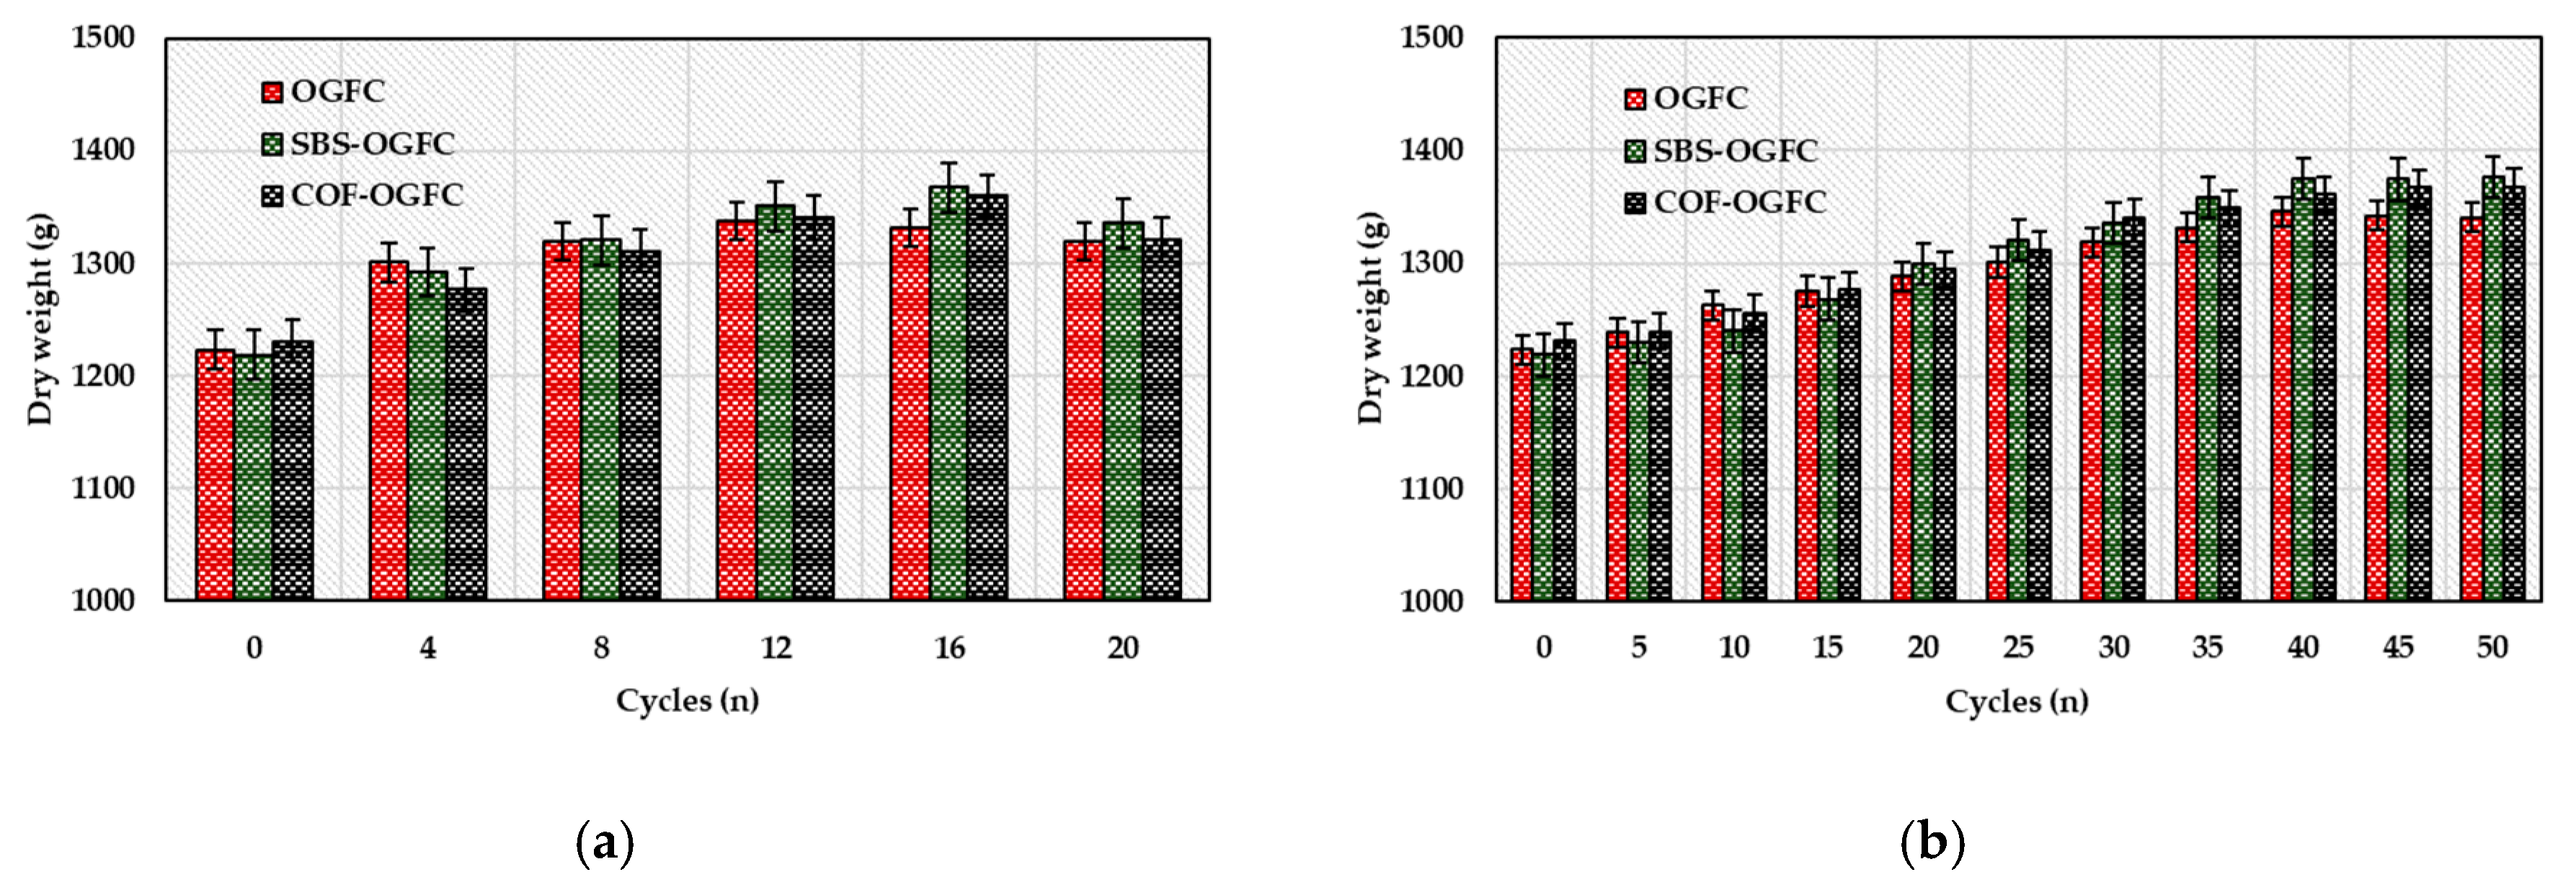
The dry weight of the three permeable asphalt mixtures with different cycles is shown in Figure 10.
It can be seen from Figure 10a that the dry weight of the three mixtures increased overall as the number of cycles increased. After 20 spring clogging cycles, the dry weights of OGFC, SBS-OGFC, and COF-OGFC mixtures increased by 7.86%, 9.59%, and 7.33%, respectively. The increase of the mass is due to the fact that the proportion of clogging materials remaining inside the permeable asphalt pavement is gradually increasing. The mass increase rate of SBS-OGFC was always higher than that of the other two asphalt mixtures during the physical clogging procedure. This is because the SBS-OGFC has a larger porosity and can accommodate more clogging materials. Moreover, due to the relatively excellent bonding properties between aggregates in SBS-OGFC, the phenomenon of quality degradation caused by aggregates falling off due to the dynamic water scouring does not occur easily. The dry mass of the OGFC decreased after 12 spring clogging cycles, which may be caused by the spalling of some aggregates on the surface of the specimen under the action of dynamic water scouring. The dry mass of the SBS-OGFC and COF-OGFC decreased after 16 spring clogging cycles, which also indicates that SBS-OGFC and COF-OGFC have better raveling resistance than OGFC. It can be seen from Figure 10b that the dry weight of the three asphalt mixtures increases steadily with the increase of summer clogging cycles in the first 40 cycles, and then the dry weight began to stabilize, which is consistent with the permeability coefficient and porosity results. This also indicated that the clogging materials in the asphalt pavement reached saturation after 40 summer clogging cycles. The mass increase rate of SBS-OGFC is higher than that of COF-OGFC after 50 cycles, indicating that the larger the porosity, the more clogging materials can be accommodated. The mass change of the three asphalt mixtures during the summer clogging procedure is more stable than that during the spring clogging procedure. This is due to the influence of temperature, which was considered in the spring clogging procedure. The adhesive and adhesion properties of the asphalt binder deteriorated under the F-T cycles, resulting in a decrease in the overall properties of the asphalt mixture, which easily triggers the loosening of the asphalt mixture under hydrodynamic scouring. Moreover, the coefficient of variation (CV) of the above data was calculated, and the formula for CV is as follows.
C V = σ μ
where σ is the data standard deviation and μ is the data average. The CV of test results for samples gradually increases with the cycles, and the CV of the test results for samples is smallest when the cycle time is zero. This indicates that the physical clogging of the permeable asphalt mixture is a random phenomenon, and the longer the cycle time, the greater the discreteness of the test data. The CV of all test results measured in this paper is within 20%, which proves that the porosity test has good repeatability.
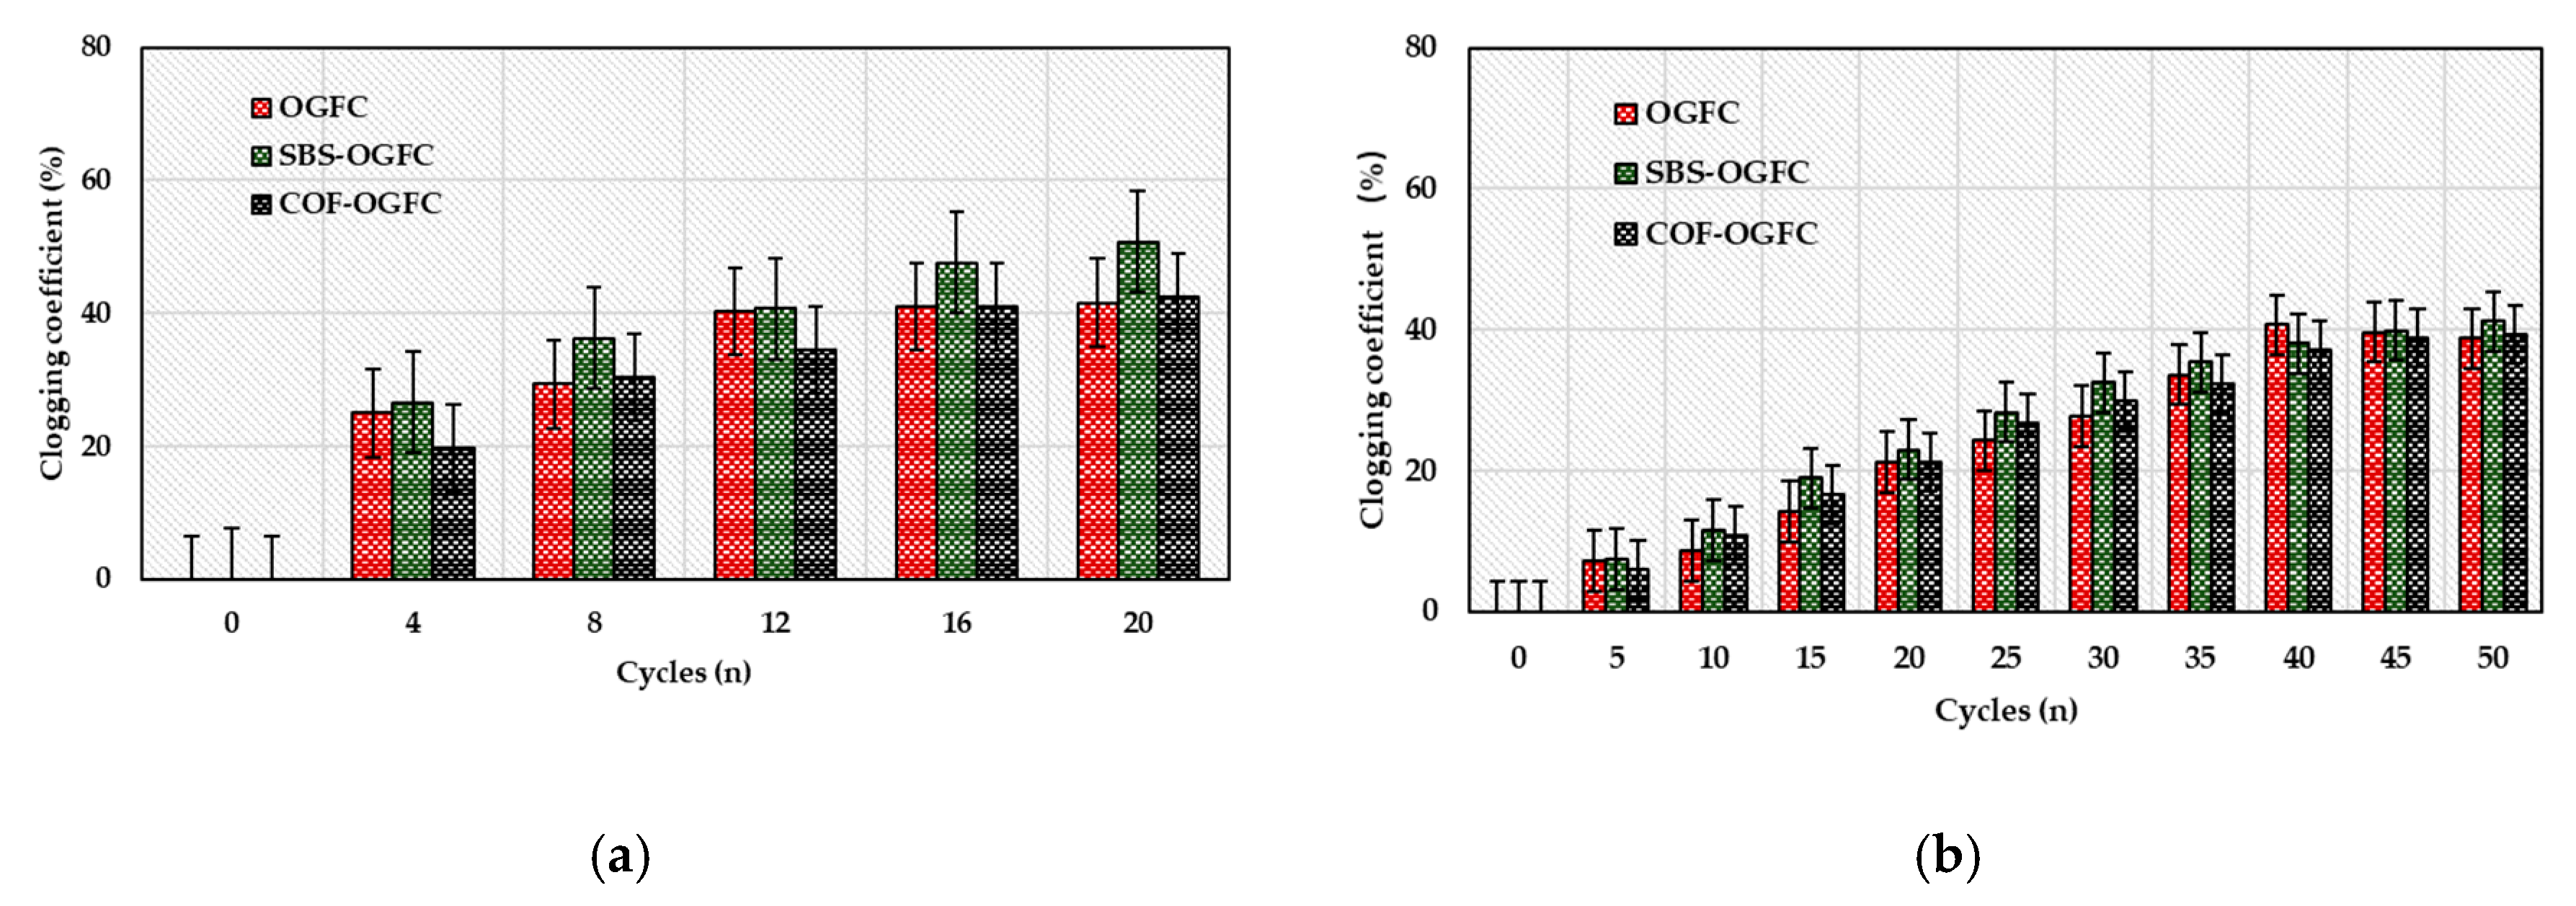
According to the grey system theory, the clogging coefficient of the three mixtures with different cycles is calculated, and the results are shown in Figure 11.
As can be seen from Figure 11a, the clogging coefficient of the three mixtures increases as the cycles increase, which indicates that the clogging state of the permeable pavement becomes increasingly serious. For the same cycles, the clogging coefficient of SBS-OGFC is always higher than that of the other two mixtures, which demonstrates that the larger the porosity of permeable asphalt pavement, the higher the probability that the clogging materials will enter the pores and cause the clogging behavior. The clogging coefficient of OGFC showed almost no charge after 12 cycles, which indicated that the rapid clogging process in spring was basically completed before 12 cycles, followed by the slow clogging process. The effect of the slow clogging process on the clogging coefficient index is not obvious. The clogging coefficient of COF-OGFC showed little change after 16 cycles, i.e., the rapid clogging process of COF-OGFC had been completed before 16 cycles. It can be seen from Figure 11b that the clogging coefficient of three asphalt mixtures increases steadily with the increase of summer clogging cycles in the first 40 cycles, and then the clogging coefficient of three asphalt mixtures enters the stable stage, which is almost consistent with the permeability coefficient, porosity and dry weight change trend. This indicated that the clogging coefficient as an indicator for evaluating the clogging state of the actual permeable pavement is an objective and reliable application. The clogging coefficients of three permeable pavement are similar in each period. This is because the gradation of the three permeable pavements is the same. After 50 summer clogging cycles, the clogging coefficient of SBS-OGFC was higher than OGFC and COF-OGFC. This is because the porosity of SBS-OGFC is the largest, and it can accommodate more clogging materials. In the last 10 summer clogging cycles, the clogging coefficient of three asphalt mixtures has almost no change, which also shows that the clogging materials content of permeable pavement almost reached saturation after 40 summer clogging cycles.

4.3. Spring-Thawing Clogging Model of OGFC Based on the Mistcherlich Growth Model

After calculation, spring-thawing clogging model of three mixtures and model parameters are summarized in Table 11 and Figure 12.
It can be seen from Table 11 that the determinant coefficient of each model is above 0.98, which indicates that the spring-thawing clogging model of the three mixtures has a higher prediction accuracy, and employing the Mistcherlich growth model is reasonable to describe the clogging process of the permeable asphalt pavement during the spring-thawing season. SBS-OGFC has the highest a value among the three mixtures, which indicates that the maximum degree of clogging of SBS-OGFC is the largest among the three mixtures. This is due to the higher porosity of the SBS-OGFC, which is consistent with the above data. The sequence of the clogging rate (index c) of the three asphalt mixtures during the spring-thawing season was OGFC > SBS-OGFC > COF-OGFC, respectively, which indicated that COF-OGFC not only has better pavement performance, but also has better permeability and resistance to rapid clogging behavior in the spring-thawing season. This may be due to the fact that oil shale waste adsorbs a large amount free asphalt, which reduces the probability that redundant asphalt blocks the effective pores, meaning that the generated pores are uniformly dispersed in the mixtures.
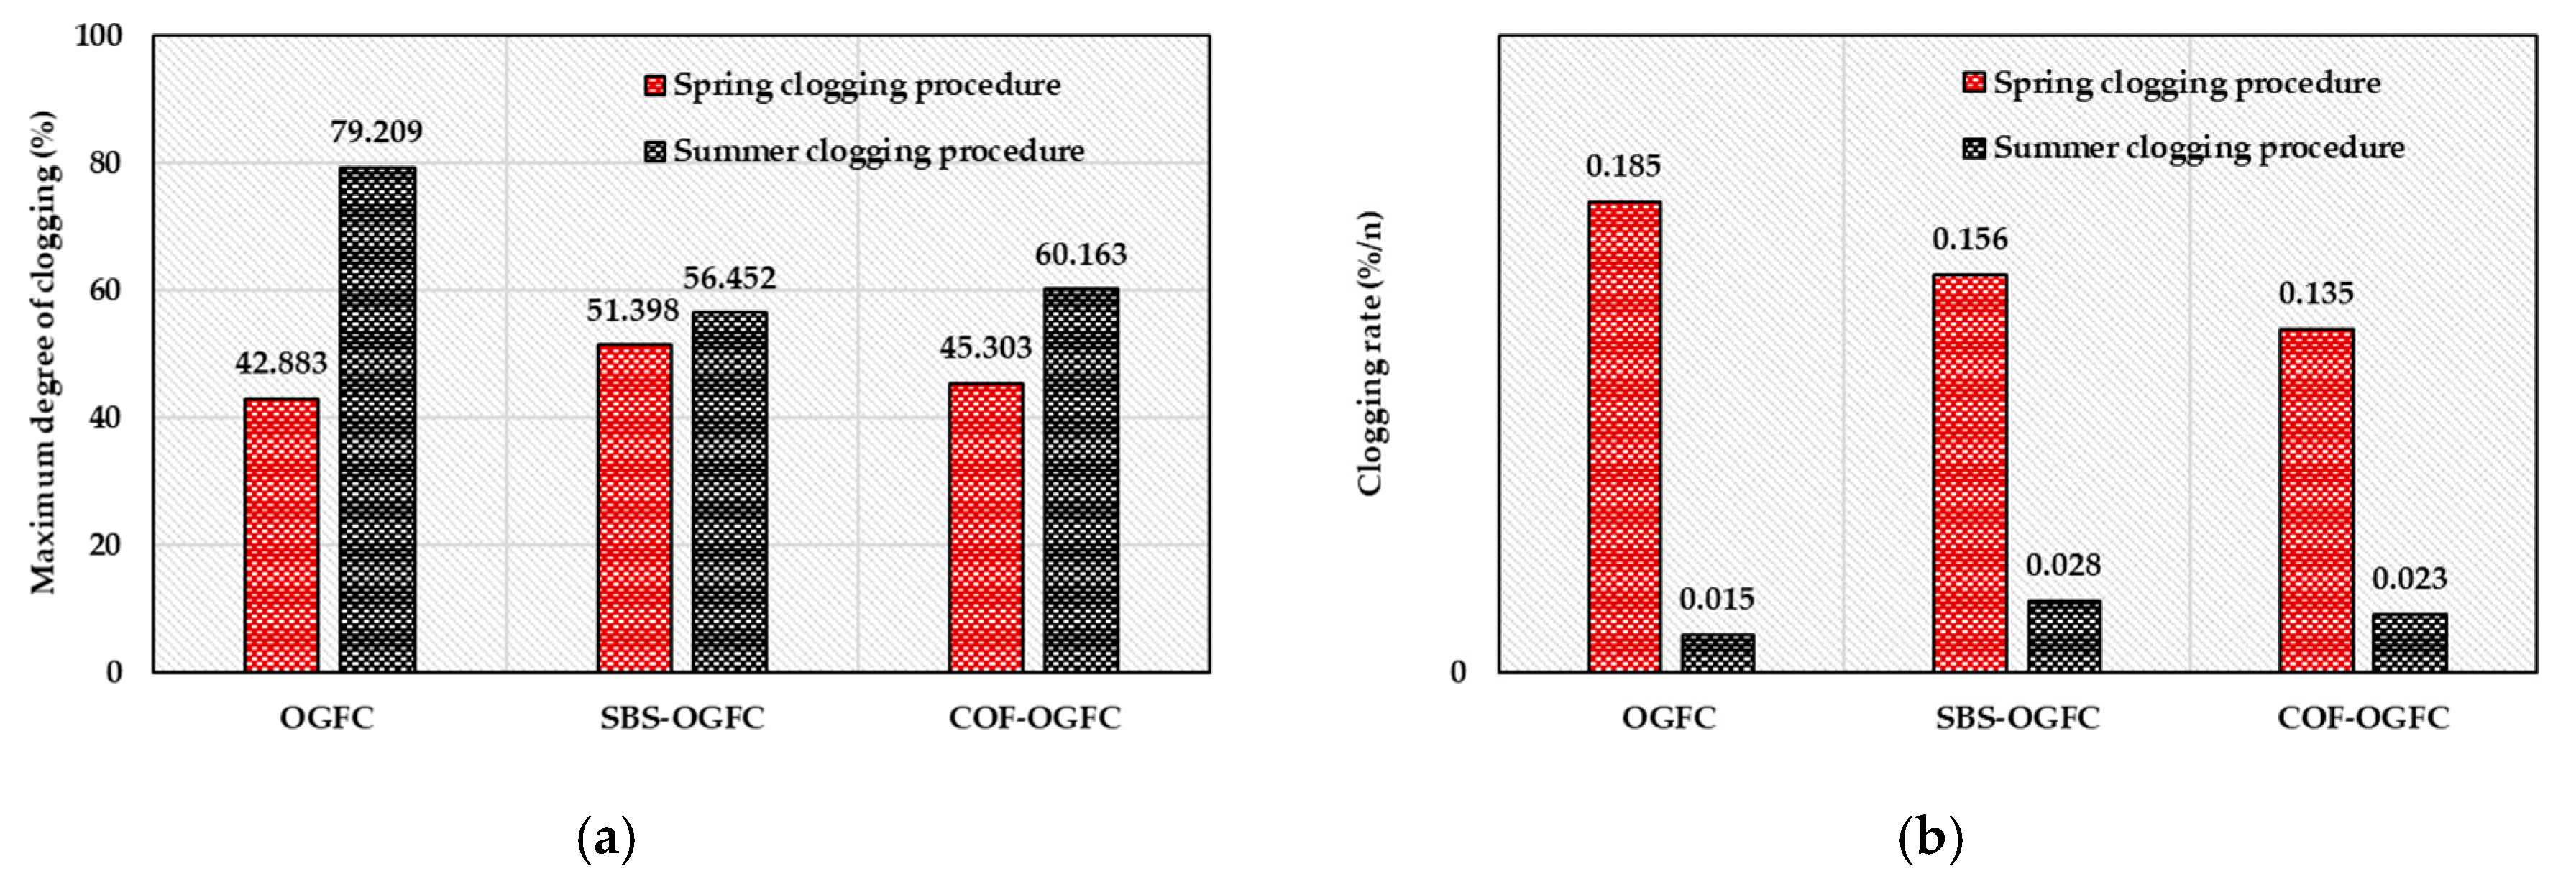
It can be seen from Figure 12 that there is a significant difference in the maximum degree of clogging and clogging rate of the three permeable asphalt pavements under the summer clogging procedure. The OGFC has the largest maximum degree of clogging and the lowest clogging rate among the three mixes under the summer clogging procedure. This may be due to the OGFC having the smallest porosity, and the particle size of the clogging materials that can enter the interior of pavement is also relatively small, which reduces the probability that effective pores are directly blocked, and increases the possibility of deposition blockage. Thus, the clogging rate of OGFC is small and the maximum degree of clogging is large.
It also can be concluded that the maximum clogging degree of permeable pavement in summer is greater than that in spring, and the clogging rate in summer is much smaller than that in spring. This indicates that there is an essential difference in the clogging behavior of the permeable pavement in spring and summer. The maximum clogging degree of the permeable pavement in summer is about 40% higher than that in spring season, while the clogging rate is much lower than that in spring, at only about 14%, which indicates that the clogging behavior of the permeable asphalt pavement in spring is mostly in the rapid clogging mode, and that in summer is mostly in a slow deposition clogging mode.
According to the above analysis, it can be seen that the COF-OGFC has an excellent maximum clogging degree and clogging rate value in summer and spring seasons, which indicates that COF-OGFC can effectively resist different modes of clogging behavior and has strong applicability. This is because the oil shale waste has a large specific surface area, dense pore structure and various mesoporous shapes, which means a larger adsorption area and lower probability of redundant asphalt blocking the effective pore. The oil shale waste reshapes the pore structure of permeable asphalt pavement and enhances the permeability properties and resistance to the clogging behavior of permeable asphalt pavement.

4.4. Effect of Particle Size of Clogging Materials on Clogging of COF-OGFC Base on the Gray Relation Entropy Theory

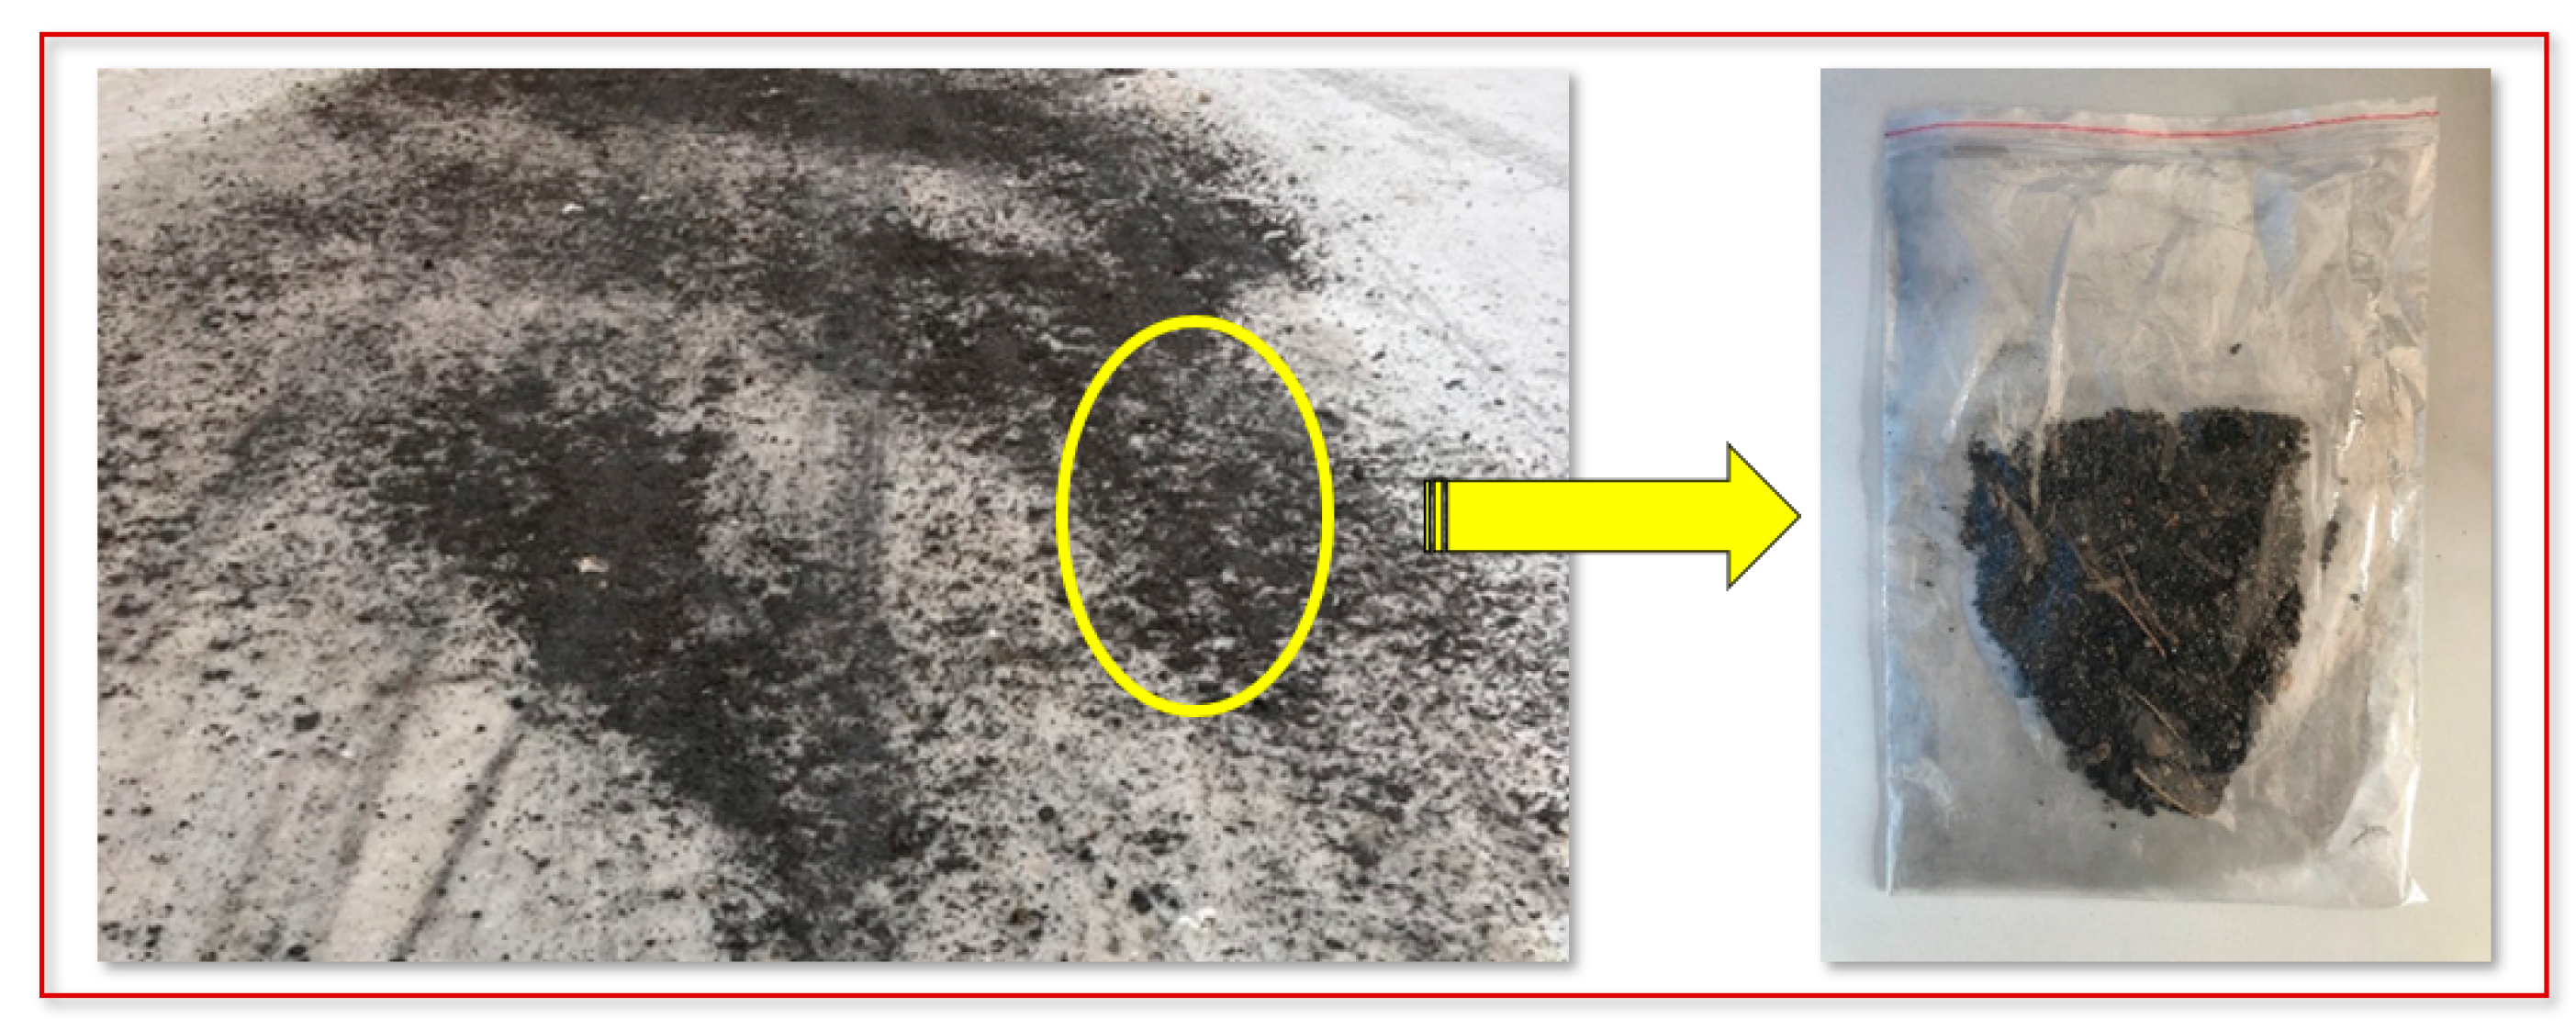
Through the above analysis, it is seen that the spring clogging behavior of the permeable pavement in the seasonal frozen region is in a rapid clogging mode, which makes the permeable asphalt pavement quickly lose its permeable function in a short time. Therefore, the effect of particle size of clogging materials on spring clogging behavior of the permeable pavement was discussed in this section, which can provide a reference for the design of the permeable pavement.
In this study, the sieved fine sand is synthesized into four clogging materials with different gradation: powdery clogging materials, sandy clogging materials, gravelly clogging materials, and full-scale clogging materials, according to the above statistics on the particle size distribution of spring clogging materials. The gradation of powdery clogging materials, sandy clogging materials, gravelly clogging materials, and full-scale clogging materials is shown in Table 12.
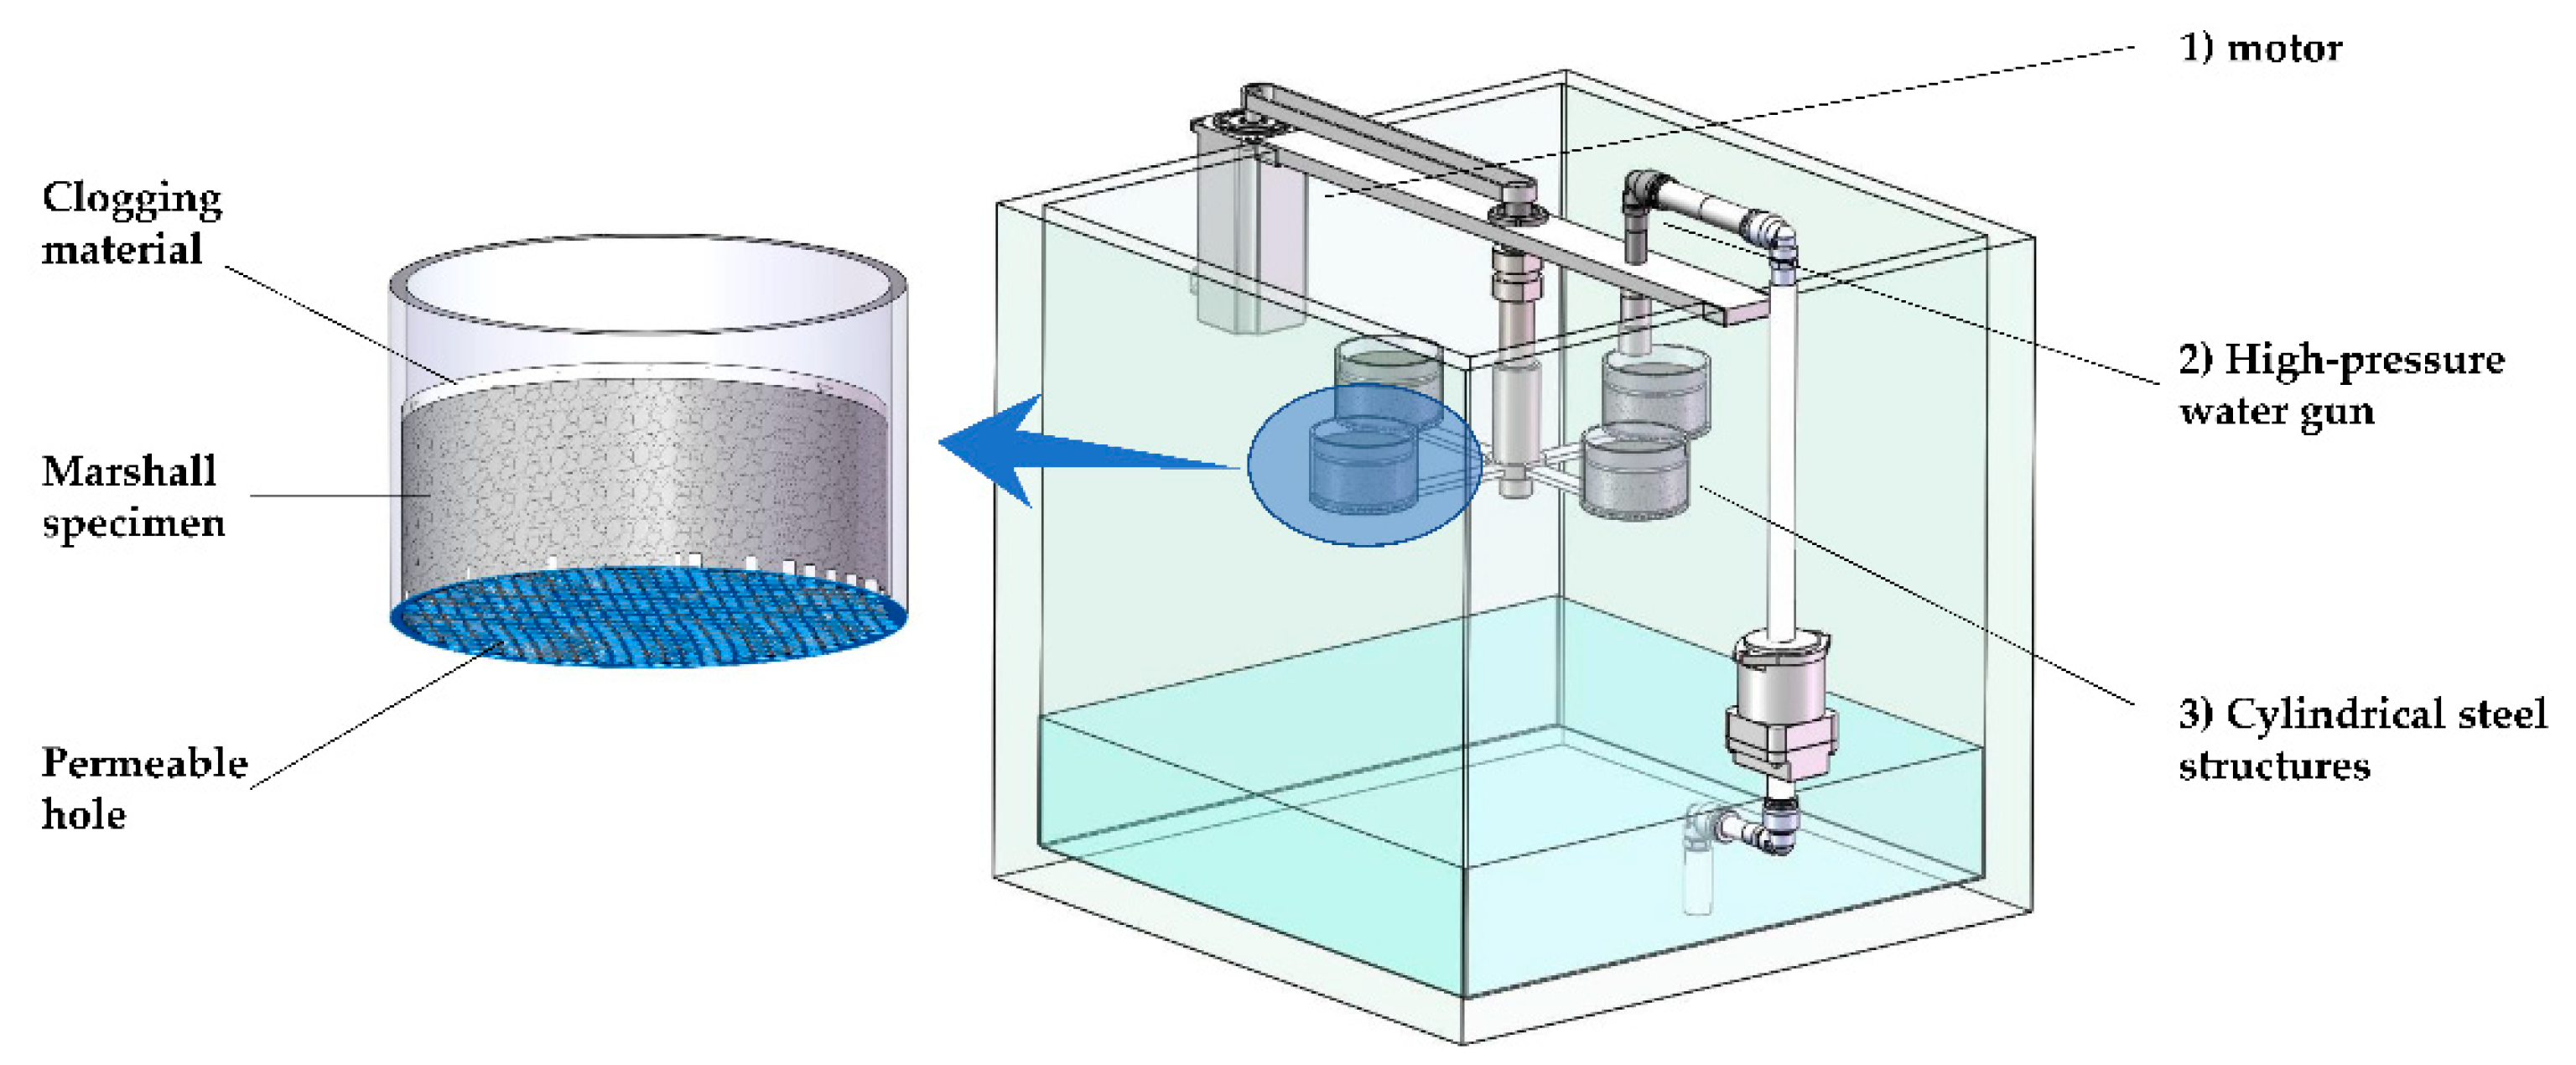
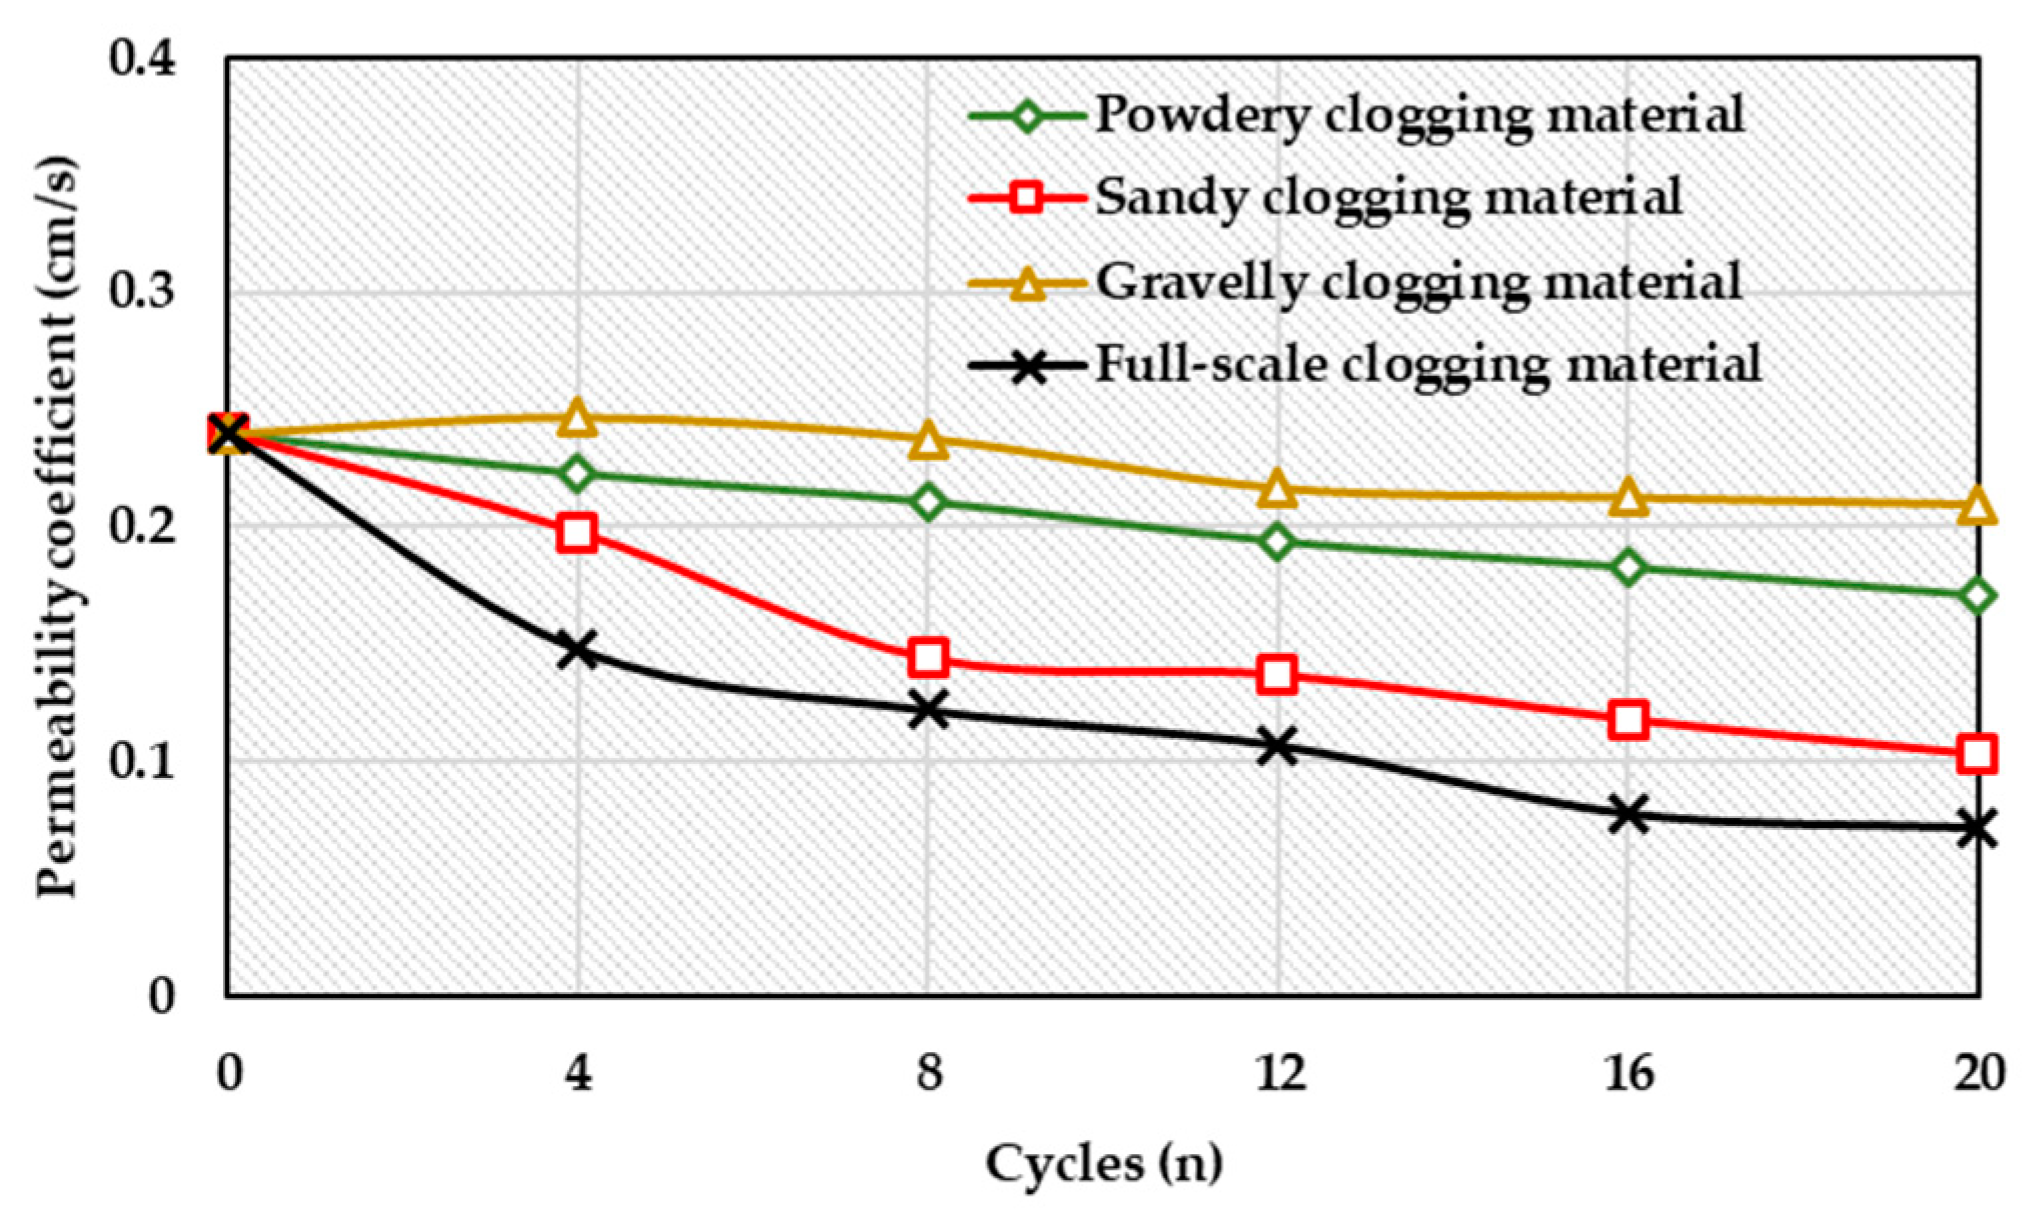
In this study, the spring physical clogging procedure was applied to evaluate the effect of the particle size of clogging materials on the clogging of COF-OGFC. In order to remain consistent with the above procedure, the simulated vehicle speed is 80 km/h, the water gun pressure is set to 2561.6 KPa, the rotation speed of the cylindrical structure is set to 420 rad/min, and the scouring time of one cycle is 4.8 min. The mass of the clogging materials deposited on the surface of the Marshall specimen before cycles is 43 g, and the dry weight, porosity and permeability coefficient of specimen are measured every 4 cycles for a total of 20 cycles. The permeability coefficient of COF-OGFC with different clogging materials is shown in Figure 13.
It can be observed in Figure 13 that the permeability coefficients of COF-OGFC with powdery clogging materials, sandy clogging materials, gravelly clogging materials, and full-scale clogging materials were reduced to 71%, 43%, 88%, and 30% of the initial value after 20 cycles. It can be seen that the gravelly clogging materials had the least influence on the permeability coefficient of COF-OGFC, which is because the large-size clogging materials are more easily embedded in the open pores of the surface and do not easily enter the pavement to form an accumulation. Moreover, the gap between the clogging materials embedded in the open pores of the surface is larger, which has little influence on the permeability of COF-OGFC. The full-scale clogging materials have the greatest influence on the permeability coefficient of COF-OGFC. This is because the large-size clogging materials are embedded in the interconnected pores, and the small-size clogging materials accumulate and fill the remaining pores, resulting in the complete blockage of the permeability path of COF-OGFC. The effect of powdery clogging materials on the permeability coefficient of COF-OGFC is also small. This is because the two-phase mixture containing the powdery clogging materials and the water flow can smoothly flow out of the pavement surface along the interconnected pores. The powdery clogging materials do not easily form an intrusion in the interconnected pores, and only the accumulation formed by powdery clogging materials has little effect on the permeability coefficient of COF-OGFC.
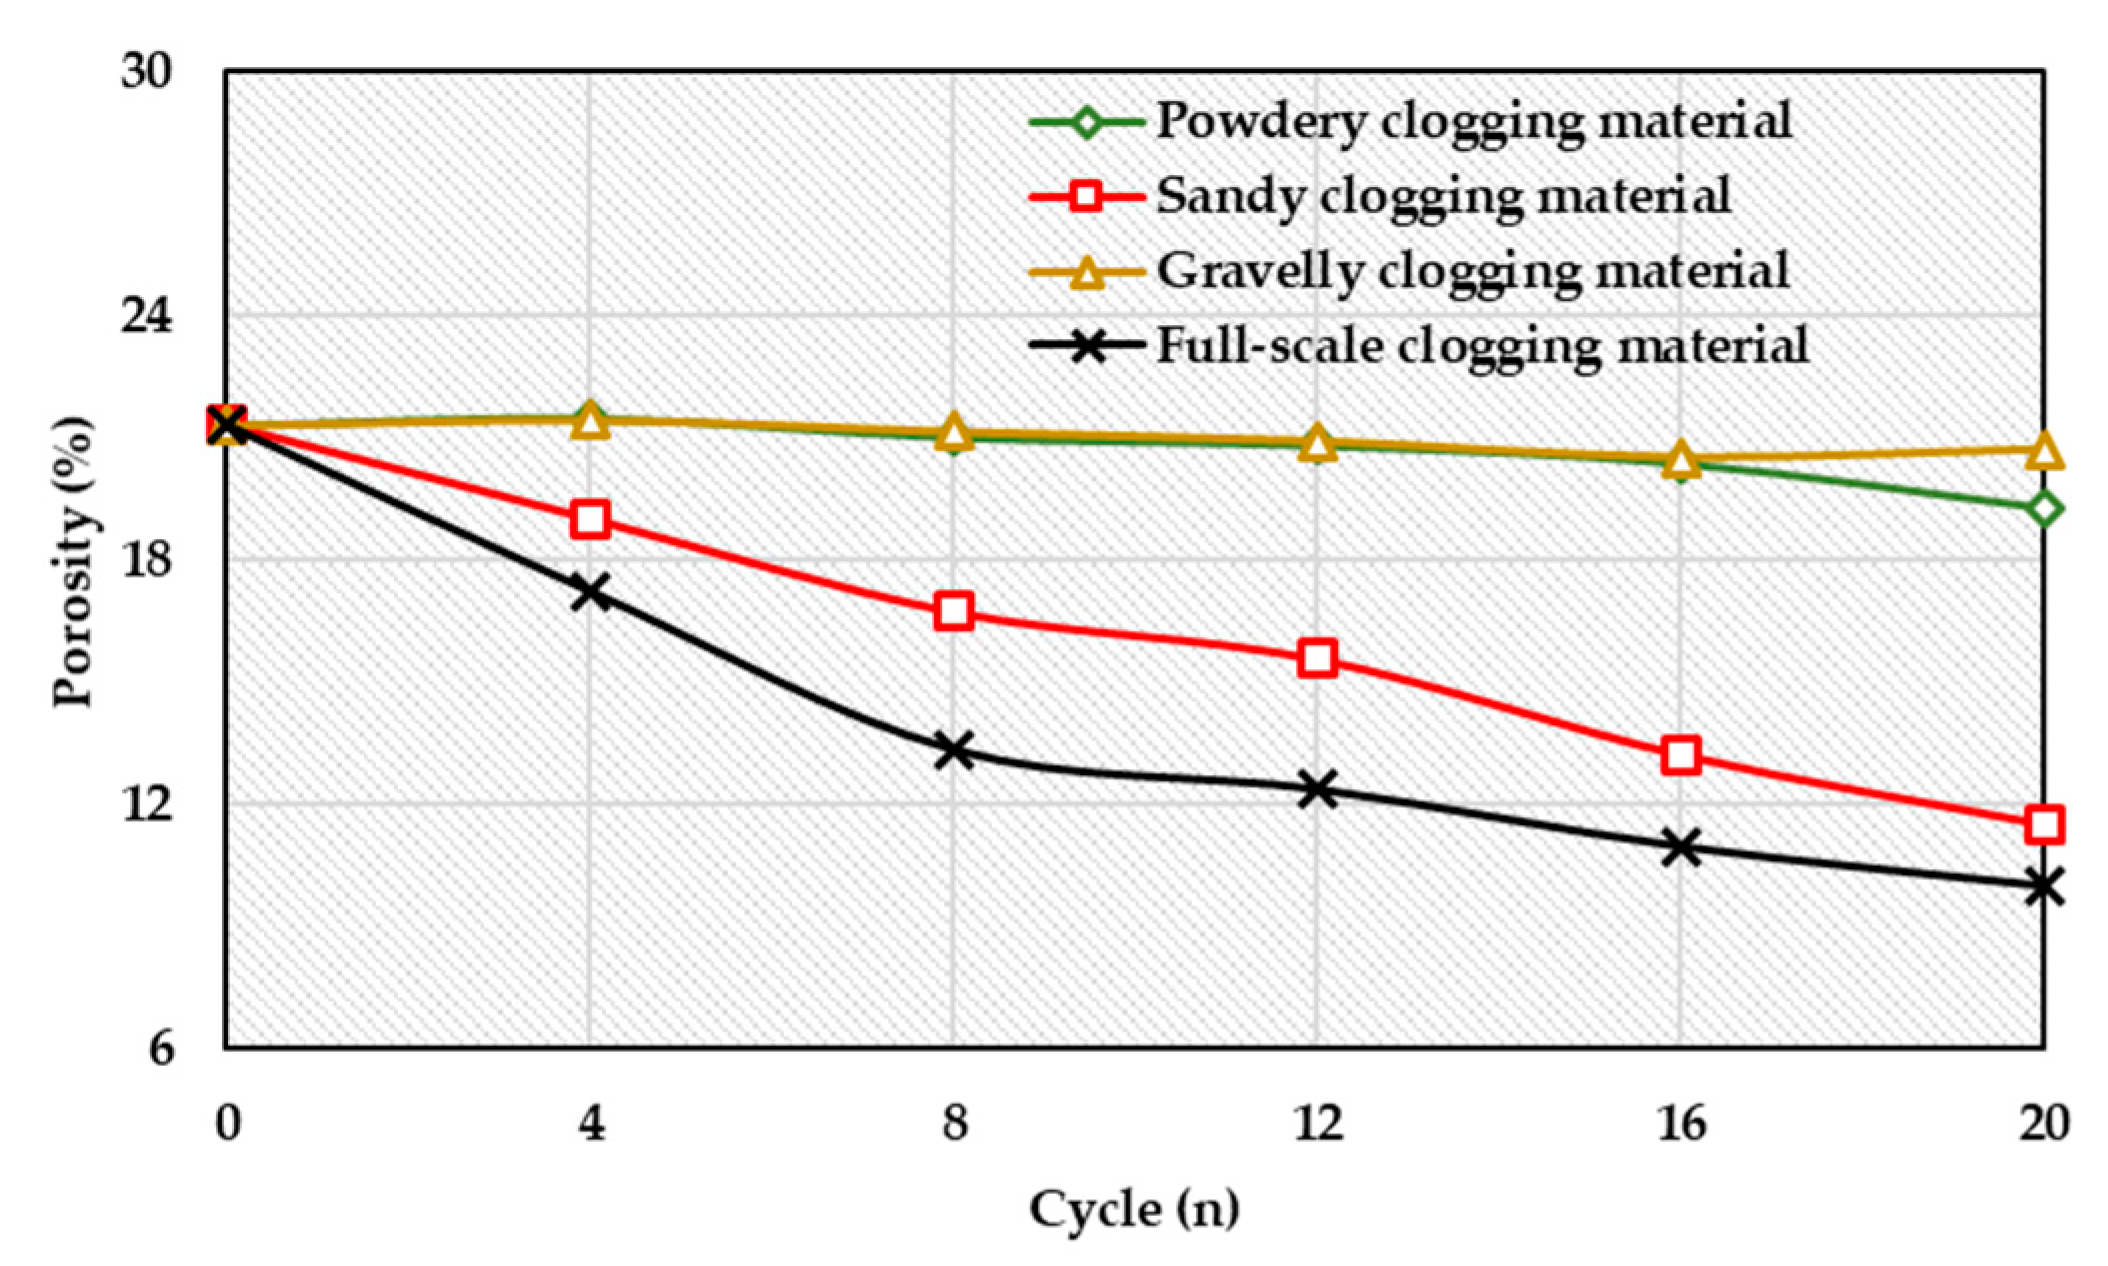
The porosity of COF-OGFC with different clogging materials is shown in Figure 14.
Figure 14 shows that the porosities of COF-OGFC with powdery clogging materials, sandy clogging materials, gravelly clogging materials and full-scale clogging materials were reduced to 90%, 53%, 97% and 57% of the initial value after 20 cycles. This also indicates that powdery clogging materials and gravelly clogging materials have little effect on the porosity of OGFC, which is consistent with the permeability test results. The main reason for this is that the clogging materials with a larger size or smaller size cannot remain in the interior of the COF-OGFC, and sandy clogging materials are easily retained in the permeable pavement due to the proper size.
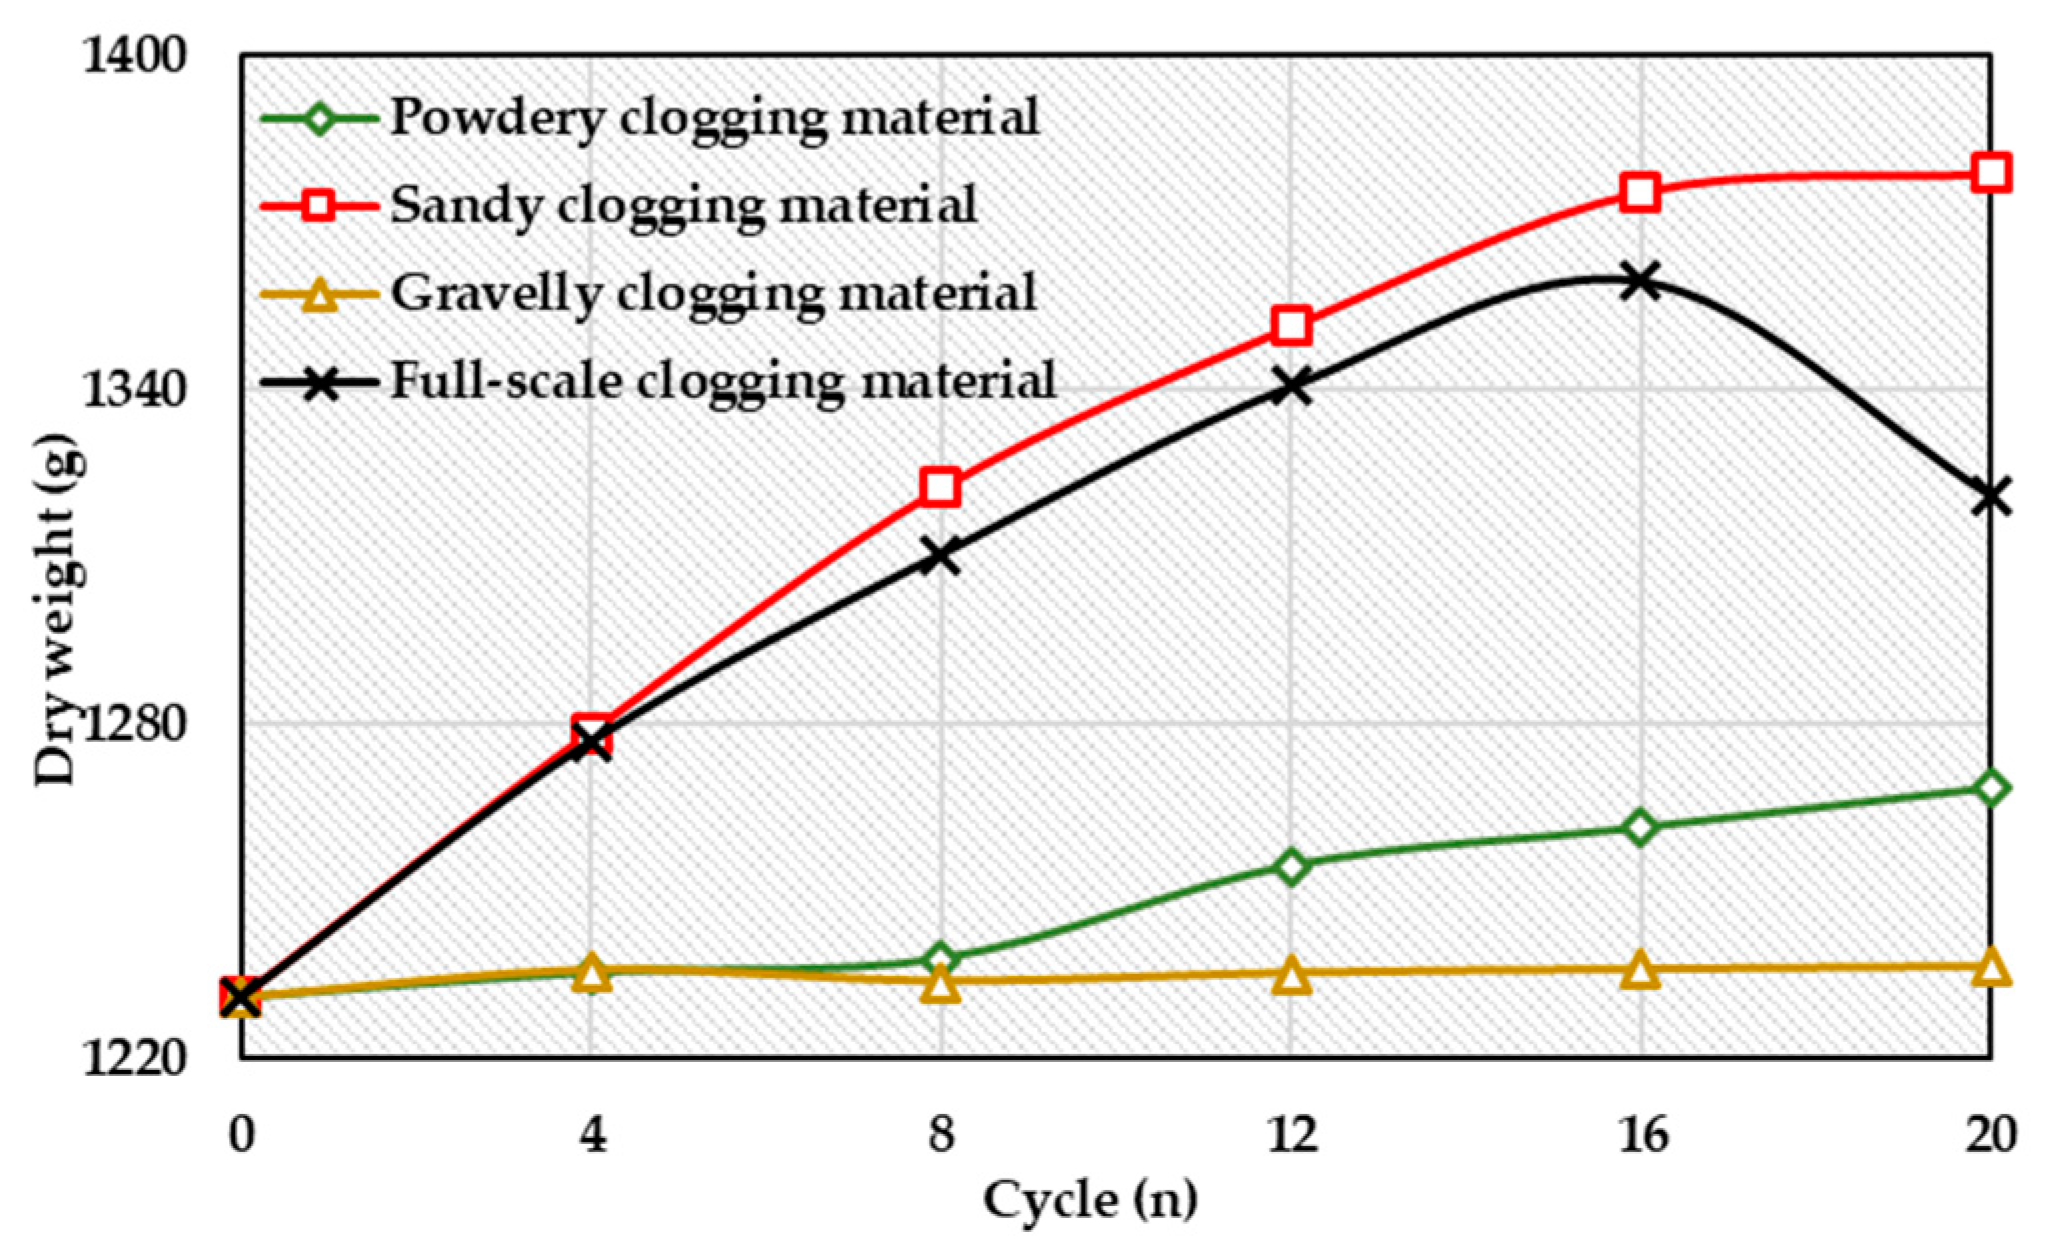
The dry weight of COF-OGFC with different clogging materials is shown in Figure 15.
It can be seen from Figure 15 that, as the cycles increase, the dry weight of COF-OGFC with different clogging materials increases. The increase in the dry weight of COF-OGFC with sandy clogging materials and full-scale clogging materials was quite obvious. After 20 cycles, the dry weight of COF-OGFC with sandy clogging materials and full-scale clogging materials increased by 148.27 g and 90.26 g, respectively. The dry weight change of COF-OGFC with powdery clogging materials and gravelly clogging materials was not significant, and after 20 cycles, the dry weight of COF-OGFC with powdery clogging materials and gravelly clogging materials increased by 37.73 g and 5.64 g, respectively. However, compared with the permeability coefficient and porosity index, the dry weight of COF-OGFC with powdery clogging materials changes more obviously, which may be due to the fact that the clogging materials with a small size can easily enter the pavement under the hydraulic gradient and dynamic water scouring, and the infiltrated clogging materials can only be attached to uneven grooves in the pores or in semi-connected pores. The accumulation of small-size clogging materials only causes a significant change in dry weight and does not affect the porosity and permeability coefficient of COF-OGFC. The dry weight of COF-OGFC with full-scale clogging materials was 1359.57 g after 16 cycles and 1320.96 g after 20 cycles. The dry weight of COF-OGFC with full-scale clogging materials suddenly decreased, but the porosity and permeability coefficient indexes did not fluctuate abnormally, and still increased steadily. This is because the aggregate on the surface of specimens falls off under the long-term scouring, and the abnormal mass change is ascribed to the aggregate falling from the surface, so it does not affect the porosity and permeability coefficient of COF-OGFC.
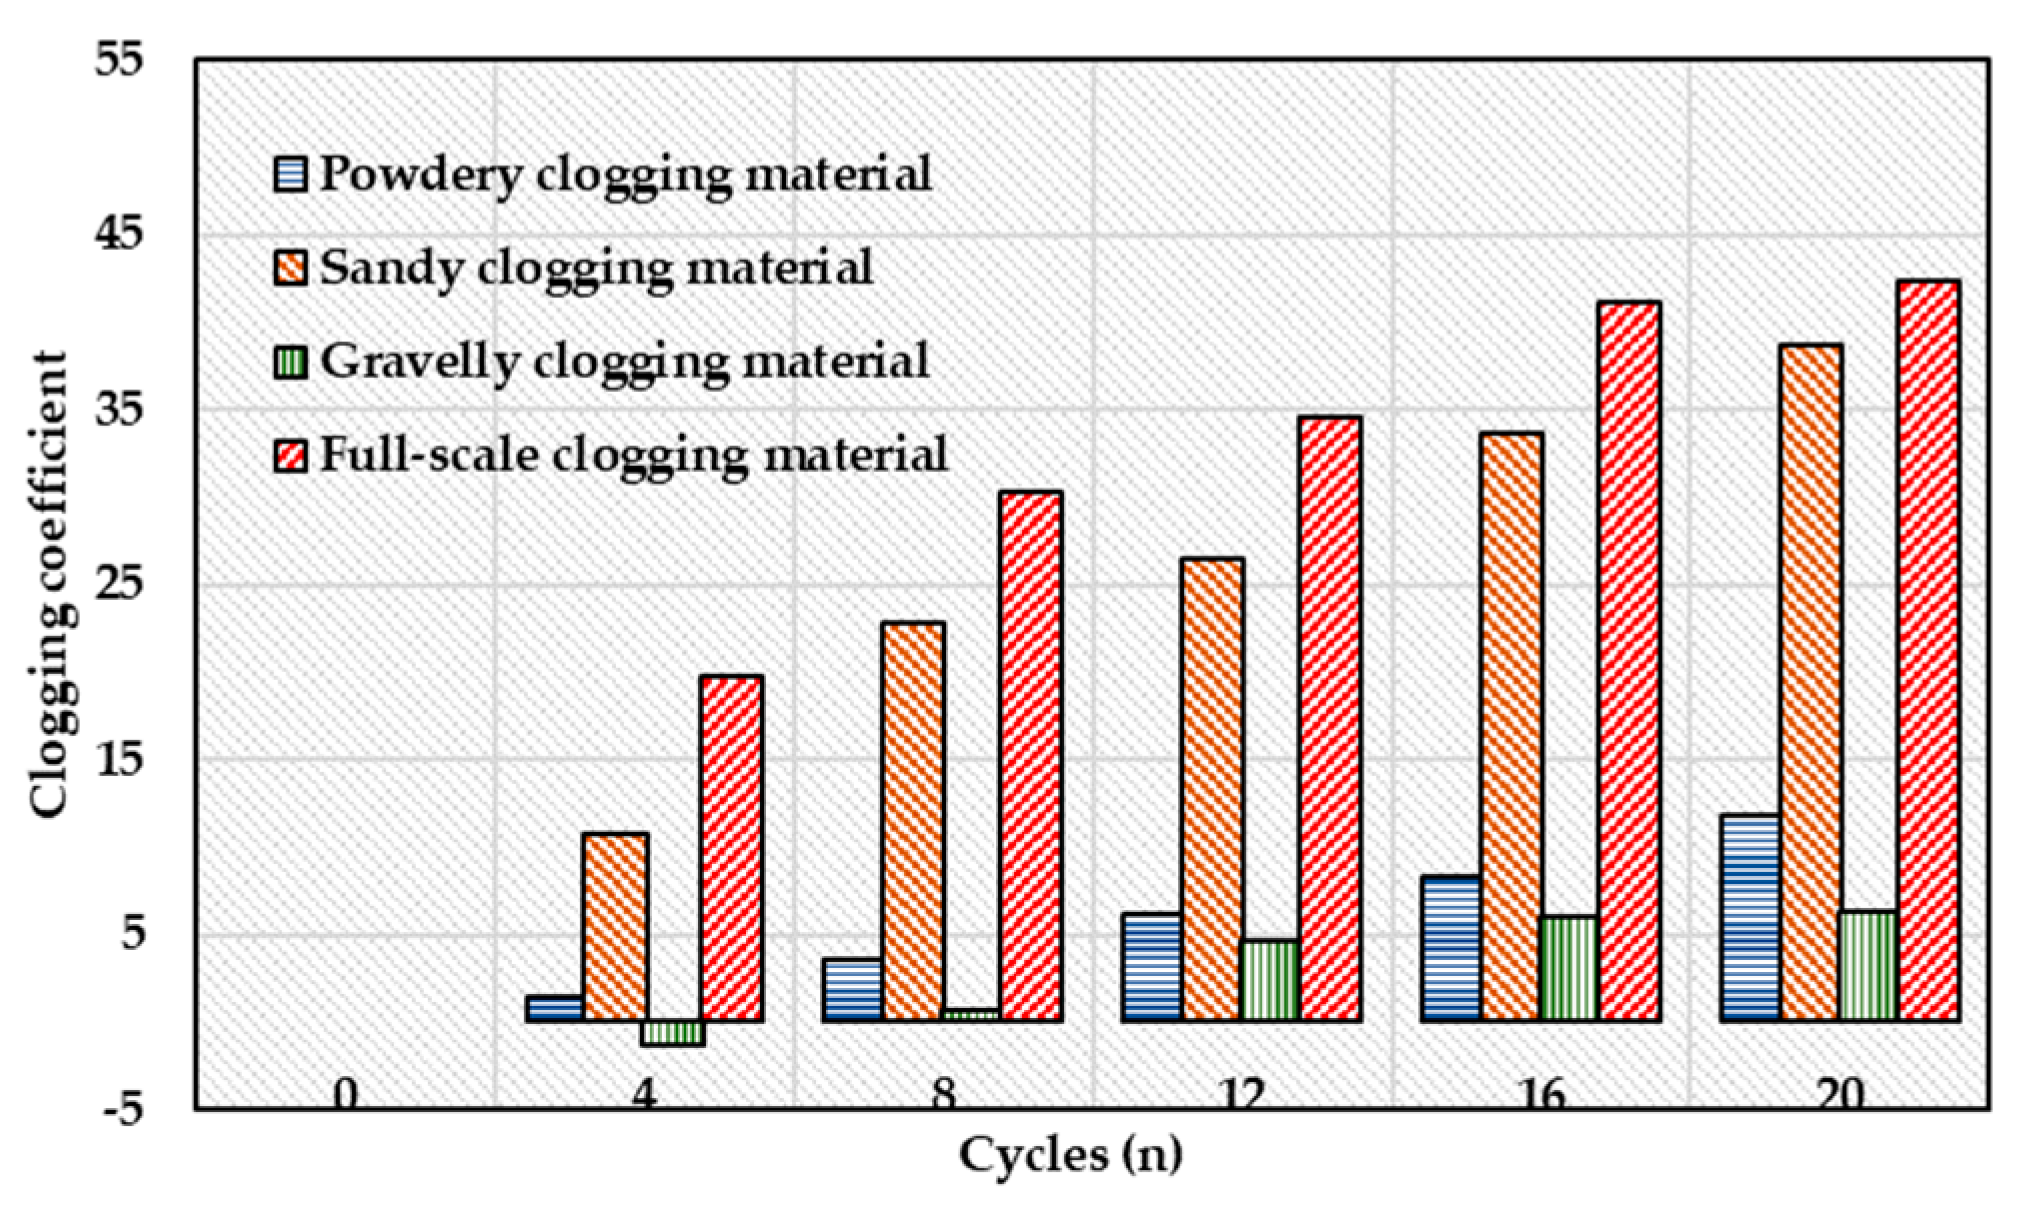
According to the calculation method of the clogging coefficient in Section 4.1, the clogging coefficient COF-OGFC with different clogging materials was calculated and is summarized in Figure 16.
In this study, the clogging coefficient of full-scale clogging materials is used as the characterization of the clogging state, i.e., the systematic characteristic behavior sequence in the grey entropy correlation analysis, the powdery clogging materials, sandy clogging materials, and gravelly clogging materials as the factor sequence. Thus, the correlation degree between the systematic characteristic behavior sequence and correlation factor sequences is calculated according to the gray relation entropy theory. The results are as shown in Table 13.
As can be observed in Table 13, the sequence of grey entropy correlation of three clogging materials was sandy clogging materials > powdery clogging materials > gravelly clogging materials, respectively, which indicates that gravelly clogging materials have the least influence on the clogging behavior of permeable pavement, and the particle size ranges from 1180 μm to 4750 μm. This may be because the large-size clogging materials are more easily embedded in the open pores of the surface, and do not easily enter the pavement to form an accumulation. Moreover, the gap between the clogging materials embedded in the open pores of the surface is larger, which has little influence on the permeability of COF-OGFC. The powdery clogging materials have a greater influence on the spring clogging process compared with gravelly clogging materials, and the particle size range is below 150 μm. This is because the size of clogging materials in this particle size range is small. The clogging materials could flow out of the surface along the interconnected pores under dynamic water scouring, but there are always some clogging materials which remain inside the pavement, which accumulate at the interconnected pores with smaller drops, affecting the permeability of the pavement. The most important influence on the spring clogging behavior is the sandy clogging materials, and the particle size ranges from 150 μm to 1180 μm. The size of the sandy clogging materials is moderate, and it can move to a deeper position inside the pavement under dynamic water scouring, forming an accumulation and blocking water flow, thus causing the permeability functional failure of permeable pavement.

5. Conclusions

Oil shale waste (OSW), as a fine aggregate in the mixture (with a particle size less than 4.75 mm), can effectively improve the overall properties of open grade friction course (OGFC), but the permeability durability is not clear. Thus, a comprehensive investigation of the permeability durability of OSW as a fine aggregate is essential to achieve a better understanding in order to promote its engineering application. In this study, the long-term permeability when using oil shale waste as a fine aggregate in OGFC was systematically investigated based on a self-developed laboratory physical clogging procedure, and the physical clogging model of COF-OGFC was established based on the Mistcherlich growth model. Moreover, the effect of the particle size of clogging materials on the clogging of COF-OGFC in the spring-thawing season was discussed based on the gray relation entropy theory. The main conclusions are as follows:
  • The self-developed laboratory physical clogging procedure illustrated that the utilization of oil shale waste as a fine aggregate could effectively improve the permeability durability of OGFC. This may be due to the large specific surface area, dense pore structure, and various mesoporous shapes of OSW, which means a larger adsorption area and lower probability of redundant asphalt blocking the effective pore compared with SBS-OGFC and COF-OGFC.
  • A comprehensive index of the clogging coefficient containing mass, porosity, and permeability coefficient was proposed based on gray relation entropy theory. The clogging coefficient index can truly and effectively characterize the clogging state of the actual permeable mixture. Moreover, the Mistcherlich growth model is reasonable to describe the physical clogging process of permeable asphalt pavement. The model parameters a and c could be used to evaluate the clogging rate and maximum clogging degree of permeable pavement, respectively.
  • Through a quantitative assessment of the clogging procedure of permeable pavement in spring and summer, it was found that there is an essential difference in the clogging behavior of the permeable pavement in spring and summer. The maximum clogging degree of the permeable pavement in summer is about 40% higher than that in spring, while the clogging rate is much lower than that in spring, at only about 14%, which indicates that the clogging behavior of permeable asphalt pavement in spring is mostly in a rapid clogging mode, and that in summer is mostly in a slow deposition clogging mode.
  • Three clogging materials with different gradations were prepared to determine the effect of the particle size of clogging materials on the clogging behavior of COF-OGFC during the spring-thawing season. It was found that the most important influence on the spring clogging behavior of COF-OGFC is the sandy clogging materials, and the particle size ranges from 150 μm to 1180 μm, which can be used to provide a reference for the design of anti-slip sand.

Author Contributions

Conceptualization, W.G. and W.D.; Data curation, X.C., Z.L. and Y.A.; Formal analysis, Y.L. and Y.A.; Funding acquisition, X.G.; Methodology, W.G.; Project administration, X.G.; Software, X.C.; Validation, W.D.; Writing—original draft, Y.L. and Y.A.; Writing—review & editing, W.G., X.G. and W.D. All authors have read and agreed to the published version of the manuscript.

Funding

This research was funded by the National Nature Science Foundation of China (NSFC) (Grant No. 51178204) and Jilin Province Science and Technology Development Plan Project (20190303033SF).

Conflicts of Interest

The authors declare that there is no conflict of interest regarding the publication of this paper.

References

  1. Jiang, W.; Sha, A.M.; Xiao, J.J. Experimental Study on Relationships among Composition, Microscopic Void Features, and Performance of Porous Asphalt Concrete. J. Mater. Civ. Eng. 2015, 27, 04015028. [Google Scholar] [CrossRef]
  2. Kumar, K.; Kozak, J.; Hundal, L.; Cox, A.; Zhang, H.; Granato, T. In-situ infiltration performance of different permeable pavements in a employee used parking lot—A four-year study. J. Environ. Manag. 2016, 167, 8–14. [Google Scholar] [CrossRef] [PubMed]
  3. Rahman, A.; Imteaz, M.A.; Arulrajah, A.; Piratheepan, J.; Disfani, M.M. Recycled construction and demolition materials in permeable pavement systems: Geotechnical and hydraulic characteristics. J. Clean. Prod. 2015, 90, 183–194. [Google Scholar] [CrossRef]
  4. Kuruppu, U.; Rahman, A.; Rahman, M.A. Permeable pavement as a stormwater best management practice: A review and discussion. Environ. Earth Sci. 2019, 78, 327. [Google Scholar] [CrossRef]
  5. Rodriguez-Hernandez, J.; Andrés-Valeri, V.C.; Calzada-Pérez, M.A.; Vega-Zamanillo, A.; Castro-Fresno, D. Study of the raveling resistance of porous asphalt pavements used in sustainable drainage systems affected by hydrocarbon spills. Sustainability 2015, 7, 16226–16236. [Google Scholar] [CrossRef] [Green Version]
  6. Drake, J.A.P.; Bradford, A.; Marsalek, J. Review of environmental performance of permeable pavement systems: State of the knowledge. Water Qual. Res. J. Can. 2013, 48, 203–222. [Google Scholar] [CrossRef]
  7. Collins, K.A.; Hunt, W.F.; Hathaway, J.M. Hydrologic comparison of four types of permeable pavement and standard asphalt in eastern North Carolina. J. Hydrol. Eng. 2008, 13, 1146–1157. [Google Scholar] [CrossRef]
  8. Scholz, M.; Grabowiecki, P. Review of permeable pavement systems. Build. Environ. 2007, 42, 3830–3836. [Google Scholar] [CrossRef]
  9. Jayakaran, A.D.; Knappenberger, T.; Stark, J.D.; Hinman, C. Remediation of Stormwater Pollutants by Porous Asphalt Pavement. Water. 2019, 11, 520. [Google Scholar] [CrossRef] [Green Version]
  10. Zhu, X.; Ye, F.; Cai, Y.; Birgisson, B.; Lee, K. Self-healing properties of ferrite-filled open-graded friction course (OGFC) asphalt mixture after moisture damage. J. Clean. Prod. 2019, 232, 518–530. [Google Scholar] [CrossRef]
  11. Xu, H.N.; Yao, X.G.; Wang, D.W.; Tan, Y. Investigation of anisotropic flow in asphalt mixtures using the X-ray image technique: Pore structure effect. Road Mater. Pavement Des. 2019, 20, 491–508. [Google Scholar] [CrossRef]
  12. Mampearachchi, W.K.; Masakorala, S.R.; Umasangar, K. Aggregate interlocking of open-graded friction courses with compaction effort. J. Natl. Sci. Found. Sri Lanka 2019, 47, 139–146. [Google Scholar] [CrossRef]
  13. Dai, Z.; Shen, J.; Shi, P.; Zhu, H.; Li, X. Nano-sized morphology of asphalt components separated from weathered asphalt binders. Constr. Build. Mater. 2018, 182, 588–596. [Google Scholar] [CrossRef]
  14. Chen, J.; Yin, X.; Wang, H.; Ding, Y. Evaluation of durability and functional performance of porous polyurethane mixture in porous pavement. J. Clean. Prod. 2018, 188, 12–19. [Google Scholar] [CrossRef]
  15. Luo, S.; Qian, Z.D.; Xue, Y.C. Performance evaluation of open-graded epoxy asphalt concrete with two nominal maximum aggregate sizes. J. Cent. South Univ. 2015, 22, 4483–4489. [Google Scholar] [CrossRef]
  16. Hou, L.; Feng, S.; Hou, Z.; Ding, Y.; Zhang, S. Experimental study on rainfall-runoff relation for porous pavements. Hydrol. Res. 2008, 39, 181–190. [Google Scholar] [CrossRef]
  17. Yoo, C.; Ku, J.M.; Jun, C.; Zhu, J.H. Simulation of infiltration facilities using the SEEP/W model and quantification of flood runoff reduction effect by the decrease in CN. Water Sci. Technol. 2016, 74, 118–129. [Google Scholar] [CrossRef]
  18. Chui, T.F.M.; Liu, X.; Zhan, W. Assessing cost-effectiveness of specific LID practice designs in response to large storm events. J. Hydrol. 2016, 533, 353–364. [Google Scholar] [CrossRef]
  19. Brattebo, B.O.; Booth, D.B. Long-term stormwater quantity and quality performance of permeable pavement systems. Water Res. 2003, 37, 4369–4376. [Google Scholar] [CrossRef]
  20. Liu, C.Y.; Chui, T.F.M. Factors Influencing Stormwater Mitigation in Permeable Pavement. Water 2017, 9, 988. [Google Scholar] [CrossRef] [Green Version]
  21. Bai, Y.R.; Li, Y.H.; Zhang, R.Y. Comprehensive Performance Evaluation System Based on Environmental and Economic Benefits for Optimal Allocation of LID Facilities. Water 2019, 11, 341. [Google Scholar] [CrossRef] [Green Version]
  22. Martins, V.; Igor, C.; Ghisi, E.; Thives, L.P. Life cycle energy assessment and economic feasibility of stormwater harvested from pervious pavement. Water Res. 2019, 170, 115322. [Google Scholar] [CrossRef]
  23. Dougherty, M.; Hein, M.; Martina, B.A.; Ferguson, B.K. Quick surface infiltration test to assess maintenance needs on small pervious concrete sites. J. Irrig. Drain. Eng. 2011, 137, 553–563. [Google Scholar] [CrossRef]
  24. Ranieri, V.; Colonna, P.; Sansalone, J.J.; Sciddurlo, A. Measurement of hydraulic conductivity in porous mixes. J. Transp. Res. Board 2012, 2295, 1–10. [Google Scholar] [CrossRef]
  25. Sañudo-Fontaneda, L.A.; Andrés-Valeri, V.C.A.; Rodriguez-Hernandez, J.; Castro-Fresno, D. Field study of infiltration capacity reduction of porous mixture surfaces. Water 2014, 6, 661–669. [Google Scholar] [CrossRef] [Green Version]
  26. Sañudo-Fontaneda, L.A.; Andres-Valeri, V.C.; Costales-Campa, C.; Cabezon-Jimenez, I.; Cadenas-Fernandez, F. The Long-Term Hydrological Performance of Permeable Pavement Systems in Northern Spain: An Approach to the “End-of-Life” Concept. Water 2018, 10, 4. [Google Scholar] [CrossRef] [Green Version]
  27. Razzaghmanesh, M.; Beecham, S. A Review of Permeable Pavement Clogging Investigations and Recommended Maintenance Regimes. Water 2018, 10, 3. [Google Scholar] [CrossRef] [Green Version]
  28. Kazemi, H.; Rockaway, T.D.; Rivard, J.; Abdollahian, S. Assessment of Surface Infiltration Performance and Maintenance of Two Permeable Pavement Systems in Louisville, Kentucky. J. Sustain. Water Built Environ. 2017, 3, 04017009. [Google Scholar] [CrossRef]
  29. Wang, Q.; Chen, X.; Jha, A.N.; Rogers, H. Natural gas from shale formation—The evolution, evidences and challenges of shale gas revolution in United States. Renew. Sustain. Energy Rev. 2014, 30, 1–28. [Google Scholar] [CrossRef]
  30. Gale, J.F.W.; Laubach, S.E.; Olson, J.E.; Eichhubl, P.; Fall, A. Natural fractures in shale: A review and new observations. AAPG Bull. 2014, 98, 2165–2216. [Google Scholar] [CrossRef]
  31. Montgomery, S.L.; Jarvie, D.M.; Bowker, K.A.; Pollastro, R.M. Mississippian Barnett Shale, Fort Worth basin, north-central texas: Gas-shale play with multi-trillion cubic foot potential. AAPG Bull. 2005, 89, 155–175. [Google Scholar] [CrossRef]
  32. Bowker, K.A. Barnett Shale gas production, Fort Worth Basin: Issues and discussion. AAPG Bull. 2007, 91, 523–533. [Google Scholar] [CrossRef]
  33. Hadi, N.A.R.A.; Abdelhadi, M. Characterization and utilization of oil shale ash mixed with granitic and marble wastes to produce lightweight bricks. Oil Shale 2018, 35, 56–69. [Google Scholar] [CrossRef]
  34. Aljbour, S.H. Production of ceramics from waste glass and jordanian oil shale ash. Oil Shale 2016, 33, 260–271. [Google Scholar] [CrossRef]
  35. Cheng, Y.C.; Wang, W.S.; Tan, G.J.; Shi, C.L. Assessing high- and low-temperature properties of asphalt pavements incorporating waste oil shale as an alternative material in Jilin Province, China. Sustainability 2018, 10, 2179. [Google Scholar] [CrossRef] [Green Version]
  36. Guo, X.; Chen, X.; Li, Y.; Li, Z.; Guo, W. Using Sustainable Oil Shale Waste Powder Treated with Silane Coupling Agent for Enriching the Performance of Asphalt and Asphalt Mixture. Sustainability 2019, 11, 4857. [Google Scholar] [CrossRef] [Green Version]
  37. Guo, W.; Guo, X.; Chen, X.; Li, Y.; Li, Z.; Dai, W. Aggregate-Bitumen Interface Enhancement Mechanism of Utilization of Oil Shale Waste as Fine Aggregate in Open Grade Friction Course. Coatings 2019, 9, 637. [Google Scholar] [CrossRef] [Green Version]
  38. Guo, W.; Guo, X.; Chen, X.; Dai, W. Properties Analysis of Oil Shale Waste as Partial Aggregate Replacement in Open Grade Friction Course. Appl. Sci. 2018, 8, 1626. [Google Scholar] [CrossRef] [Green Version]
  39. Zhang, P.Y.; Pang, B.; Li, Y.Y.; Hong, X.; Qin, C.; Zheng, H. Analyzing spatial disparities of economic development in Yellow River Basin, China. GeoJournal 2019, 84, 303–320. [Google Scholar] [CrossRef]
  40. Zheng, Z.; Zha, B.; Xuchen, Y.; Yuan, H.; Gao, Y.; Zhang, H. Adaptive Edge Detection Algorithm Based on Grey Entropy Theory and Textural Features. IEEE Access 2019, 7, 92943–92954. [Google Scholar] [CrossRef]
  41. Chu, F.F.; Hao, P.F. Evolutionary Development and Influencing Factors of Service Outsourcing Efficiency in Jiangsu Province Based on DEA and Grey Relational Entropy. J. Grey Syst. 2019, 31, 41–51. [Google Scholar]
  42. Liu, Z. Study on Demand Deduction and Dispatch of Emergency Relief Supllies; Beijing University of Posts and Telecommunications: Beijing, China, 2014. [Google Scholar]
Figure 1. The microscopic appearance of oil shale waste.
Applsci 10 00419 g001
Figure 2. Gradation of open graded friction course (OGFC)-16 in the test.
Applsci 10 00419 g002
Figure 3. Anti-slip sand thrown on permeable pavement.
Applsci 10 00419 g003
Figure 4. Dynamic water scouring application device.
Applsci 10 00419 g004
Figure 5. The variation of scouring pressure with time at different speeds.
Applsci 10 00419 g005
Figure 6. Clogging materials’ coverage density at different collection locations.
Applsci 10 00419 g006
Figure 7. The synthetic gradations of clogging materials in spring.
Applsci 10 00419 g007
Figure 8. Permeability coefficient of three permeable asphalt mixtures with different cycles in spring and summer. (a) Spring clogging procedure; (b) Summer clogging procedure.
Applsci 10 00419 g008
Figure 9. Porosity of the three permeable asphalt mixtures with different cycles. (a) Spring clogging procedure; (b) Summer clogging procedure.
Applsci 10 00419 g009
Figure 10. Dry weight of three permeable asphalt mixtures with different cycles. (a) Spring clogging procedure; (b) Summer clogging procedure.
Applsci 10 00419 g010
Figure 11. Clogging coefficient of three mixtures with different cycles. (a) Spring clogging procedure; (b) Summer clogging procedure.
Applsci 10 00419 g011
Figure 12. Clogging parameters of three mixtures in summer and spring season. (a) Maximum degree of clogging; (b) Clogging rate.
Applsci 10 00419 g012
Figure 13. Permeability coefficient of COF-OGFC with different clogging materials.
Applsci 10 00419 g013
Figure 14. Porosity of COF-OGFC with different clogging materials.
Applsci 10 00419 g014
Figure 15. Dry weight of COF-OGFC with different clogging materials.
Applsci 10 00419 g015
Figure 16. Clogging coefficient COF-OGFC with different clogging materials.
Applsci 10 00419 g016
Table 1. Technical parameters of AH-90 base asphalt.
ItemUnitTest ResultsSpecification RequirementTest Procedure
15 °C densityg·cm−31.003N/AT 0603-2011
25 °C penetration100 g, 5 s, 0.1 mm81.380–100T 0604-2011
Softening point°C44.2≥42T 0606-2011
25 °C ductilitycm>130≥100T 0605-2011
Wax content%≤1.8≤3T 0615-2011
Flash point°C340N/AT 0611-2011
Solubility%≥99.9≥99T 0607-2011
Table 2. Technical parameters of oil shale waste (OSW).
Technical ParametersApparent DensityWater AbsorptionCrushing ValueCohesionInternal Friction AngleOptimum Water Rate
Unitg/cm3%%KPa°%
OSW2.62718.642.213.8433.328.3
Table 3. Main chemical composition of OSW.
Chemical CompositionSiO2CaOAl2O5Fe2O3MgOAshOthers
Percentage (%)55.3822.284.725.342.019.710.56
Table 4. Technical parameters of aggregate.
Item0–4.75 mm4.75–9.5 mm9.5–16 mm16–26 mmSpecification RequirementTest Procedure
Apparent specific gravity/g·cm−32.702.742.782.78≥2.6T 0328
Bulk specific gravity/g·cm−32.552.642.762.77N/AT 0304
Crushing value/%N/A14.115.5N/A≤26T 0316
Los Angeles abrasion value/%N/A9.79.0N/A≤28T 0317
Elongated particles content/%N/A5.85.4N/A≤12T 0312
≤0.075 mm particle content/%N/A0.30.2N/A≤1T 0310
Table 5. Technical parameters of mineral powder.
ItemUnitTest ResultsSpecification RequirementTest Procedure
Apparent specific gravityg·cm−32.799≥2.5T 0352
Water absorption%0.3≤1T 0103
Granular composition<0.6 mm%100100T 0351
<0.15 mm%99.290–100
<0.075 mm%97.975–100
Hydrophilic coefficientN/A0.6≤1T 0353
Table 6. Clogging materials collection locations.
NumberRegionPavement GradeLocationPavement Type
1Urban areaHeavy-duty roadRenmin StreetAsphalt pavement
2Heavy-duty roadYatai StreetAsphalt pavement
3Non-overloaded roadWenchang StreetAsphalt pavement
4Non-overloaded roadNanling CommunityConcrete pavement
5Suburban areaHeavy-duty roadXincheng StreetAsphalt pavement
6Heavy-duty roadFuzhi StreetAsphalt pavement
7Non-overloaded roadYinxing StreetAsphalt pavement
8Non-overloaded roadLangtian CommunityConcrete pavement
Table 7. Particle size score table of clogging materials.
Particle Size Range (μm)Mesh Hole Number (n)Granularity Attribute
2360–47504Fine gravel
1180–23608Very coarse sand
600–118016Coarse sand
300–60030Medium sand
150–30050Fine sand
75–150100Very fine sand
<75200Silt
Table 8. Corresponding relationship between vehicle and water gun pressure and the rotation speed of the cylindrical structure.
Speed of Vehicle (km/h)In-Field Measured Pressure (KPa)Water Gun Pressure (KPa)Rotation Speed of Cylindrical Structure (rad/min)
40161.3511201.3210
60209.6921863.4300
80324.242561.6420
Table 9. Particle size distribution of clogging materials at different collection locations in the spring-thawing season.
Granularity AttributeSize RangeNo. 1No. 2No. 3No. 4No. 5No. 6No. 7No. 8
Fine gravel2360–4750 μm10.85%12.74%52.4%44.8%8.74%9.32%7.63%6.74%
Very coarse sand1180–2360 μm23.44%19.88%20.74%30.74%12.69%20.77%18.69%27.32%
Coarse sand600–1180 μm19.53%20.76%12.54%10.1%20.53%18.4%20.74%30.98%
Medium sand300–600 μm25.75%27.43%7.85%8.49%29.87%20.68%14.63%14.48%
Fine sand150–300 μm11.6%10.3%2.33%3.33%18.43%29.16%35.55%14.36%
Very fine sand75–150 μm5.79%5.98%3.17%1.74%5.34%1.44%1.03%3.79%
Silt<75 μm3.04%2.91%0.97%0.8%4.4%0.23%1.73%2.33%
Table 10. Particle size distribution of clogging materials at different collection locations in the summer season.
Granularity AttributeSize RangeNo. 1No. 2No. 3No. 4No. 5No. 6No. 7No. 8
Very coarse sand1180–2360 μm2.73%5.12%1.3%3.62%2.69%0%2.06%0.93%
Coarse sand600–1180 μm4.34%10.7%2.11%6.94%2.62%1.53%5.42%1.78%
Medium sand300–600 μm20.17%22.04%28.74%23.11%12.4%19.21%10.27%28.44%
Fine sand150–300 μm30.52%17.3%17.63%28.68%27.31%20.41%22.84%18.1%
Very fine sand75–150 μm23.07%18.39%30.22%16.74%20.44%22.36%28.67%30.63%
Silt<75 μm19.17%26.45%20%20.91%34.54%36.49%30.74%20.12%
Table 11. Spring-thawing clogging model and model parameters of three mixtures.
SeasonTypeFitting EquationabcR2
SpringOGFC y ( t ) = 42.883 42.444 e 0.185 t 42.88342.4440.1850.980
SBS-OGFC y ( t ) = 51.398 50.681 e 0.156 t 51.39850.6810.1560.990
COF-OGFC y ( t ) = 45.303 45.064 e 0.135 t 45.30345.0640.1350.996
SummerOGFC y ( t ) = 79.209 79.754 e 0.015 t 79.20979.7540.0150.976
SBS-OGFC y ( t ) = 56.452 56.926 e 0.028 t 56.45256.9260.0280.997
COF-OGFC y ( t ) = 60.163 60.836 e 0.023 t 60.16360.8360.0230.996
Table 12. The gradation of powdery clogging materials, sandy clogging materials, gravelly clogging materials and full-scale clogging materials.
Granularity AttributeSize RangePowdery Clogging MaterialsSandy Clogging MaterialsGravelly Clogging MaterialsFull-Scale Clogging Materials
Fine gravel2360–4750 μm0046.8%19.2%
Very coarse sand1180–2360 μm0053.2%21.8%
Coarse sand600–1180 μm036%019.2%
Medium sand300–600 μm034.8%018.6%
Fine sand150–300 μm029.2%015.6%
Very fine sand75–150 μm62.5%003.5%
Silt<75 μm37.5%002.1%
Table 13. Calculation results of correlation factor sequences by gray relation entropy theory.
Correlation Factor SequencesPowdery Clogging MaterialsSandy Clogging MaterialsGravelly Clogging Materials
Gray relational entropy1.7544011.7838481.716498
Grey entropy correlation0.979150.9955840.957996

