
Therapeutic Effects of Crocin Alone or in Combination with Sorafenib against Hepatocellular Carcinoma: In Vivo & In Vitro Insights


Abstract
:1. Introduction
2. Materials and Methods
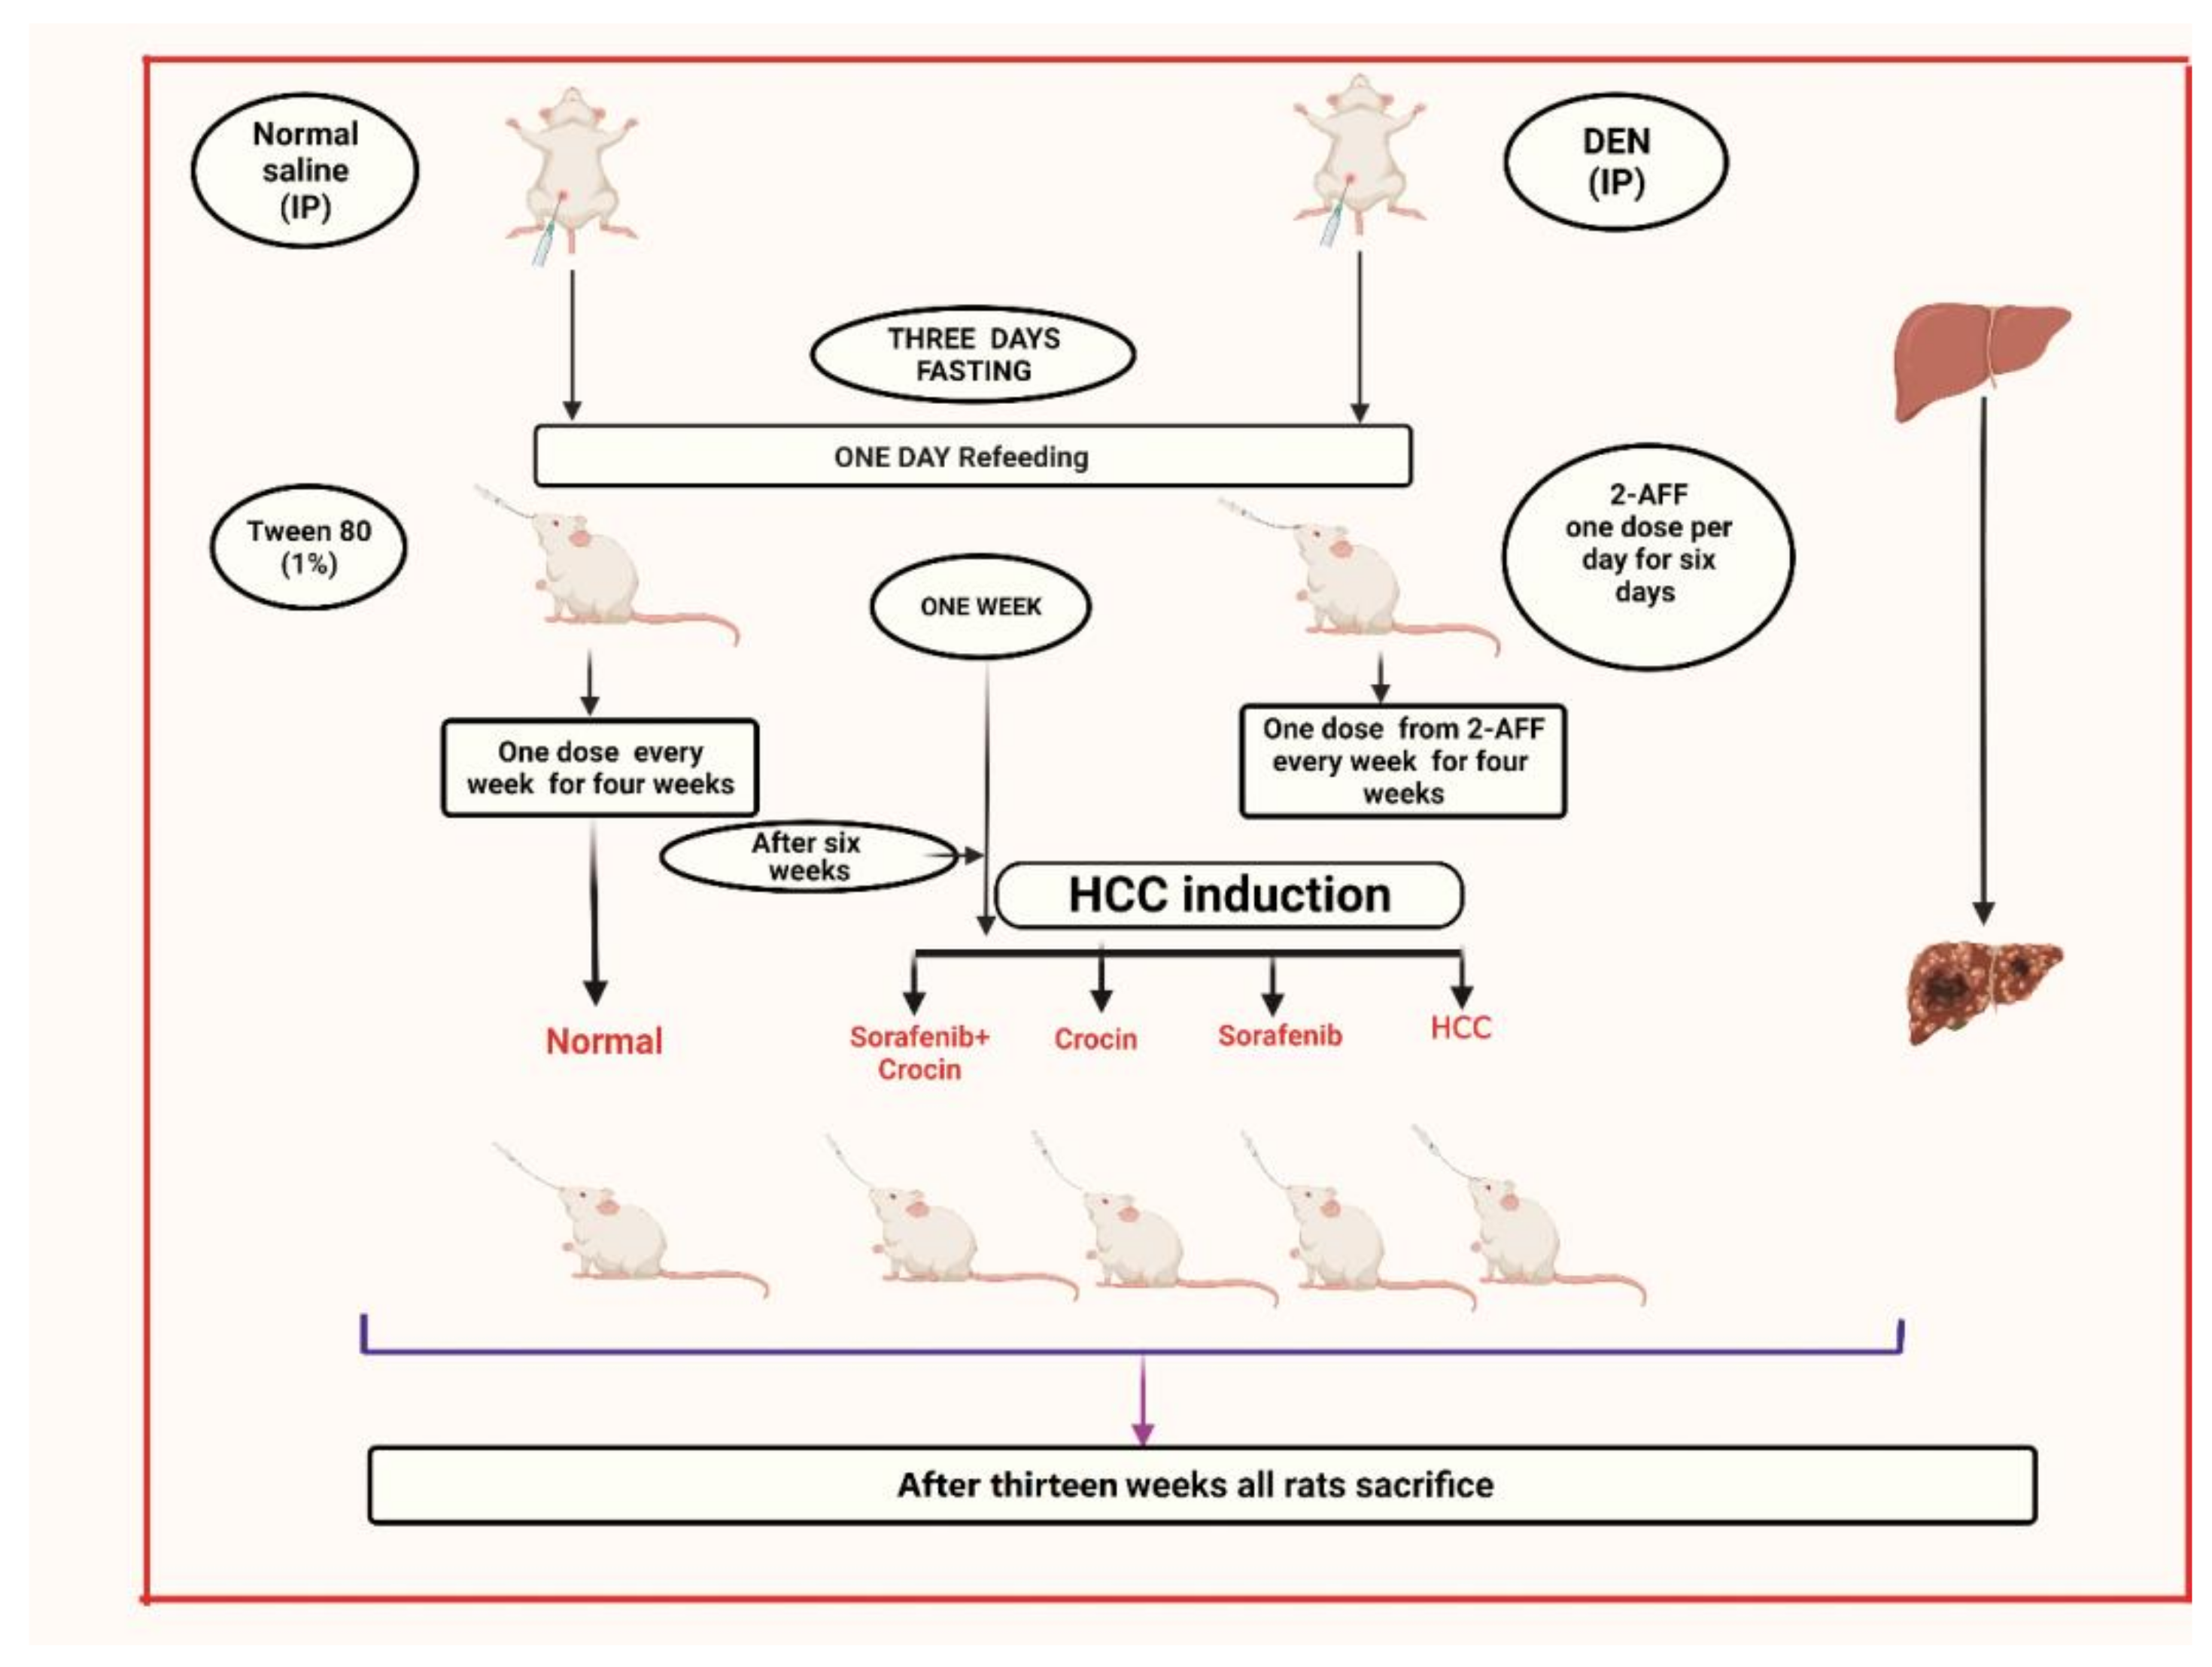
2.1. Animals, Hepatocarcinogenesis Induction and Treatment
- Group 1: Non-induced rats (control group).
- Group 2: HCC induced rats.
- Group 3: HCC induced rats treated with crocin.
- Group 4: HCC induced rats treated with sorafenib
- Group 5: HCC induced rats treated with crocin/sorafenib combination.
2.2. Evaluation of Serum Biochemical Parameters
2.3. Evaluation of Liver Homogenate Biomarkers
2.4. Histopathological Staining
2.5. Immunohistochemistry
2.6. Molecular Analysis by Real-Time PCR
2.7. Cancer Cell Line
2.8. Cytotoxicity Assay
2.9. Cell Cycle Analysis
2.10. Apoptosis Assays
2.11. Statistical Analysis
3. Results
3.1. Effect of Crocin and Sorafenib Treatment on HCC Induced Rats
3.1.1. Effect of Crocin and Sorafenib on Liver and Body Weights
3.1.2. Effect of Crocin and Sorafenib on Biochemical Parameters
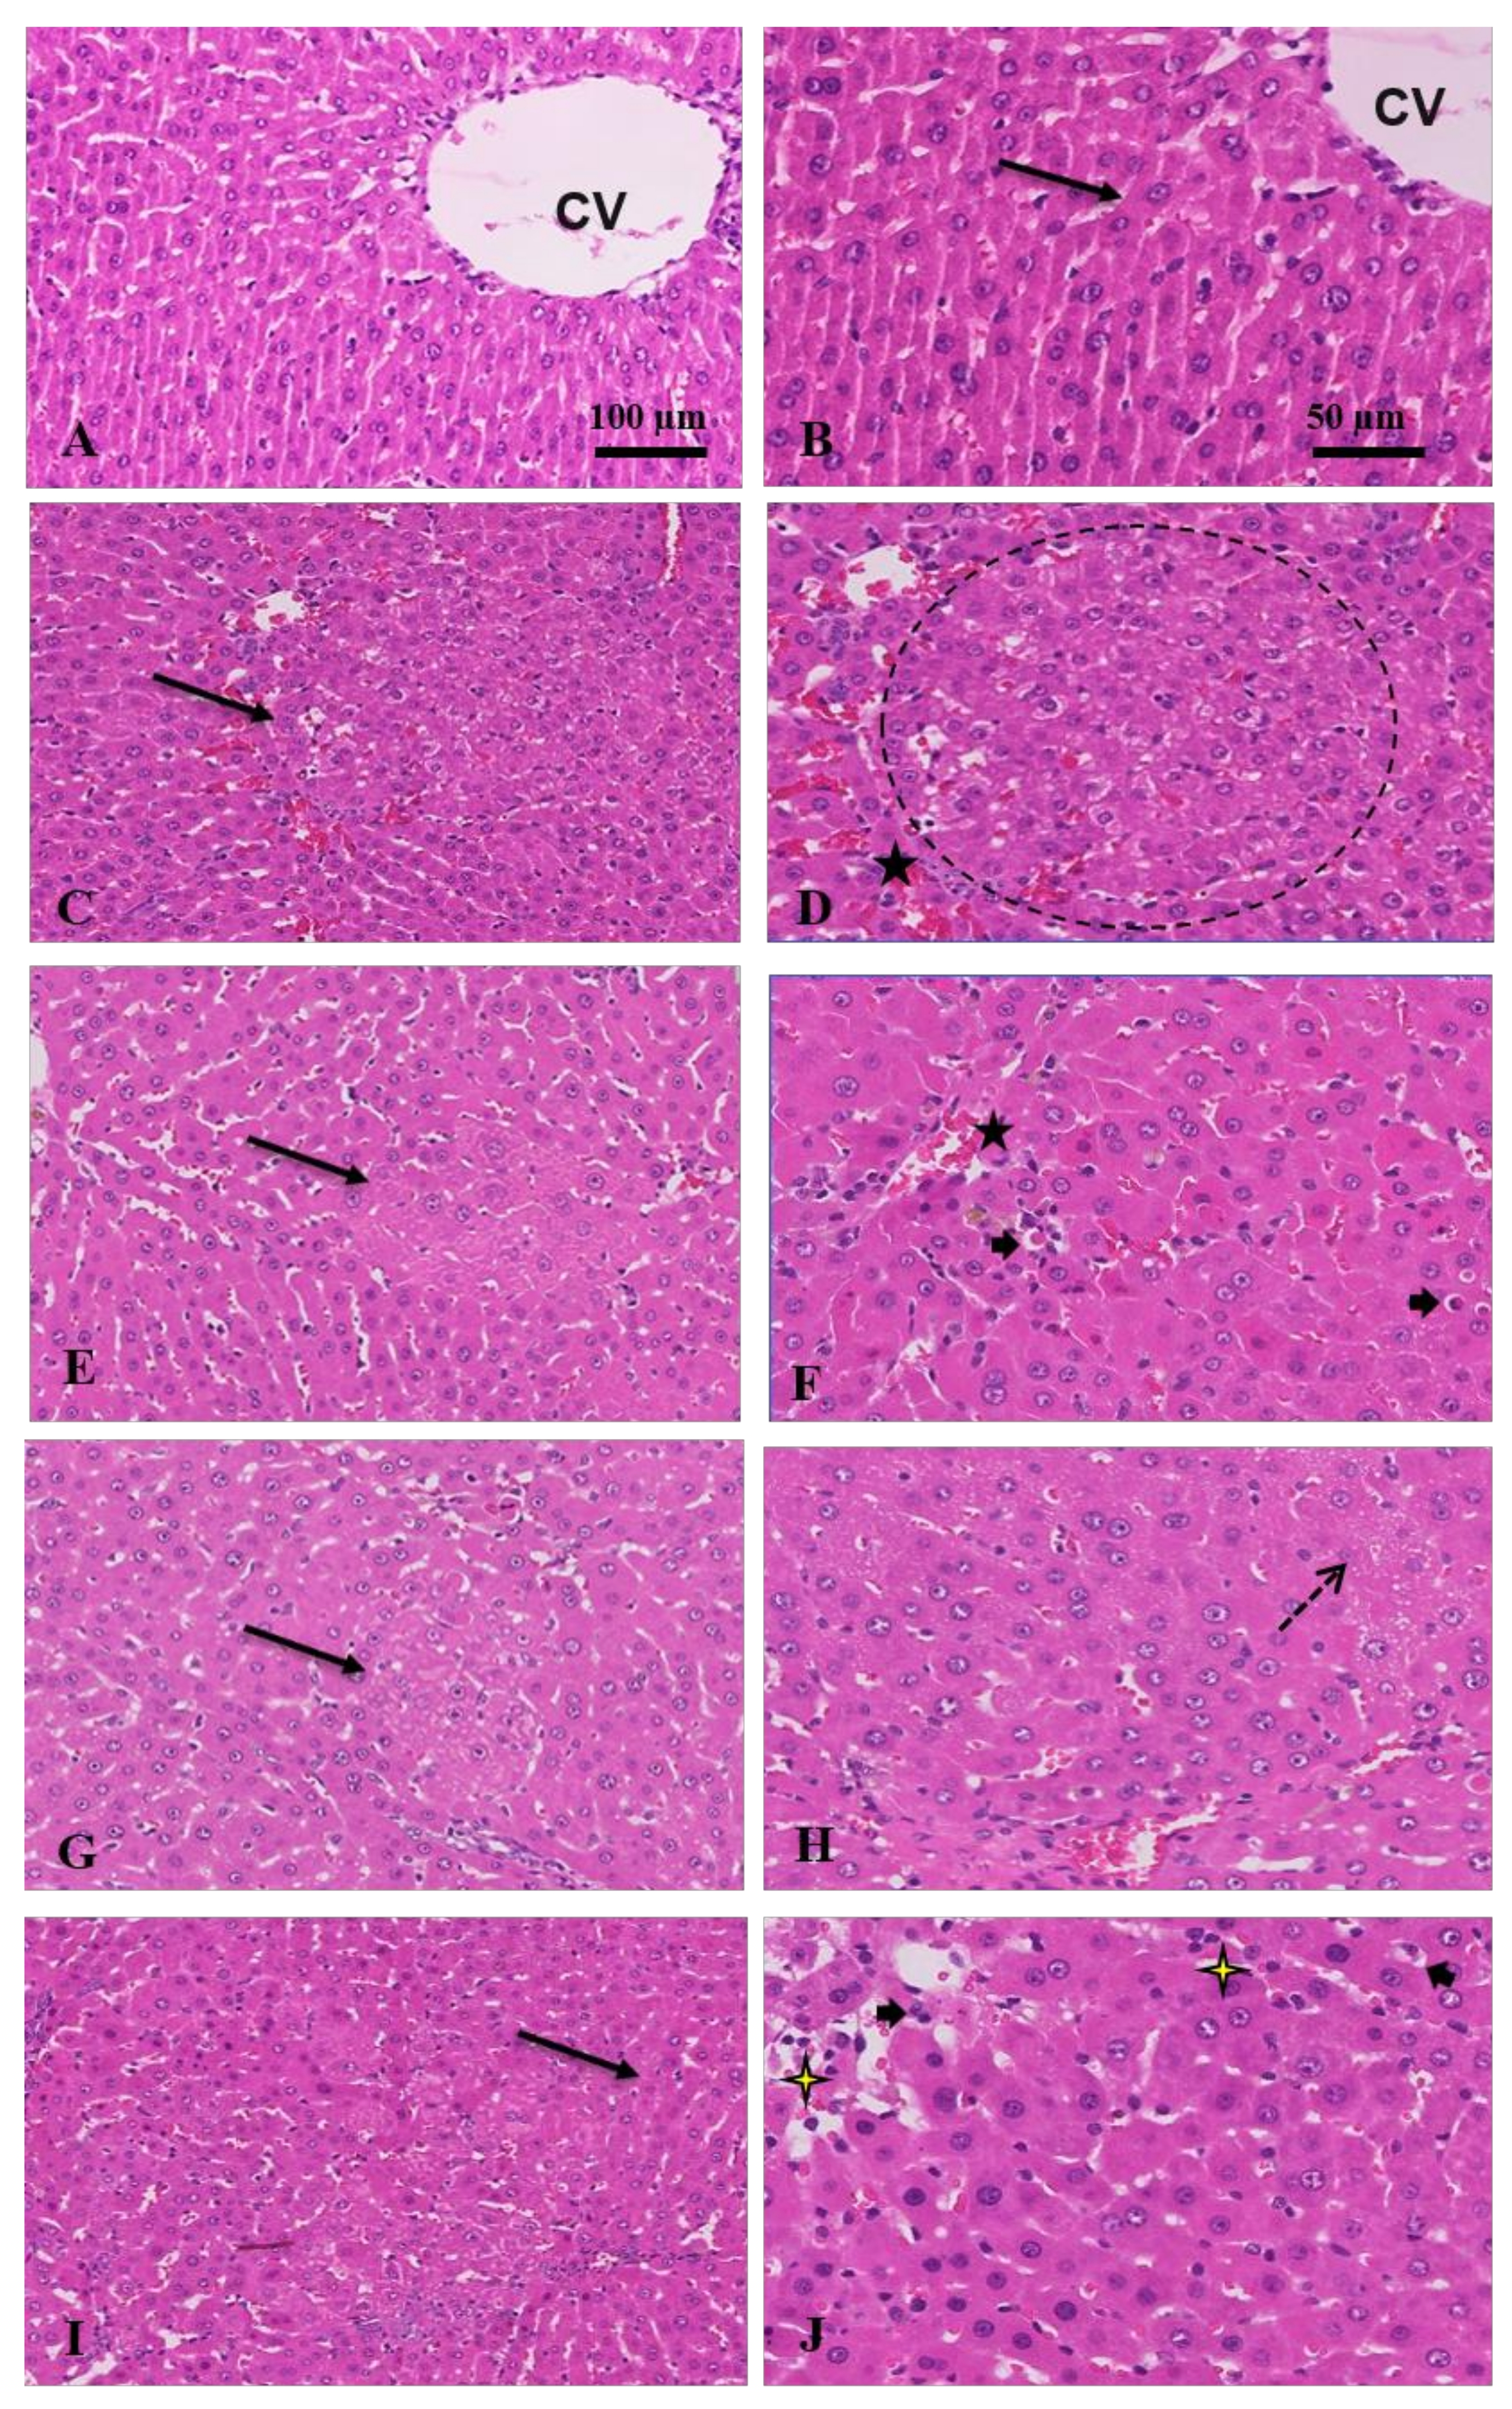
3.1.3. Histopathological and Immunostaining Changes Induced by Crocin and Sorafenib
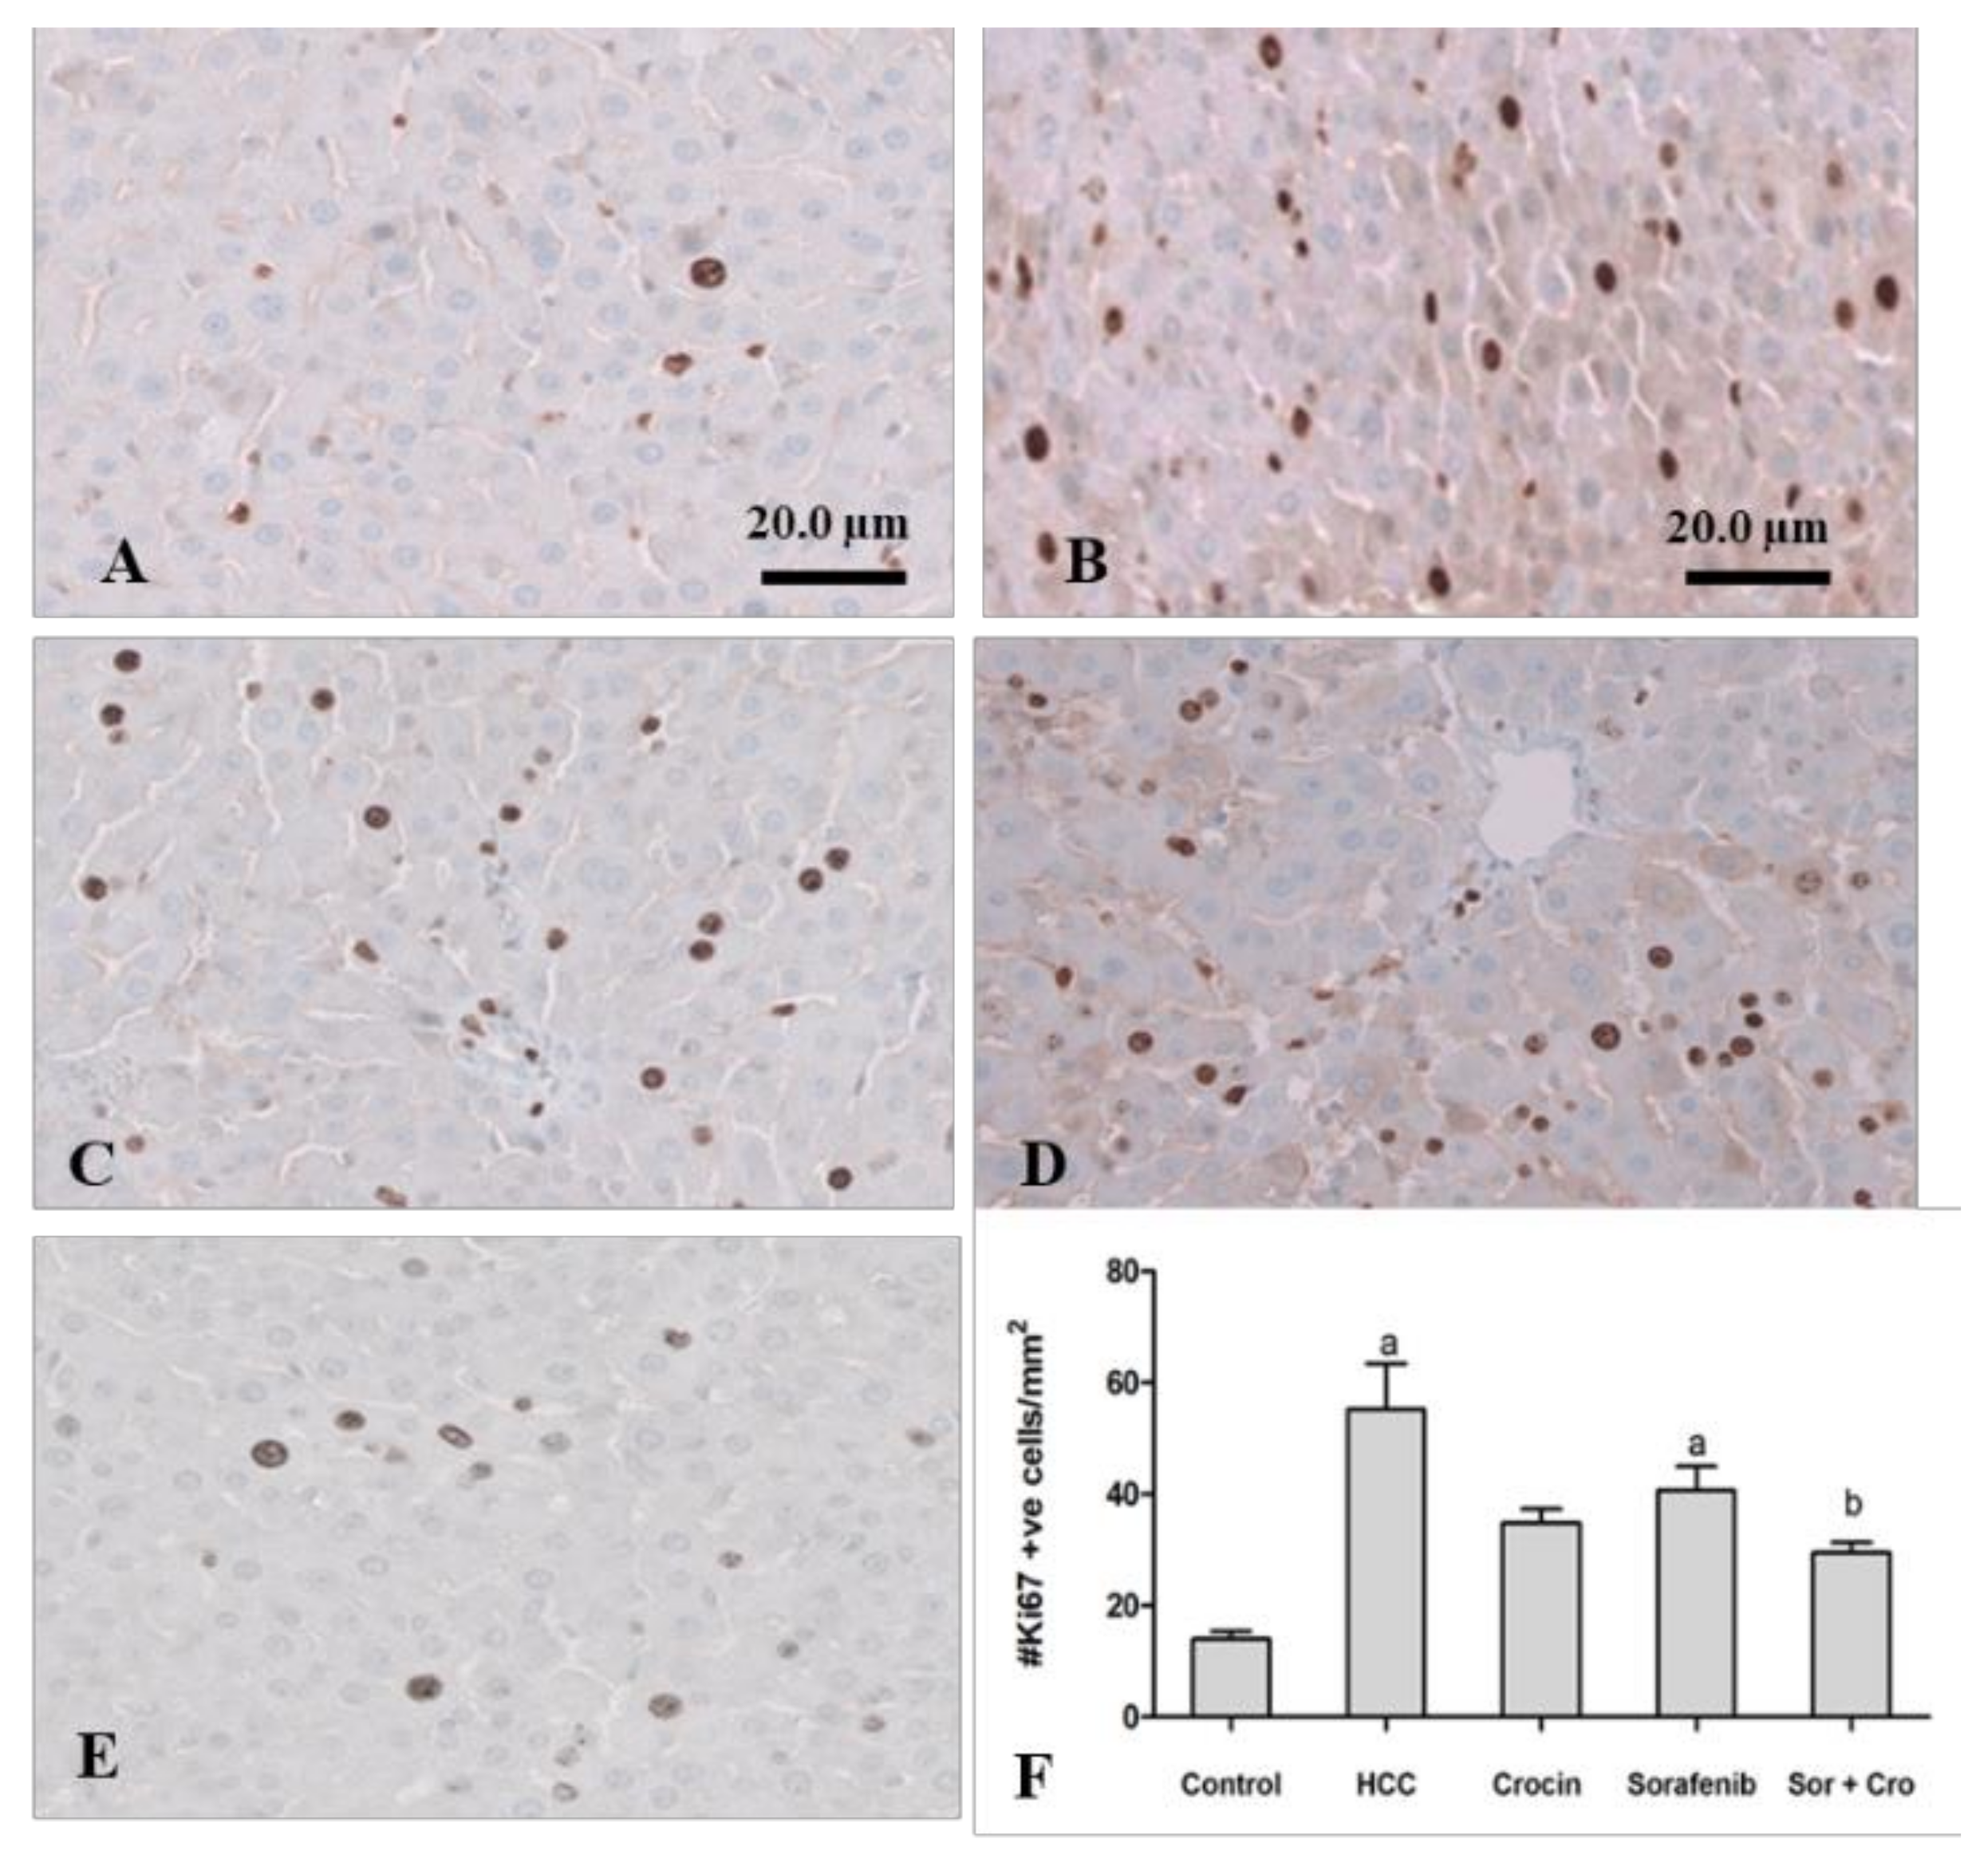
3.1.4. Immunohistochemical Staining of Ki67
3.1.5. Molecular Changes in Gene Expression Induced by Crocin and Sorafenib Treatment
3.2. Effect of Crocin and Sorafenib Treatment on HepG2 Cell Viability and Cell Cycle
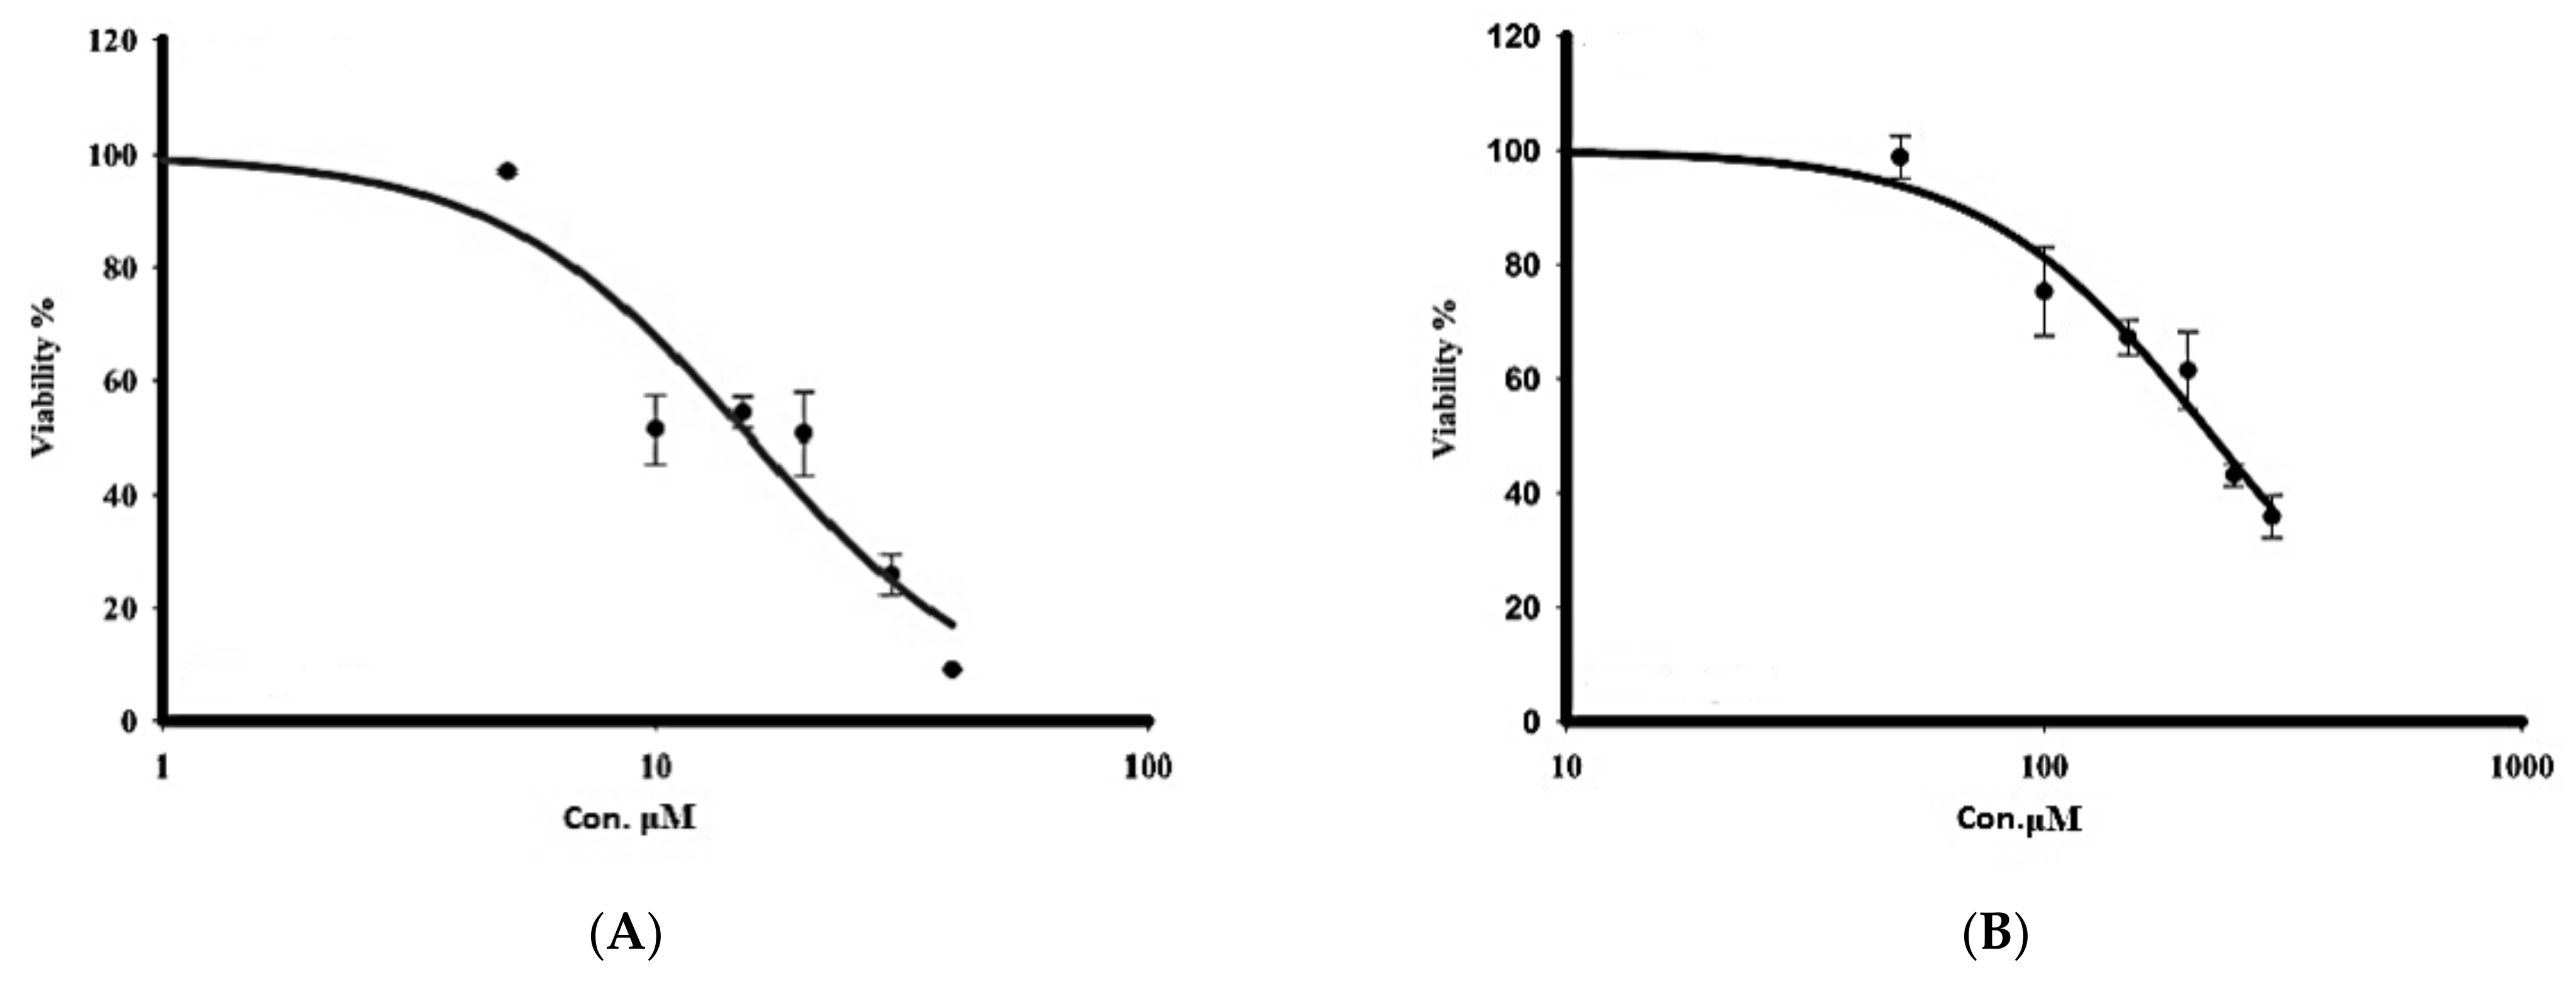
3.2.1. Cytotoxicity
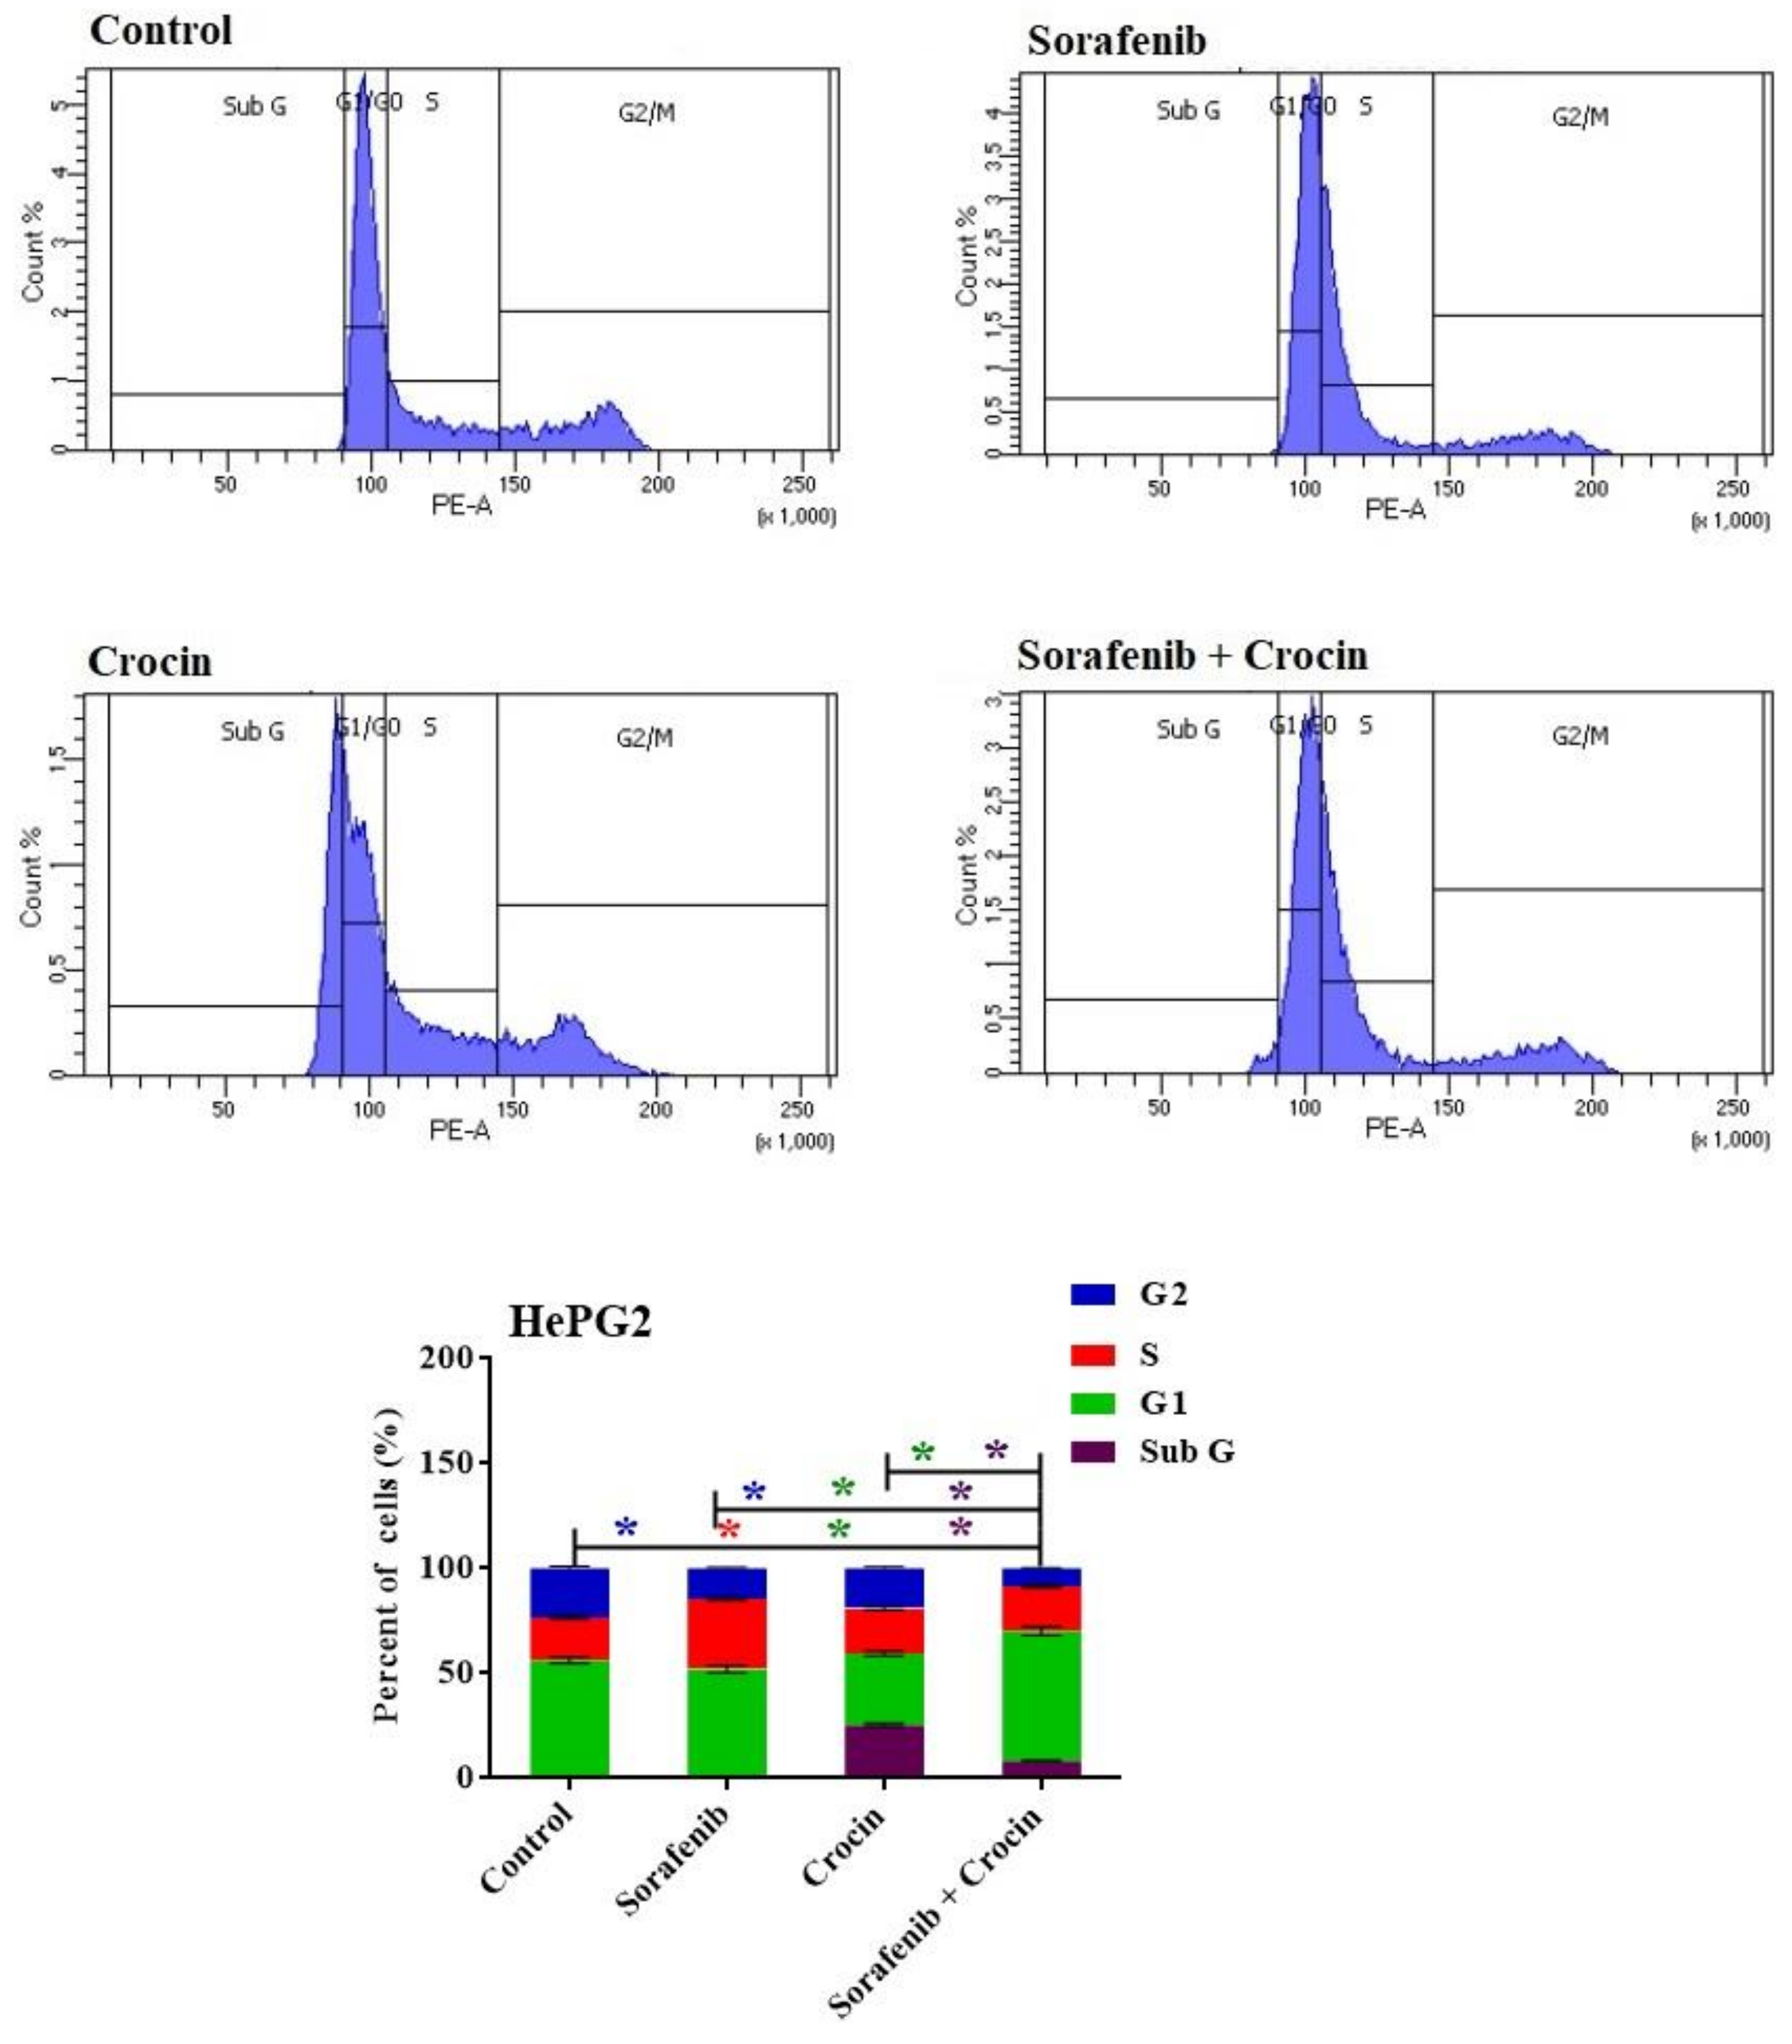
3.2.2. Cell Cycle
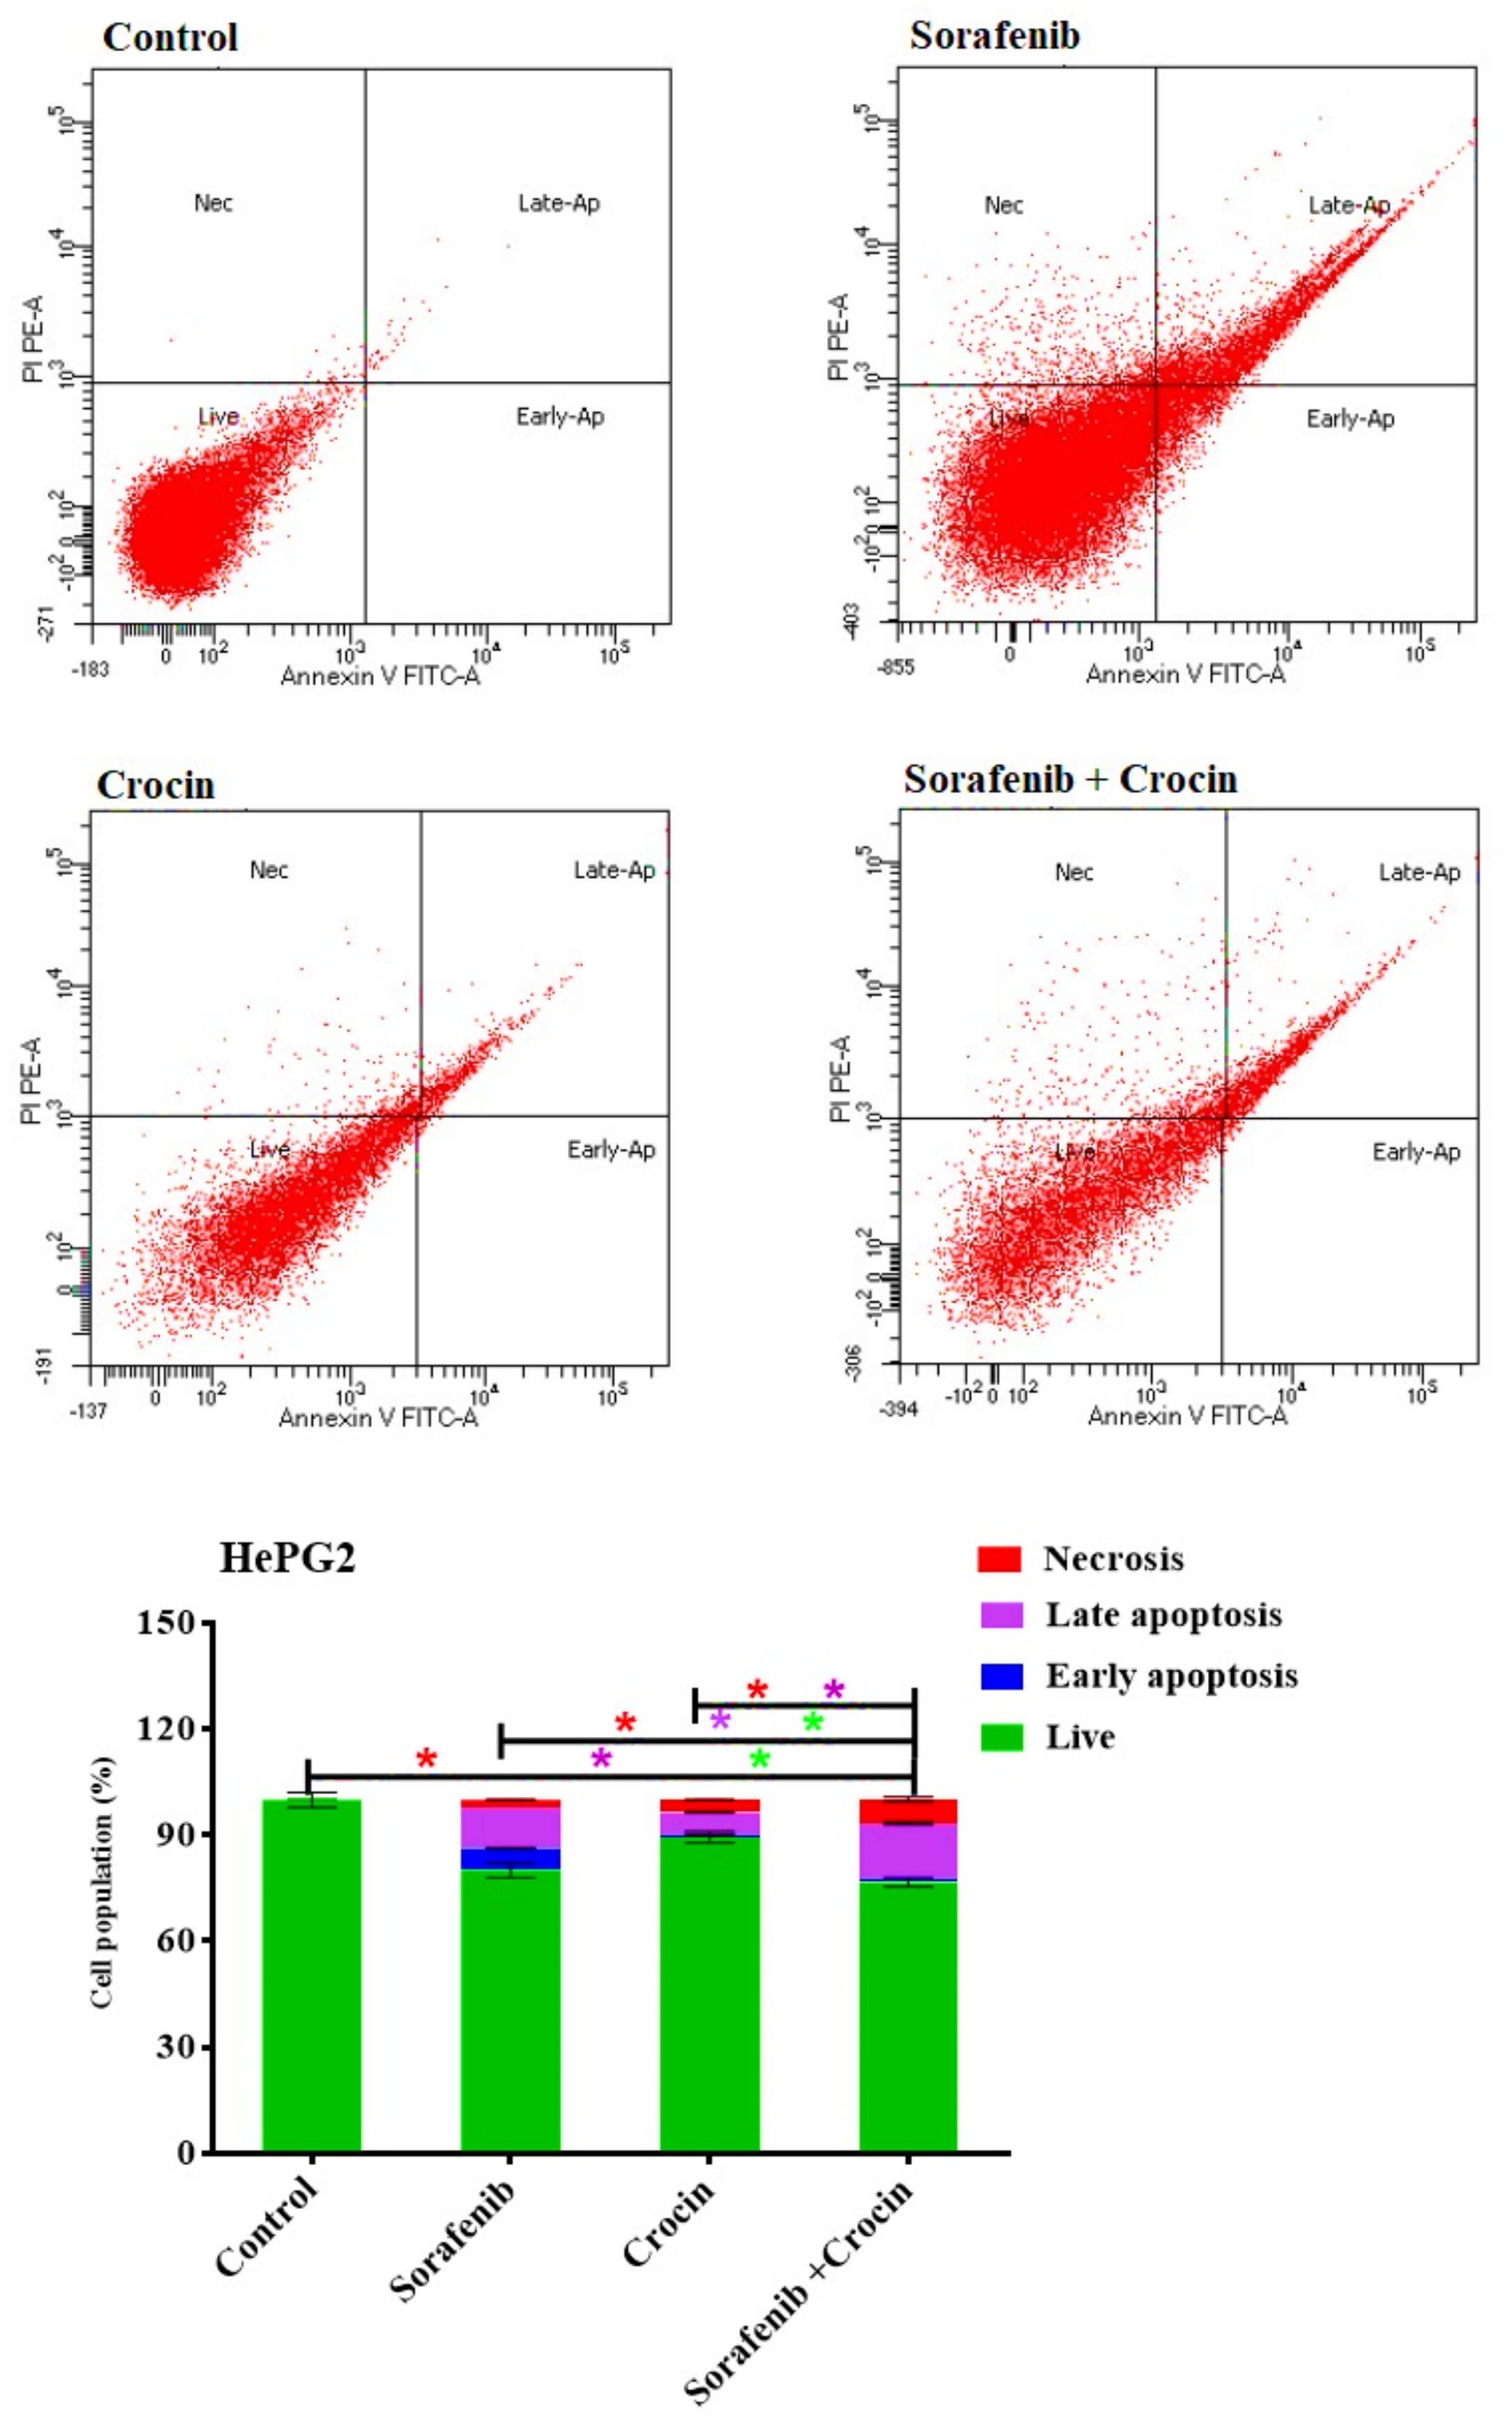
3.2.3. Apoptosis
4. Discussion
5. Conclusions
Author Contributions
Funding
Institutional Review Board Statement
Conflicts of Interest
References
- Wang, X.; Sun, W.; Shen, W.; Xia, M.; Chen, C.; Xiang, D.; Ning, B.; Cui, X.; Li, H.; Li, X. Long non-coding RNA DILC regulates liver cancer stem cells via IL-6/STAT3 axis. J. Hepatol. 2016, 64, 1283–1294. [Google Scholar] [CrossRef] [PubMed]
- Bray, F.; Ferlay, J.; Soerjomataram, I.; Siegel, R.L.; Torre, L.A.; Jemal, A. Global cancer statistics 2018: GLOBOCAN estimates of incidence and mortality worldwide for 36 cancers in 185 countries. CA Cancer J. Clin. 2018, 68, 394–424. [Google Scholar] [CrossRef] [PubMed]
- Singal, A.G.; Lampertico, P.; Nahon, P. Epidemiology and surveillance for hepatocellular carcinoma: New trends. J. Hepatol. 2020, 72, 250–261. [Google Scholar] [CrossRef] [PubMed]
- Tang, A.; Hallouch, O.; Chernyak, V.; Kamaya, A.; Sirlin, C.B. Epidemiology of hepatocellular carcinoma: Target population for surveillance and diagnosis. Abdom. Radiol. 2018, 43, 13–25. [Google Scholar] [CrossRef] [PubMed]
- Ding, S.; Hu, A.; Hu, Y.; Ma, J.; Weng, P.; Dai, J. Anti-hepatoma cells function of luteolin through inducing apoptosis and cell cycle arrest. Tumor Biol. 2014, 35, 3053–3060. [Google Scholar] [CrossRef] [PubMed]
- Mazzoccoli, G.; Miele, L.; Marrone, G.; Mazza, T.; Vinciguerra, M.; Grieco, A. A role for the biological clock in liver cancer. Cancers 2019, 11, 1778. [Google Scholar] [CrossRef]
- Zhang, C.; Yang, M.; Ericsson, A.C. The potential gut microbiota-mediated treatment options for liver cancer. Front. Oncol. 2020, 10, 524205. [Google Scholar] [CrossRef]
- Chen, Z.; Xie, H.; Hu, M.; Huang, T.; Hu, Y.; Sang, N.; Zhao, Y. Recent progress in treatment of hepatocellular carcinoma. Am. J. Cancer Res. 2020, 10, 2993–3036. [Google Scholar]
- Desai, A.; Sandhu, S.; Lai, J.-P.; Sandhu, D.S. Hepatocellular carcinoma in non-cirrhotic liver: A comprehensive review. World J. Hepatol. 2019, 11, 1. [Google Scholar] [CrossRef]
- European Association For The Study Of The Liver. EASL clinical practice guidelines: Management of hepatocellular carcinoma. J. Hepatol. 2018, 69, 182–236. [Google Scholar] [CrossRef]
- Plaz Torres, M.C.; Bodini, G.; Furnari, M.; Marabotto, E.; Zentilin, P.; Giannini, E.G. Nuts and Non-Alcoholic Fatty Liver Disease: Are Nuts Safe for Patients with Fatty Liver Disease? Nutrients 2020, 12, 3363. [Google Scholar] [CrossRef] [PubMed]
- Berentzen, T.L.; Gamborg, M.; Holst, C.; Sørensen, T.I.; Baker, J.L. Body mass index in childhood and adult risk of primary liver cancer. J. Hepatol. 2014, 60, 325–330. [Google Scholar] [CrossRef] [PubMed]
- Plastaras, J.P.; Kim, S.H.; Liu, Y.Y.; Dicker, D.T.; Dorsey, J.F.; McDonough, J.; Cerniglia, G.; Rajendran, R.R.; Gupta, A.; Rustgi, A.K.; et al. Cell cycle–dependent and schedule-dependent antitumor effects of sorafenib combined with radiation. Cancer Res. 2007, 67, 9443–9454. [Google Scholar] [CrossRef]
- Jane, E.P.; Premkumar, D.R.; Pollack, I.F. Coadministration of sorafenib with rottlerin potently inhibits cell proliferation and migration in human malignant glioma cells. J. Pharmacol. Exp. Ther. 2006, 319, 1070–1080. [Google Scholar] [CrossRef]
- Cervello, M.; Bachvarov, D.; Lampiasi, N.; Cusimano, A.; Azzolina, A.; McCubrey, J.A.; Montalto, G. Molecular mechanisms of sorafenib action in liver cancer cells. Cell Cycle 2012, 11, 2843–2855. [Google Scholar] [CrossRef]
- Broecker-Preuss, M.; Müller, S.; Britten, M.; Worm, K.; Schmid, K.W.; Mann, K.; Fuhrer, D. Sorafenib inhibits intracellular signaling pathways and induces cell cycle arrest and cell death in thyroid carcinoma cells irrespective of histological origin or BRAF mutational status. BMC Cancer 2015, 15, 184. [Google Scholar] [CrossRef] [PubMed]
- Auclair, D.; Miller, D.; Yatsula, V.; Pickett, W.; Carter, C.; Chang, Y.; Zhang, X.; Wilkie, D.; Burd, A.; Shi, H.; et al. Antitumor activity of sorafenib in FLT3-driven leukemic cells. Leukemia 2007, 21, 439–445. [Google Scholar] [CrossRef]
- Zhang, Y.; Li, G.; Liu, X.; Song, Y.; Xie, J.; Li, G.; Ren, J.; Wang, H.; Mou, J.; Dai, J.; et al. Sorafenib inhibited cell growth through the MEK/ERK signaling pathway in acute promyelocytic leukemia cells. Oncol. Lett. 2018, 15, 5620–5626. [Google Scholar] [CrossRef]
- Liu, L.; Cao, Y.; Chen, C.; Zhang, X.; McNabola, A.; Wilkie, D.; Wilhelm, S.; Lynch, M.; Carter, C. Sorafenib blocks the RAF/MEK/ERK pathway, inhibits tumor angiogenesis, and induces tumor cell apoptosis in hepatocellular carcinoma model PLC/PRF/5. Cancer Res. 2006, 66, 11851–11858. [Google Scholar] [CrossRef]
- Kudo, M.; Finn, R.; Qin, S.; Han, K.; Ikeda, K.; Piscaglia, F.; Baron, A.; Park, J.; Han, G.; Jassem, J. A Randomised Phase 3 trial of lenvatinib vs. sorafenib in first-line treatment of patients with unresectable hepatocellular carcinoma. Lancet 2018, 391, 1163–1173. [Google Scholar] [CrossRef]
- Bruix, J.; Qin, S.; Merle, P.; Granito, A.; Huang, Y.; Bodoky, G.; Pracht, M.; Yokosuka, O.; Rosmorduc, O.; Breder, V. RESORCE Investigators Regorafenib for patients with hepatocellular carcinoma who progressed on sorafenib treatment (RESORCE): A randomised, double-blind, placebo-controlled, phase 3 trial. Lancet 2017, 389, 56–66. [Google Scholar] [CrossRef] [Green Version]
- Abou-Alfa, G.K.; Meyer, T.; Cheng, A.-L.; El-Khoueiry, A.B.; Rimassa, L.; Ryoo, B.-Y.; Cicin, I.; Merle, P.; Chen, Y.; Park, J.-W. Cabozantinib in patients with advanced and progressing hepatocellular carcinoma. N. Engl. J. Med. 2018, 379, 54–63. [Google Scholar] [CrossRef]
- Jin, F.; Wang, Y.; Li, M.; Zhu, Y.; Liang, H.; Wang, C.; Wang, F.; Zhang, C.-Y.; Zen, K.; Li, L. MiR-26 enhances chemosensitivity and promotes apoptosis of hepatocellular carcinoma cells through inhibiting autophagy. Cell Death Dis. 2018, 8, e2540. [Google Scholar] [CrossRef] [PubMed]
- Hsu, D.-Z.; Chen, Y.-W.; Chu, P.-Y.; Periasamy, S.; Liu, M.-Y. Protective effect of 3, 4-methylenedioxyphenol (sesamol) on stress-related mucosal disease in rats. BioMed Res. Int. 2013, 2013, 481827. [Google Scholar] [CrossRef] [PubMed]
- Kabiri, M.; Rezadoost, H.; Ghassempour, A. A comparative quality study of saffron constituents through HPLC and HPTLC methods followed by isolation of crocins and picrocrocin. LWT 2017, 84, 1–9. [Google Scholar] [CrossRef]
- Amin, A.; Awad, B. Crocin-Sorafenib Combination Therapy for Liver Cancer. U.S. Patent 10,933,076, 2 March 2021. [Google Scholar]
- Amin, A.; Bajbouj, K.; Koch, A.; Gandesiri, M.; Schneider-Stock, R. Defective autophagosome formation in p53-null colorectal cancer reinforces crocin-induced apoptosis. Int. J. Mol. Sci. 2015, 16, 1544–1561. [Google Scholar] [CrossRef] [PubMed]
- El-Kharrag, R.; Amin, A.; Hisaindee, S.; Greish, Y.; Karam, S.M. Development of a therapeutic model of precancerous liver using crocin-coated magnetite nanoparticles. Int. J. Oncol. 2017, 50, 212–222. [Google Scholar] [CrossRef]
- Samarghandian, S.; Borji, A.; Farahmand, S.K.; Afshari, R.; Davoodi, S. Crocus sativus L. (Saffron) Stigma Aqueous Extract Induces Apoptosis in Alveolar Human Lung Cancer Cells through Caspase-Dependent Pathways Activation. BioMed Res. 2013, 2013, 417928. [Google Scholar]
- Amin, A.; Daoud, S.; Zaki, N.; Salehi-Ashtiani, K.; Al-Hrout, A.; Chaiboonchoe, A.; Baig, B.; Khazanehdari, K.; Adrian, T. Saffron-based crocin prevents early lesions of liver cancer: In vivo, in vitro and in silico analyses. HPB 2016, 18, e303. [Google Scholar] [CrossRef]
- Noureini, S.K.; Wink, M. Antiproliferative effects of crocin in HepG2 cells by telomerase inhibition and hTERT down-regulation. Asian Pac. J. Cancer Prev. 2012, 13, 2305–2309. [Google Scholar] [CrossRef]
- Yao, C.; Liu, B.-B.; Qian, X.-D.; Li, L.-Q.; Cao, H.-B.; Guo, Q.-S.; Zhou, G.-F. Crocin induces autophagic apoptosis in hepatocellular carcinoma by inhibiting Akt/mTOR activity. OncoTargets Ther. 2018, 11, 2017. [Google Scholar] [CrossRef] [PubMed]
- Bakshi, H.; Sam, S.; Rozati, R.; Sultan, P.; Islam, T.; Rathore, B.; Lone, Z.; Sharma, M.; Triphati, J.; Saxena, R.C. DNA fragmentation and cell cycle arrest: A hallmark of apoptosis induced by crocin from kashmiri saffron in a human pancreatic cancer cell line. Asian Pac. J. Cancer Prev. 2010, 11, 675–679. [Google Scholar] [PubMed]
- Gedik, S.; Erdemli, M.E.; Gul, M.; Yigitcan, B.; Bag, H.G.; Aksungur, Z.; Altinoz, E. Hepatoprotective effects of crocin on biochemical and histopathological alterations following acrylamide-induced liver injury in Wistar rats. Biomed. Pharmacother. 2017, 95, 764–770. [Google Scholar] [CrossRef] [PubMed]
- Muñoz, N.M.; Minhaj, A.A.; Maldonado, K.L.; Kingsley, C.V.; Cortes, A.C.; Taghavi, H.; Polak, U.; Mitchell, J.M.; Ensor, J.E.; Bankson, J.A. Comparison of dynamic contrast-enhanced magnetic resonance imaging and contrast-enhanced ultrasound for evaluation of the effects of sorafenib in a rat model of hepatocellular carcinoma. Magn. Reson. Imaging 2019, 57, 156–164. [Google Scholar] [CrossRef] [PubMed]
- Lowry, O.H.; Rosebrough, N.J.; Farr, A.L.; Randall, R.J. Protein measurement with the Folin reagent. J. Biol. Chem. 1951, 193, 265–275. [Google Scholar] [CrossRef]
- ALmohaimeed, H.M.; Mohammedsaleh, Z.M.; Batawi, A.H.; Balgoon, M.J.; Ramadan, O.I.; Baz, H.A.; Ayuob, N.N. Synergistic Anti-inflammatory and Neuroprotective Effects of Cinnamomum cassia and Zingiber officinale Alleviate Diabetes-Induced Hippocampal Changes in Male Albino Rats: Structural and Molecular Evidence. Front. Cell Dev. Biol. 2021, 9, 727049. [Google Scholar] [CrossRef]
- Korpanty, G.; Chen, S.; Shohet, R.V.; Ding, J.H.; Yang, B.Z.; Frenkel, P.A.; Grayburn, P.A. Targeting of VEGF-mediated angiogenesis to rat myocardium using ultrasonic destruction of microbubbles. Gene Ther. 2005, 12, 1305–1312. [Google Scholar] [CrossRef]
- Bima, A.I.; Mahdi, A.S.; Al Fayez, F.F.; Khawaja, T.M.; Abo El-Khair, S.M.; Elsamanoudy, A.Z. Cellular Senescence and Vitamin D Deficiency Play a Role in the Pathogenesis of Obesity-Associated Subclinical Atherosclerosis: Study of the Potential Protective Role of Vitamin D Supplementation. Cells 2021, 10, 920. [Google Scholar] [CrossRef]
- Kermanian, F.; Soleimani, M.; Pourheydar, B.; Samzadeh-Kermani, A.; Mohammadzadeh, F.; Mehdizadeh, M. Effects of adenosine A2a receptor agonist and antagonist on cerebellar nuclear factor-kB expression preceded by MDMA toxicity. Med. J. Islamic Repub. Iran 2014, 28, 120. [Google Scholar]
- Munetomo, A.; Ishii, H.; Miyamoto, T.; Sakuma, Y.; Kondo, Y. Puerperal and parental experiences alter rat preferences for pup odors via changes in the oxytocin system. J. Reprod. Dev. 2016, 62, 17–27. [Google Scholar] [CrossRef]
- Kobashi, K.; Nishimura, K.; Kawate, Y.; Horiuchi, T. Synthesis of diamonds by use of microwave plasma chemical-vapor deposition: Morphology and growth of diamond films. Phys. Rev. B 1988, 38, 4067. [Google Scholar] [CrossRef] [PubMed]
- Bashmail, H.A.; Alamoudi, A.A.; Noorwali, A.; Hegazy, G.A.; AJabnoor, G.; Choudhry, H.; Al-Abd, A.M. Thymoquinone synergizes gemcitabine anti-breast cancer activity via modulating its apoptotic and autophagic activities. Sci. Rep. 2018, 8, 11674. [Google Scholar] [CrossRef] [PubMed]
- Santos, N.P.; Colaço, A.A.; Oliveira, P.A. Animal models as a tool in hepatocellular carcinoma research: A Review. Tumor Biol. 2017, 39, 1010428317695923. [Google Scholar] [CrossRef] [PubMed] [Green Version]
- Tolba, R.; Kraus, T.; Liedtke, C.; Schwarz, M.; Weiskirchen, R. Diethylnitrosamine (DEN)-induced carcinogenic liver injury in mice. Lab. Anim. 2015, 49 (Suppl. 1), 59–69. [Google Scholar] [CrossRef]
- Hayden, M.S.; Ghosh, S. Regulation of NF-Κb by TNF Family Cytokines. Semin. Immunol. 2014, 26, 253–266. [Google Scholar] [CrossRef]
- Espandiari, P.; Robertson, L.W.; Srinivasan, C.; Glauert, H.P. Comparison of different initiation protocols in the resistant hepatocyte model. Toxicology 2005, 206, 373–381. [Google Scholar] [CrossRef]
- Feo, F.; Pascale, R.M.; Calvisi, D.F. Models for liver cancer. In The Cancer Handbook; Alison, M.R., Ed.; John Wiley & Sons, Ltd.: Hoboken, NJ, USA, 2007; pp. 1–12. [Google Scholar]
- Hamza, A.A.; Heeba, G.H.; Hamza, S.; Abdalla, A.; Amin, A. Standardized extract of ginger ameliorates liver cancer by reducing proliferation and inducing apoptosis through inhibition oxidative stress/inflammation pathway. Biomed. Pharmacother. 2021, 134, 111102. [Google Scholar] [CrossRef]
- Abdalla, Y.; Abdalla, A.; Hamza, A.A.; Amin, A. Safranal prevents liver cancer through inhibiting oxidative stress and alleviating inflammation. Front. Pharmacol. 2021, 12, 777500. [Google Scholar] [CrossRef]
- Liu, X.; Chi, X.; Gong, Q.; Gao, L.; Niu, Y.; Chi, X.; Cheng, M.; Si, Y.; Wang, M.; Zhong, J. Association of serum level of growth differentiation factor 15 with liver cirrhosis and hepatocellular carcinoma. PLoS ONE 2015, 10, e0127518. [Google Scholar] [CrossRef]
- Bai, D.-S.; Zhang, C.; Chen, P.; Jin, S.-J.; Jiang, G.-Q. The prognostic correlation of AFP level at diagnosis with pathological grade, progression, and survival of patients with hepatocellular carcinoma. Sci. Rep. 2017, 7, 12870. [Google Scholar] [CrossRef]
- Li, L.; Liu, H.; Xu, C.; Deng, M.; Song, M.; Yu, X.; Xu, S.; Zhao, X. VEGF promotes endothelial progenitor cell differentiation and vascular repair through connexin 43. Stem Cell Res. Ther. 2017, 8, 237. [Google Scholar] [CrossRef] [PubMed]
- Min, J.-K.; Han, K.-Y.; Kim, E.-C.; Kim, Y.-M.; Lee, S.-W.; Kim, O.-H.; Kim, K.-W.; Gho, Y.S.; Kwon, Y.-G. Capsaicin inhibits in vitro and in vivo angiogenesis. Cancer Res. 2004, 64, 644–651. [Google Scholar] [CrossRef] [PubMed]
- Teufel, A.; Staib, F.; Kanzler, S.; Weinmann, A.; Schulze-Bergkamen, H.; Galle, P.R. Genetics of hepatocellular carcinoma. World J. Gastroenterol. WJG 2007, 13, 2271. [Google Scholar] [CrossRef] [PubMed]
- You, J.; Yang, H.; Lai, Y.; Simon, L.; Au, J.; Burkart, A.L. Erratum to ARID2, p110α, p53, and β-catenin protein expression in hepatocellular carcinoma and clinic pathologic implications. Hum. Pathol. 2015, 46, 1068–1077. [Google Scholar] [CrossRef]
- Kato, F.; Kakihara, H.; Kunugita, N.; Ootsuyama, A.; Norimura, T. Role of p53 gene in apoptotic repair of genotoxic tissue damage in mice. J. Radiat. Res. 2002, 43, S209–S212. [Google Scholar] [CrossRef]
- Perabo, F.G.; Landwehrs, G.; Frössler, C.; Schmidt, D.H.; Mueller, S. Antiproliferative and apoptosis inducing effects of indirubin-3′-monoxime in renal cell cancer cells. Urol. Oncol. Semin. Orig. Investig. 2011, 29, 815–820. [Google Scholar] [CrossRef]
- Demarcq, C.; Bunch, R.T.; Creswell, D.; Eastman, A. The role of cell cycle progression in cisplatin-induced apoptosis in Chinese hamster ovary cells. Cell Growth Differ.-Publ. Am. Assoc. Cancer Res. 1994, 5, 983–994. [Google Scholar]
- Dera, A.; Rajagopalan, P. Thymoquinone attenuates phosphorylation of AKT to inhibit kidney cancer cell proliferation. J. Food Biochem. 2019, 43, e12793. [Google Scholar] [CrossRef]
- Wilhelm, S.M.; Carter, C.; Tang, L.; Wilkie, D.; McNabola, A.; Rong, H.; Trail, P.A. BAY 43-9006 exhibits broad spectrum oral antitumor activity and targets the RAF/MEK/ERK pathway and receptor tyrosine kinases involved in tumor progression and angiogenesis. Cancer Res. 2004, 64, 7099–7109. [Google Scholar] [CrossRef]
- Mohajeri, D.; Doustar, Y. Protective effect of ethanolic extract of Crocus sativus L.(Saffron) stigma against Cisplatin induced hepatotoxicity in rats. Med. Sci. J. Islamic Azad Univ.-Tehran Med. Branch 2012, 21, 251–261. [Google Scholar]
- Liu, Y.; Yao, C.; Wang, Y.; Liu, X.; Xu, S.; Liang, L. Protective effect of crocin on liver function and survival in rats with traumatic hemorrhagic shock. J. Surg. Res. 2021, 261, 301–309. [Google Scholar] [PubMed]
- Algandaby, M.M. Ant fibrotic effects of crocin on thioacetamide-induced liver fibrosis in mice. Saudi J. Biol. Sci. 2018, 25, 747–754. [Google Scholar] [CrossRef] [PubMed]
- Chhimwal, J.; Sharma, S.; Kulurkar, P.; Patial, V. Crocin attenuates CCl4-induced liver fibrosis via PPAR-γ mediated modulation of inflammation and fibro genesis in rats. Hum. Exp. Toxicol. 2020, 39, 1639–1649. [Google Scholar] [CrossRef] [PubMed]
- Scartozzi, M.; Faloppi, L.; Bianconi, M.; Giampieri, R.; Maccaroni, E.; Bittoni, A.; Del Prete, M.; Loretelli, C.; Belvederesi, L.; Svegliati Baroni, G. The role of LDH serum levels in predicting global outcome in HCC patients undergoing TACE: Implications for clinical management. PLoS ONE 2012, 7, e32653. [Google Scholar] [CrossRef]
- Feng, H.; Li, B.; Li, Z.; Wei, Q.; Ren, L. PIVKA-II serves as a potential biomarker that complements AFP for the diagnosis of hepatocellular carcinoma. BMC Cancer 2021, 21, 401. [Google Scholar]
- Amin, A.; Hamza, A.A.; Bajbouj, K.; Ashraf, S.S.; Daoud, S. Saffron: A potential candidate for a novel anticancer drug against hepatocellular carcinoma. Hepatology 2011, 54, 857–867. [Google Scholar] [CrossRef] [PubMed]
- Chen, S.-S.; Gu, Y.; Lu, F.; Qian, D.-P.; Dong, T.-T.; Ding, Z.-H.; Zhao, S.; Yu, Z.-H. Antiangiogenic effect of crocin on breast cancer cell MDA-MB-231. J. Thorac. Dis. 2019, 11, 4464. [Google Scholar] [CrossRef]
- Hoshyar, R.; Mollaei, H. A comprehensive review on anticancer mechanisms of the main carotenoid of saffron, crocin. J. Pharm. Pharmacol. 2017, 69, 1419–1427. [Google Scholar] [CrossRef]
- Bi, X.; Jiang, Z.; Luan, Z.; Qiu, D. Crocin exerts anti-proliferative and apoptotic effects on cutaneous squamous cell carcinoma via miR-320a/ATG2B. Bioengineered 2021, 12, 4569–4580. [Google Scholar] [CrossRef]
- Finco, T.S.; Beg, A.A.; Baldwin, A.S., Jr. Inducible phosphorylation of I kappa B alpha is not sufficient for its dissociation from NF-kappa B and is inhibited by protease inhibitors. Proc. Natl. Acad. Sci. USA 1994, 91, 11884–11888. [Google Scholar] [CrossRef]
- Lv, B.; Huo, F.; Zhu, Z.; Xu, Z.; Dang, X.; Chen, T.; Zhang, T.; Yang, X. Crocin upregulates CX3CR1 expression by suppressing NF-κB/YY1 signaling and inhibiting lipopolysaccharide-induced microglial activation. Neurochem. Res. 2016, 41, 1949–1957. [Google Scholar] [CrossRef] [PubMed]
- Orosz, P.; Krüger, A.; Hubbe, M.; Rüschoff, J.; Hoegen, P.V.; NMännel, D. Promotion of experimental liver metastasis by tumor necrosis factor. Int. J. Cancer 1995, 60, 867–871. [Google Scholar] [CrossRef] [PubMed]
- Shrestha, R.; Bridle, K.R.; Crawford, D.H.; Jayachandran, A. TNF-α-mediated epithelial-to-mesenchymal transition regulates expression of immune checkpoint molecules in hepatocellular carcinoma. Mol. Med. Rep. 2020, 21, 1849–1860. [Google Scholar] [CrossRef]
- Tan, W.; Luo, X.; Li, W.; Zhong, J.; Cao, J.; Zhu, S.; Chen, X.; Zhou, R.; Shang, C.; Chen, Y. TNF-α is a potential therapeutic target to overcome sorafenib resistance in hepatocellular carcinoma. Biomedicine 2019, 40, 446–456. [Google Scholar] [CrossRef] [PubMed]
- Farahi, A.; Abedini, M.R.; Javdani, H.; Arzi, L.; Chamani, E.; Farhoudi, R.; Talebloo, N.; Hoshyar, R. Crocin and Metformin suppress metastatic breast cancer progression via VEGF and MMP9 downregulations: In vitro and in vivo studies. Mol. Cell. Biochem. 2021, 476, 3341–3351. [Google Scholar] [CrossRef] [PubMed]
- Aly, S.M.; Fetaih, H.A.; Hassanin, A.A.; Abomughaid, M.M.; Ismail, A.A. Protective effects of garlic and cinnamon oils on hepatocellular carcinoma in albino rats. Anal. Cell. Pathol. 2019, 2019, 9895485. [Google Scholar] [CrossRef] [Green Version]
- Gauthier, A.; Ho, M. Role of sorafenib in the treatment of advanced hepatocellular carcinoma: An update. Hepatol. Res. 2013, 43, 147–154. [Google Scholar]
- Morisaki, T.; Umebayashi, M.; Kiyota, A.; Koya, N.; Tanaka, H.; Onishi, H.; Katano, M. Combining celecoxib with sorafenib synergistically inhibits hepatocellular carcinoma cells in vitro. Anticancer. Res. 2013, 33, 1387–1395. [Google Scholar]


| Variables | Group 1 (Control) | Group 2 (HCC) |
|---|---|---|
| Total body weight at 1st week (grams) | 189.30 ± 6.85 | 186.79 ± 11.69 |
| Total body weight at 2nd week (grams) | 189 ± 8.18 | 162.02 ± 9.17 a |
| Total body weight at 3rd week (grams) | 214.18 ± 12.78 | 175.18 ± 13.85 a |
| Total body weight at 4th week (grams) | 239.26 ± 22.16 | 203.02 ± 12.82 a |
| Total body weight at 5th week (grams) | 247.98 ± 25.03 | 224.33 ± 18.94 a |
| Total body weight at 6th week (grams) | 265.98 ± 31.38 | 239.39 ± 22.05 a |
| Ratio of total body weight changes (%) | 40.51% | 28.16% |
| Data | Group 1 (Control) | Group 2 (HCC) | Group 3 (Induced HCC + Crocin) | Group 4 (Induced HCC + Sorafenib) | Group 5 (Induced HCC + Sorafenib/Crocin) |
|---|---|---|---|---|---|
| Initial body weights at week 7 (grams) | 278.16 ± 29.56 | 247.19 ± 17.40 a | 248.08 ± 14.86 a | 263.74 ± 19.60 | 237.97 ± 22.82 a |
| Final body weights at week 13 (grams) | 319.58 ± 4.04 | 269.90 ± 33.36 a | 291.52 ± 18.96 | 316.55 ± 26.53 b | 287.43 ± 27.61 |
| Ratio of total increase of body weight (%) | 14.89% | 9.19% | 17.51% | 20.02% | 20.78% |
| Liver weights (grams) | 8.78 ±1.31 | 7.98 ± 1.37 | 8.07 ± 0.59 | 8.50 ± 1.11 | 8.08 ± 0.88 |
| Liver index (%) | 2.75 ± 0.13 | 2.95 ± 0.29 | 2.78 ± 0.24 | 2.68 ± 0.22 b | 2.81 ± 0.13 |
| Parameters | Group 1 (Control) | Group 2 (HCC) | Group 3 (Induced HCC + Crocin) | Group 4 (Induced HCC + Sorafenib) | Group 5 (Induced HCC + Sorafenib/Crocin) | |
|---|---|---|---|---|---|---|
| Serum | ALT (U/L) | 16.99 ± 3.98 | 79.80 ± 10.35 a | 21.00 ± 5.66 b | 37.00 ± 4.80 a, b | 32.00 ± 8.06 a, b |
| AST (U/L) | 20.36 ± 4.72 | 107.10 ± 8.96 a | 26.00 ± 7.38 b | 55.20 ± 25.37 a, b | 45.76 ± 4.73 a, b | |
| ALP (U/L) | 43.80 ± 3.56 | 134.40 ± 14.47 a | 45.20 ± 6.34 b | 98.40 ± 22.07 a, b | 56.00 ± 7.28 b | |
| TP (mg/mL) | 6.91 ± 0.78 | 10.98 ± 0.95 a | 7.52 ± 0.76 b | 9.36 ± 0.48 a, b | 9.48 ± 0.49 a, b | |
| Conjugated bilirubin (mg/dL) | 0.31 ± 0.05 | 1.81 ± 0.31 a | 0.38 ± 0.13 b | 0.98 ± 0.08 a, b | 0.88 ± 0.15 a, b, c | |
| TC (mg/dL) | 121.20 ± 12.99 | 254.40 ± 35.56 a | 124.60 ± 8.08 b | 197.80 ± 11.58 a, b | 126.40 ± 6.88 b | |
| TG (mg/dL) | 73.80 ± 3.11 | 144.00 ± 38.97 a | 76.20 ± 4.15 b | 118.60 ± 9.37 a, b | 76.60 ± 4.67 b | |
| CRP (mg/dL) | 7.24 ± 1.27 | 26.60 ± 6.11 a | 10.92 ± 3.46 b | 19.38 ± 2.88 a, b | 7.56 ± 0.96 b | |
| IL-6 (pg/mL) | 4.99 ± 0.79 | 23.34 ± 5.53 a | 6.16 ± 1.43 b | 14.75 ± 1.77 a, b | 5.52 ± 1.03 b | |
| LDH (U/L) | 158.00 ± 19.20 | 448.40 ± 83.25 a | 214.00 ± 43.78 b | 337.20 ± 93.08 a, b | 207.60 ± 16.56 b, c | |
| Serum tumor marker PIVKA-II (mAU/mL) | 3.50 ± 0.55 | 17.34 ± 2.05 a | 7.34 ± 1.63 a, b | 13.36 ± 1.24 a, b | 8.53 ± 1.41 a, b | |
| Tissue homogenates | GSH (ng/mg proteins) | 17.90 ± 5.37 | 2.08 ± 0.65 a | 10.84 ± 2.07 a, b | 5.82 ± 2.53 a, b | 12.04 ± 2.48 a, b |
| MDA (nmol/mg proteins) | 0.40 ± 0.11 | 1.63 ± 0.31 a | 0.77 ± 0.23 a, b | 1.19 ± 0.23 a, b | 0.77 ± 0.17 a, b | |
| Homogenate tumor marker AFP (ng/mg proteins) | 13.64 ± 2.71 | 72.12 ± 10.87 a | 22.84 ± 2.18 a, b | 52.60 ± 10.16 a, b | 25.16 ± 4.61 a, b, c | |
| Rats Group | Expression Fold Change 2−(△△CT) | |||||||
|---|---|---|---|---|---|---|---|---|
| TNF-α | p-Value | VEGF | p-Value | P53 | p-Value | NF-KB | p-Value | |
| Control | 1 | 0.00292043 | 1 | 0.15289108 | 1 | 0.25597226 | 1 | 0.05884745 |
| HCC | 1083.8 ± 1.69 | 0.00558695 | 545.86 ± 2.91 | 0.02391665 | 243.43 ± 2.85 | 0.00896182 | 352.38 ± 3.86 | 0.00558695 |
| HCC+ Crocin | 1.17 ± 0.422 | 0.03644899 | 5.02 ± 1.58 | 0.4917508 | 0.99 ± 0.86 | 0.07553378 | 4.21 ± 2.48 | 0.08432088 |
| HCC+ Sorafenib | 165.79 ± 1.47 | 0.01215541 | 54.57 ± 1.05 | 0.01092501 | 147.64 ± 1.17 | 0.00276726 | 12.87 ± 1.47 | 0.01215541 |
| HCC+ Sorafenib/Crocin | 95.8 ± 1.77 | 0.04617572 | 31.2 ± 1.65 | 0.08639409 | 24.1 ± 1.82 | 0.01113539 | 9.29 ± 1.28 | 0.18709868 |
| Concentration of Sorafenib and Crocin Mix (μM) | Cell Viability (%) |
|---|---|
| 0 | 100 |
| 6.25 | 67.30 |
| 12.5 | 46.94 |
| 25 | 36.46 |
| 50 | 27.91 |
| 100 | 20.8 |
Publisher’s Note: MDPI stays neutral with regard to jurisdictional claims in published maps and institutional affiliations. |
© 2022 by the authors. Licensee MDPI, Basel, Switzerland. This article is an open access article distributed under the terms and conditions of the Creative Commons Attribution (CC BY) license (https://creativecommons.org/licenses/by/4.0/).
Share and Cite
Abdu, S.; Juaid, N.; Amin, A.; Moulay, M.; Miled, N. Therapeutic Effects of Crocin Alone or in Combination with Sorafenib against Hepatocellular Carcinoma: In Vivo & In Vitro Insights. Antioxidants 2022, 11, 1645. https://doi.org/10.3390/antiox11091645
Abdu S, Juaid N, Amin A, Moulay M, Miled N. Therapeutic Effects of Crocin Alone or in Combination with Sorafenib against Hepatocellular Carcinoma: In Vivo & In Vitro Insights. Antioxidants. 2022; 11(9):1645. https://doi.org/10.3390/antiox11091645
Chicago/Turabian StyleAbdu, Suzan, Nouf Juaid, Amr Amin, Mohamed Moulay, and Nabil Miled. 2022. "Therapeutic Effects of Crocin Alone or in Combination with Sorafenib against Hepatocellular Carcinoma: In Vivo & In Vitro Insights" Antioxidants 11, no. 9: 1645. https://doi.org/10.3390/antiox11091645