Article

Growth Performance, Bone Development and Phosphorus Metabolism in Chicks Fed Diets Supplemented with Phytase Are Associated with Alterations in Gut Microbiota

State Key Laboratory of Animal Nutrition, College of Animal Science and Technology, China Agricultural University, Beijing 100193, China
*
Author to whom correspondence should be addressed.
These authors contributed equally to this work.
Current address: Beijing Huadu Yukou Poultry Industry Co., Ltd., Beijing 101206, China.
Animals 2022, 12(7), 940; https://doi.org/10.3390/ani12070940
Submission received: 27 February 2022 / Revised: 31 March 2022 / Accepted: 1 April 2022 / Published: 6 April 2022
(This article belongs to the Collection Gut and Bone in Health and Disease)

Abstract

:

Simple Summary

Phosphorus is a crucial component of nucleic acids, phospholipids, several coenzymes and bone, and plays numerous roles in nutrient metabolism in animals. We investigated the growth performance, bone development, phosphorus metabolism and gut microbiota changes elicited by different phosphorus levels with/without phytase in chicks during the brooding period. Low-phosphorus diets inhibited growth performance and bone development, decreased utilization of phosphorus and altered gut microbial structure and function in the brooding stage of chicks. Inclusion of phytase improved growth performance and bone development and decreased phosphorus emission. The potential mechanisms may be associated with gut microbiota reprogramming.

Abstract

Phosphorus pollution caused by animal husbandry is becoming increasingly problematic, especially where decreasing and non-renewable phosphorus resources are concerned. We investigated the growth performance, bone development, phosphorus metabolism and gut microbiota changes elicited by different phosphorus levels with/without phytase in chicks during the brooding period (1–42 d). Five-hundred-and-forty (540) egg-laying chickens were assigned to six groups (0.13% NPP, 0.29% NPP, 0.45% NPP, 0.13% NPP + P, 0.29% NPP + P and 0.45% NPP + P) according to a factorial design with three non-phytate phosphorus (NPP) levels (0.13, 0.29 and 0.45%) and two phytase (P) dosages (0 and 200 FTU/kg). Chicks fed with the diet with 0.13% NPP had the lowest body weight, average daily gain, shank length, average daily feed intake and highest ratio of feed to gain, while phytase supplementation was able to mitigate the adverse effects of low-phosphorus diets on growth performance. Moreover, phosphorus metabolism was affected by different dietary NPP and phytase levels. Thus, 0.13% NPP significantly reduced serum phosphorus, while phytase supplementation significantly increased serum phosphorus. Notably, phosphorus utilization in the 0.13% NPP group was significantly decreased and the phosphorus excretion ratio was increased. Phytase supplementation significantly improved phosphorus utilization by 43.79% and decreased phosphorus emission in the 0.13% NPP group but not in the 0.29% NPP or the 0.45% NPP group. Remarkably, the alpha diversity of gut microbiota was significantly decreased in the low-phosphorus group, while phytase supplementation increased alpha diversity and improved gut microbial community and function. The LEfSe analysis revealed that several differential genera (e.g., Bacteroides, norank_f__Clostridiales_vadinBB60_group and Eggerthella) were enriched in the different dietary NPP and phytase levels. Furthermore, correlations between differential genera and several crucial phenotypes suggested that the enrichment of beneficial bacteria with different levels of phosphorus and phytase promoted phosphorus utilization in the foregut and hindgut. In summary, low-phosphorus diets inhibited growth performance and bone development, decreased utilization of phosphorus and altered gut microbial structure and function in the brooding stage of chicks. Finally, phytase supplementation improves growth performance and bone development and decreases phosphorus emission, and the potential mechanisms may be associated with the reprogramming of gut microbiota.

1. Introduction

Phosphorus is a crucial component of nucleic acids, phospholipids, several coenzymes and bone and plays numerous roles in nutrient metabolism in animals [1,2]. It is therefore consequential that the world’s phosphate rock supplies may be depleted over the next 50–100 years [3]. In general, mineral feed phosphates are frequently added to chicken diets since the quantity of accessible phosphorus supplied by plant-based feed components is deemed inadequate [4]. However, feed phosphates are produced from mined rock phosphate; therefore, it is necessary to decrease using feed phosphates to make poultry production more sustainable [5]. In addition, excessive P supplementation results in higher feed prices and higher phosphate contents in excreta [3]. This can lead to phosphorus pollution issues, such as the eutrophication of sensitive ecosystems [6,7].
The phosphorus availability of planted feed ingredients is regarded as insufficient. In a balance trial in pigs, the phosphorus availability of maize was found to be 18%, wheat 62% and triticale 52% [8]. In poultry production, phosphorus availability reported from laying hen studies varied from 23 to 53% [4]. In vegetable feedstuffs, phytic acid is an anti-nutritional constituent to block P digestion [9]. In plant seeds, phytic acid is naturally present as phytate, the principal storage form of phosphorus for mature poultry [9]. Many studies have demonstrated the usefulness of phytases in enhancing phosphorus bioavailability, thus inorganic phosphorus supplementation could be reduced and consequent phosphorus excretion minimized in animal production [10,11]. During the past decade, the inclusion of microbial phytase in poultry diets has increased remarkably, mainly due to its benefits to poultry production [12] and in response to concerns about phosphorus pollution [13].
The gut microbiome is extremely important in animal health due to its role in shaping the biochemical profile of diets [14]. Recent research reveals that calcium phosphate has a considerable impact on gut microbiota alterations caused by inulin and galacto-oligosaccharides ingestion [15]. Moreover, phytase affects the gut microbiota of chicken, which is connected to the contents of dietary phosphorus and Ca [16]. Despite increasing research into the effects of phytase on phosphorus metabolism and growth performance, the relationship between growth performance and phosphorus emission and gut microflora in chicks is rarely considered. Therefore, we hypothesized that different levels of phosphorous with phytase affect growth performance, reshape gut microbiota and reduce phosphorus pollution in layers. Hence, the goal of this trial was to explore the effects of varying doses of phosphorus and phytase on the growth performance, phosphorus metabolism and emission of phosphorus and the microflora community in chicks.

2. Materials and Methods

The animal experimental and sample collection were approved by the Animal Care and Use Committee of China Agricultural University (AW13301202-1-14). All procedures were conducted following the guidelines for Experimental Animals (Beijing, China).

2.1. Animals, Housing and Experimental Design

Five-hundred-and-forty one-day-old white egg-laying strain chicks (Jing Pink, a cultivated brand with pink eggshell and white feathers and medium body size, supplied by Yukou Poultry Co., Ltd., Beijing, China) with an average body weight (BW) of 37.55 ± 0.30 g were randomly assigned to six treatments (6 replicates of 15 birds) with three dietary NPP supplementation levels (0.45%, 0.29% and 0.13%) with/without phytase (0 FTU/kg and 200 FTU/kg). All six experimental treatment diets were prepared to meet the Chinese Feeding Standard of Chickens except for phosphorus and phytase (Table 1). Chicks were provided with feed and water ad libitum. A 23 h light schedule was applied for the initial three-day period, followed by 22 h of lighting with 2 h of darkness during the fourth and seventh days, and then an increase of 2 h of darkness each week until the chicks had reached 6 weeks of age. The temperature of the animal housing was kept at roughly 35 °C for the first week, then progressively dropped to 25 °C for the remainder of the experiment. Protocols for disinfection and immunization were followed in line with the commercial layer’s management manual. The experiment lasted 6 weeks.

2.2. Growth Performance and Bone Development Analysis

On days 14 and 42, the BW and shank length were measured. BW, average daily feed intake (ADFI), average daily gain (ADG), feed to gain ratio (F:G) and increment of shank length were calculated.

2.3. Blood Biochemical Parameters Analysis

Blood samples were obtained from the wing vein of one bird from each replicate at random in order to prepare serum samples on days 14 and 42 [17]. The concentrations of serum Ca, serum P, Albumin (ALB), and Alkaline Phosphatase (ALP) were determined by an automatic biochemical analyzer (Hitachi Co., Ltd., Tokyo, Japan) with commercial kits (Nanjing Jiancheng, China). Moreover, the contents of Bone Alkaline Phosphatase (BALP), Calcium Binding Protein (CaBP), Calcitonin (CT), Parathyroid Hormone (PTH), 1,25(OH)2D3 and 25(OH)D3 were detected by commercial ELISA kits (Nanjing Jiancheng, China).

2.4. Phosphorus Digestibility and Emission Analysis

Fecal digestibility was determined by the indicator method, which uses acid-insoluble ash as the endogenous indicator [18]. On days 33–35 of the experiment, the excreta were collected every 24 h and feathers and other debris were removed. Then, 5 g fresh manure was mixed with 10 mL of 10% sulfuric acid. The 3-day excrement was evenly mixed and put it into an oven at 65 °C to dry to constant weight, put indoors for moisture regain for 24 h, mashed through a 40-mesh sieve, then stored at −20 °C for further analysis.
Hydrochloric acid-insoluble ash contents were determined using the method described in a previous report [19]. Total phosphorus and Ca contents were analyzed using ICP-OES (ICP 720ES, Agilent, Santa Clara, CA, USA).
The dry matter (DM) digestibility, apparent total tract digestibility (ATTD) of phosphorus, phosphorus emission rate, phosphorus emission per kilogram of feed, daily phosphorus emission, ATTD of Ca, Ca emission rate, Ca emission per kilogram of feed and daily Ca excretion were calculated. The calculation formulas were as follows:
DM digestibility (%) = [1 − (Im × Pc)/(Id × Pd)] × 100
ATTD of P (%) = (1 − [(Im × Pc)/(Id × Pd)) × 100, where Im is the content of the acid-insoluble ash in the diet, Pc is the P content in feces, Pd is the P content in the diet and Id is acid-insoluble ash in feces.
Phosphorus excretion rate (%) = 100 − ATTD of P.
Phosphorus emission/kg of feed = total phosphorus in diet × phosphorus excretion rate.
Daily phosphorus excretion (g/d) = average daily feed intake × total phosphorus content × phosphorus excretion rate.
ATTD of Ca (%) = [1 − (Im × Cac)/(Id × Cad)] × 100, where Im is the content of the acid-insoluble ash in the diet, Cac is the Ca content in feces, Cad is the Ca content in the diet and Id is the acid-insoluble ash in feces.
Ca excretion rate (%) = 100 − ATTD of Ca.
Ca excretion emission/kg of feed = total Ca in diet × Ca excretion rate.
Daily Ca excretion (g/d) = average daily intake × total Ca content × Ca excretion rate.

2.5. Gut Microbial Analysis

The fresh cecal contents were collected for gut microbiota analysis. The E.Z.N.A. Stool DNA Kit was used to extract total DNA from the cecal contents of chicks, and a NanoDrop spectrophotometer was used to determine the amount and quality of the DNA. A commercial business (Majorbio, Shanghai, China) performed the Illumina MiSeq sequencing and data analytics. The V3 and V4 regions were PCR-amplified using the 338F (5′-ACTCCTACGGGAGGCAGC-3′) and 806R (5′-GGACTACHVGGGTWTCTAAT-3′) primers reported in a previous work [20]. The Illumina MiSeq paired-end sequenced (2300) platform was utilized to sequence purified amplicons, and the sequencing results were employed for bioinformatics analysis.
The methods used for intestinal microbiome analysis were consistent with a previous paper [21]. Alpha-diversity measure was analyzed using MOTHUR software (1.30.2). QIIME (1.9.1) was used to perform PCoA. The LEfSe analysis was utilized to identify the distinct bacterial populations at different phosphorus and phytase levels. Spearman correlation analysis was utilized in the Pheatmap package in R (3.3.1) to investigate the relationship between differential microbiota and growth performance, serum parameters and the P emission-related index.

2.6. Statistical Analysis

Except for microbiota analysis, the general linear model and two-way analysis of variance procedure in SAS 9.0 were used for analysis. After the ANOVA procedure, Tukey’s multiple comparisons test was applied for specific differences. All results were listed as means ± standard error of the mean (SEM). When the p-value < 0.05, differences were considered statistically significant.

3. Results

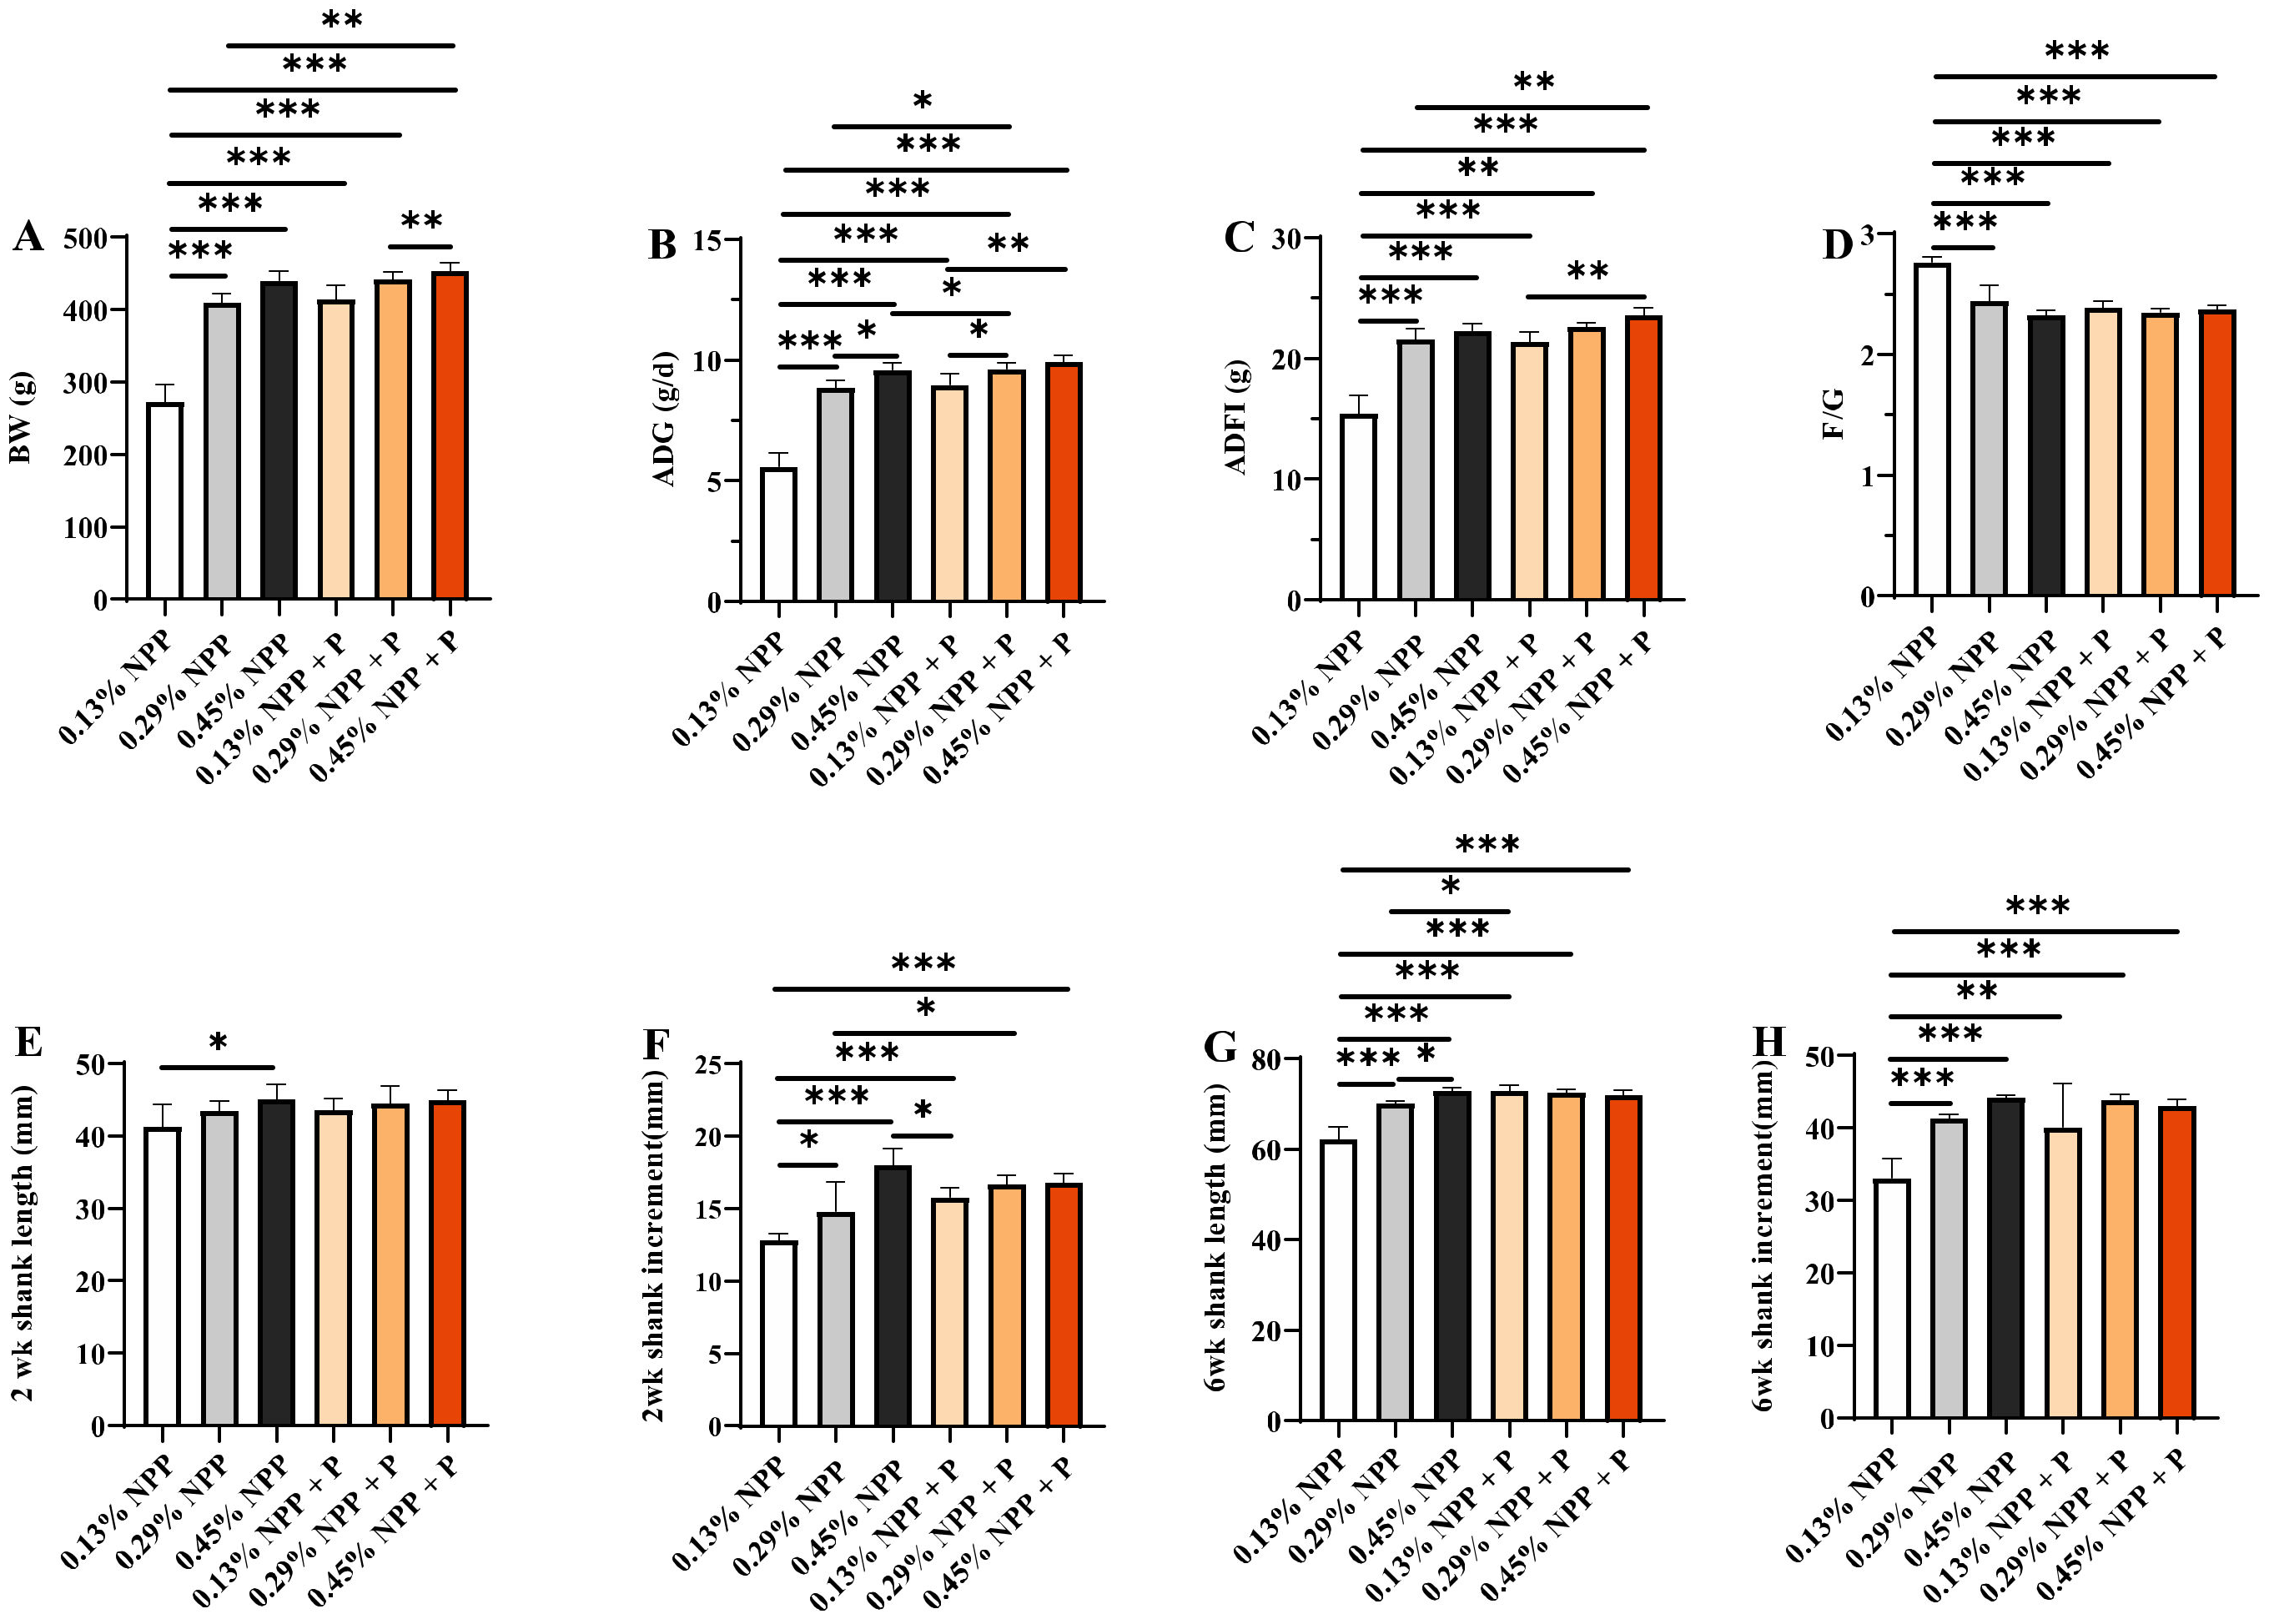
3.1. Growth Performance and Bone Development

Chicks were fed for six weeks with a series of dietary treatments consisting of three different levels of NPP (0.13%, 0.29% and 0.45%) with/without phytase. Dietary NPP and phytase levels had a significant interaction effect on average BW, ADG, ADFI and F/G (p < 0.01) (Figure 1 and Table S1). With the increase in phosphorus levels, BW, ADG and ADFI increased, and F/G decreased linearly (Figure S1). BW, ADG and ADFI varied significantly with different levels of phosphorus, with/without phytase (p < 0.001) (Figure 1). The 0.13% NPP group had significantly lower BW (p < 0.001), ADG (p < 0.001) and ADFI (p < 0.001) values and a significantly higher F/G (p < 0.001) value compared to the other treatments. Phytase supplementation in the 0.13% NPP diet improved all these growth indices, and the 0.13% NPP + P group achieved very similar growth performance to the 0.29% NPP and 0.45% NPP groups (p > 0.05) but still had a lower BW and ADFI than the 0.45% NPP + P group (p < 0.01) and a lower ADG than the other two phytase-supplemented groups (p < 0.05). The 0.29% NPP group exhibited a significant decrease in BW and AFDI compared with the 0.45% NPP + P group, meanwhile ADG decreased significantly compared with the 0.45% NPP, 0.29% NPP + P and 0.45% NPP + P groups (p < 0.05).
As shown in Figure 1 and Table S2, dietary NPP and phytase had a significant interaction effect on shank increment at 2 weeks of age and on shank length and increment at 6 weeks of age (p < 0.01). With the increase in phosphorus levels, shank length and shank increment increased linearly (Figure S1). At 2 weeks of age, the 0.13% NPP group showed a significant decrease in shank length and increment, and the 0.13% NPP group supplemented with phytase showed an increase in shank length and increment (p < 0.05). In addition, the 0.29% NPP group with phytase supplementation was also found to have an increased shank increment compared with the 0.29% NPP group (p < 0.05). At 6 weeks of age, the 0.13% NPP group and the 0.29% NPP group exhibited significant decreases in shank length compared with the 0.45% NPP (p < 0.05) and 0.13% NPP groups, and the 0.29% NPP group with phytase supplementation exhibited a significant increase in shank length (p < 0.05) not significantly different from that of the 0.45% NPP group (p > 0.05). Moreover, the shank increment in the 0.13% NPP group was significantly decreased (p < 0.01), while the 0.13% NPP + P group showed a significant increase in shank increment (p < 0.001) not significantly different from the other treatments.

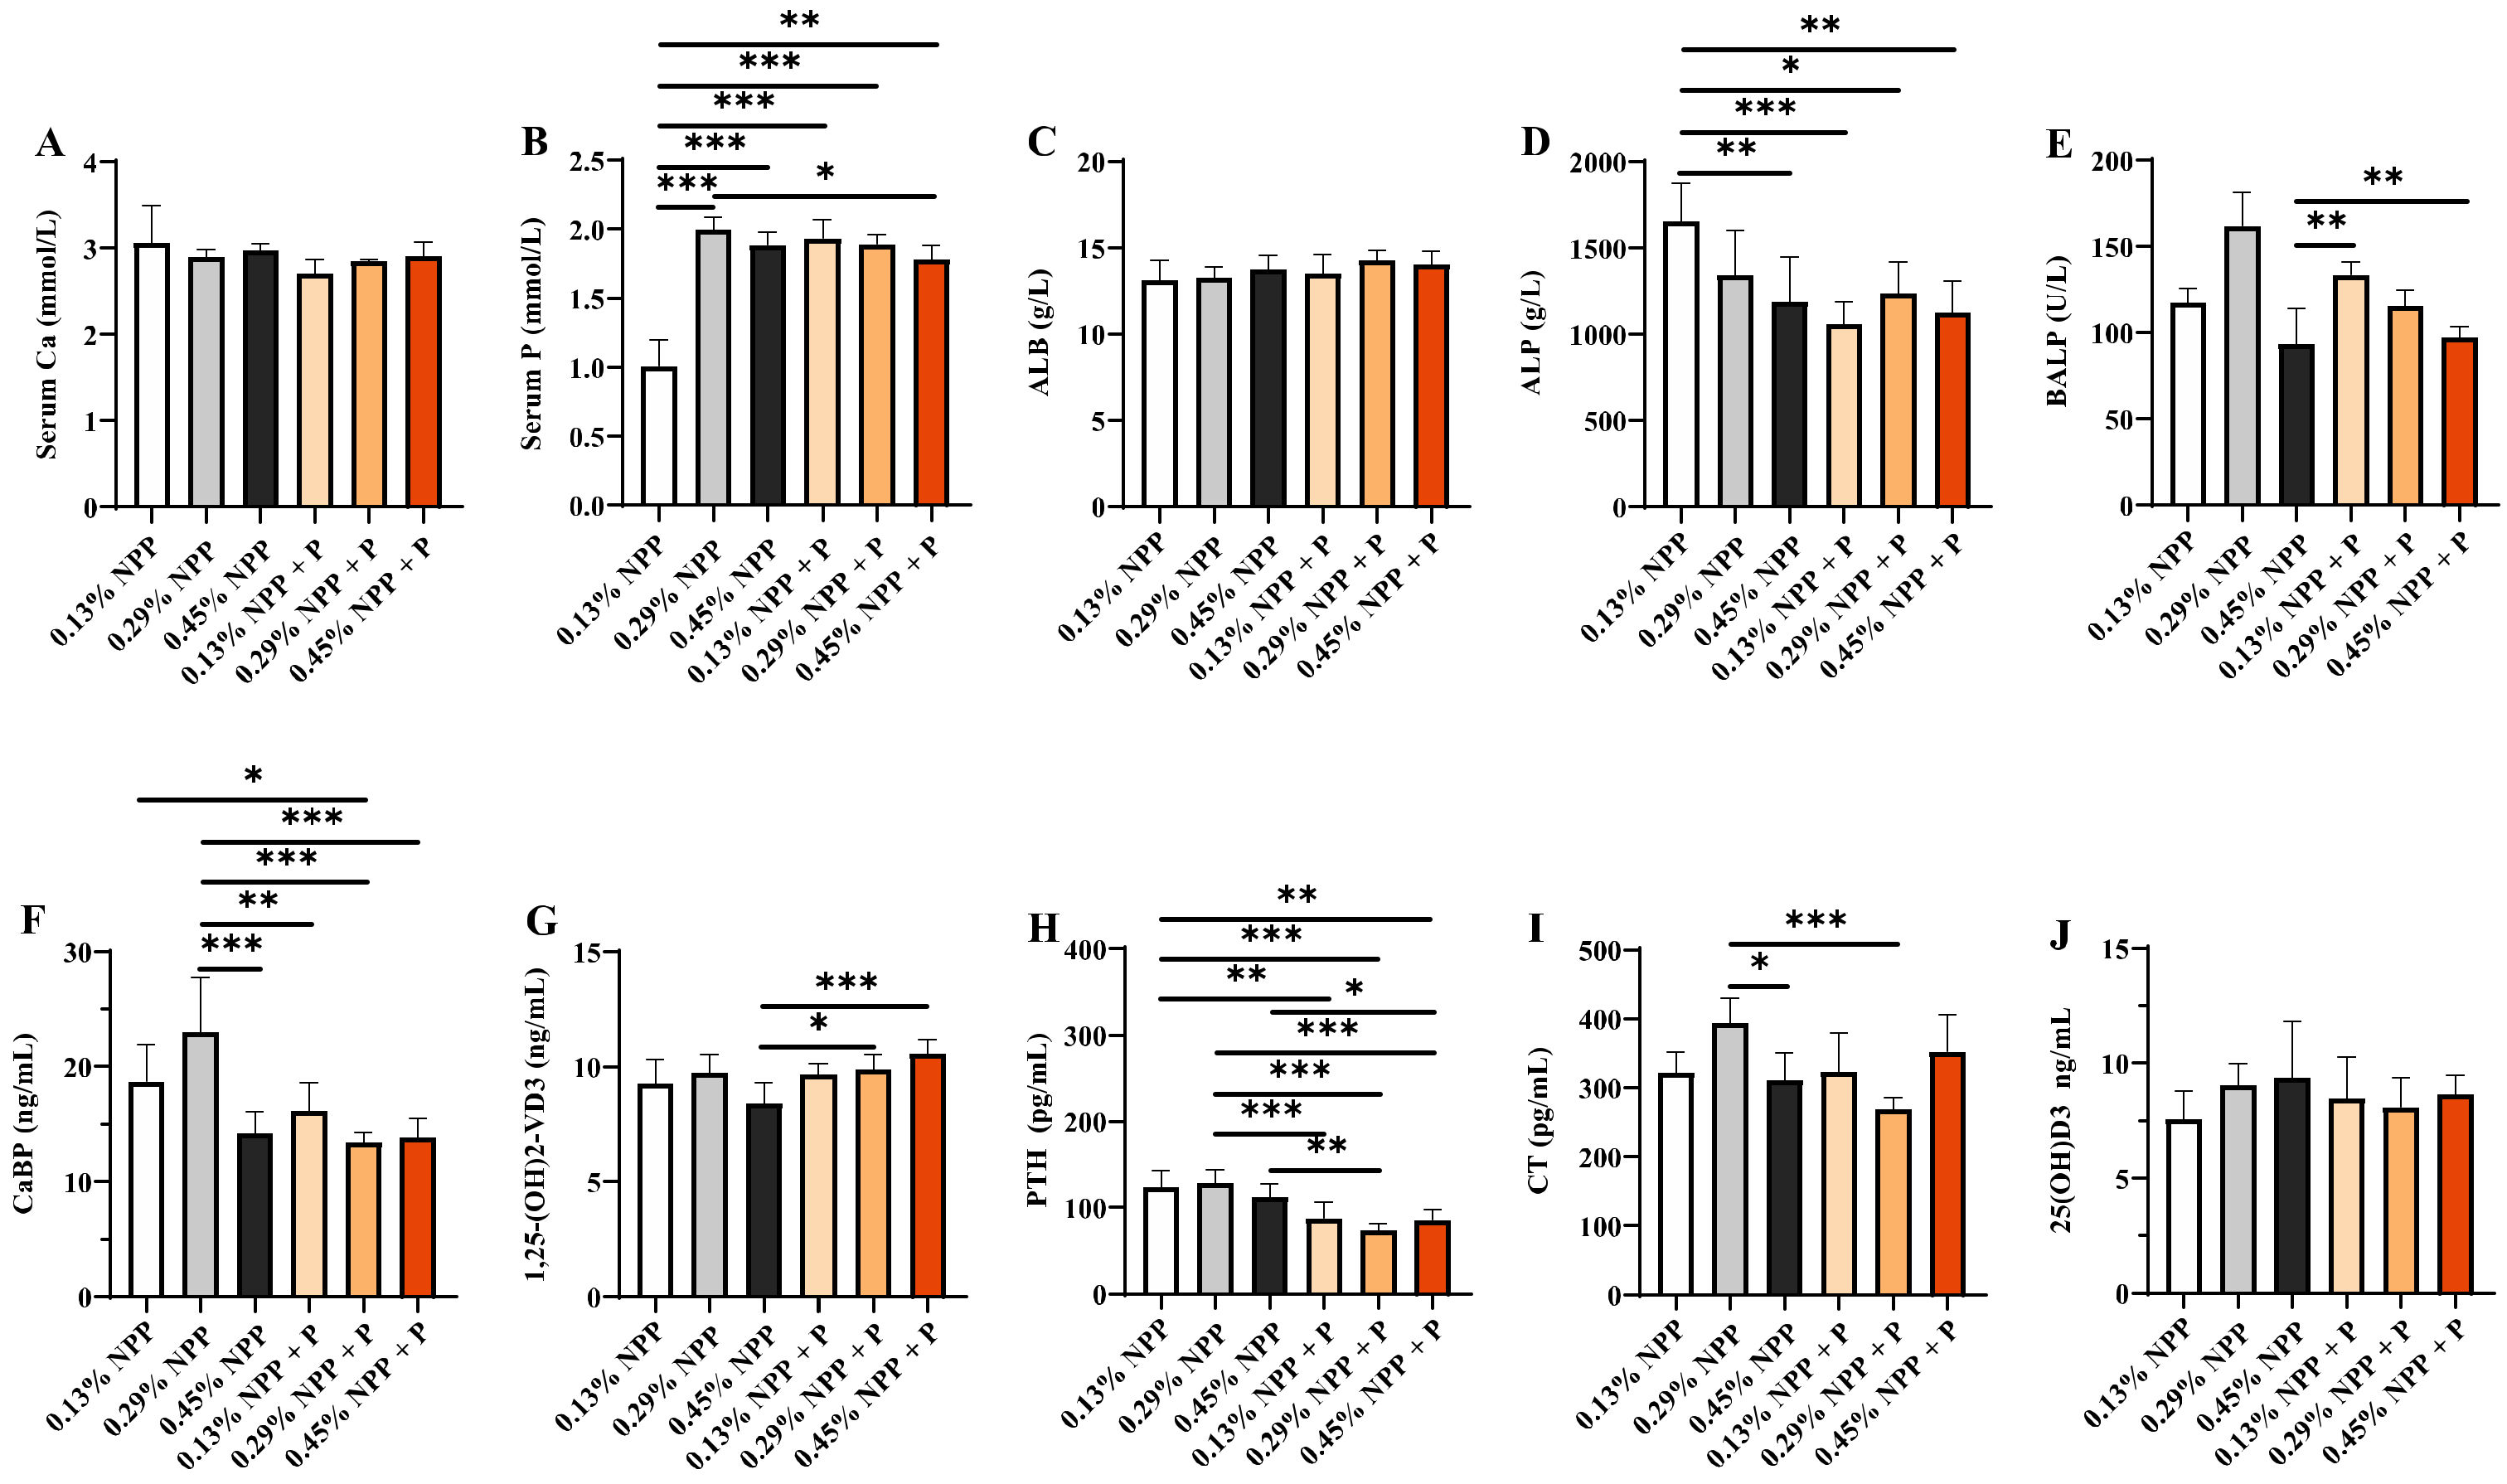
3.2. Serum Biochemical Index

As shown at Figure S2 and Table S3, dietary NPP and phytase had a significant interaction effect on serum phosphorus, ALB and ALP at 2 weeks of age (p < 0.01). Serum phosphorus in the 0.13% NPP group and 0.29% NPP group was significantly lower than in the 0.45% NPP group (p < 0.01), while, with phytase supplementation, there were significant increases in the 0.13% + P and 0.29% + P groups (p < 0.05). In addition, ALP content in the 0.13% NPP group was significantly increased compared with the other treatments (p < 0.001). The BALP content in the 0.45% NPP group was significantly higher than in the 0.13% NPP + P and 0.45% NPP + P groups (p < 0.01). Serum biochemical indexes of 6 weeks of age are presented in Figure 2 and Table S4; dietary NPP and phytase levels had a significant interaction effect on serum phosphorus, ALP, NBAP, CaBP, 1,25(OH)2D3 and CT (p < 0.01). Serum phosphorus in the 0.13% group was significantly decreased (p < 0.001); the addition of phytase in the 0.13% NPP diet significantly improved serum phosphorus, and there was no significant difference from other groups (p >0.05). In addition, the ALP content in the 0.13% NPP group was significantly higher than in the 0.45% NPP (p < 0.01), 0.13% NPP + P (p < 0.001), 0.29% NPP + P (p < 0.05) and 0.45% NPP + P (p < 0.01) groups. Moreover, we found that CaBP in the 0.29% NPP group was significantly higher than in the 0.45% NPP, 0.13% NPP + P, 0.29% NPP + P and 0.45% NPP + P groups (p < 0.01), and in the 0.13% NPP group was significantly higher than in the 0.29% NPP + P group (p < 0.05). PTH in the 0.13% NPP and 0.29% NPP groups was significantly higher than in the other groups added with phytase (p < 0.01), and in the 0.45% NPP group was significantly higher (p < 0.05) than in the 0.13% NPP + P (p < 0.01) and 0.45% NPP + P groups.

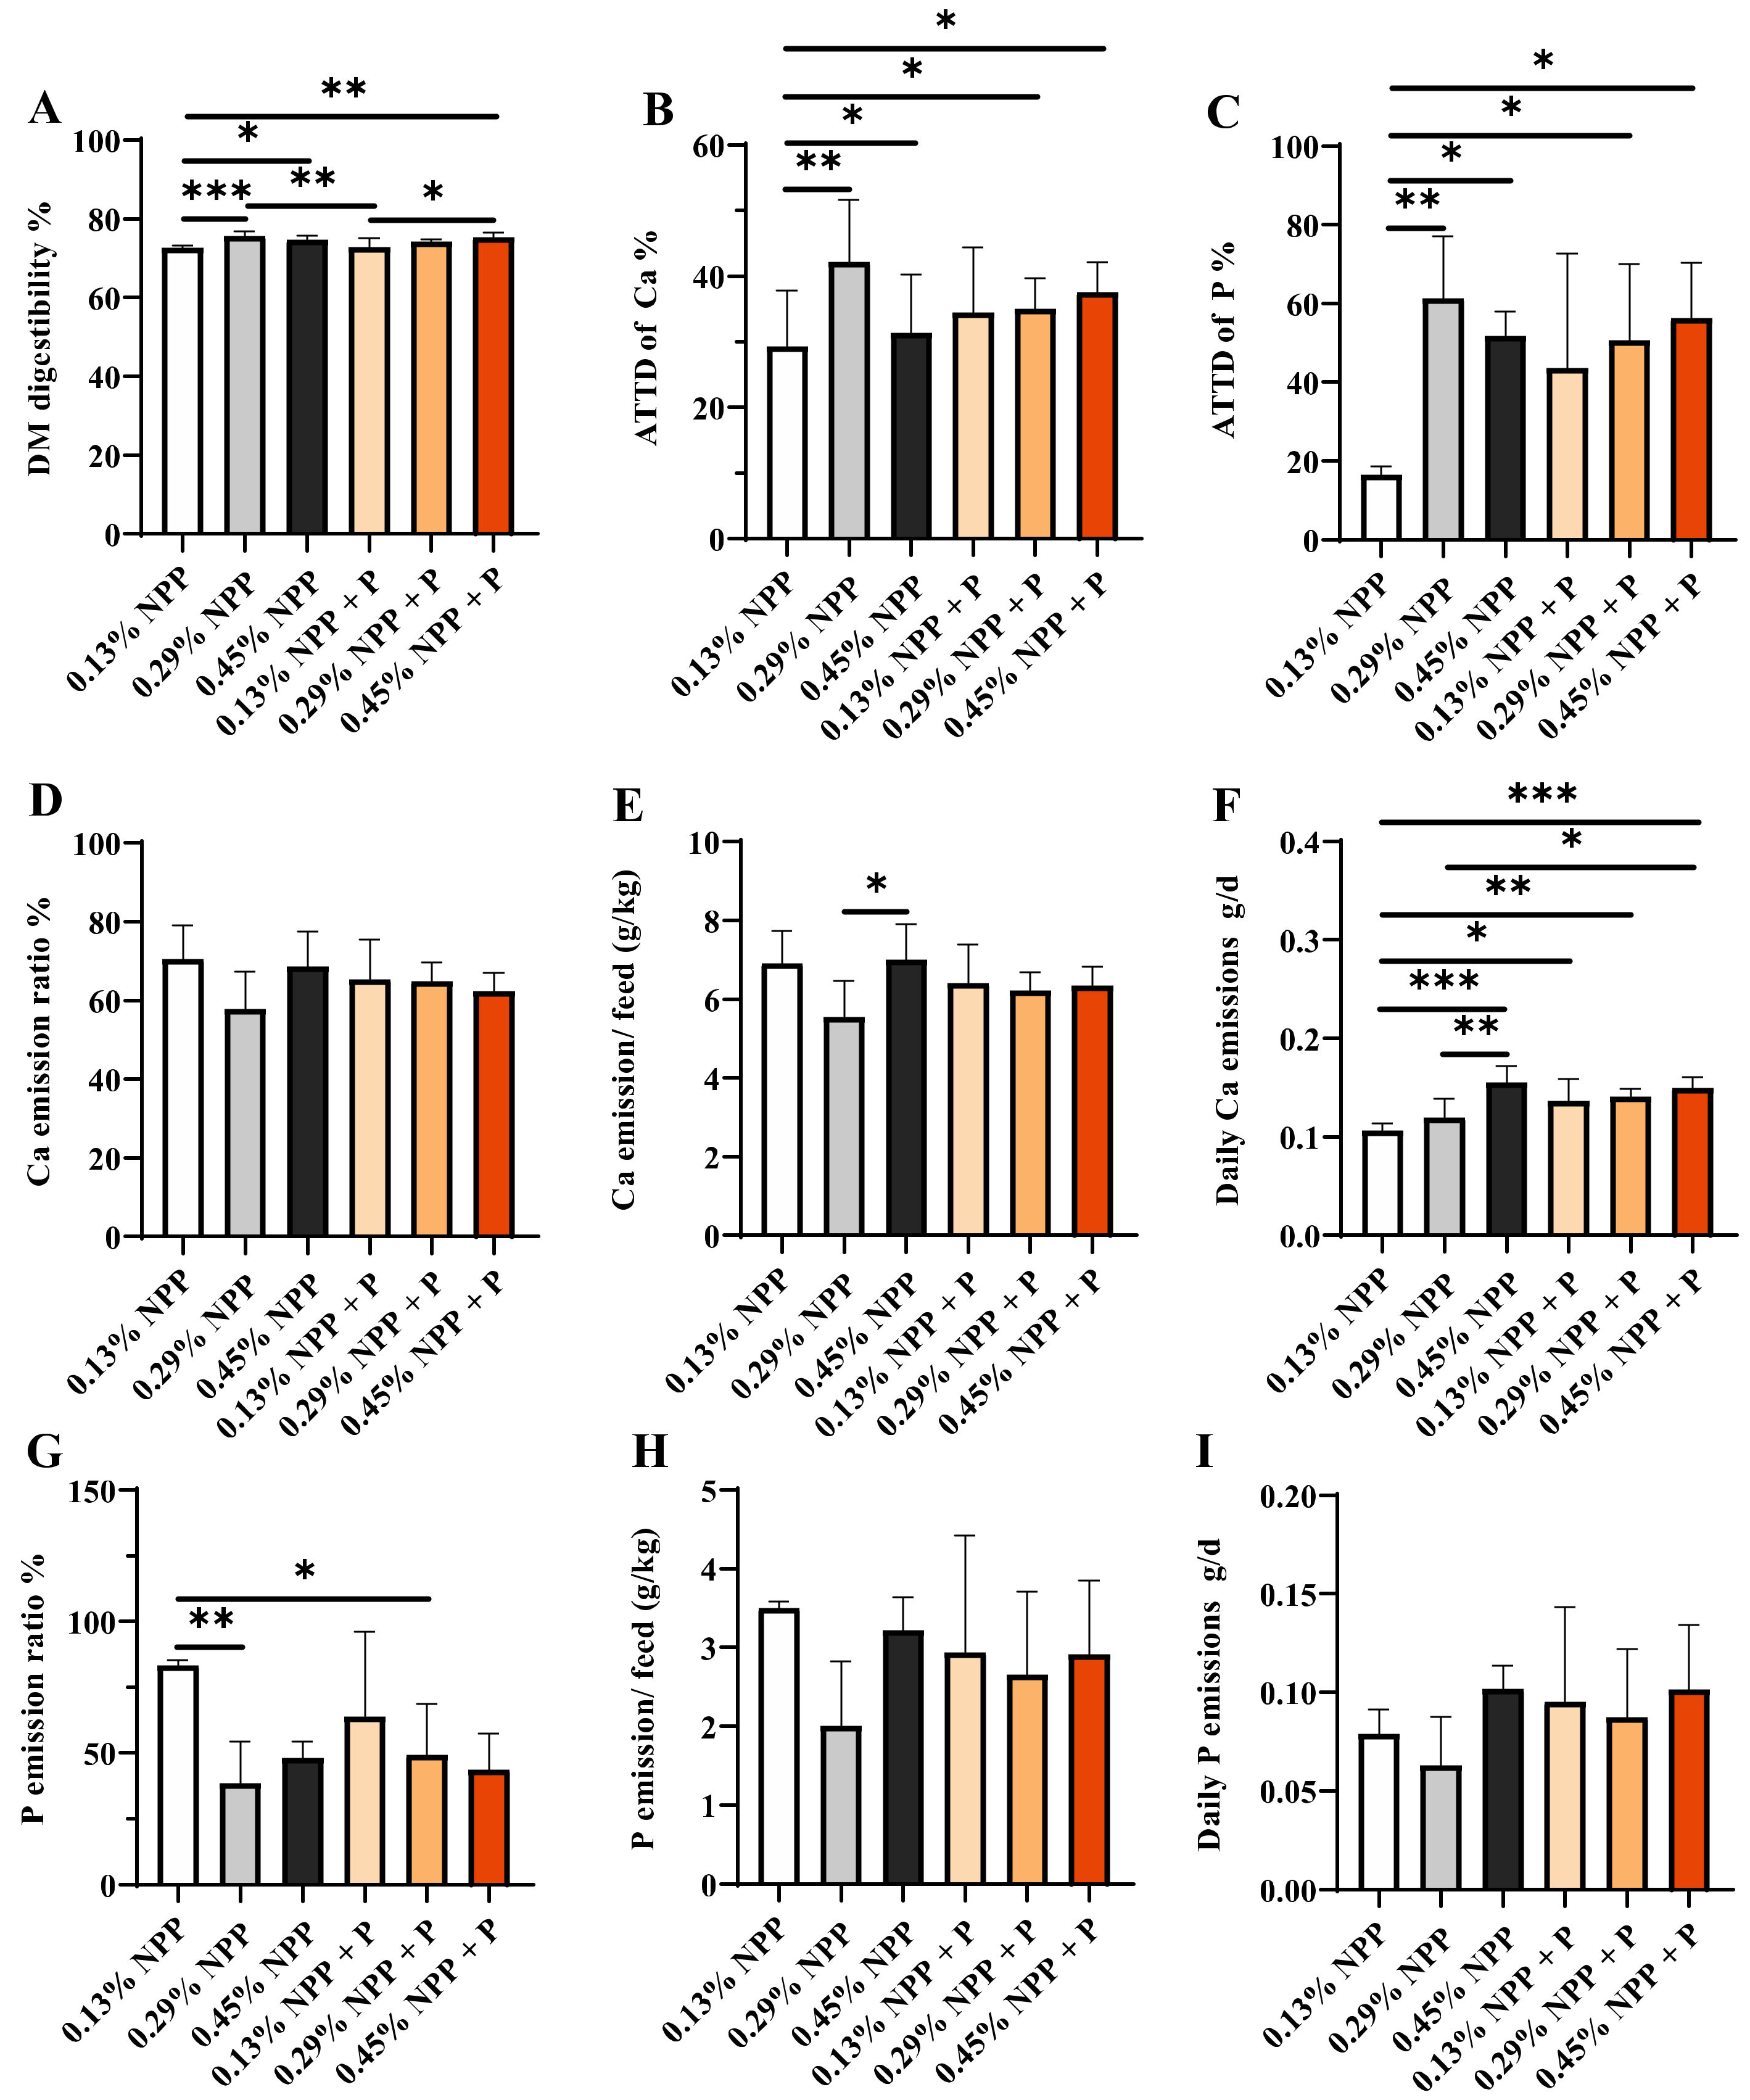
3.3. ATTD and Emission of Ca and Phosphorus

Dietary NPP and phytase levels had a significant interaction effect on Ca emission/feed and daily Ca emissions (Figure 3 and Table S5). As shown in Figure 3, the DM digestibility in the 0.13% NPP group was significantly lower than in the 0.29% NPP group and the 0.45% NPP group (p < 0.05); with phytase supplementation, the 0.13% NPP group still had lower DM digestibility compared to the 0.29% NPP group (Figure 3A). In addition, the ATTD of P in the 0.13% NPP group was significantly lower than in the 0.29% NPP (p < 0.01), 0.45% NPP (p < 0.05), 0.29% NPP + P (p < 0.05) and 0.45% NPP + P groups (p < 0.05), and there was no significant difference in the ATTD of phosphorus with phytase supplementation in the 0.13% NPP group (p > 0.05) (Figure 3C).
The Ca emission/feed in the 0.29% NPP diets was significantly lower than in the 0.45% NPP group (p < 0.05) (Figure 3E). The daily Ca emission in 0.13% NPP diets was significantly lower than in the 0.45% NPP (p < 0.001), 0.13% NPP + P (p < 0.05), 0.29% NPP + P (p < 0.05) and 0.45% NPP + P groups (p < 0.05) (Figure 3F). In addition, daily Ca emission in the 0.29% NPP group was significantly lower than in the 0.45% NPP group (p < 0.01) and in the 0.45% NPP + P group (p < 0.05). We also found a significant increase in the phosphorus emission ratio in the 0.13% NPP group compared with the 0.29% NPP group (p < 0.01) (Figure 3G). There was no significant difference in daily Ca emissions with phytase supplementation in the 0.13% and 0.29% NPP groups (Figure 3F).

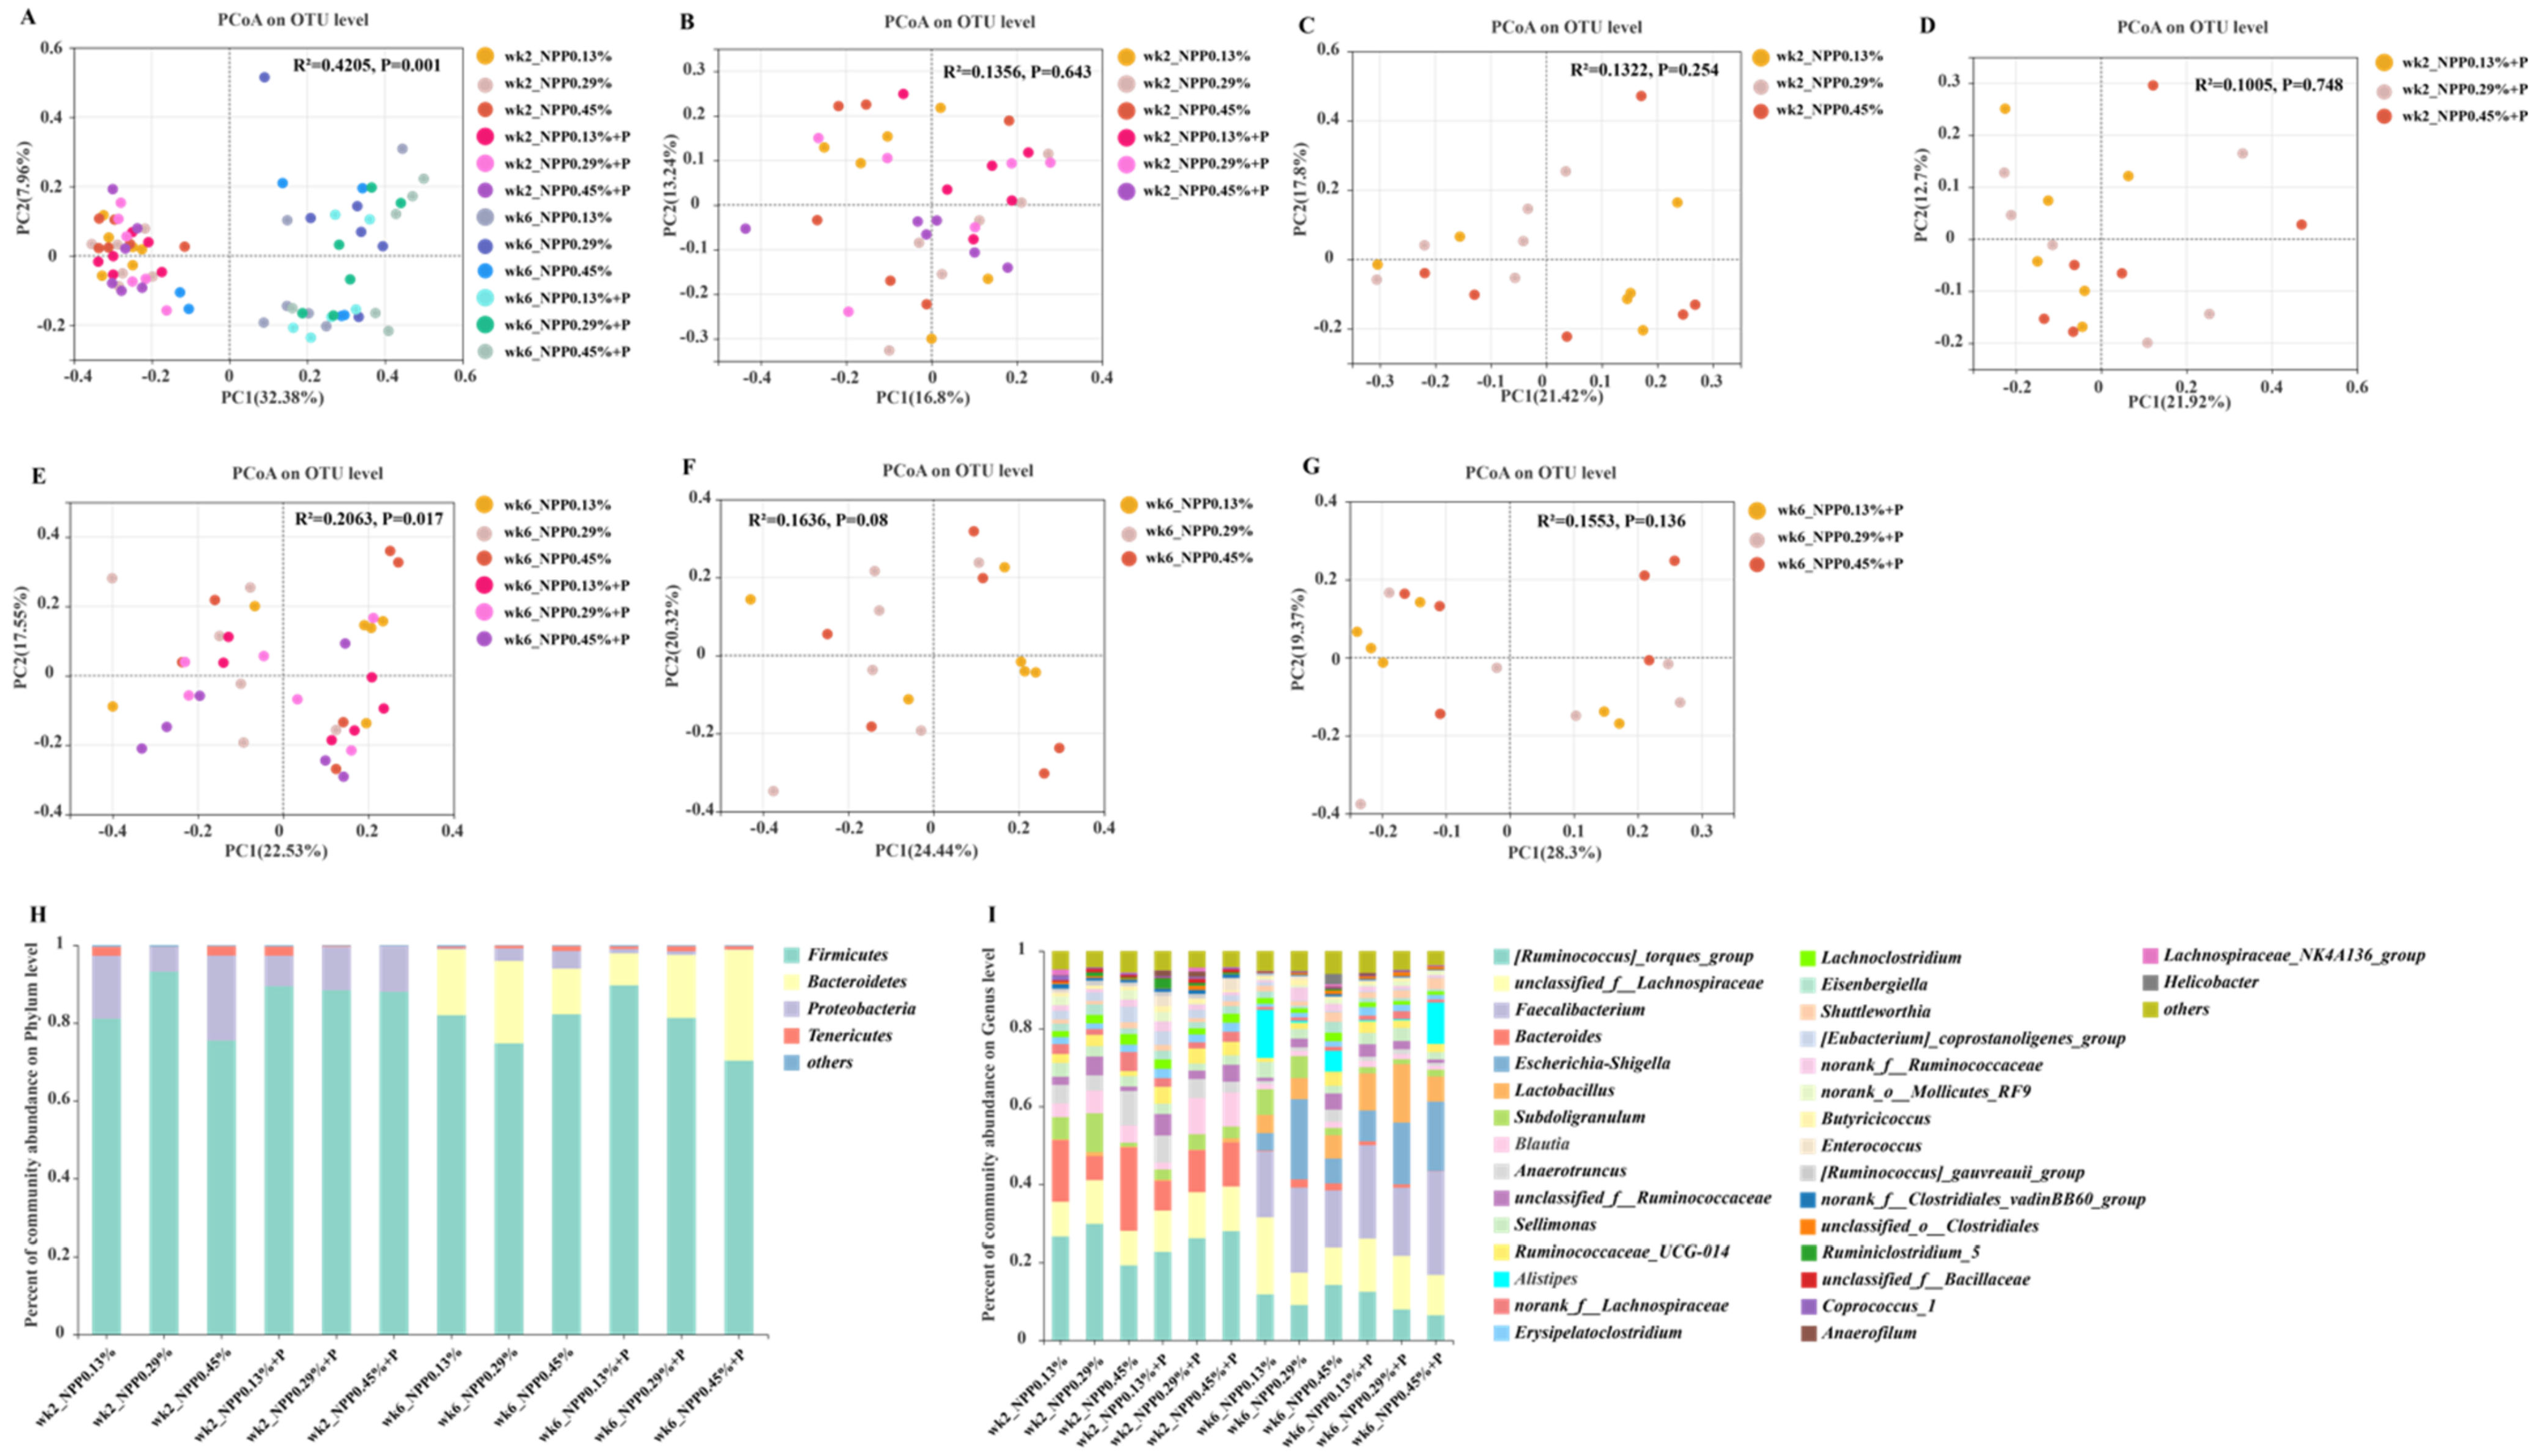
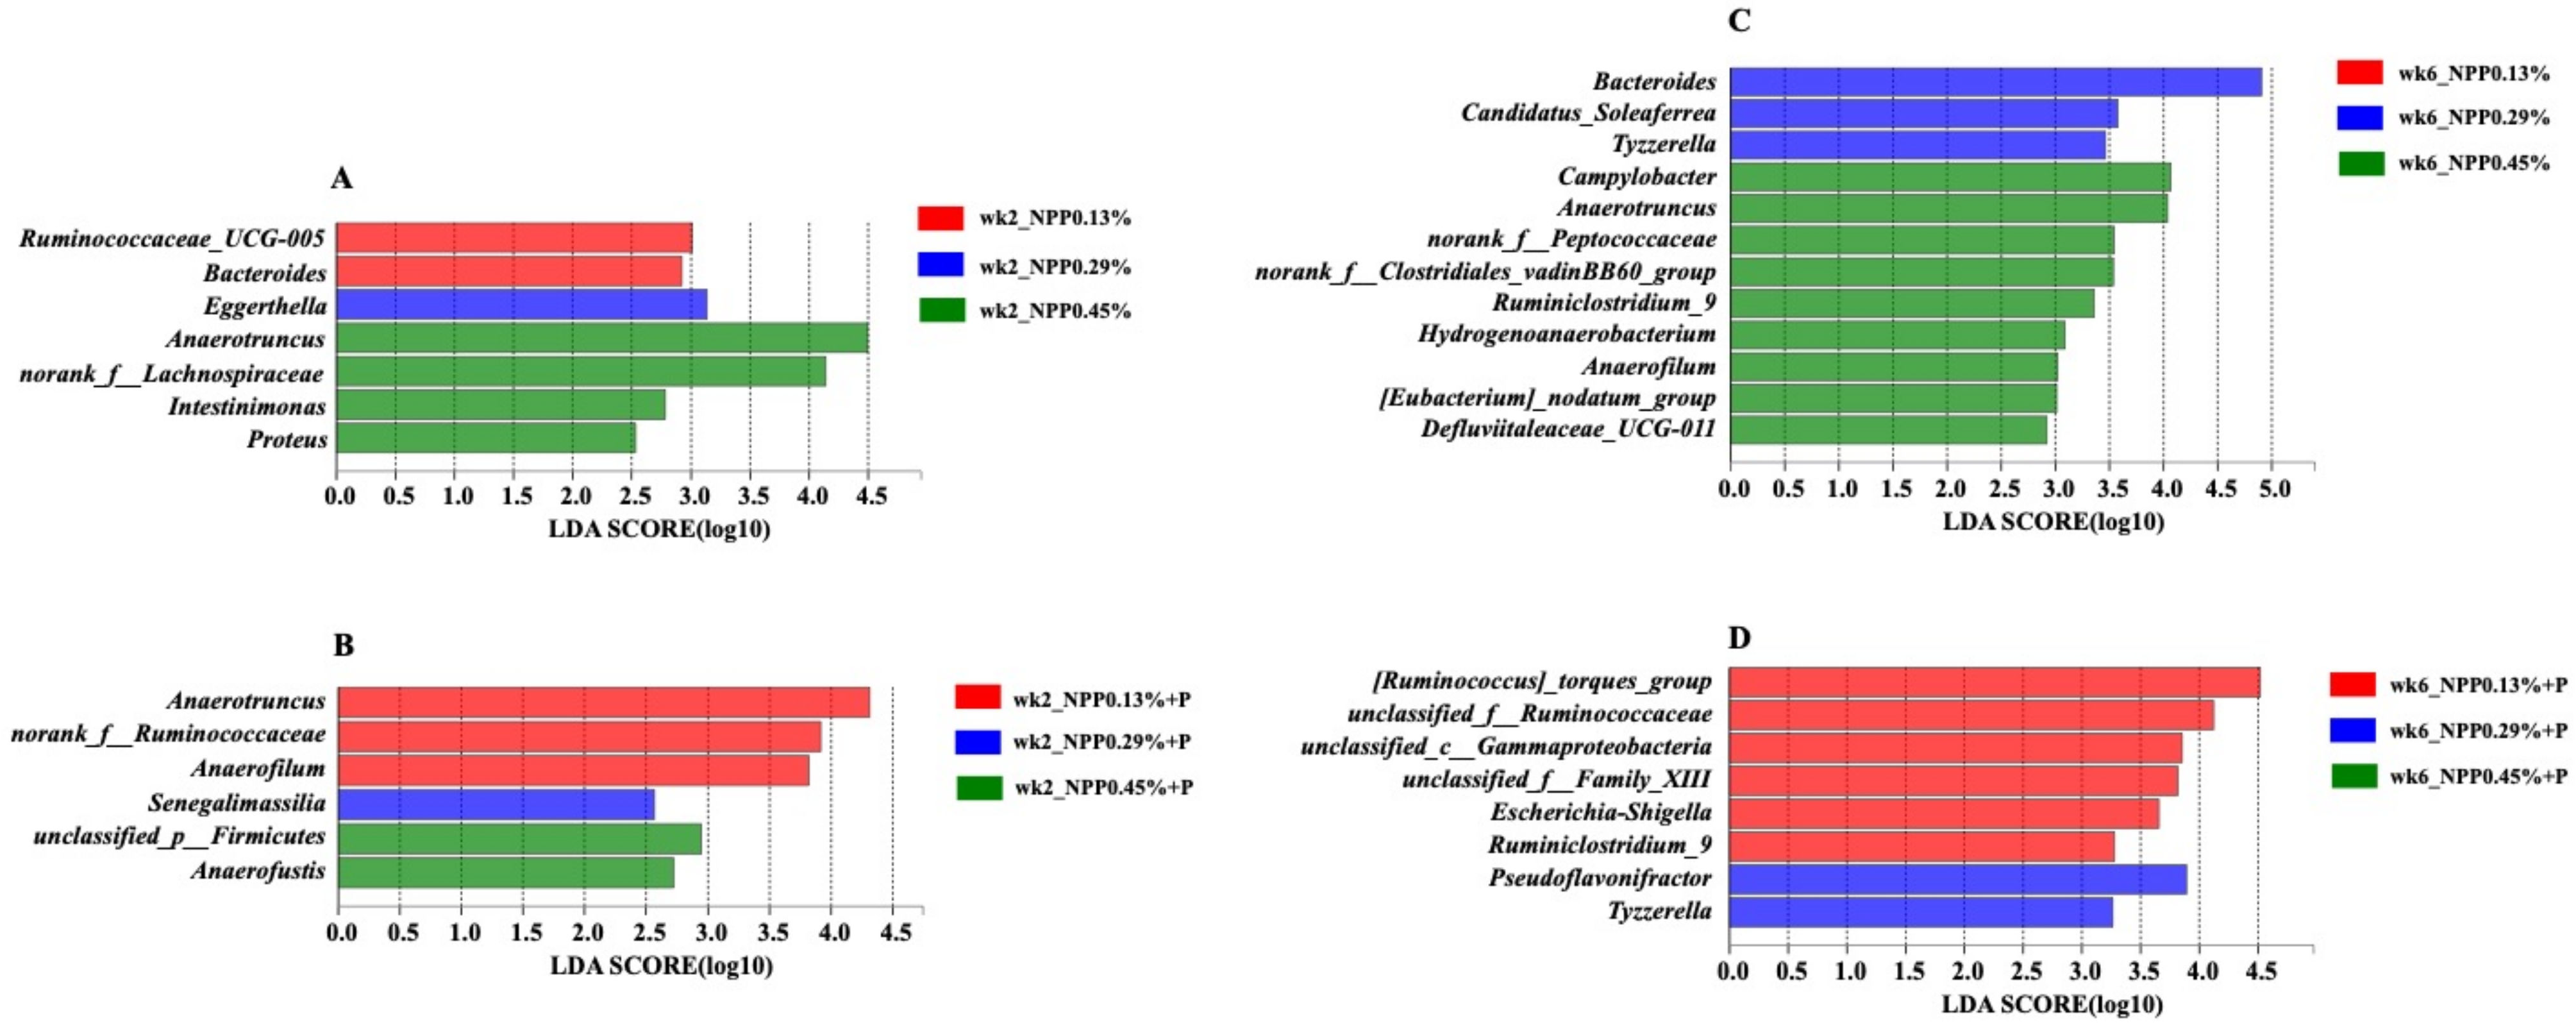
3.4. Gut Microbial Community and Structure

16S rDNA sequencing was performed to investigate how different phosphorus and phytase levels impacted the gut microbiota composition of chicks: 3,351,225 valid sequences were obtained, 608 distinct OTUs were matched with 97% similarity and 11 phyla and 58 genera in gut microbiota were annotated. As shown in Figure S3A–D, at 2 weeks of age, no significant variations in alpha diversity were identified between treatments. However, at 6 weeks of age, the Sobs index for the 0.13% NPP group was significantly lower than it was for the 0.45% NPP (p < 0.05), 0.13% NPP + P (p < 0.001) and 0.45% NPP + P groups (p < 0.001), and for the 0.29% NPP group was significantly lower than for the 0.29% NPP + P group (p < 0.01) (Figure S3E). In addition, the ACE index for the 0.13% group was significantly lower than for the 0.45% NPP (p < 0.05), 0.13% NPP + P (p < 0.01), 0.29% NPP + P (p < 0.01) and 0.45% NPP + P (p < 0.01) groups (Figure S3G). Moreover, Chao’s index for the 0.13% group was significantly lower than it was for the 0.45% NPP (p < 0.01), 0.13% NPP + P (p < 0.05), 0.29% NPP + P (p < 0.01) and 0.45% NPP + P (p < 0.01) groups (Figure S3H).
The relative abundance of organisms was studied at the phylum and genus levels. The PCoA data revealed that the microbiota structure altered between the ages of 2 and 6 weeks (Figure 4A). The distribution of spots has not presented a distinct clustering of gut microbial community structure (Figure 4B–G). Remarkably, phosphorus and phytase altered the structure and content of the chicks’ intestinal microbiota (Figure 4H,I). Interestingly, we found that Proteobacteria and Firmicutes had the highest concentrations at the phylum level at 2 weeks of age, while Bacteroidetes and Firmicutes make up the majority of bacteria in chick ceca, accounting for more than 95% of total cecal bacteria at 6 weeks of age. Cecal microbiota were dominated by [Ruminococcus]_torques_group, unclassified_f__Lachnospiraceae, Escherichia-Shigella, Lactobacillus and Subdoligranulum at 2 weeks of age. However, gut microbiota were dominated by [Ruminococcus]_torques_group, unclassified_f__Lachnospiraceae, Faecalibacterium, Escherichia-Shigella and Bacteroides at 6 weeks of age.
We utilized LEfSe to find out which bacterial genera were different across the groups. Relative abundance at genus level was investigated. As shown in Figure 5A, compared with the 0.13% NPP group, Eggerthella was enriched in the 0.29% NPP group, and Anaerotruncus, norank_f__Lachnospiraceae, Intestinimonas and Proteus were enriched in the 0.45% NPP group. As shown in Figure 5B, compared with the 0.13% NPP + P group, Senegalimassilia was enriched in the 0.29% NPP + P group, unclassified_p__Firmicutes and Anaerofustis were enriched in the 0.45% NPP + P group. As shown in Figure 5C, at 6 weeks of age, compared with the 0.13% NPP group, Bacteroides, Candidatus_Soleaferrea and Tyzzerella were enriched in the 0.29% NPP group, and Campylobacter, Anaerotruncus, norank_f__Peptococcaceae, norank_f__Clostridiales_vadinBB60_group, Ruminiclostridium_9, Hydrogenoanaerobacterium, Anaerofilum, [Eubacterium]_nodatum_group and Defluviitaleaceae_UCG-011 were enriched in the 0.45% NPP group. As shown in Figure 5D, at 6 weeks of age, compared with the 0.13% NPP + P group, Pseudoflavonifractor and Tyzzerella were enriched in the 0.45% NPP + P group.

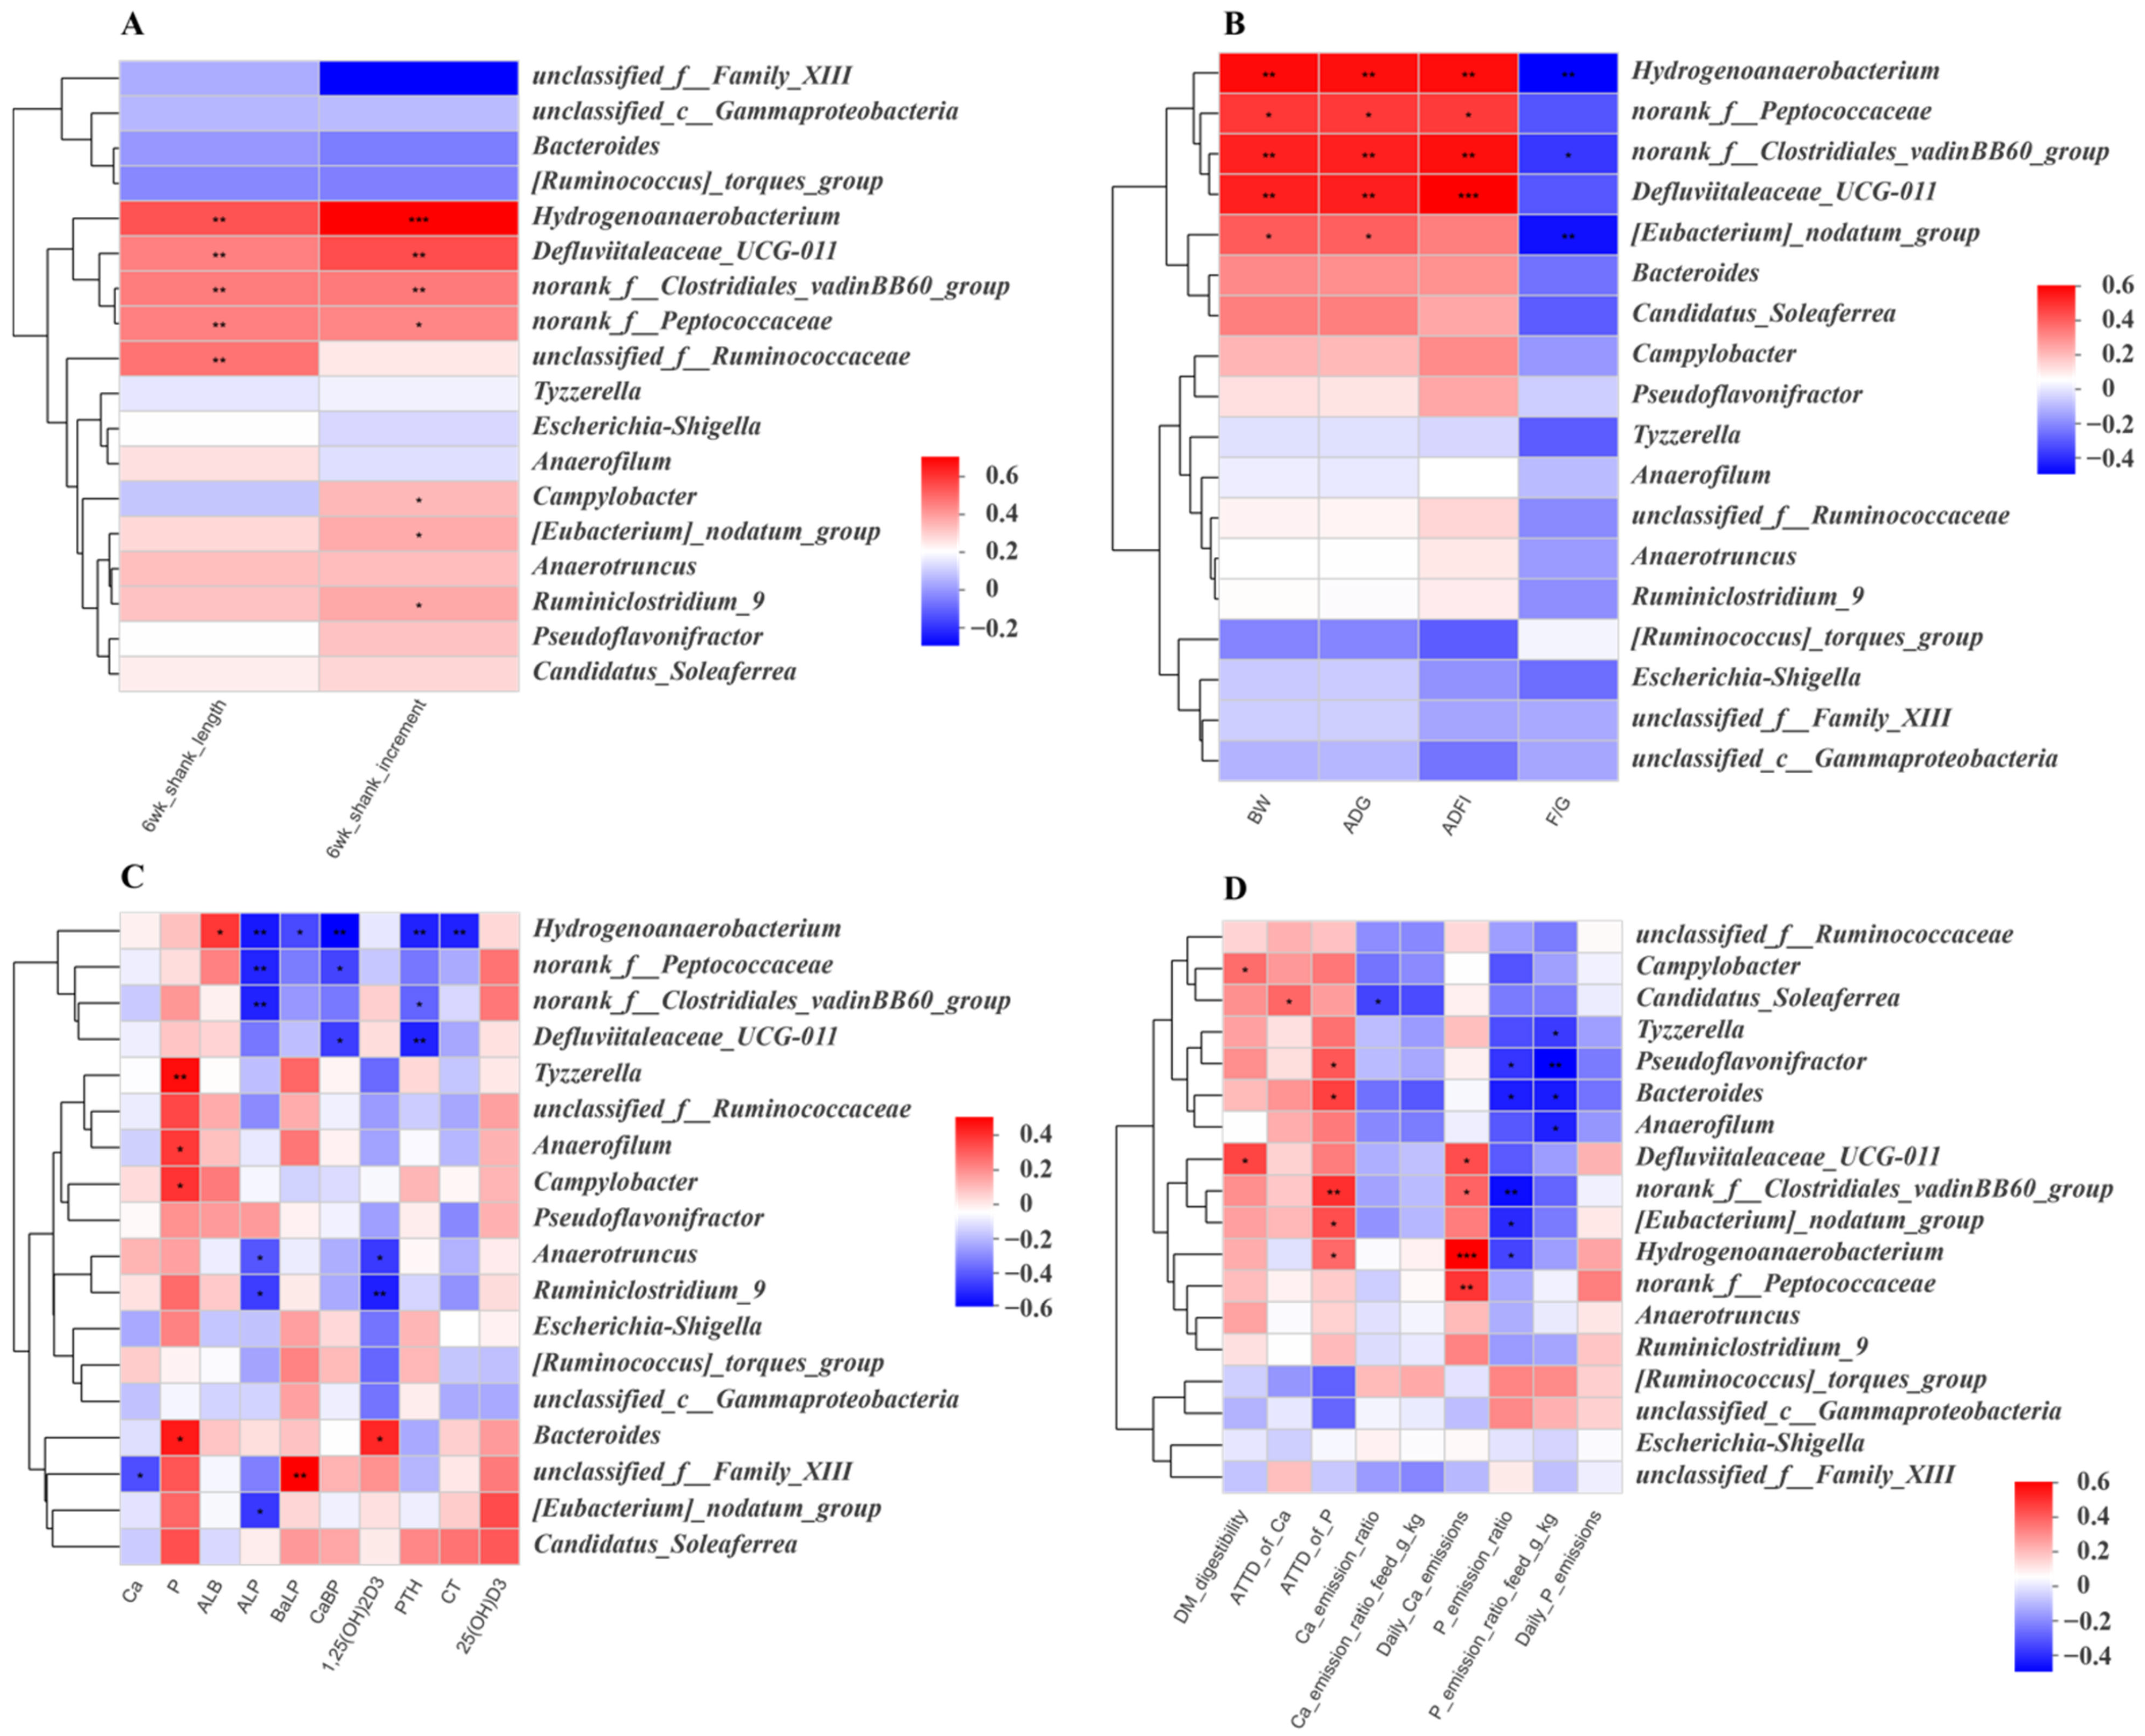
3.5. Correlation Analysis of the Gut Microbiota and Growth Performance and Phosphorus Metabolism Emission

As shown in Figure 6A, Hydrogenoanaerobacterium, Defluviitaleaceae_UCG-011, norank_f__Clostridiales_vadinBB60_group and norank_f__Peptococcaceae were positively correlated with shank length and increment. Unclassified_f__Ruminococcaceae was positively correlated with shank length. In addition, Campylobacter, [Eubacteriucm]_nodatum_group and Ruminiclostridium_9 were positively correlated with shank increment. In Figure 6B, it can be seen that Hydrogenoanaerobacterium, norank_f__Peptococcaceae, norank_f__Clostridiales_vadinBB60_group and Defluviitaleaceae_UCG-011 were positively correlated with BW, ADG and AFDI. Hydrogenoanaerobacterium and norank_f__Clostridiales_vadinBB60_group were negatively correlated with F/G. [Eubacterium]_nodatum_group was positively correlated with BW and ADG and negatively correlated with F/G.
The results of the correlational analysis of the gut microbiota and serum parameters are presented in Figure 6C. Hydrogenoanaerobacterium was positively correlated with ALB and negatively correlated with ALP, BALP, CaBP, PTH and CT. Norank_f__Peptococcaceae and norank_f__Clostridiales_vadinBB60_group were negatively correlated with ALP. Norank_f__Peptococcaceae and Defluviitaleaceae_UCG-011 were negatively correlated with CaBP, meanwhile norank_f__Clostridiales_vadinBB60_group and Defluviitaleaceae_UCG-01 were negatively correlated with PTH. Tyzzerella, Anaerofilum, Campylobacter and Bacteroides were positively correlated with serum phosphorus, and Bacteroides was positively correlated with 1,25(OH)2D3. Anaerotruncus, Ruminiclostridium_9 and [Eubacterium]_nodatum_group were negatively correlated with ALP. Meanwhile, Anaerotruncus and Ruminiclostridium_9 were negatively correlated with 1,25(OH)2D3. In addition, unclassified_f__Family_XIII was negatively correlated with serum Ca and positively correlated with BALP, meanwhile [Eubacterium]_ nodatum_group was negatively correlated with ALP.
As can be seen in Figure 6D, Campylobacter and Defluviitaleaceae_UCG-011 were positively correlated with DM digestibility, and Defluviitaleaceae_UCG-011 was positively correlated with daily Ca emission. Candidatus_Soleaferrea was positively correlated with ATTD of Ca and negatively correlated with Ca emission ratio. Tyzzerella and Anaerofilum were negatively correlated with P emission ratio/feed. Pseudoflavonifractor, Bacteroides, norank_f__Clostridiales_vadinBB60_group, [Eubacterium]_nodatum_group and Hydrogenoanaerobacterium were positively correlated with ATTD of phosphorus and negatively correlated with phosphorus emission ratio. Pseudoflavonifractor and Bacteroides were also negatively correlated with phosphorus emission ratio, while norank_f__Clostridiales_vadinBB60_group, Hydrogenoanaerobacterium and norank_f__Peptococcaceae were positively correlated with daily Ca emission.

4. Discussion

Growth performance and feed intake are essential indicators to evaluate the health status of poultry at an early age, while ADG is a sensitive indicator that reflects the utilization of phosphorus [22,23]. In the current results, the low-phosphorus diets significantly decreased growth performance in hens at 6 weeks of age; however, BW, ADG, ADFI, shank length and shank length increment were increased in the low-phosphorus diet with phytase group, which is in line with previous reports [24,25,26]. Interestingly, we found that the growth performance of the 0.45% NPP group was not influenced by phytase supplementation, which may be due to the 0.45% NPP in this group meeting the requirements for the growth and development of chicks such that additional phytase was not required to hydrolyze phytate. The meta-analysis revealed that the response of digestible phosphorus to the phytase depended on the amount of substrate in growing pigs [27]. Therefore, the current results confirm that phytase supplementation can alleviate the adverse effects of low-phosphorus diets (0.13% NPP) on growth performance, though it had a limited effect on the high-phosphorus group (0.45% NPP).
Serum phosphorus is a sensitive marker by means of which to evaluate homeostatic phosphorus in animals. In the present study, low-phosphorus diets significantly reduced serum phosphorus, and the addition of phytase significantly increased serum phosphorus and decreased ALP activity compared with the low-phosphorus diet group but had no significant effect on the adequate phosphorus treatment group, which is in accord with prior findings [28,29]. Bone phosphorus retention is involved in the skeletal development of the broiler through the regulation of ALP and BALP [30]. Chicks 1 to 42 days old are in the phase of rapid growth with high bone metabolism. ALP is a reliable biomarker for bone mineralization in birds and can reflect the activity of osteoblasts, which are at higher levels in disorders involving bone development or remodeling [31,32]. For intestinal phosphate uptake, 1,25(OH)2D3 is essential [33], increasing blood calcium and inhibiting the secretion of PTH, which is regulated by negative feedback from blood calcium. Low blood calcium levels stimulate PTH secretion, while high blood calcium prevents the release of PTH [34]. In this study, phytase supplementation significantly reduced CaBP, thereby promoting the secretion of 1,25(OH)2D3 while inhibiting the secretion of PTH. Therefore, we document that phytase prevents low-phosphorus diet-induced metabolic disorder via alterations of hormones related to phosphorus metabolism.
The gut microbiome is a complex community that influences the regulation of homeostasis in animals, playing an important role through altering host health, nutritional digestion and immunological function [35,36,37,38]. These data show differences in the composition of microbial communities, with varied influences due to different levels of phosphorus and phytase. In this study, there was no significant change in the alpha index at two weeks of age; however, low-dietary phosphorus diets decreased alpha diversity at six weeks of age. This finding is consistent with a previous study which discovered that as the host matures, the enteric microbial community becomes increasingly varied until it achieves a stable dynamic state [39]. Phosphorus is a vital nutrient for bacterial growth, bacterial structure and metabolic functions [40]. A study on pigs indicated that phosphorus might be regarded as part of an integrated approach to support immune functions and maintain a stable microbial environment, thereby providing a barrier against potential pathogenesis [2]. Furthermore, the production of fibrolytic enzymes by bacteria is highly dependent on an adequate phosphorus supply [41,42]. Therefore, these results confirm the importance of phosphorus for gut microbes; low-phosphorus diets reduce the diversity of intestinal microbial communities.
During the rearing phase, the gut microbiota was dominated by two phyla, Firmicutes and Proteobacteria [43]. Of note, the Firmicutes/Bacteroidetes ratio has been identified as a major predictor of intestinal homeostasis [44], with an increased or decreased Firmicutes/Bacteroidetes ratio indicating dysbiosis [45]. The F/B ratio decreased in the 0.45% NPP + P group in this study, which suggests that supplementation with phytase in the high-phosphorus group may also have adverse effects on gut microbiota. In addition, phosphorus deficiency caused a decrease in short chain fatty acid (SCFA) production as a result of reduced cellulose fermentation, demonstrating that the activity of bacterial fibrolytic enzymes is controlled by phosphorus [42,46]. SCFAs affect lipid and cholesterol metabolism, contributing to intestinal development in the whole growing period of broilers [47,48]. Collectively, low-phosphorus diets decreased chick growth performance in the brooding stage, which may be related to the production of SCFAs.
Numerous studies have proved that supplementation with phytase can effectively reduce fecal phosphorus emission [49,50,51]. Our results show that proper reduction of dietary phosphorus and supplementation with phytase can improve phosphorus utilization and reduce phosphorus emissions. It has been reported that high-phosphorus use efficiency cows fed low-phosphorus diets routed more endogenous phosphorus into milk and excrement., which may harm animal health and the environment in the long term [52]. Remarkably, we noticed that Tyzzerella, Anaerofilum, Pseudoflavonifractor, Bacteroides, norank_f__Clostridiales_vadinBB60_group, Hydrogenoanaerobacterium and [Eubacterium]_nodatum_group were significantly correlated with phosphorus utilization- and emission-related parameters. Bacteroides is beneficial in the intestinal health of poultry because of its essential role in growth performance and its fermentation products’ suppression of Clostridium perfringens sporulation [53]. In Japanese quail, based on host miRNA–mRNA and gut microbial interaction, Bacteroides played a vital role in phosphorus utilization [54]. Interestingly, a study has revealed that Clostridiales vadinBB60 group was enriched in participants who did not take vitamin D supplements after UVB exposures [55]. Combined with these results, Bacteroides and norank_f__Clostridiales_vadinBB60_group may be the key indicators of phosphorus utilization. However, since a regulation mechanism for intestinal microorganisms on phosphorus emission is not clear, further studies investigating the function of related microbiota in phosphorus utilization are required.

5. Conclusions

Low-phosphorus diets affected growth performance, bone development and phosphorus metabolism and altered the diversity and structure of the intestinal flora in egg-laying chicks. A combination of low-phosphorus feeding and supplementation with phytase will optimize growth performance and bone development, decrease phosphorus emission and reduce dependency on mineral phosphorus by enhancing the utilization of phytate phosphorus. These results provide new insights into phytase-induced alterations in growth performance, bone development, phosphorus metabolism and gut microbiota.

Supplementary Materials

The following are available online at https://www.mdpi.com/article/10.3390/ani12070940/s1, Figure S1: Regression equation between different levels of dietary phosphorus and growth performance and bone development with or without phytase in layers, Figure S2: Effects of different levels of dietary phosphorus with phytase on serum biochemical indexes of layers at 2 weeks of age, Figure S3: Effects of different levels of dietary phosphorus with phytase on the alpha diversity of layers, Table S1: Effects of interaction between different levels of phosphorus and phytase on the growth performance of chicks during the brooding period, Table S2: Effects of interaction between different levels of phosphorus and phytase on shank length and shank increment in chicks during the brooding period, Table S3: Effects of interaction between different levels of phosphorus and phytase on serum indexes of chicks at 2 weeks of age, Table S4: Effects of interaction between different levels of phosphorus and phytase on serum indexes of chicks at the end of 6 weeks of age, Table S5: Effects of interaction between different levels of phosphorus and phytase on apparent total digestibility and emission of Ca and P in chicks during the brooding period.

Author Contributions

Conceptualization, Q.M. and J.Z. (Jianyun Zhang); methodology, X.Z. and L.L.; investigation, L.L., X.Z., J.Z. (Jiatu Zhang) and M.L.; data analysis, L.L., S.H. and X.Z.; writing—original draft preparation, L.L.; writing—review and editing, L.Z., S.H., Q.M. and C.J.; project administration, Q.M.; funding acquisition Q.M. All authors have read and agreed to the published version of the manuscript.

Funding

This study was supported by the National Key Research and Development Programs of China (2021YFD1300405). A Special Fund from the China Agricultural Research System program (CARS-40-K08) provided funding for the design of the study, the collection and analysis of samples and the writing of the manuscript. Deutsche For schungsgemeinschaft (DFG, German Research Foundation, 328017493/GRK 2366) provided funding for a fellowship.

Institutional Review Board Statement

All animal protocols used in this study were approved by the institutional Animal Care and Use Committee of China Agricultural University (Beijing, China) (NO. AW13301202–1-14).

Informed Consent Statement

Not applicable.

Data Availability Statement

The data presented in this study are available on request from the corresponding author.

Conflicts of Interest

The authors declare no conflict of interest.

References

  1. Soetan, K.O.; Olaiya, C.O.; Oyewole, O.E. The importance of mineral elements for humans, domestic animals and plants: A review. Afr. J. Food Sci. 2010, 4, 200–222. [Google Scholar]
  2. Heyer, C.M.; Weiss, E.; Schmucker, S.; Rodehutscord, M.; Hoelzle, L.E.; Mosenthin, R.; Stefanski, V. The impact of phosphorus on the immune system and the intestinal microbiota with special focus on the pig. Nutr. Res. Rev. 2015, 28, 67–82. [Google Scholar] [CrossRef] [PubMed] [Green Version]
  3. Cordell, D.; Drangert, J.-O.; White, S. The story of phosphorus: Global food security and food for thought. Glob. Environ. Chang. 2009, 19, 292–305. [Google Scholar] [CrossRef]
  4. Qiugang, M.A.; Rodehutscord, M.; Novotny, M.; Lan, L.I.; Yang, L. Phytate and phosphorus utilization by broiler chickens and laying hens fed maize-based diets. Front. Agric. Sci. Eng. 2019, 6, 380–387. [Google Scholar]
  5. Gong, H.; Meng, F.; Wang, G.; Hartmann, T.E.; Feng, G.; Wu, J.; Jiao, X.; Zhang, F. Toward the sustainable use of mineral phosphorus fertilizers for crop production in China: From primary resource demand to final agricultural use. Sci. Total Environ. 2022, 804, 150183. [Google Scholar] [CrossRef]
  6. Azam, H.M.; Alam, S.T.; Hasan, M.; Yameogo, D.D.S.; Kannan, A.D.; Rahman, A.; Kwon, M.J. Phosphorous in the environment: Characteristics with distribution and effects, removal mechanisms, treatment technologies, and factors affecting recovery as minerals in natural and engineered systems. Environ. Sci. Pollut. Res. Int. 2019, 26, 20183–20207. [Google Scholar] [CrossRef]
  7. Kundu, S.; Coumar, V.M.; Rajendiran, S.; Ajay, R.; Subba, A. Phosphates from detergents and eutrophication of surface water ecosystem in India. Curr. Sci. 2015, 108, 1320–1325. [Google Scholar]
  8. Düngelhoef, M.; Rodehutscord, M.; Spiekers, H.; Pfeffer, E. Effects of supplemental microbial phytase on availability of phosphorus contained in maize, wheat and triticale to pigs. Anim. Feed Sci. Technol. 1994, 49, 1–10. [Google Scholar] [CrossRef]
  9. Singh, P.K. Significance of phytic acid and supplemental phytase in chicken nutrition: A review. Worlds Poult. Sci. J. 2008, 64, 553–580. [Google Scholar] [CrossRef]
  10. Lei, X.G.; Weaver, J.D.; Mullaney, E.; Ullah, A.H.; Azain, M.J. Phytase, a new life for an “old” enzyme. Annu. Rev. Anim. Biosci. 2013, 1, 283–309. [Google Scholar] [CrossRef] [Green Version]
  11. Yu, B.; Jan, Y.C.; Chung, T.K.; Lee, T.T.; Chiou, P.W.S. Exogenous phytase activity in the gastrointestinal tract of broiler chickens. Anim. Feed Sci. Technol. 2004, 117, 295–303. [Google Scholar] [CrossRef]
  12. Ravindran, V. Feed enzymes: The science, practice, and metabolic realities. J. Appl. Poult. Res. 2013, 22, 628–636. [Google Scholar] [CrossRef]
  13. Selle, P.H.; Ravindran, V. Microbial phytase in poultry nutrition. Anim. Feed Sci. Technol. 2007, 135, 1–41. [Google Scholar] [CrossRef]
  14. Rowland, I.; Gibson, G.; Heinken, A.; Scott, K.; Swann, J.; Thiele, I.; Tuohy, K. Gut microbiota functions: Metabolism of nutrients and other food components. Eur. J. Nutr. 2018, 57, 1–24. [Google Scholar] [CrossRef] [Green Version]
  15. Fuhren, J.; Schwalbe, M.; Boekhorst, J.; Rösch, C.; Schols, H.A.; Kleerebezem, M. Dietary calcium phosphate strongly impacts gut microbiome changes elicited by inulin and galacto-oligosaccharides consumption. Microbiome 2021, 9, 218. [Google Scholar] [CrossRef]
  16. Ptak, A.; Bedford, M.R.; Świątkiewicz, S.; Żyła, K.; Józefiak, D. Phytase modulates ileal microbiota and enhances growth performance of the broiler chickens. PLoS ONE 2015, 10, e0119770. [Google Scholar] [CrossRef] [Green Version]
  17. Guo, Y.; Huang, S.; Zhao, L.; Zhang, J.; Ji, C.; Ma, Q. Pine (Pinus massoniana Lamb.) needle extract supplementation improves performance, egg quality, serum parameters, and the gut microbiome in laying hens. Front. Nutr. 2022, 9, 810462. [Google Scholar] [CrossRef]
  18. Sales, J.; Janssens, G. Acid-insoluble ash as a marker in digestibility studies: A review. J. Anim. Feed Sci. 2003, 12, 383–401. [Google Scholar] [CrossRef]
  19. Spowart, P.R.; Michael, G.; Easom, J.A.; Fritzler, L.D.; Lust, D.G.; Samuelson, K.L. PSI-13 Evaluation of acid insoluble ash as a digestibility marker in feedlot diets containing corn-milling byproducts. J. Anim. Sci. 2020, 98 (Suppl. 4), 273. [Google Scholar] [CrossRef]
  20. Geng, S.; Huang, S.; Ma, Q.; Li, F.; Gao, Y.; Zhao, L.; Zhang, J. Alterations and correlations of the gut microbiome, performance, egg quality, and serum biochemical indexes in laying hens with low-protein amino acid-deficient diets. ACS Omega 2021, 6, 13094–13104. [Google Scholar] [CrossRef]
  21. Ma, M.; Geng, S.; Liu, M.; Zhao, L.; Zhang, J.; Huang, S.; Ma, Q. Effects of different methionine levels in low protein diets on production performance, reproductive system, metabolism, and gut microbiota in laying hens. Front. Nutr. 2021, 8, 739676. [Google Scholar] [CrossRef]
  22. Elkin, R.G. A review of duck nutrition research. World’s Poult. Sci. J. 1987, 43, 84–106. [Google Scholar] [CrossRef]
  23. Lei, X.; Ku, P.; Miller, E.; Yokoyama, M. Supplementing corn-soybean meal diets with microbial phytase linearly improves phytate phosphorus utilization by weanling pigs. J. Anim. Sci. 1993, 71, 3359–3367. [Google Scholar] [CrossRef]
  24. Perney, K.M.; Cantor, A.H.; Straw, M.L.; Herkelman, K.L. The effect of dietary phytase on growth performance and phosphorus utilization of broiler chicks. Poult. Sci. 1993, 72, 2106–2114. [Google Scholar] [CrossRef]
  25. Ravindran, V.; Cowieson, A.J.; Selle, P.H. Influence of dietary electrolyte balance and microbial phytase on growth performance, nutrient utilization, and excreta quality of broiler chickens. Poult. Sci. 2008, 87, 677–688. [Google Scholar] [CrossRef]
  26. Li, L.; Zhang, X.; Zhao, L.; Zhang, J.; Ji, C.; Ma, Q. Phosphorus restriction in brooding stage has continuous effects on growth performance and early laying performance of layers. Animals 2021, 11, 3546. [Google Scholar] [CrossRef]
  27. Létourneau-Montminy, M.P.; Jondreville, C.; Sauvant, D.; Narcy, A. Meta-analysis of phosphorus utilization by growing pigs: Effect of dietary phosphorus, calcium and exogenous phytase. Animal 2012, 6, 1590–1600. [Google Scholar] [CrossRef]
  28. Farhadi, D.; Karimi, A.; Sadeghi, G.; Rostamzadeh, J.; Bedford, M.R. Effects of a high dose of microbial phytase and myo-inositol supplementation on growth performance, tibia mineralization, nutrient digestibility, litter moisture content, and foot problems in broiler chickens fed phosphorus-deficient diets. Poult. Sci. 2017, 96, 3664–3675. [Google Scholar] [CrossRef]
  29. Jiang, X.R.; Luo, F.H.; Qu, M.R.; Valentino, B. Effects of non-phytate phosphorus levels and phytase sources on growth performance, serum biochemical and tibia parameters of broiler chickens. Ital. J. Anim. Sci. 2013, 12, e60. [Google Scholar] [CrossRef]
  30. Shao, Y.; Sun, G.; Cao, S.; Lu, L.; Zhang, L.; Liao, X.; Luo, X. Bone phosphorus retention and bone development of broilers at different ages. Poult. Sci. 2019, 98, 2114–2121. [Google Scholar] [CrossRef] [PubMed]
  31. Brenes, A.; Viveros, A.; Arija, I.; Centeno, C.; Pizarro, M.; Bravo, C. The effect of citric acid and microbial phytase on mineral utilization in broiler chicks. Anim. Feed Sci. Technol. 2003, 110, 201–219. [Google Scholar] [CrossRef] [Green Version]
  32. Tilgar, V.; Kilgas, P.; Viitak, A.; Reynolds, S.J. The rate of bone mineralization in birds is directly related to alkaline phosphatase activity. Physiol. Biochem. Zool. 2008, 81, 106–111. [Google Scholar] [CrossRef] [PubMed]
  33. Shao, P.; Ohtsuka-Isoya, M.; Shinoda, H. Circadian rhythms in serum bone markers and their relation to the effect of etidronate in rats. Chronobiol. Int. 2003, 20, 325–336. [Google Scholar] [CrossRef] [PubMed]
  34. Calvo, M.S.; Kumar, R.; Heath, H. Persistently elevated parathyroid hormone secretion and action in young women after four weeks of ingesting high phosphorus, low calcium diets. J. Clin. Endocrinol. Metab. 1990, 70, 1334–1340. [Google Scholar] [CrossRef]
  35. Krajmalnik-Brown, R.; Ilhan, Z.E.; Kang, D.W.; Dibaise, J.K. Effects of gut microbes on nutrient absorption and energy regulation. Nutr. Clin. Pract. Off. Publ. Am. Soc. Parenter. Enter. Nutr. 2015, 27, 201–214. [Google Scholar] [CrossRef] [Green Version]
  36. Valdes, A.M.; Walter, J.; Segal, E.; Spector, T.D. Re: Role of the gut microbiota in nutrition and health. BMJ 2018, 361, 17–22. [Google Scholar]
  37. Yoo, J.Y.; Groer, M.; Dutra, S.V.O.; Sarkar, A.; McSkimming, D.I. Gut microbiota and immune system interactions. Microorganisms 2020, 8, 1587. [Google Scholar] [CrossRef]
  38. Wu, H.J.; Wu, E. The role of gut microbiota in immune homeostasis and autoimmunity. Gut Microbes 2012, 3, 4–14. [Google Scholar] [CrossRef] [Green Version]
  39. Pan, D.; Yu, Z. Intestinal microbiome of poultry and its interaction with host and diet. Gut Microbes 2014, 5, 108–119. [Google Scholar] [CrossRef]
  40. Wood, H.G.; Clark, J.E. Biological aspects of inorganic polyphosphates. Annu. Rev. Biochem. 1988, 57, 235–260. [Google Scholar] [CrossRef]
  41. Francis, G.L.; Gawthorne, J.M.; Storer, G.B. Factors affecting the activity of cellulases isolated from the rumen digesta of sheep. Appl. Environ. Microbiol. 1978, 36, 643–649. [Google Scholar] [CrossRef] [Green Version]
  42. Montagne, L.; Pluske, J.R.; Hampson, D.J. A review of interactions between dietary fibre and the intestinal mucosa, and their consequences on digestive health in young non-ruminant animals. Anim. Feed Sci. Technol. 2003, 108, 95–117. [Google Scholar] [CrossRef]
  43. Joat, N.; Van, T.T.H.; Stanley, D.; Moore, R.J.; Chousalkar, K. Temporal dynamics of gut microbiota in caged laying hens: A field observation from hatching to end of lay. Appl. Microbiol. Biotechnol. 2021, 105, 4719–4730. [Google Scholar] [CrossRef]
  44. Li, W.; Ma, Z.S. FBA Ecological guild: Trio of firmicutes-bacteroidetes alliance against actinobacteria in human oral microbiome. Sci. Rep. 2020, 10, 287. [Google Scholar] [CrossRef] [Green Version]
  45. Stojanov, S.; Berlec, A.; Štrukelj, B. The influence of probiotics on the firmicutes/bacteroidetes ratio in the treatment of obesity and inflammatory bowel disease. Microorganisms 2020, 8, 1715. [Google Scholar] [CrossRef]
  46. Fan, Y.; Pedersen, O. Gut microbiota in human metabolic health and disease. Nat. Rev. Microbiol. 2021, 19, 55–71. [Google Scholar] [CrossRef]
  47. Liao, X.; Shao, Y.; Sun, G.; Yang, Y.; Zhang, L.; Guo, Y.; Luo, X.; Lu, L. The relationship among gut microbiota, short-chain fatty acids, and intestinal morphology of growing and healthy broilers. Poult. Sci. 2020, 99, 5883–5895. [Google Scholar] [CrossRef]
  48. Den Besten, G.; Van Eunen, K.; Groen, A.K.; Venema, K.; Reijngoud, D.-J.; Bakker, B.M. The role of short-chain fatty acids in the interplay between diet, gut microbiota, and host energy metabolism. J. Lipid Res. 2013, 54, 2325–2340. [Google Scholar] [CrossRef] [Green Version]
  49. Emiola, A.; Akinremi, O.; Slominski, B.; Nyachoti, C.M. Nutrient utilization and manure P excretion in growing pigs fed corn-barley-soybean based diets supplemented with microbial phytase. Anim. Sci. J. 2009, 80, 19–26. [Google Scholar] [CrossRef]
  50. Plumstead, P.W.; Romero-Sanchez, H.; Maguire, R.O.; Gernat, A.G.; Brake, J. Effects of phosphorus level and phytase in broiler breeder rearing and laying diets on live performance and phosphorus excretion. Poult. Sci. 2007, 86, 225–231. [Google Scholar] [CrossRef]
  51. Yitbarek, A.; López, S.; Tenuta, M.; Asgedom, H.; France, J.; Nyachoti, C.M.; Kebreab, E. Effect of dietary phytase supplementation on greenhouse gas emissions from soil after swine manure application. J. Clean. Prod. 2017, 166, 1122–1130. [Google Scholar] [CrossRef]
  52. Müller, C.B.M.; Kuhla, B. Holstein dairy cows with high phosphorus utilization efficiency fed a low phosphorous diet secreted less phosphorus with urine but more with milk and feces. Sci. Total Environ. 2021, 788, 147813. [Google Scholar] [CrossRef]
  53. Chang, C.L.; Chung, C.Y.; Kuo, C.H.; Kuo, T.F.; Yang, C.W.; Yang, W.C. Beneficial effect of bidens pilosa on body weight gain, food conversion ratio, gut bacteria and coccidiosis in chickens. PLoS ONE 2016, 11, e0146141. [Google Scholar] [CrossRef]
  54. Ponsuksili, S.; Reyer, H.; Hadlich, F.; Weber, F.; Trakooljul, N.; Oster, M.; Siengdee, P.; Muráni, E.; Rodehutscord, M.; Camarinha-Silva, A.; et al. Identification of the key molecular drivers of phosphorus utilization based on host miRNA-mRNA and gut microbiome interactions. Int J. Mol. Sci 2020, 21, 2818. [Google Scholar] [CrossRef]
  55. Bosman, E.S.; Albert, A.Y.; Lui, H.; Dutz, J.P.; Vallance, B.A. Skin exposure to narrow band ultraviolet (UVB) light modulates the human intestinal microbiome. Front. Microbiol. 2019, 10, 2410. [Google Scholar] [CrossRef]
Figure 1. Effects of different levels of dietary phosphorus with phytase on growth performance and bone development of layers at 2 and 6 weeks of age. (A) BW. (B) ADG. (C) ADFI. (D) F/G. BW = body weight; ADG = average daily gain; ADFI = average daily feed intake; F/G = the ratio of feed to gain. (E) Shank length at 2 weeks of age. (F) Shank increment at 2 weeks of age. (G) Shank length at 6 weeks of age. (H) Shank increment at 6 weeks of age. Data are shown as means ± SEM. * p < 0.05, ** p < 0.01, *** p < 0.001. n = 6 per group.
Animals 12 00940 g001
Figure 2. Effects of different levels of dietary phosphorus with phytase on the serum biochemical indexes of layers at 6 weeks of age. (A) Serum Ca. (B) Serum phosphorus. (C) ALB. (D) ALP. (E) BALP. (F) CaBP. (G) 1,25(OH)2D3. (H) PTH. (I) CT. (J) 25(OH)D3. Data are shown as means ± SEM. * p < 0.05, ** p < 0.01, *** p < 0.001. n = 6 per group.
Animals 12 00940 g002
Figure 3. Effects of different levels of dietary phosphorus and phytase on apparent total tract digestibility (ATTD) and emission of Ca and phosphorus in layers. (A) DM digestibility. (B) ATTD of Ca. (C) ATTD of phosphorus. (D) Ca emission. (E) Ca emission/feed. (F) Daily Ca emission. (G) Phosphorus emission. (H) Phosphorus emission/feed. (I) Daily Ca emission. Data are shown as means ± SEM. * p < 0.05, ** p < 0.01, *** p < 0.001. n = 6 per group.
Animals 12 00940 g003
Figure 4. Effects of different levels of dietary phosphorus with phytase on relative abundance levels in the cecal microbiota of layers and principal coordinates analysis (PCoA, Bray–Curtis distance) plot of the gut microbial community structure. (A) The PCoA for the six treatments at 2 and 6 weeks of age. (B) The PCoA for the six treatments at 2 weeks of age. (C) The PCoA at different dietary phosphorus levels at 2 weeks of age. (D) The PCoA at different dietary phosphorus levels with phytase at 2 weeks of age. (E) The PCoA for the six treatments at 6 weeks of age. (F) The PCoA for the different dietary phosphorus levels at 6 weeks of age. (G) The PCoA for the different dietary phosphorus levels with phytase at 6 weeks of age. (H) Relative abundance of gut microbiota at the phylum level. (I) Relative abundance of gut microbiota at the genus level. n = 6 per group.
Animals 12 00940 g004
Figure 5. Differentially abundant genera in the gut microbiota of layers fed different levels of dietary phosphorus with phytase. (A) The LEfSe analysis of the gut microbiota at different dietary phosphorus levels at 2 weeks of age. (B) The LEfSe analysis of the gut microbiota at different dietary phosphorus levels with phytase at 2 weeks of age. (C) The LEfSe analysis of the gut microbiota at different dietary phosphorus levels at 6 weeks of age. (D) The LEfSe analysis of the gut microbiota at different dietary phosphorus levels with phytase at 6 weeks of age.
Animals 12 00940 g005
Figure 6. Spearman correlation analysis of the differentially abundant genera and shank growth (A), growth performance (B), serum index related to phosphorus metabolism (C) and Ca and phosphorus emission-related index (D). * p < 0.05, ** p < 0.01, *** p < 0.001. n = 6 per group.
Animals 12 00940 g006
Table 1. Composition and nutrient levels of experimental diets (%, air-drying basis).
ItemsTreatment Groups
0.13% NPP0.29% NPP0.45% NPP
Ingredients
Corn65.20 65.20 65.20
Soybean meal29.40 29.40 29.40
Dicalcium phosphate0.00 0.95 1.90
Limestone2.35 1.82 1.30
Zeolite powder2.01 1.59 1.16
Salt0.30 0.30 0.30
Choline chloride (50%)0.10 0.10 0.10
L-Lysine HCl (98%)0.11 0.11 0.11
DL-methionine0.19 0.19 0.19
Premix 10.34 0.34 0.34
Total100.00 100.00 100.00
Nutrient levels 2
Metabolizable energy (MJ/kg)11.72 11.72 11.72
Crude protein18.00 18.00 18.00
Available methionine0.45 0.45 0.45
Available methionine and cystine0.74 0.74 0.74
Available Lysine1.00 1.00 1.00
Available Tryptophan0.20 0.20 0.20
Available Threonine0.68 0.68 0.68
Calcium0.980.96 1.02
Total phosphorus0.42 0.51 0.67
Non-phytate phosphorus0.13 0.29 0.45
Phytate phosphorus0.290.220.22
1 Provided per kilogram of diet: vitamin A, 8000 IU; vitamin D3, 3 600 IU; vitamin E, 21 IU; vitamin K3, 4.2 mg; vitamin B1, 3 mg; vitamin B2, 10.2 mg; folic acid, 0.9 mg; pantothenic acid, 15 mg; niacin, 45 mg; vitamin B6, 5.4 mg; vitamin B12, 24 μg; biotin, 0.15 mg; copper, 6.8 mg; iron, 66 mg; zinc, 83 mg; manganese, 80 mg; iodine, 1 mg; Se 0.3 mg. 2 All nutrient levels were calculated, except calcium and total phosphorus were measured values.
Publisher’s Note: MDPI stays neutral with regard to jurisdictional claims in published maps and institutional affiliations.

