Phenotypic Characterization of Encephalitis and Immune Response in the Brains of Lambs Experimentally Infected with Spanish Goat Encephalitis Virus

 ,
,
Abstract
:Simple Summary
Abstract
1. Introduction
2. Materials and Methods
2.1. Animals and Sampling
2.2. Immunohistochemistry
2.3. Evaluation and Quantitation
2.4. Statistical Analysis
2.5. Ethics Approval
3. Results
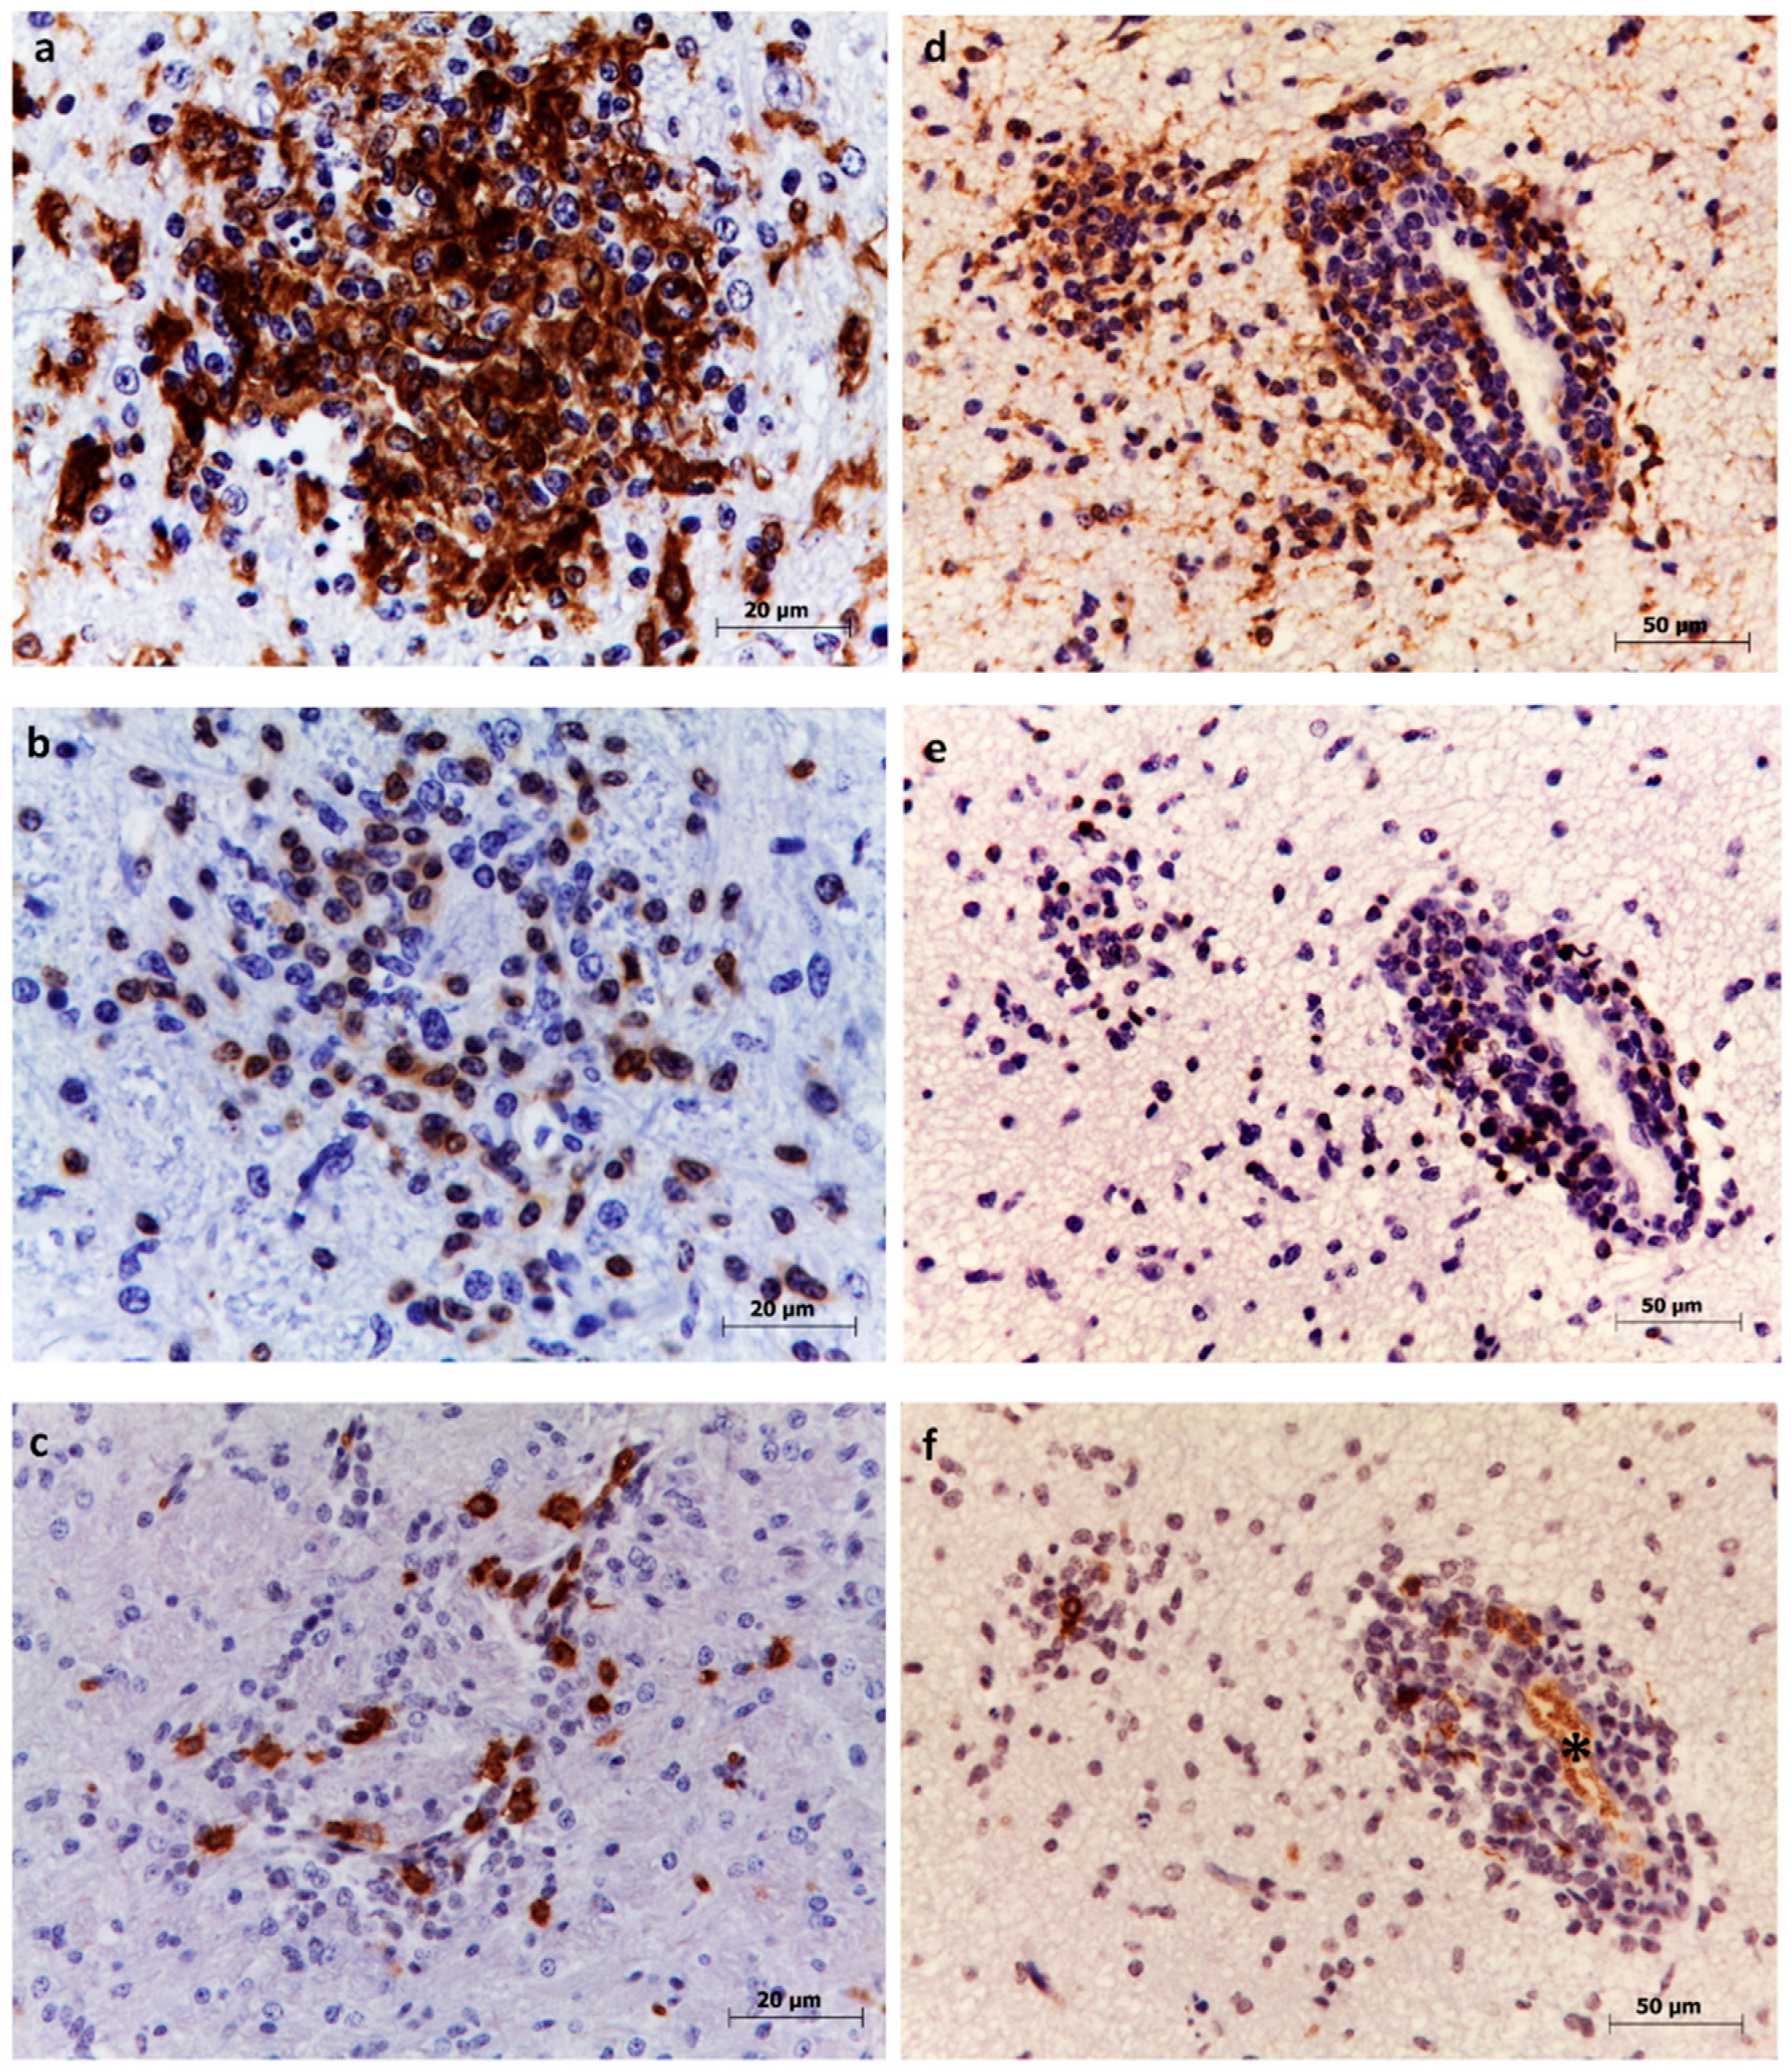
3.1. Microglia
3.2. T lymphocytes
3.3. B lymphocytes
3.4. Proportions of Microglia, T lymphocyte,s and B Lymphocytes According to Lesion Location and Severity
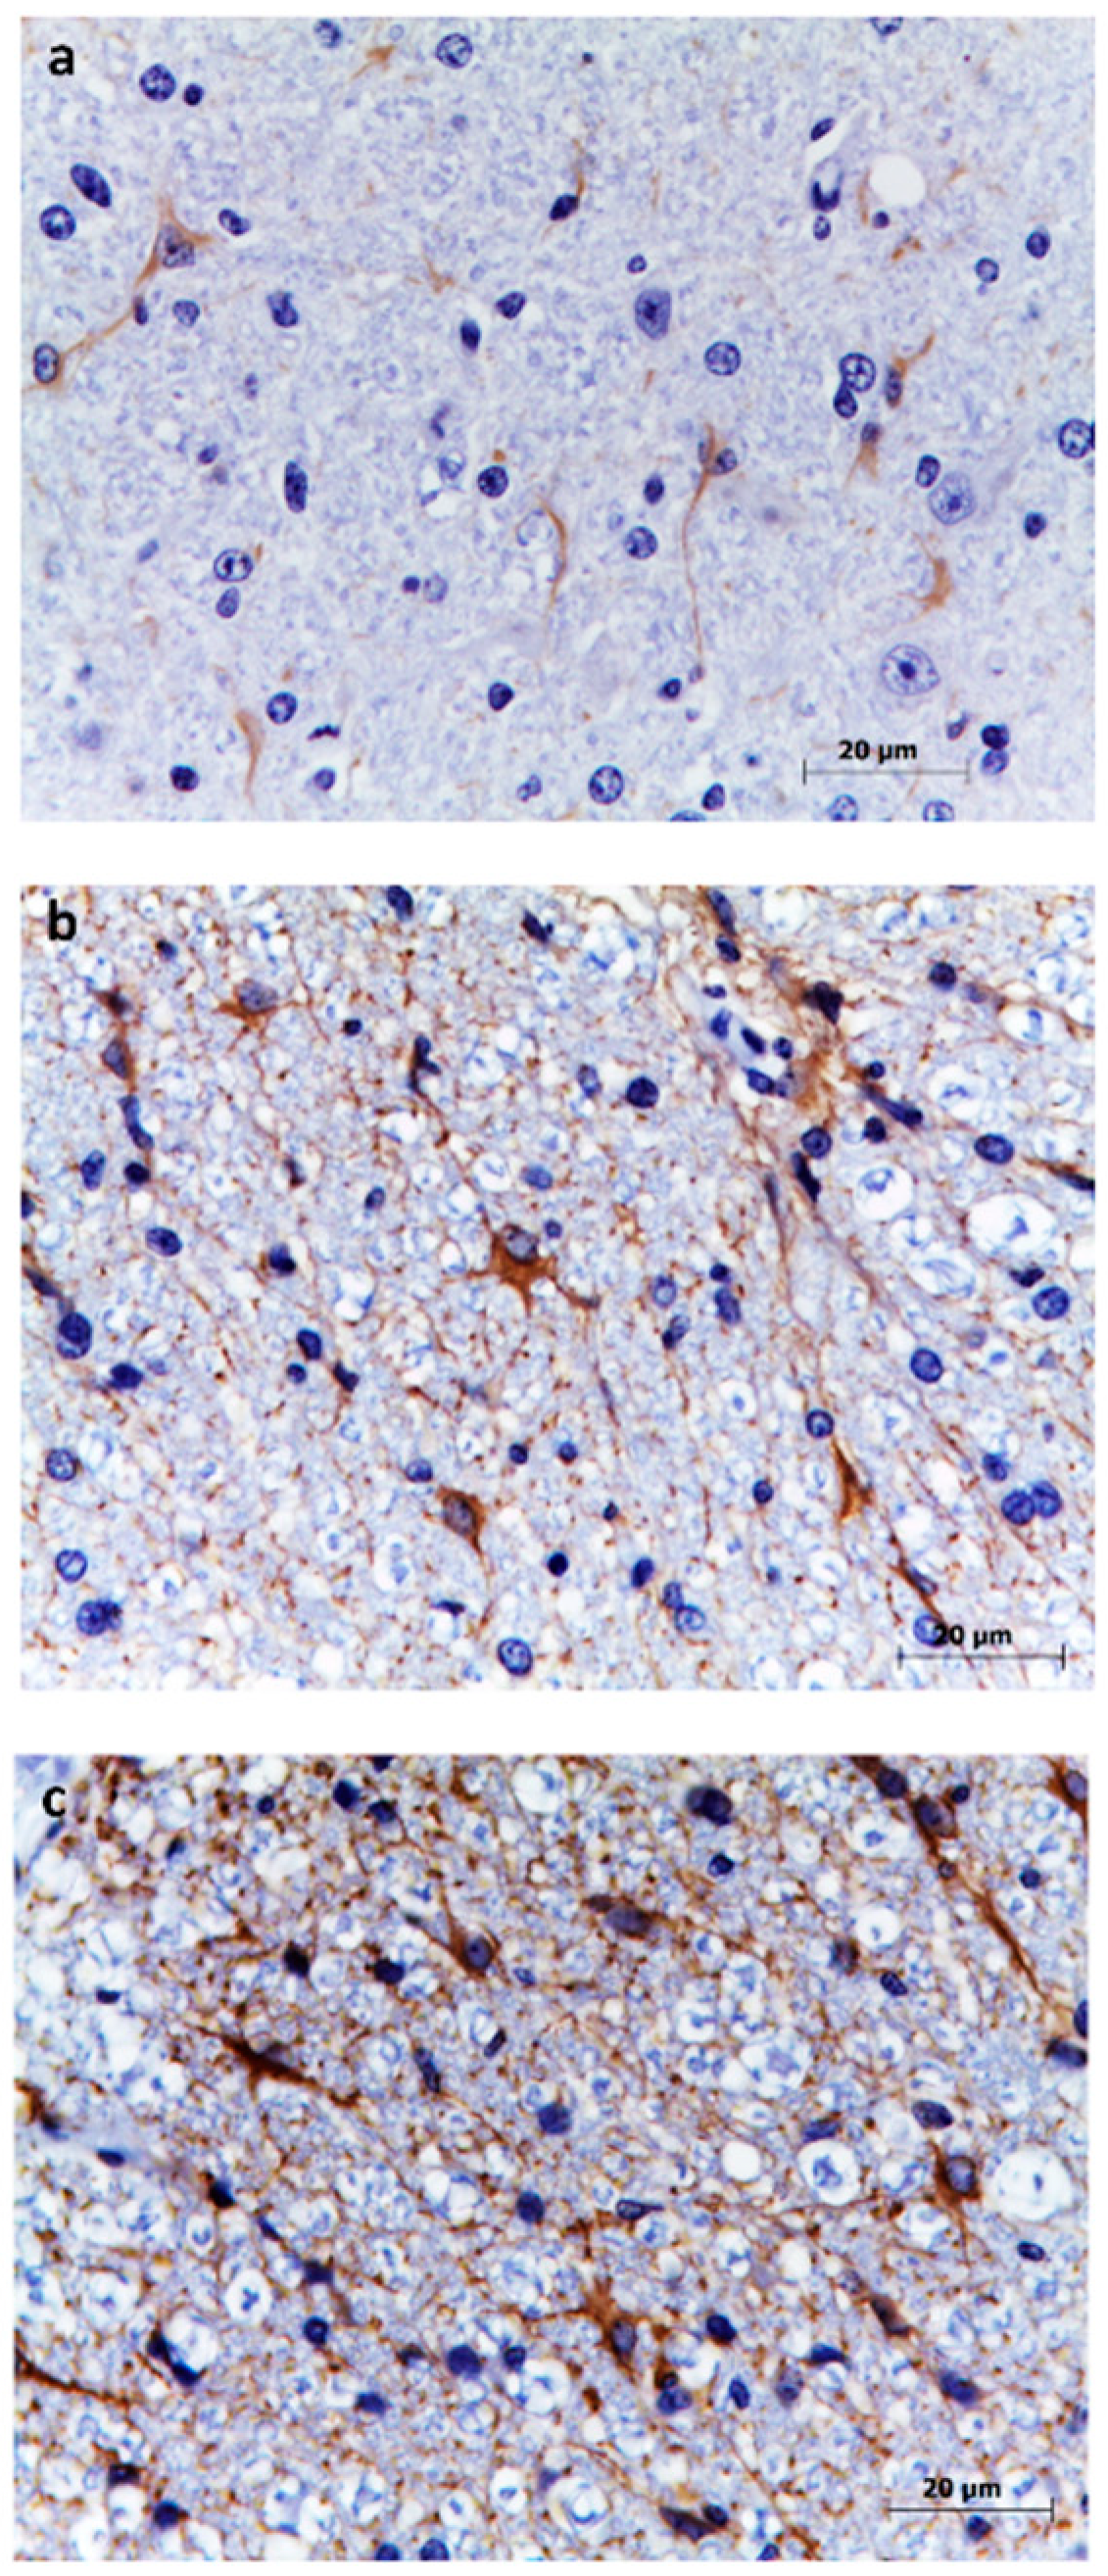
3.5. Astrocytes
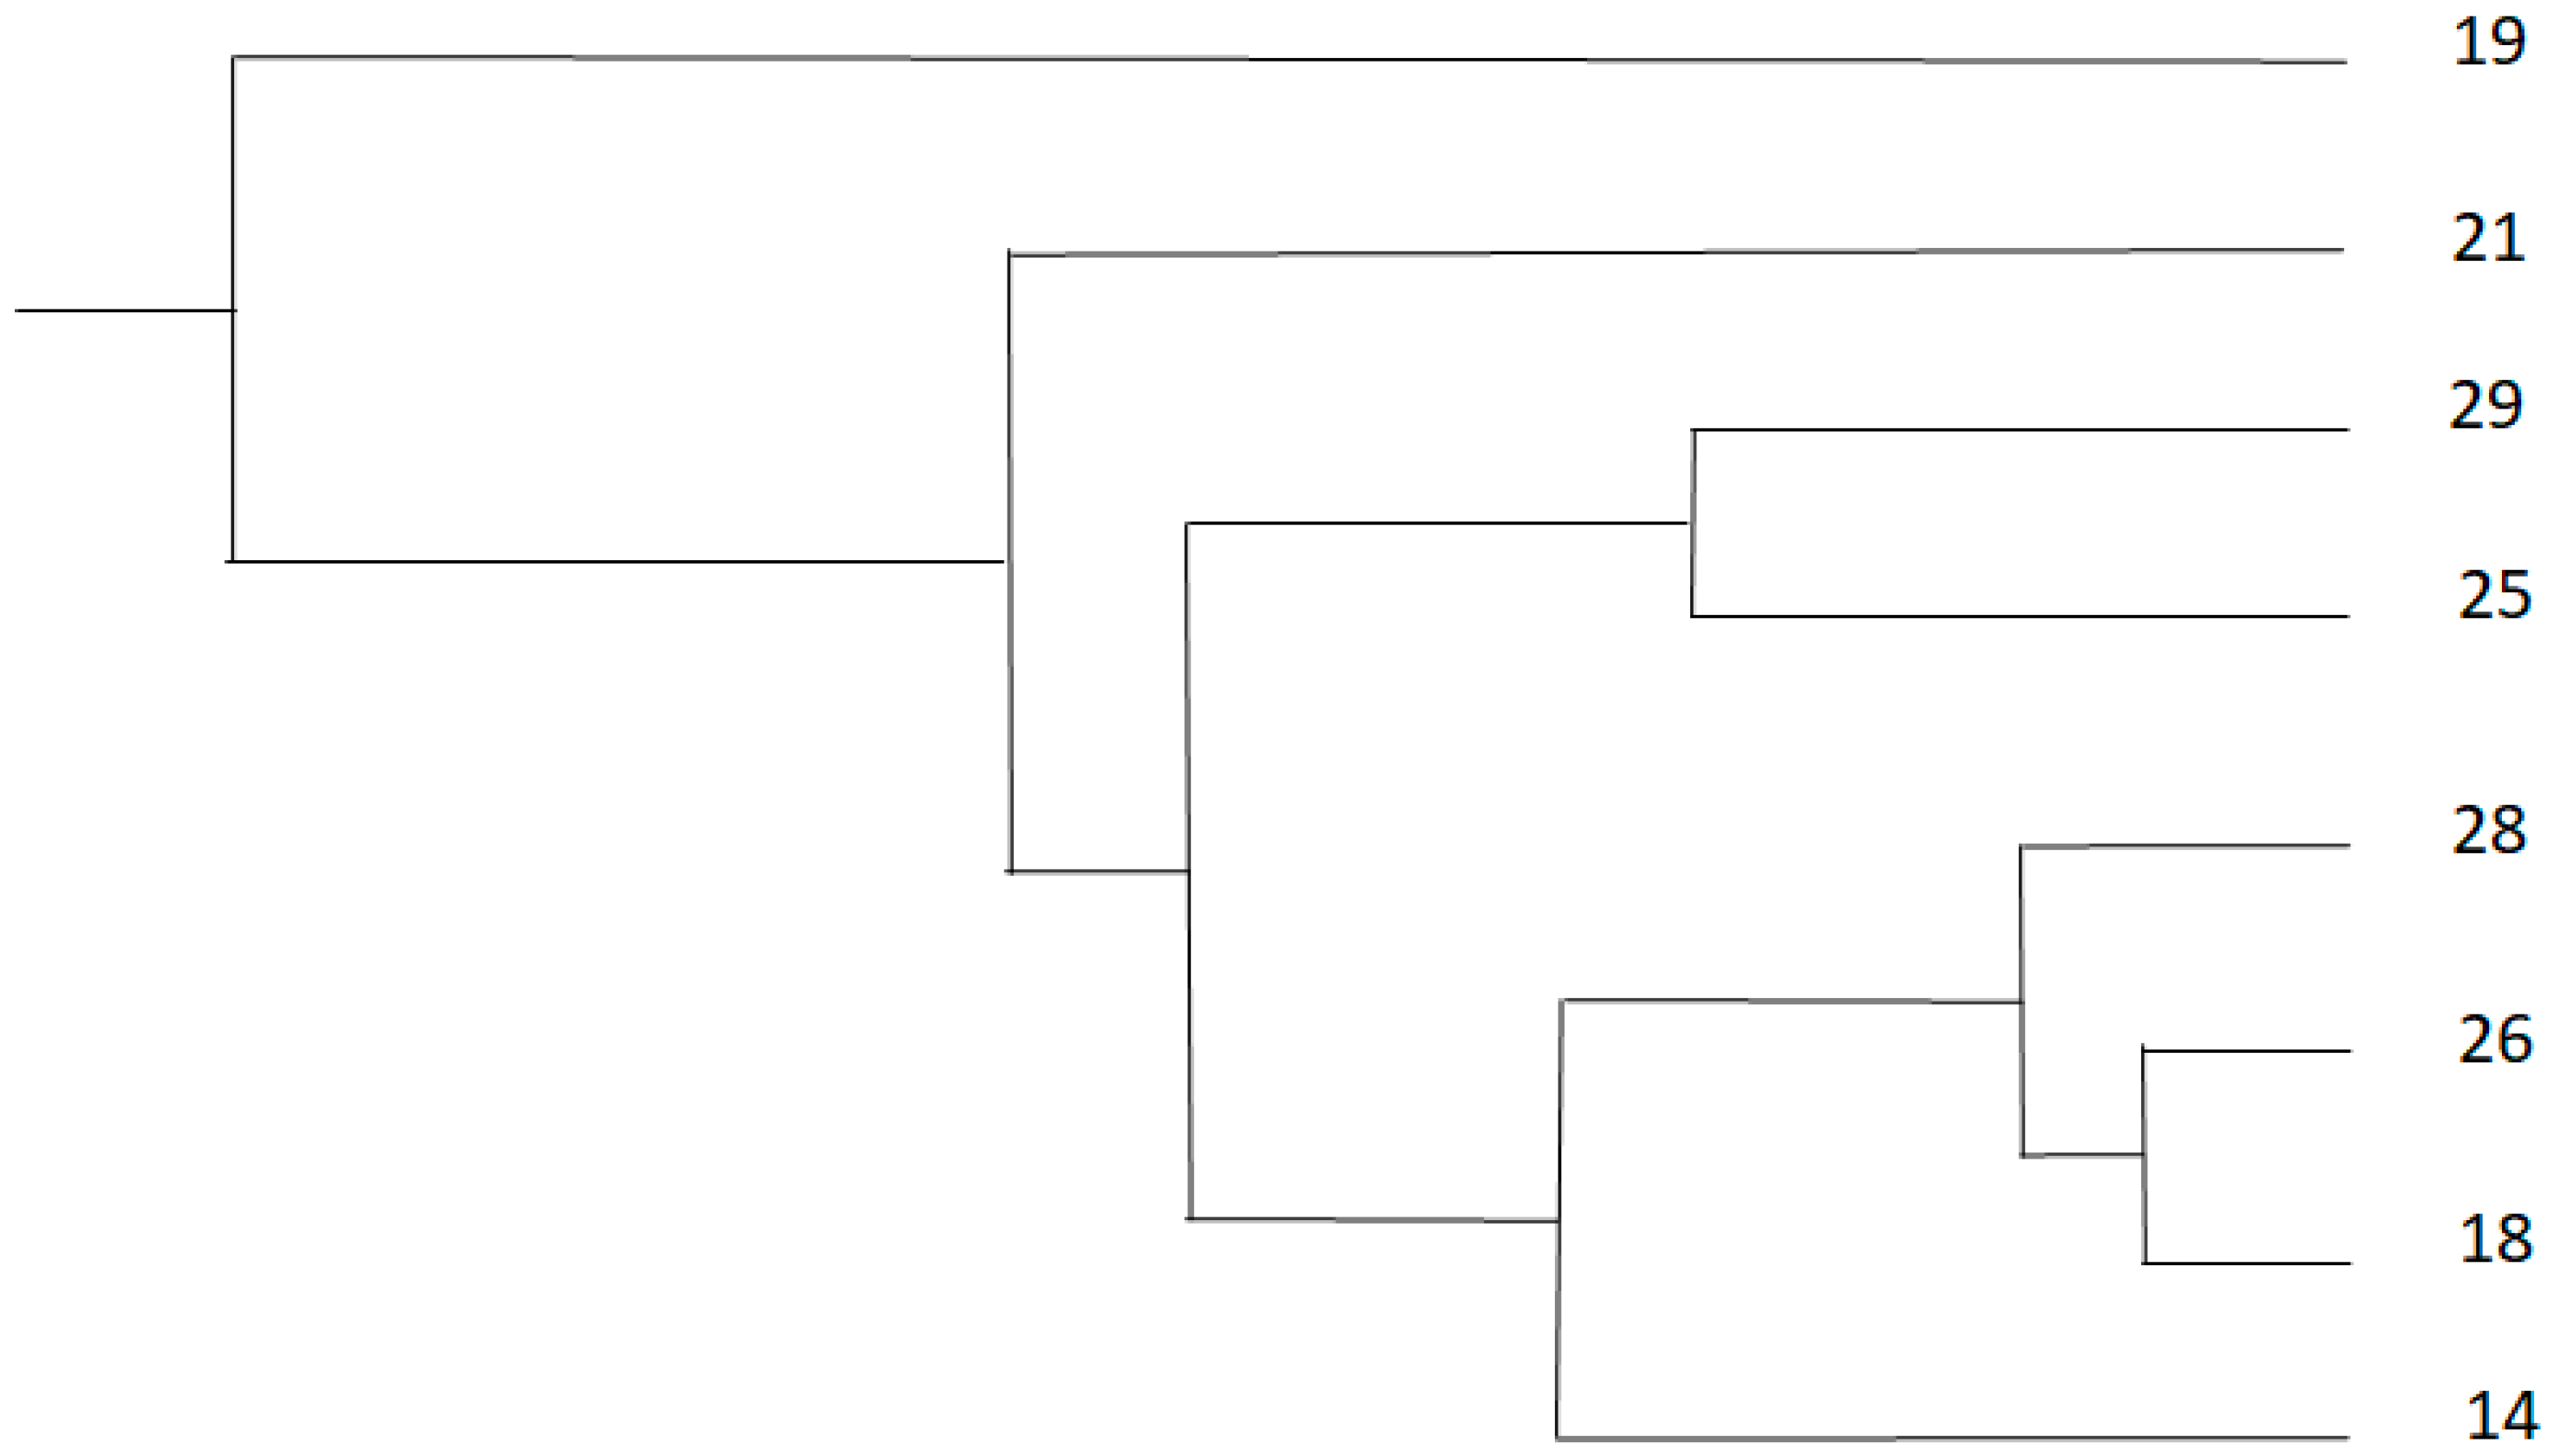
3.6. Lesion Count and Laterality
4. Discussion
5. Conclusions
Author Contributions
Funding
Acknowledgments
Conflicts of Interest
References
- Mansfield, K.L.; Balseiro Morales, A.; Johnson, N.; Ayllón, N.; Höfle, U.; Alberdi, P.; Fernández de Mera, I.G.; García Marín, J.F.; Gortázar, C.; De la Fuente, J.; et al. Identification and characterization of a novel tick-borne flavivirus subtype in goats (Capra hircus) in Spain. J. Gen. Virol. 2015, 96, 1676–1681. [Google Scholar] [CrossRef] [PubMed]
- Balseiro, A.; Royo, L.J.; Pérez-Martínez, C.; de Mera, I.G.F.; Höfle, Ú.; Polledo, L.; Marreros, N.; Casais, R.; García-Marín, J.F. Louping ill in goats, Spain, 2011. Emerg. Infect. Dis. 2012, 18, 976–978. [Google Scholar] [CrossRef] [PubMed] [Green Version]
- Salinas, L.M.; Casais, R.; García Marín, J.F.; Dalton, K.P.; Royo, L.J.; Del Cerro, A.; Gayo, E.; Dagleish, M.P.; Alberdi, P.; Juste, R.A.; et al. Vaccination against louping ill virus protects goats from experimental challenge with Spanish goat encephalitis virus. J. Comp. Pathol. 2017, 156, 409–418. [Google Scholar] [CrossRef] [PubMed]
- Salinas, L.M.; Casais, R.; García Marín, J.F.; Dalton, K.P.; Royo, L.J.; del Cerro, A.; Gayo, E.; Dagleish, M.P.; Juste, R.A.; Balseiro, A. Lambs are susceptible to experimental challenge with Spanish goat encephalitis virus. J. Comp. Pathol. 2017, 156, 400–413. [Google Scholar] [CrossRef] [PubMed]
- Doherty, P.C.; Reid, H.E.; Smith, W. Loping—Ill encephalomyelitis in the sheep. IV. Nature perivascular inflammatory reaction. J. Comp. Pathol. 1971, 81, 545–549. [Google Scholar] [CrossRef]
- Martínez, I.Z.; Pérez-Martínez, C.; Salinas, L.M.; García-Marín, J.F.; Juste, R.A.; Balseiro, A. Phenotypic characterization of encephalitis in the brain of goats experimentally infected with Spanish goat encephalitis virus. Vet. Immnol. Immunopathol. 2020, 220, 1–7. [Google Scholar] [CrossRef]
- Sheahan, B.J.; Moore, M.; Atkins, G.J. The pathogenicity of louping ill virus for mice and lambs. J. Comp. Pathol. 2002, 126, 137–146. [Google Scholar] [CrossRef]
- Cho, H.; Diamond, M.S. Immune responses to West Nile virus infection in the central nervous system. Viruses 2012, 4, 3814–3830. [Google Scholar] [CrossRef]
- Delcambre, G.H.; Liu, J.; Streit, W.J.; Shaw, G.P.J.; Vallario, K.; Herrington, J.; Wenzlow, N.; Barr, K.L.; Long, M.T. Phenotypic characterization of cell populations in the brains of horses experimentally infected with West Nile virus. Equine Vet. J. 2017, 49, 815–820. [Google Scholar] [CrossRef]
- Thongtan, T.; Thepparit, C.; Smith, D.R. The involvement of microglia cells in Japanese encephalitis infections. Clin. Dev. Immunol. 2012, 2012, 1–7. [Google Scholar] [CrossRef] [Green Version]
- Maximova, O.A.; Faucette, L.J.; Ward, J.M.; Murphy, B.R.; Pletnev, A.G. Cellular inflammatory response to flaviviruses in the central nervous system of a primate host. J. Histochem. Cytochem. 2009, 57, 973–989. [Google Scholar] [CrossRef] [PubMed] [Green Version]
- Maximova, O.A.; Pletnev, A.G. Flaviviruses and the central nervous system: Revisiting neuropathological concepts. Annu. Rev. Virol. 2018, 5, 255–272. [Google Scholar] [CrossRef] [PubMed]
- Sofroniew, M.V.; Vinters, H.V. Astrocytes: Biology and pathology. Acta Neuropathol. 2010, 119, 7–35. [Google Scholar] [CrossRef] [PubMed] [Green Version]
- Johnson, R.T.; Burke, D.S.; Elwell, M.; Leake, C.J.; Nisalak, A.; Hoke, C.H.; Lorsomrudee, W. Japanese encephalitis: Immunocytochemical studies of viral antigen and inflammatory cells in fatal cases. Ann. Neurol. 1985, 18, 567–573. [Google Scholar] [CrossRef] [PubMed]
- Gelpi, E.; Preusser, M.; Garzuly, F.; Holzmann, H.; Heinz, F.X.; Budka, H. Visualization of central European tick-borne encephalitis infection in fatal human cases. J. Neuropathol. Exp. Neurol. 2005, 64, 506–512. [Google Scholar] [CrossRef] [Green Version]
- Rock, R.B.; Gekker, G.; Hu, S.; Sheng, W.S.; Cheeran, M.; Lokensgard, J.R.; Peterson, P.K. Role of microglia in central nervous system infections. Clin. Microbiol. Rev. 2004, 17, 942–964. [Google Scholar] [CrossRef] [Green Version]
- Gelpi, E.; Preusser, M.; Laggner, U.; Garzuly, F.; Holzmann, H.; Heinz, F.; Budka, H. Inflammatory response in human tick-borne encephalitis: Analysis of postmortem brain tissue. J. Neurovirol. 2006, 12, 322–327. [Google Scholar] [CrossRef]
- Ghoshal, A.; Das, S.; Ghosh, S.; Mishra, M.K.; Sharma, V.; Koli, P.; Sen, E.; Basu, A. Proinflammatory mediators released by activated microglia induces neuronal death in Japanese encephalitis. Glia 2007, 55, 483–496. [Google Scholar] [CrossRef]
- Blom, K.; Cuapio, A.; Sandberg, J.T.; Varnaite, R.; Michaëlsson, J.; Björkström, N.K.; Sandberg, J.K.; Klingström, J.; Lindquist, L.; Gredmark, R.S.; et al. Cell-mediated immune responses and immunopathogenesis of human tick-borne encephalitis virus-infection. Front. Immunol. 2018, 9, 1–10. [Google Scholar] [CrossRef] [Green Version]
- Binder, G.K. Interferon-gamma- mediated site-specific clearance of alphavirus from CNS neurons. Science 2001, 293, 303–306. [Google Scholar] [CrossRef]
- Ruzek, D.; Salat, J.; Palus, M.; Gritsun, T.S.; Gould, E.A.; Dyková, I.; Skallová, A.; Jelínek, J.; Kopecký, J.; Grubhoffer, L. CD8+ T-cells mediate immunopathology in tick-borne encephalitis. Virology 2009, 384, 1–6. [Google Scholar] [CrossRef] [PubMed]
- Mansfield, K.L.; Johnson, N.; Banyard, A.C.; Núñez, A.; Baylis, M.; Solomon, T.; Fooks, A.R. Innate and adaptive immune responses to tick-borne flavivirus infections in sheep. Vet. Microbiol. 2016, 185, 20–28. [Google Scholar] [CrossRef] [PubMed]
- Kelley, T.W.; Prayson, R.A.; Ruiz, A.I.; Isada, C.M.; Gordon, S.M. The neuropathology of West Nile virus meningoencephalitis. A report of two cases and review of the literature. Am. J. Clin. Pathol. 2003, 119, 749–753. [Google Scholar] [CrossRef] [PubMed]
- Palus, M.; Bily, T.; Elsterova, J.; Langhansova, H.; Salat, J.; Vancova, M.; Rek, D. Infection and injury of human astrocytes by tick-borne encephalitis virus. J. Gen. Virol. 2014, 95, 2411–2426. [Google Scholar] [CrossRef] [PubMed]
- Potokar, M.; Jorgačevski, J.; Zorec, R. Astrocytes in flavivirus infections. Int. J. Mol. Sci. 2019, 20, 691. [Google Scholar] [CrossRef] [PubMed] [Green Version]


| Antibody/Specificity | Clone n° | Isotype | Manufacturer | Antigen Retrieval | Dilution |
|---|---|---|---|---|---|
| Iba1/Macrophages/microgial cells | Polyclonal 019-19741 | Rabbit IgG | FLUJIFILM-Wako Chemicals Europe GmbH, Neuss, Germany | Citrate pH 6.0 in microwave in 20 min | 1:1000 |
| CD3/T lymphocytes | Monoclonal NCL-L-CD3-565 | Mouse IgG | Novocastra, Leica Biosystem, Neucastle, United Kingdom | Citrate pH 6.0 in microwave in 20 min | 1:500 |
| CD20/B lymphocytes | Polyclonal PA5-16701 | Rabbit IgG | ThermoFisher, Massachusetts, USA. | Citrate pH 6.0 in steamer for 20 min | 1:200 |
| GFAP/Astrocytes | Monoclonal MCA-5C10 | Mouse IgG | EncorBiotechnology, Gainesville, Florida, USA | Citrate pH 6.0 in microwave in 20 min | 1:8000 |
| Variable | Level | Microglia (Iba1) | T lymphocytes (CD3) | B lymphocytes (CD20) | Astrocytes (GFAP) | ||||
|---|---|---|---|---|---|---|---|---|---|
| Mean | SE | Mean | SE | Mean | SE | Mean | SE | ||
| Cluster | A (mild to moderate lesions) | 31.5 | 2.3 | 12.5 | 2.3 | 2.4 | 2.3 | 2.4 | 1.1 |
| B (moderate to severe lesion) | 59.3 | 2.3 | 24.8 | 2.34 | 6.4 | 2.34 | 2.3 | 1.1 | |
| Region | Cortex | 55.3 | 4.7 | 16.4 | 4.7 | 3.4 | 4.70 | 2.1 | 2.2 |
| Thalamus, hypothalamus, corpus callosum | 51.4 | 4.7 | 18.9 | 4.7 | 4.8 | 4.7 | 2.4 | 2.2 | |
| Hippocampus | 55.2 | 4.7 | 16.0 | 4.7 | 3.9 | 4.7 | 2.0 | 2.2 | |
| Midbrain | 42.1 | 4.7 | 21.6 | 4.7 | 5.8 | 4.7 | 2.1 | 2.2 | |
| Pons, cerebellum | 45.8 | 4.7 | 25.1 | 4.7 | 4.5 | 4.7 | 2.3 | 2.2 | |
| Medulla oblongata | 47.6 | 4.7 | 24.7 | 4.7 | 3.4 | 4.7 | 2.5 | 2.2 | |
| Cervical spinal cord | 34.4 | 4.7 | 11.6 | 4.7 | 5.6 | 4.7 | 2.5 | 2.2 | |
| Lumbosacral spinal cord | 31.6 | 4.7 | 14.8 | 4.7 | 3.8 | 4.7 | 2.9 | 2.2 | |
| Type of lesion | Glial foci | 55.3 | 2.3 | 16.6 | 2.3 | 2.5 | 2.3 | 2.3 | 0.1 |
| Perivascular Cuffing | 35.5 | 2.3 | 20.6 | 2.3 | 6.3 | 2.3 | - | - | |
© 2020 by the authors. Licensee MDPI, Basel, Switzerland. This article is an open access article distributed under the terms and conditions of the Creative Commons Attribution (CC BY) license (http://creativecommons.org/licenses/by/4.0/).
Share and Cite
Martínez, I.Z.; Pérez-Martínez, C.; Salinas, L.M.; Juste, R.A.; García Marín, J.F.; Balseiro, A. Phenotypic Characterization of Encephalitis and Immune Response in the Brains of Lambs Experimentally Infected with Spanish Goat Encephalitis Virus. Animals 2020, 10, 1373. https://doi.org/10.3390/ani10081373
Martínez IZ, Pérez-Martínez C, Salinas LM, Juste RA, García Marín JF, Balseiro A. Phenotypic Characterization of Encephalitis and Immune Response in the Brains of Lambs Experimentally Infected with Spanish Goat Encephalitis Virus. Animals. 2020; 10(8):1373. https://doi.org/10.3390/ani10081373
Chicago/Turabian StyleMartínez, Ileana Z., Claudia Pérez-Martínez, Luis M. Salinas, Ramón A. Juste, Juan F. García Marín, and Ana Balseiro. 2020. "Phenotypic Characterization of Encephalitis and Immune Response in the Brains of Lambs Experimentally Infected with Spanish Goat Encephalitis Virus" Animals 10, no. 8: 1373. https://doi.org/10.3390/ani10081373