Impacts of Dietary Protein and Prebiotic Inclusion on Liver and Spleen Gene Expression in Hy-Line Brown Caged Layers

 , , and
Abstract
:Simple Summary
Abstract
1. Introduction
2. Materials and Methods
2.1. Live Animal Study
2.2. Tissue Collection and Storage
2.3. Genes for Targeted Differential Expression
2.4. RNA Extraction, Quality Analysis, and Reverse Transcription
2.5. Primer Design and Testing
2.6. Real-Time Quantitative Polymerase Chain Reaction (RT-qPCR)
2.7. Statistical Analysis
3. Results
4. Discussion
5. Conclusions
Author Contributions
Funding
Acknowledgments
Conflicts of Interest
References
- de Vries, M.; de Boer, I.J.M. Comparing environmental impacts for livestock products: A review of life cycle assessments. Livest. Sci. 2010, 128, 1–11. [Google Scholar] [CrossRef]
- Tallentire, C.W.; Mackenzie, S.G.; Kyriazakis, I. Environmental impact trade-offs in diet formulation for broiler production systems in the UK and USA. Agric. Syst. 2017, 154, 145–156. [Google Scholar] [CrossRef]
- Nahashon, S.N.; Nakaue, H.S.; Snyder, S.P.; Mirosh, L.W. Performance of single comb White Leghorn layers fed corn-soybean meal and barley-corn-soybean meal diets supplemented with a direct-fed microbial. Poult. Sci. 1994, 73, 1712–1723. [Google Scholar] [CrossRef] [PubMed]
- Park, Y.H.; Kim, H.K.; Kim, H.S.; Lee, H.S.; Shin, I.S.; Whang, K.Y. Effects of three different soybean meal sources on layer and broiler performance. Asian-Australas. J. Anim. Sci. 2002, 15, 254–265. [Google Scholar] [CrossRef]
- Shi, S.R.; Lu, J.; Tong, H.B.; Zou, J.M.; Wang, K.H. Effects of graded replacement of soybean meal by sunflower seed meal in laying hen diets on hen performance, egg quality, egg fatty acid composition, and cholesterol content. J. Appl. Poult. Res. 2012, 21, 367–374. [Google Scholar] [CrossRef]
- Zeng, Q.F.; Bai, P.; Wang, J.P.; Ding, X.M.; Luo, Y.H.; Bai, S.P.; Xuan, Y.; Su, Z.W.; Lin, S.Q.; Zhao, L.J.; et al. The response of meat ducks from 15 to 35 d of age to gossypol from cottonseed meal. Poult. Sci. 2015, 94, 1277–1286. [Google Scholar] [CrossRef]
- Nagalakshmi, D.; Rao, S.V.R.; Panda, A.K.; Sastry, V.R.B. Cottonseed meal in poultry diets: A review. J. Poult. Sci. 2007, 44, 119–134. [Google Scholar] [CrossRef] [Green Version]
- Gadelha, I.C.N.; Fonseca, N.B.S.; Oloris, S.C.S.; Melo, M.M.; Soto-Blanco, B. Gossypol toxicity from cottonseed products. Sci. World J. 2014, 2014, 231635. [Google Scholar] [CrossRef] [Green Version]
- Lordelo, M.M.; Calhoun, M.C.; Dale, N.M.; Dowd, M.K.; Davis, A.J. Relative toxicity of gossypol enantiomers in laying and broiler breeder hens. Poult. Sci. 2007, 86, 582–590. [Google Scholar] [CrossRef]
- Davis, A.J.; Lordelo, M.M.; Dale, N. The Use of Cottonseed Meal with or without Added Soapstock in Laying Hen Diets. J. Appl. Poult. Res. 2002, 11, 127–133. [Google Scholar] [CrossRef] [Green Version]
- He, T.; Zhang, H.J.; Wang, J.; Wu, S.G.; Yue, H.Y.; Qi, G.H. Application of low-gossypol cottonseed meal in laying hens’ diet. Poult. Sci. 2015, 94, 2456–2463. [Google Scholar] [CrossRef]
- Smith, K.J. Practical significance of gossypol in feed formulation. J. Am. Oil Chem. Soc. 1970, 47, 448–450. [Google Scholar] [CrossRef]
- Gibson, G.R.; Roberfroid, M.B. Dietary modulation of the human colonic microbiota: Introducing the concept of prebiotics. J. Nutr. 1995, 125, 1401–1412. [Google Scholar] [CrossRef] [PubMed]
- Hooge, D.M.; Connolly, A. Meta-Analysis Summary of Broiler Chicken Trials with Dietary Actigen® (2009–2011). Int. J. Poult. Sci. 2011, 10, 819–824. [Google Scholar] [CrossRef] [Green Version]
- Lenoir-Wijnkoop, I.; Sanders, M.E.; Cabana, M.D.; Caglar, E.; Corthier, G.; Rayes, N.; Sherman, P.M.; Timmerman, H.M.; Vaneechoutte, M.; Van Loo, J.; et al. Probiotic and prebiotic influence beyond the intestinal tract. Nutr. Rev. 2007, 65, 469–489. [Google Scholar] [CrossRef] [PubMed]
- Spring, P.; Wenk, C.; Dawson, K.A.; Newman, K.E. The effects of dietary mannaoligosaccharides on cecal parameters and the concentrations of enteric bacteria in the ceca of salmonella-challenged broiler chicks. Poult. Sci. 2000, 79, 205–211. [Google Scholar] [CrossRef]
- Hassan, H.A.; Ragab, M.S. Single and combined effects of manan oligosaccharide (MOS) and dietary protein on the performance and immunity response of laying hens. Egypt. Poult. Sci. 2007, 27, 969–987. [Google Scholar]
- Micallef, G.; Cash, P.; Fernandes, J.M.O.; Rajan, B.; Tinsley, J.W.; Bickerdike, R.; Martin, S.A.M.; Bowman, A.S. Dietary Yeast Cell Wall Extract Alters the Proteome of the Skin Mucous Barrier in Atlantic Salmon (Salmo salar): Increased Abundance and Expression of a Calreticulin-Like Protein. PLoS ONE 2017, 12, e0169075. [Google Scholar] [CrossRef]
- Yu, H.H.; Han, F.; Xue, M.; Wang, J.; Tacon, P.; Zheng, Y.H.; Wu, X.F.; Zhang, Y.J. Efficacy and tolerance of yeast cell wall as an immunostimulant in the diet of Japanese seabass (Lateolabrax japonicus). Aquaculture 2014, 432, 217–224. [Google Scholar] [CrossRef]
- Martin, S.A.M.; Król, E. Nutrigenomics and immune function in fish: New insights from omics technologies. Dev. Comp. Immunol. 2017, 75, 86–98. [Google Scholar] [CrossRef] [Green Version]
- Al-Ajeeli, M.N.; Leyva-Jimenez, H.; Abdaljaleel, R.A.; Jameel, Y.; Hashim, M.M.; Archer, G.; Bailey, C.A. Evaluation of the performance of Hy-Line Brown laying hens fed soybean or soybean-free diets using cage or free-range rearing systems. Poult. Sci. 2018, 97, 812–819. [Google Scholar] [CrossRef] [PubMed]
- Hubert, S.M.; Al-Ajeeli, M.; Bailey, C.A.; Athrey, G. The role of housing environment and dietary protein source on the gut microbiota of chicken. Animals 2019, 9, 1085. [Google Scholar] [CrossRef] [PubMed] [Green Version]
- Hodek, P.; Trefil, P.; Stiborová, M. Flavonoids-potent and versatile biologically active compounds interacting with cytochromes P450. Chem.-Biol. Interact. 2002, 139, 1–21. [Google Scholar] [CrossRef]
- Rong, Y.; Distelhorst, C.W. Bcl-2 protein family members: Versatile regulators of calcium signaling in cell survival and apoptosis. Ann. Rev. Physiol. 2008, 70, 73–91. [Google Scholar] [CrossRef] [PubMed]
- Ye, Z.; Ting, J.P.-Y. NLR, the nucleotide-binding domain leucine-rich repeat containing gene family. Curr. Opin. Immunol. 2008, 20, 3–9. [Google Scholar] [CrossRef] [PubMed]
- Zanger, U.M.; Schwab, M. Cytochrome P450 enzymes in drug metabolism: Regulation of gene expression, enzyme activities, and impact of genetic variation. Pharmacol. Ther. 2013, 138, 103–141. [Google Scholar] [CrossRef] [PubMed]
- Watanabe, K.P.; Kawai, Y.K.; Ikenaka, Y.; Kawata, M.; Ikushiro, S.-I.; Sakaki, T.; Ishizuka, M. Avian cytochrome P450 (CYP) 1-3 family genes: Isoforms, evolutionary relationships, and mRNA expression in chicken liver. PLoS ONE 2013, 8, e75689. [Google Scholar] [CrossRef] [Green Version]
- Livak, K.J.; Schmittgen, T.D. Analysis of relative gene expression data using real-time quantitative PCR and the 2(-Delta Delta C(T)) Method. Methods 2001, 25, 402–408. [Google Scholar] [CrossRef]
- Schmittgen, T.D.; Livak, K.J. Analyzing real-time PCR data by the comparative CT method. Nat. Protoc. 2008, 3, 1101–1108. [Google Scholar] [CrossRef]
- R Core Team. R: A Language and Environment for Statistical Computing; R Foundation for Statistical Computing: Vienna, Austria, 2019. [Google Scholar]
- de Souza Theodoro, S.; Putarov, T.C.; Tiemi, C.; Volpe, L.M.; de Oliveira, C.A.F.; de Abreu Glória, M.B.; Carciofi, A.C. Effects of the solubility of yeast cell wall preparations on their potential prebiotic properties in dogs. PLoS ONE 2019, 14, e0225659. [Google Scholar] [CrossRef]
- Mendieta, C.R.; Gómez, G.V.; Del Río, J.C.G.; Cuevas, A.C.; Arce, J.M.; Ávila, E.G. Effect of the Addition of Saccharomyces Cerevisiae Yeast Cell Walls to Diets with Mycotoxins on the Performance and Immune Responses of Broilers. J. Poult. Sci. 2018, 55, 38–46. [Google Scholar] [CrossRef] [PubMed] [Green Version]
- Chittenden, T.; Harrington, E.A.; O’Connor, R.; Flemington, C.; Lutz, R.J.; Evan, G.I.; Guild, B.C. Induction of apoptosis by the Bcl-2 homologue Bak. Nature 1995, 374, 733–736. [Google Scholar] [CrossRef] [PubMed]
- Karbowski, M.; Norris, K.L.; Cleland, M.M.; Jeong, S.-Y.; Youle, R.J. Role of Bax and Bak in mitochondrial morphogenesis. Nature 2006, 443, 658–662. [Google Scholar] [CrossRef] [PubMed]
- Bleicken, S.; Landeta, O.; Landajuela, A.; Basañez, G.; García-Sáez, A.J. Proapoptotic Bax and Bak proteins form stable protein-permeable pores of tunable size. J. Biol. Chem. 2013, 288, 33241–33252. [Google Scholar] [CrossRef] [Green Version]
- Johnson, A.L. Editorial: Mcl-1—Just Another Antiapoptotic Bcl-2 Homolog? Endocrinology 1999, 140, 5465–5468. [Google Scholar] [CrossRef]
- Craig, R.W. MCL1 provides a window on the role of the BCL2 family in cell proliferation, differentiation and tumorigenesis. Leukemia 2002, 16, 444–454. [Google Scholar] [CrossRef] [Green Version]
- Viedma-Rodriguez, R.; Baiza-Gutman, L.A.; García-Carrancá, A.; Moreno-Fierros, L.; Salamanca-Gómez, F.; Arenas-Aranda, D. Suppression of the death gene BIK is a critical factor for resistance to tamoxifen in MCF-7 breast cancer cells. Int. J. Oncol. 2013, 43, 1777–1786. [Google Scholar] [CrossRef] [Green Version]
- Croom, E. Metabolism of xenobiotics of human environments. In Progress in Molecular Biology and Translational Science; Academic Press: Cambridge, MA, USA, 2012; Volume 112, pp. 31–88. [Google Scholar]
- Huang, N.; Agrawal, V.; Giacomini, K.M.; Miller, W.L. Genetics of P450 oxidoreductase: Sequence variation in 842 individuals of four ethnicities and activities of 15 missense mutations. Proc. Natl. Acad. Sci. USA 2008, 105, 1733–1738. [Google Scholar] [CrossRef] [Green Version]
- Sahakitrungruang, T.; Huang, N.; Tee, M.K.; Agrawal, V.; Russell, W.E.; Crock, P.; Murphy, N.; Migeon, C.J.; Miller, W.L. Clinical, genetic, and enzymatic characterization of P450 oxidoreductase deficiency in four patients. J. Clin. Endocrinol. Metab. 2009, 94, 4992–5000. [Google Scholar] [CrossRef] [Green Version]
- D’Agostino, J.; Ding, X.; Zhang, P.; Jia, K.; Fang, C.; Zhu, Y.; Spink, D.C.; Zhang, Q.-Y. Potential biological functions of cytochrome P450 reductase-dependent enzymes in small intestine: Novel link to expression of major histocompatibility complex class II genes. J. Biol. Chem. 2012, 287, 17777–17788. [Google Scholar] [CrossRef] [Green Version]


| Ingredients | 47–55 Weeks of Age | 55–62 Weeks of Age | ||
|---|---|---|---|---|
| SBM% | CSM% | SBM% | CSM% | |
| Corn | 64.17 | 42.22 | 65.67 | 51.19 |
| Dehulled Soybean Meal | 21.17 | 0 | 19.56 | 0 |
| Cottonseed Meal | 0 | 15 | 0 | 15 |
| Corn Gluten Meal | 0.38 | 1.66 | 0.29 | 1.14 |
| Dried Distiller Grains | 0 | 15 | 0 | 15 |
| Wheat Middlings | 0 | 8.31 | 0 | 1.08 |
| DL-Methionine 98% | 0.17 | 0.22 | 0.15 | 0.16 |
| L-Threonine 98% | 0 | 0.06 | 0 | 0 |
| Lysine HCL | 0 | 0.48 | 0.02 | 0.43 |
| AV 4 Fat Blend | 2.12 | 5 | 1.27 | 2.74 |
| Limestone | 9.91 | 10.1 | 11 | 11.1 |
| Dicalcium Phosphate | 1.42 | 1.37 | 1.43 | 1.44 |
| Salt | 0.38 | 0.04 | 0.33 | 0.04 |
| Sodium Bicarbonate | 0 | 0.27 | 0.03 | 0.37 |
| Trace Minerals 1 | 0.05 | 0.05 | 0.05 | 0.05 |
| Vitamins 2 | 0.25 | 0.25 | 0.25 | 0.25 |
| Calculated Nutrient Composition (%) | ||||
| ME (kcal/kg) | 2867 | 2867 | 2800 | 2800 |
| Crude Protein | 16.75 | 16.75 | 16 | 16 |
| Crude Fat | 3.95 | 7.66 | 3.13 | 5.4 |
| Crude Fiber | 1.75 | 4.47 | 1.71 | 4.05 |
| Calcium | 4.1 | 4.1 | 4.5 | 4.5 |
| Phosphorous | 0.64 | 0.75 | 0.63 | 0.73 |
| AV Phosphate | 0.4 | 0.4 | 0.4 | 0.4 |
| AV Methionine 3 | 0.41 | 0.44 | 0.38 | 0.38 |
| AV Lysine 3 | 0.74 | 0.77 | 0.71 | 0.71 |
| AV TSAA 3 | 0.64 | 0.67 | 0.6 | 0.6 |
| Gene Name | Abbreviation | Function |
|---|---|---|
| Aryl Hydrocarbon Receptor | AHR (R) | Cell-cycle regulation and tissue development |
| Glyceraldehyde-3-phosphate Dehydrogenase | GAPDH (R) | Glycolysis, RNA transport, and DNA replication |
| BCL2 Agonist/Killer | BAK | Apoptosis regulation, mitochondria energy metabolism regulation |
| BCL2 Interacting Killer | BIK | Programmed cell death accelerator via apoptosis |
| B-Cell Lymphoma 2 Apoptosis Regulator | BCL2 | Apoptosis suppressor, cell death regulator |
| Myeloid Leukemia Apoptosis Regulator | MCL1 | Anti-apoptotic protein, cell viability maintenance |
| Nucleotide-Binding Leucine-Rich Repeat Protein | NLRP3 | Innate immunity |
| P450 Oxidoreductase | POR | Oxidative metabolism of steroids, and carcinogens |
| Cytochrome P450 Family 1 Subfamily A Member 1 | CYP1A1 | NADPH-dependent electron transport pathway |
| Cytochrome P450 Family 1 Subfamily A Member 2 | CYP1A2 | Xenobiotic metabolism, carcinogenic aromatic |
| Cytochrome P450 2C23A | CYP2C23A | Xenobiotic and drug metabolism |
| Cytochrome P450 3A4 | CYP3A4 | Monooxygenase |
| Gene | Primer Sequence 5′–3′ | |
|---|---|---|
| BAK | Forward Primer | ACGAGAGATCAATGCAGAGGAC |
| Reverse Primer | ACTCGTAGGCGTTCTCCTTG | |
| BIK | Forward Primer | TCTCCAGATACCCCAACGGA |
| Reverse Primer | ACTGATAGCAACCCTGCGTG | |
| BCL2 | Forward Primer | GGATGGGATGCCTTTGTGGAA |
| Reverse Primer | TTAGCCAGGAAGTTGTTTTGCTC | |
| MCL1 | Forward Primer | GAGGCTGGGAGGGCTTTGTT |
| Reverse Primer | GGTGACTCAAGTCTGGCTGT | |
| NLRP3 | Forward Primer | GTCACTAAACCTGGTGGGGC |
| Reverse Primer | CCTGCGCTCTCCTGATCCAT | |
| POR | Forward Primer | ACAAGGGAAGTGAGTGGAGTT |
| Reverse Primer | ACTATGTTTCGGCCCGTCTT | |
| CYP1A1 | Forward Primer | GCAGCACCCAAAGGTTCACT |
| Reverse Primer | ATGGTCACCTCCATCACGTC | |
| CYP1A2 | Forward Primer | ACACCACGCTTCCCCTTAGT |
| Reverse Primer | TCCATCACGTCCCCGTATTT | |
| CYP2C23A | Forward Primer | CCTTCAGTGGGAGAGGAATACTG |
| Reverse Primer | TGAAAGGTTCCTCGTGTGTCTT | |
| CYP3A4 | Forward Primer | ACACCACGCTTCCCCTTAGT |
| Reverse Primer | TCCATCACGTCCCCGTATTT | |
| AHR | Forward Primer | GTGCAGAAAATAGTAAAGCCATCT |
| Reverse Primer | CCCTCTCCAAGTTTTGCTGT | |
| GAPDH | Forward Primer | TCGGAGTCAACGGATTTGGC |
| Reverse Primer | GCCCATTTGATGTTGCTGGG | |
| Tissue | Gene | SBM vs. CSM | YCW vs. No Add | Interaction | Significant Post-hoc Tests | Post-hoc N.S |
|---|---|---|---|---|---|---|
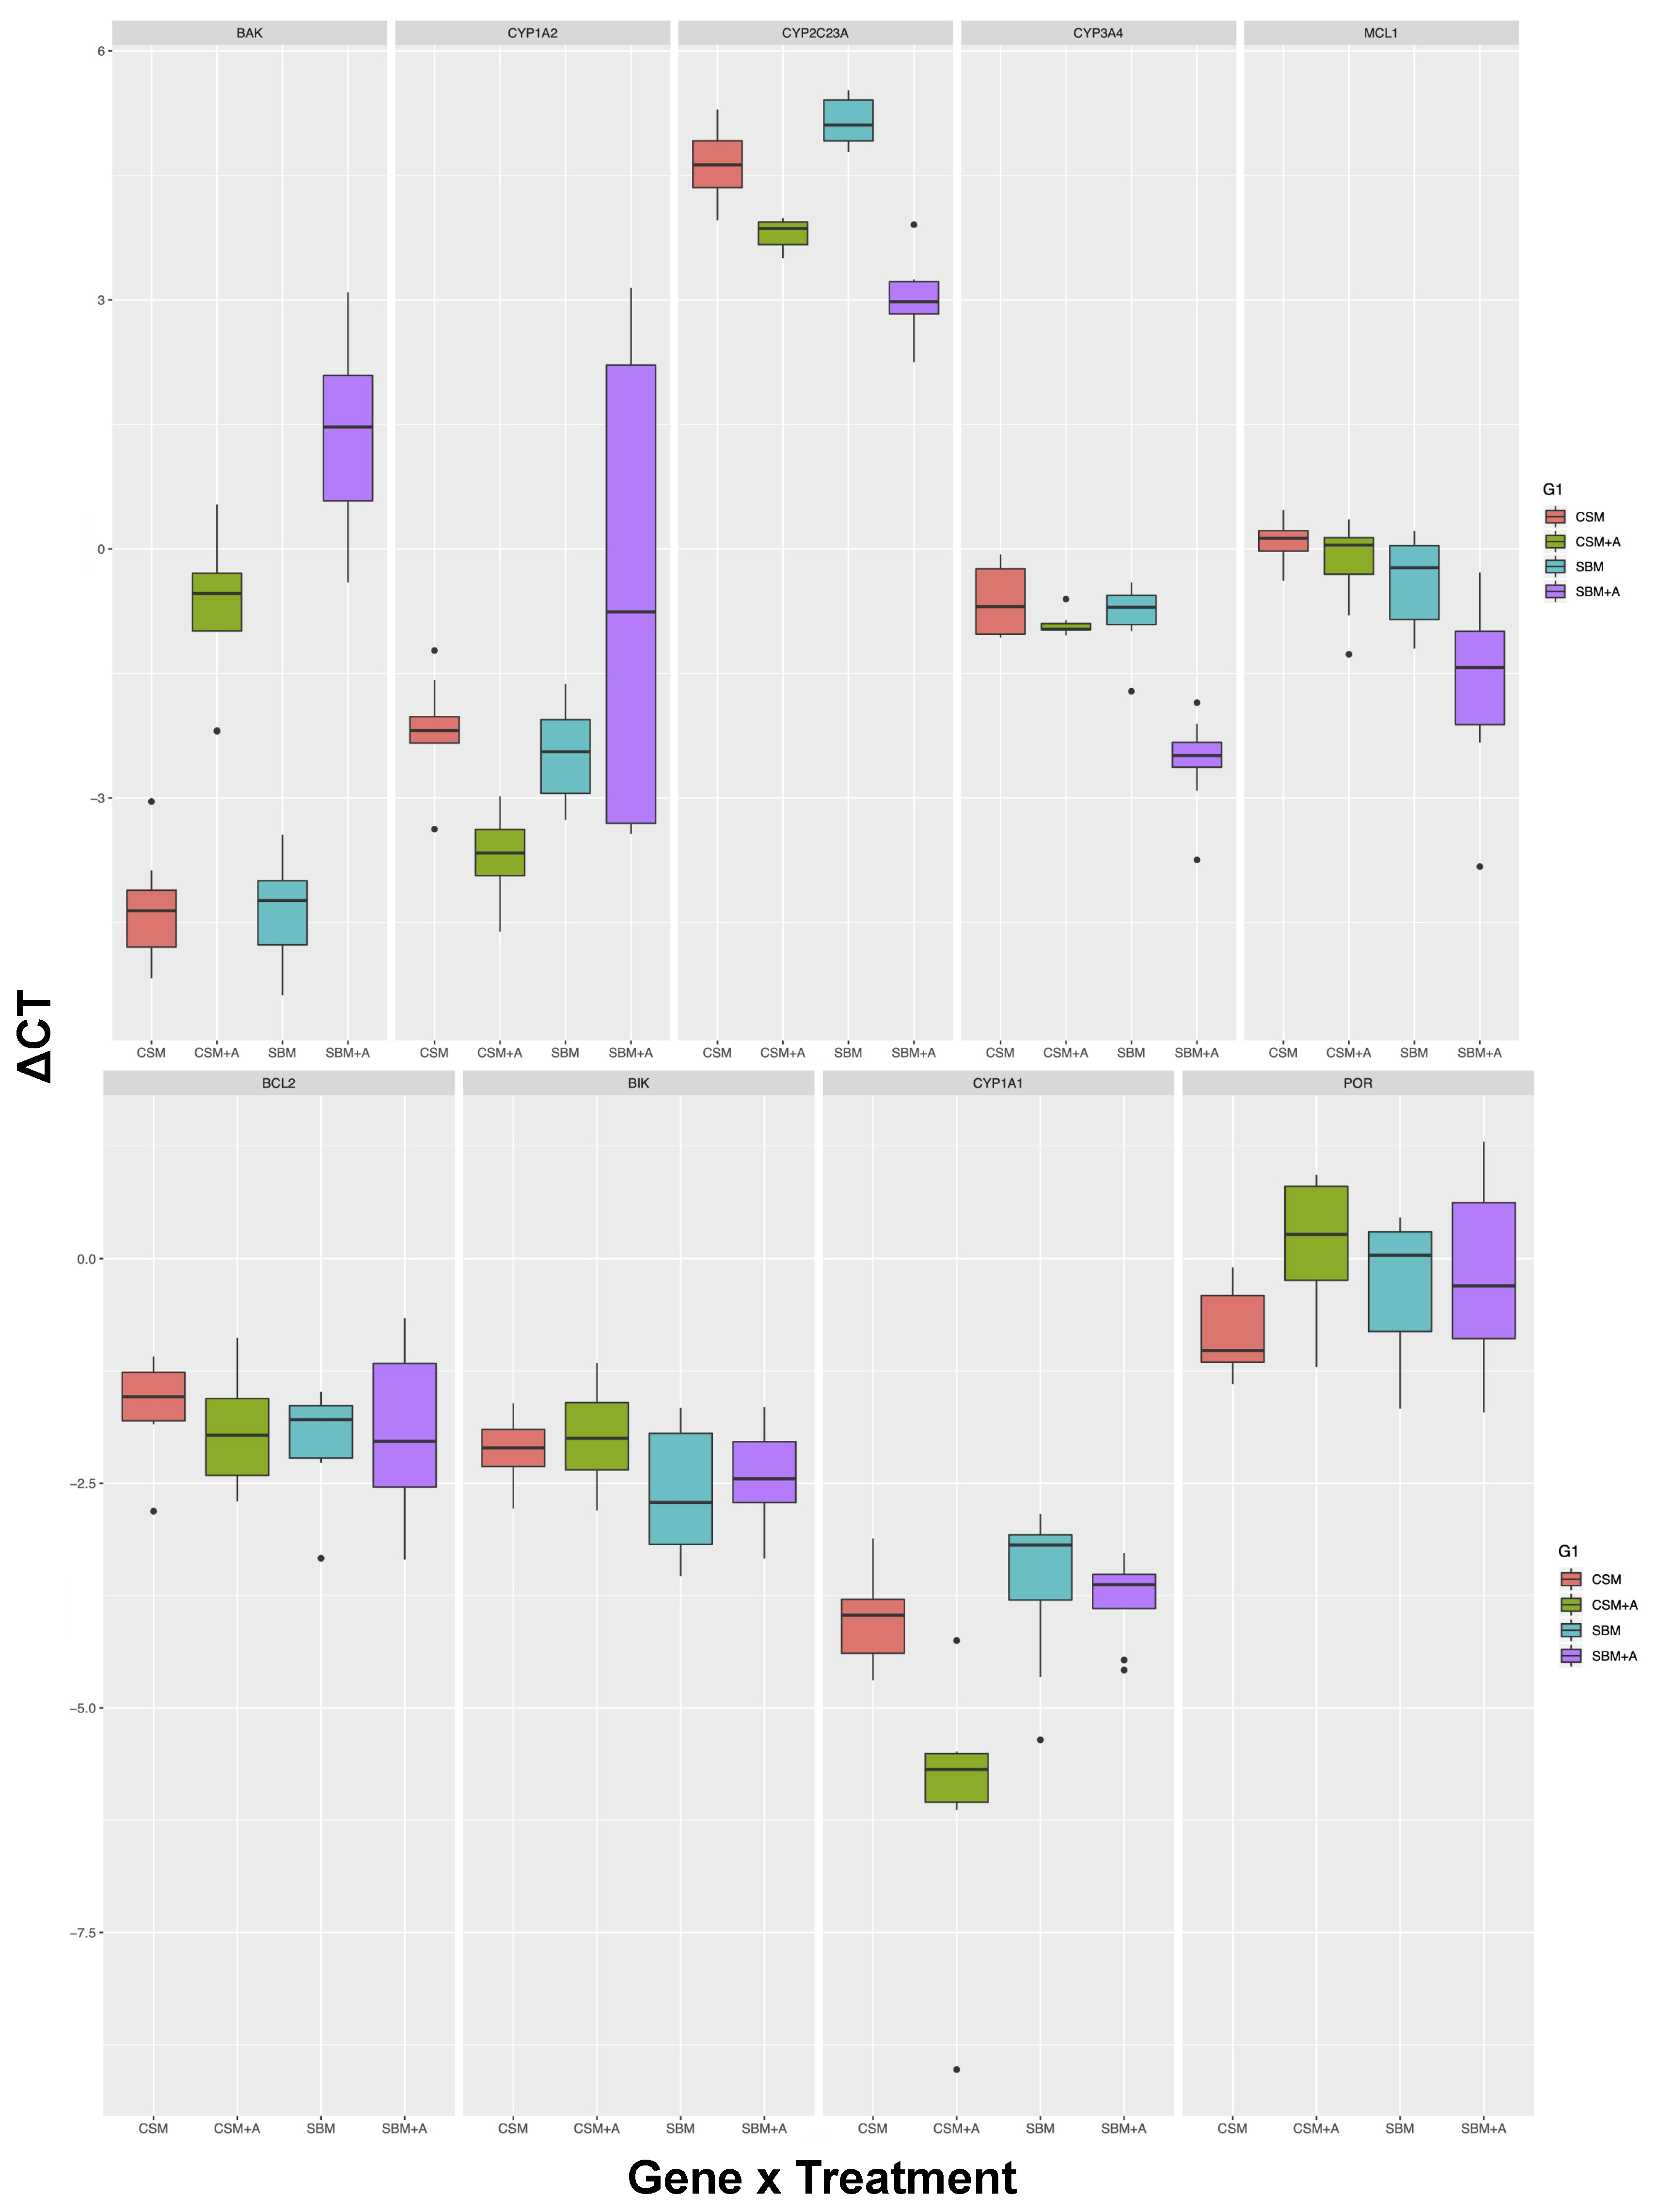
| Liver | BAK | <0.01 | <0.001 | <0.01 | 5 out of 6 | SBM v.s CSM |
| CYP1A2 | <0.05 | n.s | <0.01 | 1 out of 6 | SBM vs CSM, CSM + YCW vs. CSM, SBM + YCW vs. SBM, CSM + YCW vs. SBM, SBM vs. SBM + YCW | |
| CYP2C23A | n.s | <0.001 | <0.001 | 6 out of 6 | All pairs different | |
| CYP3A4 | <0.001 | <0.001 | <0.001 | 3 out of 6 | SBM vs. CSM, CSM vs. CSM + YCW, CSM + YCW vs. SBM | |
| MCL1 | <0.001 | <0.01 | n.s | 3 out of 6 | SBM vs. CSM, CSM vs. CSM + YCW, CSM + YCW vs. SBM | |
| BCL2 | n.s | n.s | n.s | 0 out of 6 | All pairs not different | |
| BIK | <0.05 | n.s | n.s | 0 out of 6 | All pairs not different | |
| CYP1A1 | <0.01 | <0.01 | <0.05 | 3 out of 6 | SBM vs. CSM, SBM + YCW vs. CSM, SBM + YCW vs. SBM | |
| POR | n.s | n.s | n.s | 0 out of 6 | All pairs not different | |
| Tissue | Gene | SBM vs. CSM | YCW vs. No Add | Interaction | Significant Post-hoc Tests | Post-hoc N.S |
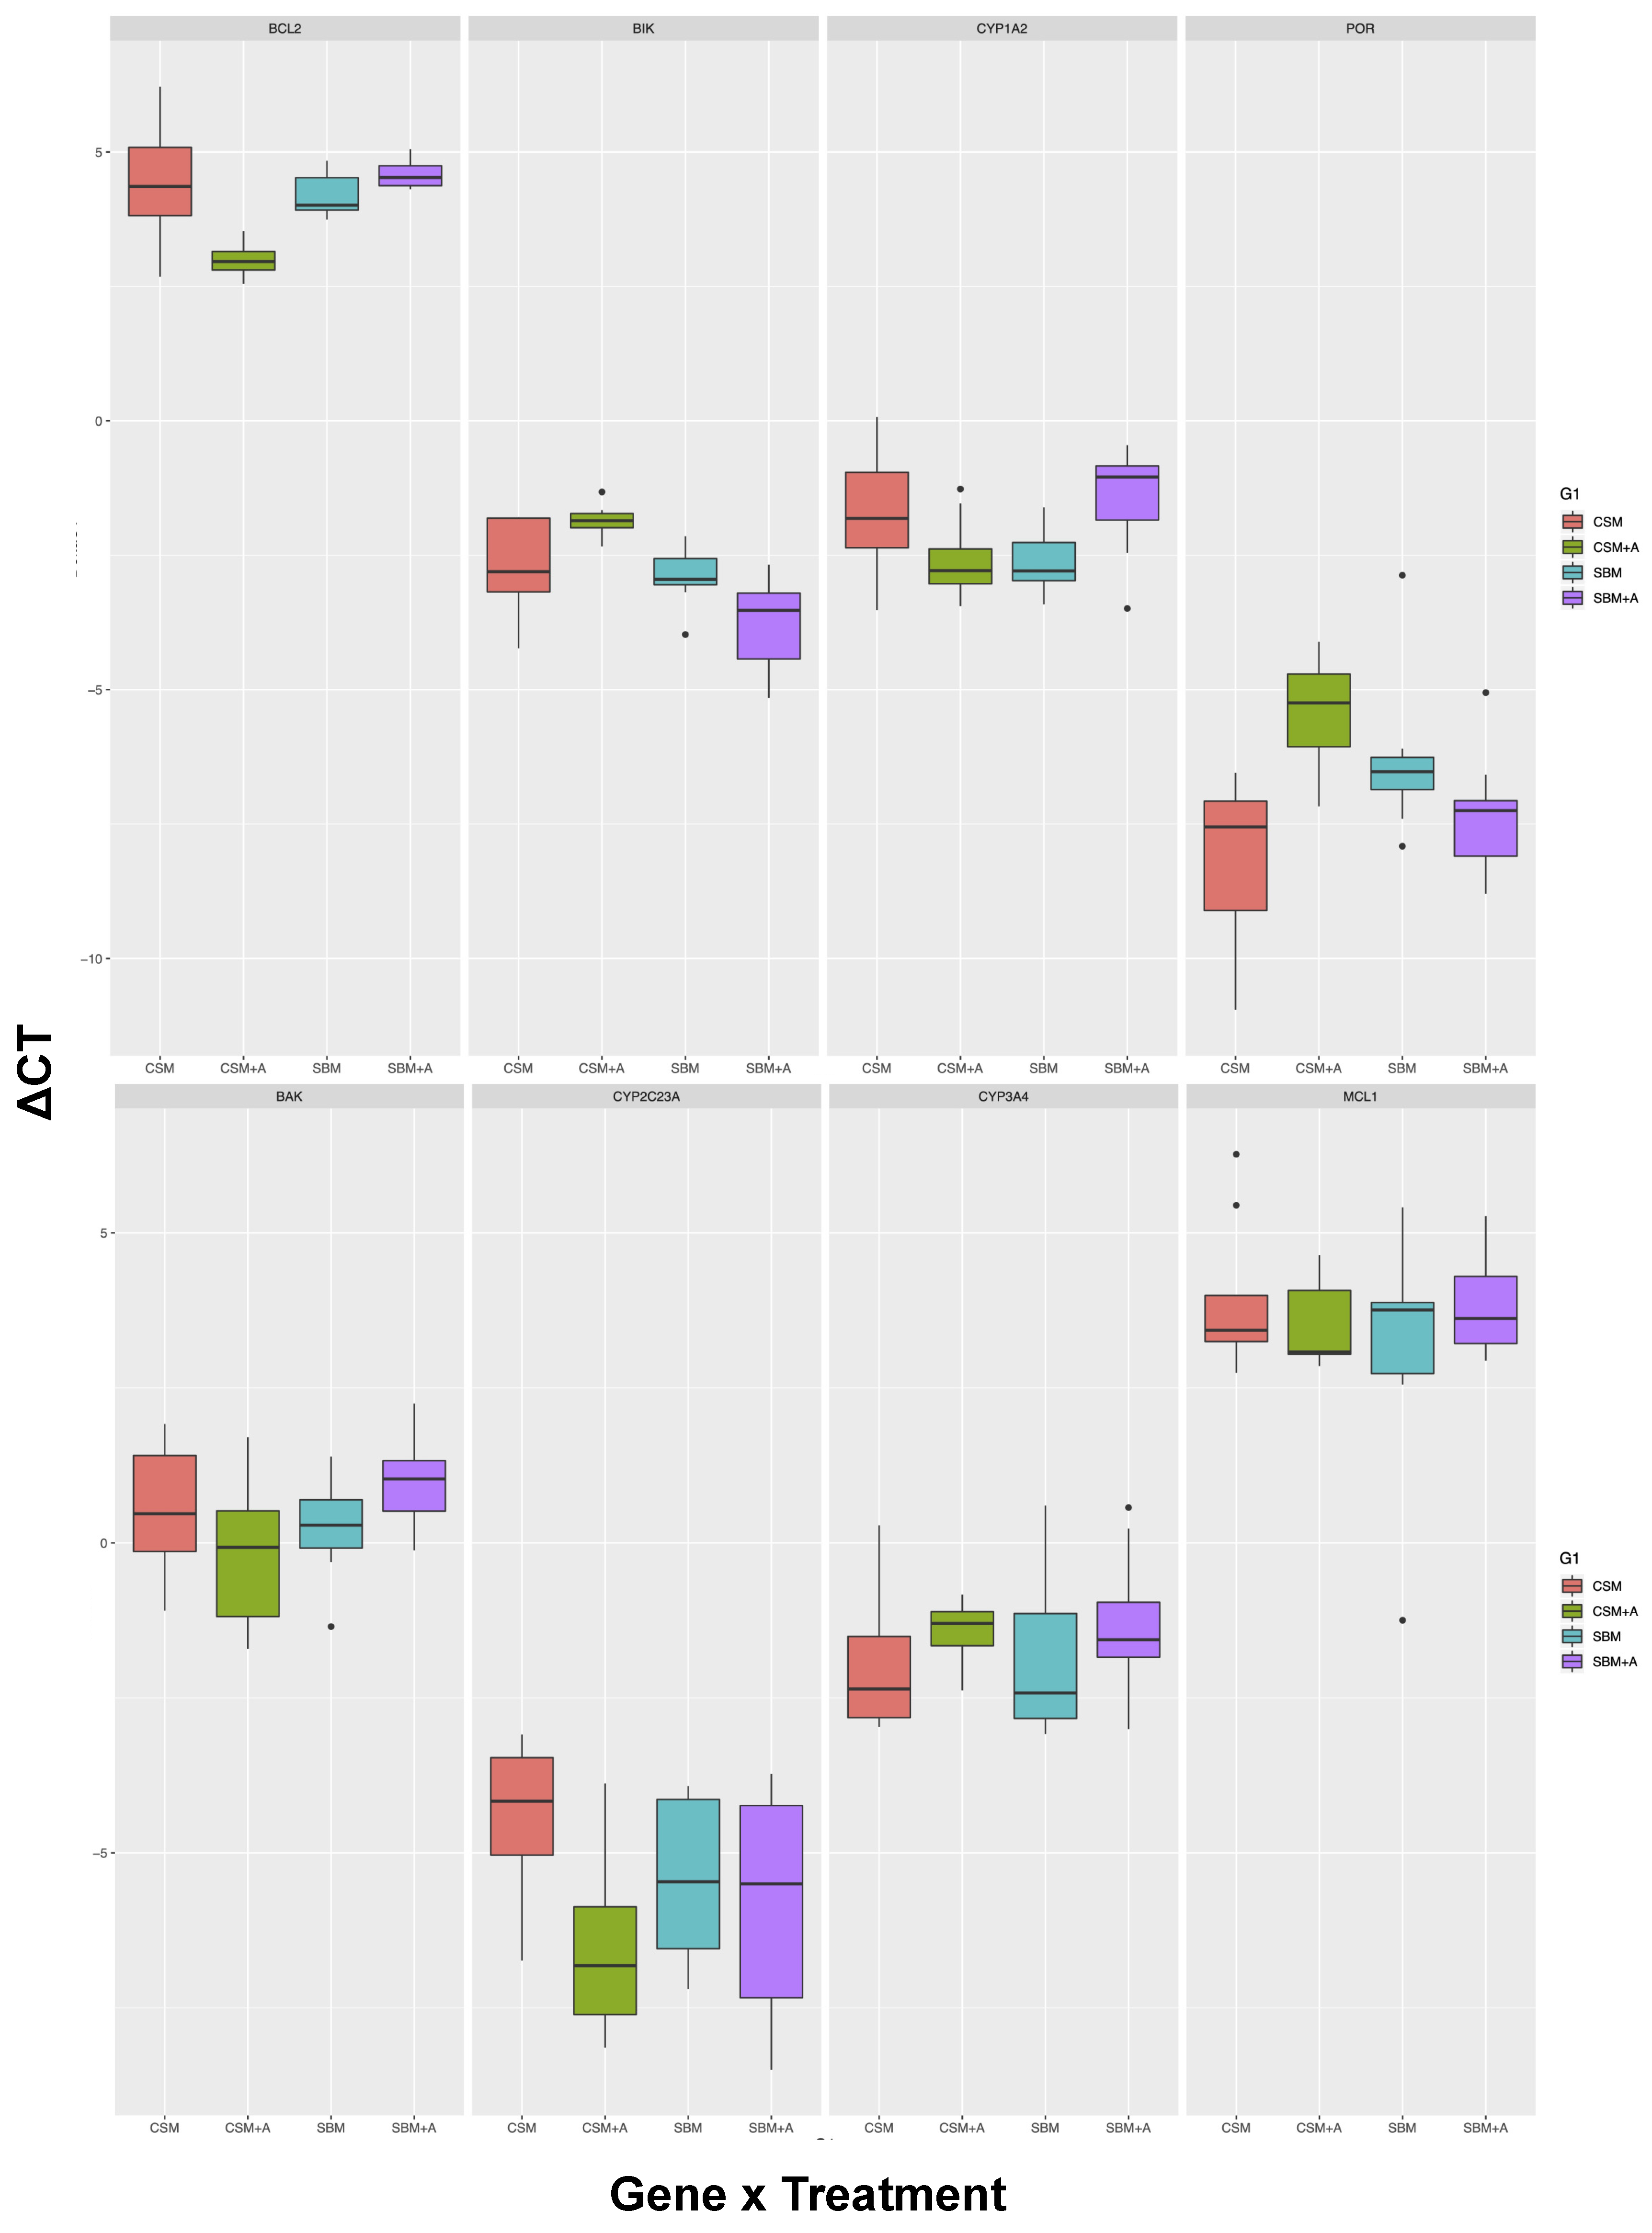
| Spleen | BAK | n.s | n.s | n.s | 0 out of 6 | All pairs not different |
| CYP1A2 | n.s | n.s | <0.01 | 0 out of 6 | All pairs not different | |
| CYP2C23A | n.s | <0.05 | n.s | 0 out of 6 | All pairs not different | |
| CYP3A4 | n.s | n.s | n.s | 0 out of 6 | All pairs not different | |
| MCL1 | n.s | n.s | n.s | 0 out of 6 | All pairs not different | |
| BCL2 | <0.01 | <0.05 | <0.001 | 3 out of 6 | SBM vs CSM, SMB + YCW vs. CSM, SBM + YCW vs. SBM | |
| BIK | <0.001 | n.s | <0.01 | 3 out of 6 | SBM vs. CSM, CSM + YCW vs. CSM, SMB + YCW vs. SBM | |
| CYP1A1 | ND | ND | ND | ND | ND | |
| POR | n.s | n.s | <0.001 | 2 out of 6 | SBM vs. CSM, SMB + YCW vs. CSM, CSM + YCW vs. SBM, SBM + YCW vs. SBM |
© 2020 by the authors. Licensee MDPI, Basel, Switzerland. This article is an open access article distributed under the terms and conditions of the Creative Commons Attribution (CC BY) license (http://creativecommons.org/licenses/by/4.0/).
Share and Cite
Al-Ajeeli, M.N.; Hubert, S.M.; Leyva-Jimenez, H.; Hashim, M.M.; Abdaljaleel, R.A.; Alsadwi, A.M.; Athrey, G.; Bailey, C.A. Impacts of Dietary Protein and Prebiotic Inclusion on Liver and Spleen Gene Expression in Hy-Line Brown Caged Layers. Animals 2020, 10, 453. https://doi.org/10.3390/ani10030453
Al-Ajeeli MN, Hubert SM, Leyva-Jimenez H, Hashim MM, Abdaljaleel RA, Alsadwi AM, Athrey G, Bailey CA. Impacts of Dietary Protein and Prebiotic Inclusion on Liver and Spleen Gene Expression in Hy-Line Brown Caged Layers. Animals. 2020; 10(3):453. https://doi.org/10.3390/ani10030453
Chicago/Turabian StyleAl-Ajeeli, Morouj N., Shawna M. Hubert, Hector Leyva-Jimenez, Mohammed M. Hashim, Raghad A. Abdaljaleel, Akhil M. Alsadwi, Giridhar Athrey, and Christopher A. Bailey. 2020. "Impacts of Dietary Protein and Prebiotic Inclusion on Liver and Spleen Gene Expression in Hy-Line Brown Caged Layers" Animals 10, no. 3: 453. https://doi.org/10.3390/ani10030453