Loci Controlling Adaptation to Heat Stress Occurring at the Reproductive Stage in Durum Wheat

 ,
,
Abstract
:
1. Introduction
2. Materials and Methods
2.1. Plant Material
2.2. Field Experiment Conditions and Phenotyping
2.3. Data Analysis
2.4. Genotyping and Marker-Trait Associations
2.5. Markers Conversion to KASP (Kompetitive Allele Specific PCR)
3. Results
3.1. Agronomic Performance of the Genotypes and Sensitivity of Traits to Heat Stress
3.2. The Traits Interrelationship under Each Environmental Condition
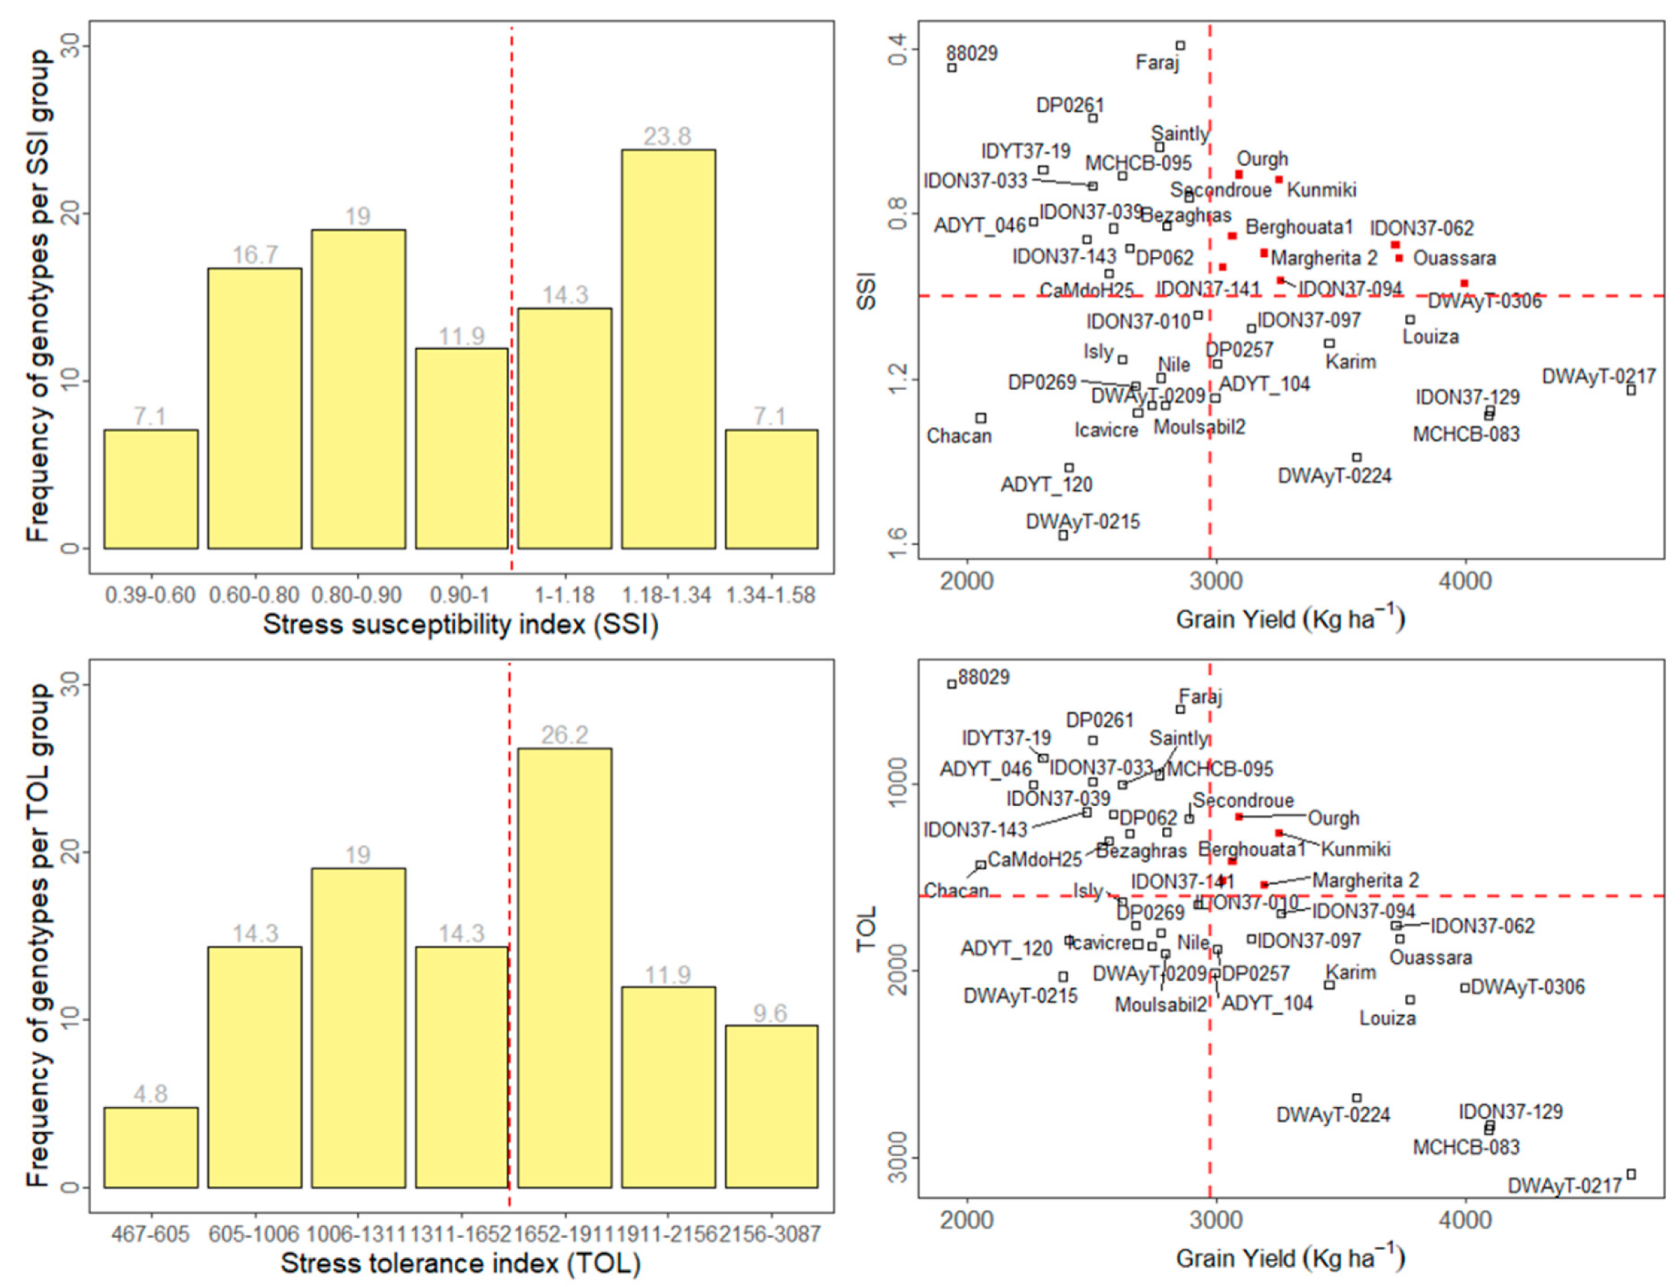
3.3. Stress Tolerance Indices
3.4. Markers Associated to Heat Stress Tolerance
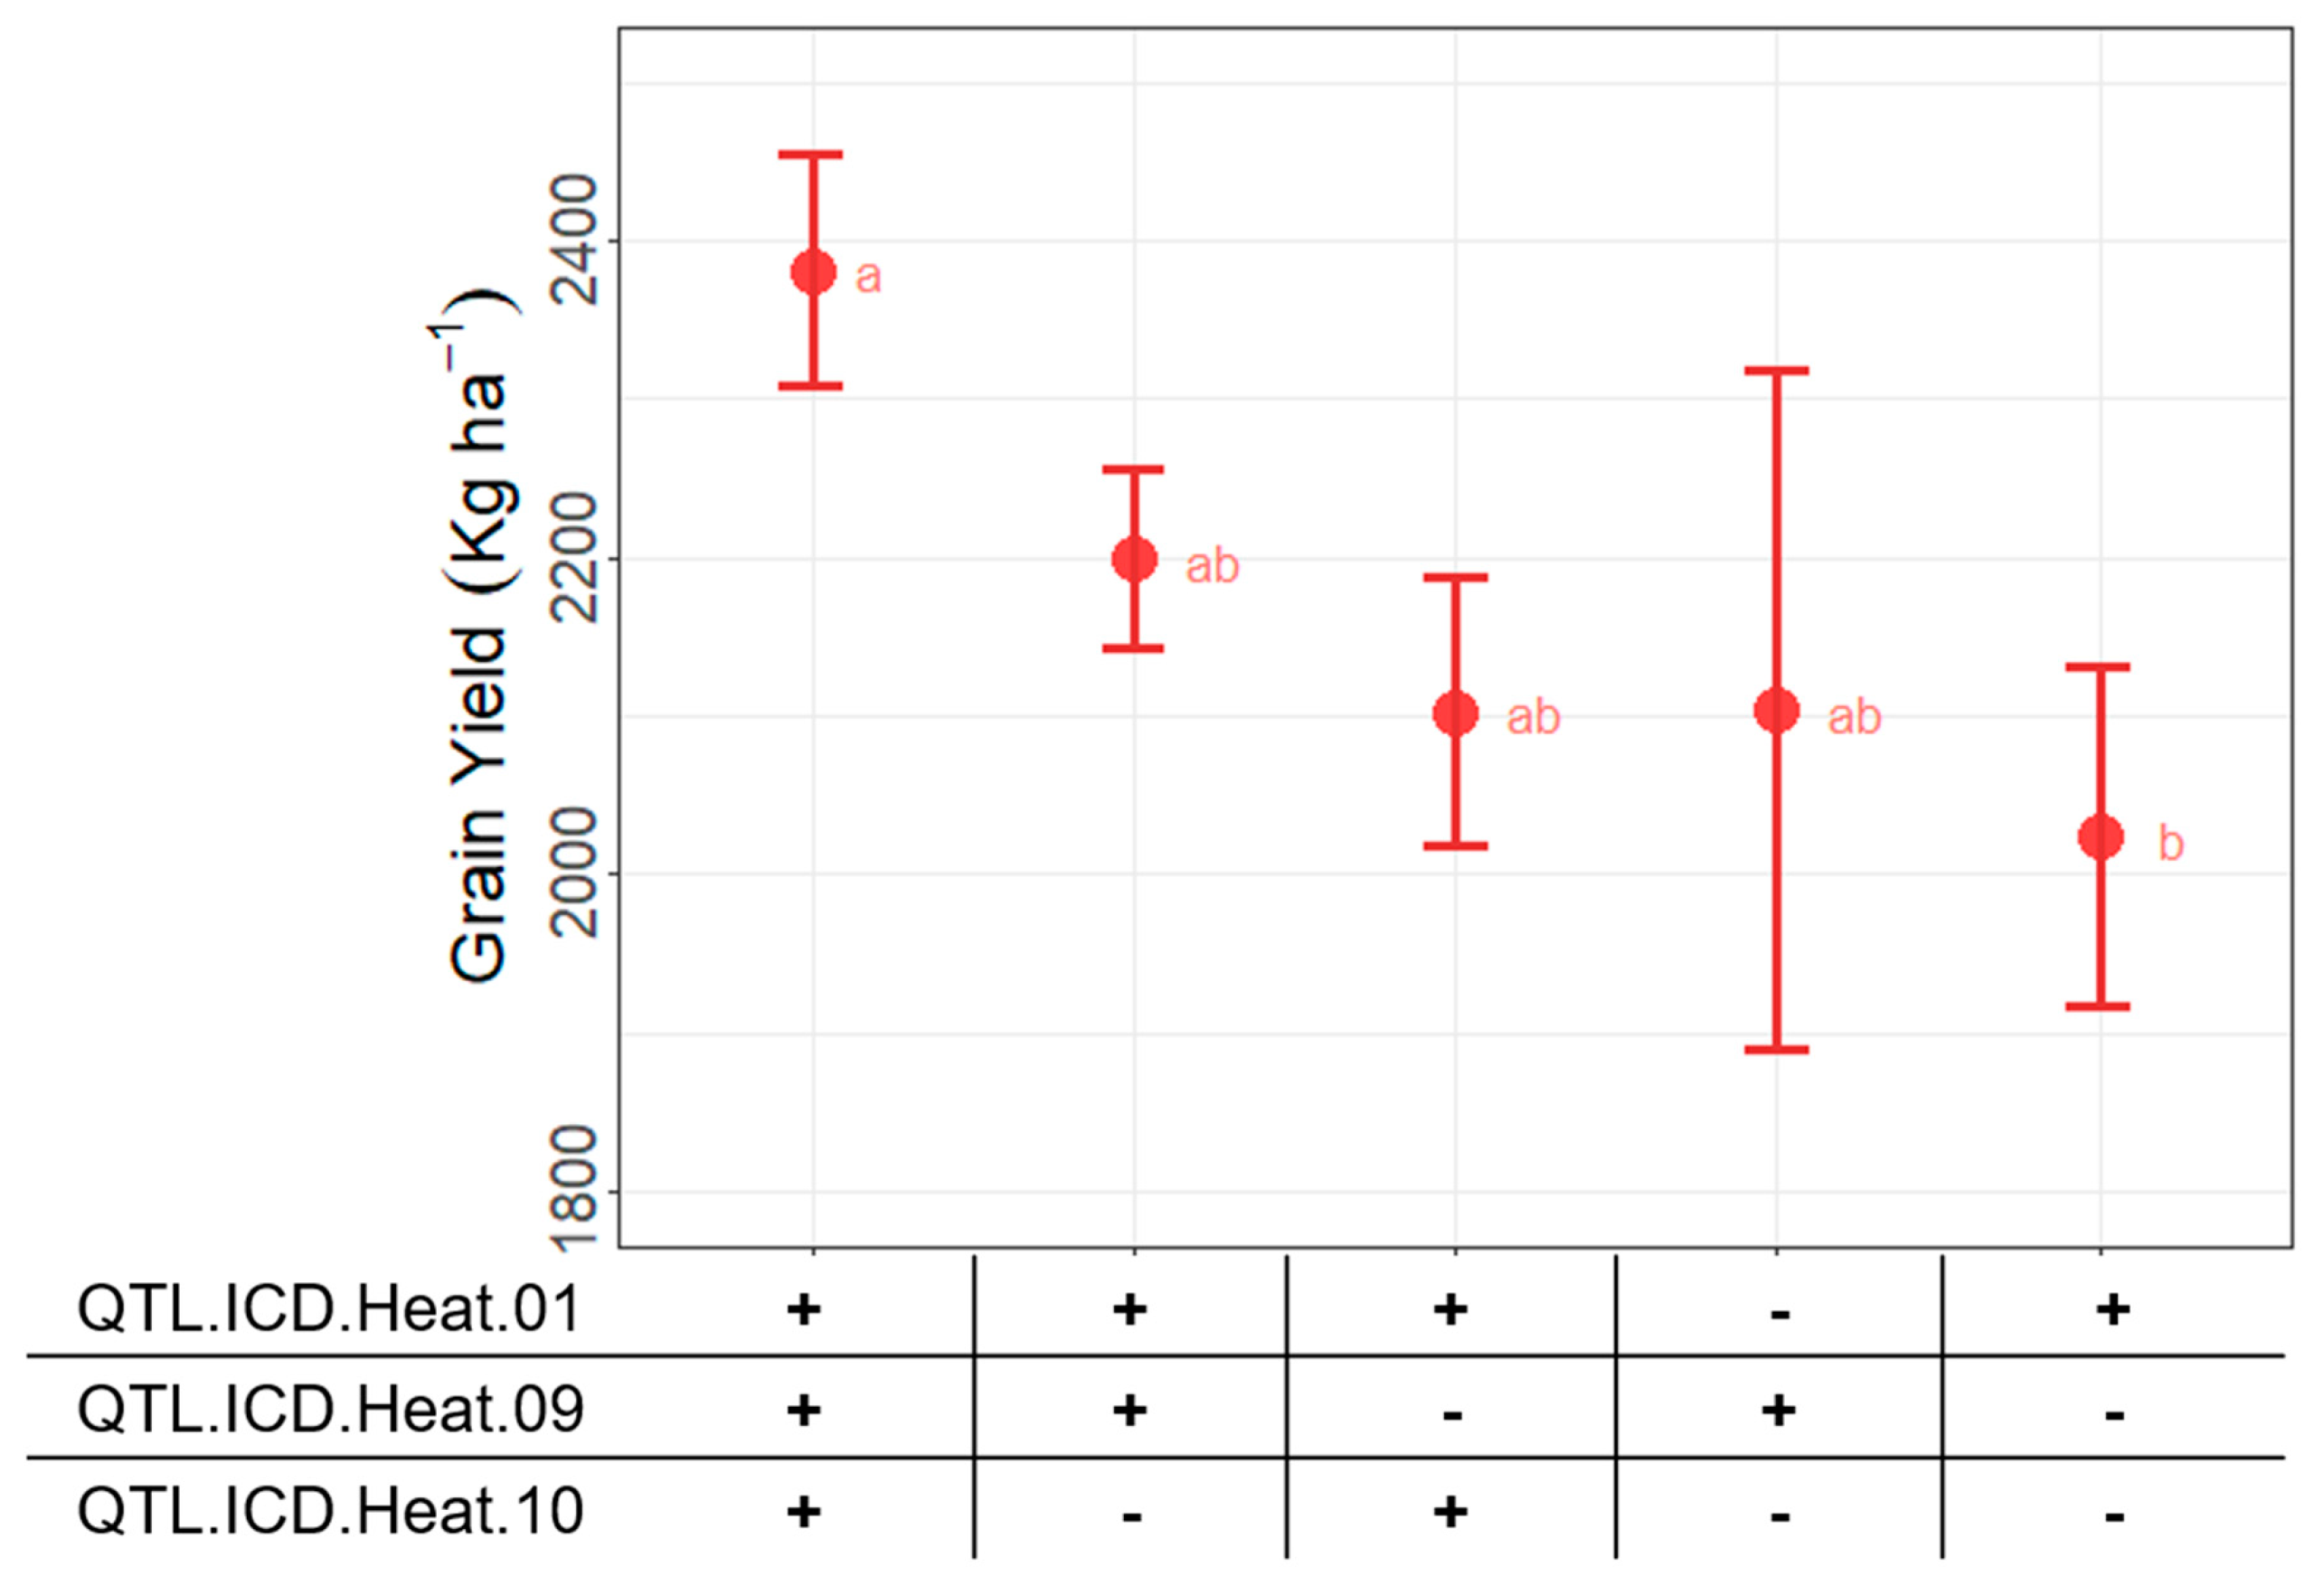
3.5. Effect of Different Allele Combination on Yield Performance
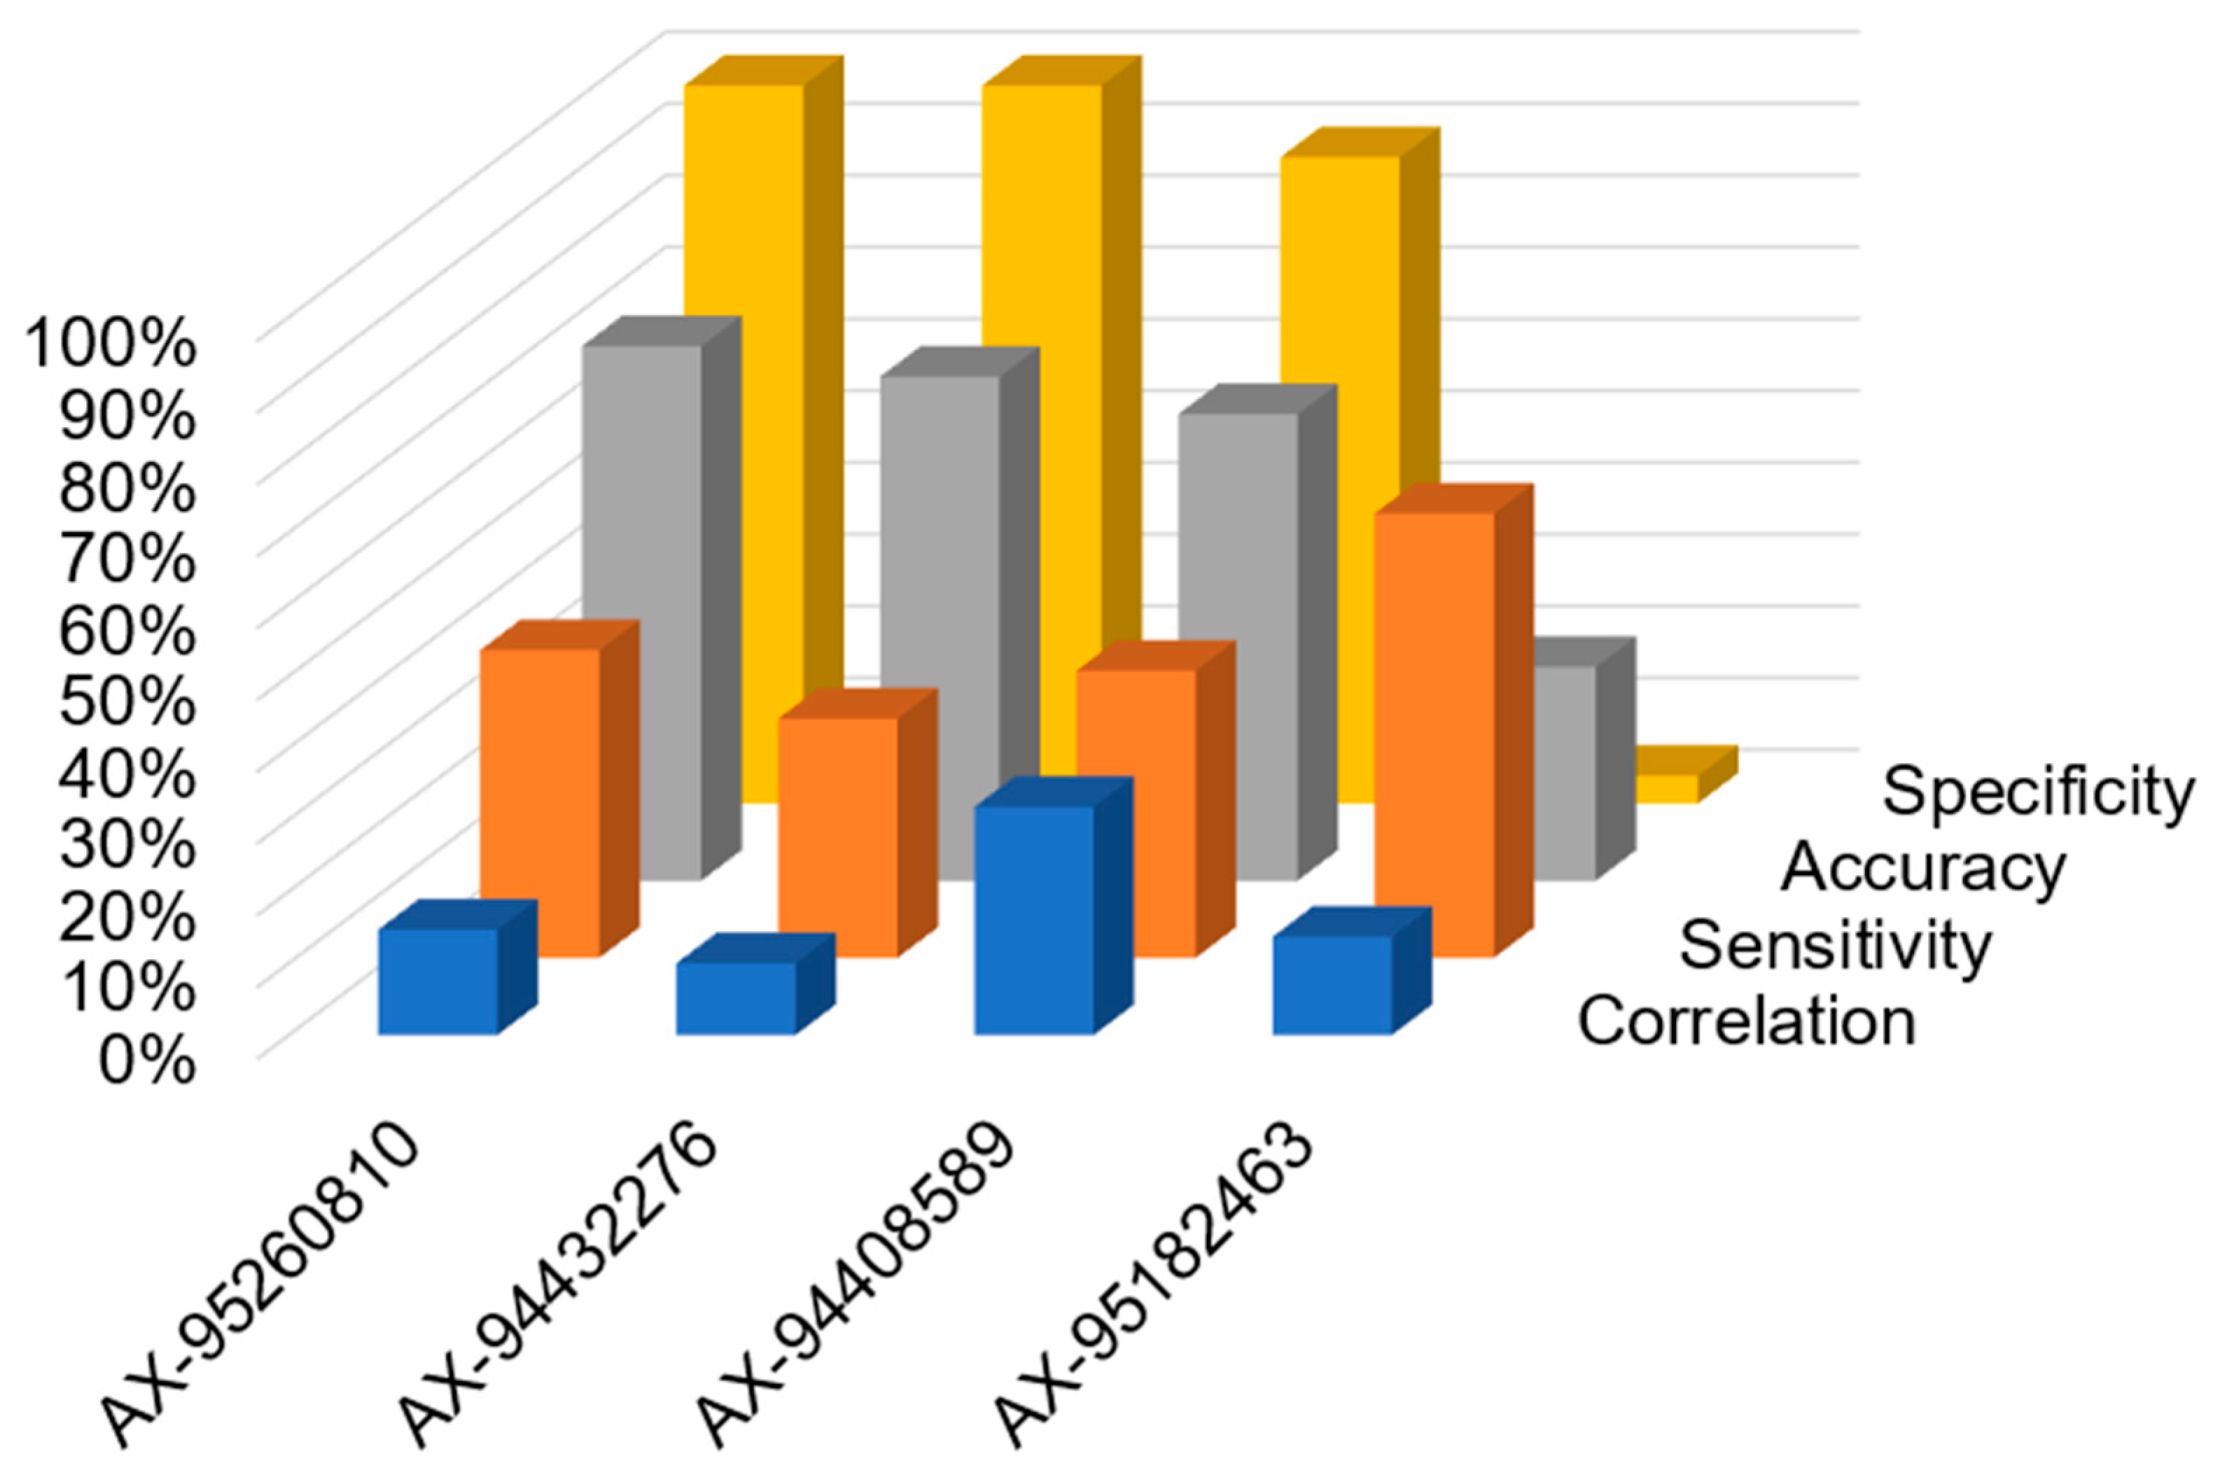
3.6. Validation of Markers for Marker Assisted Selection
4. Discussion
4.1. Evaluation of the Phenotypic Performance of Yield and Yield Components under Normal and Heat Stress Conditions
4.2. Dissection of Heat-Specific QTLs Associated with Yield-Related Traits and Stress Tolerance Indices
4.3. Pyramiding Heat-Tolerant QTLS via MAS
5. Conclusions
Supplementary Materials
Author Contributions
Funding
Acknowledgments
Conflicts of Interest
References
- Hays, D.; Mason, E.; Hwa, D.J.; Menz, M.; Reynolds, M. Expression quantitative trait loci mapping heat tolerance during reproductive development in wheat (T. aestivum L.). In Wheat Production in Stressed Environment; Buck, H.T., Nisi, J.E., Salomon, N., Eds.; Springer: Amsterdam, The Netherlands, 2007; pp. 373–382. [Google Scholar]
- Saini, H.; Aspinall, D. Abnormal sporogenesis in wheat (Triticum aestivum L.) induced by short periods of high temperature. Ann. Bot. 1982, 49, 835–846. [Google Scholar] [CrossRef]
- Plaut, Z.; Butow, B.J.; Blumenthal, C.S.; Wrigley, C.W. Transport of dry matter into developing wheat kernels and its contribution to grain yield under post-anthesis water deficit and elevated temperature. Field Crops Res. 2004, 86, 185–198. [Google Scholar] [CrossRef]
- Hunt, L.A.; van der Poorten, G.; Pararajasingham, S. Post-anthesis temperature effects on duration and rate of grain filling in some winter and spring wheats. Can. J. Plant Sci. 1991, 71, 609–617. [Google Scholar] [CrossRef]
- Wollenweber, B.; Porter, J.R.; Schellberg, J. Lack of interaction between extreme high-temperature events at vegetative and reproductive growth stages in wheat. J. Agron. Crop Sci. 2003, 189, 142–150. [Google Scholar] [CrossRef]
- Dias, A.S.; Lidon, F.C. Bread and durum wheat tolerance under heat stress: A synoptical overview. J. Food Agric. 2010, 22, 412–436. [Google Scholar] [CrossRef]
- Dolferus, R.; Ji, X.; Richards, R.A. Abiotic stress and control of grain number in cereals. Plant Sci. 2011, 181, 331–341. [Google Scholar] [CrossRef] [PubMed]
- Porter, J.R.; Gawith, M. Temperatures and the growth and development of wheat: A review. Eur. J. Agron. 1999, 10, 23–36. [Google Scholar] [CrossRef]
- Farooq, M.; Bramley, H.; Palta, J.A.; Siddique, K.H.M. Heat stress in wheat during reproductive and grain-filling phases. Crit. Rev. Plant Sci. 2011, 30, 1–17. [Google Scholar] [CrossRef]
- Liu, B.; Asseng, S.; Muller, C.; Ewert, F.; Elliott, J.; Lobell, D.B.; Rosenzweig, C. Similar estimates of temperature impacts on global wheat yield by three independent methods. Nat. Clim. Chang. 2016, 6, 1130–1136. [Google Scholar] [CrossRef]
- Lillemo, M.; van Ginkel, M.; Trethowan, R.M.; Hernandez, E.; Crossa, J. Differential adaptation of CIMMYT bread wheat to global high temperature environments. Crop Sci. 2005, 45, 2443–2453. [Google Scholar] [CrossRef]
- Hansen, J.; Sato, M.; Ruedy, R. Perception of climate change. Proc. Natl. Acad. Sci. USA 2012, 109, 2415–2423. [Google Scholar] [CrossRef] [PubMed]
- United Nations Economic and Social Commission for Western Asia (ESCWA). Arab Climate Change Assessment Report—Main Report; E/ESCWA/SDPD/2017/RICCAR/Report; United Nations Publication: Beirut, Lebanon, 2017. [Google Scholar]
- Ayeneh, A.; van Ginkel, M.; Reynolds, M.P.; Ammar, K. Comparison of leaf, spike, peduncle, and canopy temperature depression in wheat under heat stress. Field Crops Res. 2002, 79, 173–184. [Google Scholar] [CrossRef]
- Yang, J.; Sears, R.G.; Gill, B.S.; Paulsen, G.M. Quantitative and molecular characterization of heat tolerance in hexaploid wheat. Euphytica 2002, 126, 275–282. [Google Scholar] [CrossRef]
- Nachit, M.M.; Elouafi, I. Durum adaptation in the Mediterranean dryland breeding: Breeding, stress physiology, and molecular markers. Crop Sci. Soc. Am. Am. Soc. Agron. CSSA 2004, 32, 203–218. [Google Scholar]
- Reynolds, M.P.; Hobbs, P.R.; Braun, H.J. Challenges to international wheat improvement. J. Agric. Sci. 2007, 145, 223–227. [Google Scholar] [CrossRef]
- Tuberosa, R. Phenotyping for drought tolerance of crops in the genomics era. Front. Physiol. 2012, 3, 347. [Google Scholar] [CrossRef] [PubMed] [Green Version]
- Reynolds, M.; Langridge, P. Physiological breeding. Curr. Opin. Plant Biol. 2016, 31, 162–171. [Google Scholar] [CrossRef] [PubMed] [Green Version]
- Vijayalakshmi, K.; Fritz, A.K.; Paulsen, G.M.; Bai, G.; Pandravada, S.; Gill, B.S. Modeling and mapping QTL for senescence-related traits in winter wheat under high temperature. Mol. Breed. 2010, 26, 163–175. [Google Scholar] [CrossRef]
- Pinto, R.S.; Reynolds, M.P.; Mathews, K.L.; McIntyre, C.L.; Olivares-Villegas, J.J.; Chapman, S.C. Heat and drought adaptive QTL in a wheat population designed to minimize confounding agronomic effects. Theor. Appl. Genet. 2010, 121, 1001–1021. [Google Scholar] [CrossRef] [Green Version]
- Bennett, D.; Reynolds, M.; Mullan, D.; Izanloo, A.; Kuchel, H.; Langridge, P.; Schnurbusch, T. Detection of two major grain yield QTL in bread wheat (Triticum aestivum L.) under heat, drought and high yield potential environments. Theor. Appl. Genet. 2012, 125, 1473–1485. [Google Scholar] [CrossRef]
- Paliwal, R.; Röder, M.S.; Kumar, U.; Srivastava, J.P.; Joshi, A.K. QTL mapping of terminal heat tolerance in hexaploid wheat (T. aestivum L.). Theor. Appl. Genet. 2012, 125, 561–575. [Google Scholar] [CrossRef] [PubMed]
- Talukder, S.K.; Babar, M.A.; Vijayalakshmi, K.; Poland, J.; Prasad, P.V.V.; Bowden, R.; Fritz, A. Mapping QTL for the traits associated with heat tolerance in wheat (Triticum aestivum L.). BMC Genet. 2014, 15, 97. [Google Scholar] [CrossRef] [PubMed]
- Shirdelmoghanloo, H.; Taylor, J.D.; Lohraseb, I.; Rabie, H.; Brien, C.; Timmins, A.; Martin, P.; Mather, D.E.; Emebiri, L.; Collins, N.C. A QTL on the short arm of wheat (Triticum aestivum L.) chromosome 3B affects the stability of grain weight in plants exposed to a brief heat shock early in grain filling. BMC Plant Biol. 2016, 16, 100. [Google Scholar] [CrossRef] [PubMed]
- Ogbonnaya, F.C.; Rasheed, A.; Okechukwu, E.C.; Jighly, A.; Makdis, F.; Wuletaw, T.; Hagras, A.; Uguru, M.I.; Agbo, C.U. Genome-wide association study for agronomic and physiological traits in spring wheat evaluated in a range of heat prone environments. Theor. Appl. Genet. 2017, 130, 1819–1835. [Google Scholar] [CrossRef] [PubMed]
- Sukumaran, S.; Reynolds, M.P.; Sansaloni, C. Genome-Wide Association Analyses Identify QTL Hotspots for Yield and Component Traits in Durum Wheat Grown under Yield Potential, Drought, and Heat Stress Environments. Front. Plant Sci. 2018, 9, 81. [Google Scholar] [CrossRef] [PubMed] [Green Version]
- Sall, A.T.; Cisse, M.; Gueye, H.; Kabbaj, H.; Ndoye, I.; Maltouf, A.F.; El-Mourid, M.; Ortiz, R.; Bassi, F.M. Heat tolerance of durum wheat (triticum durum desf.) elite germplasm tested along the Senegal river. J. Agric. Sci. 2018, 10, 217–233. [Google Scholar] [CrossRef]
- Pradhan, G.P.; Prasad, P.V.V.; Fritz, A.; Kirkham, M.B.; Gill, B.S. Effects of drought and high temperature stress on synthetic hexaploid wheat. Funct. Plant Biol. 2012, 39, 190–198. [Google Scholar] [CrossRef]
- Weldearegay, D.F.; Yan, F.; Jiang, D.; Liu, F. Independent and combined effects of soil warming and drought stress during anthesis on seed set and grain yield in two spring wheat varieties. J. Agron. Crop Sci. 2012, 198, 245–253. [Google Scholar] [CrossRef]
- Jha, U.C.; Bohra, A.; Singh, N.P. Heat stress in crop plants: Its nature, impacts and integrated breeding strategies to improve heat tolerance. Plant Breed. 2014, 133, 679–701. [Google Scholar] [CrossRef]
- Mishra, S.C.; Singh, S.K.; Patil, R.; Bhusal, N.; Malik, A.; Sareen, S. Breeding for heat tolerance in wheat. In Recent Trends on Production Strategies of Wheat in India; Shukla, R.S., Mishra, P.C., Chatrath, R., Gupta, R.K., Tomar, S.S., Sharma, I., Eds.; JNKVV, Jabalpur & ICAR-IIWBR: Karnal, Indi, 2014; pp. 15–29. [Google Scholar]
- Ni, A.; Li, H.; Zhao, Y.; Peng, H.; Hu, Z.; Xin, M.; Sun, Q. Genetic improvement of heat tolerance in wheat: Recent progress in understanding the underlying molecular mechanisms. Crop J. 2017, 6, 32–41. [Google Scholar] [CrossRef]
- Kabbaj, H.; Sall, A.T.; Al-Abdallat, A.; Geleta, M.; Amri, A.; Filali-Maltouf, A.; Bassi, F.M. Genetic diversity within a global panel of durum wheat (Triticum durum L.) landraces and modern germplasm reveals the history of alleles exchange. Front. Plant Sci. 2017, 8, 1277. [Google Scholar] [CrossRef] [PubMed]
- Sall, A.T.; Bassi, F.M.; Cisse, M.; Gueye, H.; Ndoye, I.; Filali-Maltouf, A.; Ortiz, R. Durum wheat breeding: In the heat of the Senegal river. Agriculture 2018, 8, 99. [Google Scholar] [CrossRef]
- Bates, D.; Maechler, M.; Bolker, B.; Walker, S. Fitting linear mixed-effects models using lme4. J. Stat. Softw. 2015, 67, 1–48. [Google Scholar] [CrossRef]
- R Development Core Team. R: A Language and Environment for Statistical Computing; R Foundation For Statistical Computing: Vienna, Austria, 2016. [Google Scholar]
- DeLacy, I.H.; Basford, K.E.; Cooper, M.; Bull, J.K.; McLaren, C.G. Analysis of multi-environment trials: An historical perspective. In Plant Adaptation and Crop Improvement; Cooper, M., Hammer, G.L., Eds.; CAB International: Oxfordshire, UK, 1996. [Google Scholar]
- Wickham, H. ggplot2: Elegant Graphics for Data Analysis; Springer: New York, NY, USA, 2009. [Google Scholar]
- Wei, T.; Simko, V. R package “corrplot”: Visualization of a Correlation Matrix (Version 0.84); R Foundation for Statistical Computing: Vienna, Austria, 2017. [Google Scholar]
- Wood, S.N. Generalized Additive Models: An Introduction with R, 2nd ed.; Chapman & Hall, CRC: Boca Raton, Florida, 2017; ISBN 9781498728331. [Google Scholar]
- Wood, S.N.; Pya, N.; Saefken, B. Smoothing parameter and model selection for general smooth models. J. Am. Stat. Assoc. 2016, 111, 1548–1575. [Google Scholar] [CrossRef]
- Fisher, R.A.; Maurer, R. Drought resistance in spring wheat cultivars I. grain yield responses. Aust. J. Agric. Res. 1978, 29, 897–917. [Google Scholar] [CrossRef]
- Nachit, M.M.; Ouassou, A. Association of yield potential, drought tolerance and stability of yield in Triticum turgidum var durum. In Proceedings of the 7th International Wheat Symposium, Cambridge, UK, 13–19 July 1988; pp. 867–870. [Google Scholar]
- Rosielle, A.A.; Hamblin, J. Theoretical aspects of selection for yield in stress and non-stress environments. Crop Sci. 1981, 21, 943–946. [Google Scholar] [CrossRef]
- Bivand, R.; Ono, H.; Dunlap, R.; Stigler, M. R Package Classint: Choose Univariate Class Intervals. 2018. Available online: http://cran.r-project.org/package=classInt (accessed on 10 September 2019).
- Lenth, R.; Love, J.; Maxime, H. Estimated Marginal Means, aka Least-Squares Means. 2017. Available online: http://cran.r-project.org/package=emmeans (accessed on 14 June 2019).
- Maccaferri, M.; Harris, N.S.; Twardziok, S.O.; Pasam, R.K.; Gundlach, H.; Spannagl, M.; Himmelbach, A. Durum wheat genome highlights past domestication signatures and future improvement targets. Nat. Genet. 2019, 51, 885–895. [Google Scholar] [CrossRef] [PubMed] [Green Version]
- Bradbury, P.J.; Zhang, Z.; Kroon, D.E.; Casstevens, T.M.; Ramdoss, Y.; Buckler, E.S. TASSEL: Software for association mapping of complex traits in diverse samples. Bioinformatics 2007, 23, 2633–2635. [Google Scholar] [CrossRef]
- Jujumaan. Estimating and Plotting the Decay of Linkage Disequilibrium. Available online: https://jujumaan.com/2017/07/15/linkage-disequilibrium-decay-plot/ (accessed on 15 July 2017).
- Bassi, F.; Brahmi, H.; Sabraoui, A.; Amri, A.; Nsarellah, N.; Nachit, M.M.; Al-Abdallat, A.; Chen, M.S.; Lazraq, A.; El Bouhssini, M. Genetic identification of loci for Hessian fly resistance in durum wheat. Mol. Breed. 2019, 39, 24. [Google Scholar] [CrossRef] [Green Version]
- Sukumaran, S.; Xiang, W.; Bean, S.R.; Pedersen, J.F.; Kresovich, S.; Tuinstra, M.R.; Yu, J. Association mapping for grain quality in a diverse sorghum collection. Plant Genom. J. 2012, 5, 126–135. [Google Scholar] [CrossRef]
- Duggal, P.; Gillanders, E.M.; Holmes, T.N.; Bailey-Wilson, J.E. Establishing an adjusted p-value threshold to control the family-wide type 1 error in genome wide association studies. BMC Genom. 2008, 9, 516. [Google Scholar] [CrossRef] [PubMed]
- Pearson, K. Notes on regression and inheritance in the case of two parents. Proc. R. Soc. Lond. 1985, 58, 240–242. [Google Scholar]
- Sofield, I.; Evans, L.T.; Cook, M.G.; Wardlaw, I.F. Factors influencing the rate and duration of grain filling in wheat. Aust. J. Plant Physiol. 1977, 4, 785–797. [Google Scholar] [CrossRef]
- Gooding, M.J.; Ellis, R.H.; Shewry, P.R.; Schofield, J.D. Effects of restricted water availability and increased temperature on the grain filling, drying and quality of winter wheat. J. Cereal Sci. 2003, 37, 295–309. [Google Scholar] [CrossRef]
- Corbellini, M.; Canevara, M.G.; Mazza, L.; Ciaffi, M.; Lafiandra, D.; Tozzi, L.; Borghi, B. Effect of the duration and intensity of heat shock during grain filling on dry matter and protein accumulation, technological quality and protein composition in bread and durum wheat. Aust. J. Plant Physiol. 1997, 24, 245–250. [Google Scholar] [CrossRef]
- Corbellini, M.; Mazza, L.; Ciaffi, M.; Lafiandra, D.; Borghi, B. Effect of heat shock during grain filling on protein composition and technological quality of wheats. Euphytica 1998, 100, 147–154. [Google Scholar] [CrossRef]
- Ugarte, C.; Calderini, D.F.; Slafer, G.A. Grain weight and grain number responsiveness to pre-anthesis temperature in wheat, barley and triticale. Field Crops Res. 2006, 100, 240–248. [Google Scholar] [CrossRef]
- Nachit, M.M. Durum breeding for Mediterranean drylands of North Africa and West Asia. In Durum Wheat: Challenges and Opportunities; Rajaram, S., Saari, E., Hettel, G.P., Eds.; Wheat Special Report; CIMMYT: Ciudad Obregon, Mexico, 1992; Volume 9. [Google Scholar]
- Barnabas, B.; Jager, K.; Feher, A. The effect of drought and heat stress on reproductive processes in cereals. Plant Cell Environ. 2008, 31, 11–38. [Google Scholar] [CrossRef]
- Reynolds, M.; Foulkes, J.; Furbank, R.; Griffiths, S.; King, J.; Murchie, E.; Parry, M.; Slafer, G. Achieving yield gains in wheat. Plant Cell Environ. 2012, 35, 1799–1823. [Google Scholar] [CrossRef]
- Masoni, A.; Ercoli, L.; Mariotti, M.; Arduini, I. Post-anthesis accumulation and remobilization of dry matter, nitrogen and phosphorus in durum wheat as affected by soil type. Eur. J. Agron. 2007, 26, 179–186. [Google Scholar] [CrossRef]
- Prasad, P.V.V.; Pisipati, S.R.; Mutava, R.N.; Tuinstra, M.R. Sensitivity of grain sorghum to high temperature stress during reproductive development. Crop Sci. 2008, 48, 1911–1917. [Google Scholar] [CrossRef]
- Sukumaran, S.; Lopes, M.; Dreisigacker, S.; Reynolds, M. Genetic analysis of multi-environmental spring wheat trials identifies genomic regions for locus-specific trade-offs for grain weight and grain number. Theor. Appl. Genet 2017, 131, 1–14. [Google Scholar] [CrossRef]
- Sio-Se Mardeh, A.; Ahmadi, A.; Poustini, K.; Mohammadi, V. Evaluation of drought resistance indices under various environmental conditions. Field Crops Res. 2006, 98, 222–229. [Google Scholar] [CrossRef]
- Dodig, D.; Zoric, M.; Kandic, V.; Perovic, D.; Surlan-Momirovic, G. Comparison of responses to drought stress of 100 wheat accessions and landraces to identify opportunities for improving wheat drought resistance. Plant Breed. 2012, 131, 369–379. [Google Scholar] [CrossRef]
- Mason, R.E.; Mondal, S.; Beecher, F.W.; Pacheco, A.; Jampala, B.; Ibrahim, A.M.H.; Hays, D.B. QTL associated with heat susceptibility index in wheat (Triticum aestivum L.) under short-term reproductive stage heat stress. Euphytica 2010, 174, 423–436. [Google Scholar] [CrossRef]
- Mason, R.E.; Mondal, S.; Beecher, F.W.; Hays, D.B. Genetic loci linking improved heat tolerance in wheat (Triticum aestivum L.) to lower leaf and spike temperature under controlled conditions. Euphytica 2011, 180, 181–194. [Google Scholar] [CrossRef]
- Orcen, N.; Altinbas, M. Use of some stress tolerance indices for late drought in spring wheat. Fresenius Environ. Bull. 2014, 24. [Google Scholar]
- Clarke, J.M.; Depauw, R.M.; Townley-Smith, T.F. Evaluation of methods for quantification of drought tolerance in wheat. Crop Sci. 1992, 32, 723–728. [Google Scholar] [CrossRef]
- Rekika, D.; Kara, Y.; Souyris, I.; Nachit, M.M.; Asbati, A.; Monneveux, P. The tolerance of PSII to high temperatures in durum wheat (T. Turgidum conv. Durum): Genetic variation and relationship with yield under heat stress. Cereal Res. Commun. 2000, 28, 395–402. [Google Scholar]
- Lopes, M.S.; Reynolds, M.P.; Jalal-Kamali, M.R.; Moussa, M.; Feltaous, Y.; Tahir, I.S.A.; Barma, N.; Vargas, M.; Mannes, Y.; Baum, M. The yield correlations of selectable physiological traits in a population of advanced spring wheat lines grown in warm and drought environments. Field Crops. Res. 2012, 128, 129–136. [Google Scholar] [CrossRef]
- Reynolds, M.; Tuberosa, R. Translational research impacting on crop productivity in drought-prone environments. Curr. Opin. Plant Biol. 2008, 11, 171–179. [Google Scholar] [CrossRef] [PubMed]
- Heidari, B.; Sayed-Tabatabaei, B.E.; Saeidi, G.; Kearsey, M.; Suenaga, K. Mapping QTL for grain yield, yield components, and spike features in a doubled haploid population of bread wheat. Genome 2011, 54, 517–527. [Google Scholar] [CrossRef] [PubMed]
- Tahmasebi, S.; Heidari, B.; Pakniyat, H.; McIntyre, C.L. Mapping QTLs associated with agronomic and physiological traits under terminal drought and heat stress conditions in wheat (Triticum aestivum L.). Genome 2017, 60, 26–45. [Google Scholar] [CrossRef] [PubMed]
- Quarrie, S.A.; Steed, A.; Calestani, C.; Semikhodskii, A.; Lebreton, C.; Chinoy, C.; Schondelmaier, J. A high-density genetic map of hexaploid wheat (Triticum aestivum L.) from the cross Chinese Spring x SQ1 and its use to compare QTL for grain yield across a range of environments. Theor. Appl. Genet. 2005, 110, 865–880. [Google Scholar] [CrossRef] [PubMed]
- Acuna-Galindo, M.A.; Mason, R.E.; Subrahmanyam, N.K.; Hays, D. Meta-analysis of wheat QTL regions associated with adaptation to drought and heat stress. Crop Sci. 2014, 55, 477–492. [Google Scholar] [CrossRef]
- McIntyre, C.L.; Mathews, K.L.; Rattey, A.; Drenth, J.; Ghaderi, M.; Reynolds, M.; Chapman, C.S.; Shorter, R. Molecular detection of genomic regions associated with grain yield and yield components in an elite bread wheat cross evaluated under irrigated and rainfed conditions. Theor. Appl. Genet. 2010, 120, 527–541. [Google Scholar] [CrossRef] [PubMed]
- Araus, J.L.; Bort, J.; Steduto, P.; Villegas, D.; Royo, C. Breeding cereals for Mediterranean conditions: Ecophysiological clues for biotechnology application. Ann. Appl. Biol. 2003, 142, 129–141. [Google Scholar] [CrossRef]
- Slafer, G.A.; Araus, J.L.; Royo, C.; García Del Moral, L.F. Promising eco-physiological traits for genetic improvement of cereal yields in Mediterranean environments. Ann. Appl. Biol. 2005, 146, 61–70. [Google Scholar] [CrossRef]
- McCartney, C.A.; Somers, D.J.; Humphreys, D.G.; Lukow, O.; Ames, N.; Noll, J.; Cloutier, S.; McCallum, B.D. Mapping quantitative trait loci controlling agronomic traits in the spring wheat cross RL4452 9 ‘AC Domain’. Genome 2005, 48, 870–883. [Google Scholar] [CrossRef]
- Collins, N.C.; Tardieu, F.; Tuberosa, R. Quantitative trait loci and crop performance under abiotic stress: Where do we stand? Plant Physiol. 2008, 147, 469–486. [Google Scholar] [CrossRef]
- Rebetzke, G.J.; van Herwaarden, A.F.; Jenkins, C.; Weiss, M.; Lewis, D.; Ruuska, S.; Tabe, L.; Fettell, N.A.; Richards, R.A. Quantitative trait loci for water soluble carbohydrates and associations with agronomic traits in wheat. Aust. J. Agric. Res. 2008, 59, 891–905. [Google Scholar] [CrossRef]
- Zaim, M.; El Hassouni, K.; Gamba, F.; Filali-Maltouf, A.; Belkadi, B.; Ayed, S.; Amri, A.; Nachit, M.; Taghouti, M.; Bassi, F. Wide crosses of durum wheat (Triticum durum Desf.) reveal good disease resistance, yield stability, and industrial quality across Mediterranean sites. Field Crops Res. 2017, 214, 219–227. [Google Scholar] [CrossRef]
- Bassi, F.; Sanchez-Garcia, M. Adaptation and stability analysis of ICARDA durum wheat elites across 18 countries. Crop Sci. 2017, 57, 2419–2430. [Google Scholar] [CrossRef]
- Graziani, M.; Maccaferri, M.; Royo, C.; Salvatorelli, F.; Tuberosa, R. QTL dissection of yield components and morpho-physiological traits in a durum wheat elite population tested in contrasting thermo-pluviometric conditions. Crop Pasture Sci. 2014, 65, 80–95. [Google Scholar] [CrossRef]


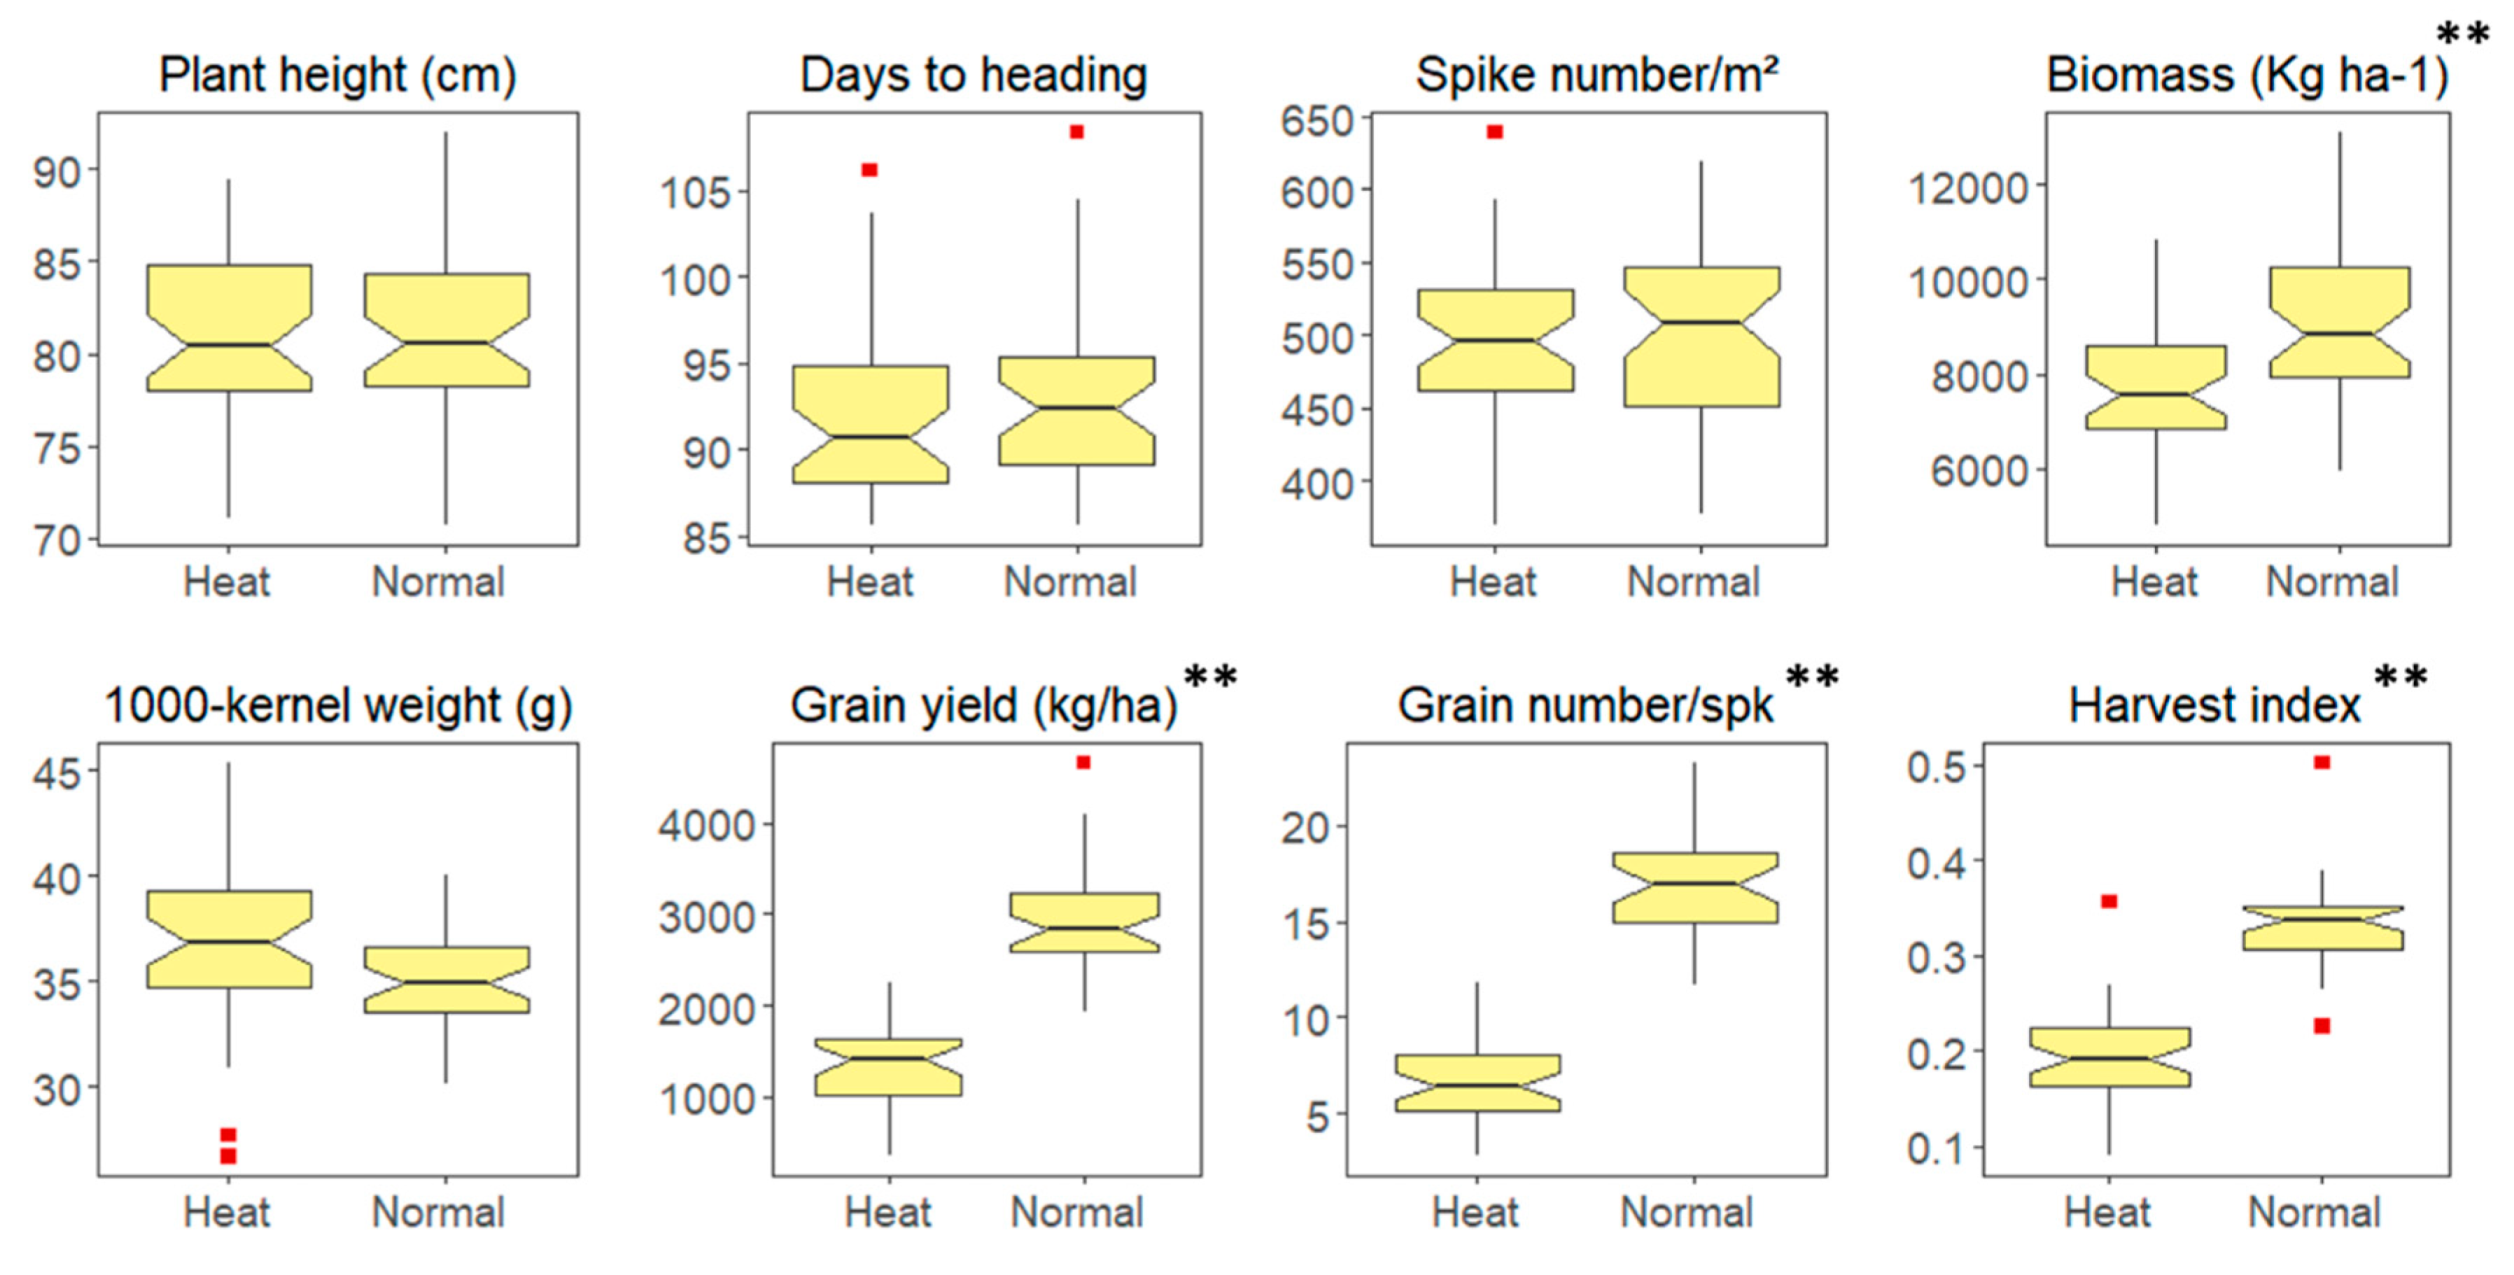
| Trait | Acronym | Mean | Min | Max | Genetic Variance (%) | Treatment Variance (%) | G × T (%) | h2 |
|---|---|---|---|---|---|---|---|---|
| Days to heading | DTH | 92 | 71 | 109 | 34 ** | 1ns | 1ns | 0.78 |
| Plant height (cm) | PH | 81 | 71 | 92 | 60 ** | 1ns | 16ns | 0.76 |
| Biomass (kg ha−1) | Biom | 8407 | 4792 | 13,108 | 49 ** | 7 ** | 7 ** | 0.79 |
| Spikes number per m2 | Spkm2 | 524 | 370 | 640 | 14 ** | 1ns | 2 ** | 0.50 |
| Grain yield (kg ha−1) | GY | 2171 | 352 | 4658 | 30 ** | 44 ** | 12 * | 0.63 |
| Harvest index (%) | HI | 26 | 1 | 50 | 15 ** | 34 ** | 13ns | 0.20 |
| Thousand kernel weight (g) | TKW | 36 | 27 | 45 | 48 ** | 1ns | 18 ** | 0.72 |
| Grain number per spike | GNSpk | 13 | 3 | 24 | 19 * | 29 ** | 16 ** | 0.46 |
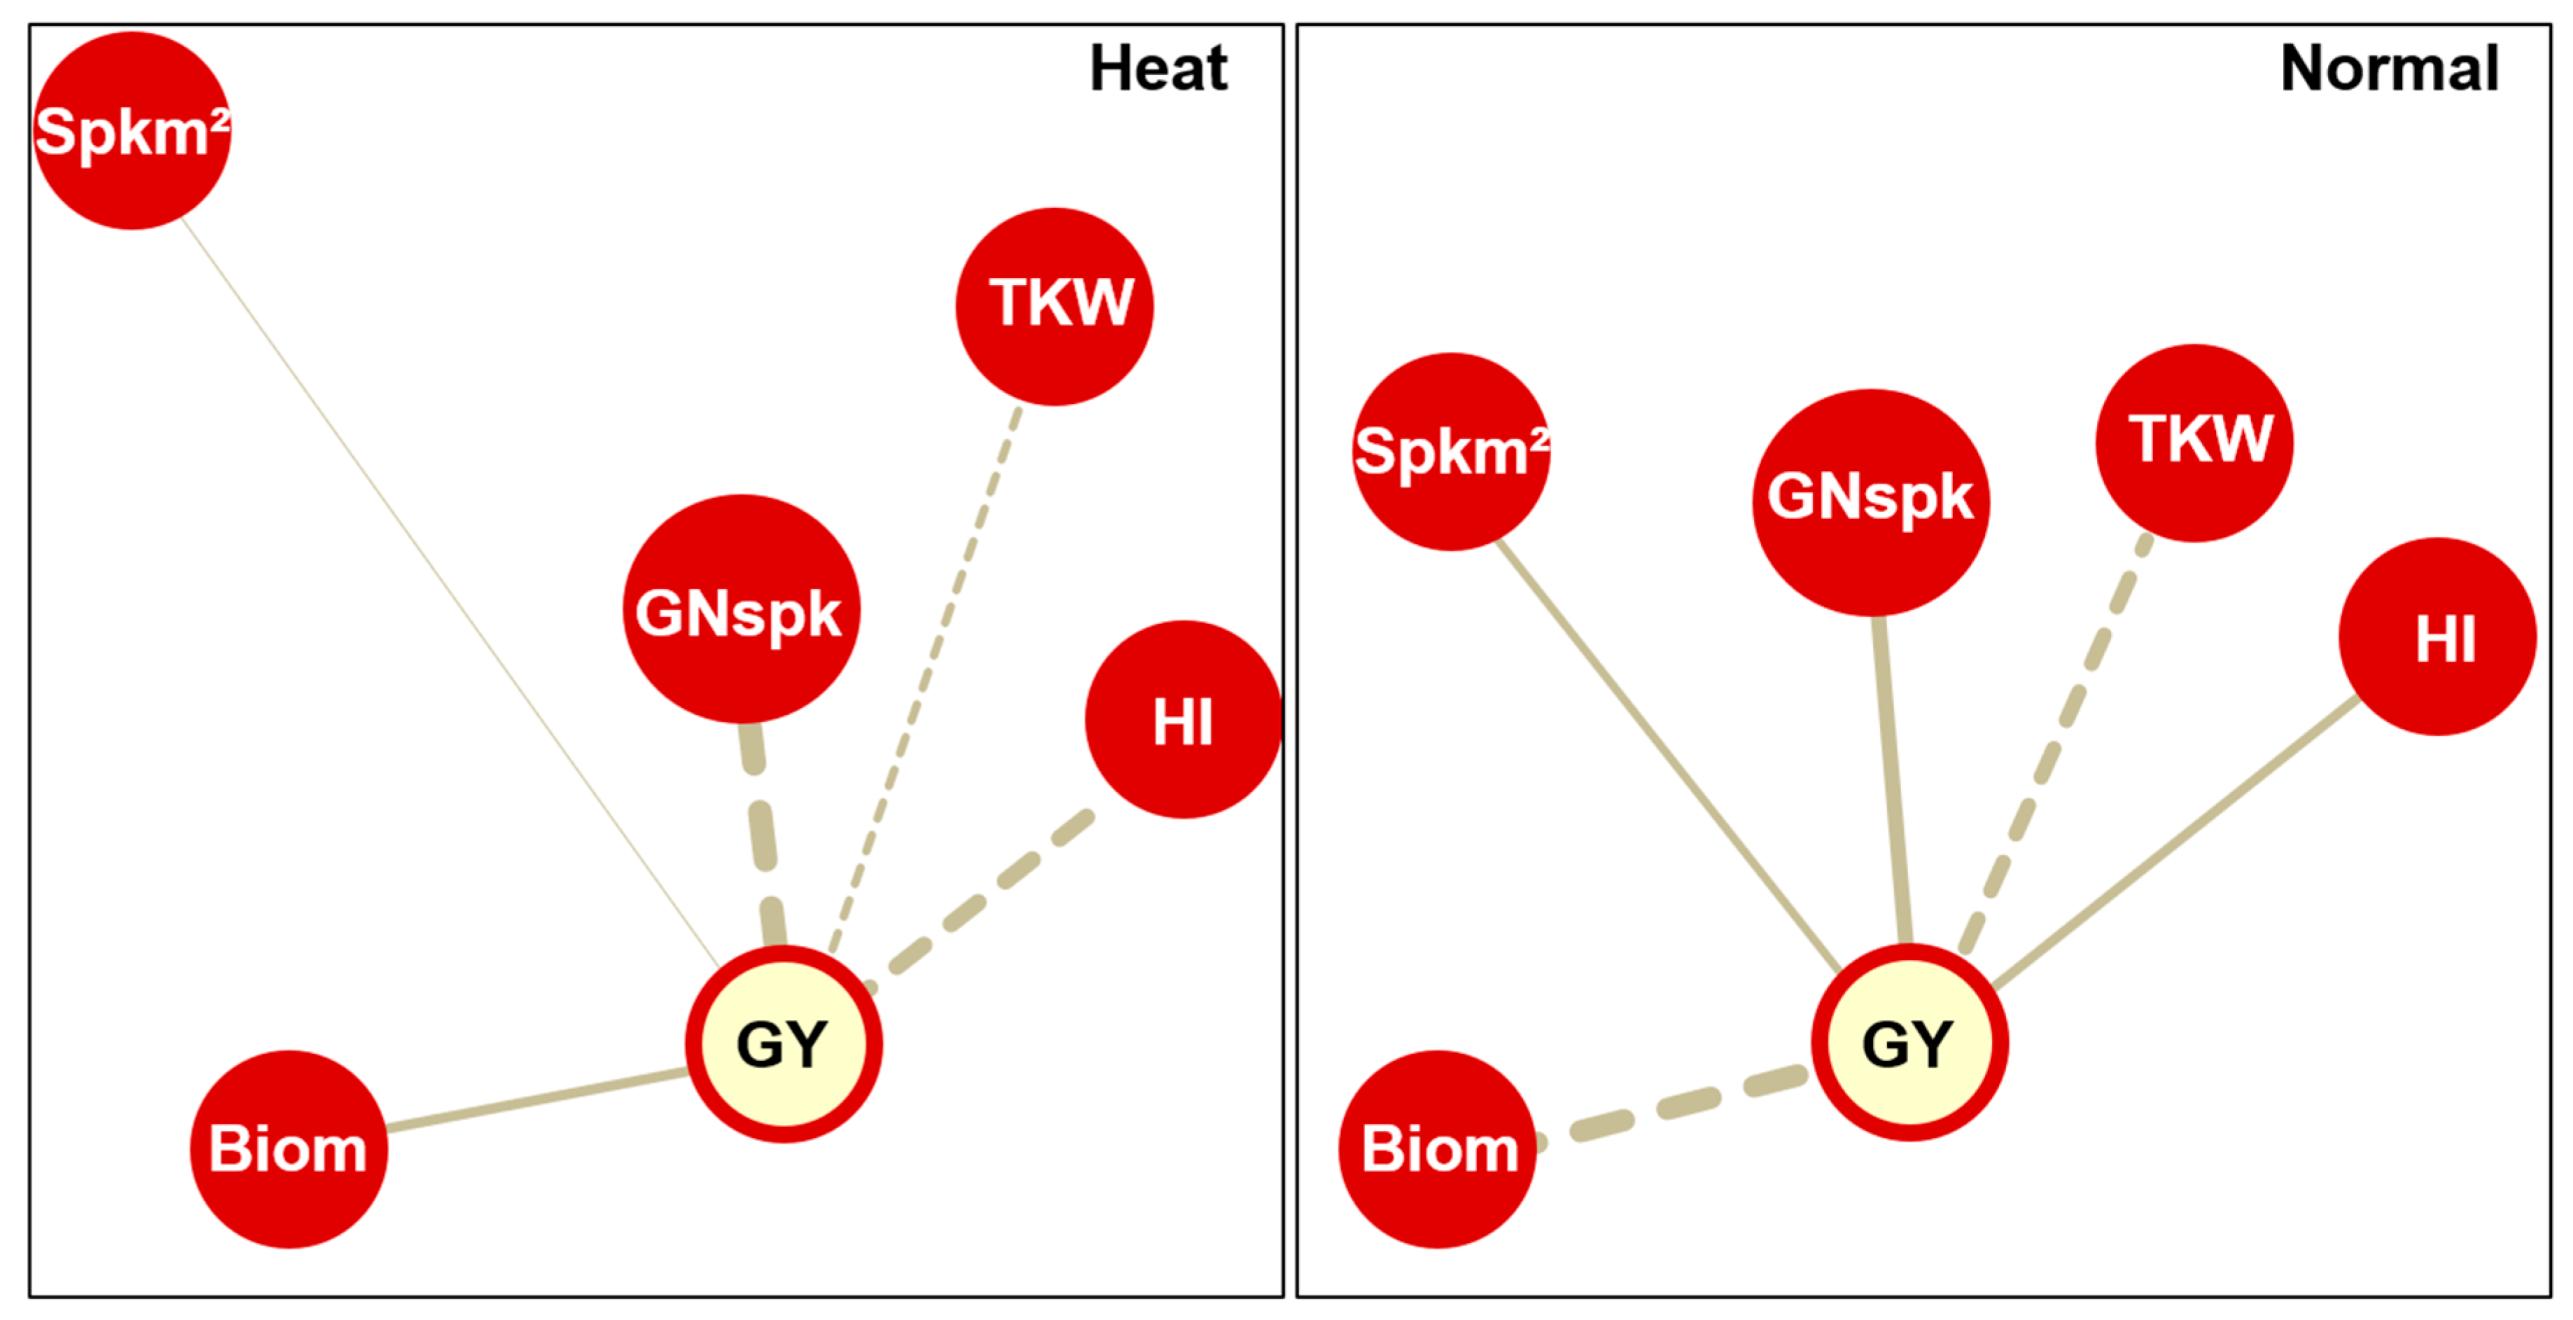
| Locus | Trait | Chr. † | Main Marker | Position ‡ (bp) | Local LD (Mbp) | Max LOD | Max r2 | Heat Stress | Normal | Indices |
|---|---|---|---|---|---|---|---|---|---|---|
| QTL.ICD.Heat.01 | GNspk, HI, TOL-GY | 1AL | AX-94863732 | 570,040,339 | 31.7 | 3.38 | 0.27 | * | * | |
| QTL.ICD.Heat.02 | GNspk, HI | 1BL | AX-94447402 | 632,403,981 | 43.1 | 3.38 | 0.27 | * | ||
| QTL.ICD.Heat.03 | GNspk, HI, SSI-GY, TOL-GY | 2AL | AX-94538070 | 748,624,588 | 36.3 | 3.06 | 0.25 | * | * | * |
| QTL.ICD.Heat.04 | GY, HI | 2BS | AX-95193898 | 6,012,904 | 36.0 | 3.67 | 0.36 | * | ||
| QTL.ICD.Heat.05 | GNspk, HI | 3AL | AX-95632723 | 562,421,267 | 75.4 | 3.39 | 0.27 | * | * | |
| QTL.ICD.Heat.06 | GNspk, HI | 3BL | AX-95174625 | 788,551,042 | 85.4 | 3.38 | 0.27 | * | * | |
| QTL.ICD.Heat.07 | GNspk | 5AS | AX-95247611 | 27,923,949 | 108.7 | 3.38 | 0.27 | * | ||
| QTL.ICD.Heat.08 § | SSI-GY, TOL-GY | 5AS | AX-94631521 | 421,078,546 | 41.3 | 4.93 | 0.45 | * | ||
| QTL.ICD.Heat.09 § | GNspk, SSI-GY, TOL-GY | 5BS | AX-95182463 | 427,098,066 | 50.3 | 4.17 | 0.37 | * | * | |
| QTL.ICD.Heat.10 § | GNspk, HI, Biom, SSI-GY | 6BS | AX-94408589 | 157,777,006 | 56.0 | 3.20 | 0.36 | * | * | |
| QTL.ICD.Heat.11 | GNspk | 7AL | AX-95074729 | 660,833,752 | 153.6 | 3.60 | 0.29 | * | ||
| QTL.ICD.Heat.12 | GNspk, HI | 7AS | AX-94381852 | 16,943,364 | 44.8 | 3.42 | 0.37 | * |
© 2019 by the authors. Licensee MDPI, Basel, Switzerland. This article is an open access article distributed under the terms and conditions of the Creative Commons Attribution (CC BY) license (http://creativecommons.org/licenses/by/4.0/).
Share and Cite
El Hassouni, K.; Belkadi, B.; Filali-Maltouf, A.; Tidiane-Sall, A.; Al-Abdallat, A.; Nachit, M.; Bassi, F.M. Loci Controlling Adaptation to Heat Stress Occurring at the Reproductive Stage in Durum Wheat. Agronomy 2019, 9, 414. https://doi.org/10.3390/agronomy9080414
El Hassouni K, Belkadi B, Filali-Maltouf A, Tidiane-Sall A, Al-Abdallat A, Nachit M, Bassi FM. Loci Controlling Adaptation to Heat Stress Occurring at the Reproductive Stage in Durum Wheat. Agronomy. 2019; 9(8):414. https://doi.org/10.3390/agronomy9080414
Chicago/Turabian StyleEl Hassouni, Khaoula, Bouchra Belkadi, Abdelkarim Filali-Maltouf, Amadou Tidiane-Sall, Ayed Al-Abdallat, Miloudi Nachit, and Filippo M. Bassi. 2019. "Loci Controlling Adaptation to Heat Stress Occurring at the Reproductive Stage in Durum Wheat" Agronomy 9, no. 8: 414. https://doi.org/10.3390/agronomy9080414