Article

Hyperspectral Non-Imaging Measurements and Perceptron Neural Network for Pre-Harvesting Assessment of Damage Degree Caused by Septoria/Stagonospora Blotch Diseases of Wheat

by
Sofia V. Zhelezova
1,
Elena V. Pakholkova
1,
Vladislav E. Veller
1,2,
Mikhail A. Voronov
1,
Eugenia V. Stepanova
1,
Alena D. Zhelezova
1,3,*,
Anton V. Sonyushkin
4,
Timur S. Zhuk
1 and
Alexey P. Glinushkin
1
1
Federal State Budgetary Scientific Institution All-Russian Scientific Research Institute of Phytopathology (VNIIF), Institut Street, 5, Bolshie Vyazemy, Moscow Region 143050, Russia
2
BASF, Department of Russian Federation, Leningradsky Ave, 37A Building 4, Moscow 125167, Russia
3
Dokuchaev Soil Science Institute, Department of Soil Biology and Biochemistry, Pyzhyovskiy Lane 7 Building 2, Moscow 119017, Russia
4
Institute of Geography, Russian Academy of Sciences, Staromonetniy Lane, 29, Moscow 119017, Russia
*
Author to whom correspondence should be addressed.
Agronomy 2023, 13(4), 1045; https://doi.org/10.3390/agronomy13041045
Submission received: 17 January 2023 / Revised: 13 March 2023 / Accepted: 30 March 2023 / Published: 1 April 2023

Abstract

:
The detection and identification of plant diseases is a fundamental task for sustainable crop production. Septoria tritici and Stagonospora nodorum blotch (STB and SNB) are two of the most common diseases of cereal crops that cause significant economic damage. Both pathogens are difficult to identify at early stages of infection. Determining the degree of the disease at a late infection stage is useful for assessing cereal crops before harvesting, as it allows the assessment of potential yield losses. Hyperspectral sensing could allow for automatic recognition of Septoria harmfulness on wheat in field conditions. In this research, we aimed to collect information on the hyperspectral data on wheat plants with different lesion degrees of STB&SNB and to create and train a neural network for the detection of lesions on leaves and ears caused by STB&SNB infection at the late stage of disease development. Spring wheat was artificially infected twice with Septoria pathogens in the stem elongation stage and in the heading stage. Hyperspectral reflections and brightness measurements were collected in the field on wheat leaves and ears on the 37th day after STB and the 30th day after SNB pathogen inoculation using an Ocean Insight “Flame” VIS-NIR hyperspectrometer. Obtained non-imaging data were pre-treated, and the perceptron model neural network (PNN) was created and trained based on a pairwise comparison of datasets for healthy and diseased plants. Both statistical and neural network approaches showed the high quality of the differentiation between healthy and damaged wheat plants by the hyperspectral signature. A comparison of the results of visual recognition and automatic STB&SNB estimation showed that the neural network was equally effective in the quality of the disease definition. The PNN, based on a neuron model of hyperspectral signature with a spectral step of 6 nm and 2000–4000 value datasets, showed a high quality of detection of the STB&SNB severity. There were 0.99 accuracy, 0.94 precision, 0.89 recall and 0.91 F-score metrics of the PNN model after 10,000 learning epochs. The estimation accuracy of diseased/healthy leaves ranged from 88.1 to 97.7% for different datasets. The accuracy of detection of a light and medium degree of disease was lower (38–66%). This method of non-imaging hyperspectral signature classification could be useful for the identification of the STB and SNB lesion degree identification in field conditions for pre-harvesting crop estimation.

1. Introduction

Sustainable crop production is a basis for food security. Wheat is one of the most important cereal crops, and its productivity could be significantly constrained by several pathogenic species. Septoria tritici blotch and Stagonospora nodorum blotch (STB and SNB), or septoriosis, are widely spread and common diseases of cereal crops. Under this name, several variants of the disease are combined that are caused by different pathogens with the similar mechanism of action. This pathogen complex affects wheat, rye, triticale, barley and many other crops, as well as about 20 types of wild cereals [1]. Septoriosis is a common disease in all small-grain-cereal-growing territories on all continents, especially in the medium- and high-rainfall zones [1,2,3,4,5,6].
Septoriosis causes significant economic damage due to crop losses and increased fungicide application. Annual economic losses from septoriosis were estimated at EUR 0.28–1.2 billion per year in Europe and more than USD 275 million per year in the United States [2,7]. In Europe, cereal crop losses in epiphytotic years could range from 20 to 40% and losses of wheat yields could be up to 50% [2]. In Russia, septoriosis is one of the most spread leaf–stem fungal diseases of wheat. Mass outbreaks of this disease are noted every 5 years out of 10; crop losses in epiphytotic years can range from 20 to 40% [8,9,10].
On wheat crops in Russia, two types of STB pathogens are the most common: Zymoseptoria tritici (Desm.) Quaedvlieg and Crous (synonym of Septoria tritici Rob. et Desm) and Parastagonospora nodorum (Berk.) Quaedvlieg, Verkley and Crous (synonym of Stagonospora nodorum (Berk.) Castellani and E. G. Germano) [8,9,10]. The first pathogen is the causative agent of septoria leaf blotch and it affects mainly leaves. The second pathogen is the causative agent of septoria glume blotch and it affects both leaves and ears equally. The Septoria pathogens affect plants at any time of the growing season, in several stages of vegetation, causing the spotting of leaves, stems and ears. The main damage from septoriosis, as well as other plant leaf diseases, is a reduction in plants’ photosynthetic assimilation surface area.
Traditionally, visual assessment is used to determine the degree of leaf damage using the nominal, ordinal and ratio scales [11]. In recent years, the automatic detection of plant diseases using images has also become widely applied. Many databases on plant diseases are represented by sets of digital photographic images [12,13]. The results of multi- and hyperspectral imaging are also used to determine some problems of plant health, such as salinity stress, drought and fungal and viral diseases [11,14,15,16,17,18,19]. Various methods are used to process sets of digital, multi- and hyperspectral images, from non-parametric statistical methods (principal component analysis, cluster analysis and others) to automatic data processing based on neural networks. The basis of automatic methods for determining plant diseases is a comparison of photographs of healthy and diseased plants with clearly presented disease signs [13,20,21]. With a sufficient number of images in the training sample, neural networks (NNs) could easily and with high accuracy identify various plant diseases from digital photographs and hyperspectral survey results.
Currently, different approaches and models of neural networks are used to extract data and select a classification model. The extraction of an image’s features is the first important step for successful image classification. The precision of classification depends on (1) quality of input image (or hyperspectral) information and (2) the advantages and disadvantages of machine learning algorithms [18,22]. A convolutional neural network (CNN) is an example of a deep learning neural network. It uses computer vision for image recognition and classification. For automatically determining plant diseases, the number of CNN models can be used, for example, AlexNet, GoogLeNet, VGG19, ResNet50 and others [13,21,23]. CNN is a common method used for image classification and computer vision. Another method of the neural network is multilayer perceptron (MLP). This method can be used for non-imaging hyperspectral data [16]. In our research, non-imaging spectral curves were used instead of images, and there were none applied to the CNN class.
It is necessary to find the effective methods of plant disease detection in plants for timely diagnostics and the prevention of notable damage. Optical imaging techniques such as RGB, thermal, fluorescence, multi- and hyperspectral imaging are non-invasive methods of plant disease detection [11,15,24,25]. RGB with hyper-spectral imaging was successfully applied to identify various diseases of sugar beet leaves and other crops [14,25], yellow rust and Fusarium head blight in cereal crops [26], and STB in wheat [27,28,29]. Both hyperspectral imaging and non-imaging measurements are effective for the determination of various visible symptoms of plant stress or infection [16,28,29,30,31,32]. A specialized library of spectral characteristics (signatures) of the main foliar diseases of wheat was created for pathogen detection and identification [32]. Many studies are dedicated to obtaining and analyzing spectral images in controlled laboratory conditions [33]. The method of disease development assessment depends on the scale of research: the cellular level, the level of the leaf, the individual plant, the canopy of the crop, the field and the landscape [11,14,15,34,35]. Field conditions make constraints for studies using hyperspectral imaging: the light intensity can change significantly during the shooting, which makes it difficult to interpret the result. Some works emphasize that the methods developed for the laboratory for the detection of plant diseases cannot be transferred to field conditions [33].
The detection of STB pathogens on leaves and SNB on ears in the field is difficult due to the long latent stage of disease. The visual diagnostic characteristic of Septoriosis on the leaves and ears is the presence of black fruiting bodies (pycnidia) within pale grey to dark brown spots. Leaf discoloration is associated with chlorosis and tissue necrosis. The necrotic phase and the first chlorotic tissue become visible 12–13 days after infection (dai). These signs can be easily visually detected and by using optical and spectral cameras [11,36]. The possibilities of hyperspectral imaging and machine learning for assessing the development of Septoriosis were shown in laboratory conditions at the level of leaves and ears [32,35], in field conditions at the level of leaves and the crop canopy [27,28] and at the level of plots and fields [19,29].
All previous studies have stated the indisputable fact that Septoria disease is difficult to identify in the initial stages of development. To one degree or another, this problem of disease identification has been solved with the use of hyperspectral surveys. In the last stages of this disease’s development, it can be easily identified using visual detection, but researchers can only state the fact that the disease caused weak, medium or severe damage. However, this knowledge is useful for special aims of inventory. The assessment of the damage caused by the disease in the pre-harvesting stage of crop development can be used to predict crop yield losses from septoriosis, to estimate the effectiveness of protective measures carried out or to compare the cultivars’ sensitivity to this disease. Visual pre-harvesting crop inspection in fields is limited because of subjective reasons, and automatic inspection can be more convenient and faster. This study shows the possibility of automatic assessment of the degree of wheat damage by septoriosis based on the use of non-imaging hyperspectral analysis and the perceptron neural network.
The aim of the study was to examine the results of automatic identification of the Septoriosis degree in the pre-harvesting stage of wheat on the basis of hyperspectral non-imaging measurements in the field condition and a comparison of the results of visual and automatic STB&SNB estimation.

2. Materials and Methods

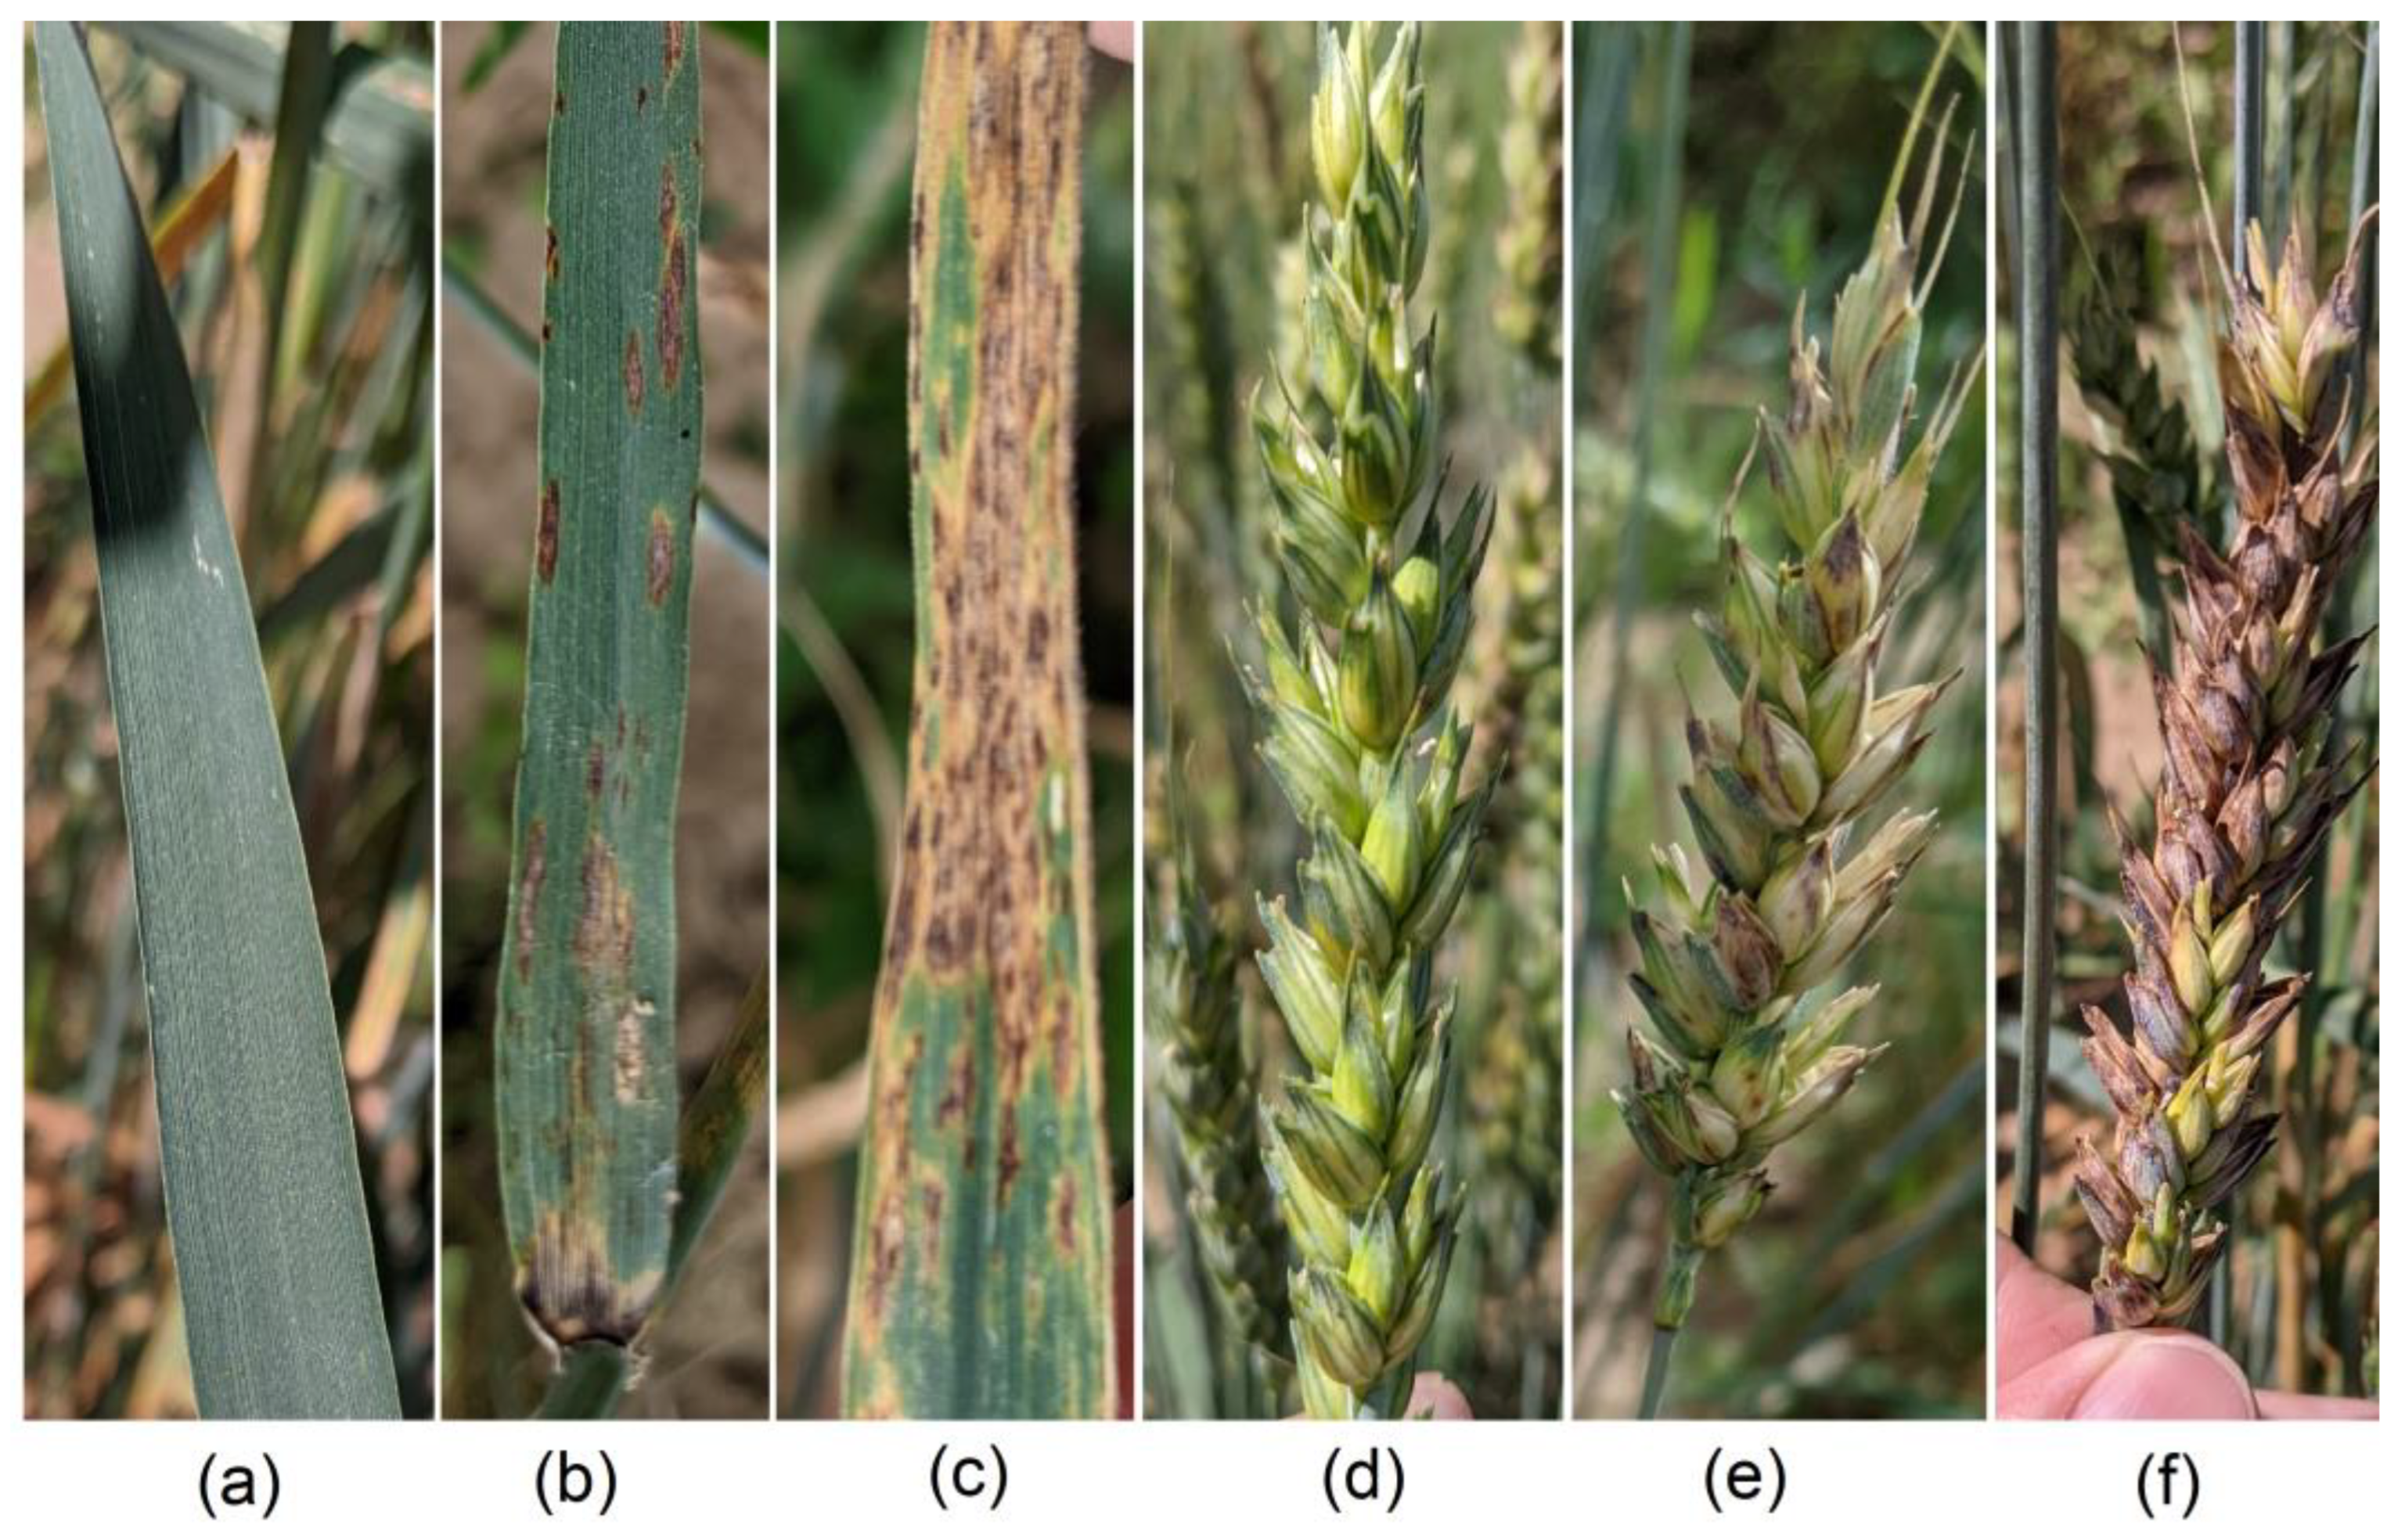
2.1. Wheat Cultivation and Pathogen Inoculation

For the dataset creation it was necessary to observe healthy and diseased leaves and ears with different degrees of Septoria tritici and Stagonospora nodorum blotch. Two moderately susceptible cultivars of spring wheat (Triticum aestivum) were used: Stepnodar-90 (originating from Kazakhstan) and Aekada-282 (originating from Tatarstan, Russia).
For the collection of spring wheat cultivars (Triticum aestivum), they were grown according to standard growth technology in the field condition in the Moscow region, Russia. The soil of the site was sod-podzolic medium-loamy. The standard technology used for the growing of the spring wheat cultivar collection included (1) pre-winter soil plowing after the harvesting of the previous crop sunflower, where the depth of conventional plowing was 24 cm; (2) fertilization with cultivation in the spring, two days before sowing, where the doses of complex fertilizer NPK were 60, 36 and 36 kg·ha−1, respectively; (3) sowing with the density equivalent to 4.5 million seeds per hectare, where the inter-row distance was 15 cm and (4) weeding as needed. Since this was a collection of varieties for studying resistance to STB&SNB, no pesticide treatments were carried out on this collection. Seeds of the wheat cultivar collection were sown at the 24th of May 2022, and the plants developed normally during the whole growing season. Inoculation with spores of Septoria pathogens was carried out twice: for STB on 27th of June in the growth stage BBCH-35-37 (flag leaf just visible, still rolled) and for SNB on 4th of July in earing stage BBCH-55 [37].
To create an artificial infection background, we used pathogenic strains of Parastagonospora nodorum and Zymoseptoria tritici from the core facility center “State Collection of Phytopathogenic Microorganisms” of the Federal State Budgetary Scientific Institution All-Russian Scientific Research Institute of Phytopathology (VNIIF).
Inoculation of wheat plots was carried out in the most sensitive phases for each type of fungus: in the stem elongation phase for Z. tritici, and in the heading phase for P. nodorum. Inoculums were evenly applied to the plants with a spray gun in the evening after dew had fallen. The concentrations of suspensions were 1 × 10⁶ spores/mL for P. nodorum and 1 × 10⁷ spores/mL for Z. tritici. A total of 100 mL of suspension was applied to 1 m2 of the crop’s canopy. The lesions of STB were firstly detected visually on 9th of July, on the 12th dai (day after infection for STB). Up until the end of July, wheat had reached the growth stage of the maturity beginning (BBCH-70). On 29th of July (32nd dai of STB and 25th dai of SNB), wheat leaves and ears were investigated using a non-imaging hyperspectrometer sensor. Because the early detection of STB&SNB symptoms via non-imaging sensors is limited, especially for low severity [11], this was a reason to determine the degree of STB&SNB severity at the mature stage of cultivar–pathogen interaction. Hyperspectral reflection brightness measurements were carried out on live plants in the field (in situ) at the leaf and ear level. The degree of disease had previously been assessed visually. Healthy leaves and leaves with different degrees of lesion (light, medium or severe) were chosen and observed in situ in the collection for hyperspectral imaging (Figure 1a–c). The same degrees of disease severity were selected for the wheat ears (Figure 1d–f). For each degree of STB&SNB severity, 3 replicates of leaves and ears were taken, respectively. After this, an individual unique dataset of non-imaging hyperspectral signatures was compiled for each replicate.
At the end of the vegetation season, the biological yield of all wheat cultivars was recorded. The regression equation of the relationship between Septoriosis disease degree and crop yield was calculated.

2.2. Hyperspectral Non-Imaging Measurements

Hyperspectral non-imaging reflection signatures of wheat leaves and ears were obtained using the Ocean Insight “Flame” VIS-NIR hyperspectrometer [38]. This passive optical spectrometer registers the intensity of electromagnetic radiation (EMR) in the wavelength range from 338 to 1018 nm, including visible (VIS) and near infrared (NIR) diapasons. The spectral resolution (step) of the measurements was 0.3 nm. The data of reflection intensity were recorded in a text file format from which a spectral reflection curve (signature) could be designed. One signature was extracted from a unit *.txt file. The curve of each measurement file had an input of 2048 single indicators of spectral reflection for each 0.3 nm wavelength gradation in the range from 338 to 1018 nm. Immediately before the start of the non-imaging measurements, the spectrometer device was calibrated via reflection from a white rough fluoroplastic plate (standard white).
The size of the spectrometer field of vision depends on the distance from the collimator to the leaf surface; in our experiment, it was a spot with size of about 5 mm × 5 mm. The leaf necrosis and chlorosis spots can be either larger or smaller than the field of vision size. Measurements were carried out continuously when the eyepiece of the spectrometer moved near the surface of the leaves at the distance of 2.5–3 cm. Within the visible area, spectral information at each wavelength was averaged.
There were 8 unique datasets of leaves, and 8 datasets of ears were created. Every dataset includes series of non-imaging measurements according to the degree of STB for leaves and SNB for ears. Leaves and ears were chosen manually according to visual estimation. There were 2 datasets of healthy leaves, 2 datasets of healthy ears and the other 12 datasets included different stages of STB&SNB severity of leaves or ears. Every dataset included 2000 non-imaging hyper-spectral signatures for leaves, and 2000 or 4000 signatures for ears. The volume of the datasets on the ears was larger, because the surface of the ear is uneven. In such a condition, the raw data had more noise and irrelevant values related to the absorption and reflection of light by the ear surface. So, increasing the size of the dataset was necessary, because increasing the sample size reduces the standard error, and the training of neural networks is expected to be more reliable.
The time-line period for one dataset containing 2000 values depended on the intensity of the external light flux and usually ranged from 2 to 10 min. Measurements were performed in the field conditions on midday under natural bright sunlight, and it took 1–2 min time-lines for one survey (unique dataset). In total, 16 datasets (each of 2000 or 4000 records) were collected in half an hour; so, the change in the angle of sun inclination and the illumination conditions could be neglected.

2.3. Hyperspectral Data Analysis and Neural Network

Raw hyperspectral reflection data vary in a wide range of values, especially in the NIR diapason. Data preprocessing and the design of spectral brightness curves were carried out in a specially created Python script, using numpy, scipy and matplotlib standard libraries. Noise, outliers and irrelevant values were removed in each unique dataset (raw spectral reflection data). There were discarded values, whereby deviations exceeded 3σ from the average value of the dataset for a given wavelength. Hyperspectral brightness reflection curves were designed in a software module and inspected visually and by using classic statistics methods. The spread distribution of values over the entire spectrum range was estimated, and a quantile analysis and comparison of the spectral brightness curves were performed based on the values averaged for each dataset.
The neural network was created and trained on the basis of pairwise comparison of standard datasets of “healthy leaf”/”severely damaged leaf” and “healthy ear”/”severely damaged ear” for further classification of plants with signs of disease. We used the perceptron model of the neural network, PNN (Figure 2) [39]. Two datasets were used to train the neural networks: hyperspectral characteristics of healthy (1) and severely damaged, diseased (2) plants (Supplementary File S1). The training datasets were divided into proportions of 80% and 20% for training and validation parts, respectively. Several perceptron neural network models were created and tested, and a model with two layers of neurons was chosen. There were 5 neurons on the first layer and 2 neurons on the second layer; the number of training epochs was 5000 for the leaves datasets and 10,000 for the ears datasets. In such a configuration of the neural network, the predicted percentage of correct answers was 89% for leaves and 78% for ears. After the training and testing of the neural network, every new dataset of leaves and ears with different damage degrees was tested in this neural configuration. The metrics of the PNN model after 10,000 learning epochs were 0.99 accuracy, 0.94 precision, 0.89 recall and 0.91 F-score.
Other traditional convolution neural network models (CNNs) earlier proposed for plant disease classification by images could not be used in our investigation because we worked with non-imaging signatures. So, we used only one PNN model and the results were compared with the visual estimation of STB severity via a nominal scale [11].

3. Results

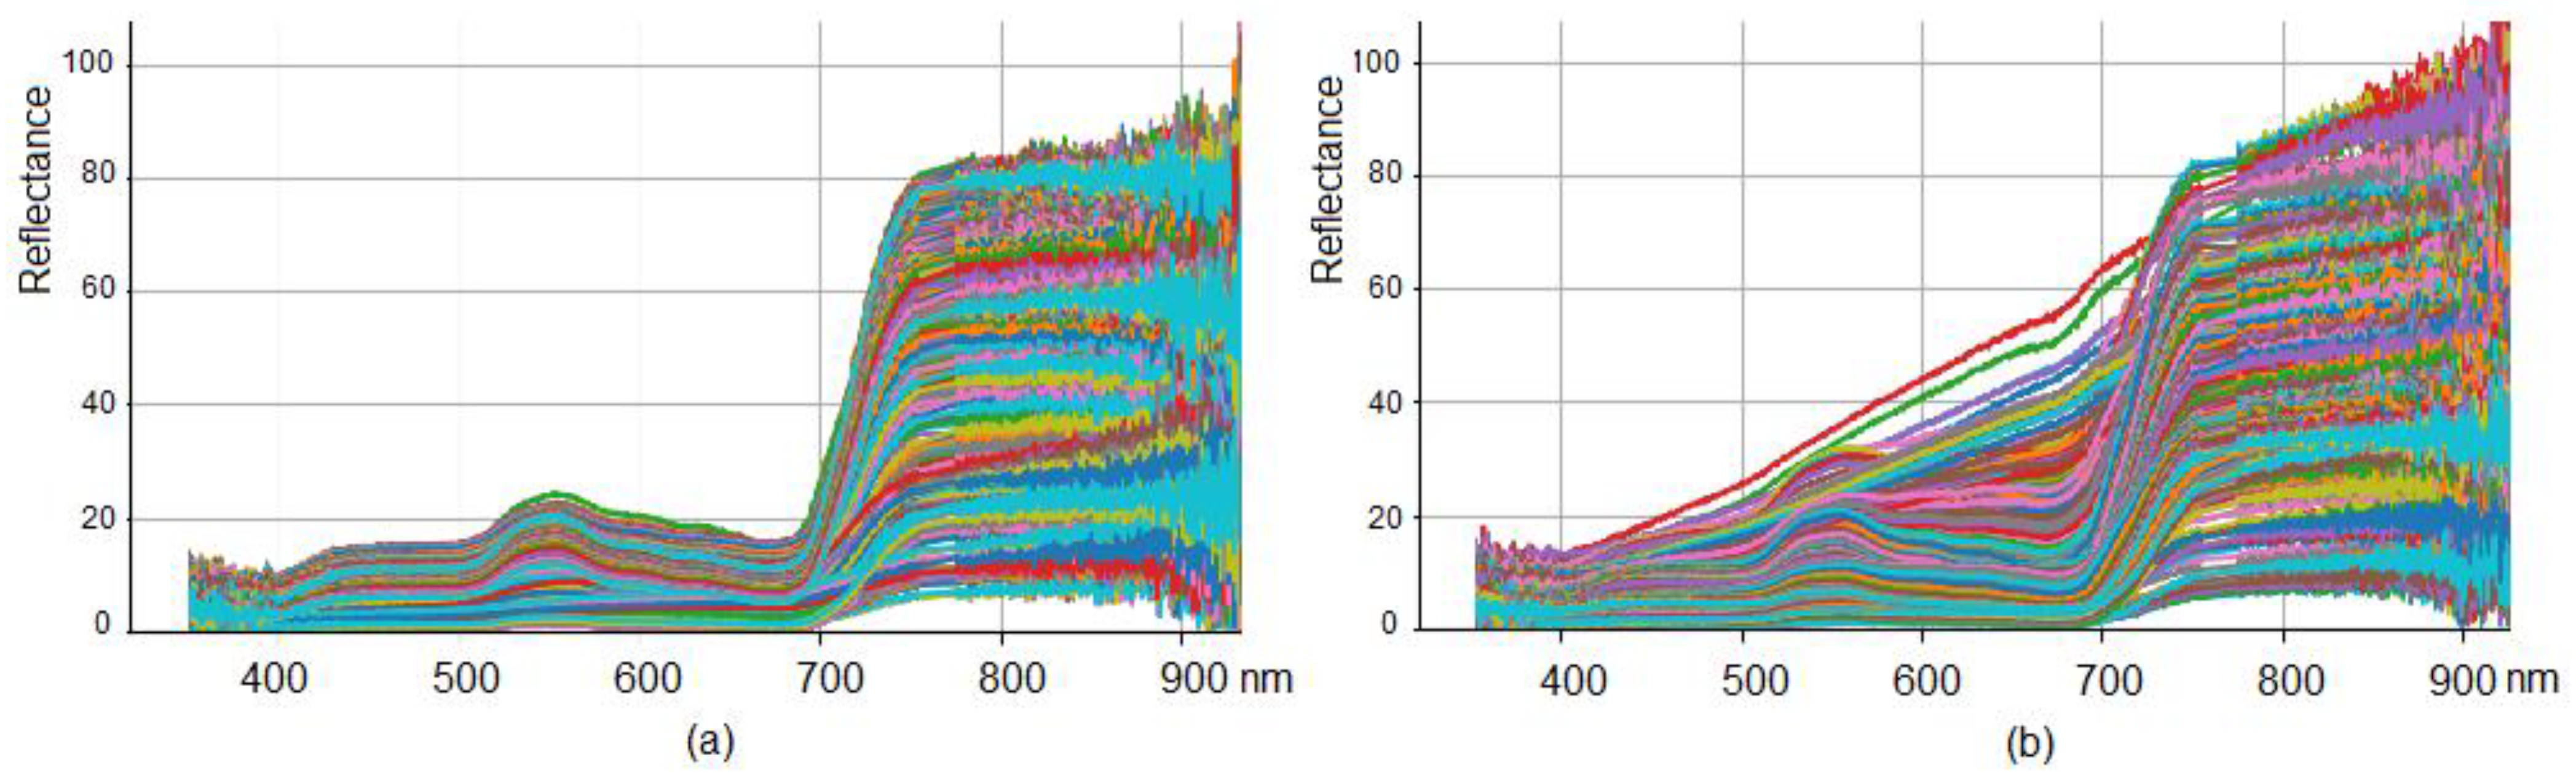
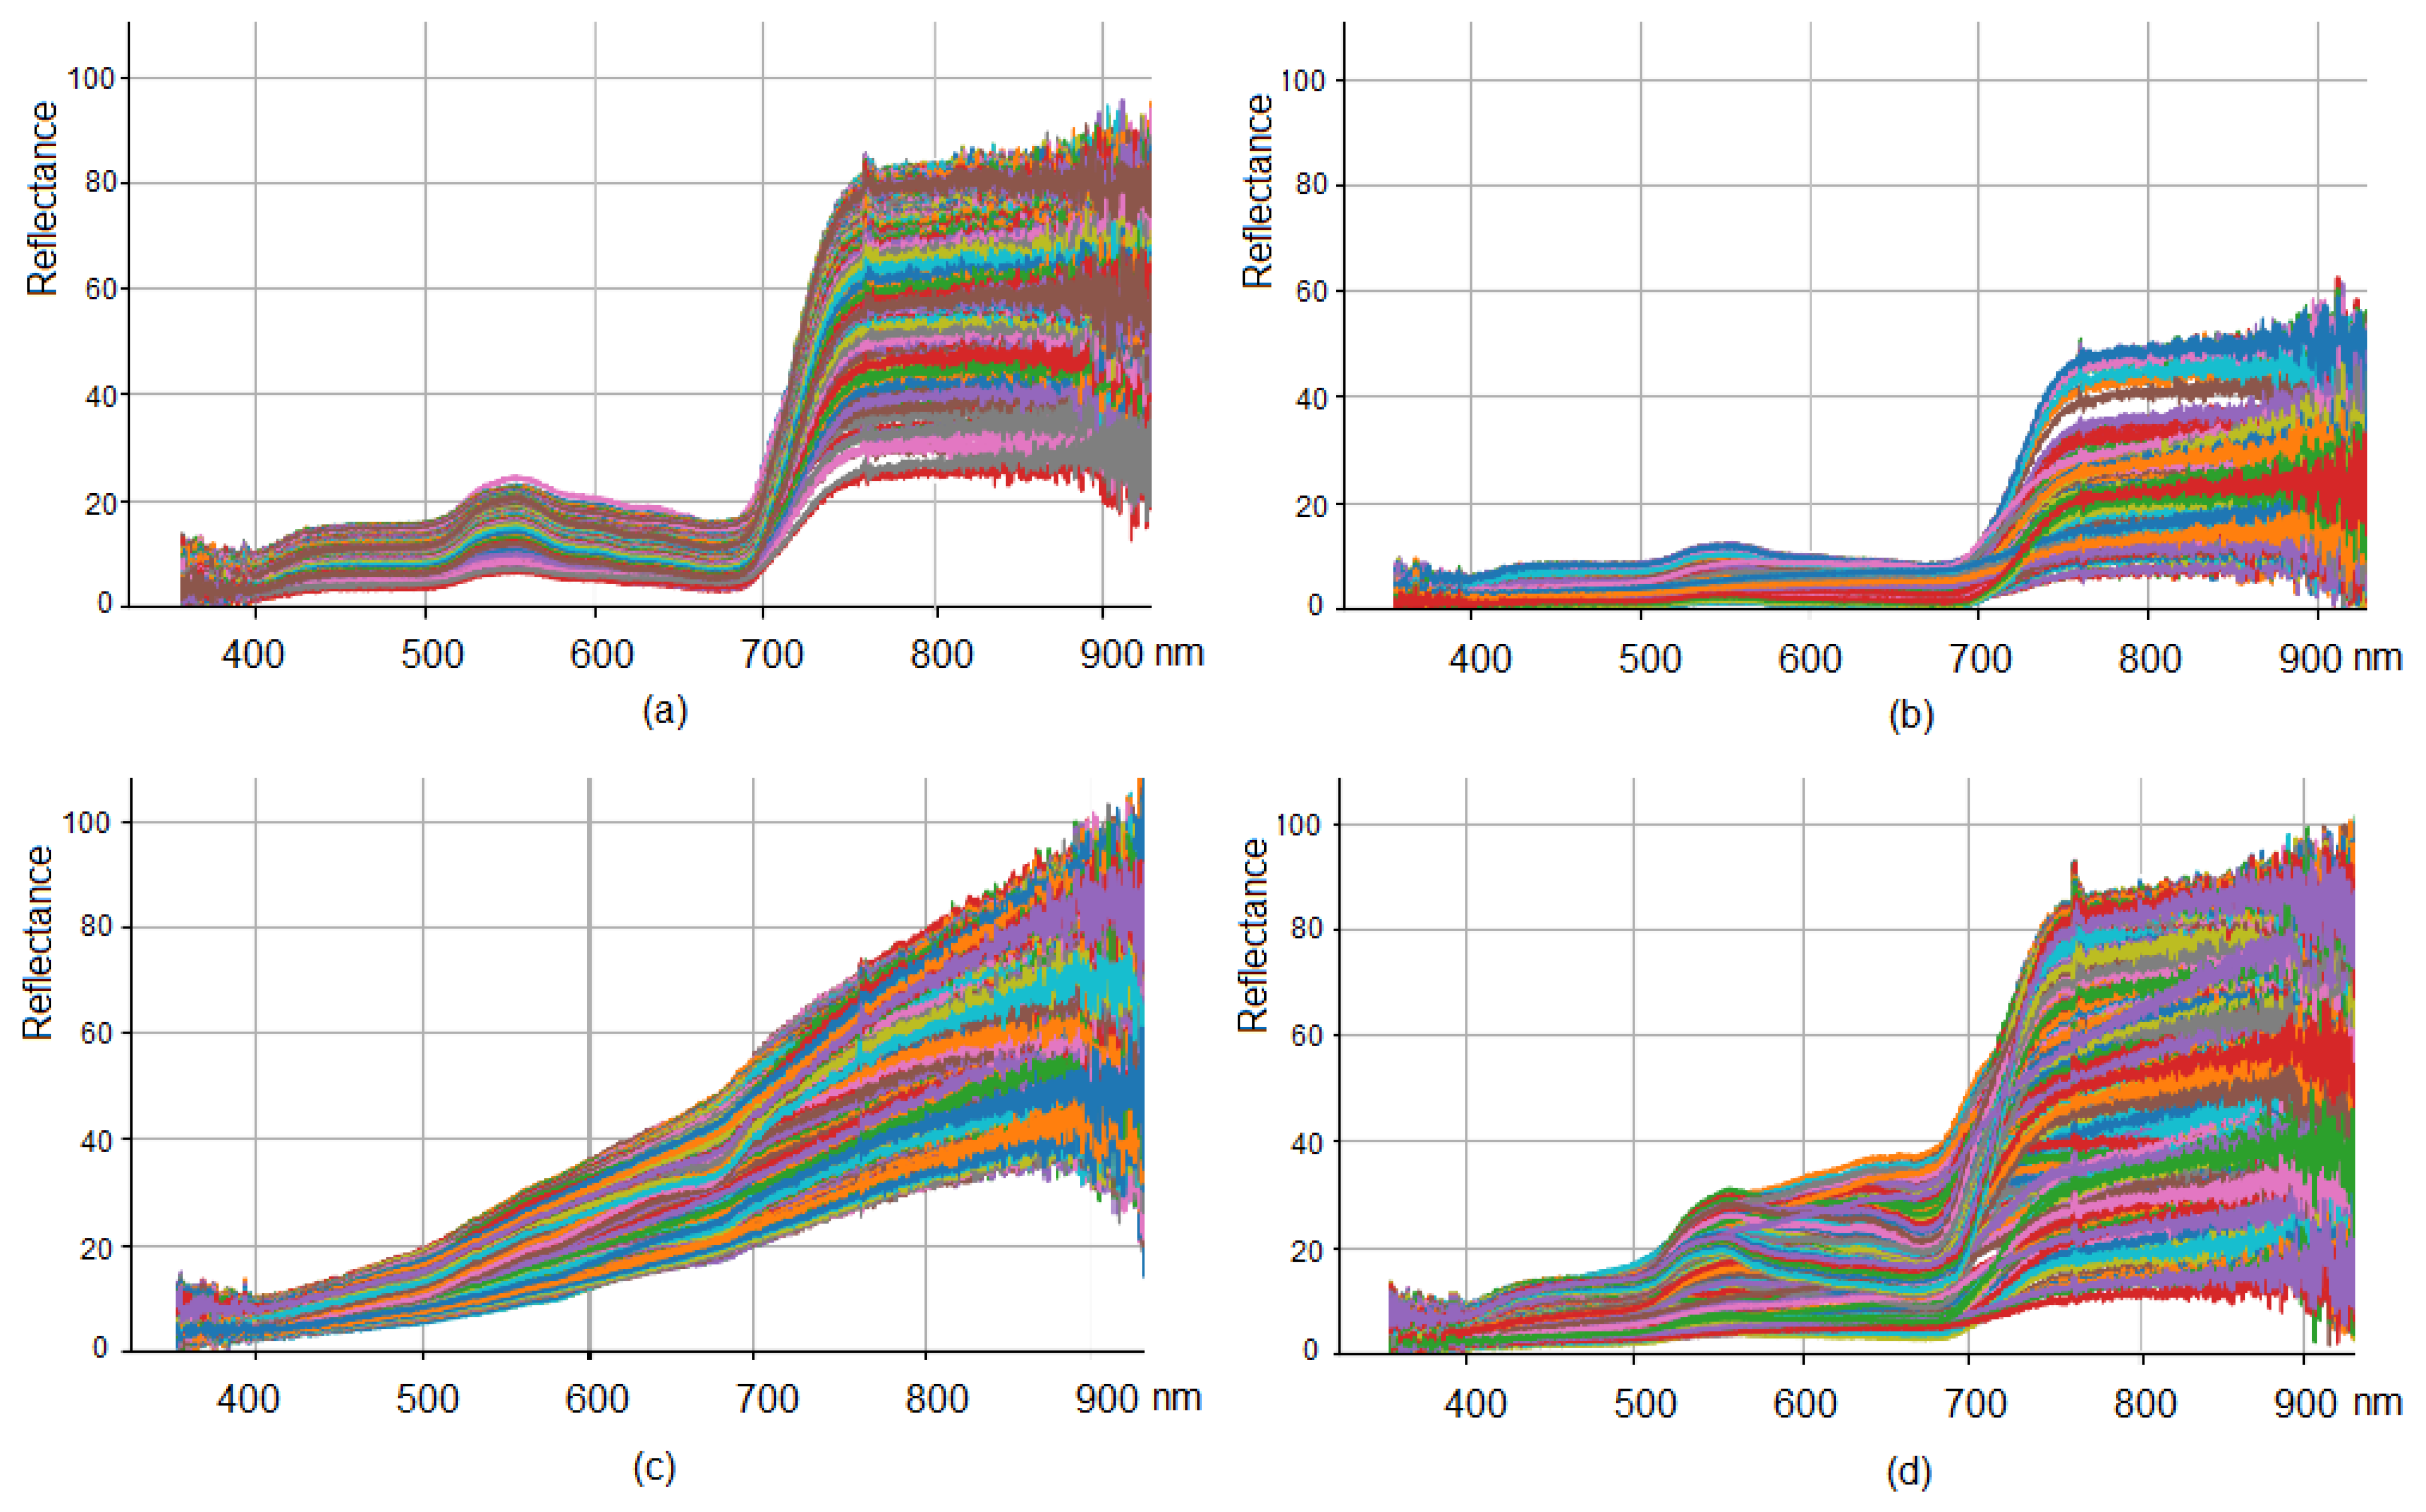
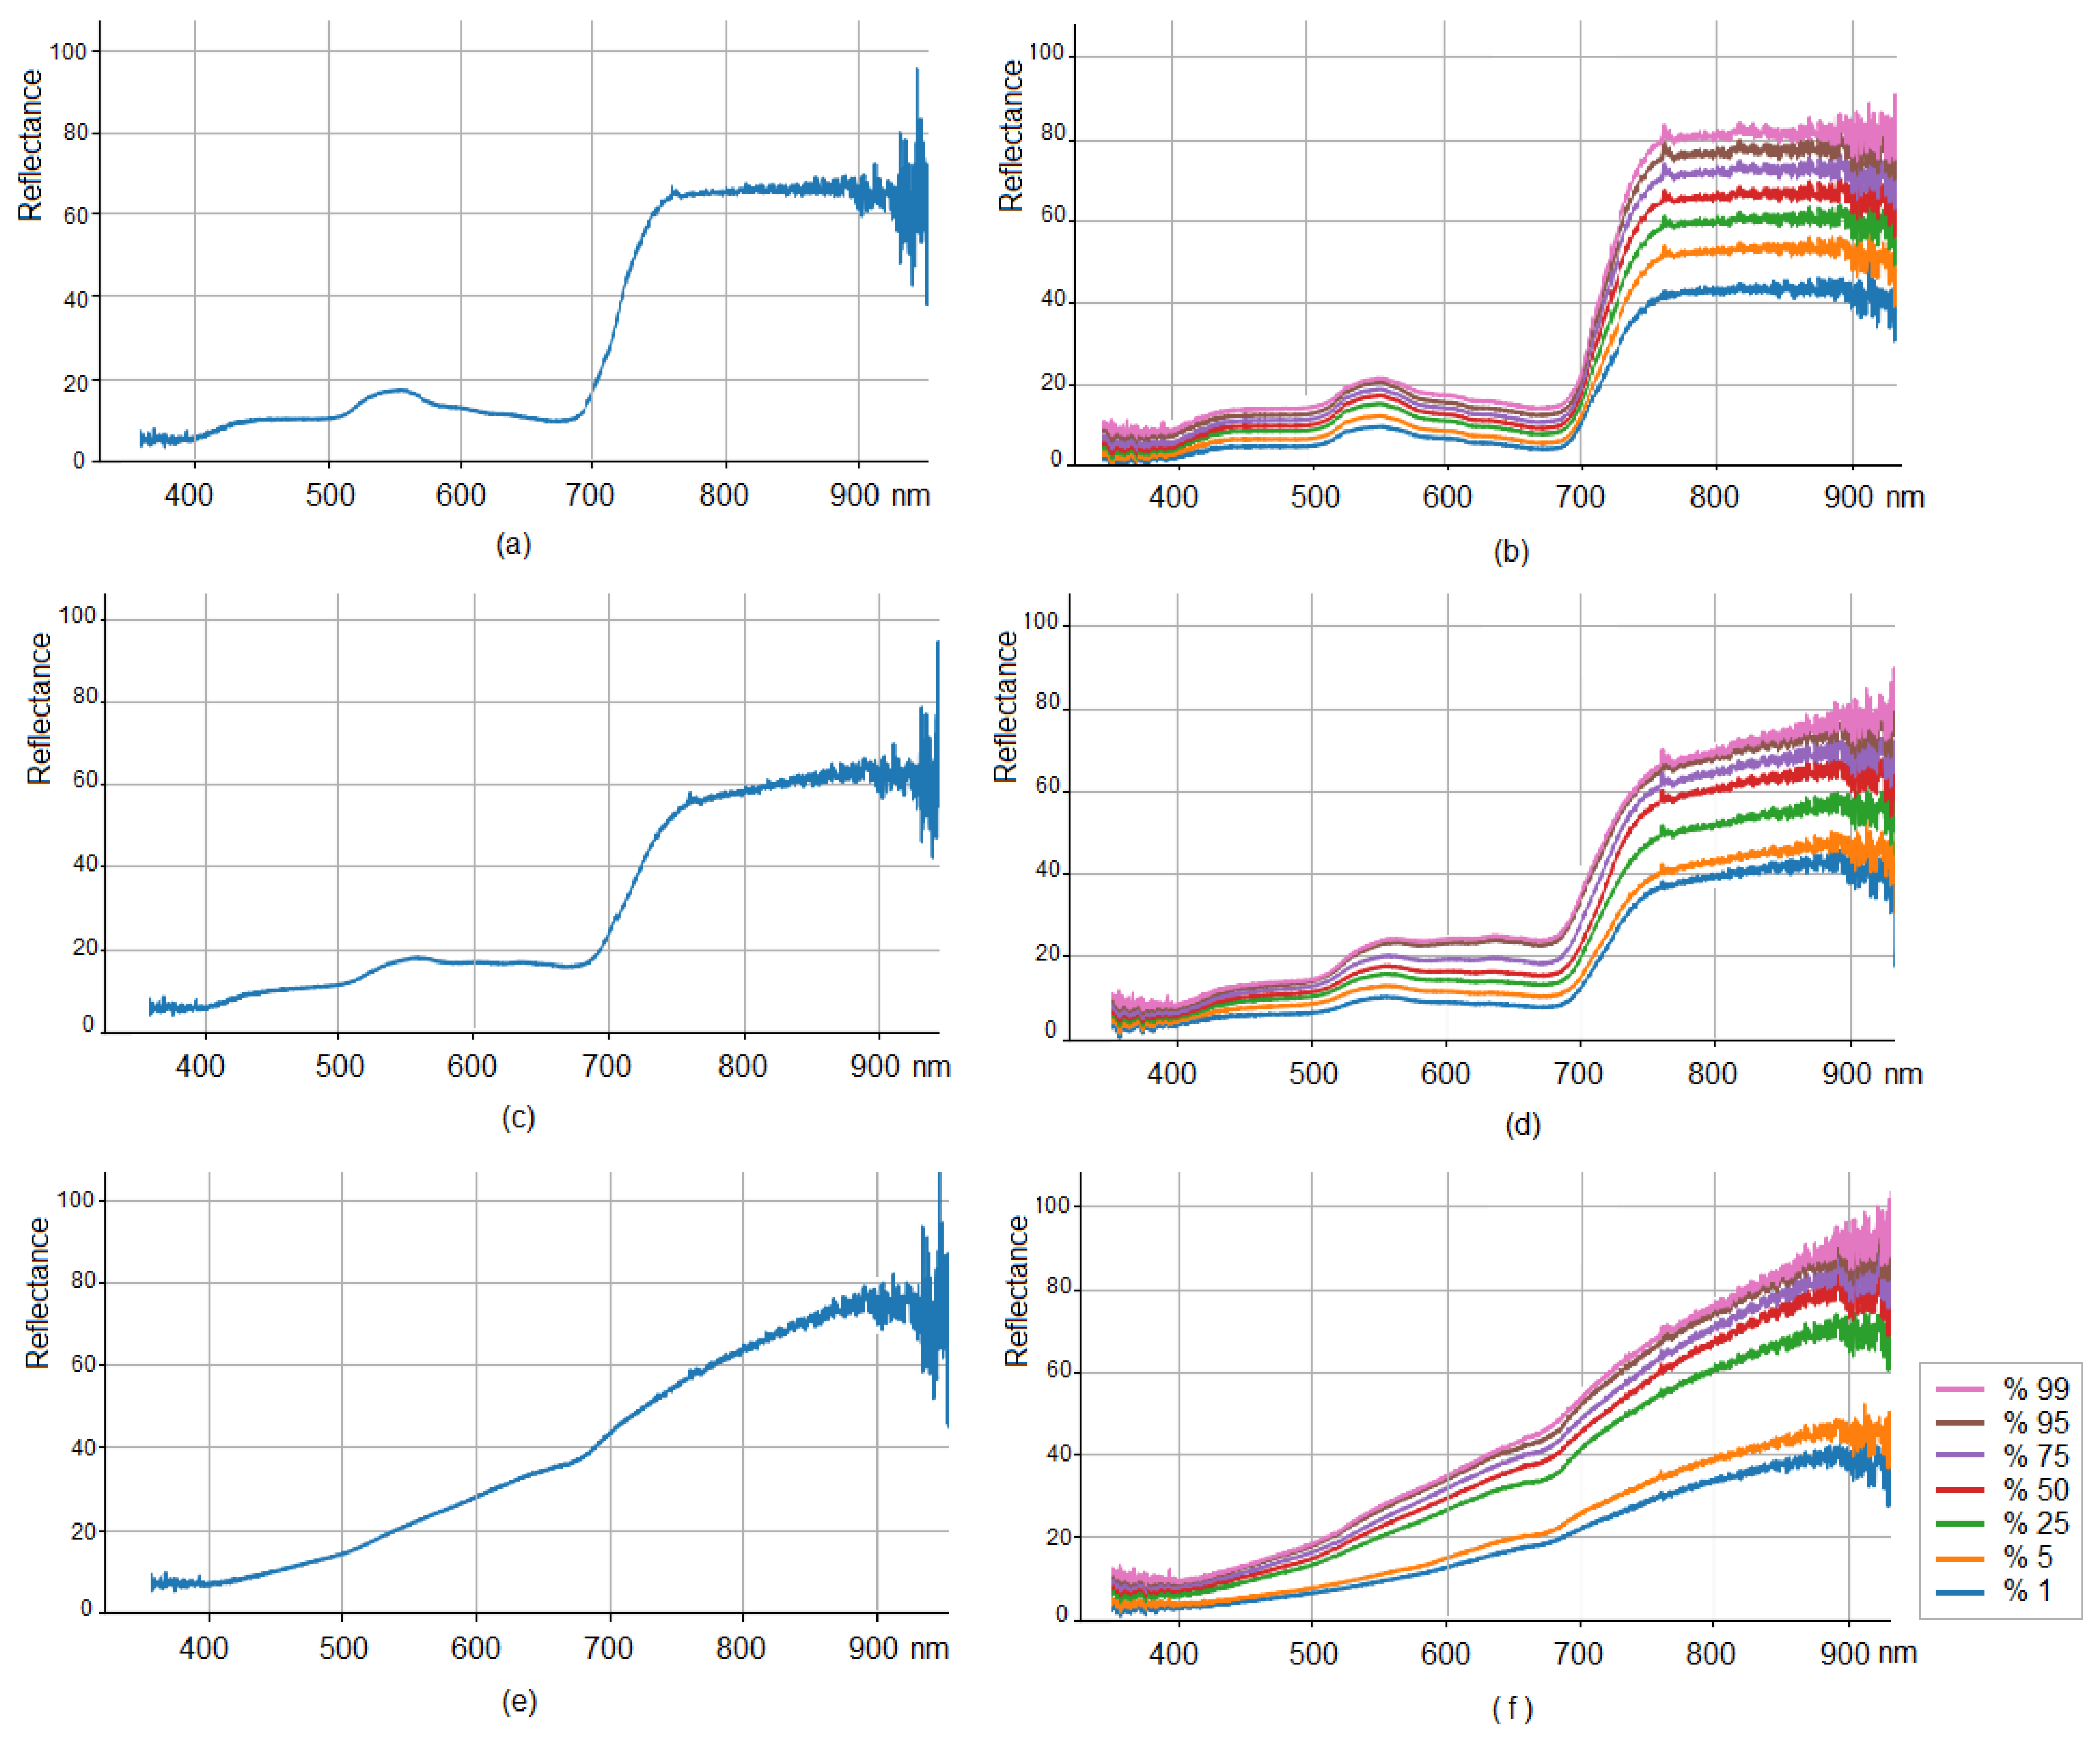
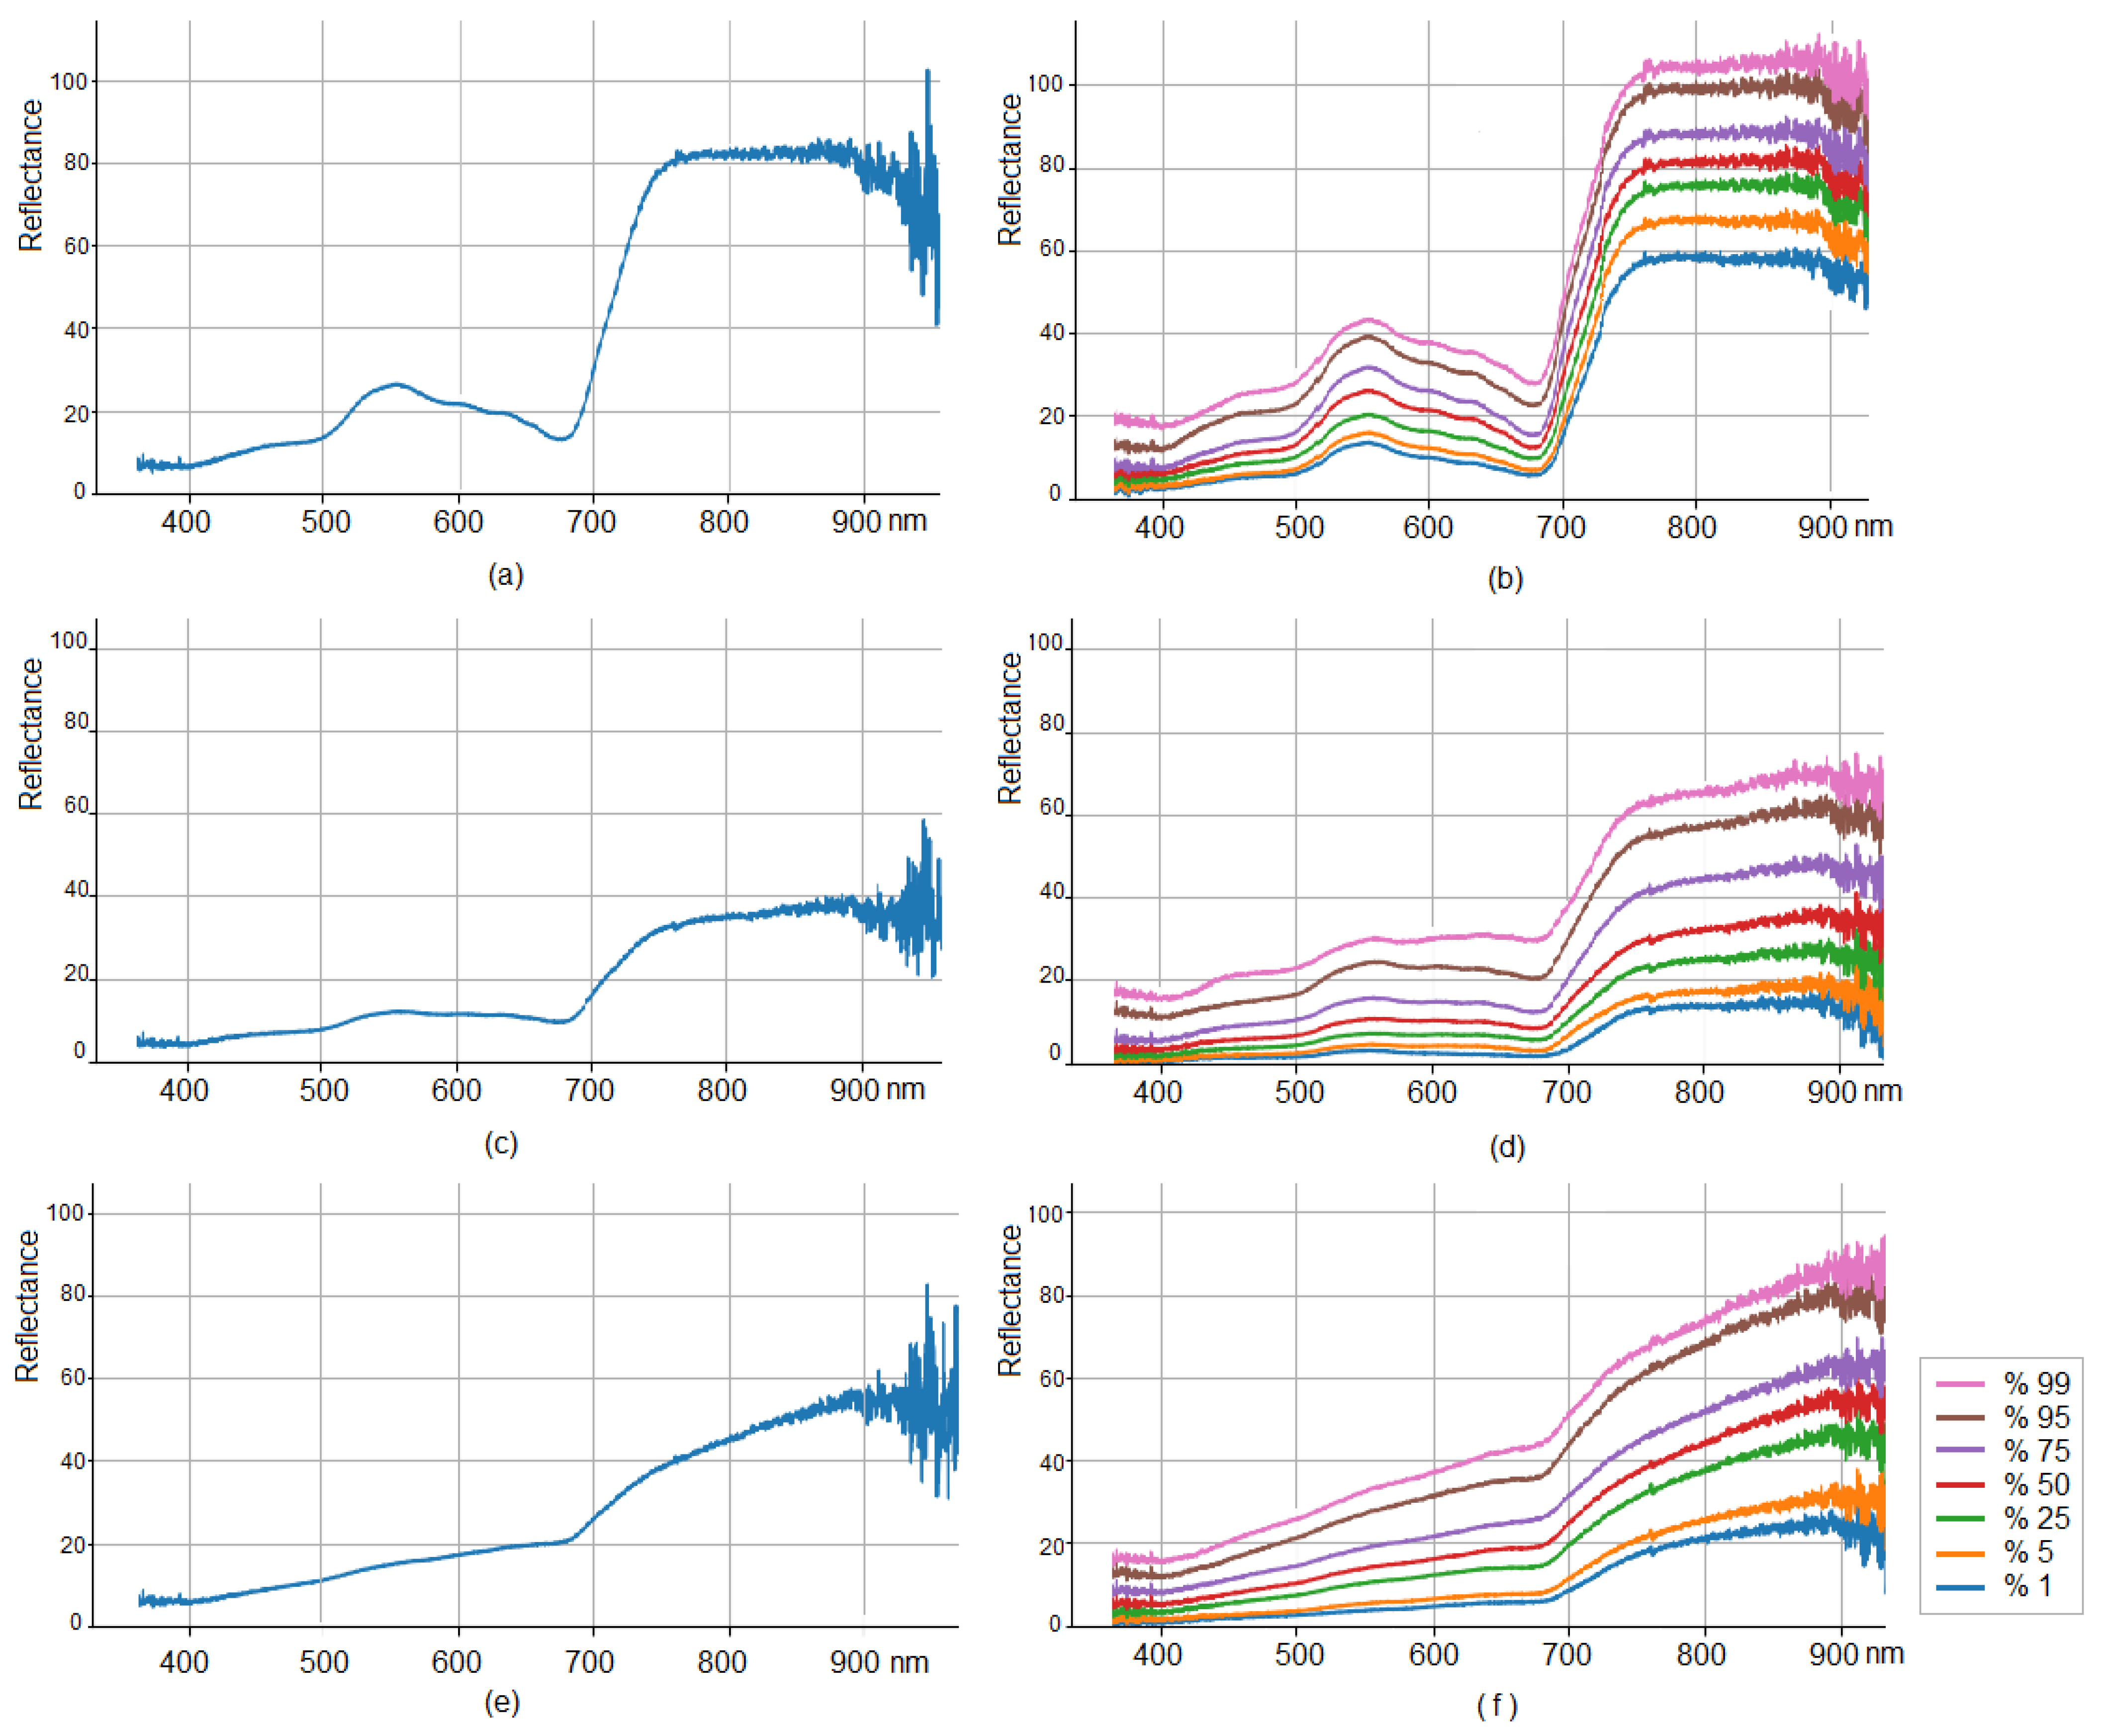
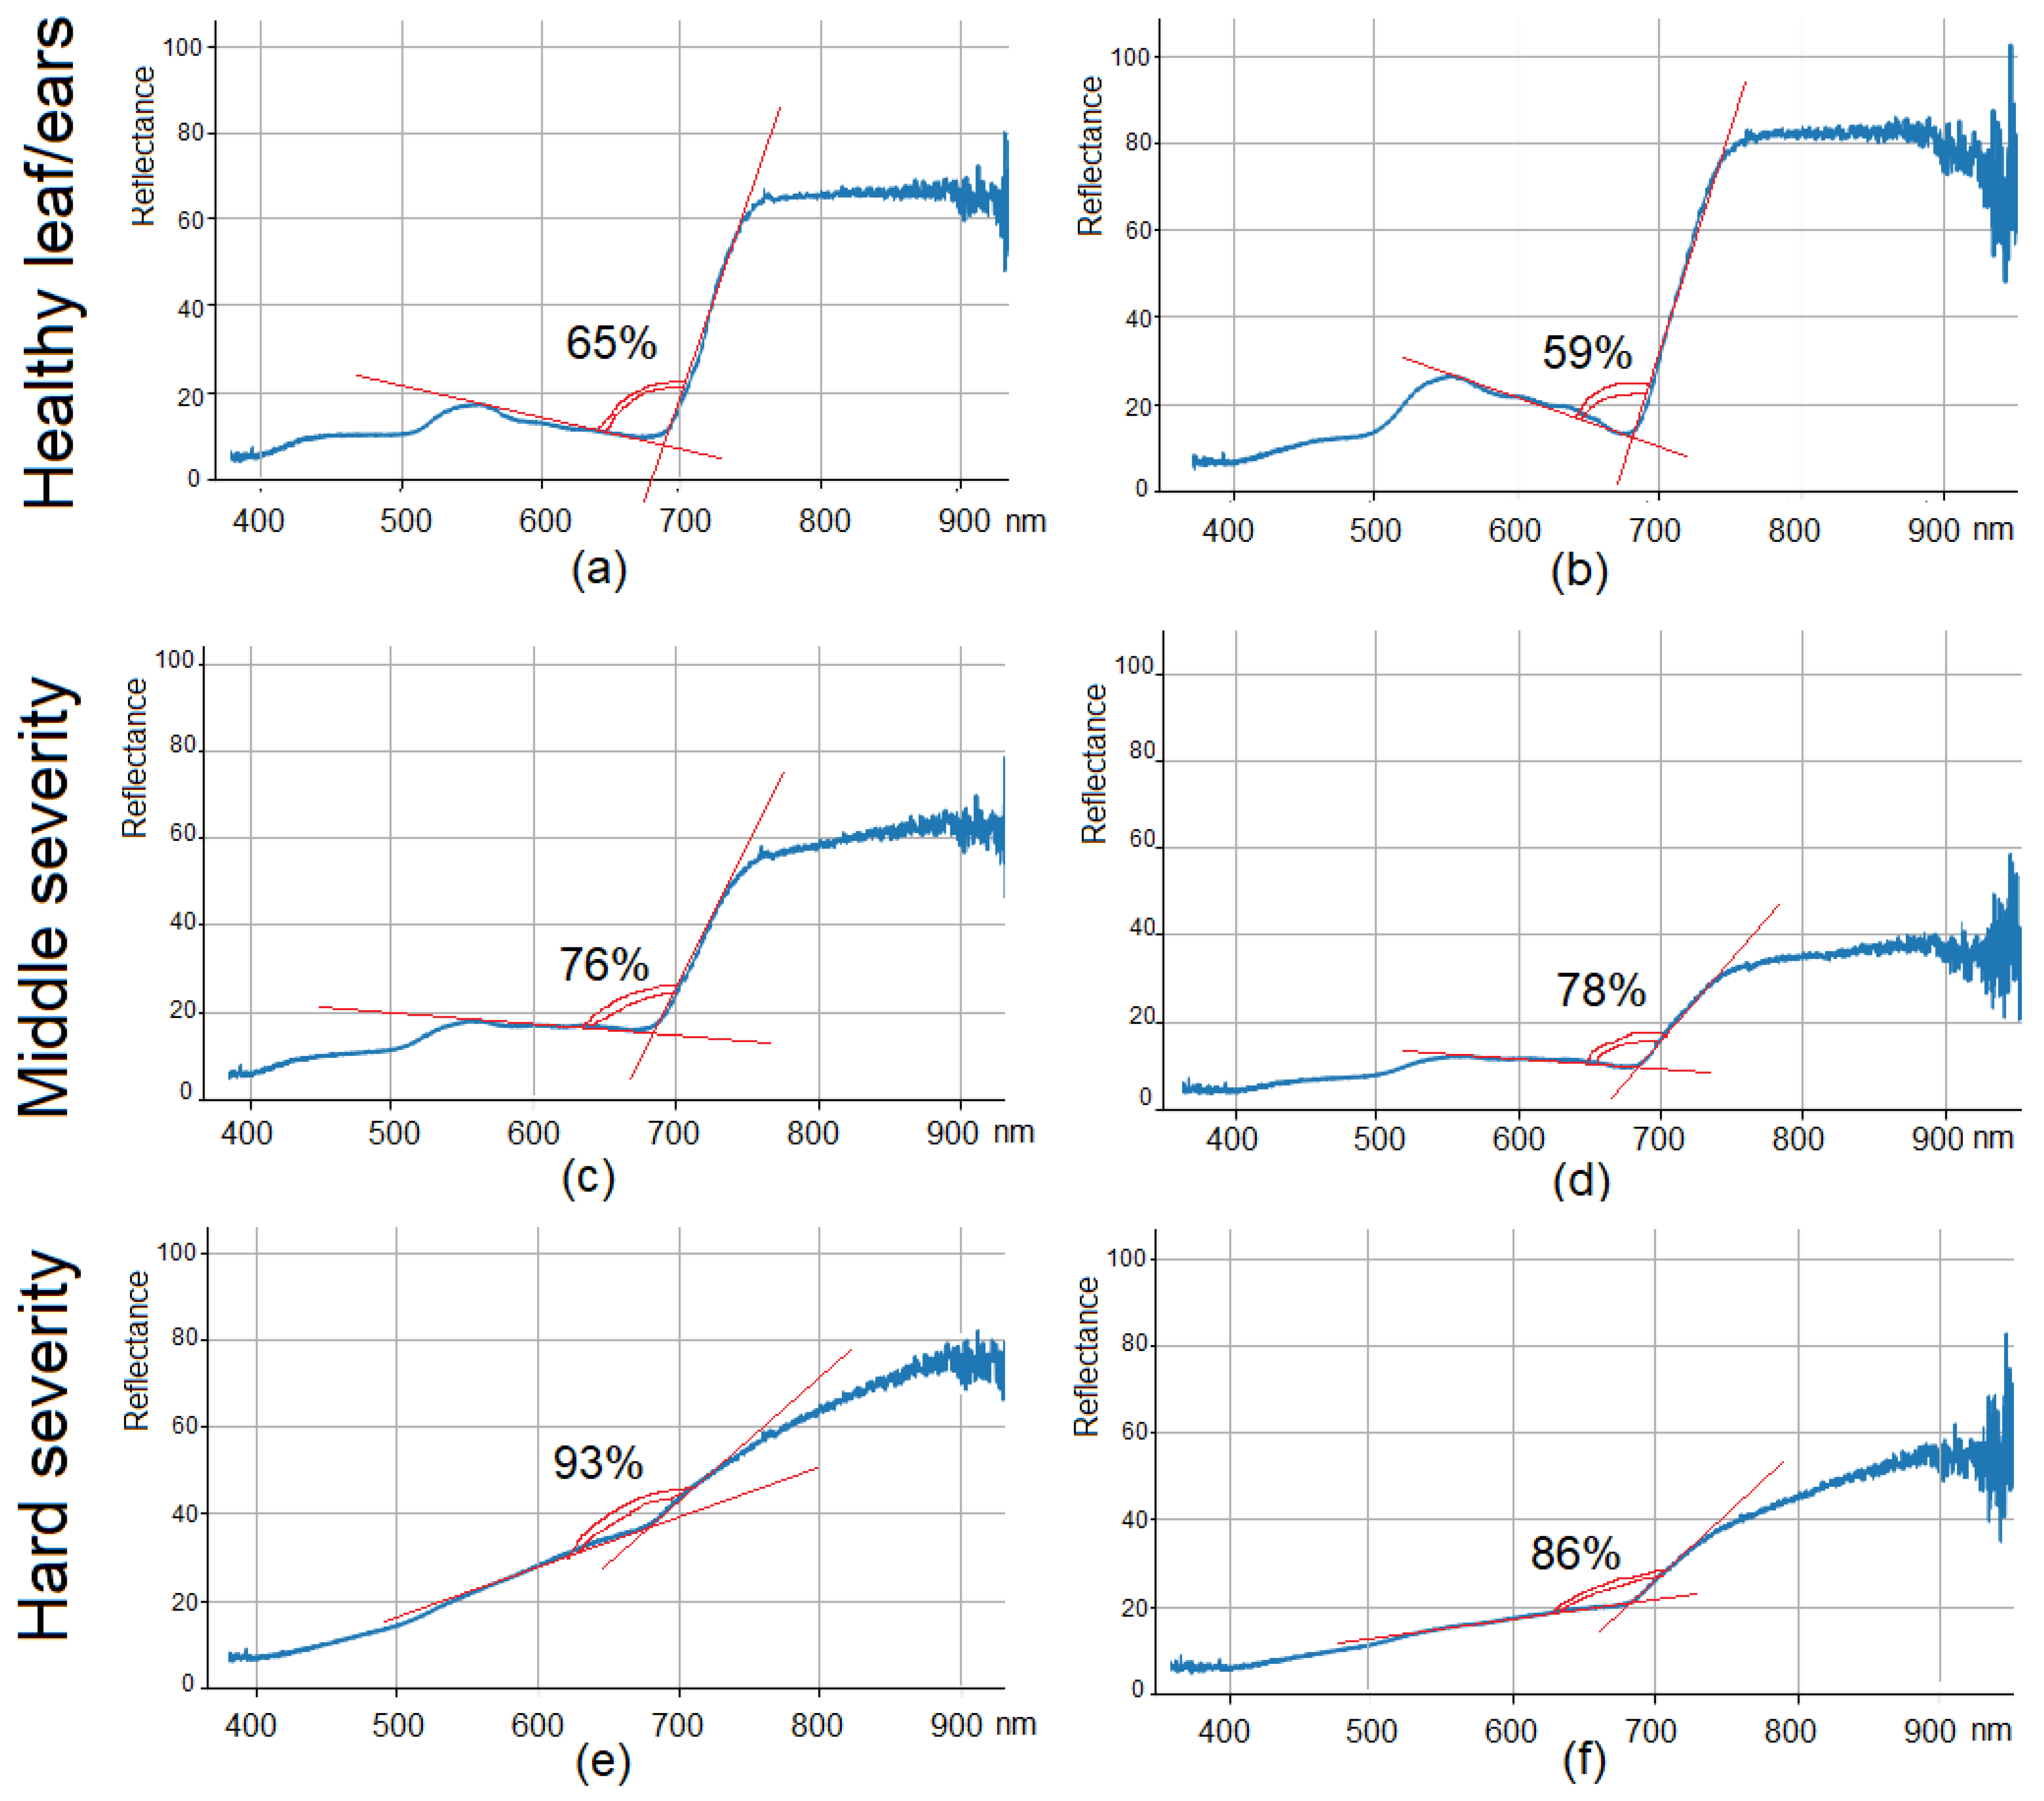
3.1. Hyperspectral Data Visualization and Distribution Quantile Analysis

A total collection of spectrograms (spectral reflection curves) in the range from 330 to 1018 nm was created. For each dataset of hyperspectral measurement survey, 2000 curves for leaves (or 4000 for ears) were obtained. Every set of curves, designed using the computing module of Python, illustrates a wide range of values of spectral reflection (Figure 3). Due to a comparable size of the device’s field of vision and necrosis-chlorosis spots on leaves, every shooting txt-file included individual spectral reflections that differed from each other—the hyperspectral signature. Shooting an individual hyperspectral reflectance could include a damaged spot, a healthy part of the leaf or a part that was partially damaged/healthy. Every individual curve is unique, but in the cases of healthy leaves, the shapes of the curves were approximately the same (Figure 3a). In the cases of damaged leaves, the shapes of the curves demonstrated significant variation (Figure 3b). Therefore, a very large spread of spectrogram curves appears and a large error appears during averaging in the visible (VIS) range.
For the determination of the curves obtained for healthy and damaged leaves, the data clusterization procedure was carried out, and twenty-four data clusters were formed for every dataset. The same clustering procedures were carried out for datasets with data on leaves and ears in the light, medium and severe stages of the disease. Clusters of curves of healthy and damaged plants were visually different according to the shape of the curves. After clustering, the selection of data for further analysis was carried out manually according to the correspondence of the curves’ shapes and the number of curves in the clusters. To classify clusters, an approach based on two indicators was applied: (1) the shape of the curve and (2) the number of curves in every cluster. The shape of the curves was evaluated visually and was compared with previously published data, which provide examples of spectral brightness curves for healthy plants and for those affected by diseases [14,15,22,25,35,40]. The number of spectral curves in one dataset was 2000 or 4000. The number of curves in clusters ranged from 1 to 1680. Small clusters with fewer than 20 curves were excluded from the analysis. Uncharacteristic curves selected visually were excluded from the analysis. From each dataset with a volume of 2000 or 4000 curves, a combined cluster with a volume of at least 1000 spectral reflection curves was formed for further statistical analysis. After this classification, for every dataset, two clusters were formed: (1) cluster of typical curves and (2) cluster of invalid curves that were not reflecting the condition of leaves (Figure 4).
The approximate data ratio was as follows: typical curves were no less than 70% of the total primary volume of the dataset, and invalid curves ranged from 5 to 30%, depending on the dataset and the degree of the disease development. The most difficult classification of curves was for plants, especially ears, damaged by septoriosis in the middle degree.
Further distribution quantile analysis was carried out with relevant data curves, excluding the invalid ones.
At the beginning of the VIS range (wavelength 350 to 450 nm), a minimal spread in the values of the spectral brightness was observed at any stage of the development of the disease, i.e., the reflection in this range was similar for healthy and damaged plants. The biggest difference in average meanings was found in the red radiation spectrum on the wavelength of about 680 nm (Figure 5a,c,e). The change in the spectral brightness of reflection in the diapason of 550–680 nm was approximately −10% of the entire range of the reflection scale for healthy plants, approximately −2% for a medium lesion and +20% for a severe lesion. Additionally, in damaged and healthy plants, the difference in reflections in the red slope area (Red-Edge, 705–745 nm) was pronounced: the stronger the degree of disease infestation, the smaller the slope of the curves and the larger the total quantile range (from 1-quantile to 99-quantile)in this area (Figure 5b,d,f). At 700–705 nm, the total quantile range was 10% for healthy leaves, 26% for a medium lesion and 44% for a severe lesion. The same trend was observed for ears, an increase in the total quantile range of 35, 38 and 41%, respectively (Figure 6). Thus, the more pronounced the disease, the greater the total quantile range of values at the beginning of the red edge.
When comparing the ears with different degrees of lesion caused by Septoria, we observed higher variability in reflectance meanings at the beginning of the spectrum (wavelength 350–450 nm) compared to those observed for leaves (Figure 6). The total quantile range was also higher. This suggests that the ear itself is an object with a much more uneven coloration than the leaf. However, in general, the characteristics of the curves of the spectral reflection of the ears are similar in shape to the characteristics of the curves of the reflection of the leaves (Figure 5 and Figure 6).
As a measure of the differences in the type of spectral brightness curves (hyperspectral signatures), the angle between the branches of the graph can be proposed (Figure 7). The left branch of the graph is a reflection in the VIS diapason of the spectrum. The reflection at wavelengths of 550 to 680 nm corresponds, respectively, to the maximum and minimum reflection of a healthy plant. The right branch of the graph is the reflection of the red edge and NIR diapason. For our investigation, the attention was focused on the red edge. The red edge slope is always more gentle in plants under stress [41]. Therefore, the angle between the branches of the graph for healthy and diseased plants differs significantly. Since the angle in degrees will depend on the scale of the axes, the numerical angle is represented in % of 100, where 100% is an angle of 180 degrees, or a straight line without a break. In healthy wheat plants, the average value of the angle between the branches of the graph was 59–65%. With a medium disease severity degree, the value was 76–78%, and with a high severity degree the value was 86–93%. When comparing spectral signatures, this pattern can be used to assess the degree of the STB disease.

3.2. Classification of Diseased Plants by Non-Imaging Hyperspectral Signatures with Neural Network

The task of creating a neural network was to divide healthy and diseased wheat plants by spectral characteristics in the automatic mode. The first step was to recognize disease on leaves; the second step was to recognize STB severity on ears. The algorithm for creating a neural network was the same, but the training samples (datasets) for leaves and ears were different. Each dataset of leaves and ears contained 2000 or 4000 files, respectively. Every file included the numerical values of the spectral reflection curve for the range 338–1018 nm, with a spectral resolution step of 0.3 nm. Each of the 2000 files contained 2048 numeric values for a given individual curve. The algorithm for preparing primary raw data included (1) reducing the hyperspectral scale range from 338–1018 nm to 350–950 nm, (2) smoothing the data using the sliding window technique with a step (window) of 6 nm and (3) forming a new dataset after limiting the range boundaries and smoothing procedure. Limiting the range was necessary to reduce the influence of noise at the ends of the spectral brightness curve, since the largest measurement errors were in the region of less than 350 nm and more than 950 nm. The sliding window smoothing also reduced the impact of individual outliers in the primary raw data. The size of the sliding window was chosen at 6 nm, so 16 consecutive measurements in 0.3 nm increments were placed into this window. Using a sliding window method, every 6 nm of the spectrum, the average mean of spectral brightness was calculated and recorded. When forming a new dataset, the raw primary information was minimized and optimized: from a set of 2048 numeric values of hyperspectral brightness with a step of 0.3 nm, a set of 100 values with a step of 6 nm was formed. There were still 2000 such sets in each dataset of leaves and 4000 sets for each dataset of ears.
The neural network was trained on two datasets of 2000 files which were converted from 2048 numeric to 100 consecutive values of the hyperspectral brightness. These datasets were the reference for the neural network training. The first training dataset corresponded to healthy plants, and the second contained data for plants severely damaged by septoriosis disease. Two independent neural networks were trained and tested for leaves and ears. The neural network had two layers of neurons. On the first layer there were five neurons, and the second layer contained two neurons. The number of training epochs for the neural network for leaves was 5000, and for ears it was 10,000. Each neuron on the first layer contained one dataset of 100 spectral brightness values in the total range of the investigated spectrum in increments of 6 nm. To train the network, data were fed to the neural network in the form of a training sample (80% of the entire dataset) and a test part (20% of the dataset). This ratio of 80 and 20% was formed randomly from a set of 2000 files for leaves or 4000 for ears. As a result of the training and testing of the neural network, a forecast of the operability of this network configuration was obtained: the expected number of correct answers was 100% with an average error of 27%. During subsequent testing on other datasets, when leaves and ears were affected by septoriosis, it was revealed that the neural network worked with higher accuracy on leaf materials than on ears. Thus, out of 100% of the total data of a sample of healthy leaves, 88.1% of the data was classified as healthy, 10.6% of the data was classified as damaged and about 1% of the data was not classified. The stronger the degree of damage to the leaves and ears, the higher the accuracy of the neural network in determining it. The most difficult task was classifying the medium stage of the disease manifestation. From the entire dataset, samples with an average lesion of 33 to 65% of all values could be classified as being both healthy and damaged (Table 1).
The quality of disease identification by the neural network was good. In the automated mode, the precision of determining diseased/healthy leaves ranged from 88.1 to 97.7% for different datasets. It was more difficult to identify the presence of the disease on wheat ear. Only severely damaged plants were precisely identified (up to 99.4%). Light and medium stages of septoriosis disease were classified with a higher error. This is due to the uneven ear surface. A comparison of visual and automatic (PNN) assessment was carried out according to Cohen’s kappa for each gradation of the disease (Table 1, column Cohen’s kappa). A strong coincidence of estimates for healthy and STB&SNB highly damaged plants was observed, and the Kappa coefficient was 0.90–0.98. For light and medium degrees of the disease, the visual and automatic assessments coincided less, and the Kappa coefficient was 0.13–0.64. The average value of Cohen’s kappa together, according to all of the data, was 0.69.

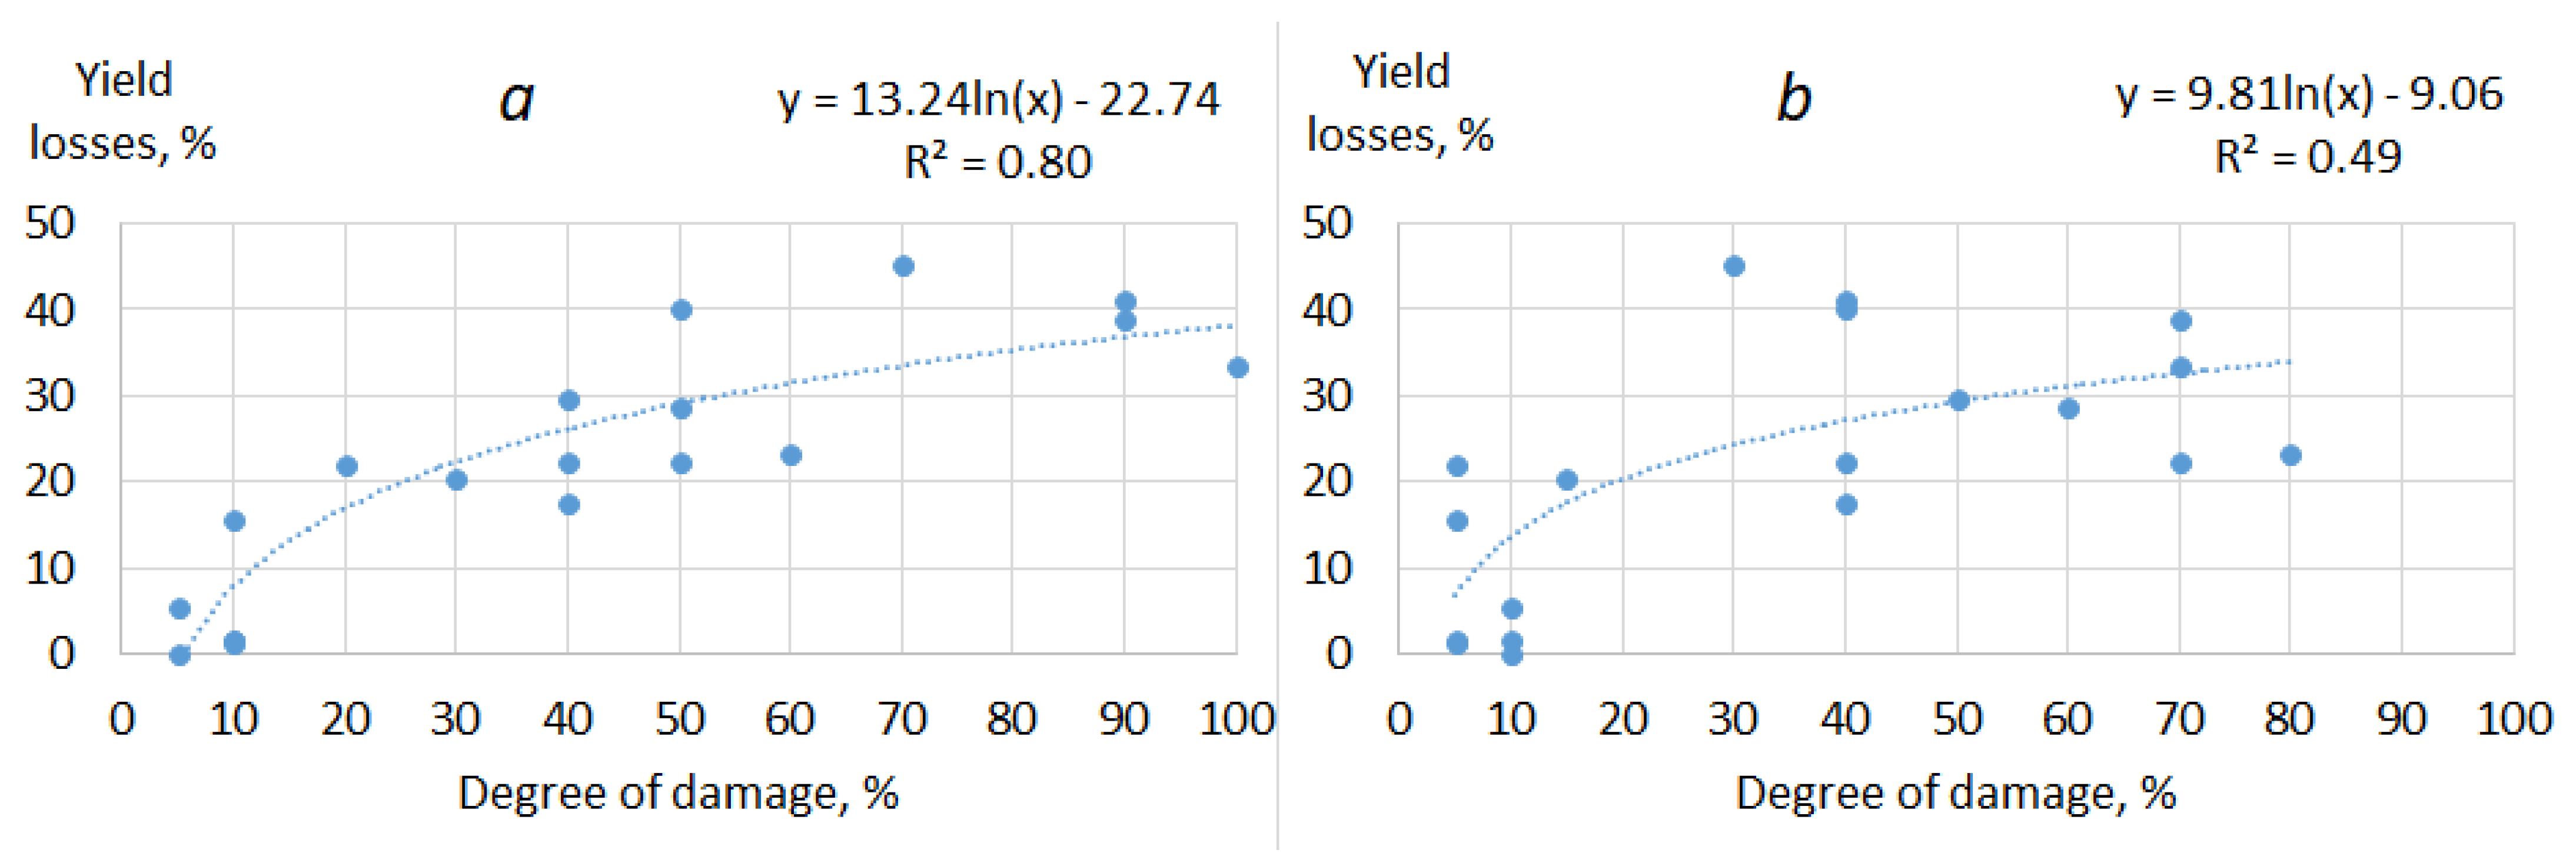
3.3. Estimation of Yield Losses Due to Septoriosis

The biological yields of every wheat cultivar were determined during harvesting. Yield losses were recorded for different degrees of STB&SNB lesion. A strong positive relationship was shown between the lesion degree and yield losses (Figure 8). Yield losses from disease were described using the logarithmic equation. For evaluation according to leaves, the relationship was stronger than for evaluation according to ear: R2 = 0.7993 and 0.4941, respectively (p < 0.05). A severe lesion caused by STB on flag-leaf (more than 70%) led to 35–45% yield losses. A severe lesion caused by SNB on ears (more than 70%) led to 20–40% yield losses.
The loss of biological yield is usually associated with the loss of the photosynthetic surface area of the leaves and ears under the influence of the disease. The main reason for crop loss in this case was a decrease in the mass of 1000 grains.

4. Discussion

The identification of septoriosis symptoms in the beginning of the vegetation season is difficult because of a long latent period. In the second half of the growing season, at the beginning of the wheat maturation phase, the lesion of leaves and ears becomes obvious; however, at this time, it is too late to protect wheat crops. However, it is possible to predict yield losses due to STB by the amount of affected plants and the degree of their lesion. Under septoriosis, plant tissues with spots necrotize and die prematurely, so the leaf surface area decreases and the active growing season becomes shorter. With a degree of leaf damage of 30%, the yield is reduced by 10%; with leaf damage of 51–75%, the yield is reduced by 30%; and when leaf and ear damages come to 75% and more, the yield is reduced by 40% and more [10]. The disease has the strongest effect on grain size and on its quality, which is expressed by a decrease in gluten [35]. With an increase in the lesion of the ear by 10%, the gluten content decreases by 2.5% [42]. With the chemical parameters of the grain change, in particular, the content of protein nitrogen decreases. The sowing qualities of seeds, such as germination energy and field germination, are noticeably degraded. Different wheat cultivars could demonstrate susceptibility or resistance to STB, and the use of cultivar mixtures may help to reduce the damage caused by this pathogen [43,44,45,46]. It has also been shown that the mass of 1000 grains becomes lower with the development of ear disease caused by STB [35].
If the investigation is carried out for the collection of crops of different varieties, it could allow for the assessment of the cultivar resistance to Septoria tritichi blotch. Visual, manual and laboratory assessment of STB development is time-consuming, even for an experienced expert in phytopathology [35,46,47,48]. Therefore, the use of optical sensors, including hyperspectral non-imaging cameras, could be useful and time-saving for assessing the state of cereal crops.
The main difficulty in our study was the processing and interpretation of field hyperspectral survey data for Sertoriosis lesion identification and the comparison of the degrees of lesion. In the field, the development of the disease is usually estimated via points of marking damage scale or percentages [11]. The results of hyperspectral imaging could not be presented in points; instead, it was necessary to compare the shape of the spectral brightness curves (signatures) for different degrees of lesion. The raw data, as the basis for curve creation, had a large range of values; so, a two-step procedure for preparing the initial data was required, including automatic clustering and the manual culling of clusters with an unsuitable shape of curves. Based on the results of data preprocessing and processing, curves characteristic of different degrees of the disease were constructed. Thus, for diseased plants, the spectral reflection in the visible range (350–690 nm) was approximately 20% higher than that of healthy plants. In addition, the spectral reflection curves of the diseased plants had a flat shape in the region of the red edge (705–745 nm). As a measure of STB&SNB severity on green plants, we suggest using values of the angle (%) between the branches of the hyperspectral reflection curve graph.
Our results are consistent with a previous study on STB and SNB detection using hyperspectral measurements, when a 350–1150 nm wavelength range was used, and several spectral vegetation indices (calculated from the reflectance measured for two or more wavelengths) were indicative of the disease development on the 15th–17th dai [27]. These spectral vegetation indices were related to the different levels of chlorophyll, anthocyanin and carotenoid content in the infected leaves, and the variation in these levels could be detected in the visible range. The changes in the reflections in the NIR range were also proven to be indicative of various plant stresses and diseases [49,50,51,52,53].
However, there are other options for STB&SNB detection using hyperspectral measurements. In the study of Iori et al., where a spectrograph worked in a range from 1000 to 1700 nm, the variation in reflectance on the wavelength 1650 nm was proclaimed as being indicative of Septoria nodorum blotch, even in the early stages (1st–3rd dai) of disease development [35].
The neural network could successfully recognize the degree of STB&SNB disease on the leaves and ears in the pre-harvesting period. Hyperspectral survey raw data were loaded into the neural network for both training and testing. The results of determination of STB&SNB via the perceptron neural network are comparable with the nominal scale of the STB&SNB disease. Thus, the created neural network based on the processing of raw hyperspectral survey data successfully coped with the assessment of the presence of STB on wheat leaves and SNB on ears in the late stage.
These studies were carried out at the level of individual plants and at the level of an experimental plot. For food production crops, studies should be conducted at the level of the crop cover area (a single field or a group of fields). This can be useful for predicting crop yield losses in the fields [54,55]. In this case, the use of a manual spectrometer is not applicable, and it is necessary to use remote assessment methods using an unmanned aerial vehicle or satellite imagery.

5. Conclusions

This study suggests an automatic approach to detect the degree of STB&SNB disease damage on spring wheat in the pre-harvesting period in field conditions using hyperspectral non-imaging measurements and the trained perceptron neural network. With all of the possibilities of modern data processing, the results largely depend on the quality of the input information. Septoriosis is a difficult-to-identify disease in the early stages of development. Therefore, for our research, we chose a rather late detection period in the field in the pre-harvesting stage of wheat growth, when the disease could be unmistakably determined visually, and the training dataset was relevant. The proposed perceptron neural network model successfully coped with the identification of healthy leaves and ears, and also determined the % of occurrence of affected leaves and ears. The results were consistent with the visual expert assessment of the development of the disease; the average value of Cohen’s kappa was 0.69 (substantial agreement). In the case of healthy plants and a high degree of STB&SNB severity, Cohen’s kappa reached 0.90–0.98.
Looking ahead, further research is needed for STB severity degree estimation in different cultivars with varying degrees of resistance to STB. Hyperspectral reflection measurements of healthy/diseased plants in the field condition and with machine learning algorithms are prospective for the determination of disease.

Supplementary Materials

The following supporting information can be downloaded at https://www.mdpi.com/article/10.3390/agronomy13041045/s1: File S1: A list of links to zip-archived raw hyperspectral data files.

Author Contributions

Conceptualization, S.V.Z., V.E.V., E.V.S. and A.P.G.; methodology, S.V.Z. and V.E.V.; software, A.V.S. and T.Z; validation, S.V.Z., A.V.S. and T.S.Z.; formal analysis and investigation (field measurement), S.V.Z., V.E.V. and M.A.V.; resources (wheat collection and inoculation), E.V.P.; data curation, S.V.Z. and E.V.S.; writing—original draft preparation, S.V.Z. and A.D.Z.; writing—review and editing, S.V.Z. and A.D.Z.; visualization, S.V.Z. and A.V.S.; supervision, A.P.G.; project administration, S.V.Z., E.V.S. and A.P.G.; funding acquisition, S.V.Z., E.V.S. and A.P.G. All authors have read and agreed to the published version of the manuscript.

Funding

This research was funded by the Ministry of Science and Higher Education of the Russian Federation, project № 075-15-2021-1409.

Institutional Review Board Statement

Not applicable.

Informed Consent Statement

Not applicable.

Data Availability Statement

Not applicable.

Acknowledgments

The strains of pathogens cultivated in the core facility center “State Collection of Phytopathogenic Microorganisms” of the Federal State Budgetary Scientific Institution All-Russian Scientific Research Institute of Phytopathology (VNIIF) were used in this research.

Conflicts of Interest

On behalf of all of the authors, the corresponding author states that there are no conflicts of interest. The funders had no role in the design of the study; in the collection, analyses, or interpretation of data; in the writing of the manuscript or in the decision to publish the results.

References

  1. Suffert, F.; Sache, I.; Lannou, C. Early stages of septoria tritici blotch epidemics of winter wheat: Build-up, overseasoning, and release of primary inoculum. Plant Pathol. 2011, 60, 166–177. [Google Scholar] [CrossRef]
  2. Fones, H.; Gurr, S. The impact of Septoria tritici Blotch disease on wheat: An EU perspective. Fungal Genet. Biol. 2015, 79, 3–7. [Google Scholar] [CrossRef] [PubMed] [Green Version]
  3. Chedli, R.B.H.; M’barek, S.B.; Yahyaoui, A.; Kehel, Z.; Rezgui, S. Occurrence of Septoria tritici blotch (Zymoseptoria tritici) disease on durum wheat, triticale, and bread wheat in northern Tunisia. Chil. J. Agric. Res. 2018, 78, 559–568. [Google Scholar] [CrossRef]
  4. Turgay, E.B.; Büyük, O.; Yıldırım, A.F.; Ölmez, F.; Akci, N.; Karakaya, A. Pathotype diversity of Zymoseptoria tritici (Desm. Quaedvlieg & Crous) isolates collected from Central Anatolia, Turkey. J. Phytopathol. 2022, 170, 588–597. [Google Scholar] [CrossRef]
  5. Ponomarenko, A.; Goodwin, S.B.; Kema, G. Septoria tritici blotch (STB) of wheat. Plant Health Instr. 2011. [Google Scholar] [CrossRef]
  6. McDonald, M.C.; Renkin, M.; Spackman, M.; Orchard, B.; Croll, D.; Solomon, P.S.; Milgate, A. Rapid parallel evolution of azole fungicide resistance in Australian populations of the Wheat Pathogen Zymoseptoria tritici. Appl. Environ. Microbiol. 2019, 85, e01908-18. [Google Scholar] [CrossRef] [Green Version]
  7. O’Driscoll, A.; Doohan, F.; Mullins, E. Exploring the utility of Brachypodium distachyon as a model pathosystem for the wheat pathogen Zymoseptoria tritici Plant Biology. BMC Res. Notes 2015, 8, 132. [Google Scholar] [CrossRef] [Green Version]
  8. Sanin, S.S.; Korneva, L.G.; Polyakova, T.M. Prognosis of the risk of epiphytotic septoria of wheat leaves and ears. Plant Prot. Quar. 2015, 33–36. [Google Scholar]
  9. Kononenko, O.S.; Shishkin, N.V.; Derova, T.G. Winter wheat septoria blotch (Zymoseptoria tritici) (literature review). Grain Econ. Russ. 2021, 6, 104–108. [Google Scholar] [CrossRef]
  10. Sanin, S.S.; Zhohova, T.P. The influence of diseases and plant protection products on the quality of wheat grain. Защита и карантин растений 2012, 11, 16–20. (In Russian) [Google Scholar]
  11. Bock, C.H.; Barbedo, J.G.A.; Del Ponte, E.M.; Bohnenkamp, D.; Mahlein, A.-K. From visual estimates to fully automated sensor-based measurements of plant disease severity: Status and challenges for improving accuracy. Phytopathol. Res. 2020, 2, 9. [Google Scholar] [CrossRef] [Green Version]
  12. Hughes, D.P.; Salathe, M. An open access repository of images on plant health to enable the development of mobile disease diagnostics. arXiv 2015, arXiv:1511.08060. [Google Scholar]
  13. Esgario, J.G.M.; Krohling, R.A.; Ventura, J.A. Deep learning for classification and severity estimation of coffee leaf biotic stress. Comput. Electron. Agric. 2020, 169, 105162. [Google Scholar] [CrossRef] [Green Version]
  14. Mahlein, A.K.; Steiner, U.; Hillnhütter, C.; Dehne, H.W.; Oerke, E.C. Hyperspectral imaging for small-scale analysis of symptoms caused by different sugar beet diseases. Plant Methods 2012, 8, 3. [Google Scholar] [CrossRef] [PubMed] [Green Version]
  15. Thomas, S.; Kuska, M.T.; Bohnenkamp, D.; Brugger, A.; Alisaac, E.; Wahabzada, M.; Behmann, J.; Mahlein, A.K. Benefits of hyperspectral imaging for plant disease detection and plant protection: A technical perspective. J. Plant Dis. Prot. 2018, 125, 5–20. [Google Scholar] [CrossRef]
  16. Abdulridha, J.; Ehsani, R.; De Castro, A. Detection and differentiation between laurel wilt disease, phytophthora disease, and salinity damage using a hyperspectral sensing technique. Agriculture 2016, 6, 56. [Google Scholar] [CrossRef] [Green Version]
  17. Wang, D.; Vinson, R.; Holmes, M.; Seibel, G.; Bechar, A.; Nof, S.; Tao, Y. Early Detection of Tomato Spotted Wilt Virus by Hyperspectral Imaging and Outlier Removal Auxiliary Classifier Generative Adversarial Nets (OR-AC-GAN). Sci. Rep. 2019, 9, 1–14. [Google Scholar] [CrossRef] [PubMed] [Green Version]
  18. Lowe, A.; Harrison, N.; French, A.P. Hyperspectral image analysis techniques for the detection and classification of the early onset of plant disease and stress. Plant Methods 2017, 13, 80. [Google Scholar] [CrossRef]
  19. Bebronne, R.; Michez, A.; Leemans, V.; Vermeulen, P.; Dumont, B.; Mercatoris, B. Characterisation of fungal diseases on winter wheat crop using proximal and remote multispectral imaging. In Proceedings of the Precision Agriculture’19; Wageningen Academic Publishers: Wageningen, The Netherlands, 2019; pp. 255–261. [Google Scholar]
  20. Amara, J.; Bouaziz, B.; Algergawy, A. A deep learning-based approach for banana leaf diseases classification. Lect. Notes Inform. (LNI), Proc. Ser. Ges. Fur Inform. 2017, 266, 79–88. [Google Scholar]
  21. Mohanty, S.P.; Hughes, D.P.; Salathé, M. Using deep learning for image-based plant disease detection. Front. Plant Sci. 2016, 7, 1419. [Google Scholar] [CrossRef] [Green Version]
  22. Wan, L.; Li, H.; Li, C.; Wang, A.; Yang, Y.; Wang, P. Hyperspectral Sensing of Plant Diseases: Principle and Methods. Agronomy 2022, 12, 1451. [Google Scholar] [CrossRef]
  23. Boulent, J.; Foucher, S.; Théau, J.; St-Charles, P.L. Convolutional Neural Networks for the Automatic Identification of Plant Diseases. Front. Plant Sci. 2019, 10, 941. [Google Scholar] [CrossRef] [Green Version]
  24. Bhupathi, P.; Sevugan, P. Application of Hyperspectral Remote Sensing Technology for Plant Disease Forecasting: An Applied Review. Ann. Rom. Soc. Cell Biol. 2021, 25, 4555–4566. [Google Scholar]
  25. Mahlein, A.K.; Kuska, M.T.; Thomas, S.; Bohnenkamp, D.; Alisaac, E.; Behmann, J.; Wahabzada, M.; Kersting, K. Plant disease detection by hyperspectral imaging: From the lab to the field. Adv. Anim. Biosci. 2017, 8, 238–243. [Google Scholar] [CrossRef]
  26. Whetton, R.L.; Waine, T.W.; Mouazen, A.M. Hyperspectral measurements of yellow rust and fusarium head blight in cereal crops: Part 2: On-line field measurement. Biosyst. Eng. 2018, 167, 144–158. [Google Scholar] [CrossRef] [Green Version]
  27. Odilbekov, F.; Armoniené, R.; Henriksson, T.; Chawade, A. Proximal phenotyping and machine learning methods to identify septoria tritici blotch disease symptoms in wheat. Front. Plant Sci. 2018, 9, 685. [Google Scholar] [CrossRef] [PubMed]
  28. Yu, K.; Anderegg, J.; Mikaberidze, A.; Karisto, P.; Mascher, F.; McDonald, B.A.; Walter, A.; Hund, A. Hyperspectral canopy sensing of wheat septoria tritici blotch disease. Front. Plant Sci. 2018, 9, 1195. [Google Scholar] [CrossRef] [PubMed] [Green Version]
  29. Anderegg, J.; Hund, A.; Karisto, P.; Mikaberidze, A. In-Field Detection and Quantification of Septoria Tritici Blotch in Diverse Wheat Germplasm Using Spectral–Temporal Features. Front. Plant Sci. 2019, 10, 1355. [Google Scholar] [CrossRef] [Green Version]
  30. Cheshkova, A.F. A review of hyperspectral image analysis techniques for plant disease detection and identification. Vavilovskii Zhurnal Genet. Sel. 2022, 26, 202–213. [Google Scholar] [CrossRef]
  31. Doktor, D.; Brosinsky, A.; Lausch, A.; Merbach, I. Comparison of imaging and non-imaging hyperspectral sensors observing vegetation in the laboratory. Geophys. Res. Abstr. 2011, 13, 9251. [Google Scholar]
  32. Bohnenkamp, D.; Behmann, J.; Paulus, S.; Steiner, U.; Mahlein, A.K. A Hyperspectral Library of Foliar Diseases of Wheat. Phytopathology 2021, 111, 1583–1593. [Google Scholar] [CrossRef] [PubMed]
  33. Paulus, S.; Mahlein, A.K. Technical workflows for hyperspectral plant image assessment and processing on the greenhouse and laboratory scale. Gigascience 2020, 9, giaa090. [Google Scholar] [CrossRef] [PubMed]
  34. Dammer, K.H. Proof of concept study: A novel mobile in-canopy imaging system for detecting symptoms of fungal diseases in cereals. J. Plant Dis. Prot. 2022, 129, 769–773. [Google Scholar] [CrossRef]
  35. Iori, A.; Scala, V.; Cesare, D.; Pinzari, F.; D’Egidio, M.G.; Fanelli, C.; Fabbri, A.A.; Reverberi, M.; Serranti, S. Hyperspectral and molecular analysis of Stagonospora nodorum blotch disease in durum wheat. Eur. J. Plant Pathol. 2015, 141, 689–702. [Google Scholar] [CrossRef]
  36. Singh, V.; Sharma, N.; Singh, S. A review of imaging techniques for plant disease detection. Artif. Intell. Agric. 2020, 4, 229–242. [Google Scholar] [CrossRef]
  37. Meier, U.; Bleiholder, H.; Buhr, L.; Feller, C.; Hack, H.; Heß, M.; Lancashire, P.; Schnock, U.; Stauß, R.; Van den Boom, T.; et al. The BBCH system to coding the phenological growth stages of plants-history and publications. J. Für Kult. 2009, 61, 41–52. [Google Scholar] [CrossRef]
  38. Ocean Optics, Ocean View Installation & Operation Manual United States America, 2016. Available online: https://www.oceaninsight.com/globalassets/catalog-blocks-and-images/manuals--instruction-ocean-optics/software/oceanviewio.pdf (accessed on 6 November 2022).
  39. Perceptron Neural Networks Description. Available online: https://www.mathworks.com/help/deeplearning/ug/perceptron-neural-networks.html (accessed on 24 February 2023).
  40. Bohnenkamp, D.; Behmann, J.; Mahlein, A.K. In-field detection of Yellow Rust in Wheat on the Ground Canopy and UAV Scale. Remote Sens. 2019, 11, 2495. [Google Scholar] [CrossRef] [Green Version]
  41. Golhani, K.; Balasundram, S.K.; Vadamalai, G.; Pradhan, B. Red-Edge indices to diagnose orange spotting disease of oil palm in Malaysia. In Proceedings of the 38th Asian Conference on Remote Sensing - Space Applications: Touching Human Lives, ACRS 2017, New Delhi, India, 23–27 October 2017. [Google Scholar]
  42. Kristoffersen, R.; Eriksen, L.B.; Nielsen, G.C.; Jørgensen, J.R.; Jørgensen, L.N. Management of Septoria Tritici Blotch Using Cultivar Mixtures. Plant Dis. 2022, 106, 1341–1349. [Google Scholar] [CrossRef]
  43. Castro, A.C.; Simón, M.R. Effect of tolerance to Septoria tritici blotch on grain yield, yield components and grain quality in Argentinean wheat cultivars. Crop Prot. 2016, 90, 66–76. [Google Scholar] [CrossRef]
  44. Ficke, A.; Cowger, C.; Bergstrom, G.; Brodal, G. Understanding yield loss and pathogen biology to improve disease management: Septoria nodorum blotch—A case study in wheat. Plant Dis. 2018, 102, 696–707. [Google Scholar] [CrossRef] [Green Version]
  45. Ghaffary, S.M.T.; Chawade, A.; Singh, P.K. Practical breeding strategies to improve resistance to Septoria tritici blotch of wheat. Euphytica 2018, 214, 122. [Google Scholar] [CrossRef]
  46. Cunfer, B.M. Stagonospora and Septoria diseases of barley, oat, and rye. Can. J. Plant Pathol. 2000, 22, 332–348. [Google Scholar] [CrossRef]
  47. Simko, I.; Jimenez-Berni, J.A.; Sirault, X.R.R. Phenomic approaches and tools for phytopathologists. Phytopathology 2017, 107, 6–17. [Google Scholar] [CrossRef] [Green Version]
  48. Mahlein, A.K.; Kuska, M.T.; Thomas, S.; Wahabzada, M.; Behmann, J.; Rascher, U.; Kersting, K. Quantitative and qualitative phenotyping of disease resistance of crops by hyperspectral sensors: Seamless interlocking of phytopathology, sensors, and machine learning is needed! Curr. Opin. Plant Biol. 2019, 50, 156–162. [Google Scholar] [CrossRef]
  49. Zahir, S.A.D.M.; Omar, A.F.; Jamlos, M.F.; Azmi, M.A.M.; Muncan, J. A review of visible and near-infrared (Vis-NIR) spectroscopy application in plant stress detection. Sens. Actuators A Phys. 2022, 338, 113468. [Google Scholar] [CrossRef]
  50. Ryckewaert, M.; Héran, D.; Simonneau, T.; Abdelghafour, F.; Boulord, R.; Saurin, N.; Moura, D.; Mas-Garcia, S.; Bendoula, R. Physiological variable predictions using VIS–NIR spectroscopy for water stress detection on grapevine: Interest in combining climate data using multiblock method. Comput. Electron. Agric. 2022, 197, 106973. [Google Scholar] [CrossRef]
  51. Kremneva, O.Y.; Danilov, R.Y.; Sereda, I.I.; Tutubalina, O.V.; Pachkin, A.A.; Zimin, M. V Spectral characteristics of winter wheat varieties depending on the development degree of Pyrenophora tritici-repentis. Precis. Agric. 2022. [Google Scholar] [CrossRef]
  52. Wegulo, S.N.; Breathnach, J.A.; Baenziger, P.S. Effect of growth stage on the relationship between tan spot and spot blotch severity and yield in winter wheat. Crop Prot. 2009, 28, 696–702. [Google Scholar] [CrossRef] [Green Version]
  53. Pierre, B.; Marie-Odile, B.; François, C.; David, G. Identifying traits leading to tolerance of wheat to Septoria tritici blotch. Field Crop Res. 2015, 180, 176–185. [Google Scholar] [CrossRef]
  54. Jevtić, R.; Župunski, V.; Lalošević, M.; Župunski, L. Predicting potential winter wheat yield losses caused by multiple disease systems and climatic conditions. Crop Prot. 2017, 99, 17–25. [Google Scholar] [CrossRef]
  55. Budka, A.; Łacka, A.; Gaj, R.; Jajor, E.; Korbas, M. Predicting winter wheat yields by comparing regression equations. Crop Prot. 2015, 78, 84–91. [Google Scholar] [CrossRef]
Figure 1. The degrees of septoriosis disease severity on spring wheat leaves and ears: (a) healthy leaf; (b) medium lesion on leaf; (c) severe lesion on leaf; (d) healthy ear; (e) medium lesion on ear; (f) severe lesion on ear.
Agronomy 13 01045 g001
Figure 2. The perceptron neural network architecture. Inputs p1, p2… pr are the hyperspectral signatures from one dataset.
Agronomy 13 01045 g002
Figure 3. Hyperspectral curves of one dataset after preprocessing of raw data (each chart includes 2000 curves): (a) curves of healthy leaf, (b) curves of leaf in medium stage of Septoria disease.
Agronomy 13 01045 g003
Figure 4. Two examples of curve dataset clusterization: (a) cluster of typical curves of healthy leaves; (b) cluster of invalid curves of healthy leaves; (c) cluster of typical curves of leaves with severe lesions caused by Septoria; (d) cluster of non-typical (invalid) curves of leaves with severe lesions caused by Septoria.
Agronomy 13 01045 g004
Figure 5. Datasets of means and quantiles of variety of hyperspectral curves of leaves: (a,c,e)—means of healthy, medium-damaged and severely damaged leaves, respectively; (b,d,f) quantile distribution of the same datasets.
Agronomy 13 01045 g005
Figure 6. Dataset means and quantiles of variety of hyperspectral curves of ears: (a,c,e)—means of healthy, medium-damaged and severely damaged ears, respectively; (b,d,f) quantile distribution of the same datasets.
Agronomy 13 01045 g006
Figure 7. Hyperspectral curves of reflectance of leaves (a,c,e) and ears (b,d,f)—means of healthy, medium-damaged and severely damaged leaves and ears, respectively, and values of the angle (%) between the branches of the graph.
Agronomy 13 01045 g007
Figure 8. Regression relationship between the degree of septoriosis lesion and yield loss: (a) STB lesion of flag-leaf; (b) SNB lesion of ears. Every circle is an individual measurement from the plot with studied wheat cultivar.
Agronomy 13 01045 g008
Table 1. Checking the results of the neural network determining the septoriosis diseases of wheat leaves and ears: the average value of the feature definition in % with a confidence interval of the average (detection percentage).
Defined with Neural NetworkCohen’s Kappa
Healthy, %Damaged, %Uncertain, %
Nominal scale
Leaves
Healthy leaves88.1 ± 2.410.6 ± 2.51.1 ± 0.10.90
Light lesion of Septoria84.0 ± 5.510.8 ± 6.15.0 ± 0.10.64
Medium lesion of Septoria60.5 ± 5.638.3 ± 5.91.2 ± 0.30.13
Severe lesion of Septoria7.1 ± 2.992.7 ± 3.10.1 ± 0.10.98
Dead leaves2.3 ± 3.097.7 ± 3.20.1 ± 0.10.99
Ears
Healthy ears94.9 ± 4.84.9 ± 4.70.1 ± 0.10.96
Light lesion of Septoria70.2 ± 6.529.2 ± 6.30.6 ± 0.20.40
Medium lesion of Septoria33.3 ± 7.665.6 ± 7.91.2 ± 0.20.24
Severe lesion of Septoria0.6 ± 1.099.4 ± 1.00.0 ± 0.00.99
Disclaimer/Publisher’s Note: The statements, opinions and data contained in all publications are solely those of the individual author(s) and contributor(s) and not of MDPI and/or the editor(s). MDPI and/or the editor(s) disclaim responsibility for any injury to people or property resulting from any ideas, methods, instructions or products referred to in the content.

