
Genomic Association Mapping of Apparent Amylose and Protein Concentration in Milled Rice

 ,
,
Abstract
:1. Introduction
2. Materials and Methods
2.1. Plant Materials and Field Plots
2.2. Grain Apparent Amylose and Grain Protein Determination
2.3. Marker Data and Genome-Wide Association Analysis (GWAS)
2.4. Statistical Analyses
3. Results
3.1. Grain Protein and Apparent Amylose Concentration
3.2. Screening for SNP-Trait Associations Using GWAS
4. Discussion
5. Conclusions
Supplementary Materials
Author Contributions
Funding
Institutional Review Board Statement
Informed Consent Statement
Data Availability Statement
Acknowledgments
Conflicts of Interest
References
- Wang, X.; Pang, Y.; Zhang, J.; Wu, Z.; Chen, K.; Ali, J.; Ye, G.; Xu, J.; Li, Z. Genome-wide and gene-based association mapping for rice eating and cooking characteristics and protein content. Sci. Rep. 2017, 7, 17203. [Google Scholar] [CrossRef] [Green Version]
- Li, H.; Prakash, S.; Nicholson, T.M.; Fitzgerald, M.A.; Gilbert, R.G. The importance of amylose and amylopectin fine structure for textural properties of cooked rice grains. Food Chem. 2016, 196, 702–711. [Google Scholar] [CrossRef] [PubMed] [Green Version]
- Bhattacharya, K.; Juliano, B. Rice: Chemistry and Technology; AACC: St Paul, MN, USA, 1985; p. 289. [Google Scholar]
- Fitzgerald, M.A.; McCouch, S.R.; Hall, R.D. Not just a grain of rice: The quest for quality. Trends Plant Sci. 2009, 14, 133–139. [Google Scholar] [CrossRef]
- Peng, Y.; Mao, B.; Zhang, C.; Shao, Y.; Wu, T.; Hu, L.; Hu, Y.; Tang, L.; Li, Y.; Tang, W.; et al. Influence of physicochemical properties and starch fine structure on the eating quality of hybrid rice with similar apparent amylose content. Food Chem. 2021, 353, 129461. [Google Scholar] [CrossRef] [PubMed]
- Chen, Y.; Wang, M.; Ouwerkerk, P.B.F. Molecular and environmental factors determining grain quality in rice. Food Energy Secur. 2012, 1, 111–132. [Google Scholar] [CrossRef]
- Patindol, J.; Wang, Y.-J. Fine Structures and Physicochemical Properties of Starches from Chalky and Translucent Rice Kernels. J. Agric. Food Chem. 2003, 51, 2777–2784. [Google Scholar] [CrossRef] [PubMed]
- Yu, S.; Ma, Y.; Sun, D.W. Impact of amylose content on starch retrogradation and texture of cooked milled rice during storage. J. Cereal Sci. 2009, 50, 139–144. [Google Scholar] [CrossRef]
- Chen, M.H.; Bergman, C.J.; McClung, A.M.; Everette, J.D.; Tabien, R.E. Resistant starch: Variation among high amylose rice varieties and its relationship with apparent amylose content, pasting properties and cooking methods. Food Chem. 2017, 234, 180–189. [Google Scholar] [CrossRef]
- Raigond, P.; Ezekiel, R.; Raigond, B. Resistant starch in food: A review. J. Sci. Food Agric. 2014, 95, 1968–1978. [Google Scholar] [CrossRef]
- Birt, D.F.; Boylston, T.; Hendrich, S.; Jane, J.-L.; Hollis, J.; Li, L.; McClelland, J.; Moore, S.; Phillips, G.J.; Rowling, M.; et al. Resistant Starch: Promise for Improving Human Health. Adv. Nutr. Int. Rev. J. 2013, 4, 587–601. [Google Scholar] [CrossRef] [PubMed] [Green Version]
- Fitzgerald, M.A.; Rahman, S.; Resurreccion, A.P.; Concepcion, J.; Daygon, V.D.; Dipti, S.S.; Kabir, K.A.; Klingner, B.; Morell, M.K.; Bird, A.R. Identification of a Major Genetic Determinant of Glycaemic Index in Rice. Rice 2011, 4, 66–74. [Google Scholar] [CrossRef] [Green Version]
- Peng, B.; Kong, H.; Li, Y.; Wang, L.; Zhong, M.; Sun, L.; Gao, G.; Zhang, Q.; Luo, L.; Wang, G.; et al. OsAAP6 functions as an important regulator of grain protein content and nutritional quality in rice. Nat. Commun. 2014, 5, 4847. [Google Scholar] [CrossRef] [Green Version]
- Ye, G.; Liang, S.; Wan, J. QTL mapping of protein content in rice using single chromosome segment substitution lines. Theor. Appl. Genet. 2010, 121, 741–750. [Google Scholar] [CrossRef]
- Syahariza, Z.A.; Sar, S.; Hasjim, J.; Tizzotti, M.J.; Gilbert, R.G. The importance of amylose and amylopectin fine structures for starch digestibility in cooked rice grains. Food Chem. 2013, 136, 742–749. [Google Scholar] [CrossRef]
- Champagne, E.T.; Bett-Garber, K.L.; McClung, A.M.; Bergman, C. Sensory Characteristics of Diverse Rice Cultivars as Influenced by Genetic and Environmental Factors. Cereal Chem. 2004, 81, 237–243. [Google Scholar] [CrossRef]
- Balindong, J.L.; Ward, R.M.; Liu, L.; Rose, T.J.; Pallas, L.A.; Ovenden, B.W.; Snell, P.J.; Waters, D.L.E. Rice grain protein composition influences instrumental measures of rice cooking and eating quality. J. Cereal Sci. 2018, 79, 35–42. [Google Scholar] [CrossRef] [Green Version]
- Huang, L.; Li, Q.; Zhang, C.; Chu, R.; Gu, Z.; Tan, H.; Zhao, D.; Fan, X.; Liu, Q. Creating novel Wx alleles with fine-tuned amylose levels and improved grain quality in rice by promoter editing using CRISPR/Cas9 system. Plant Biotechnol. J. 2020, 18, 2164–2166. [Google Scholar] [CrossRef]
- Liu, X.; Ding, Q.; Wang, W.; Pan, Y.; Tan, C.; Qiu, Y.; Chen, Y.; Li, H.; Li, Y.; Ye, N.; et al. Targeted Deletion of the First Intron of the Wxb Allele via CRISPR/Cas9 Significantly Increases Grain Amylose Content in Rice. Rice 2022, 15, 1. [Google Scholar] [CrossRef]
- Achary, V.; Reddy, M.K. CRISPR-Cas9 mediated mutation in GRAIN WIDTH and WEIGHT2 (GW2) locus improves aleurone layer and grain nutritional quality in rice. Sci. Rep. 2021, 11, 21941. [Google Scholar] [CrossRef]
- Wang, S.; Yang, Y.; Guo, M.; Zhong, C.; Yan, C.; Sun, S. Targeted mutagenesis of amino acid transporter genes for rice quality improvement using the CRISPR/Cas9 system. Crop J. 2020, 8, 457–464. [Google Scholar] [CrossRef]
- Wambugu, P.; Ndjiondjop, M.N.; Furtado, A.; Henry, R. Sequencing of bulks of segregants allows dissection of genetic control of amylose content in rice. Plant Biotechnol. J. 2017, 16, 100–110. [Google Scholar] [CrossRef] [Green Version]
- Biselli, C.; Volante, A.; Desiderio, F.; Tondelli, A.; Gianinetti, A.; Finocchiaro, F.; Taddei, F.; Gazza, L.; Sgrulletta, D.; Cattivelli, L.; et al. GWAS for Starch-Related Parameters in Japonica Rice (Oryza sativa L.). Plants 2019, 8, 292. [Google Scholar] [CrossRef] [Green Version]
- Butardo, V.M., Jr.; Anacleto, R.; Parween, S.; Samson, I.; de Guzman, K.; Alhambra, C.M.; Misra, G.; Sreenivasulu, N. Systems genetics identifies a novel regulatory domain of amylose synthesis. Plant Physiol. 2017, 173, 887–906. [Google Scholar] [CrossRef] [Green Version]
- Verma, R.K.; Chetia, S.K.; Sharma, V.; Baishya, S.; Sharma, H.; Modi, M.K. GWAS to spot candidate genes associated with grain quality traits in diverse rice accessions of North East India. Mol. Biol. Rep. 2022, 1–13. [Google Scholar] [CrossRef]
- Li, X.; Yan, W.; Agrama, H.; Hu, B.; Jia, L.; Jia, M.; Jackson, A.; Moldenhauer, K.; McClung, A.; Wu, D. Genotypic and phenotypic characterization of genetic differentiation and diversity in the USDA rice mini-core collection. Genetica 2010, 138, 1221–1230. [Google Scholar] [CrossRef]
- Juliano, B.O. A simplified assay for milled-rice amylose. Cereal Sci. Today 1971, 16, 334–360. [Google Scholar]
- Müller, J. Dumas or Kjeldahl for reference analysis? Anal. Beyond Meas. 2017, 1–5. [Google Scholar]
- Johnson, C. Changing the Face of Agricultural Genomics. Arab Gulf J. Sci. Res. 2019, 2, 37. [Google Scholar]
- Kawahara, Y.; de la Bastide, M.; Hamilton, J.P.; Kanamori, H.; McCombie, W.R.; Ouyang, S.; Schwartz, D.C.; Tanaka, T.; Wu, J.; Zhou, S.; et al. Improvement of the Oryza sativa Nipponbare reference genome using next generation sequence and optical map data. Rice 2013, 6, 1–10. [Google Scholar] [CrossRef] [Green Version]
- Sakai, H.; Lee, S.S.; Tanaka, T.; Numa, H.; Kim, J.; Kawahara, Y.; Wakimoto, H.; Yang, C.-C.; Iwamoto, M.; Abe, T.; et al. Rice Annotation Project Database (RAP-DB): An Integrative and Interactive Database for Rice Genomics. Plant Cell Physiol. 2013, 54, e6. [Google Scholar] [CrossRef]
- Browning, S.R.; Browning, B.L. Rapid and Accurate Haplotype Phasing and Missing-Data Inference for Whole-Genome Association Studies By Use of Localized Haplotype Clustering. Am. J. Hum. Genet. 2007, 81, 1084–1097. [Google Scholar] [CrossRef] [Green Version]
- Bradbury, P.J.; Zhang, Z.; Kroon, D.E.; Casstevens, T.M.; Ramdoss, Y.; Buckler, E.S. TASSEL: Software for association mapping of complex traits in diverse samples. Bioinformatics 2007, 23, 2633–2635. [Google Scholar] [CrossRef]
- Endelman, J.B.; Jannink, J.-L. Shrinkage Estimation of the Realized Relationship Matrix. G3 Genes Genomes Genet. 2012, 2, 1405–1413. [Google Scholar] [CrossRef]
- Turner, S. Qqman: Q-Q and Manhattan Plots for GWAS Data. R Package Version 0.1.4. 2017. Available online: https://CRAN.R-project.org/package=qqman (accessed on 24 March 2021).
- Gao, X.; Becker, L.C.; Becker, D.M.; Starmer, J.D.; Province, M.A. Avoiding the high Bonferroni penalty in genome-wide association studies. Genet. Epidemiol. 2009, 34, 100–105. [Google Scholar] [CrossRef] [Green Version]
- Mather, K.A.; Caicedo, A.L.; Polato, N.R.; Olsen, K.M.; McCouch, S.; Purugganan, M.D. The Extent of Linkage Disequilibrium in Rice (Oryza sativa L.). Genetics 2007, 177, 2223–2232. [Google Scholar] [CrossRef] [Green Version]
- Huang, X.; Wei, X.; Sang, T.; Zhao, Q.; Feng, Q.; Zhao, Y.; Li, C.; Zhu, C.; Lu, T.; Zhang, Z.; et al. Genome-wide association studies of 14 agronomic traits in rice landraces. Nat. Genet. 2010, 42, 961–967. [Google Scholar] [CrossRef]
- Leng, Y.; Xue, D.; Yang, Y.; Hu, S.; Su, Y.; Huang, L.; Wang, L.; Zheng, T.; Zhang, G.; Hu, J.; et al. Mapping of QTLs for eating and cooking quality-related traits in rice (Oryza sativa L.). Euphytica 2014, 197, 99–108. [Google Scholar] [CrossRef]
- Hu, Z.-L.; Li, P.; Zhou, M.-Q.; Zhang, Z.-H.; Wang, L.-X.; Zhu, L.-H.; Zhu, Y.-G. Mapping of quantitative trait loci (QTLs) for rice protein and fat content using doubled haploid lines. Euphytica 2004, 135, 47–54. [Google Scholar] [CrossRef]
- Zhang, W.; Bi, J.; Chen, L.; Zheng, L.; Ji, S.; Xia, Y.; Xie, K.; Zhao, Z.; Wang, Y.; Liu, L.; et al. QTL mapping for crude protein and protein fraction contents in rice (Oryza sativa L.). J. Cereal Sci. 2008, 48, 539–547. [Google Scholar] [CrossRef]
- Chattopadhyay, K.; Behera, L.; Bagchi, T.B.; Sardar, S.S.; Moharana, N.; Patra, N.R.; Chakraborti, M.; Das, A.; Marndi, B.C.; Sarkar, A.; et al. Detection of stable QTLs for grain protein content in rice (Oryza sativa L.) employing high throughput phenotyping and genotyping platforms. Sci. Rep. 2019, 9, 3196. [Google Scholar] [CrossRef]
- Aboubacar, A.; Moldenhauer, K.A.; McClung, A.M.; Beighley, D.H.; Hamaker, B.R. Effect of Growth Location in the United States on Amylose Content, Amylopectin Fine Structure, and Thermal Properties of Starches of Long Grain Rice Cultivars. Cereal Chem. 2006, 83, 93–98. [Google Scholar] [CrossRef]
- Asaoka, M.; Okuno, K.; Fuwa, H. Effect of environmental temperature at the milky stage on amylose content and fine structure of amylopectin of waxy and nonwaxy endosperm starches of rice (Oryza sativa L.). Agric. Biol. Chem. 1985, 49, 373–379. [Google Scholar]
- Bao, J.; Kong, X.; Xie, J.; Xu, L. Analysis of Genotypic and Environmental Effects on Rice Starch. 1. Apparent Amylose Content, Pasting Viscosity, and Gel Texture. J. Agric. Food Chem. 2004, 52, 6010–6016. [Google Scholar] [CrossRef]
- Chen, M.-H.; Bergman, C.; Pinson, S.; Fjellstrom, R. Waxy gene haplotypes: Associations with apparent amylose content and the effect by the environment in an international rice germplasm collection. J. Cereal Sci. 2008, 47, 536–545. [Google Scholar] [CrossRef]
- Sato, Y.; Takehisa, H.; Kamatsuki, K.; Minami, H.; Namiki, N.; Ikawa, H.; Ohyanagi, H.; Sugimoto, K.; Antonio, B.A.; Nagamura, Y. RiceXPro Version 3.0: Expanding the informatics resource for rice transcriptome. Nucleic Acids Res. 2012, 41, D1206–D1213. [Google Scholar] [CrossRef] [Green Version]
- De Schutter, K.; Van Damme, E.J.M. Protein-Carbohydrate Interactions as Part of Plant Defense and Animal Immunity. Molecules 2015, 20, 9029–9053. [Google Scholar] [CrossRef] [Green Version]
- Zhu, G.; Ye, N.; Yang, J.; Peng, X.; Zhang, J. Regulation of expression of starch synthesis genes by ethylene and ABA in relation to the development of rice inferior and superior spikelets. J. Exp. Bot. 2011, 62, 3907–3916. [Google Scholar] [CrossRef] [Green Version]
- Hanashiro, I.; Itoh, K.; Kuratomi, Y.; Yamazaki, M.; Igarashi, T.; Matsugasako, J.-I.; Takeda, Y. Granule-Bound Starch Synthase I is Responsible for Biosynthesis of Extra-Long Unit Chains of Amylopectin in Rice. Plant Cell Physiol. 2008, 49, 925–933. [Google Scholar] [CrossRef] [Green Version]


| Apparent Amylose Classification | Number of Accessions 2018 Season | Number of Accessions 2019 Season |
|---|---|---|
| Waxy | 4 | 6 |
| Very low | 22 | 46 |
| Low | 92 | 105 |
| Intermediate | 59 | 43 |
| High | 40 | 7 |
| Trait (Season) | SNP Marker | Chromosome | Position (Base Pairs) | p-Value | R2 | Allele Effect |
|---|---|---|---|---|---|---|
| Protein Concentration (2018) | S01_36225938 | 1 | 36,225,938 | 1.84 × 10⁻⁷ | 0.137 | −0.059 |
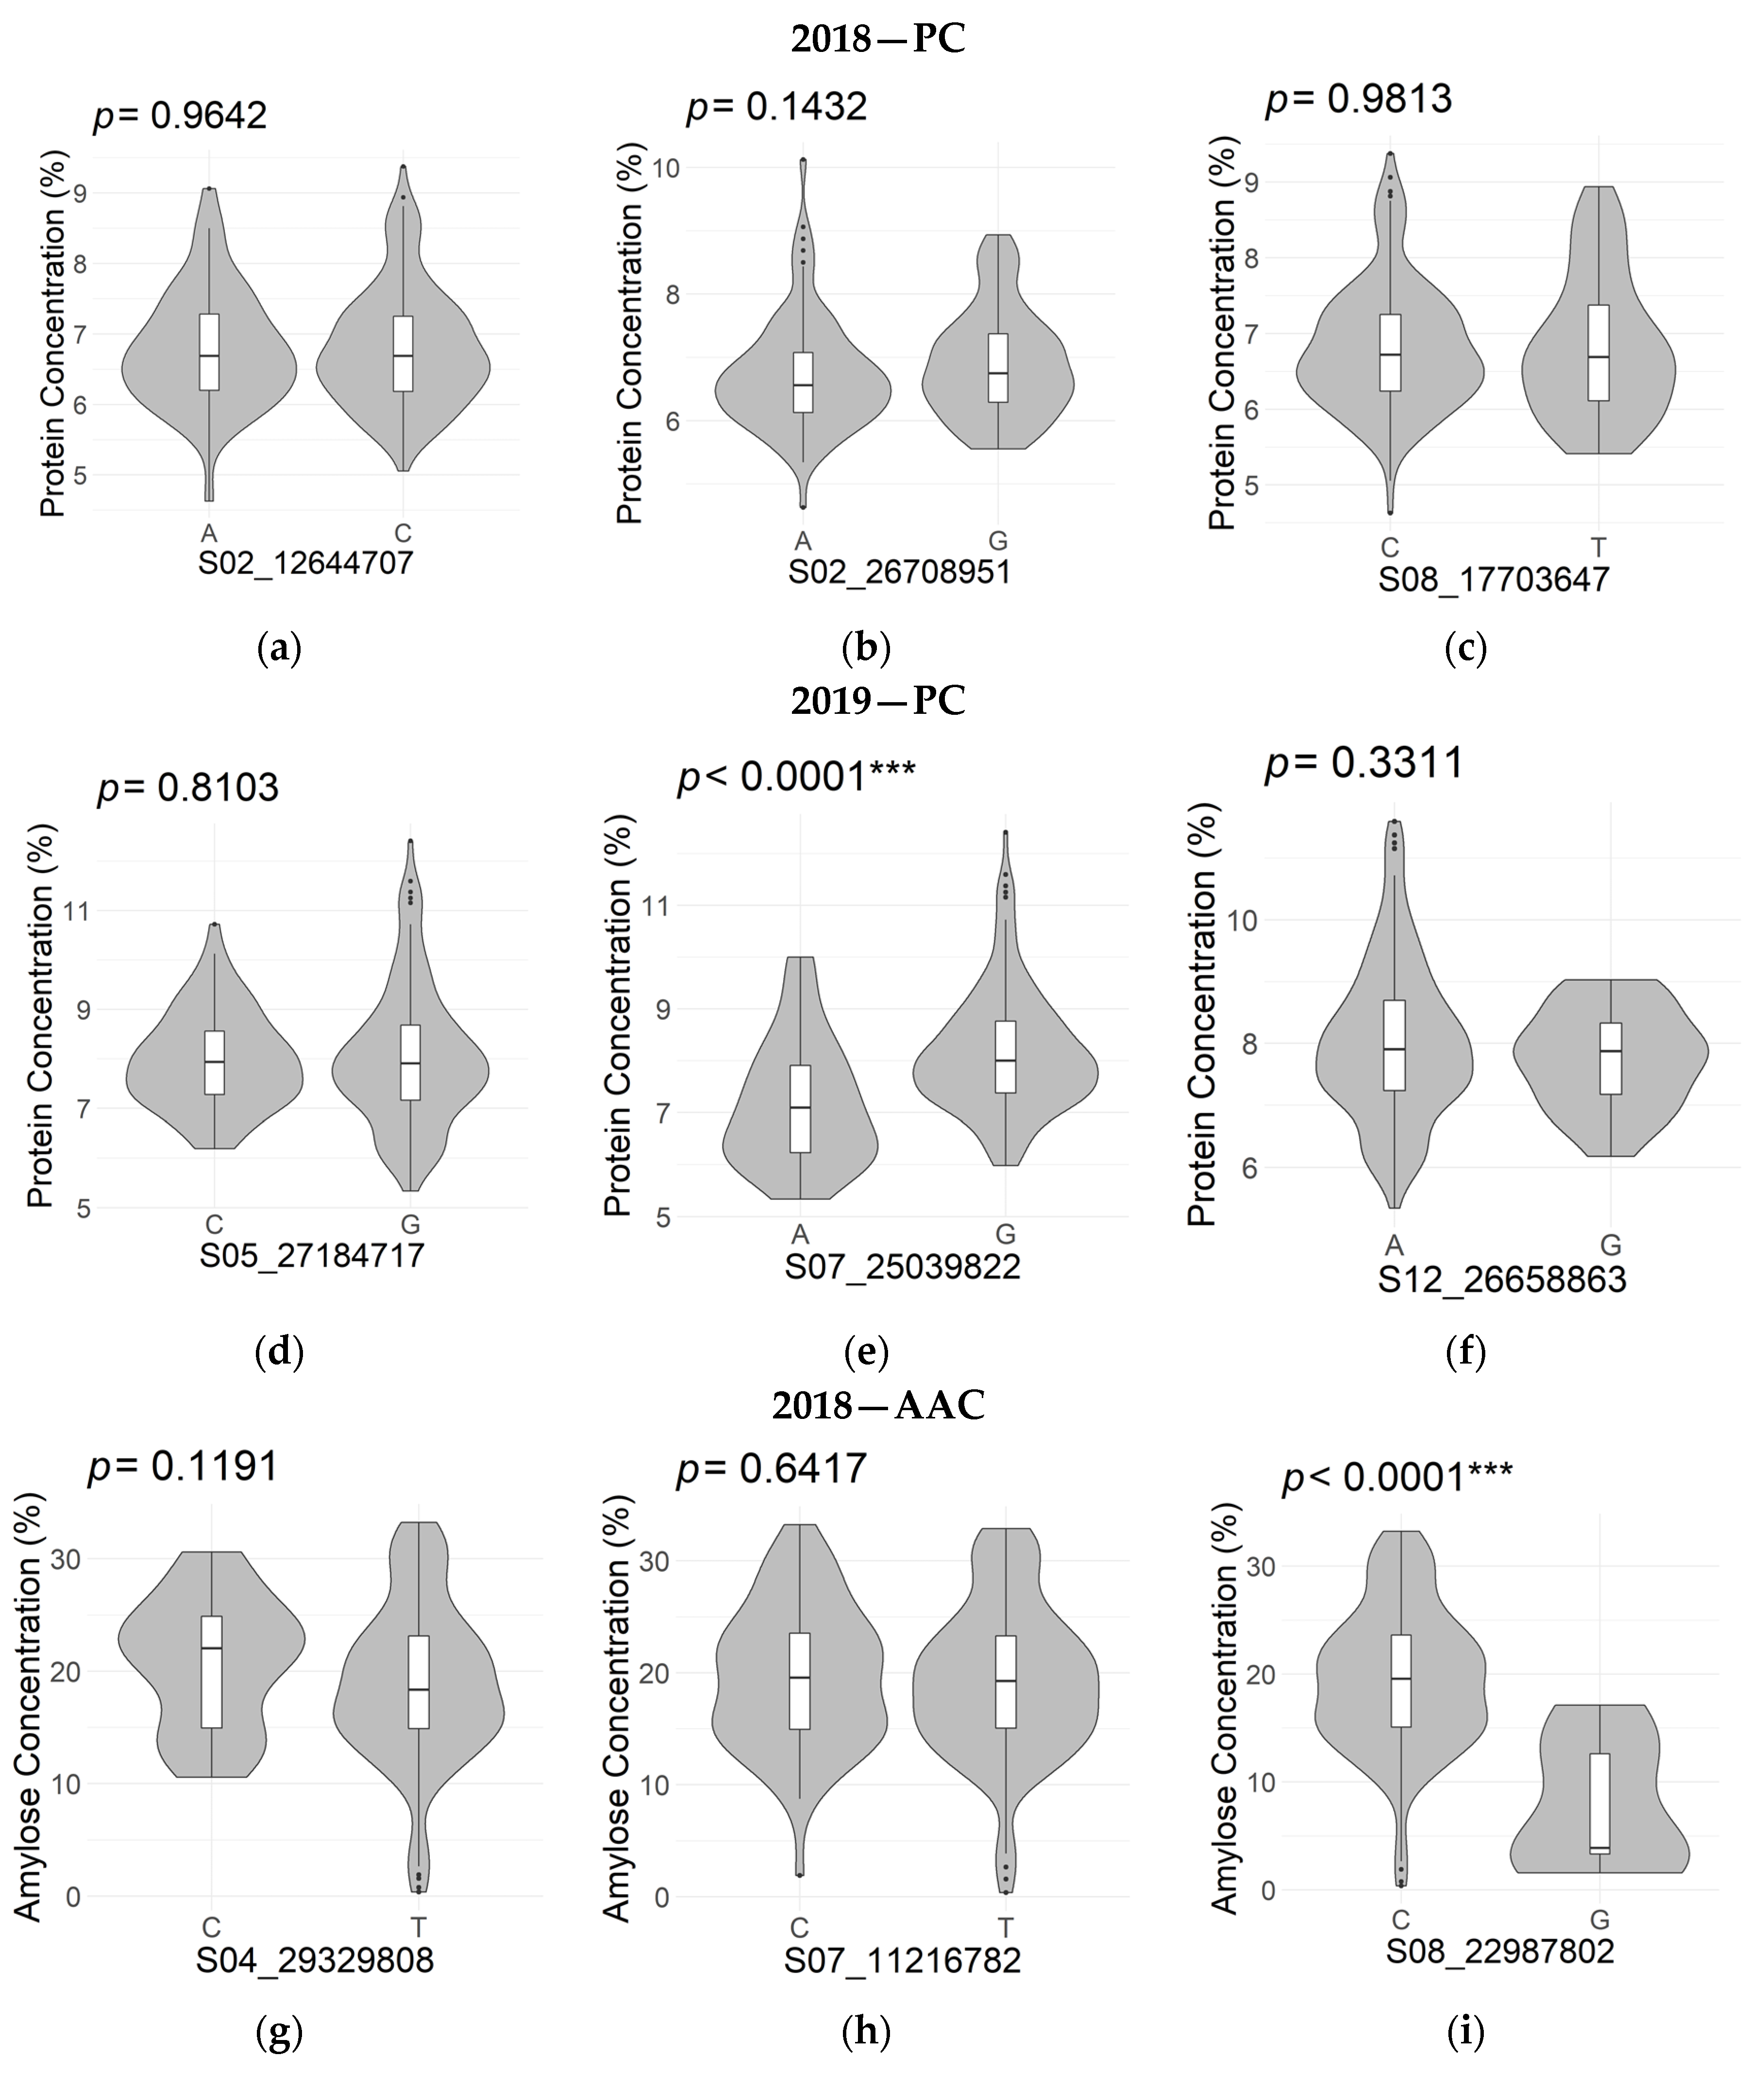
| S02_12644707 | 2 | 12,644,707 | 2.23 × 10⁻⁸ | 0.153 | −0.168 | |
| S02_26708951 | 2 | 26,708,951 | 4.90 × 10⁻⁹ | 0.167 | −0.167 | |
| S04_28680892 | 4 | 28,680,892 | 1.43 × 10⁻⁷ | 0.138 | 0.161 | |
| S08_17703647 | 8 | 17,703,647 | 2.12 × 10⁻⁸ | 0.153 | −0.209 | |
| S10_7561107 | 10 | 7,561,107 | 1.56 × 10⁻⁷ | 0.137 | 0.077 | |
| S10_10978682 | 10 | 10,978,682 | 1.29 × 10⁻⁷ | 0.140 | 0.051 | |
| S10_21407969 | 10 | 21,407,969 | 1.73 × 10⁻⁷ | 0.137 | 0.087 | |
| S10_21408016 | 10 | 21,408,016 | 1.32 × 10⁻⁷ | 0.138 | −0.225 | |
| S11_15568406 | 11 | 15,568,406 | 1.66 × 10⁻⁷ | 0.137 | 0.111 | |
| Protein Concentration (2019) | S01_32198354 | 1 | 32,198,354 | 1.35 × 10⁻⁹ | 0.185 | −0.050 |
| S02_6959467 | 2 | 6,959,467 | 1.09 × 10⁻¹⁰ | 0.203 | 0.632 | |
| S02_14624561 | 2 | 14,624,561 | 2.77 × 10⁻⁹ | 0.177 | −1.330 | |
| S02_25383967 | 2 | 25,383,967 | 9.21 × 10⁻⁸ | 0.150 | 0.277 | |
| S04_32077706 | 4 | 32,077,706 | 1.61 × 10⁻⁸ | 0.165 | 0.661 | |
| S04_32077761 | 4 | 32,077,761 | 1.61 × 10⁻⁸ | 0.165 | −0.661 | |
| S04_32077827 | 4 | 32,077,827 | 4.67 × 10⁻⁸ | 0.156 | 0.648 | |
| S04_27933097 | 4 | 27,933,097 | 2.76 × 10⁻⁸ | 0.165 | 0.239 | |
| S04_17895938 | 4 | 17,895,938 | 3.96 × 10⁻⁸ | 0.154 | 0.399 | |
| S05_27184717 | 5 | 27,184,717 | 4.13 × 10⁻¹⁴ | 0.258 | −0.366 | |
| S06_31841867 | 6 | 31,841,867 | 6.94 × 10⁻⁸ | 0.148 | 0.012 | |
| S07_23761720 | 7 | 23,761,720 | 1.27 × 10⁻⁹ | 0.184 | −1.020 | |
| S07_25039822 | 7 | 25,039,822 | 2.54 × 10⁻¹³ | 0.247 | −0.717 | |
| S07_25039804 | 7 | 25,039,804 | 1.99 × 10⁻¹⁰ | 0.197 | 0.513 | |
| S07_27349671 | 7 | 27,349,671 | 6.45 × 10⁻¹⁰ | 0.188 | 0.841 | |
| S07_27345896 | 7 | 27,345,896 | 1.83 × 10⁻⁹ | 0.180 | −0.805 | |
| S08_15381100 | 8 | 15,381,100 | 3.76 × 10⁻¹¹ | 0.201 | 1.688 | |
| S09_15114981 | 9 | 15,114,981 | 4.50 × 10⁻⁸ | 0.157 | 0.229 | |
| S09_23506233 | 9 | 23,506,233 | 9.35 × 10⁻⁹ | 0.163 | −0.612 | |
| S11_4473024 | 11 | 4,473,024 | 2.07 × 10⁻¹² | 0.239 | −0.085 | |
| S11_24669964 | 11 | 24,669,964 | 7.91 × 10⁻⁹ | 0.168 | −0.079 | |
| S12_26658863 | 12 | 26,658,863 | 9.98 × 10⁻¹⁴ | 0.259 | 0.439 | |
| Apparent Amylose Concentration (2018) | S04_29329808 | 4 | 29,329,808 | 1.52 × 10⁻⁵ | 0.104 | 6.726 |
| S07_11216782 | 7 | 11,216,782 | 3.76 × 10⁻⁶ | 0.123 | 0.716 | |
| S08_22987802 | 8 | 22,987,802 | 4.80 × 10⁻⁶ | 0.120 | 7.388 | |
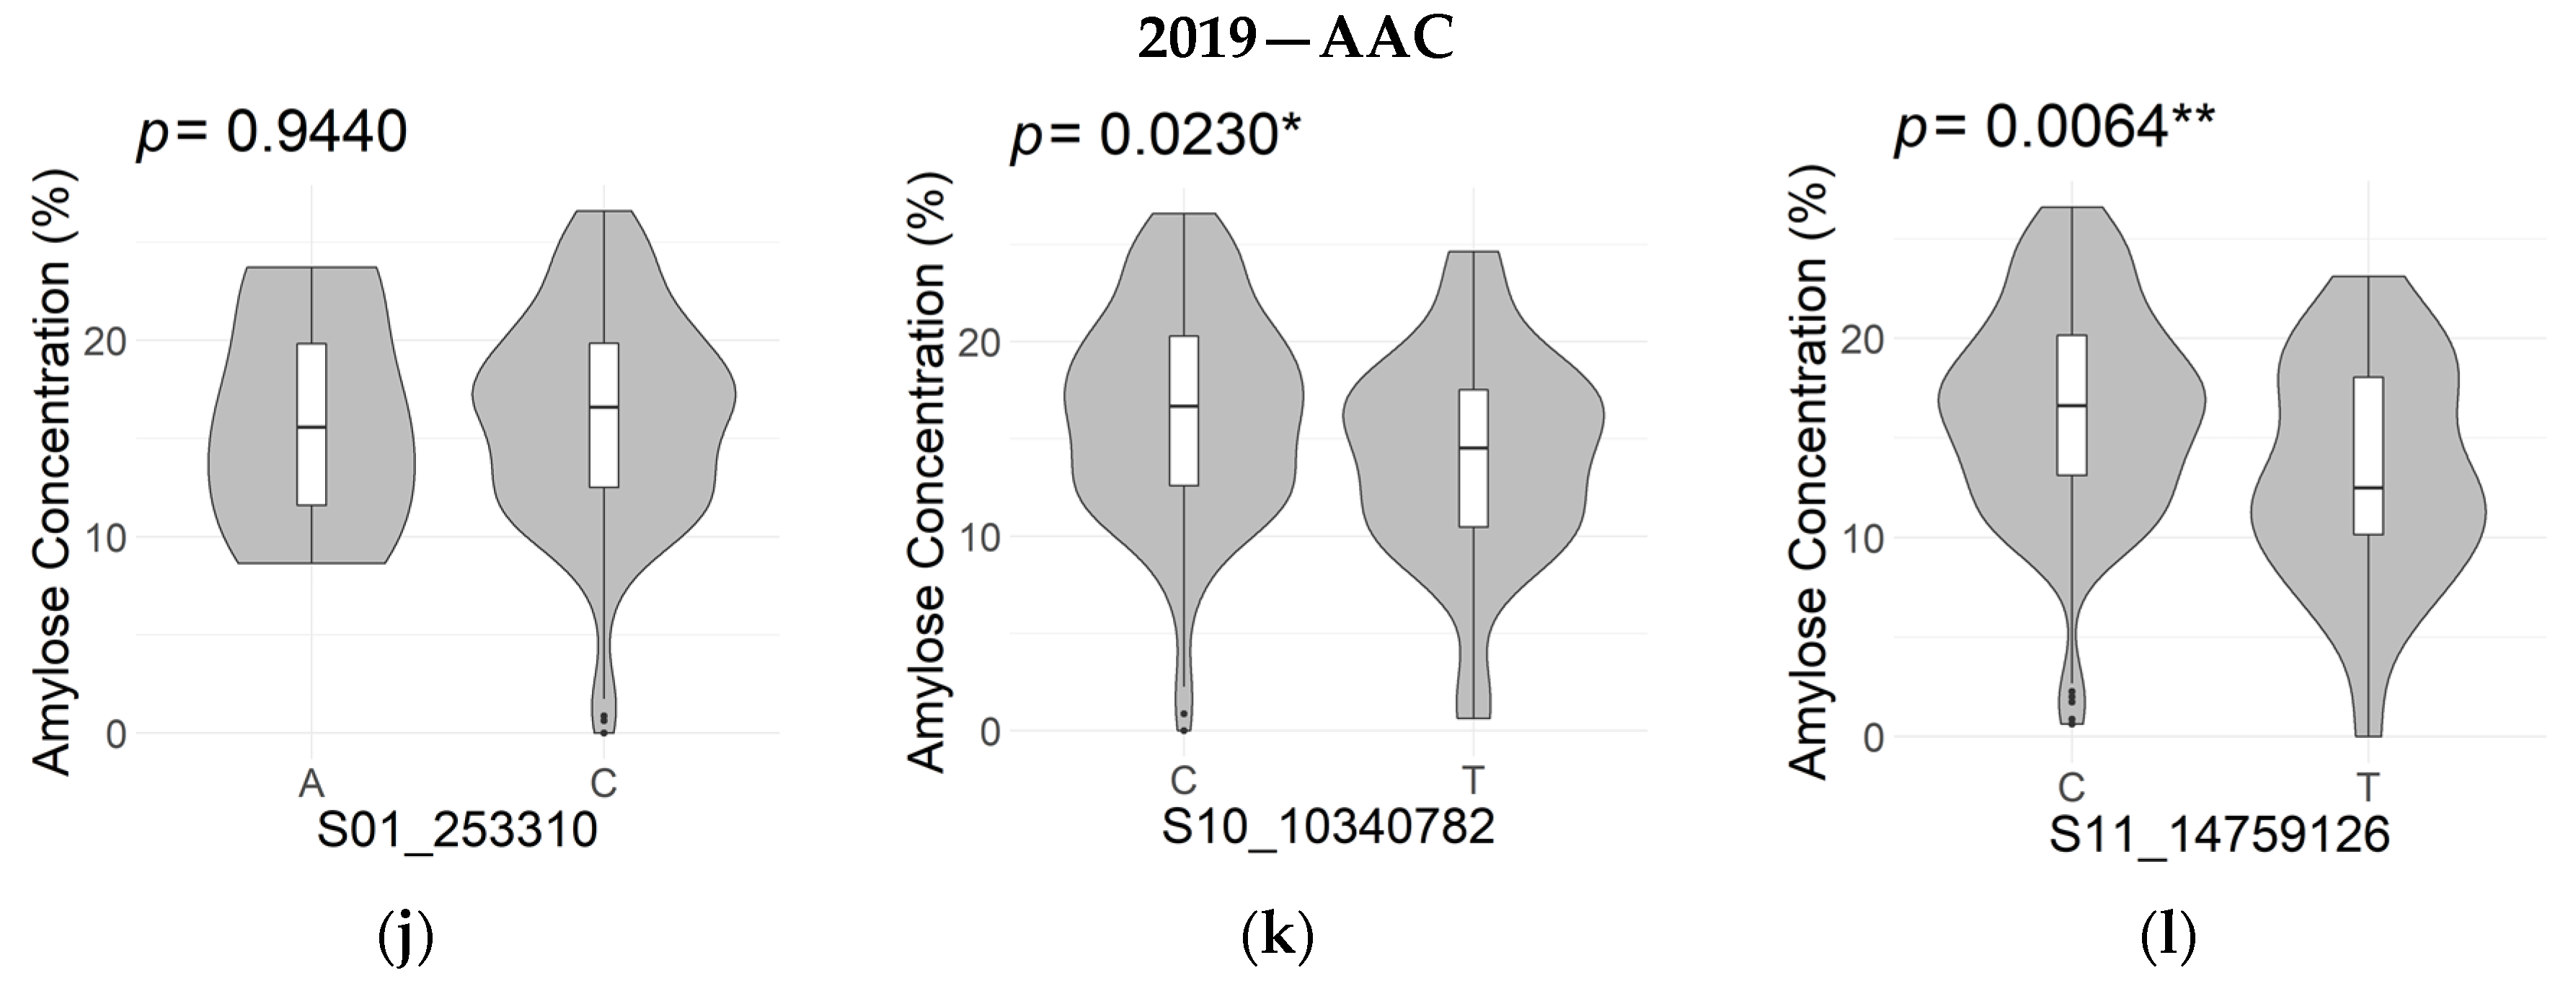
| Apparent Amylose Concentration (2019) | S01_253310 | 1 | 253,310 | 2.78 × 10⁻⁶ | 0.130 | 0.556 |
| S01_253309 | 1 | 253,309 | 3.39 × 10⁻⁶ | 0.129 | −0.552 | |
| S10_10340782 | 10 | 10,340,782 | 8.90 × 10⁻⁶ | 0.122 | 1.646 | |
| S11_14759126 | 11 | 14,759,126 | 1.83 × 10⁻⁶ | 0.135 | 2.835 |
Publisher’s Note: MDPI stays neutral with regard to jurisdictional claims in published maps and institutional affiliations. |
© 2022 by the authors. Licensee MDPI, Basel, Switzerland. This article is an open access article distributed under the terms and conditions of the Creative Commons Attribution (CC BY) license (https://creativecommons.org/licenses/by/4.0/).
Share and Cite
Alpuerto, J.B.B.; Samonte, S.O.P.B.; Sanchez, D.L.; Croaker, P.A.; Wang, Y.-J.; Wilson, L.T.; Christensen, E.F.; Tabien, R.E.; Yan, Z.; Thomson, M.J. Genomic Association Mapping of Apparent Amylose and Protein Concentration in Milled Rice. Agronomy 2022, 12, 857. https://doi.org/10.3390/agronomy12040857
Alpuerto JBB, Samonte SOPB, Sanchez DL, Croaker PA, Wang Y-J, Wilson LT, Christensen EF, Tabien RE, Yan Z, Thomson MJ. Genomic Association Mapping of Apparent Amylose and Protein Concentration in Milled Rice. Agronomy. 2022; 12(4):857. https://doi.org/10.3390/agronomy12040857
Chicago/Turabian StyleAlpuerto, Jasper Benedict B., Stanley Omar P. B. Samonte, Darlene L. Sanchez, Peyton A. Croaker, Ya-Jane Wang, Lloyd T. Wilson, Eric F. Christensen, Rodante E. Tabien, Zongbu Yan, and Michael J. Thomson. 2022. "Genomic Association Mapping of Apparent Amylose and Protein Concentration in Milled Rice" Agronomy 12, no. 4: 857. https://doi.org/10.3390/agronomy12040857