
Water Purification by Potassium Humate–C.I. Basic Blue 3 Adsorption-Based Interactions


1
Inorganic Chemistry Laboratory, Department of Chemistry, National and Kapodistrian University of Athens, Panepistimiopolis, 157 71 Athens, Greece
2
Dyeing, Finishing, Dyestuffs and Advanced Polymers Laboratory, DIDPE, University of West Attica, 250 Thivon St., 122 41 Athens, Greece
*
Authors to whom correspondence should be addressed.
Agronomy 2021, 11(8), 1625; https://doi.org/10.3390/agronomy11081625
Submission received: 30 June 2021
/
Revised: 6 August 2021
/
Accepted: 10 August 2021
/
Published: 16 August 2021
(This article belongs to the Special Issue Humic Substances: A Novel Eco-Friendly Fertilizer)
Abstract
:Interactions of C.I. Basic Blue 3 with potassium humate in aqueous systems were investigated. Both the humic content and dye removal are of crucial significance in relation to water of a desired quality. Dye retention experiments demonstrated that potassium humate is an exceptionally efficient adsorbent. The effect of both the pH and temperature on the adsorption process was investigated. The temperature proved to only slightly influence the extent of dye sorption; contrarily, under mildly acidic conditions (pH = 4.0), the quantity of dye adsorbed was doubled on standing. At this pH value, interactions between the positively charged dye and the dissociated carboxyl groups of humic substances are encountered. This was also supported by the obedience of the experimental data to the pseudo-second-order kinetic model. Three adsorption models, i.e., Langmuir, Freundlich and BET, were fitted to the experimental data; the equilibrium adsorption conformed to the Langmuir and BET isotherm equations on the basis of electrostatic dye–humics interactions, while the fitting of the Freundlich model referred to the heterogeneities of humic substances attributed to their colloidal behavior. Thermodynamic quantities, i.e., enthalpy, entropy and free energy change in the adsorption, were calculated. The low values verify the negligible effect of the temperature on the adsorption; denotes a thermodynamically favorable reaction, and denotes a spontaneous process.
1. Introduction
Oxazine cationic dyes contain a positive-charged chromophore in their molecule. C.I. Basic Blue 3 (C.I. 51004), presented in Figure 1, is a chloride salt that may be used in the coloration of paper and in the dyeing of polyacrylonitrile fibers. Based on the population put at risk, the synthetic dye industry and dyeing processes are amongst the top ten sources of pollution [1].
Humic substances (HS) are supramolecular associations of self-assembling heterogeneous and relatively small molecules—rather than coils of polymeric macromolecules—held together by hydrophobic bonding [2], deriving from the degradation and decomposition of dead biological material; they are natural organic polyelectrolytes formed from the biochemical weathering of plant and animal remains [3]. These substances possess surface sites available for the deprotonation and potential adsorption of cations. From zeta potential measurements [4], a negative surface charge due to the existence of polar functional groups (e.g., carboxylic) has been observed that can be involved in chemical bonding with the pollutants adsorbed.
Humics interact with all classes of ecotoxicants including azo dyes [5]. A cationic dye has been shown to interact with the anionic groups of HS through electrostatic forces of attraction [6]; a humic acid-immobilized amine-modified polyacrylamide/bentonite composite (HA-Am-PAA-B) has been used as an adsorbent for the adsorption of cationic dyes [7]; and humic acid (HA)-modified Fe3O4 nanoparticles (Fe3O4/HA) have been developed for the removal of Rhodamine B from water [8].
Dyes from effluents of dyestuff manufacturing industries and residual unfixed dyes present in exhausted aqueous dyebaths may result in environmental pollution after their discharge into the receiving waters. Contaminated wastewaters containing a basic dye have been treated using teak sawdust as an adsorbent [9] to make the impure wastewater reusable. Irrigation of plantations with dye-contaminated surface waters may present problems for agriculture. Low concentrations of humic acid bound to cationic dyes can promote dye photodegradation [10]. Thus, dye–HS associations lead to the removal of the sorbed colorant from both the soil and water. This process appears to be a promising remediation strategy as photolytic dye destruction may also occur. On the other hand, humic substances may pose several practical problems in terms of the drinking water production from surface waters and of the water treatment itself; therefore, new adsorption mechanisms for effective removal of humic substances from water [11] remain the subject of special research interest.
Although there is a large amount of published agronomic literature concerning dye removal by adsorbents containing humic substances [12,13,14], very few studies are disclosed in the literature regarding dye adsorption on the humics themselves. In this work, the adsorption of C.I. Basic Blue 3 (BB 3) on potassium humate in an aqueous environment is reported for the first time, and an attempt to establish a viable cost-effective alternative route for water purification is presented.
2. Materials and Methods
2.1. Experimental
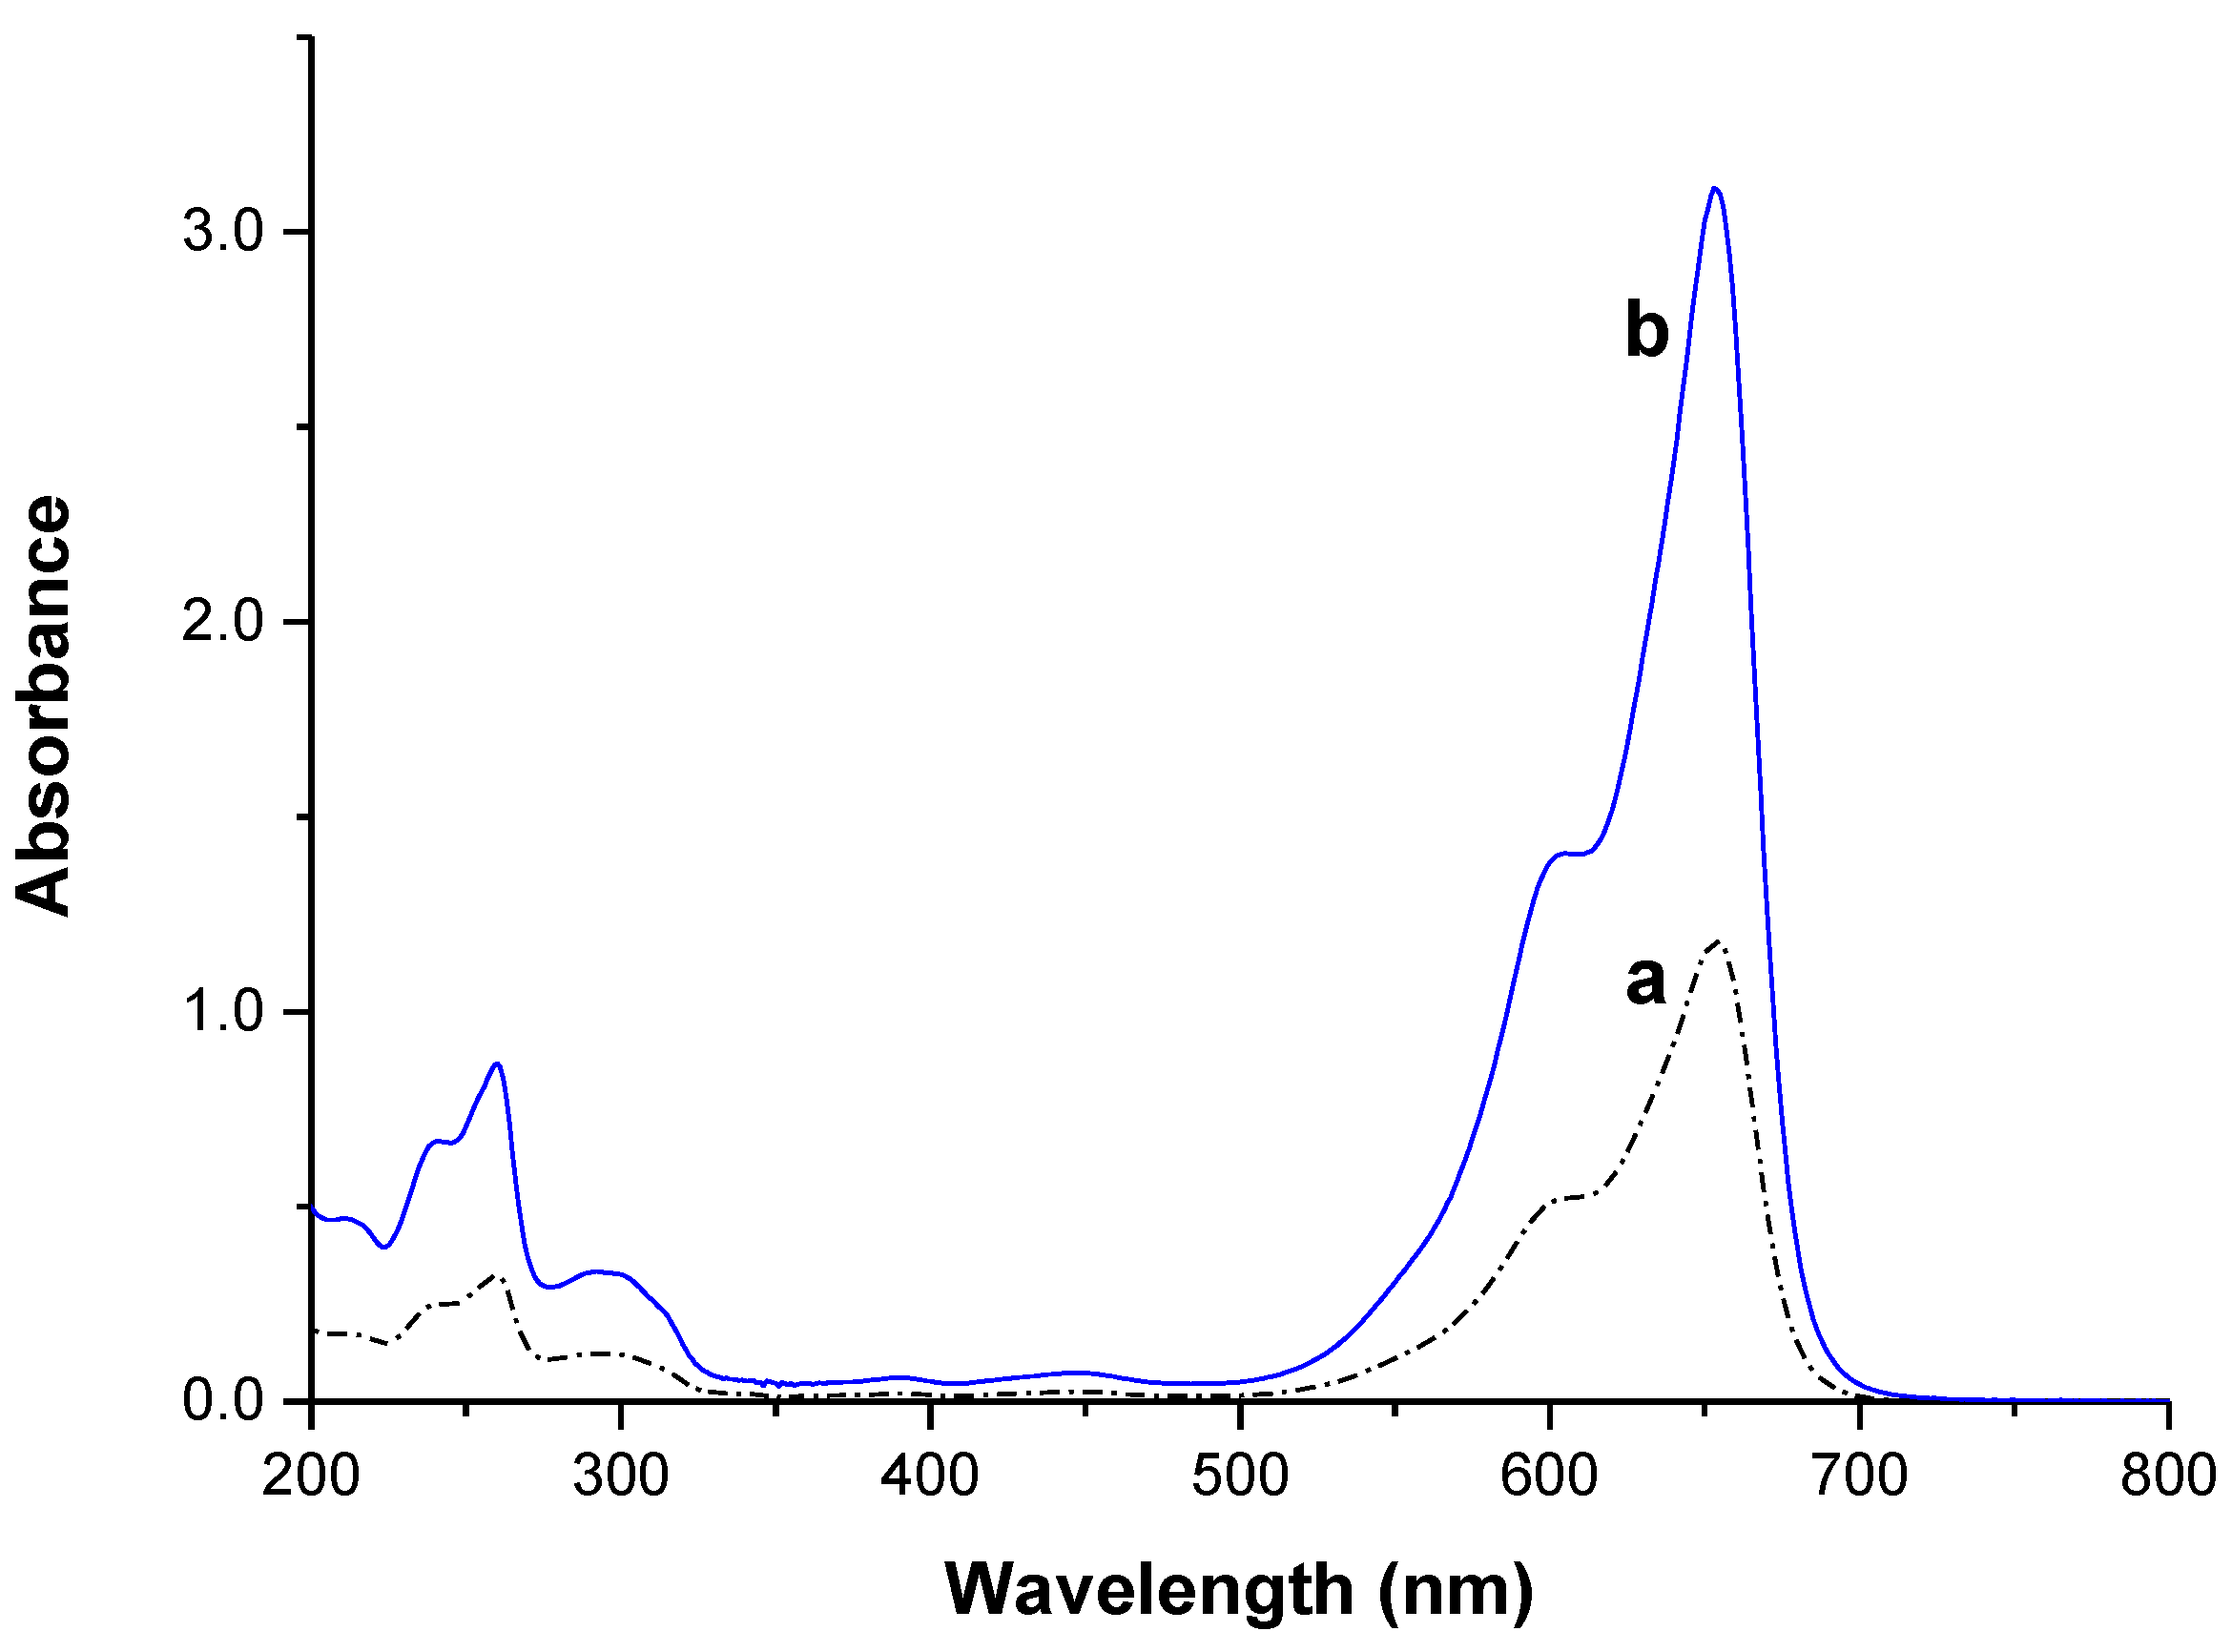
In a typical spectrum (Figure 2) of C.I. Basic Blue 3 (Chromatourgia Tripoleos S.A., Greece) shown as a plot of absorbance against the wavelength, λ, the dye exhibits a λmax at 654 nm and a secondary peak at 601 nm. From Figure 2, it is concluded that the dye displays no metachromatic behavior at high concentrations, and no dye dimers are formed. A linear calibration curve of slope 155.8 (R2 = 0.999) was prepared by plotting dye absorbance at 654 nm against ten known dye concentrations (from 2 × 10⁻³ to 2 × 10⁻² g L−1), and BB 3 contents were determined from the straight line obtained. Visible spectra were acquired using a Varian Cary 3E UV–Vis spectrophotometer.
Samples of refined potassium humate (Lemandou Chemicals Co., Ltd., Shijiazhuang, China), with a high humic substance content of at least 85% by mass on a dry basis (humic acid 70% or more, K2O 12% minimum, moisture 15% or less) and high water solubility (99–100%), were used as received. Potassium humate, a brown to black-colored neutralized product of insoluble—at pH 2.0 or less—humic acid and KOH, derived from leonardite, aromatic in nature, alkaline and rich in carboxylic acid and phenolic groups, was used to enhance both the properties and performance of soils (by an increase in the soil microbial numbers), as well as the productivity of plants. Due to their amphiphilic character, humic acids form micelle-like structures, useful in agriculture and pollution remediation [15,16,17,18,19]. The visible spectrum of potassium humate in aqueous solution is presented in Figure 3.
In order to study the interactions between C.I. Basic Blue 3 and humic substances, two 8 × 10⁻² g L−1 stock solutions of BB 3 and HS were prepared. For the adsorption experiments, solutions consisting of varying mixtures of BB 3 and potassium humate were prepared with a range of initial dye concentrations, , i.e., from 2 × 10⁻³ to 2 × 10⁻² g L−1, produced by mixing the above stock solutions. In all mixtures, the potassium humate concentration was 2 × 10⁻² g L−1. A 10 mL portion of each mixture was placed in a programmable laboratory dyeing machine (Atlas Linitest plus) and treated for 3 h at a circulation rate of 30 min−1. Adsorption measurements were carried out at pH 4.0, 7.3 and 10.0; the effect of the temperature on the HS–BB 3 interaction was tested at 287, 308, 323 and 353 K.
Adjustments of pH were made by incorporating 5 mL of the corresponding buffers (pH values 4.0 and 10.0) into the mixtures. All pH values were measured with a Jenway 3310 pHmeter.
An HS–BB 3 complex was obtained as the colloidal precipitate from the dye and potassium humate mixture (containing 2 × 10⁻² g L−1 of each) by treatment at pH 4.0. Where precipitates of the humic–dye complex were formed after the dyeing treatment, dyed HS were separated from solution by centrifugation at 5000 min−1 for 30 min (employing a Martin Christ Osterode/Harz apparatus), dried and used in the FTIR experiments.
Fourier transform infrared (FTIR) spectra (average of 50 scans) were recorded on a Shimadzu IR Affinity-1 spectrophotometer, Shimadzu Co., Kyoto, Japan, at a resolution of 4 cm−1. Pellets were obtained by mixing the samples with dry potassium bromide.
2.2. Dye Contents and Concentrations
The absorbance, A, of HS–BB 3 mixtures at 654 nm was attributed to both the HS–BB 3 complex and residual BB 3, and it can be analyzed according to the Beer–Lambert law [6]. For all cases, the absorbance of a dye–HS mixture is given by the relationship
where and are the dye concentration and the bound dye concentration, respectively, b is the optical path length, and and are the molar extinction coefficients of the dye and bound dye, respectively; was determined in a solution of BB 3 alone and in the presence of potassium humate and low BB 3 concentrations to ensure that all of the dye molecules exist in the form of an HS–BB 3 complex. If is the total analytical concentration of BB 3 (free and bound to HS) in the solution, then we have
The difference in absorbance, ΔA, at 654 nm between the absorbance, A, of an HS–BB 3 mixture and the absorbance, , of a BB 3 solution used as a blank (it contained the same concentration of BB 3, , as the mixture, but no potassium humate) is
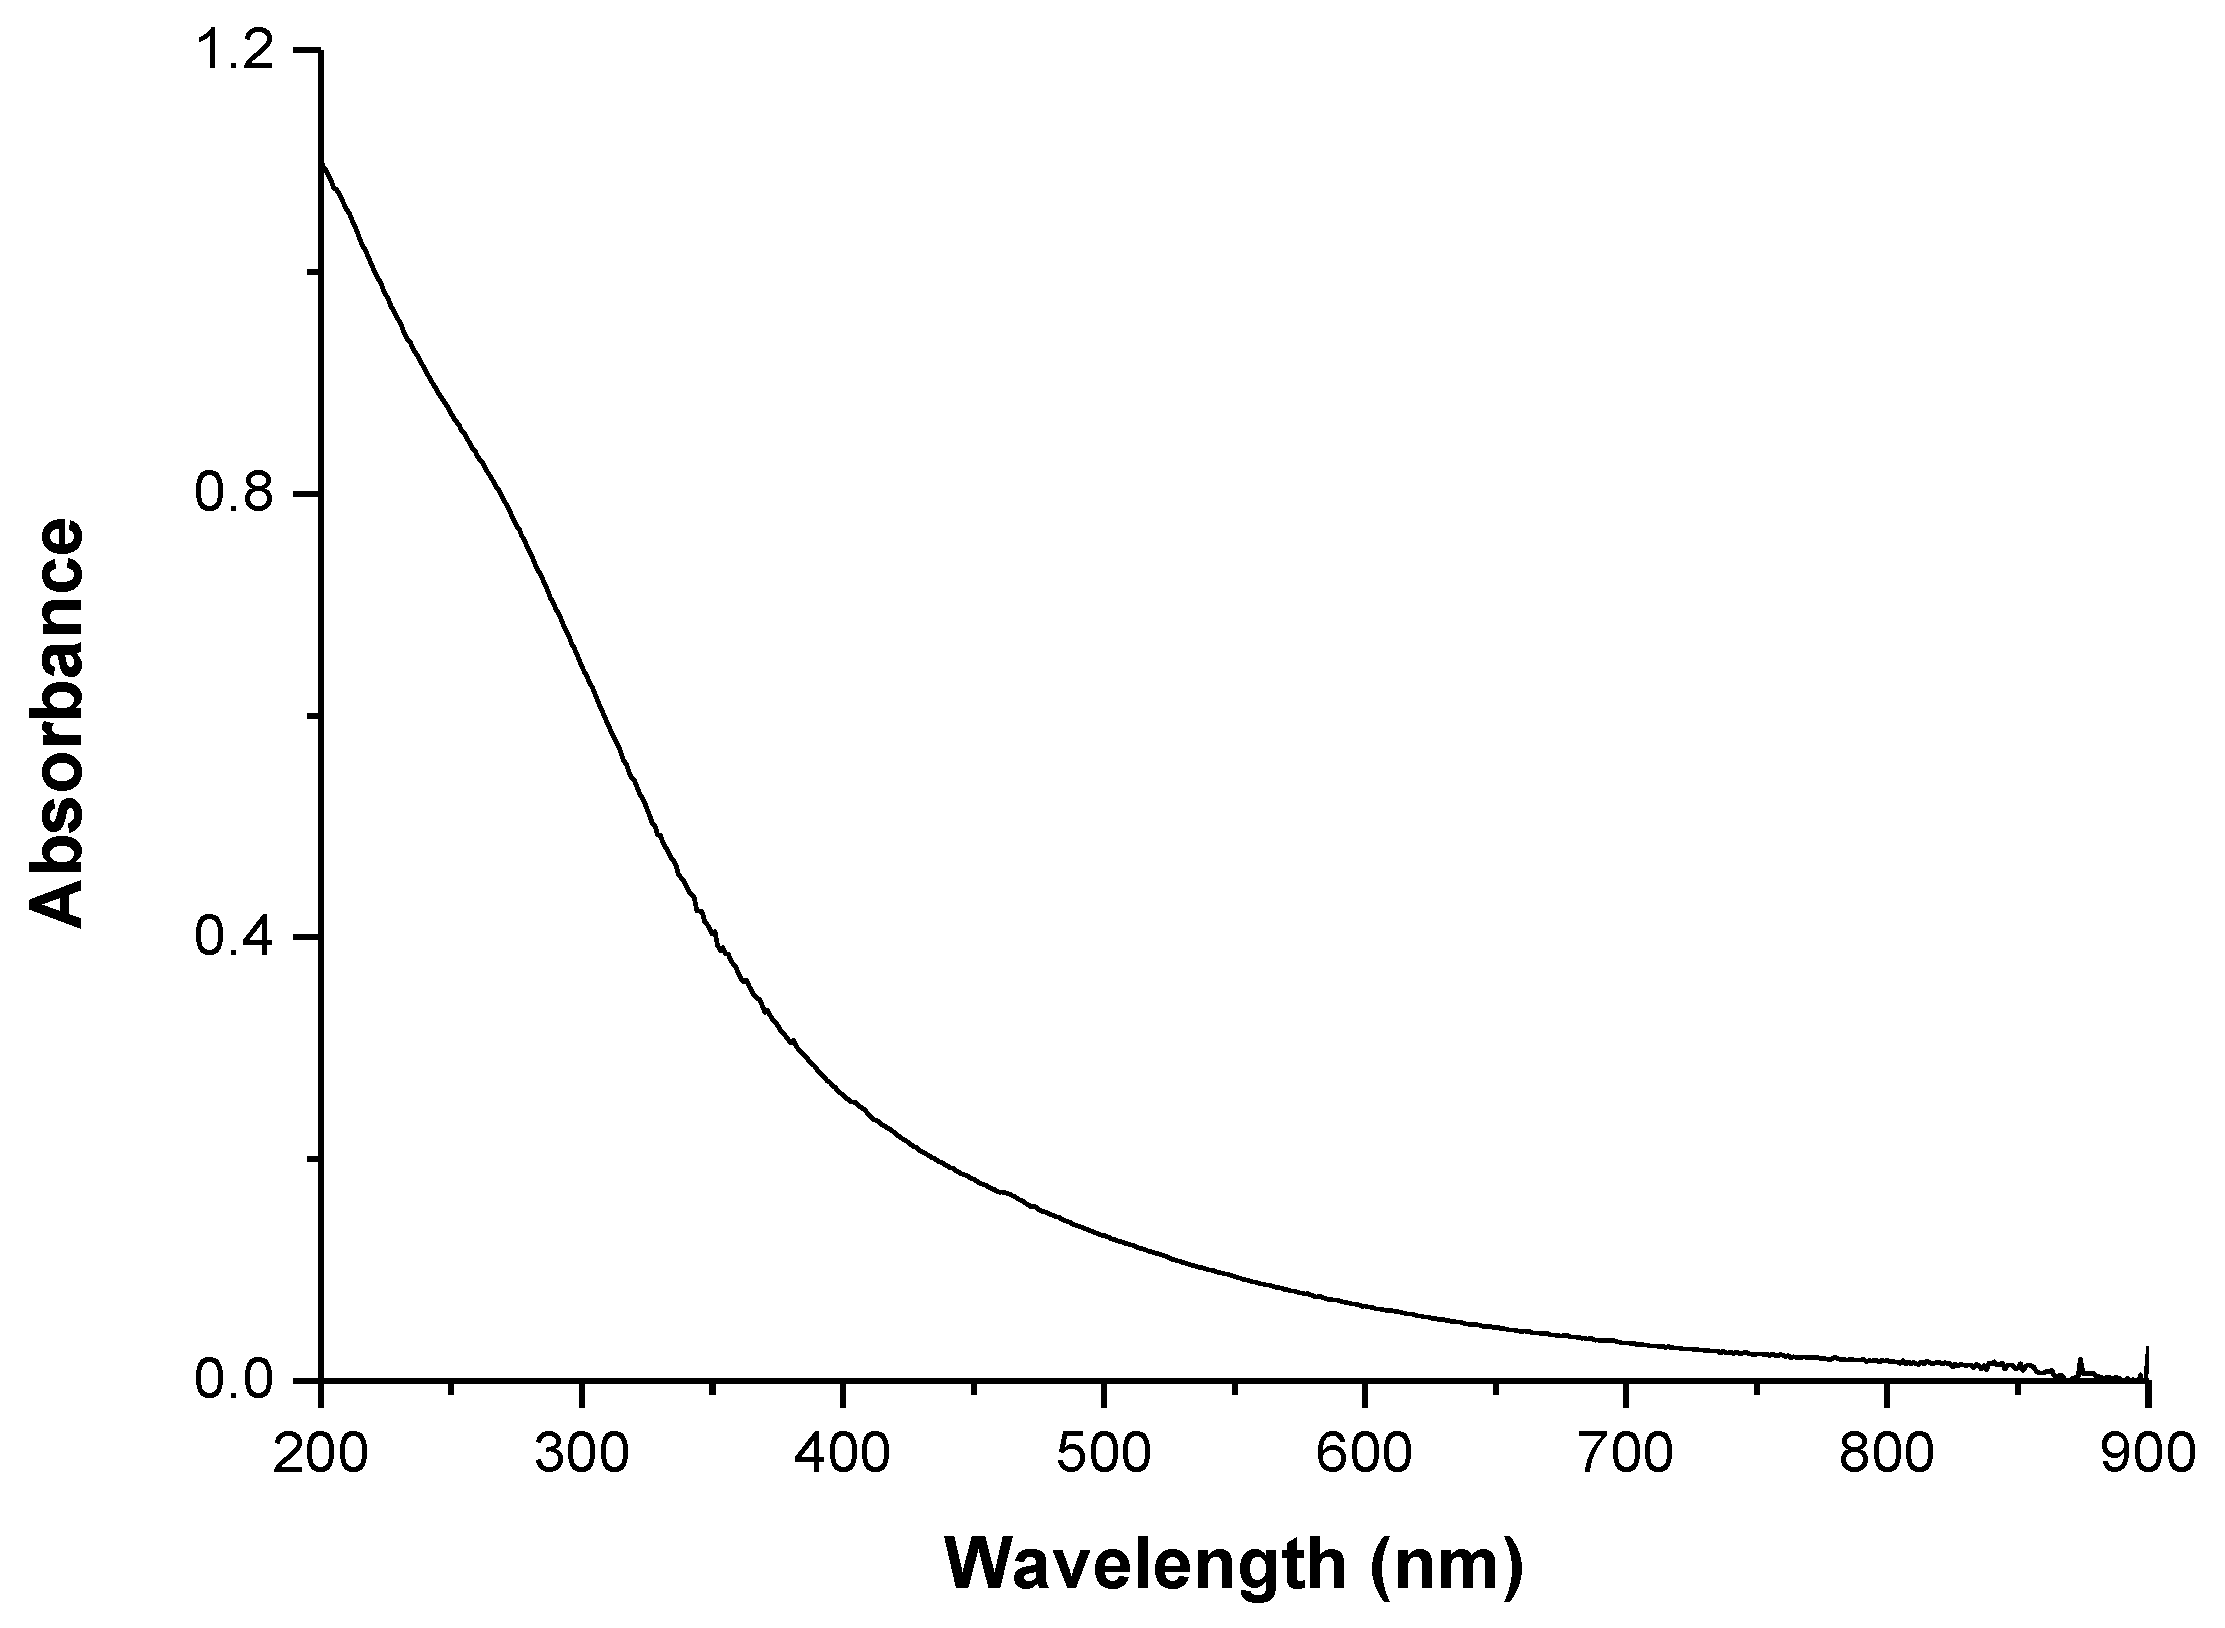
It was assumed that the humic substances do not absorb at 654 nm (Figure 3); furthermore, of BB 3 may be obtained using the Beer–Lambert law:
By combining Equations (1)–(4), we obtain
Equation (5) may also be written as
The adsorbed dye content at equilibrium, , can be directly calculated from the experimental data by Equation (7):
where is the concentration of BB 3 bound to HS at equilibrium, and represents the total analytical concentration of potassium humate in solution (unbound and bound to the dye). For a system in equilibrium, an equation analogous to Equation (6) must hold, and Equation (7) then becomes
When an equilibrium has been reached, an equation of the type of Equation (2) should also apply, the dye concentration in solution at equilibrium, , may be expressed in terms of and Equation (2) takes the form
2.3. Adsorption Kinetics
Three models, i.e., pseudo-first-order, intraparticle diffusion and pseudo-second-order, were applied to test the BB 3 and HS complexation reaction. The pseudo-first-order kinetics of the Lagergren model [20] is well expressed by the following relation:
where is the rate constant, and Q, according to Equation (8), is the adsorbed dye content.
The intraparticle diffusion model describes a process where the adsorption rate is diffusion-controlled and the equation
is used to express the relation between Q and t, with both K and C being constants.
Finally, the pseudo-second-order rate model is represented by an equation of the form
where is the pseudo-second-order rate constant.
In this model, the rate-determining step is surface adsorption due to chemisorption, i.e., the sorbent–adsorbate physicochemical interactions involved [21].
2.4. Thermodynamics
Both the enthalpy change, , and the entropy change, , of the retention process can be obtained from the van’t Hoff equation by plotting against 1/T from the slope and the intercept, respectively, of the straight line
where and are the adsorption capacity of the adsorbent and the equilibrium dye concentration in solution, respectively, for a constant coverage fraction, θ. The Gibbs change in the free energy of the adsorption, , is calculated by the relationship
2.5. Statistical Analysis
The IBM SPSS Statistics v. 24.000 software package was employed for processing the experimental data. The statistical analysis included Pearson correlations and a paired t-test at p < 0.05.
3. Results and Discussion
3.1. Spectrophotometry
The UV–Vis absorption spectrum of potassium humate is shown in Figure 3. The spectroscopic features of Figure 3 are correlated with significant structural properties of HS. The ratio of (absorbance at 250 nm) to (absorbance at 365 nm), i.e., E2/E3, has been shown to be inversely proportional to both the molecular weight and aromaticity [22], and it was found to be relatively low (2.48). In our case, the ratio (E4/E6) holds a low value of 3.86, which may indicate HS fractions with relatively high molecular weights, high C/O ratios and weak acidity [23]. The ratio of , also spectrophotometrically derived, was calculated as being 0.788. In fact, -to- ratios exceeding 0.40 [24] proved to be typical of aromatic rings substituted with hydroxyl, carbonyl, ester and carboxylic acid groups. The ratio of has been used to determine the width of the electron transition absorption band for natural organic matter (NOM) fractions and has also been associated with both the molecular weight and aromaticity; an -to- ratio of 1.89 comparable to that found by us, i.e., 1.86, has been assigned to sizeable HS with a molecular weight of 4500 and correlated strongly with aromaticity [22]. The ratio has been related directly to the absorption index of C=O functional and aromatic C=C groups, particularly in the case of high-molecular weight and aromaticity NOM fractions. Humic substances bearing an -to- ratio of 4.87 (quite similar to our value, 4.89) have been correlated with sizeable and condensed HS fractions. A ratio of to equal to 4.31 was obtained, which is indicative of the HS origin, as values in the range 4–14 demonstrate terrestrial NOM fractions, whilst higher values, ranging from 25 to 40, are characteristic of NOM fractions isolated from water. Generally, values similar to ours relate HS to macromolecular, polycondensed moieties. Finally, regarding the ratio of to , the lowest values (about 1.6) reported in the literature [25] are for HS macromolecules of high aromaticity, being fully compatible with the experimental value of 1.32 obtained from the spectrum of HS (Figure 3).
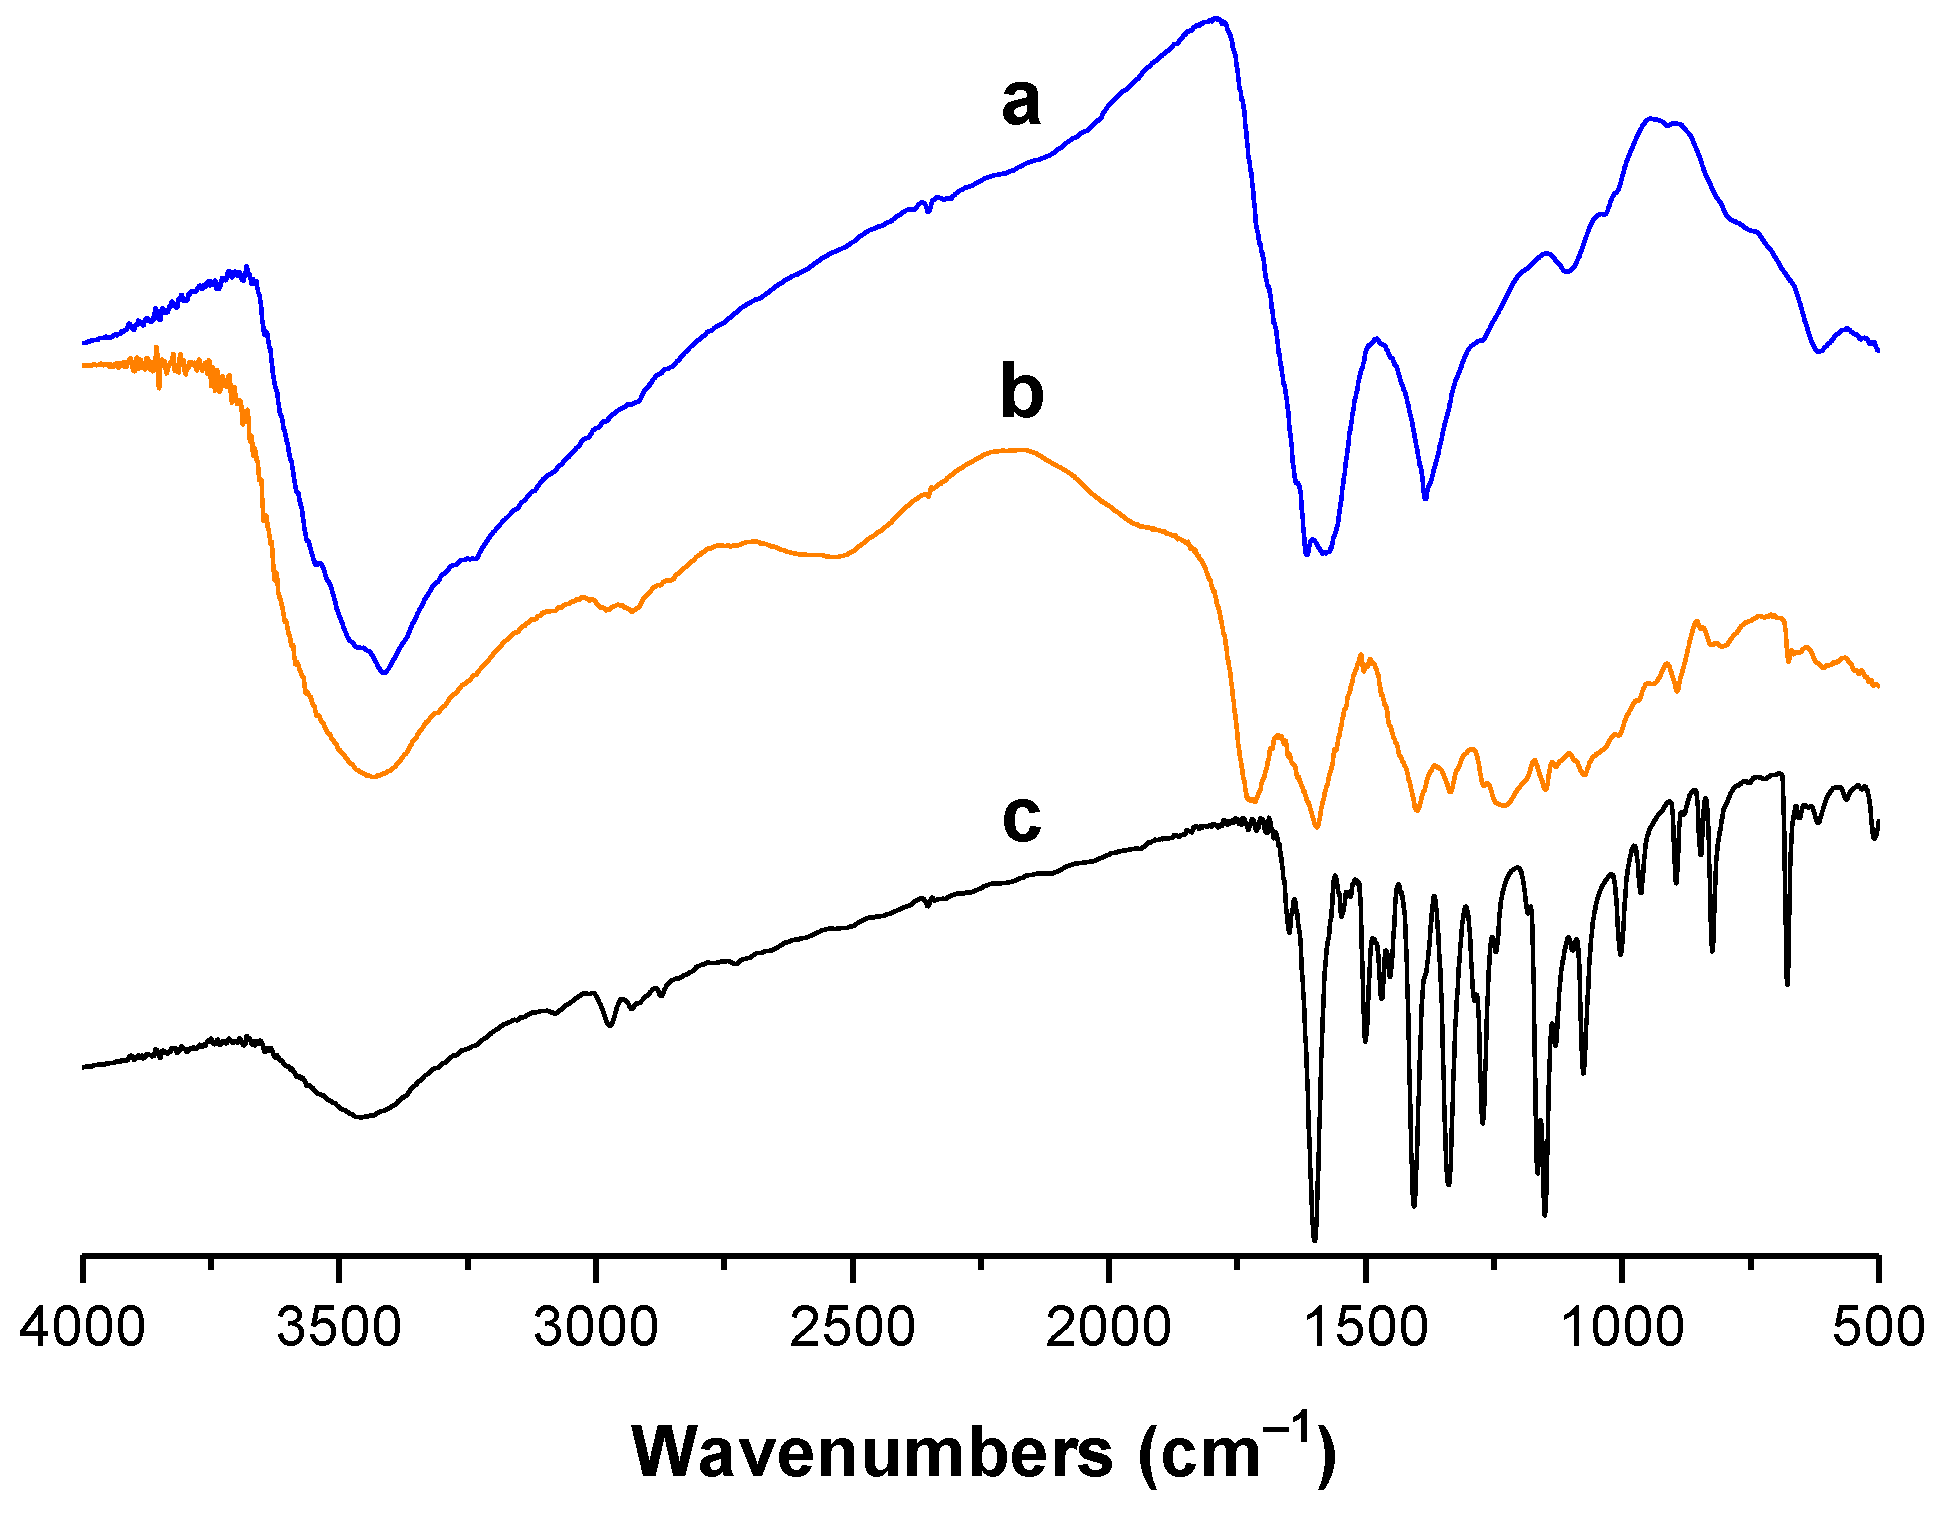
The FTIR spectra of potassium humate, BB 3 and the HS–BB 3 complex are presented in Figure 4. The 3100 to 3700 cm−1 envelope in Figure 4a is attributed to O–H stretching (e.g., alcohols, phenols, carboxylic acid groups), and peaks at 2926 cm−1 are associated with C–H stretching vibrations. The HS peaks at 1575–1625 and 1385 cm−1 (observable in Figure 4a) are due to C–O asymmetric stretching in carboxyl groups [26], as well as asymmetric and symmetric stretches of –COO– in salts of carboxylic acids. The peak at 1100 cm−1 is for the C–O stretch in alcohols and O–H deformation in carbohydrates [22].
In Figure 4c, regarding the BB 3 FTIR spectrum, peaks in the region 2870–2970 cm−1 are assigned to the –CH3 bending. The high-intensity peak at 1590 cm−1 accounts for C=N stretching of the acceptor group on the benzene ring. The narrow, sharp peaks at 1267–1340 and 1000–1150 cm−1 are ascribed to the aryl C–N and alkyl C–N stretching vibrations, respectively [27], while the 1165-cm−1 peak is due to the C–O–C asymmetric stretching.
The HS and dye interaction is clearly depicted in Figure 4b. The complex formed displays peaks corresponding to both C.I. Basic Blue 3 and potassium humate in the HS–BB 3 FTIR spectrum. Dye–humics complexation imparts significant changes in the spectrum (Figure 4b) that involve the shift in the 1385 and 1575–1625 cm−1 peaks in Figure 4a, as well as a shift in the wavelength and a reduction in the intensity of the dye peak at around 1600 cm−1 (Figure 4c). Strong absorption bands attributed to both aryl and alkyl C–N stretches in Figure 4c are decreased in intensity and shifted, which is also true for the peak at 1165 cm−1, certain indications that N atoms (not attached to the oxazine ring) and O atoms are the two most probable sites of dye–humics interaction. This is to be expected, as these atoms in the resonance structures of the dye shown in Figure 1 can bear positive charges and attach to the carboxyls that occur on humates.
3.2. Dye Adsorption
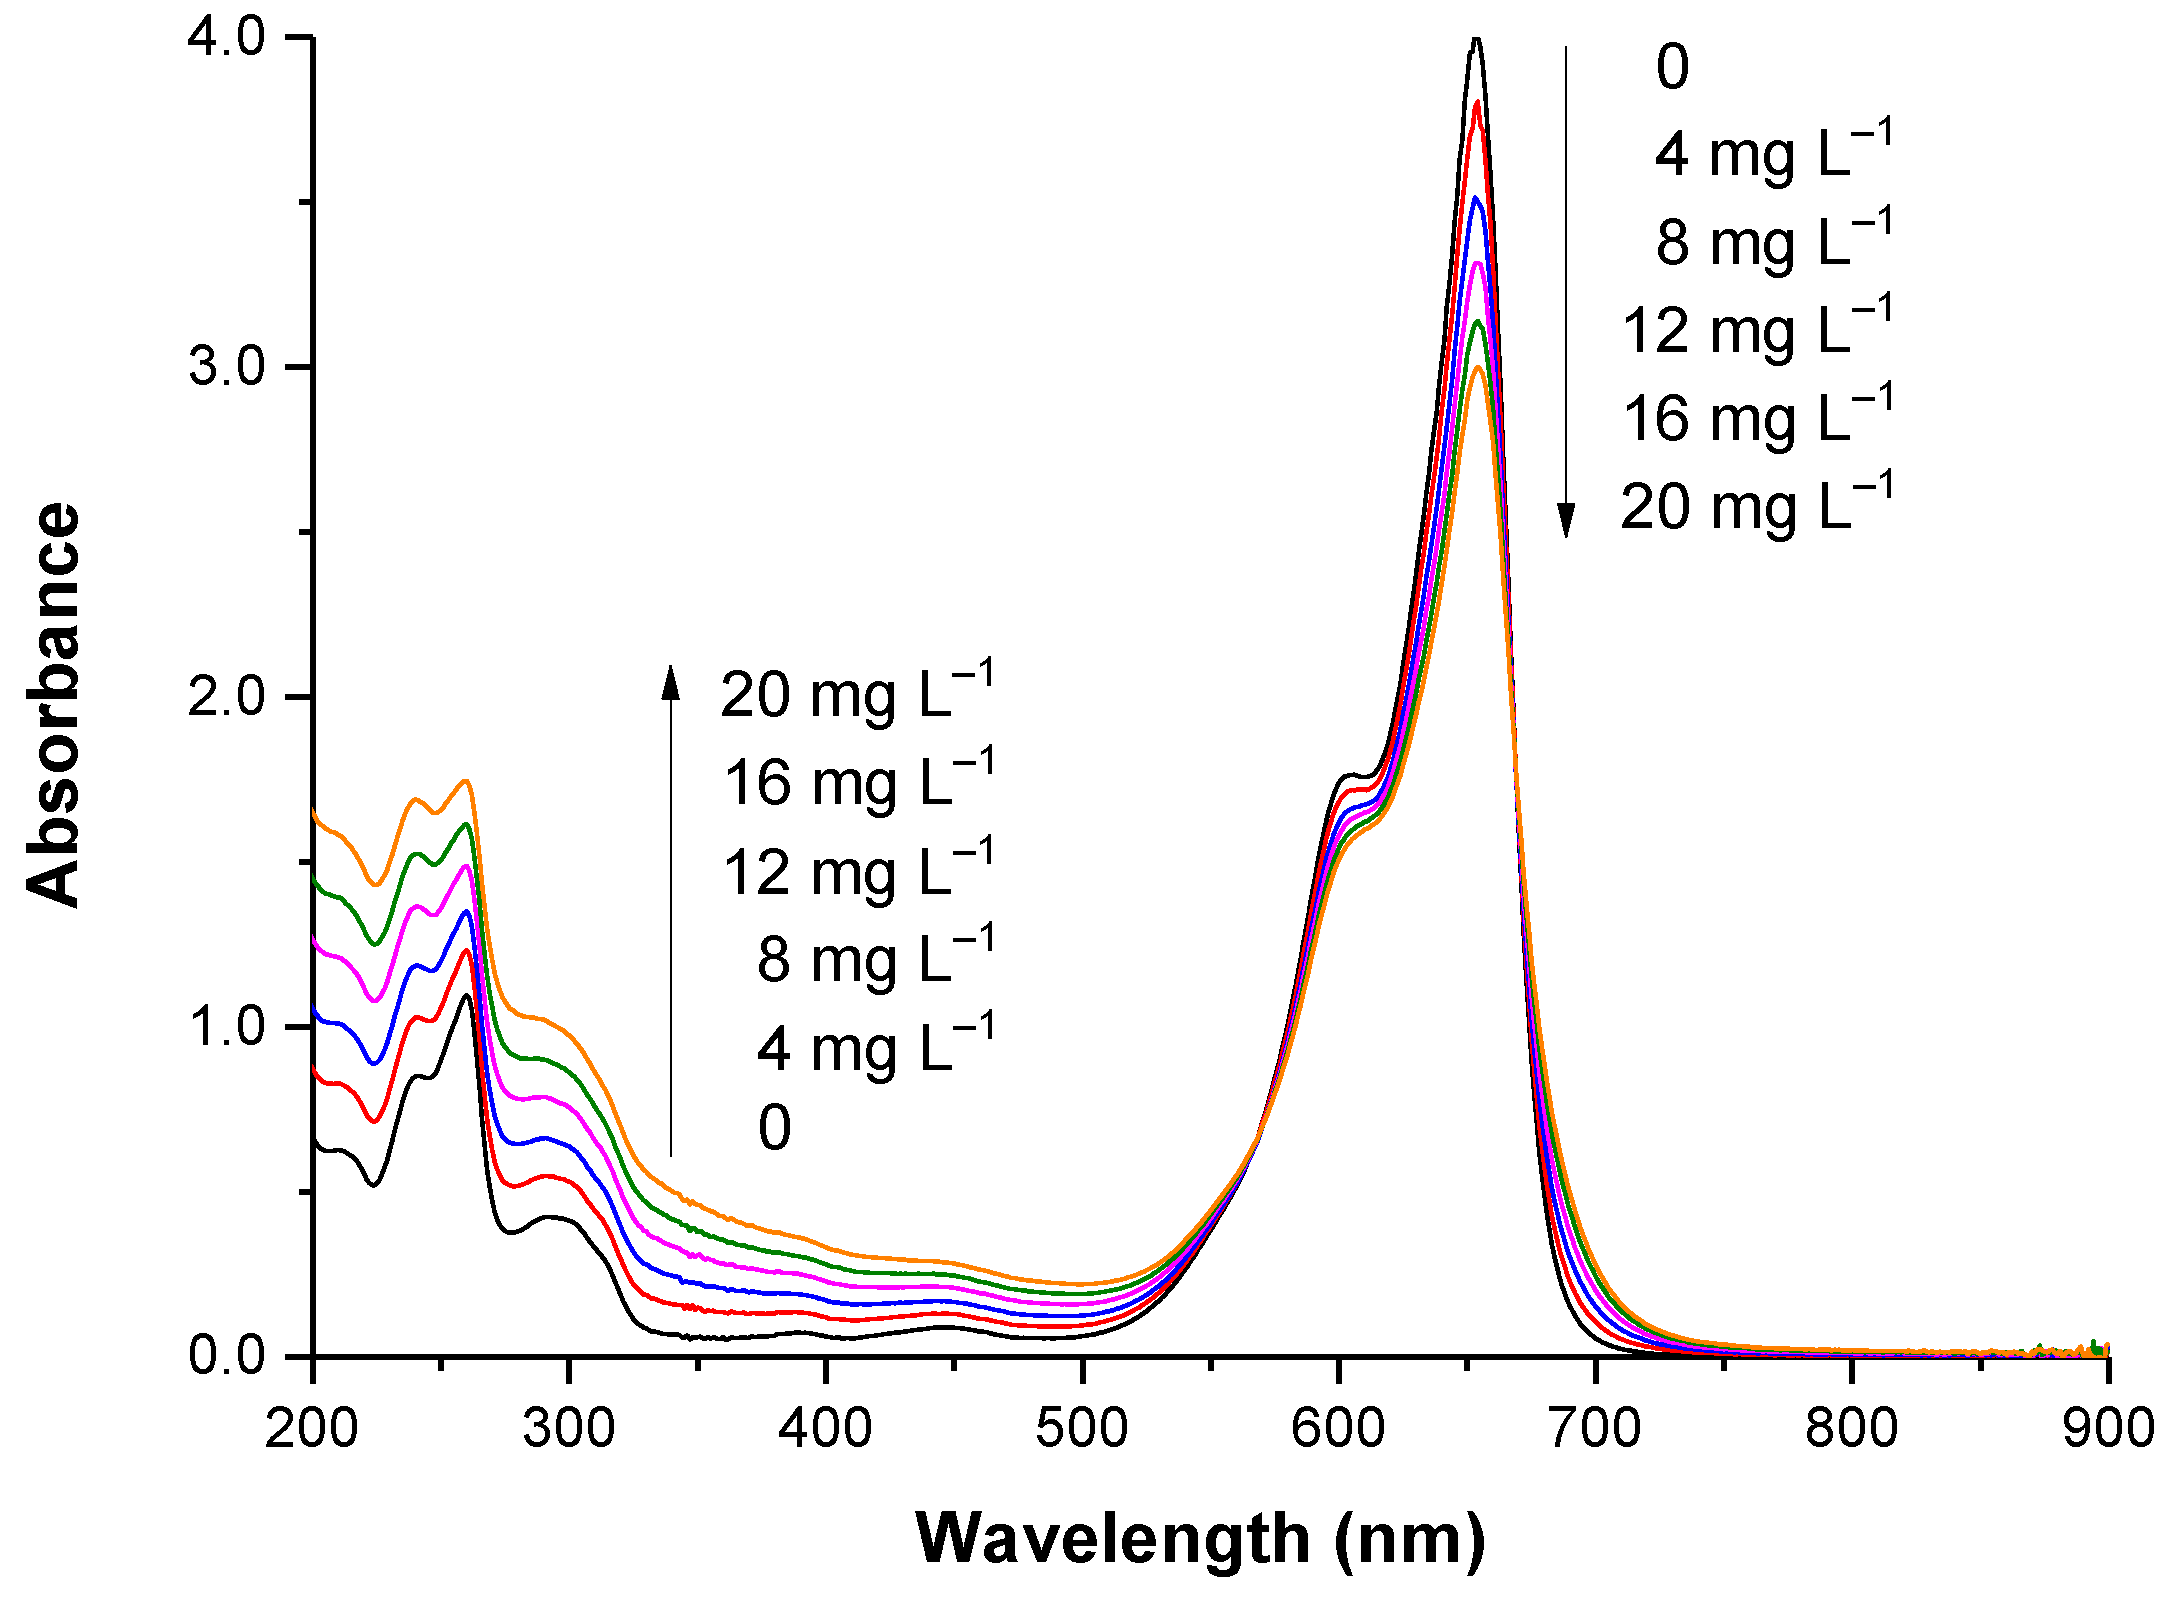
Figure 5 illustrates the HS concentration-dependent spectra of HS–BB 3 mixtures in the presence of different HS loadings. From Figure 5, we assume that the dye absorbance at 654 nm decreases with increasing concentration of potassium humate. In addition, two isosbestic points are observed at 568 and 669 nm, both accounting for HS–BB 3 complexation. Apart from the drop in absorbance at λmax (654 nm), the HS–BB 3 binding reaction induces an increase in absorbances at wavelengths greater than 669 nm and lower than 568 nm, as well as modifications in the shape of the absorption curve in the UV region. Changes in the spectrum at wavelengths of 568 nm or less denote alterations in the dye conjugation due to complexation [27]. It is also evident from Figure 3 (A = 0.04–0.06 at a concentration of 20 mg L−1) that HS absorb only weakly within the range of 620 to 670 nm in which the main absorption peak of the dye lies (Figure 2 and Figure 5). The peaks at 261 and 297 nm shown in Figure 5 are consistent with π→π* and n→π* transitions of both aromatic rings attached to the oxazine group and to the secondary amines.
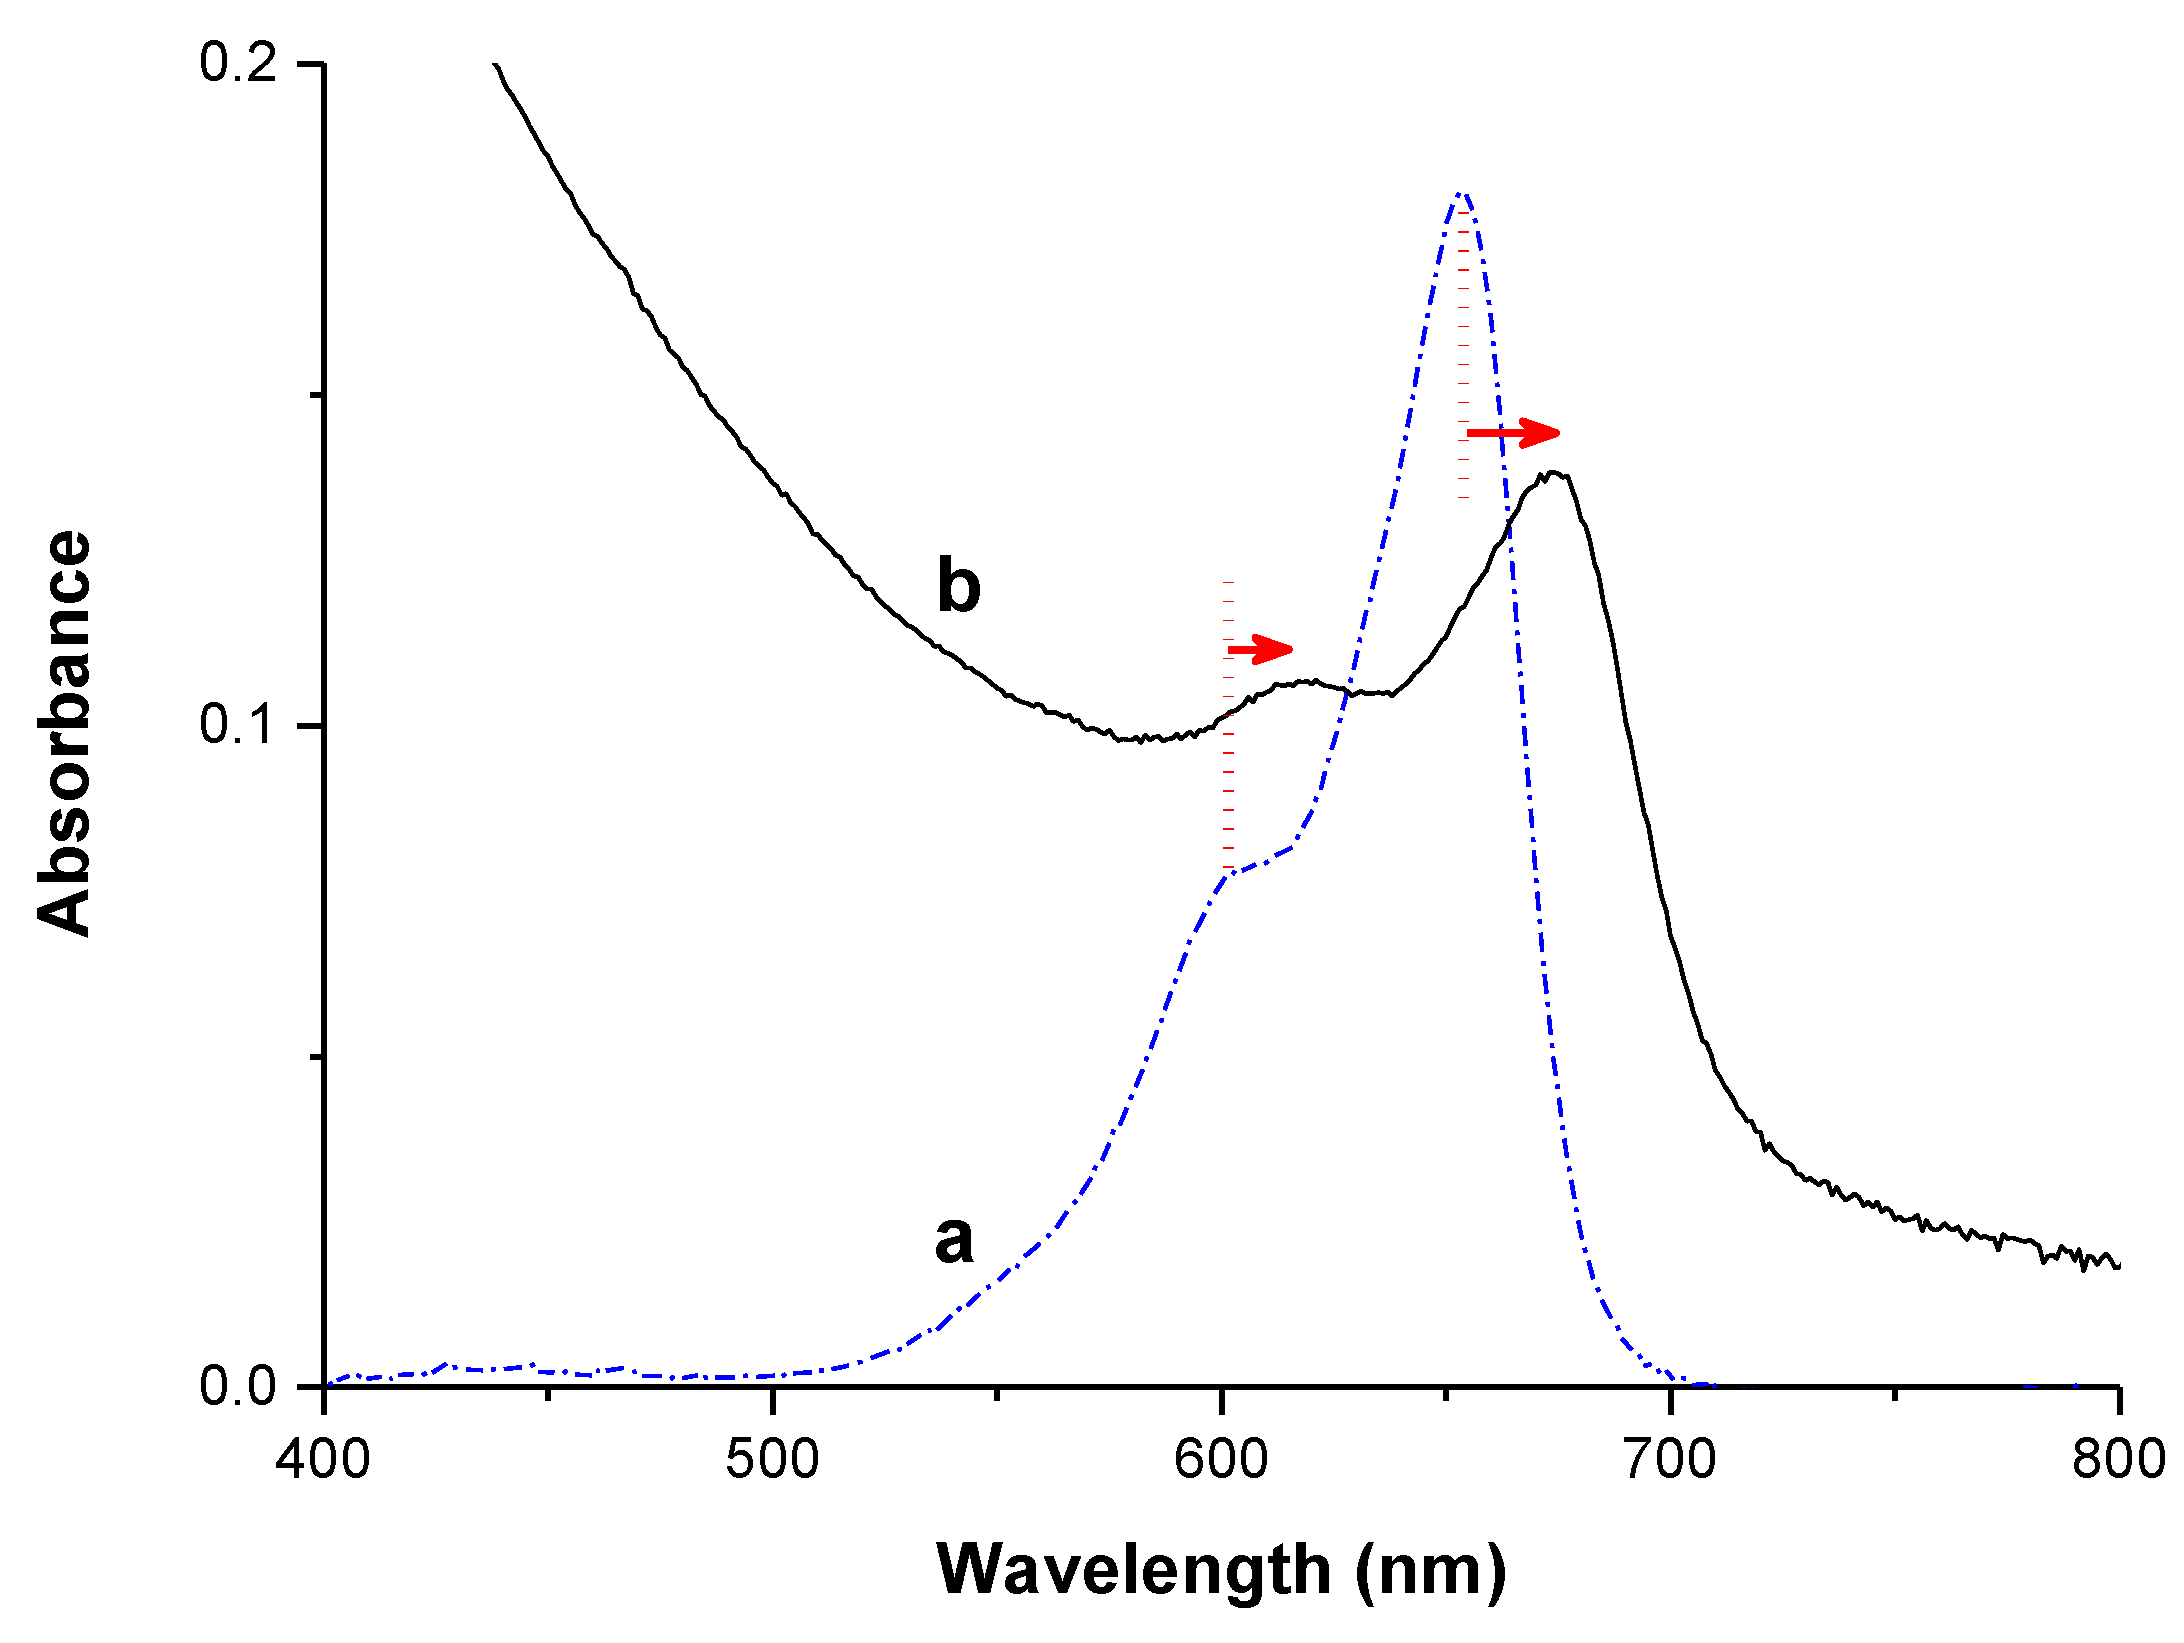
In order to fully understand the nature of the HS–BB 3 interactions, spectra were recorded using very low dye loadings (from 0.4 × 10⁻³ to 2 × 10⁻³ g L−1) with respect to the potassium humate concentration (2 × 10⁻² g L−1); under these conditions, it can be assumed that all dye molecules interact with the HS. In all experiments, qualitative differences in the spectrum of C.I. Basic Blue 3 (Figure 6a) were observed, and a typical representative curve (solid line) shifted to higher wavelengths is presented in Figure 6b.
The data in Figure 6 show that, due to solution complexation of BB 3 by humic substances, both peaks in the spectrum of the dye (dashed line), i.e., the primary peak at 654 nm and the secondary peak at 601 nm, are shifted (dotted lines) towards longer wavelengths (675 and 616 nm, respectively) as a result of the formation of the new HS–BB 3 species. Deconvolution of the spectra confirmed the primary peak positions of both the dye (653.5 nm) and complex (674.5 nm). It is of particular significance that the spectrum of Figure 6b cannot be obtained by the mixing of other curves, i.e., the summation of both the dye and potassium humate spectra.
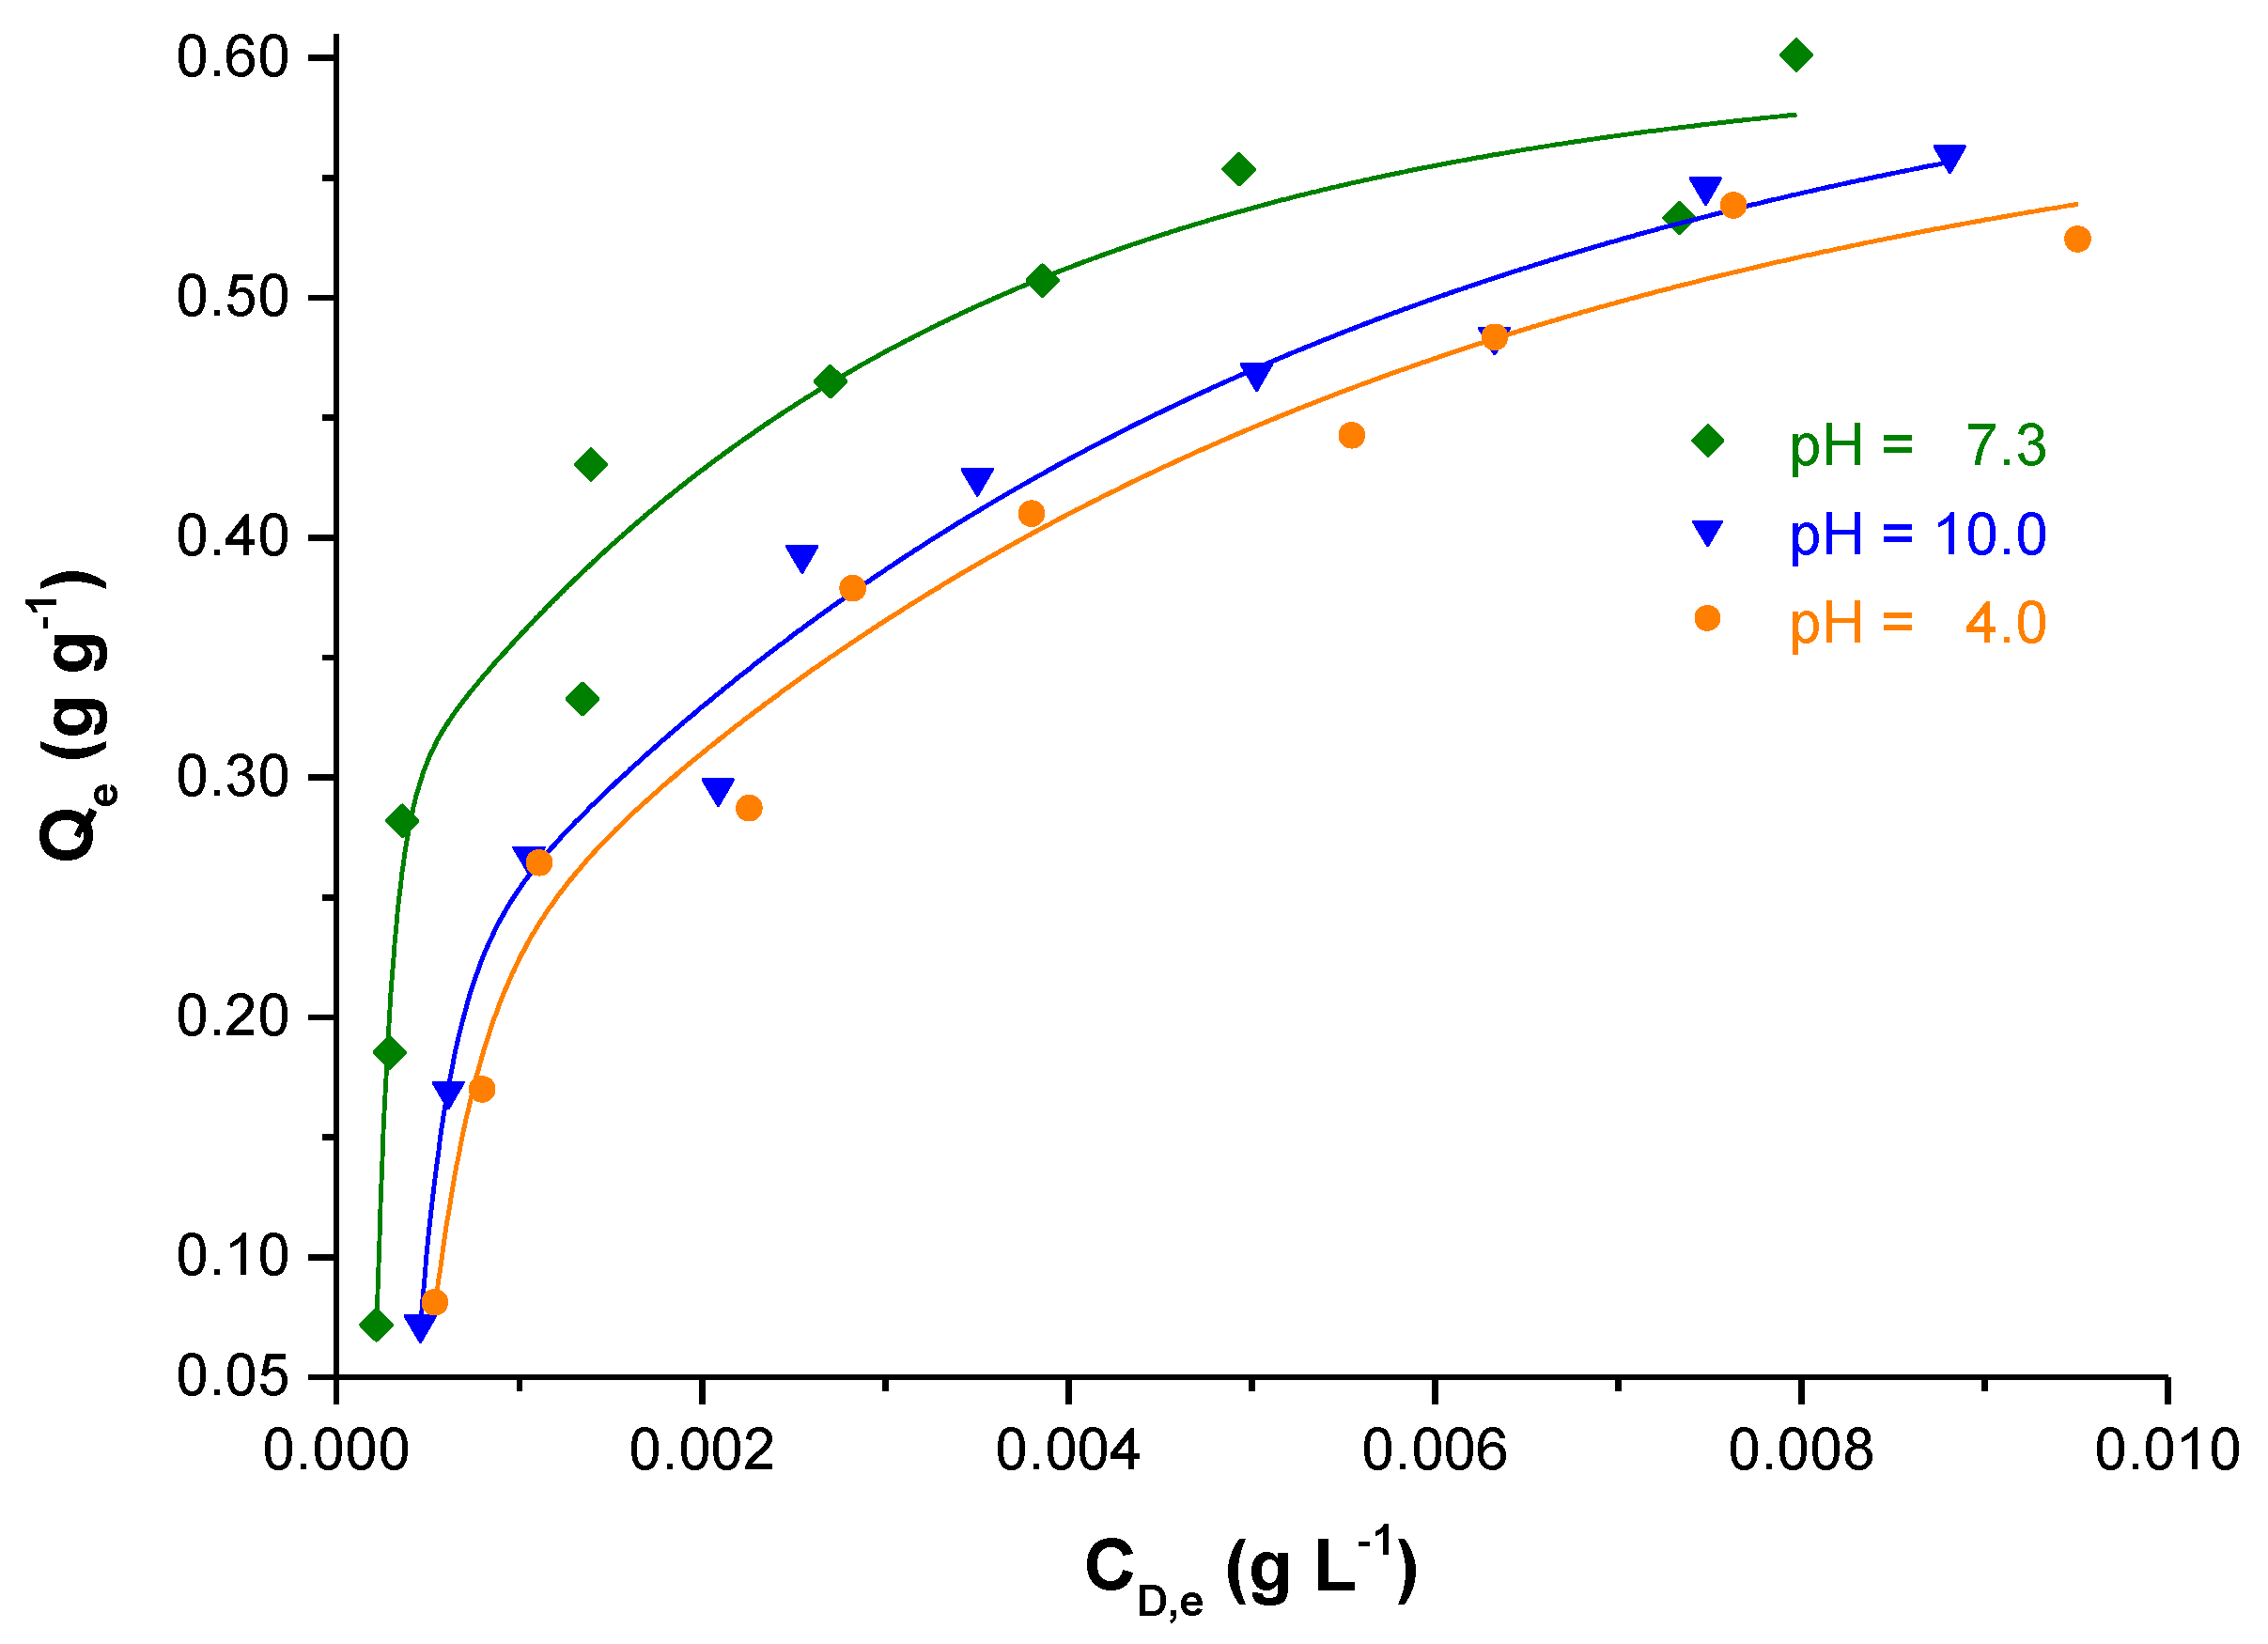
The adsorbed dye content at equilibrium, , as a function of the dye concentration in solution at equilibrium, , at pH values 4.0, 7.3 and 10.0, is plotted in Figure 7. All treatments were undertaken at 287 K for a sufficiently prolonged time, i.e., 3 h, to result in equilibrium BB 3 uptake. Adsorption onto HS occurs via a Langmuir-type isotherm, favored in systems in which ionic substances are surface-adsorbed from water onto specific adsorption sites in the substrate by strong intermolecular attraction, as in the case of dyestuffs [28]. As the pH is raised, the absorbance tends to increase because at pH values greater than 3 [6], the carboxyl groups dissociate, being responsible for facilitating the dye–HS binding, while the phenolic groups still remain protonated. From Figure 7, it is apparent that the maximum dye retention was achieved at pH 7.3, and that the experimental adsorption capacity of the adsorbent decreased with the further increase in the pH as the dye molecule loses its positive charge in alkaline solutions. It is clear that the pH affects both the surface charge of the adsorbent and the speciation of the adsorbate, influencing HS–dye interactions, as shown by the adsorption isotherms in Figure 7.
Statistical calculations showed that all samples were normally distributed and had homogeneous variances. As these assumptions are satisfied, the means were compared using paired statistical t-tests. The results verify that, in all cases, there is a significant positive difference between the retention values at all pH values.
Overall, it can be concluded that the dye cations interact with the negatively charged moieties of HS, mainly carboxylic acid and the weaker acid (i.e., phenolic) groups, via electrostatic forces of attraction. At neutral pH, almost all carboxyl groups are dissociated, in contrast to phenolics, which dissociate only slightly. Therefore, the dye molecules bind to the fully dissociated carboxyl sites (i.e., –COO–) on the humic matter at the pH in question. Although it seems likely that the highest dye content was to be expected at pH 10.0 as all acidic groups present in the substrate at this particular pH (including most of the phenolic groups) ionize completely, this would not be valid in our case, largely due to the decreasing cationic charge on the dye.
It is of considerable importance that, assuming that adsorption equilibrium is reached, a slow further dye–humics association is allowed to proceed at pH 4.0 when HS–BB 3 mixtures are left for 8 and 15 d. Thus, an increase in the retention of the dye is observed, almost a doubling of HS–BB 3 complexation, i.e., from 0.52 to 0.93 g dye/g potassium humate (if the initial dye and potassium humate concentrations are both equal to 2 × 10⁻² g L−1), over the period of 15 d. It seems that the conformation of humic molecules changes, opening the structure and allowing migration of the cations to specific strong, slowly dissociating sites in the humic matter, a process taking place on a time scale of hours or even days. On this basis, the longer the system is left standing, the more these strong sites contribute to the observed behavior [29].
This experimental value of dye retention (0.93 g BB 3/g potassium humate) is one of the highest reported in the literature [30,31,32,33] and definitely proves that potassium humate is an exceptionally effective decolorizing agent. These findings supply sufficient reasoning for attaching particular importance to the removal of both HS and dyes from waters that would need to be cleaned up. Whilst the literature on the dye retention capacity of HS-containing soil, peat and decomposition products is extensive [34,35,36,37], there are few articles in the soil literature relating to the dye removal efficiency of humic substances themselves. In fact, regarding natural non-polymeric adsorbents, humic substances have long been recognized to be important for their chelating properties, for increasing nutrient availability to plants and, also, for removing toxic pollutants in ecosystems.
Thus, a pH of 4.0 is the most favorable for water clean-up as dye adsorption is higher and, also, the dye–HS complexes formed may precipitate on standing. This acidic pH is advantageous in agriculture as, unlike macronutrients, micronutrients are more readily available in acidic-environment soils. In addition, acidic waters may be used in irrigation to control the acidity of alkaline soils for improving plant growth (potato, peanuts, cranberry, sweet potato and most subsurface vegetables) at pH values ranging from 4.0 to 5.5. This may constitute a future prospect for aqueous humics–dye systems.
The effect of the temperature on HS–BB 3 complexation was investigated at 308, 323 and 353 K. In strongly alkaline environments (pH = 10.0), the dye decomposed rapidly at temperatures higher than 308 K, and even at pH 7.3, the dye gradually decomposed at 353 K. The removal efficiency, i.e., the percentage of the initial dye retained by the adsorbent at a given temperature, was calculated for several dye concentrations (Table 1). These data demonstrate that the temperature increase had no significant effect on the dye retention by potassium humate.
3.3. Humics–Dye Reaction Kinetics
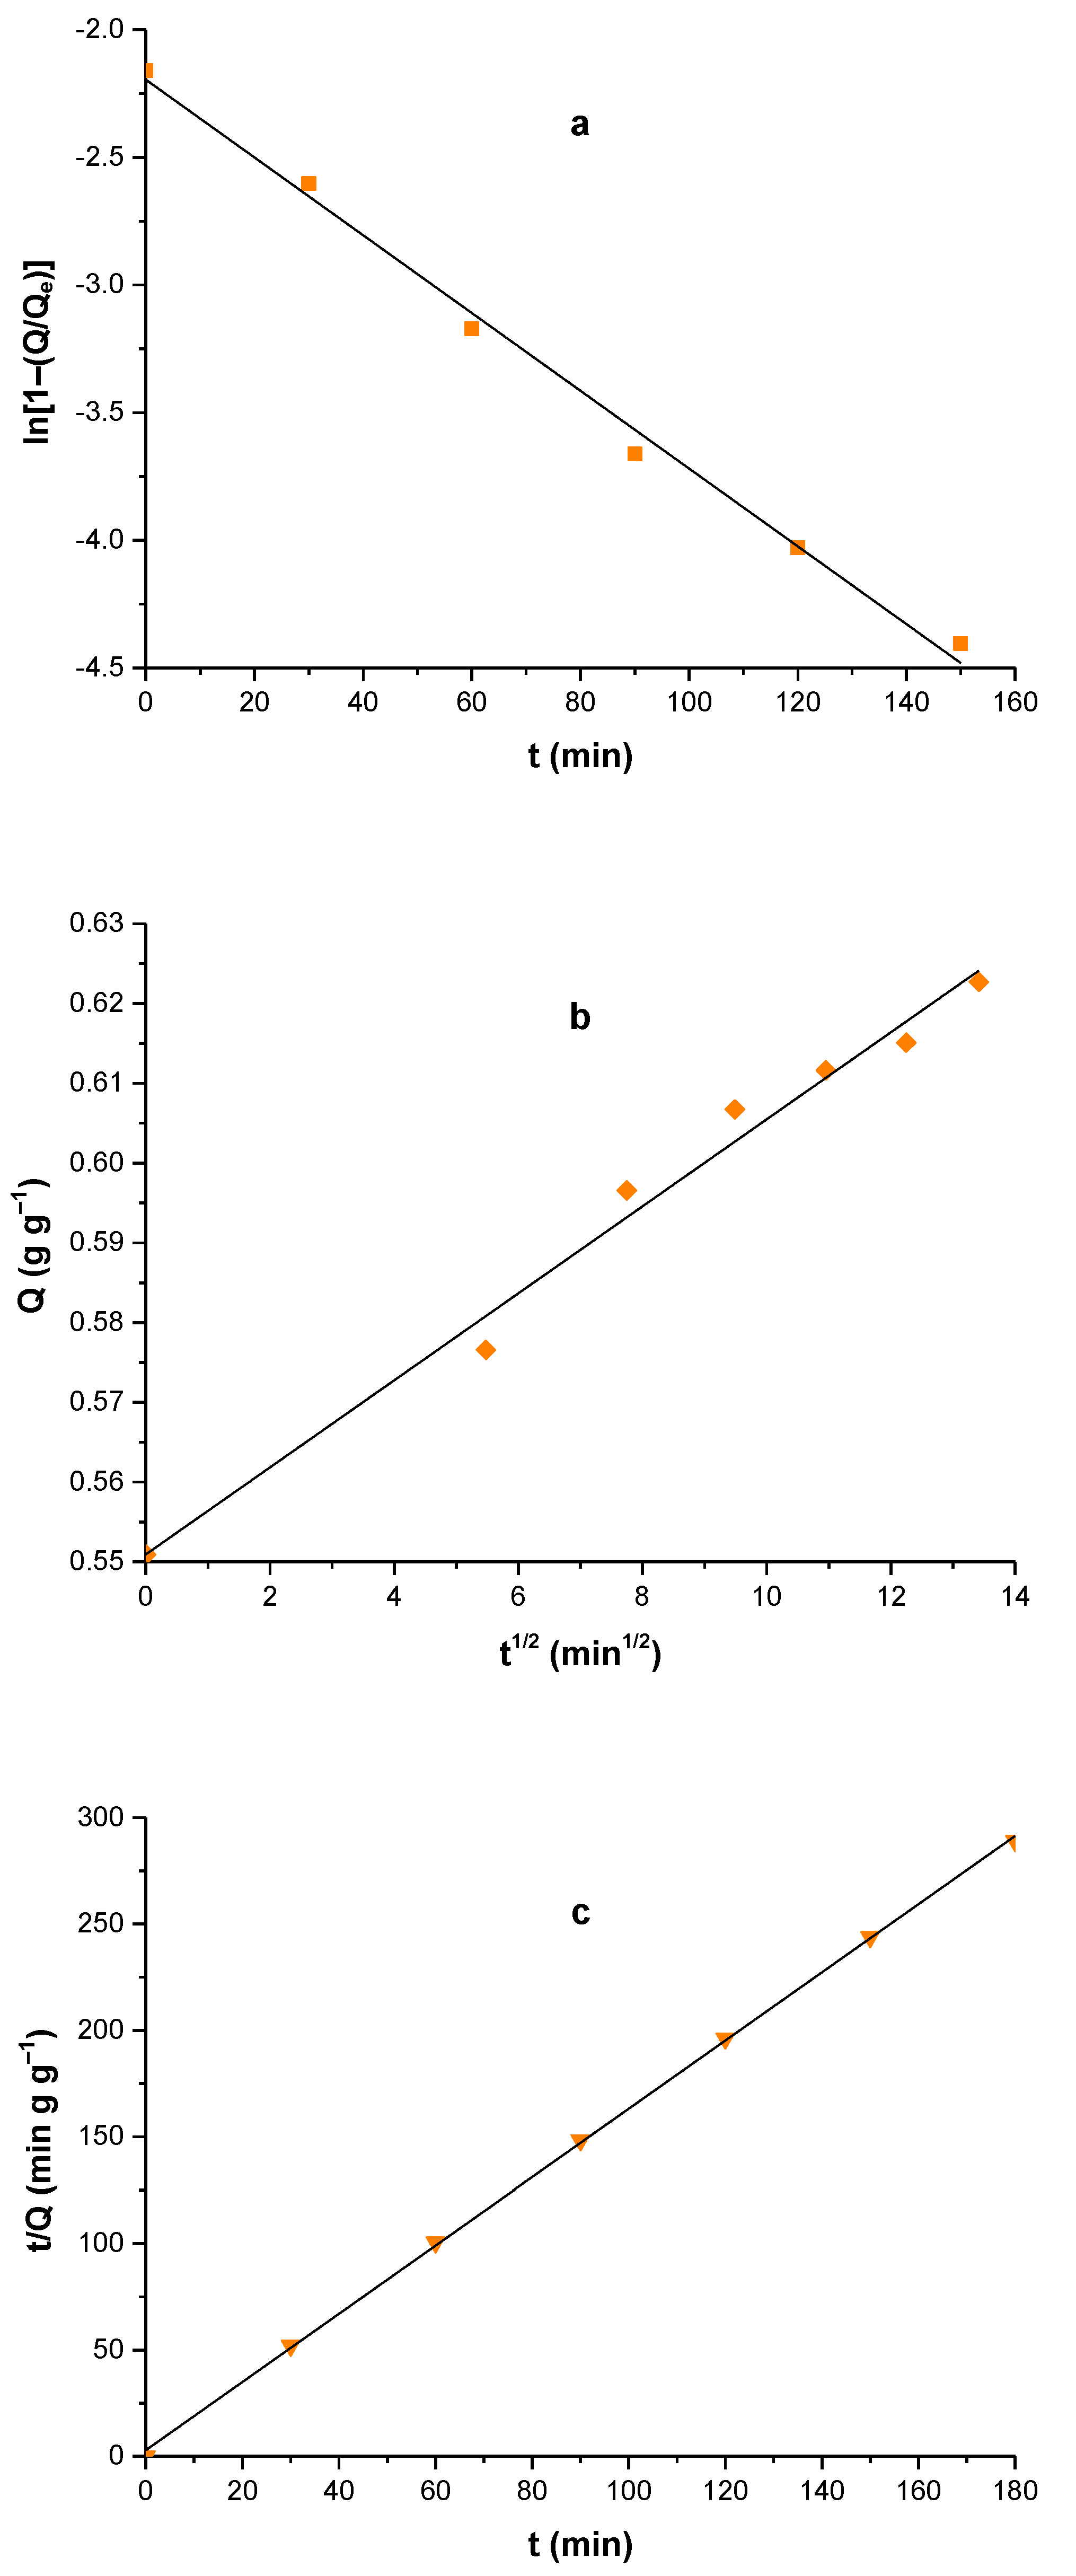
Figure 8 shows the linear plots of the three kinetic models employed for the 3 h dyeing treatments at 323 K. Kinetic analysis of the HS–BB 3 binding reaction at pH values of 7.3 and 10.0 could not be performed owing to both the high velocity of complexation and—at elevated temperatures—the considerable decomposition of the dye. Consequently, for studying the kinetics of dye adsorption, a moderate temperature (323 K) was selected, and the process was carried out at pH 4.0, where the reaction proceeded relatively slowly.
Both the pseudo-first- and pseudo-second-order models nicely fit the experimental data, but the highest correlation coefficient (R2 = 0.9997) was obtained for the pseudo-second-order rate model (Table 2), not unexpectedly, considering the physicochemical interactions that occur during the formation of an HS–BB 3 complex.
3.4. Adsorption Isotherms and Thermodynamics
The three most widely accepted adsorption models, i.e., the Langmuir, Freundlich and BET isotherm equations, were used to fit the experimentally determined equilibrium adsorption data obtained at different pH values at 287 K, not only to reveal the significant physicochemical characteristics of the retention process, but also to test the applicability of these models to BB 3 adsorption in a liquid–liquid system. The results are summarized in Table 3.
It is evident from Table 3 that both the Langmuir and BET models [38,39] were found to provide an accurate interpretation of the dye adsorption on HS. It is concluded that the adsorbent–adsorbate interactions predominantly involve strong electrostatic forces of attraction between the positive dye and the negatively charged HS, as well as a homogeneous distribution of the adsorption sites, in agreement with the two theories that share the same basic postulates. Furthermore, as shown in Figure 2, no dye–dye interactions are displayed, i.e., there is no interaction between the molecules of adsorbed species, a point also emphasized by the Langmuir model.
The empirical Freundlich equation [40] adequately describes the HS–BB 3 interaction, although the fundamental concept of the above model is that the adsorption sites are heterogeneously distributed. Site heterogeneity in humic matter may arise from colloidal behavior prior to and during complexation with the dye, from the electric double layers formed and from the influence of Derjaguin–Landau–Verwey–Overbeek (DLVO) interactions on the stability of colloids [41,42,43,44]. Humic substances have proved colloidally stable due to complexation with Mn(III) [45], interactions between humic species and other components (e.g., hydrophobic pollutants) in natural water systems, resulting in structures similar to micelles, have been studied in detail [46] and humic materials originating from soil, coal and peat sources have shown a relationship of electrokinetic and rheological data to the colloidal stability, achieved mainly via electrostatic forces in suspensions [47]. As the Freundlich model offers a satisfactory interpretation of BB 3 adsorption onto humic substances, our findings can be explained in terms of an essentially heterogeneous system in which hydrophobic groups of HS in solution tend to associate together and escape from the aqueous phase by a mechanism that involves their ability to form a solid microphase.
BB 3 retention data at 287, 308, 323 and 353 K and pH 4.0 were employed for the thermodynamic calculations. A low value (−1.15 kJ mol−1) was obtained, supporting the negligible effect of the temperature on the adsorption process. was found to be −13.3 kJ mol−1, confirming the spontaneity of the reaction, and the positive value calculated, 42.3 J mol−1 K−1, provides evidence of both an entropically favorable process and strong dye–adsorbent affinity [48].
4. Conclusions
Water purification by C.I. Basic Blue 3 adsorption on potassium humate was examined at various dye loadings, temperatures and pH values to demonstrate, for the first time, both the basic concepts of electrostatic interactions and the selective nature of the adsorption of BB 3 on specific HS. The retention of dyes by composts, peats, lignite/coal and their derivatives due to dye adsorption on the humics contained within the substrate has been extensively studied. However, a small number of articles that describe the adsorption of a dyestuff onto humic substances themselves are available. Adsorption experiments were carried out in aqueous mixtures of BB 3 and HS with concentrations from 2 × 10⁻³ to 2 × 10⁻² g L−1 and 2 × 10⁻² g L−1, respectively, at 287 K. The maximum dye uptake was obtained at pH 7.3. On standing for a period of 15 d, potassium humate proved a very strong adsorbent for BB 3 at pH 4.0, retaining 0.93 g dye/g. The temperature was found to exert little influence on the dye retention, which was also verified by the very low value of the adsorption enthalpy change. Dye–HS interactions at acidic pH values involve electrostatic forces of attraction between the positively charged dye and the—almost totally ionized—carboxyls of humic substances. Such forces of attraction are also demonstrated by the observation that the rate of HS–BB 3 complex formation obeys pseudo-second-order kinetics. The applicability of three adsorption models, i.e., Langmuir, Freundlich and BET, was tested on experimental data derived from a liquid–liquid sorbent–adsorbate system. The overall binding, solution complexation and adsorption conformed to the Langmuir and BET equations, an indication of strong electrostatic dye–humics interactions. The fact that dye adsorption was found to follow a Freundlich mechanism reveals the heterogeneities of the humic substrate due to its colloidal nature and results are consistent with the idea that humic matter interacts with the dye mole-cules on the basis of its ability to form solid microphases. The thermodynamic quantities calculated, and
underline an entropically favorable and spontaneous process, respectively.
Author Contributions
The authors contributed equally to this work. Conceptualization, M.R. and A.A.V.; methodology, M.R. and A.A.V.; investigation, M.R. and A.A.V.; writing—original draft preparation, M.R. and A.A.V.; writing—review and editing, M.R. and A.A.V.; visualization, M.R. and A.A.V. All authors have read and agreed to the published version of the manuscript.
Funding
This research received no external funding.
Institutional Review Board Statement
Not applicable.
Acknowledgments
The authors are pleased to thank Chromatourgia Tripoleos S.A., Greece, for providing the dye, Triacryl Blue 5G 250% (C.I. Basic Blue 3).
Conflicts of Interest
The authors declare no conflict of interest.
References
- Strawn, D.G.; Bohn, H.L.; O’Connor, G.A. Soil Chemistry, 5th ed.; Wiley: Hoboken, NJ, USA, 2020; p. 51. [Google Scholar]
- Piccolo, A. The supramolecular structure of humic substances: A novel understanding of humus chemistry and implications in soil science. Adv. Agron. 2002, 75, 57–134. [Google Scholar]
- Myneni, S.C.B.; Brown, J.T.; Martinez, G.A.; Meyer-Ilse, W. Imaging of humic substance macromolecular structures in water and soils. Science 1999, 286, 1335–1337. [Google Scholar] [CrossRef] [Green Version]
- Martinez, R.E.; Sharma, P.; Kappler, A. Surface binding site analysis of Ca2+-homoionized clay–humic acid complexes. J. Colloid Interface Sci. 2010, 352, 526–534. [Google Scholar] [CrossRef] [PubMed]
- Perminova, I.V.; Hatfield, K. Remediation chemistry of humic substances: Theory and implications for technology. In Use of Humic Substances to Remediate Polluted Environments: From Theory to Practice; Perminova, I.V., Hatfield, K., Hertkorn, N., Eds.; Springer: Dordrecht, The Netherlands, 2005; p. 6. [Google Scholar]
- Sheng, G.-P.; Zhang, M.-L.; Yu, H.-Q. A rapid quantitative method for humic substances determination in natural waters. Anal. Chim. Acta 2007, 592, 162–167. [Google Scholar] [CrossRef]
- Anirudhan, T.S.; Suchithra, P.S. Adsorption characteristics of humic acid-immobilized amine modified polyacrylamide/bentonite composite for cationic dyes in aqueous solutions. J. Environ. Sci. 2009, 21, 884–891. [Google Scholar] [CrossRef]
- Peng, L.; Qin, P.; Lei, M.; Zeng, Q.; Song, H.; Yang, J.; Shao, J.; Liao, B.; Gu, J. Modifying Fe3O4 nanoparticles with humic acid for removal of Rhodamine B in water. J. Hazard. Mater. 2012, 209–210, 193–198. [Google Scholar] [CrossRef]
- Mashkoor, F.; Nasar, A.; Asiri, A.M. Exploring the reusability of synthetically contaminated wastewater containing crystal violet dye using Tectona grandis sawdust as a very low-cost adsorbent. Sci. Rep. 2018, 8, 8314. [Google Scholar] [CrossRef] [PubMed] [Green Version]
- Li, Y.; Gao, Z.; Ji, Y.; Hu, X.; Sun, C.; Yang, S.; Wang, L.; Wang, Q.; Fang, D. Photodegradation of malachite green under simulated and natural irradiation: Kinetics, products, and pathways. J. Hazard. Mater. 2015, 285, 127–136. [Google Scholar]
- Vreysen, S.; Maes, A. Adsorption mechanism of humic and fulvic acid onto Mg/Al layered double hydroxides. Appl. Clay Sci. 2008, 38, 237–249. [Google Scholar] [CrossRef]
- Janoš, P. Sorption of basic dyes onto iron humate. Environ. Sci. Technol. 2003, 37, 5792–5798. [Google Scholar] [CrossRef]
- Sepulveda, L.A.; Santana, C.C. Effect of solution temperature, pH and ionic strength on dye adsorption onto Magellanic peat. Environ. Technol. 2013, 34, 967–977. [Google Scholar] [CrossRef] [PubMed]
- Vinod, V.P.; Anirudhan, T.S. Adsorption behaviour of basic dyes on the humic acid immobilized pillared clay. Water Air Soil Pollut. 2003, 150, 193–217. [Google Scholar] [CrossRef]
- Jones, M.N.; Bryan, N.D. Colloidal properties of humic substances. Adv. Colloid Interface Sci. 1998, 78, 1–48. [Google Scholar] [CrossRef]
- Klučáková, M. Size and charge evaluation of standard humic and fulvic acids as crucial factors to determine their environmental behavior and impact. Front. Chem. 2018, 6, 235. [Google Scholar] [CrossRef] [PubMed]
- Angelico, R.; Ceglie, A.; He, J.-Z.; Liu, Y.-R.; Palumbo, G.; Colombo, C. Particle size, charge and colloidal stability of humic acids coprecipitated with Ferrihydrite. Chemosphere 2014, 99, 239–247. [Google Scholar] [CrossRef]
- Klučáková, M.; Kalina, M. Composition, particle size, charge, and colloidal stability of pH-fractionated humic acids. J. Soils Sediments 2015, 15, 1900–1908. [Google Scholar] [CrossRef]
- Tarasevich, Y.I.; Dolenko, S.A.; Trifonova, M.Y.; Alekseenko, E.Y. Association and colloid-chemical properties of humic acids in aqueous solutions. Colloid J. 2013, 75, 207–213. [Google Scholar] [CrossRef]
- Lagergren, S. Zur Theorie der sogenannten Adsorption gelöster Stoffe. Bih. K. Sven. Vetensk.-Akad. Handl. 1899, 24, 1–39. [Google Scholar]
- Ho, Y.S.; McKay, G. Kinetic models for the sorption of dye from aqueous solution by wood. Trans. Inst. Chem. Eng. 1998, 76, 183–191. [Google Scholar] [CrossRef] [Green Version]
- Rodríguez, F.J.; Schlenger, P.; García-Valverde, M. Monitoring changes in the structure and properties of humic substances following ozonation using UV–Vis, FTIR and 1H NMR techniques. Sci. Total Environ. 2016, 541, 623–637. [Google Scholar] [CrossRef]
- Kang, S.; Xing, B. Phenanthrene sorption to sequentially extracted soil humic acids and humins. Environ. Sci. Technol. 2005, 39, 134–140. [Google Scholar] [CrossRef] [PubMed]
- Korshin, G.V.; Li, C.-W.; Benjamin, M.M. Monitoring the properties of natural organic matter through UV spectroscopy: A consistent theory. Water Res. 1997, 31, 1787–1795. [Google Scholar] [CrossRef]
- Her, N.; Amy, G.; Sohn, J.; Gunten, U. UV absorbance ratio index with size exclusion chromatography (URI-SEC) as an NOM property indicator. J. Water Supply Res. Technol. 2008, 57, 35–44. [Google Scholar] [CrossRef]
- Santosa, S.J.; Krisbiantoro, P.A.; Yuniarti, M.; Koesnarpardi, K.S. Magnetically separable humic acid-functionalized magnetite for reductive adsorption of tetrachloroaurate(III) ion in aqueous solution. Environ. Nanotechnol. Monit. Manag. 2021, 15, 100454. [Google Scholar]
- Khataee, A.R.; Fathinia, M.; Aber, S.; Zarei, M. Optimization of photocatalytic treatment of dye solution on supported TiO2 nanoparticles by central composite design: Intermediates identification. J. Hazard. Mater. 2010, 181, 886–897. [Google Scholar] [CrossRef]
- Giles, C.H.; MacEwan, T.H.; Nakhwa, S.N.; Smith, D. Studies in adsorption. Part XI. A system of classification of solution adsorption isotherms, and its use in diagnosis of adsorption mechanisms and in measurement of specific surface areas of solids. J. Chem. Soc. 1960, 3973–3993. [Google Scholar] [CrossRef]
- Tipping, E. Cation Binding by Humic Substances; Cambridge University Press: Cambridge, UK, 2004; p. 156. [Google Scholar]
- Khataee, A.R.; Vafaei, F.; Jannatkhah, M. Biosorption of three textile dyes from contaminated water by filamentous green algal Spirogyra sp.: Kinetic, isotherm and thermodynamic studies. Int. Biodeter. Biodegr. 2013, 83, 33–40. [Google Scholar] [CrossRef]
- Crini, G. Kinetic and equilibrium studies on the removal of cationic dyes from aqueous solution by adsorption onto a cyclodextrin polymer. Dyes Pigm. 2008, 77, 415–426. [Google Scholar] [CrossRef]
- Ong, S.T.; Lee, C.K.; Zainal, Z. Removal of basic and reactive dyes using ethylenediamine modified rice hull. Bioresour. Technol. 2007, 98, 2792–2799. [Google Scholar] [CrossRef] [PubMed]
- Muhammad, A.; Ali Shah, A.H.A.; Bilal, S.; Rahman, G. Basic Blue dye adsorption from water using polyaniline/magnetite (Fe3O4) composites: Kinetic and thermodynamic aspects. Materials 2019, 12, 1764. [Google Scholar] [CrossRef] [PubMed] [Green Version]
- Fernandes, A.N.; Almeida, C.A.P.; Menezes, C.T.B.; Debacher, N.A.; Sierra, M.M.D. Removal of methylene blue from aqueous solution by peat. J. Hazard. Mater. 2007, 144, 412–419. [Google Scholar] [CrossRef]
- Lee, V.K.C.; Porter, J.F.; McKay, G. Modified design model for the adsorption of dye onto peat. Trans. Inst. Chem. Eng. 2001, 79, 21–26. [Google Scholar] [CrossRef]
- Allen, S.J.; McKay, G.; Porter, J.F. Adsorption isotherm models for basic dye adsorption by peat in single and binary component systems. J. Colloid Interface Sci. 2004, 280, 322–333. [Google Scholar] [CrossRef]
- Janoš, P.; Sĕdivý, P.; Rýznarová, M.; Grötschelová, S. Sorption of basic and acid dyes from aqueous solutions onto oxihumolite. Chemosphere 2005, 59, 881–886. [Google Scholar] [CrossRef]
- Langmuir, I. The adsorption of gases on plane surfaces of glass, mica and platinum. J. Am. Chem. Soc. 1918, 40, 1361–1403. [Google Scholar] [CrossRef] [Green Version]
- Brunauer, S.; Emmett, P.H.; Teller, E. Adsorption of gases in multimolecular layers. J. Am. Chem. Soc. 1938, 60, 309–319. [Google Scholar] [CrossRef]
- Freundlich, H. Über die Adsorption in Lösungen. Z. Phys. Chem. 1907, 57, 385–470. [Google Scholar] [CrossRef]
- Derjaguin, B.; Landau, L. Theory of the stability of strongly charged lyophobic sols and of the adhesion of strongly charged particles in solutions of electrolytes. Acta Physicochim. USSR (Engl. Transl.) 1941, 14, 633–662. [Google Scholar] [CrossRef]
- Verwey, E.J.W. Theory of the stability of lyophobic colloids. J. Phys. Chem. 1947, 51, 631–636. [Google Scholar] [CrossRef] [Green Version]
- Verwey, E.J.W.; Overbeek, J.T.G. Theory of the Stability of Lyophobic Colloids; Elsevier: Amsterdam, The Netherlands, 1948; pp. 135–185. [Google Scholar]
- Derjaguin, B.V.; Titijevskaia, A.S.; Abricossova, I.I.; Malkina, A.D. Investigations of the forces of interaction of surfaces in different media and their application to the problem of colloid stability. Discuss. Faraday Soc. 1954, 18, 24–41. [Google Scholar] [CrossRef]
- Li, Q.; Xie, L.; Jiang, Y.; Fortner, J.D.; Yu, K.; Liao, P.; Liu, C. Formation and stability of NOM–Mn(III) colloids in aquatic environments. Water Res. 2019, 149, 190–201. [Google Scholar] [CrossRef] [PubMed]
- Wershaw, R.L. A new model for humic materials and their interactions with hydrophobic organic chemicals in soil–water or sediment–water systems. J. Contam. Hydrol. 1986, 1, 29–45. [Google Scholar] [CrossRef]
- Harbour, P.J.; Dixon, D.R.; Scales, P.J. The role of natural organic matter in suspension stability 2. Modelling of particle–particle interaction. Colloids Surf. A 2007, 295, 67–74. [Google Scholar] [CrossRef]
- Roulia, M.; Vassiliadis, A.A. Sorption characterization of a cationic dye retained by clays and perlite. Micropor. Mesopor. Mater. 2008, 116, 732–740. [Google Scholar] [CrossRef]
Figure 1.
Structural formulae of C.I. Basic Blue 3 (BB 3).

Figure 2.
UV–Vis spectrum of C.I. Basic Blue 3 (Mr = 359.89) in aqueous solution: (a) 0.8 × 10⁻² g L−1; (b) 2 × 10⁻² g L−1.
Figure 2.
UV–Vis spectrum of C.I. Basic Blue 3 (Mr = 359.89) in aqueous solution: (a) 0.8 × 10⁻² g L−1; (b) 2 × 10⁻² g L−1.

Figure 3.
Plot of absorbance as a function of wavelength for potassium humate in water (2 × 10⁻² g L−1).
Figure 3.
Plot of absorbance as a function of wavelength for potassium humate in water (2 × 10⁻² g L−1).

Figure 4.
FTIR spectra of (a) potassium humate, (b) HS–BB 3 complex and (c) BB 3.

Figure 5.
UV–vis spectra of BB 3 (2.5 × 10⁻² g L−1) in aqueous solutions with varying concentrations of potassium humate.
Figure 5.
UV–vis spectra of BB 3 (2.5 × 10⁻² g L−1) in aqueous solutions with varying concentrations of potassium humate.

Figure 6.
Visible spectra of C.I. Basic Blue 3 at a dye loading of 1.2 10−3 g L−1 in the absence (a) and presence (b) of potassium humate.
Figure 6.
Visible spectra of C.I. Basic Blue 3 at a dye loading of 1.2 10−3 g L−1 in the absence (a) and presence (b) of potassium humate.

Figure 7.
Experimental adsorption isotherms for BB 3 on potassium humate at various pH values (287 K).
Figure 7.
Experimental adsorption isotherms for BB 3 on potassium humate at various pH values (287 K).

Figure 8.
Kinetics of BB 3 adsorption on potassium humate at 323 K (pH = 4.0): (a) pseudo-first-order, (b) intraparticle diffusion, (c) pseudo-second-order.
Figure 8.
Kinetics of BB 3 adsorption on potassium humate at 323 K (pH = 4.0): (a) pseudo-first-order, (b) intraparticle diffusion, (c) pseudo-second-order.


Table 1.
Retention of BB 3 by potassium humate (experimental error ±5%).
| Adsorbent Concentration (g L−1) | pH | Dye Concentration (g L−1) | Dye Removal Efficiency (%) | Dye Adsorption (g Dye/g Adsorbent) | |||||||
|---|---|---|---|---|---|---|---|---|---|---|---|
| 287 K | 308 K | 323 K | 353 K | 287 K | 308 K | 323 K | 353 K | ||||
| 0.020 | 4.0 | 0.004 | 89.3 | 89.8 | 99.9 | 95.0 | 0.179 | 0.180 | 0.197 | 0.190 | |
| 0.020 | 55.1 | 53.5 | 63.3 | 53.8 | 0.551 | 0.535 | 0.633 | 0.538 | |||
| 0.020 | 7.3 | 0.004 | 91.0 | 96.9 | 93.5 | – | 0.185 | 0.194 | 0.187 | – | |
| 0.020 | 60.1 | 69.6 | 61.6 | – | 0.601 | 0.696 | 0.616 | – | |||
| 0.020 | 10.0 | 0.004 | 86.8 | 88.8 | – | – | 0.173 | 0.178 | – | – | |
| 0.020 | 57.3 | 61.5 | – | – | 0.573 | 0.615 | – | – | |||
Table 2.
Correlation coefficients and rate constants for the HS–BB 3 reaction.
| Model | R2 | Rate Constant |
|---|---|---|
| Pseudo-first-order | 0.9939 | = 0.0152 min−1 |
| Intraparticle diffusion | 0.9855 | K = 0.0055 g min−1/2g−1, C = 0.5509 |
| Pseudo-second-order | 0.9997 | = 0.893 g (g min)−1 |
Table 3.
Experimental R2 at three pH values for each adsorption model.
| Equation | pH | R2 |
|---|---|---|
| Langmuir | 4.0 | 0.981 |
| 7.3 | 0.988 | |
| 10.0 | 0.985 | |
| Freundlich | 4.0 | 0.960 |
| 7.3 | 0.900 | |
| 10.0 | 0.954 | |
| BET | 4.0 | 0.982 |
| 7.3 | 0.988 | |
| 10.0 | 0.922 |
Publisher’s Note: MDPI stays neutral with regard to jurisdictional claims in published maps and institutional affiliations. |
© 2021 by the authors. Licensee MDPI, Basel, Switzerland. This article is an open access article distributed under the terms and conditions of the Creative Commons Attribution (CC BY) license (https://creativecommons.org/licenses/by/4.0/).
Share and Cite
MDPI and ACS Style
Roulia, M.; Vassiliadis, A.A. Water Purification by Potassium Humate–C.I. Basic Blue 3 Adsorption-Based Interactions. Agronomy 2021, 11, 1625. https://doi.org/10.3390/agronomy11081625
AMA Style
Roulia M, Vassiliadis AA. Water Purification by Potassium Humate–C.I. Basic Blue 3 Adsorption-Based Interactions. Agronomy. 2021; 11(8):1625. https://doi.org/10.3390/agronomy11081625
Chicago/Turabian StyleRoulia, Maria, and Alexandros A. Vassiliadis. 2021. "Water Purification by Potassium Humate–C.I. Basic Blue 3 Adsorption-Based Interactions" Agronomy 11, no. 8: 1625. https://doi.org/10.3390/agronomy11081625
Note that from the first issue of 2016, this journal uses article numbers instead of page numbers. See further details here.