
The Influence of Soil Tillage System on Changes in Gas Exchange Parameters of Pisum sativum L.


Department of Forage Crop Production, Institute of Soil Science and Plant, Cultivation—State Research Institute, Czartoryskich 8 Str., 24-100 Puławy, Poland
Agronomy 2021, 11(5), 1000; https://doi.org/10.3390/agronomy11051000
Submission received: 29 March 2021
/
Revised: 28 April 2021
/
Accepted: 12 May 2021
/
Published: 18 May 2021
Abstract
:A field experiment was carried out in 2017–2019 as a split-plot design with four replicates at the Agricultural Experimental Station in Grabów, Poland. The aim of the study was to compare the gas exchange parameters of the pea depending on the use of different soil tillage systems. Physiological plant parameters as: net photosynthetic rate (PN), transpiration rate (E), stomatal conductance (gs), intercellular CO2 concentration (Ci) and relative chlorophyll content were measured in three developmental stages. The study have showed that all the measured parameters were affected by the tillage system of the soil. Net photosynthetic rate and transpiration rate were significantly lower in the treatments, where simplified-tillage was applied. Pea grown in the plough tillage (CT) showed a generally higher rate of net photosynthesis and transpiration rate compared to that of peas grown in the reduced tillage and no-tillage systems, but this was dependent on the plant development stage and the weather conditions prevailing in a given year. The highest intercellular CO2 concentration (Ci) under different cultivation methods were found in the no-tillage system, regardless of the developmental stage of legumes. The values of determination coefficients showed a positive relationship between the photosynthetic rate and seed yield of the peas tested in all the years of the research. The study also showed that a significantly higher SPAD index was found in the CT tillage system, irrespectively on the developmental stage.
1. Introduction
Crop productivity depends directly on the photosynthesis intensity process and is reduced by the loss of biomass resulting from respiration [1]. Nearly 90% of the accumulated biomass depends on the intensity of this photosynthesis process, which is one of the most important physiological processes [2,3].
The photosynthesis intensity of the legume and other crop species depends on many environmental factors, among others: temperature, type and intensity of light, concentration of oxygen and carbon dioxide in the air, and water availability. The intensity also depends on a number of other factors, such as, chlorophyll content, enzyme activity and plant developmental phase [3], thickness of leaves [4], age of leaves [5] and availability of water [6].
The leaf greenness index (SPAD) is used to diagnose, among other things, the state of plant nutrition. Based on this measurement, one may assess the chlorophyll content in leaves, which consequently allows for the proper dose of fertilizer to be determined [7].
Cultivation has a significant influence on seeds yield, the physicochemical properties, and the biological activity of soil, which affects plant growth [8,9,10,11,12,13,14,15,16]. Earlier studies have shown that cultivation systems significantly influence the physiological activity of crops, i.e., their photosynthetic activity, stomatal conductance, and transpiration [17].
However, the influence of tillage practices on physiological parameters of legumes has not been investigated yet and has not been well understood. The need for this kind of research effects is also fromthe fact that in numerous scientific studies have shown the impact of the soil tillage system on the growth, development, and yielding of plants. In the literature, there is little information on the effects of tillage systems on the gas exchange parameters of the pea and other legume species. Observation of these effects may considerably improve the amount of knowledge and contribute to the partial explanations of the effect of soil tillage systems before legume sowing on photosynthesis rates and other physiological parameters.
The aim of this study was the assessment of the efficiency of the photosynthesis process depending on the soil tillage system used.
2. Materials and Methods
2.1. Field Experiment and Cultivation Management
A field experiment was carried out at the Agricultural Experimental Station in Grabów (51°21′18″ N 21°40′09″ E; Masovian Voivodeship, Poland) belonging to the Institute of Soil Science and Plant Cultivation–State Research Institute in Puławy. The static field experiment was conducted in seasons from 2017 to 2019, as a split-plot design with four replicates on a Luvisol soil with sandy loam texture classes, belonging to a good wheat complex [18] using 24 plots (each with an area of 30 m2 and for harvest 15 m2). At the beginning of the trial, at a depth of 0–20 cm, the soil layer contained 0.74–0.83% organic carbon (measured using the Tiurin method); the total nitrogen content was measured using the Kjeldahl method). The soil pH was 5.4–6.3 (measured in 1 M of potassium chloride (KCl)). The content of phosphorus (P), potassium (K), and magnesium (Mg) amounted to 15.7–22.0, 9.2–20.4, 5.9–7.6 (mg∙100 kg−1 soil), respectively.
The scheme of the trial included one factor, the soil tillage system (TM) of peas (Pisum sativum L.): direct sowing (NT), reduced tillage (RT) and ploughing (CT). Legumes were sown at a density of 200 seeds per 1 m2, in rows intercropping 100 in all soil tillage treatments in the first 10 days of April. The selection of soil treatments was dependent on the tillage system (Table 1). A fertilization treatment (N-15, P2O5-50, K2O-75 kg·ha−1) was applied to all tillage systems before sowing the legumes. Plants were harvested at the full maturity stage of the peas (BBCH 89) in the third 10 days of July.
2.2. Gas Exchanges and SPAD Measurements
Physiological plant parameters: net photosynthetic rate (PN), transpiration rate (E), stomatal conductance (gs), and intercellular CO2 concentration (Ci) were measured in three developmental stages (DS): (1) the appearance of an inflorescence (BBCH 51); (2) full of flowering (BBCH 65) and; (3) binding of the pods (BBCH 75). Measurements of gas exchanges were taken every day before noon (between 8:00 a.m. and 11:00 a.m.) with a CIRAS-2 Portable Photosynthesis System (USA) in four replications. Gas exchange parameters were measured on the young fully exposed leaf at a concentration of 390 ppm CO2, 1000 PARi (μmol·m−2·s−1) and the temperature of 17–25 °C, a chamber flow rate of 200 mL min−1, and a relative humidity of 50%.
Relative chlorophyll content (SPAD index) was measured with a SPAD 502 (Minolta, Tokyo, Japan) chlorophyll meter in four replications.
This device measures the difference between light absorption at a wavelength of 650 and 940 nm, and the quotient of these values is presented as leaf greenness, i.e., indexed chlorophyll content [19]. The result is given in SPAD units in a range from 0 to 800. Measurements were taken in three developmental stages of the peas (on 30 leaves were measured per each plot).
2.3. Statistical Analysis
The data presented are the mean values from the years 2017–2019 as a result of a similar reaction with the plants examined using different soil tillage methods during the study years. The results were statistically analyzed with the use of the variance analysis using Statistica v.10.0 program. Tukey’s multiple comparison test was used to compare differences between the means for cropping methods, while confidence intervals for the means of LSD (α = 0.05) were used.
2.4. Weather Conditions
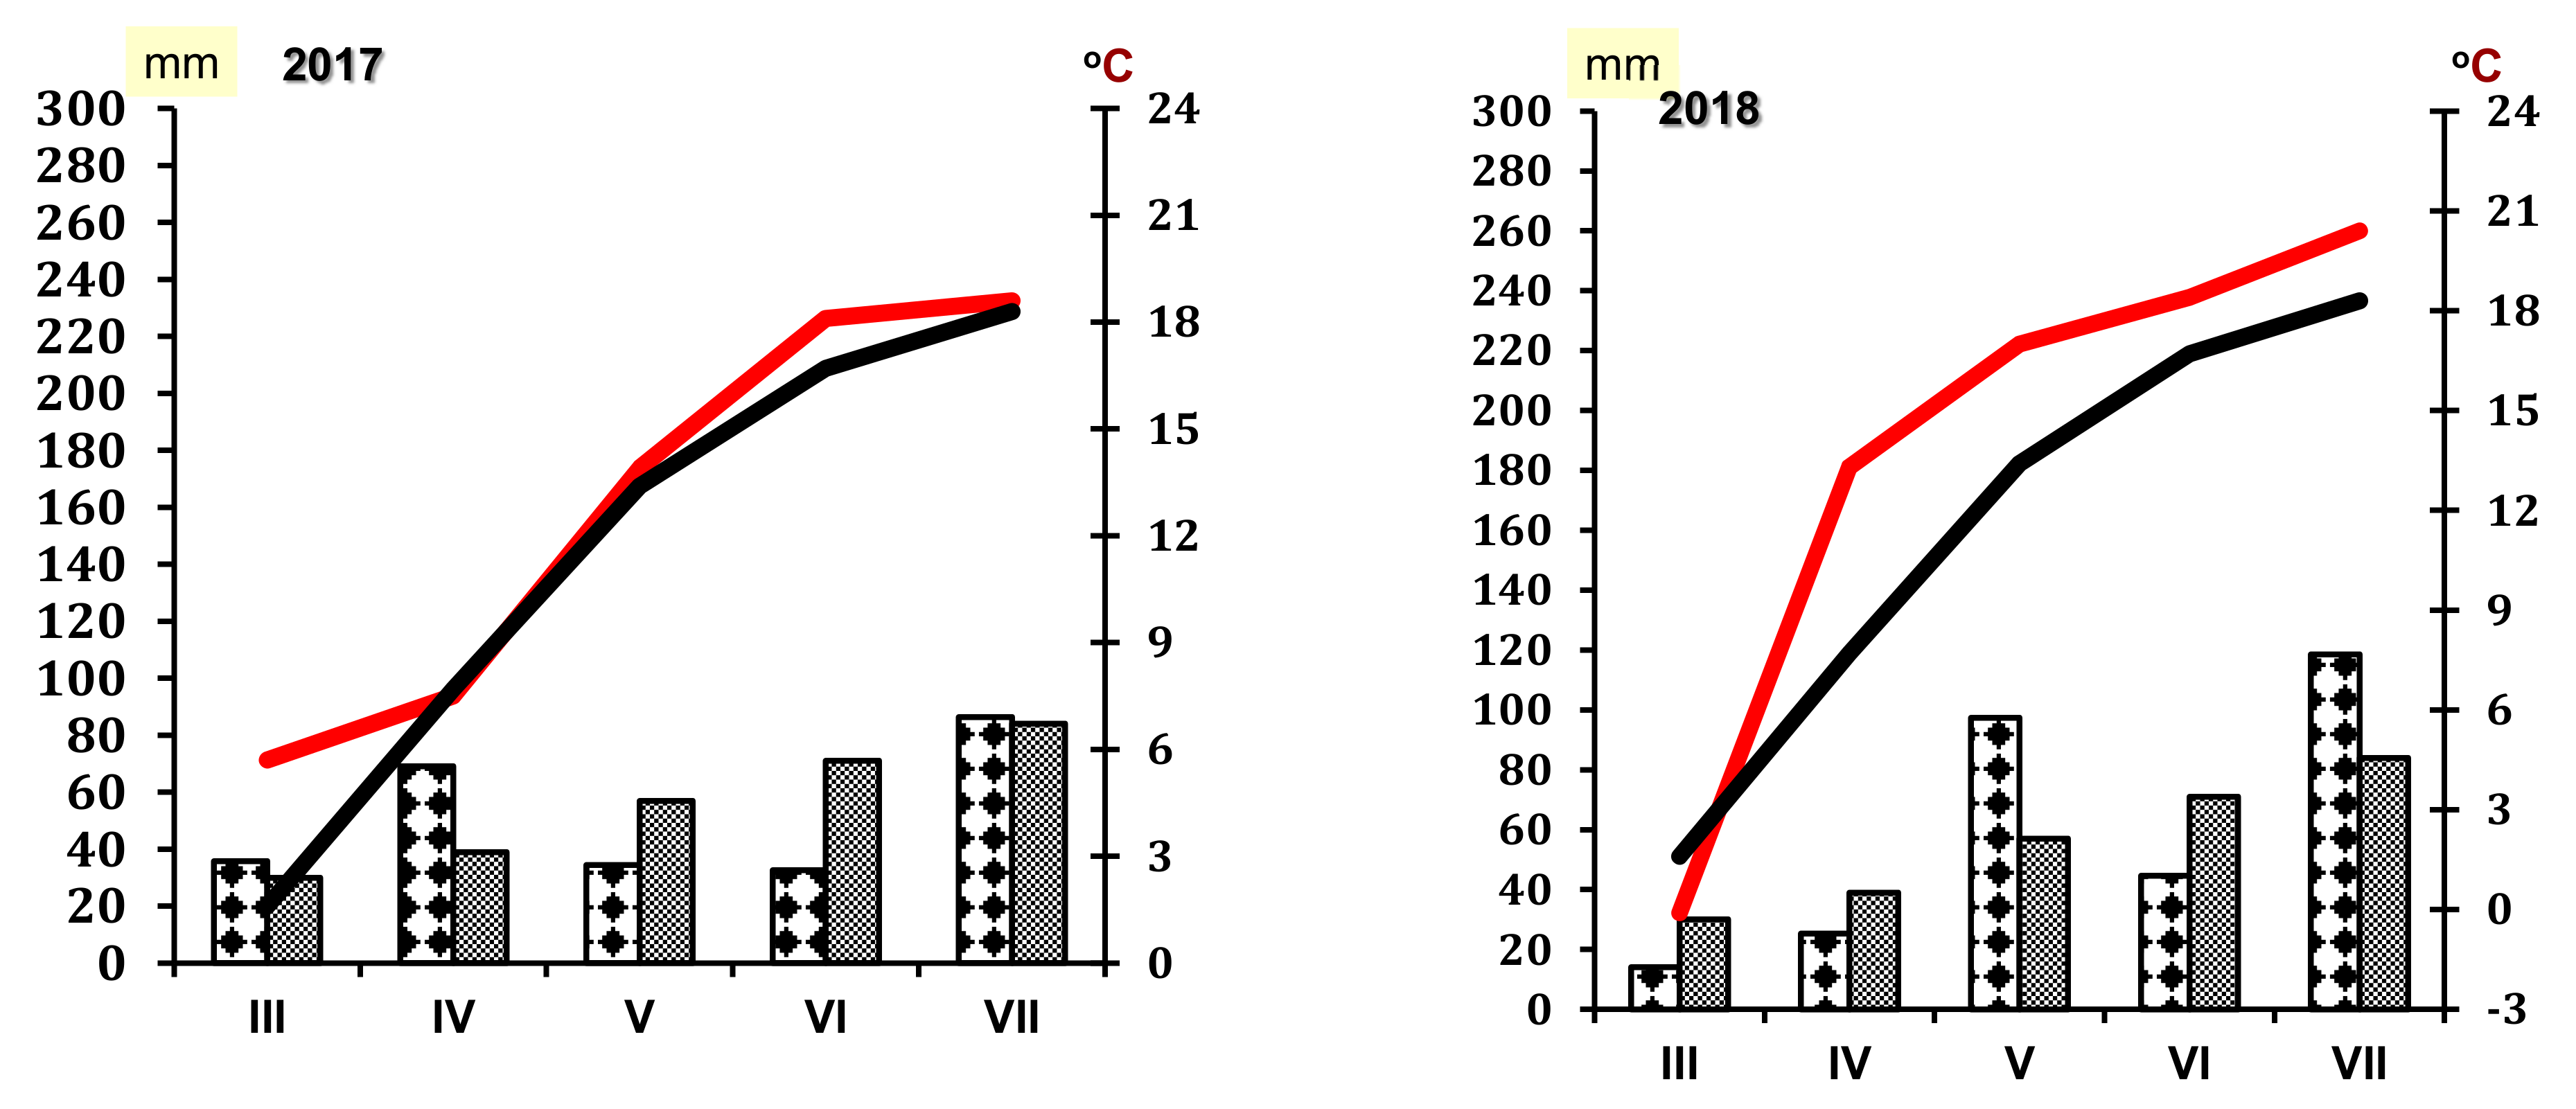
Weather conditions in the period of the research were diversified (Figure 1). In the growing season of 2017, the highest amount of precipitation was noted in spring (April), which exceeded the long term average by 77%. In June and July a small amount of rainfall was recorded. In the first 10 days of August, there were very small amounts of rainfall (0.9 mm). In 2018, the amount of rainfall in May and July exceeded the average from multi-years by 70.9 and 41.1%, respectively. During April and June the total rainfall was only 65% and 63% of the long-term average, respectively. In 2019, the total rainfall was the smallest during the vegetation season of the peas (252.4 mm) compared to earlier years. In July, there was a small amount of rainfall was recorded, which was lower than the long-term average by 30.0%.
3. Results and Discussion
Photosynthesis is one of the most stress-sensitive life processes. Factors limiting the photosynthetic activity of crops include water, carbon dioxide, temperature, and light. Water strongly affects CO2 assimilation, as under water deficit, stomata close and CO2 input gets cut off, which reduces its concentration in the intercellular spaces, and, hence, photosynthesis is inhibited [20]. The main important factor affecting the yield of plants is their gas exchange. The photosynthesis process is conducted in all green parts of the pea plant but most intensively in the leaves. Pea leaves, in comparison to other parts, such as the stem or the pods, showed the highest photosynthetic activity, and these are the source assimilations for developing pods and seeds [21,22].
The obtained results showed that the amount of CO2 released by the peas was higher than their uptake from the atmosphere. The results also showed that the concentration of intercellular CO2 was high and increased with the intensity of the soil treatment, which may indicate that this source of gas could be coming from the surface of the soil.
The pea cultivation system had the significant impact on the parameters of photosynthesis, transpiration, concentration of intercellular CO2, and stomatal conductance. Peas grown in the plough tillage (CT) showed a generally higher rate of net photosynthesis compared to peas grown in the reduced tillage and no-tillage systems, but this was dependent on the plant development stage and the weather conditions prevailing in that given year. A significant difference between all the tillage systems was noted.
In the first year of the study (2017), the highest values of PN were recorded in the full of flowering stage (65 BBCH)-14.1 μmol (CO2) m−2 s−1, while in the remaining developmental phases, only such tendency was shown (Table 2). In the second and third years of the study (2018 and 2019), the highest values of parameters of net photosynthetic rate were recorded in the third developmental phase (binding of the pods—75 BBCH):16.9 and 16.2 μmol (CO2) m−2 s−1, respectively. Comparing all the years of the study, the lowest net photosynthetic rate was noted in the first year, especially at the stage of the beginning of flowering where there was a small amount of rainfall recorded. The simplification of the soil tillage system caused a significant decrease in PN on average by 14% (NT) and 5% (RT), respectively, regardless of the developmental stage of the legumes (Table 1). Moreover, Pisum sativum exhibited significantly higher PN in the third year of the study than in the other years, irrespectively on the developmental stage.
In turn, the lowest net photosynthetic activity (PN) in all years of the study was found in the legumes grown in the no-tillage system, where the peas were sown directly without a plough treatment in each year: 9.9; 10.0, and 12.6 μmol (CO2) m−2 s−1. Niewiadomska et al. [23] and Yang et al. [17] found similar results in their study with spring wheat, which was cultivated in different tillage systems. In those studies, simplified cultivation caused the decrease in net photosynthetic activity.
The intensity of net photosynthesis was dependent on the developmental stage of the pea plant. In all the years of the study and with all the tillage systems, the highest PN was noted in the 75 BBCH stage. However, the developmental stage had not the statistically significantly effect on the PN of Pisum sativum in the first year of the study. Results of Kocoń and Podleśna [24] showed that net photosynthetic intensity is dependent on the developmental stage of the pea. According to these authors, the level of this index was higher in the stage of BBCH 74–75 than BBCH 30.
However, in our study, the interaction between the main experimental factors and the PN index was only detected in the first and second years of the study.
Pisum sativum showed the highest transpiration rate (E) under the plough tillage system, regardless to the developmental stage, while considering the individual developmental stages, the highest values of E were noted in the binding of the pods stage (75 BBCH). The statistically significant differences between the tillage systems were noted only in the second years of the study. Developmental stage also had the significantly influence on the value of E in the second and the third year of the study (Table 1). Moreover, the interaction between the main experimental factors and the transpiration rate index was detected only in the first and third years of the study.
In all considered periods, PN increased with the transpiration rate (E) (Table 2). A similar opinion was found in the study of Proietti [25]. This author stated that the reduction in PN of Olea europaea L. leaves was associated with decreases in transpiration rate. The increase in PN in leaves of Pisum sativum was associated with a stomatal conductance decrease. A tendency in all of the tillage systems of the legumes and their developmental stages was noted. This created conditions under stomata close to a consequent gs decrease.
The stomatal conductance value was different depending on the tillage system of the soil and the developmental stage of the Pisum sativum. Stomatal conductance decreased with the simplification of the soil. Taking into account the average values, the highest stomatal conductance (gs) under the different soil tillage systems was found in reduced tillage in the BBCH 51, while the lowest one in this soil tillage system was found in the BBCH 75 (Table 3). During leaf aging, in all the years of the study and in all soil tillage systems, stomatal conductance decreased. These results are confirmed by the study of Proietti [25].
The soil tillage systems had the statistically and significantly influence on the the value of gs only in the first year of the study, while the developmental stage had the most significant effect on stomatal conductance only in the first and third years of the study. However, an interaction between the main experimental factors and the gs index was only detected in the first year of the study.
The highest intercellular CO2 concentration (Ci) under different cultivation methods was found in the no-tillage system, regardless of the developmental stage of the legumes. The lowest Ci was noted in plough tillage (CT). Differences between the mean value in the first, second, and last year were more than double. Comparing all three years of the study, the highest value of Ci was noted in the third (2019) year. Considering the individual cultivation methods, no significant differences were noted in all the years of the study. While considering the individual developmental stages, significant differences were found in all the years. An interaction between the main experimental factors and the Ci index was not detected.
The decline in PN of the Pisum sativum leaves was associated with a Ci increase. The decrease in Ci due to an increase in PN causes stomatal closure, with a consequent decrease in gs, in agreement with the statement of Proietti et al. [26] and Mousavi et al. [27]. This suggests that the reduction of PN was caused primarily by non-stomatal effects but could be the result of damage to the photosystem induced by soil tillage system of the soil.
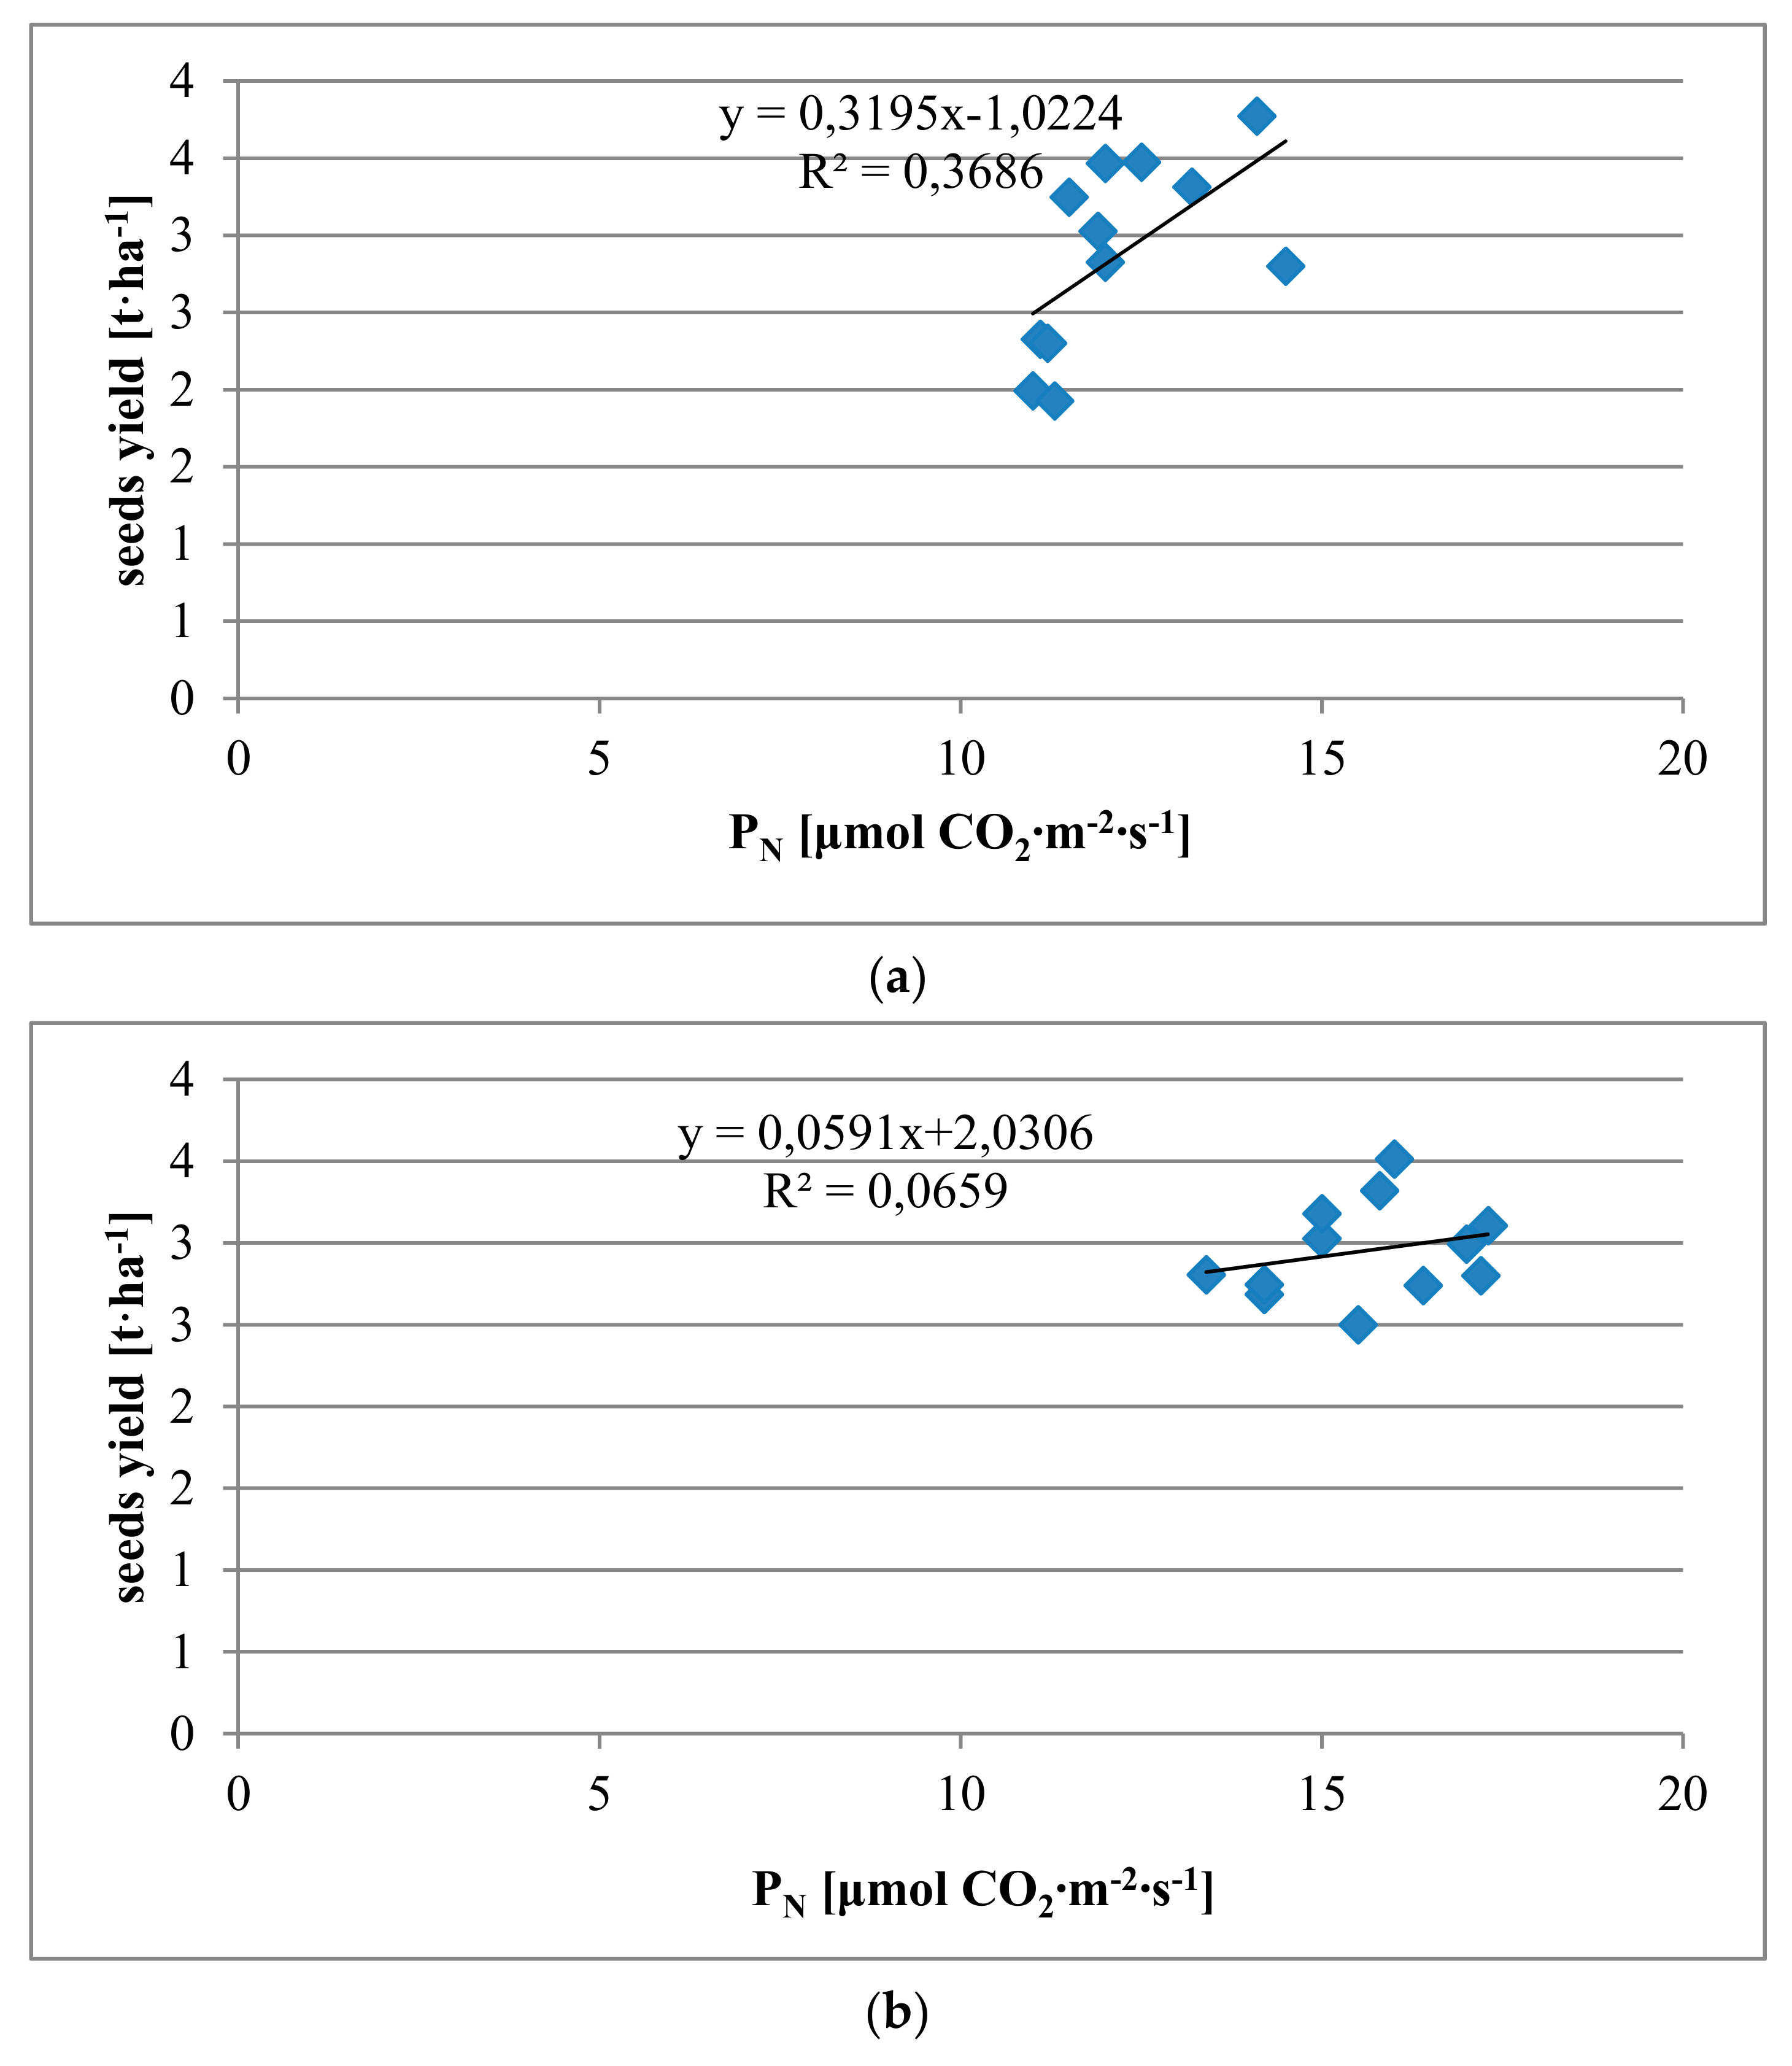
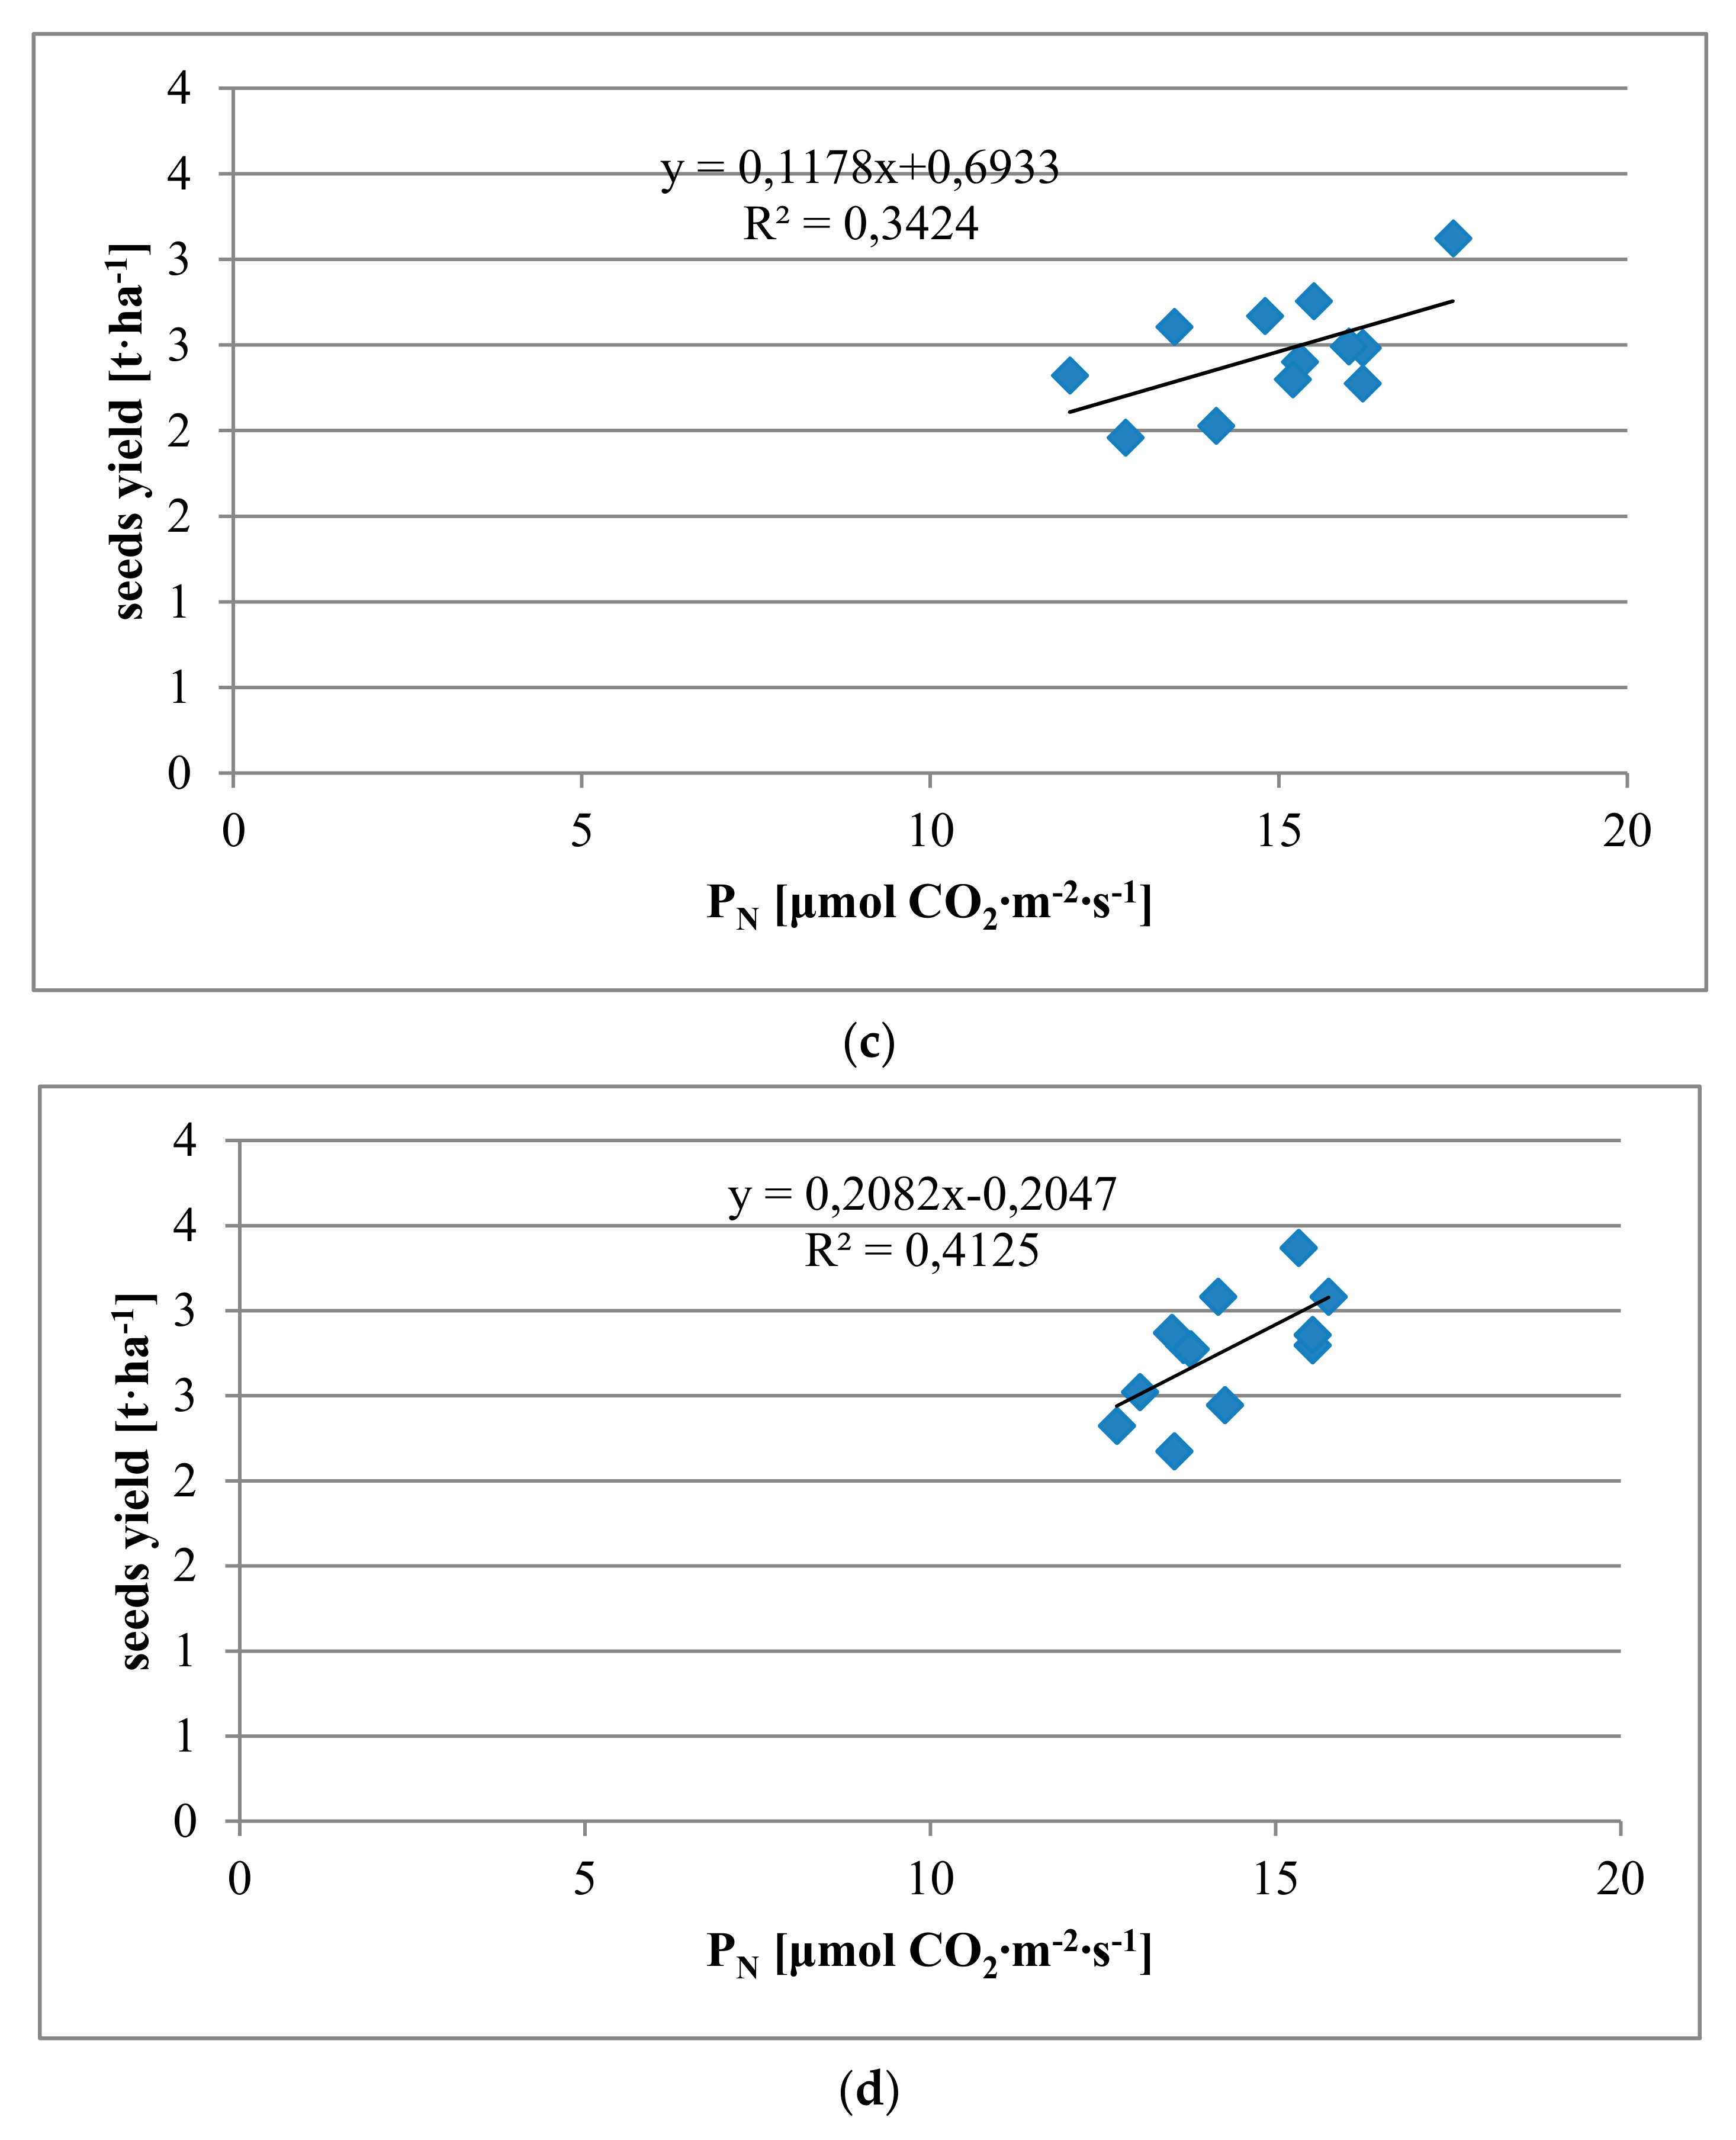
The determined values of determination coefficients (R2 = 36% in the first, R2 = 7% in the second, and R2 = 34% in the third year of study) and regression equations showed a positive relationship between the photosynthetic rate and the seeds yield of the peas tested in all years of research (Figure 2a–d). This dependency was directly proportional, which indicates a highly significant influence of the intensity of this process on the yield of the peas.
The calculated values of determination coefficients and regression equations showed no significant relationship between transpiration rate, stomatal conductance, intercellular CO2 concentration, and the seeds yield of the peas.
The direct use of leaf chlorophyll content has a physiological basis due to the inherent dependence of photosynthesis on chlorophyll molecules as the primary means of harvesting light energy to drive electron transport reactions [28]. The chlorophyll content in leaves varies among species and cultivars but also depends on soil and climate conditions, availability of nutrients, and the developmental stage of plants.
A significantly higher SPAD index was found in the CT tillage system, irrespective of developmental stage (Table 4). The highest SPAD index was recorded in the full of flowering stage (65 BBCH). This shows that the SPAD index decreased with leaf aging.
The interaction between the main experimental factors and the SPAD index was detected only in the second year of the study. No statistically significant differences between cultivation methods were found. While considering the individual developmental stages, significant differences were found in all years. Moreover, the SPAD index decreased when the PN increased.
4. Conclusions
Our study has demonstrated that the tillage system of the soil varied the rate of transpiration and photosynthesis in the tested crop species, regardless of the developmental stage. The experiment indicates that the tillage system significantly reduced the gas exchange parameters of the legumes as a simplified treatment of the soil.
Net photosynthetic rate and transpiration rate were significantly lower with a simplified treatment. Peas grown in plough tillage (CT) showed a generally higher rate of net photosynthesis and transpiration rates as compared to that of peas grown in reduced tillage and no-tillage systems, but this was dependent on the plant developmental stage. The highest intercellular CO2 concentration (Ci) under different cultivation methods was found in the no-tillage system, regardless to the developmental stage of the legumes. The values of the determination coefficients showed a positive relationship between the photosynthetic rate and the seeds yield of the peas tested in all years of the study.
The presented study broadens the knowledge on the tested issue, but the precise explanation of this aspect requires further research.
Funding
This research received no external funding.
Institutional Review Board Statement
Not applicable.
Informed Consent Statement
Not applicable.
Conflicts of Interest
The author declare no conflict of interest.
References
- Olszewski, J.; Pszczolkowska, A.; Makowska, M.; Kulik, T. Effect of water deficit on gas exchange parameters, productivity and grain wholesomeness of spring wheat. Pol. J. Natural. Sci. 2009, 24, 85–92. [Google Scholar] [CrossRef]
- Lawlor, D. Photosynthesis, productivity and environment. J. Exp. Bot. 1995, 46, 1449–1461. [Google Scholar] [CrossRef]
- Kalaji, M.H.; Loboda, T. Fluorescencja Chlorofilu w Badaniach Stanu Fizjologicznego Roślin; SGGW: Warszawa, Poland, 2010; p. 116. [Google Scholar]
- Kalariya, K.A.; Singh, A.L.; Goswami, N.; Mehta, D.; Mahatma, M.K.; Ajay, B.C.; Chakraborty, K.; Zala, P.V.; Chaudhuary, V.; Patel, C.B. Photosynthetic characteristics of peanut genotypes under excess and deficit irrigation during summer. Physiol. Mol. Biol. Plants 2015, 21, 317–327. [Google Scholar] [CrossRef] [Green Version]
- Nautiyal, P.C.; Ravindra, V.; Joshi, Y.C. Net photosynthetic rate in peanut (Arachis hypogaea L.): Influence of leaf position, time of day, and reproductive-sink. Photosynthetica 1999, 36, 129–138. [Google Scholar] [CrossRef]
- Rahman, M.J.; Inden, H.; Kirimura, M. Leaf gas exchange responses to irrigation timing and nigari (effluent of salt industries) of sweet pepper (Capsicum annuum L.) in soilless culture. HortScience 2012, 47, 1574–1579. [Google Scholar] [CrossRef] [Green Version]
- Machul, M. Assessment of nutritional status of plants with nitrogen using a test plant. Post. Nauk. Rol. 2001, 3, 71–83. (In Polish) [Google Scholar]
- Tomkowiak, A.; Starzyk, J.; Kosicka-Dziechciarek, D.; Karwatka, K. The influence of tillage systems on the microbiological condition of soil. Nauka Przyr. Technol. 2017, 11, 355–364. (In Polish) [Google Scholar] [CrossRef]
- Vogeler, I.; Rogasik, J.; Funder, U.; Panten, K.; Schnug, E. Effect of tillage systems and P-fertilization on soil physical and chemical properties, crop yield and nutrient uptake. Soil Till. Res. 2009, 103, 137–143. [Google Scholar] [CrossRef]
- Giannitsopoulos, M.L.; Burgess, P.J.; Rickson, R.J. Effects of conservation tillage systems on soil physical changes and crop yields in a wheat-oilseed rape rotation. J. Soil Water Conserv. 2019, 74, 247–258. [Google Scholar] [CrossRef]
- Shahzad, M.; Farooq, M.; Jabran, K.; Hussain, M. Impact of different crop rotations and tillage systems on weed infestation and productivity of bread wheat. Crop Prot. 2016, 89, 161–169. [Google Scholar] [CrossRef]
- Mikanová, O.; Javůrek, M.; Vach, M.; Markupová, A. The influence of tillage on selected biological parameters. Plant Soil Environ. 2006, 52, 271–274. [Google Scholar] [CrossRef] [Green Version]
- Hobbs, P.R.; Sayre, K.; Gupta, R. The role of conservation agriculture in sustainable agriculture. Philos. T. R. Soc. B 2008, 363, 543–555. [Google Scholar] [CrossRef] [PubMed]
- Mbuthia, L.W.; Acosta-Martínez, V.; DeBruyn, J.; Schaeffer, S.; Tyler, D.; Odoi, E.; Mpheshea, M.; Walker, F.; Eash, N. Long term tillage, cover crop, and fertilization effects on microbial community structure, activity: Implications for soil quality. Soil Biol. Biochem. 2015, 89, 24–34. [Google Scholar] [CrossRef]
- Małecka-Jankowiak, I.; Blecharczyk, A.; Swędrzyńska, D.; Sawińska, Z.; Piechota, T. The effect of long term tillage systems on some soil properties field of pea. Acta Sci. Polon. Agric. 2016, 15, 37–50. [Google Scholar]
- Husnjak, S.; Filipović, D.; Košutić, S. Influence of different tillage systems on soil physical properties and crop yield. Rostlinná vŷroba 2002, 48, 249–254. [Google Scholar] [CrossRef]
- Yang, Y.; Ding, J.; Zhang, Y.; Wu, J.; Zhang, J.; Pan, X.; Gao, C.; Wang, Y.; He, F. Effects of tillage and mulching measures on soil moisture and temperature, photosynthetic characteristics and yield of winter wheat. Agric. Water Manag. 2018, 201, 299–308. [Google Scholar] [CrossRef]
- World Reference Base for Soil Resources 2014. International Soil Classification System for Naming Soil and Creating Legends for Soil Maps; World Soil Resources Reports, 106; Food and Agriculture Organization of the United Nations: Rome, Italy, 2015; pp. 144–181. [Google Scholar]
- Blackmer, T.M.; Schepers, J.S. Techniques for monitoring crop nitrogen status in corn. Commun. Soil Sci. Plant Anal. 1994, 25, 1791–1800. [Google Scholar] [CrossRef]
- Córdobaa, J.; Molina-Canob, J.L.; Péreza, P.; Morcuendea, R.; Moralejoc, M.; Savéd, R.; Martínez-Carrascoa, R. Photosynthesis-dependent/independent control of stomatal responses to CO2 in mutant barley with surplus electron transport capacity and reduced SLAH3 anion channel transcript. Plant Sci. 2015, 239, 15–25. [Google Scholar] [CrossRef] [PubMed] [Green Version]
- Dzierżyńska, A. Comparative study of net photosynthesis in foliar mutant of Pisum sativum L. Acta Physiol. Plant. 1990, 1, 15–23. [Google Scholar]
- Olszewski, J. Influence of selected abiotic and biotic stresses on the intensity of photosynthesis and transpiration, yielding and health of field beans and peas [Wpływ wybranych stresów abiotycznych i biotycznych na intensywność fotosyntezy itranspiracji, plonowanie oraz zdrowotność bobiku i grochu siewnego]. Wyd. UWM Olsztyn. Rozpr. i Monogr. 2004, 85, 109. (In Polish) [Google Scholar]
- Niewiadomska, A.; Majchrzak, L.; Borowiak, K.; Wolna-Maruwka, A.; Waraczewska, Z.; Budka, A.; Gaj, R. The Influence of tillage and cover cropping on soil microbial parameters and spring wheat physiology. Agronomy 2020, 10, 200. [Google Scholar] [CrossRef] [Green Version]
- Kocoń, A.; Podleśna, A. The effect of water stress on gas exchange in leaves of varied pea cultivars. Zesz. Probl. Post. Nauk Rol. 2010, 545, 161–167. [Google Scholar]
- Proietti, P. Gas exchange in senescing leaves of Olea europaea L. Photosynt 1998, 35, 579–587. [Google Scholar] [CrossRef]
- Proietti, P.; Nasini, L.; Del Buono, D.; D’Amato, R.; Tedeschini, E.; Businelli, D. Selenium protects olive (Olea europaea L.) from drought stress. Sci. Hortic. 2013, 164, 165–171. [Google Scholar] [CrossRef]
- Mousavi, S.; Regni, L.; Bocchini, M.; Mariotti, R.; Cultrera, N.G.M.; Mancuso, S.; Googlani, J.; Chakerolhosseini, M.R.; Guerrero, C.; Albertini, E.; et al. Physiological, epigenetic and genetic regulation in some olive cultivars under salt stress. Sci. Rep. 2019, 9, 1093. [Google Scholar] [CrossRef] [PubMed] [Green Version]
- Croft, H.; Chen, J.M.; Luo, X.; Bartlett, P.; Chen, B.; Staebler, R.M. Leaf chlorophyll content as a proxy for leaf photosynthetic capacity. Glob. Change Biol. 2017, 23, 3513–3524. [Google Scholar] [CrossRef]
Figure 1.
Course of weather conditions during the vegetation periods (2017–2019); * mean from 1871 to 2000.
Figure 1.
Course of weather conditions during the vegetation periods (2017–2019); * mean from 1871 to 2000.


Figure 2.
Relationship between net photosynthetic rate (PN) and seed yields in the years: 2017 (a), 2018 (b), and 2019 (c), and mean (d).
Figure 2.
Relationship between net photosynthetic rate (PN) and seed yields in the years: 2017 (a), 2018 (b), and 2019 (c), and mean (d).


Table 1.
Methods of soil treatment in different soil tillage systems.
| Tillage System | Soil Treatment |
|---|---|
| CT * | Post-harvest of forecrop cultivation: a shallow cultivation with a disc harrow to a depth of 5 cm of soil. Basic land preparation: ploughing to a depth of 30 cm with a plough. Pre-plant tillage: cultivator followed by harrowing. |
| RT | After plant harvest, post-cultivation was carried out with a rotary cultivator to a depth of 5 cm. Basic land preparation: stubble cultivator (2.5 m wide). Pre-plant tillage: cultivator followed by harrowing and rolling. |
| NT | The preparation of the land for pea sowing was reduced to the use of a herbicide, followed by sowing directly into the stubble of the forecrop using a special seeder for direct sowing. |
* tillage system; CT—conventional tillage; RT—reduced tillage; NT—no tillage.
Table 2.
Net photosynthetic rate (PN) and transpiration rate (E) in different tillage systems in 2017–2019 (mean ± standard deviation).
Table 2.
Net photosynthetic rate (PN) and transpiration rate (E) in different tillage systems in 2017–2019 (mean ± standard deviation).
| Year | 2017 | 2018 | 2019 | 2017–2018 | ||||||||
|---|---|---|---|---|---|---|---|---|---|---|---|---|
| Tillage System | NT * | RT | CT | NT | RT | CT | NT | RT | CT | NT | RT | CT |
| Mean ± SD | ||||||||||||
| Net photosynthetic rate (PN) (μmol CO2 m−2 s−1) in I ** | 9.9 ± 0.97 | 13.9 ± 1.25 | 11.1 ± 0.84 | 10.0 ± 0.93 | 10.8 ± 0.99 | 13.2 ± 0.43 | 12.6 ± 0.50 | 13.2 ± 0.53 | 13.9 ± 0.29 | 11.1 | 12.8 | 12.8 |
| Net photosynthetic rate (PN) (μmol CO2 m−2 s−1) in II | 11.1 ± 0.33 | 13.1 ± 1.02 | 14.1 ± 0.36 | 10.7 ± 0.53 | 11.5 ± 0.48 | 13.5 ± 0.94 | 11.9 ± 0.36 | 12.5 ± 0.59 | 13.5 ± 0.80 | 11.6 | 13.2 | 13.7 |
| Net photosynthetic rate (PN) (μmol CO2 m−2 s−1) in III | 11.2 ± 0.11 | 11.9 ± 0.21 | 13.6 ± 0.78 | 15.5 ± 0.80 | 14.4 ± 0.66 | 16.9 ± 0.52 | 13.5 ± 1.02 | 15.1 ± 0.94 | 16.2 ± 0.95 | 13.4 | 13.9 | 15.5 |
| LSD (α = 0.05) for: | ||||||||||||
| Tillage system (TS) | 1.489 *** | 1.424 | 0.807 | - | ||||||||
| Development stage (DS) | n.s. | 1.084 | 2.105 | - | ||||||||
| DS/TS | 1.864 | 1.445 | n.s. | - | ||||||||
| TS/DS | 1.657 | 1.715 | n.s. | - | ||||||||
| Transpiration rate (E) (mmol H2O m−2∙s−1) in I ** | 2.6 ± 0.30 | 3.3 ± 0.47 | 2.1 ± 0.19 | 2.7 ± 0.19 | 3.0 ± 0.31 | 3.5 ± 0.26 | 3.2 ± 0.41 | 2.3 ± 0.25 | 2.7 ± 0.17 | 2.7 | 2.8 | 2.7 |
| Transpiration rate (E) (mmol H2O m−2∙s−1) in II ** | 2.5 ± 0.18 | 2.8 ± 0.26 | 3.1 ± 0.27 | 2.5 ± 0.22 | 2.7 ± 0.16 | 3.2 ± 0.22 | 2.9 ± 0.17 | 3.1 ± 0.25 | 3.4 ± 0.30 | 2.0 | 2.2 | 2.5 |
| Transpiration rate (E) (mmol H2O m−2∙s−1) in III ** | 2.6 ± 0.01 | 2.8 ± 0.04 | 3.3 ± 0.25 | 3.5 ± 0.29 | 3.3 ± 0.23 | 3.8 ± 0.04 | 3.1 ± 0.34 | 3.6 ± 0.28 | 3.7 ± 0.17 | 3.1 | 3.2 | 3.6 |
| LSD (α = 0.05) for: | ||||||||||||
| Tillage system (TS) | n.s. | 0.303 | n.s. | - | ||||||||
| Development stage (DS) | n.s. | 0.501 | 0.668 | - | ||||||||
| DS/TS | 0.555 | n.s. | 0.815 | - | ||||||||
| TS/DS | 0.504 | n.s. | 0.573 | - | ||||||||
* NT—no-tillage, RT—reduced tillage, CT—plough tillage. ** I—the beginning of flowering stage (51 BBCH stage); II—full of flowering stage (65 BBCH); III—binding the pods (75 BBCH). *** (p < 0.05). ns.—nonsignificant. BBCH = biologische, bundesanstalt, bundessortenamt and chemical.
Table 3.
Intercellular CO2 concentration (Ci) in different tillage systems in 2017–2019 (mean ± standard deviation).
Table 3.
Intercellular CO2 concentration (Ci) in different tillage systems in 2017–2019 (mean ± standard deviation).
| Year | 2017 | 2018 | 2019 | 2017–2018 | ||||||||
|---|---|---|---|---|---|---|---|---|---|---|---|---|
| Tillage System | NT * | RT | CT | NT | RT | CT | NT | RT | CT | NT | RT | CT |
| Mean ± SD | ||||||||||||
| Stomatal conductance (gs) (mmol H2O m−2 s−1) in I ** | 253 ± 26.6 | 399 ± 68.8 | 191 ± 28.2 | 264 ± 114.1 | 300 ± 112.3 | 382 ± 125.0 | 445 ± 111.8 | 312 ± 158.3 | 342 ± 59.5 | 321 | 337 | 305 |
| Stomatal conductance (gs) (mmol H2O m−2 s−1) in II ** | 250 ± 26.7 | 290 ± 65.0 | 180 ± 25.3 | 250 ± 114.1 | 310 ± 112.3 | 380 ± 232.9 | 444 ± 112.0 | 309 ± 30.0 | 346 ± 57.0 | 255 | 255 | 298 |
| Stomatal conductance (gs) (mmol H2O m−2 s−1) in III ** | 334 ± 40.5 | 312 ± 25.5 | 316 ± 23.8 | 216 ± 43.2 | 180 ± 11.6 | 188 ± 48.6 | 189 ± 75.7 | 153 ± 75.5 | 197 ± 22.5 | 246 | 215 | 234 |
| LSD (α = 0.05) for: | ||||||||||||
| Tillage system (TS) | 40.444 *** | n.s. | n.s. | - | ||||||||
| Development stage (DS) | 43.341 | n.s. | 66.539 | - | ||||||||
| DS × TS | 81.102 | n.s. | n.s. | - | ||||||||
| TS × DS | 79.607 | n.s. | n.s. | - | ||||||||
| Intercellular CO2 concentration (Ci) (μmol mol−1) in I ** | 106 ± 21.70 | 112 ± 12.99 | 121 ± 8.17 | 122 ± 4.15 | 124 ± 6.98 | 124 ± 14.34 | 249 ± 17.46 | 225 ± 117.6 | 225 ± 11.05 | 166 | 158 | 159 |
| Intercellular CO2 concentration (Ci) (μmol mol−1) in II ** | 118 ± 6.52 | 92 ± 8.44 | 92 ± 3.96 | 143 ± 20.26 | 137 ± 10.79 | 130 ± 18.19 | 181 ± 23.89 | 193 ± 21.85 | 166 ± 26.36 | 140 | 136 | 130 |
| Intercellular CO2 concentration (Ci))μmol mol−1) in III ** | 128 ± 28.60 | 132 ± 28.58 | 124 ± 4.92 | 151 ± 38.73 | 169 ± 24.77 | 174 ± 10.40 | 124 ± 15.66 | 125 ± 63.81 | 104 ± 4.39 | 134 | 142 | 134 |
| LSD (α = 0.05) for: | ||||||||||||
| Tillage system (TS) | n.s. | n.s. | n.s. | - | ||||||||
| Development stage (DS) | 16.630 | 11.304 | 18.864 | - | ||||||||
| DS × TS | n.s. | n.s. | n.s. | - | ||||||||
| TS × DS | n.s. | n.s. | n.s. | - | ||||||||
* NT—no-tillage, RT—reduced tillage, CT—plough tillage. ** I—the beginning of flowering stage (51 BBCH stage); II—the full flowering stage (65 BBCH); III—binding the pods (75 BBCH). *** (p < 0.05). ns.—nonsignificant.
Table 4.
The relative chlorophyll content (SPAD index) in different tillage systems in 2017–2019 (mean ± standard deviation).
Table 4.
The relative chlorophyll content (SPAD index) in different tillage systems in 2017–2019 (mean ± standard deviation).
| Year | 2017 | 2018 | 2019 | 2017–2018 | ||||||||
|---|---|---|---|---|---|---|---|---|---|---|---|---|
| Tillage System | NT * | RT | CT | NT | RT | CT | NT | RT | CT | NT | RT | CT |
| Mean ± SD | ||||||||||||
| SPAD in I ** | 521.8 ± 65.52 | 510.5 ± 14.40 | 528.5 ± 12.74 | 452.0 ± 9.54 | 444.5 ± 9.01 | 451.3 ± 13.24 | 411.5 ± 6.50 | 402.8 ± 3.70 | 406.8 ± 4.60 | 483.0 | 468.1 | 478.0 |
| SPAD in II | 628.0 ± 8.75 | 647.8 ± 13.29 | 619.0 ± 37.59 | 514.3 ± 8.29 | 490.8 ± 15.06 | 500.0 ± 8.28 | 460.0 ± 2.12 | 463.8 ± 7.85 | 477.3 ± 4.09 | 572.0 | 583.0 | 571.0 |
| SPAD in III | 444.8 ± 23.01 | 477.5 ± 43.27 | 536.0 ± 42.70 | 563.3 ± 18.67 | 627.3 ± 11.82 | 593.3 ± 9.58 | 598.0 ± 12.69 | 595.3 ± 5.17 | 595.0 ± 5.87 | 535.0 | 567.2 | 575.4 |
| LSD (α = 0.05) for: | ||||||||||||
| Tillage system (TS) | n.s. *** | n.s. | n.s. | - | ||||||||
| Development stage (DS) | 49.729 | 54.356 | 10.167 | - | ||||||||
| DS/TS | n.s. | 64.537 | n.s. | - | ||||||||
| TS/DS | n.s. | 50.261 | n.s. | - | ||||||||
* NT—no-tillage, RT—reduced tillage, CT—plough tillage. ** I—the beginning of flowering stage (51 BBCH stage); II—the full of flowering stage (65 BBCH); III—binding the pods (75 BBCH). *** (p < 0.05). ns.—nonsignificant.
Publisher’s Note: MDPI stays neutral with regard to jurisdictional claims in published maps and institutional affiliations. |
© 2021 by the author. Licensee MDPI, Basel, Switzerland. This article is an open access article distributed under the terms and conditions of the Creative Commons Attribution (CC BY) license (https://creativecommons.org/licenses/by/4.0/).
Share and Cite
MDPI and ACS Style
Bojarszczuk, J. The Influence of Soil Tillage System on Changes in Gas Exchange Parameters of Pisum sativum L. Agronomy 2021, 11, 1000. https://doi.org/10.3390/agronomy11051000
AMA Style
Bojarszczuk J. The Influence of Soil Tillage System on Changes in Gas Exchange Parameters of Pisum sativum L. Agronomy. 2021; 11(5):1000. https://doi.org/10.3390/agronomy11051000
Chicago/Turabian StyleBojarszczuk, Jolanta. 2021. "The Influence of Soil Tillage System on Changes in Gas Exchange Parameters of Pisum sativum L." Agronomy 11, no. 5: 1000. https://doi.org/10.3390/agronomy11051000
Note that from the first issue of 2016, this journal uses article numbers instead of page numbers. See further details here.