Article

Enhanced Nutritional Quality of Sweet Maize Kernel in Response to Cover Crops and Bio-Fertilizer

by
Vesna Dragicevic
1,*,
Željko Dolijanović
2,
Biljana Janosevic
2,
Milan Brankov
1,
Milovan Stoiljkovic
3,
Margarita S. Dodevska
4 and
Milena Simić
1
1
Maize Research Institute “Zemun Polje”, Slobodana Bajica 1, Zemun Polje, 11185 Belgrade, Serbia
2
Faculty of Agriculture, University of Belgrade, Nemanjina 6, Zemun, 11080 Belgrade, Serbia
3
Vinča Institute of Nuclear Sciences, P.fah 522, 11001 Belgrade, Serbia
4
Institute of Public Health of Serbia “Dr Milan Jovanović Batut”, Centre for Hygiene and Human Ecology, 11000 Belgrade, Serbia
*
Author to whom correspondence should be addressed.
Agronomy 2021, 11(5), 981; https://doi.org/10.3390/agronomy11050981
Submission received: 29 April 2021 / Revised: 12 May 2021 / Accepted: 12 May 2021 / Published: 14 May 2021
(This article belongs to the Section Innovative Cropping Systems)

Abstract

:
Cover crops (CC) are an important low-input strategy in sustainable agricultural systems. The impact of different CC (common vetch, field pea, winter oats, fodder kale, common vetch + winter oats and field pea + winter oats), organic mulch, control treatment-fallow, and bio-fertilizer (BF) application, on yield and quality of sweet maize kernel was evaluated. CC biomass was higher in mixtures: field pea + winter oats, and common vetch + winter oats, as well as in fodder kale. Kernel yield and its chemical composition varied significantly by CC, BF, year, and their interaction. Organic mulch enhanced the concentration of sugars and glutathione in maize kernel. BF increased kernel yield, the concentration of sugars, vitamin C, Mg, Fe, Zn, and reduced phytate concentration. The highest Mg and Mn concentration in maize kernel was achieved with fodder kale, Zn concentration with common vetch + winter oats + BF, and Fe concentration with winter oats. The same treatments expressed the highest impact on variability in concentration of the phytate, phenolics, and yellow pigment, thus affecting further bio-availability of essential elements. Results indicate that in a semi-arid climate, under rain-fed conditions, CC such as fodder kale and winter oats + common vetch could enhance sweet maize productivity and kernel quality, serving as an important part of a sustainable cropping system, to facilitate food security.

1. Introduction

Food security is of particular importance when climate change is addressed. Global changes affect not just food production, but food quality, too. High-input agriculture, agro-ecosystem devastation, in combination with climate extremes, contribute to a reduction of produces quality: decrease in concentration of essential minerals and vitamins. As a consequence, the human population is incapable of meeting minimal requirements for essential nutrients resulting in pandemic of various chronic diseases, such as obesity, diabetes, metabolic syndrome, cardio-vascular diseases, cancer, etc. [1,2].
Sustainable agricultural systems are aimed at restoring agro-ecosystems, to increase not just crop productivity, but also their quality implying various practices, such as use of cover crops. Cover crops grown during the fallow period prevent soil erosion, help in weed control, and pest management, increase content of soil organic matter, and maintain the nutrients’ status. One of the most important roles of cover crops is a conservation of mineral nutrients, preventing their leaching to a soil depth [3]. Some species, like grasses and brassicas are better for residual N scavenging. By contrast with cereal covers which have tendency to immobilize N, thus affecting soil moisture and reducing weedines, legume covers express the best efficiency for crops with high N requirements, as maize is replacing some N quantity from fertilizers [4]. Maize yield responds to residues of legume cover crops with fertiliser equivalency between 25% and 59% [5]. Some legumes such as white clover (Trifolium repens L.) are also able to enhance P absorption into maize plants [6]. Vetch, winter rape (Brassica napus subsp. napus L.) and oilseed rape (Brassica napus subsp. napus L.), are able to reduce N fertilization and diminish the risk of N leaching from soil, contributing to greater maize productivity [7]. Cover crops are able to improve rhizosphere composition, by increasing the number of N fixing bacteria or other microorganisms that facilitate the availability of nutrients, thus promoting plant-microbe symbioses [8,9], also increasing grain yield and quality [10,11].
Microorganisms, including bio-fertilizers, have a key role in crop productivity, maintaining soil fertility, stimulating plant growth and productivity, plant defence and stress tolerance, increasing uptake and accumulation of N, P, Fe, Mn, Zn, and Cu in plant tissues, enhancing antioxidants and photosynthetic pigments [12,13]. They are also able to reduce phytic acid concentration (the main anti-nutrient which binds mineral nutrients) in maize grain [14].
Maize is an important staple food worldwide. In relation to standard dent maize, sweet maize (Zea mays L. saccharata Strut) kernel is considered as vegetable and it is mainly used as fresh, frozen or canned. It has a unique profile of nutrients and phytochemicals; it is rich in carbohydrates, but is also a valuable source of fibres, it contains vitamins, minerals, phenolic acids, and flavonoids [15,16]. Constituents, such as phytic acid and phenolics, bind the majority of the minerals, making them unavailable to humans and non-ruminant animals [17]. However, some other constituents, like vitamin C, carotenoids, amino acids, glutathione, etc. are substances that enhance the bio-availability of minerals (promoters) [18,19].
The connection between cropping system, yield, and nutritional quality of sweet maize kernel is established in this research. The aim and novelty of this experiment lays in potential improvements in a nutritional quality of sweet maize kernel grown after the different cover crops and their combination with bio-fertilizer in semi-arid climate under rain-fed conditions. The goal is a feasible increase in concentration of essential mineral elements and their potential bio-availability through relations with enhancing factors (like vitamin C, carotenoids, glutathione) and factors which reduce bio-availability of essential elements (phenolics and phytic acid). For the future frameworks, from the viewpoint of food security toward sustainable systems that include cover crops, introduction of genotypes (cover crops, as well as main crops) with enhanced nutrient efficiency could be of particular importance.

2. Material and Methods

2.1. Plant Material

The effect of different treatments with winter cover crops (CC) was evaluated:
  • T1–common vetch (Vicia sativa L.);
  • T2–field pea (Pisum sativum L.);
  • T3–winter oats (Avena sativa L.);
  • T4–fodder kale (Brassica oleracea (L.) convar. acephala);
  • T5–common vetch + winter oats;
  • T6–field pea + winter oats;
  • T7–organic mulch;
  • T8–control –fallow.
Sweet maize ‘ZPSC 421su’ of FAO 400 maturity group was the main crop.

2.2. Field Experiment

The experiment was conducted during 2015/16, 2016/17 and 2017/18 at the Experimental Field of the Maize Research Institute at Zemun Polje, Belgrade vicinity (44°52’ N; 20°20’ E), according to a split-plot design, in four replications. The climate was semi-arid and soil was slightly calcareous chernozem with 30% silt, 17% clay and 53% sand. The soil properties at 0–40 cm layer were 3.22% organic matter, pH 7.3, 1.38% total CaCO3; 0.20% of total N (Kjeldahl), 10.70 mg kg−1 of available P (Olsen [20]), and 106.98 mg kg−1 of extractable K, 293.73 mg kg−1 Mg, 7.94 mg kg−1 Fe, 11.94 mg kg−1 Mn, 2.16 mg kg−1 Zn (K, Ca, Mg, Fe, Mn and Zn were determined by inductively coupled plasma-optical emission spectrometry after extraction with Mechlich 3 [21]).
The cover crops (CC) were sown at the end of October or early November, in the following amounts: common vetch–120 kg ha−1, field pea–150 kg ha−1, oat –160 kg ha−1, and fodder kale–15 kg ha−1, and in mixtures ratio of 70:30 was between legume and oats. Organic mulch treatment (T7) was consisted of after-harvest residues of winter wheat, in amount of 10 t ha−1, which were arranged over soil surface. The elementary plot area was 35 m2. In all three experimental years, the preceding crop was winter wheat. The autumn soil preparation (ploughing and seedbed preparation) was performed immediately before sowing.
The mineral fertilization was applied before the sowing of CC (autumn) and sweet maize (spring). The aim was to provide the main crop (sweet maize) with 120 kg N ha−1, 90 kg P ha−1 and 60 kg K ha−1. The total amount of P and K fertilizer was applied in autumn with mono-potassium phosphate fertilizer (ai 0:52:34) and the required N amount was incorporated prior to sweet maize sowing (urea 46% ai). Nitrogen fertilization was as follows: 120kg N ha−1 for non-legume crops and control treatments, 80 kg N ha−1 for sole legumes and 90 kg N ha−1 for mixtures. The remaining 40 or 30 kg N ha−1 was considered to be provided by nitrogen fixation, during CC cultivation.
Fresh mass of the cover crops, as well as winter wheat residues (T7) were incorporated in the soil by a rotovator TF-145 (FPM Deljanin, Kuršumlija, Serbia) at the end of April. Immediately after, a half of the elementary plot (17.5 m2) was treated with the bio-fertilizer (BF)–Uniker (containing cellulolytic and proteolytic bacteria strains: Bacillus megaterium, B. lichenoirmis and B. subtilis; producer –Agrounik d.o.o, Šimanovci, the Republic of Serbia) to support the mineralization of crop residues, in the amount of 10 L ha−1.The main crop was sown in the middle of May. The seeds were sown at the arrangement of 70 cm between rows and 22 cm between plants in the row (65,000 plants ha−1). Other cultivation and care measures were performed in accordance with the principles of proper agricultural technology. The ears from the central two rows from each elementary plot (46 plants per each replication of each treatment) were harvested at milk stage, at the end of August.

2.3. Chemical Analysis

Each year after harvest, kernels were manually removed and average sample was made (containing 100 g of fresh kernels) and dried in a ventilation oven at 60 °C and then milled on Perten 120—Hägersten, Sweden (particle size < 500 μm). After the extraction with 5% trichloroacetic acid, spectrophotometrical methods were used for the determination of phytic P (Pphy) [22], and glutathione (GSH) [23] on Biochrom Libra S22 UV/Vis (ultraviolet–visible) Spectrophotometer–Biochrom, UK. Soluble phenolics were also determined spectrophotometrically after the extraction with double distilled water [24] and expressed as μg of 3-hydroxy-4-methoxycinnamic acid g−1 dry matter. Yellow pigment (YP) was determined after the extraction with n-butanol [25] and expressed as µg of β-carotene equivalent (βCE) g−1 dry matter. The content of sucrose, D-glucose and D-fructose was determined from the fresh samples spectrophotometrically [26], using the enzymatic assay kit R-BIOPHARM AG (Cat. Nr. 10 716 260 035) and then calculated as percent of dry weight, while vitamin C was determined by iodometric titration [27]. After wet digestion with HClO4 + HNO3, the concentration of essential mineral elements (Mg, Fe, Mn and Zn) was determined with inductively coupled plasma-optical emission spectrometry (Spectroflame, 27.12 MHz and 2.5 kW, model P, Spectro Analytical Instruments, Kleve, Germany).

2.4. Statistical Analysis

The obtained data were processed using three-way factorial analysis of variance (ANOVA, F test), tailored into a split-plot design with four replicates; p < 0.05 and p < 0.01 were set as a significance level. The ratios between phytic acid and essential elements were evaluated: phytic acid Phy/Mg, Phy/Fe, Phy/Mn and Phy/Zn and presented as a mean ± standard deviation (SD). Principal component analysis (PCA) was used for evaluation of interdependence between cover crops and bio-fertilizer regarding kernel chemical composition, i.e., concentration of Mg, Fe, Mn, and Zn sucrose, glucose, fructose, Pphy, phenolics, GSH, vitamin C, and YP. Statistical analysis was performed by SPSS 15.0 (IBM Corporation, Armonk, New York, NY, USA) for the Windows Evaluation version.

2.5. Meteorological Conditions

Meteorological conditions (Table 1) during late autumn and winter (when soil surface was covered by CC) indicated higher average temperature for 2015/16 and 2017/18 season (8.3 and 7.3 °C, respectively) in regard to the 1991–2019 average (6.5 °C). The lowest temperature (under 0 °C) was noticed only in January of 2016/17 (−1.8 °C). The average precipitation amount was slightly higher in 2015/16 in comparison to the multi-year average, while in 2017/18 and particularly 2016/17 it was lower for about 108.5 and 146.1 mm, respectively.
The vegetative season of sweet maize, for 2017 was characterised by the higher average temperature compared to other two seasons and particularly the 1991–2019 average. This season was also low in precipitation amount, with 201.6 mm lesser in relation to 1991–2019 average. Especially low in precipitation amount were July in 2016, as well as July and August in 2017, with only 3.0, 26.7, and 23.7 mm, respectively. Jun in 2018 was particularly high in precipitations, with 150.1 mm.

3. Results

3.1. Cover Crops Biomass and Sweet Maize Kernel Yield

The CC and year (Y), as sources of variation significantly affected CC biomass (Table 2), with the highest average values obtained in T6 treatment (field pea + winter oats) and in 2016/17 season (44795 kg ha −1, on average). CC treatments with the significantly highest values of biomass were T4–fodder kale, in 2015/16 (43515 kg ha−1) and 2016/17 (54040 kg ha−1), as well as T6 combination (field pea + winter oats), in 2016/17 and 2017/18 (57150 kg ha−1 and 49,860 kg ha−1, respectively). Slightly lower values were noticed in T6 treatment in 2017/18 (49860 kg ha−1). By contrast, the lowest values of CC biomass were achieved at T3 treatment (winter oats) in 2015/16and 2017/18 (16610 kg ha−1 and 19,675 kg ha−1, respectively). Irrespective that almost double greater biomass was achieved by T3 in 2016/17 (29240 kg ha−1), it was the lowest value in this season, when compared to other CC treatments.
Sweet maize kernel yield varied highly significantly in regard to CC, Y, their interaction, and BF × CC interaction, while BF and its interaction with Y expressed significant impact on sweet maize kernel yield (Table 3). The highest average values were achieved in T4 treatment (6489.6 kg ha−1), with BF application (5920.0 kg ha−1), as well as in 2018 (8495.5 kg ha−1). CC × BF interaction indicated that the highest kernel yield was realised by T7 × BF combination (6787.8 kg ha−1) and slightly lower by T4 × without BF combination (6694.5 kg ha−1). T4 treatment achieved the highest average kernel yield in 2016 and 2017, with 4941.1 kg ha−1, 6261.7 kg ha−1, respectively, while in 2018, the highest yield was achieved in T8 treatment (8826.8 kg ha−1). In 2018, significantly higher kernel yield was achieved when BF was applied (8770.8 kg ha−1, in average).

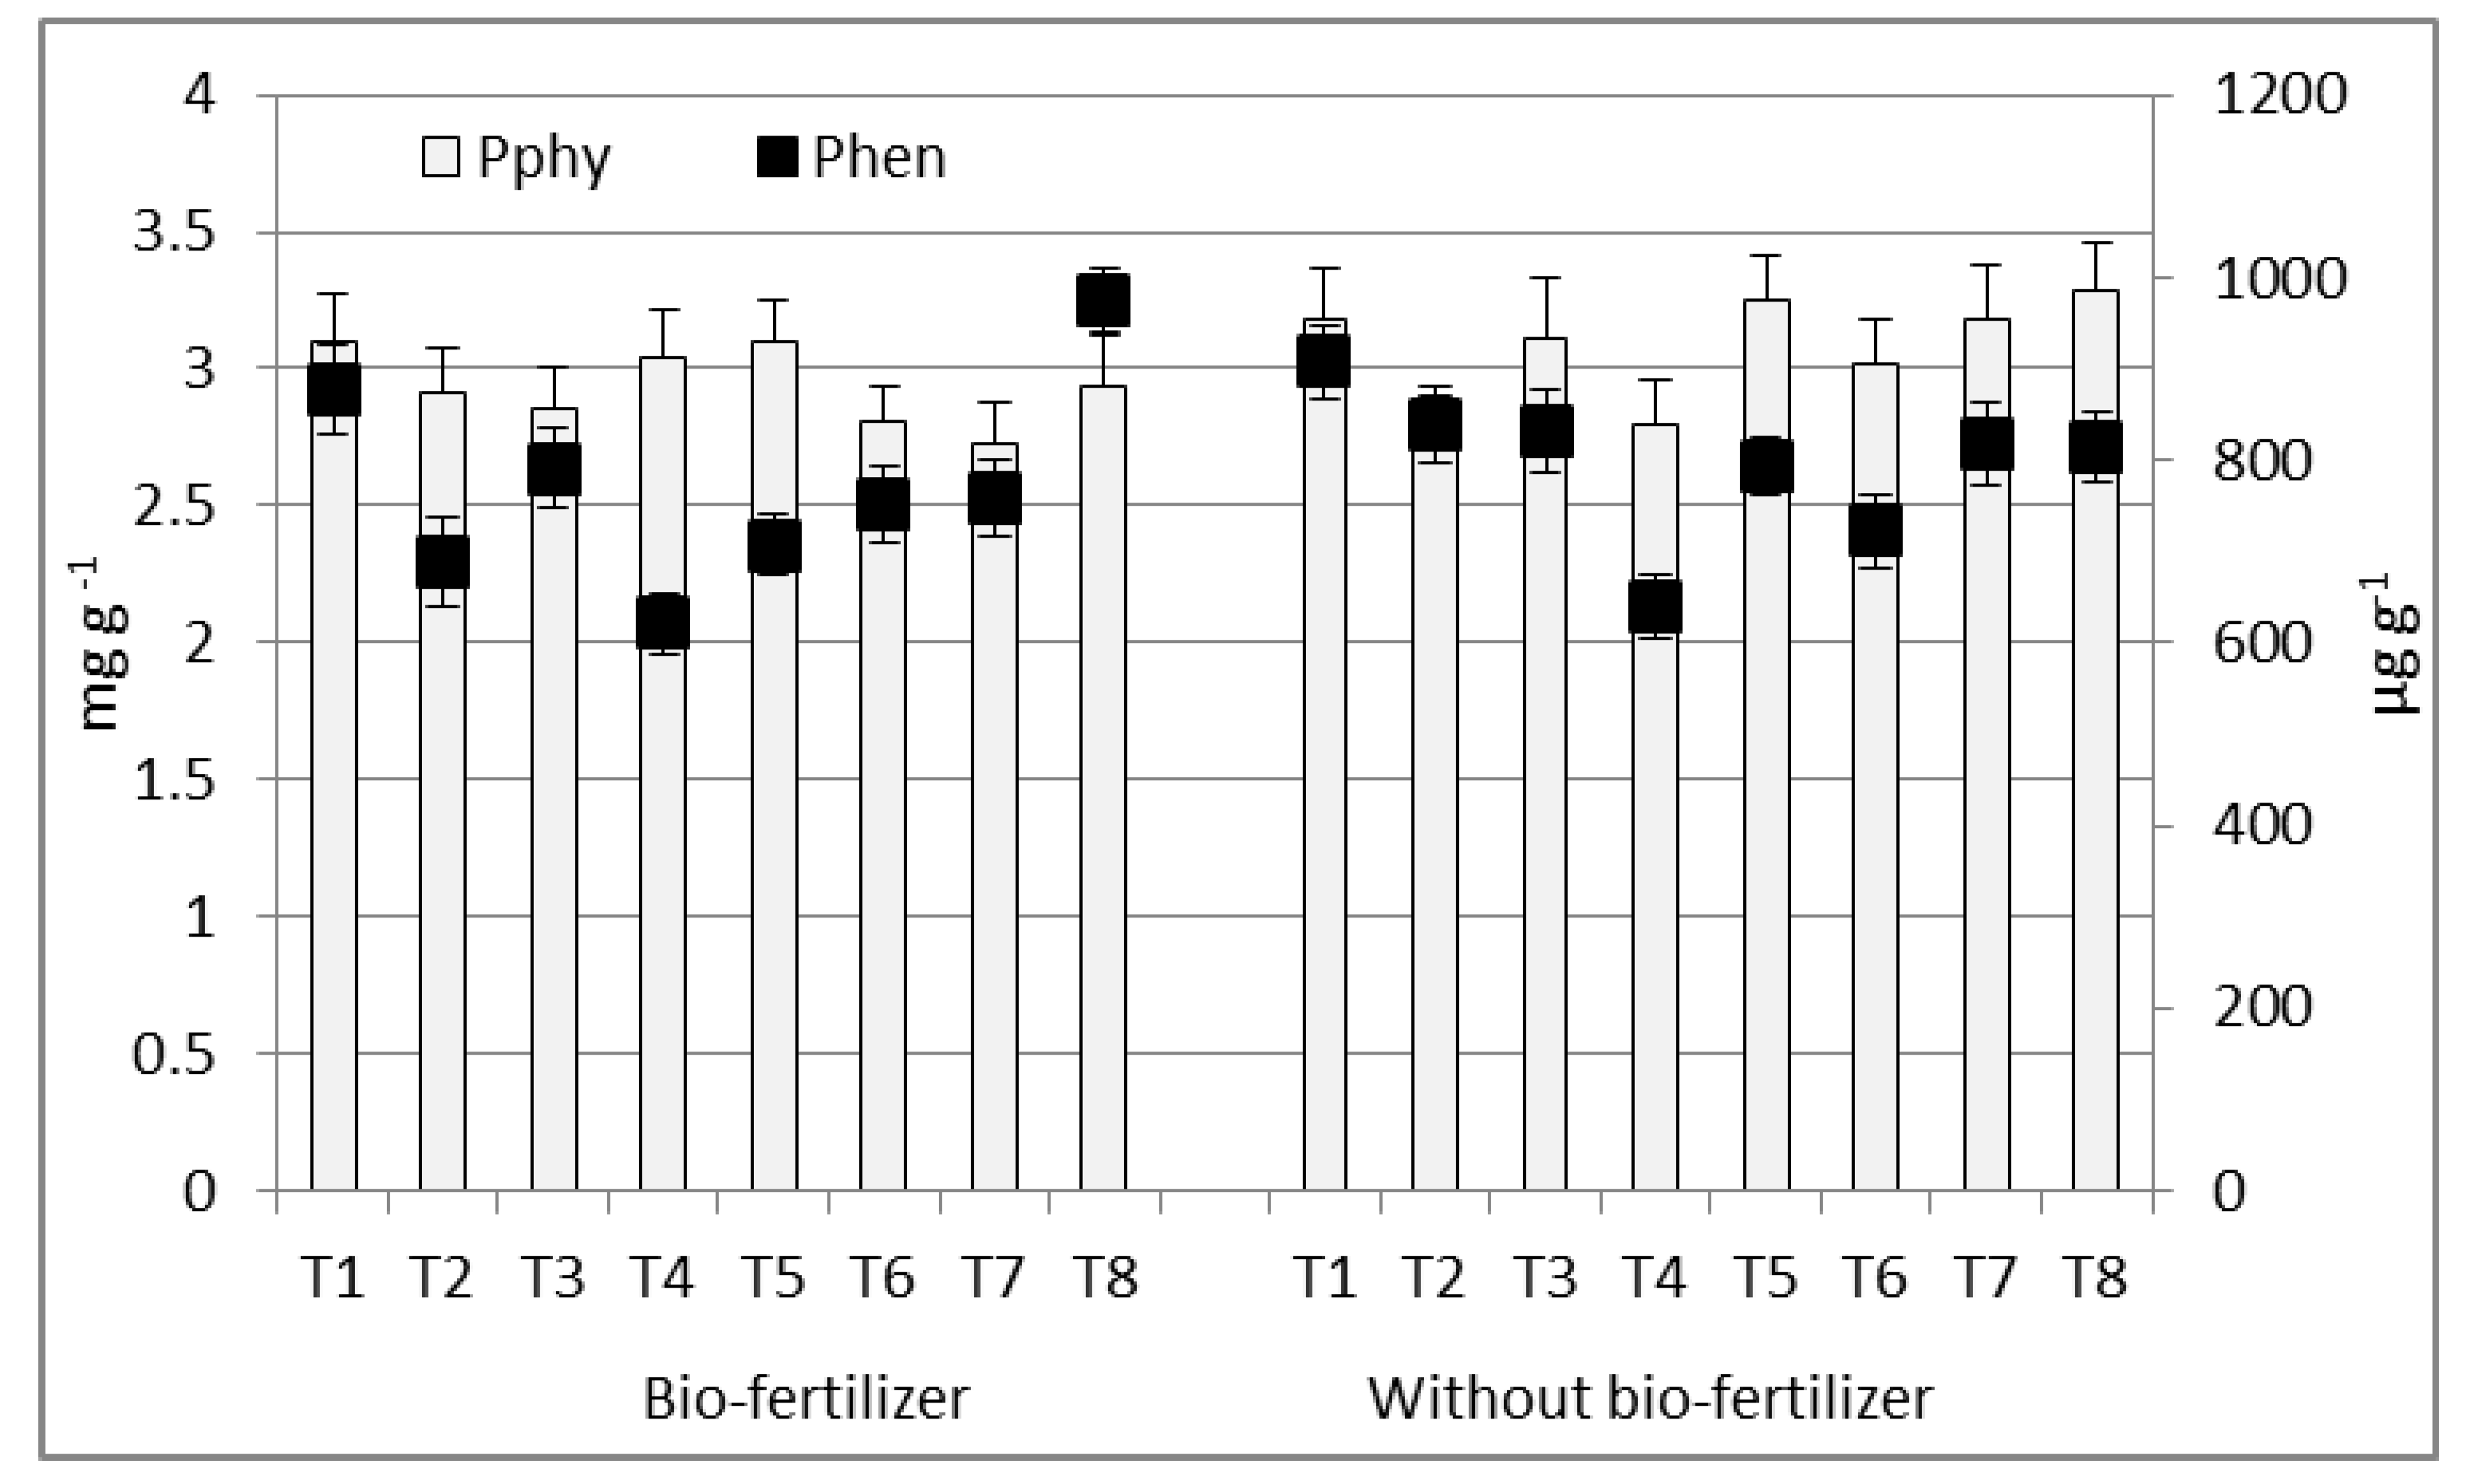
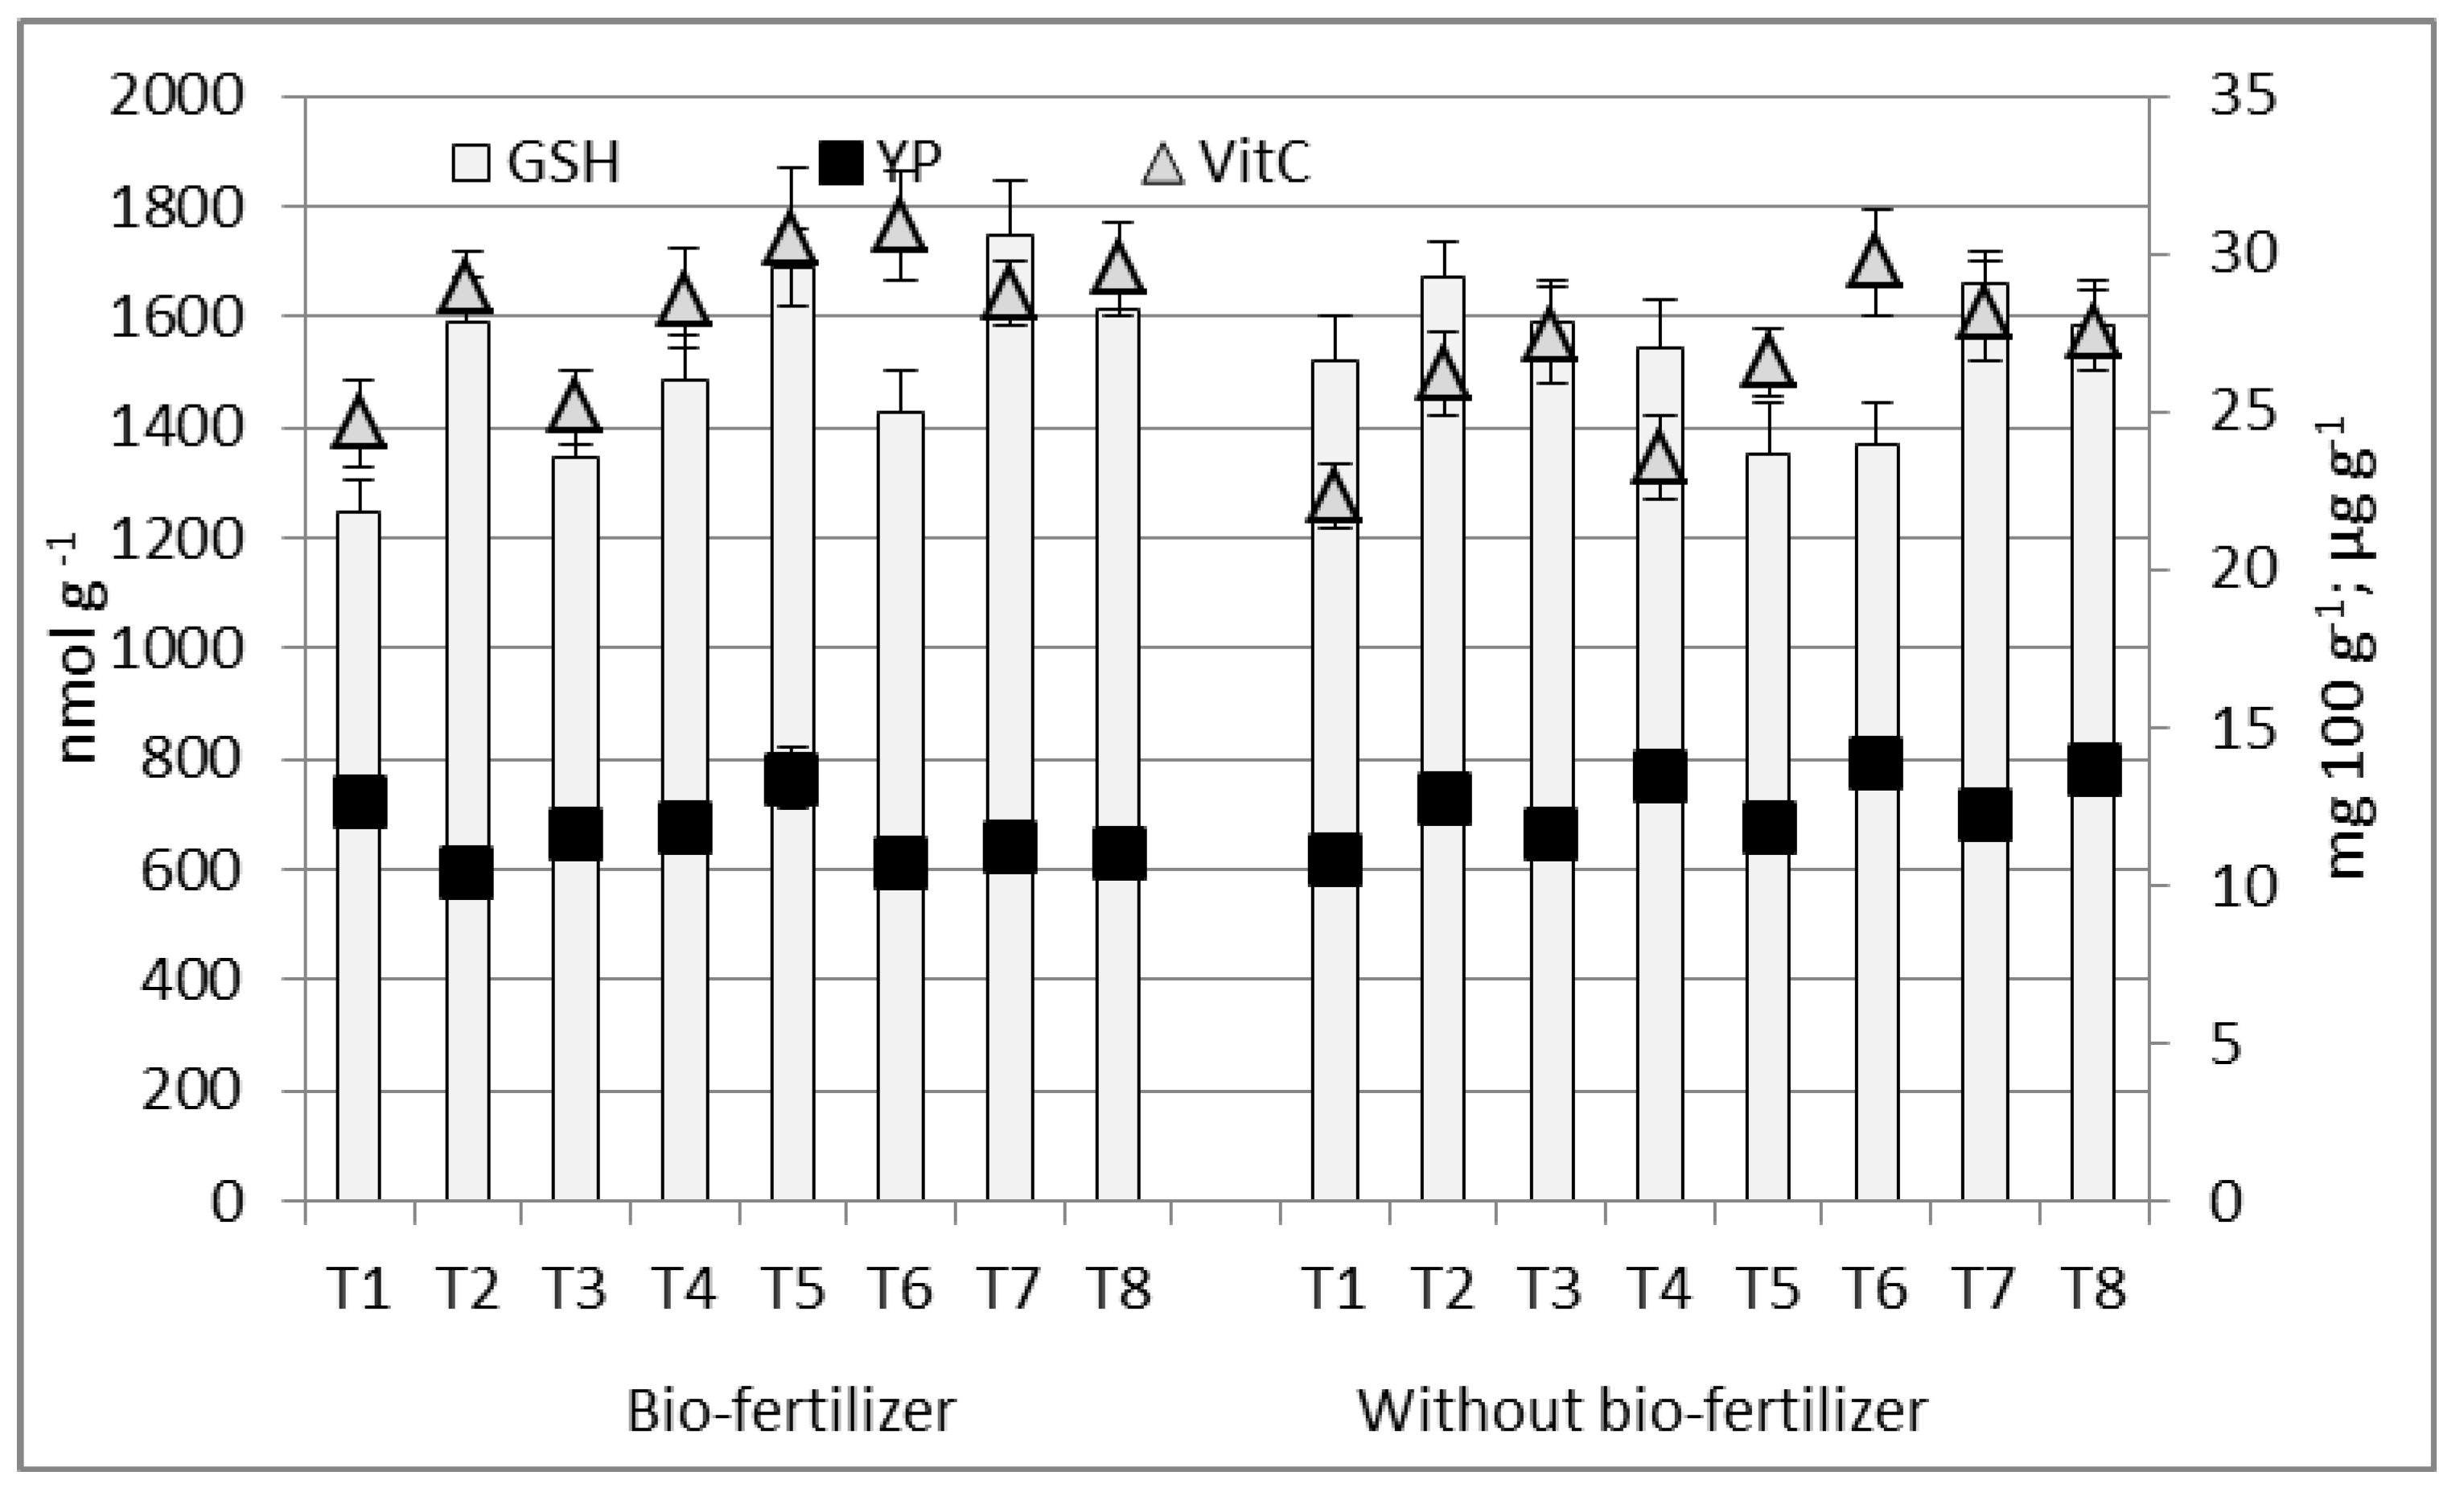
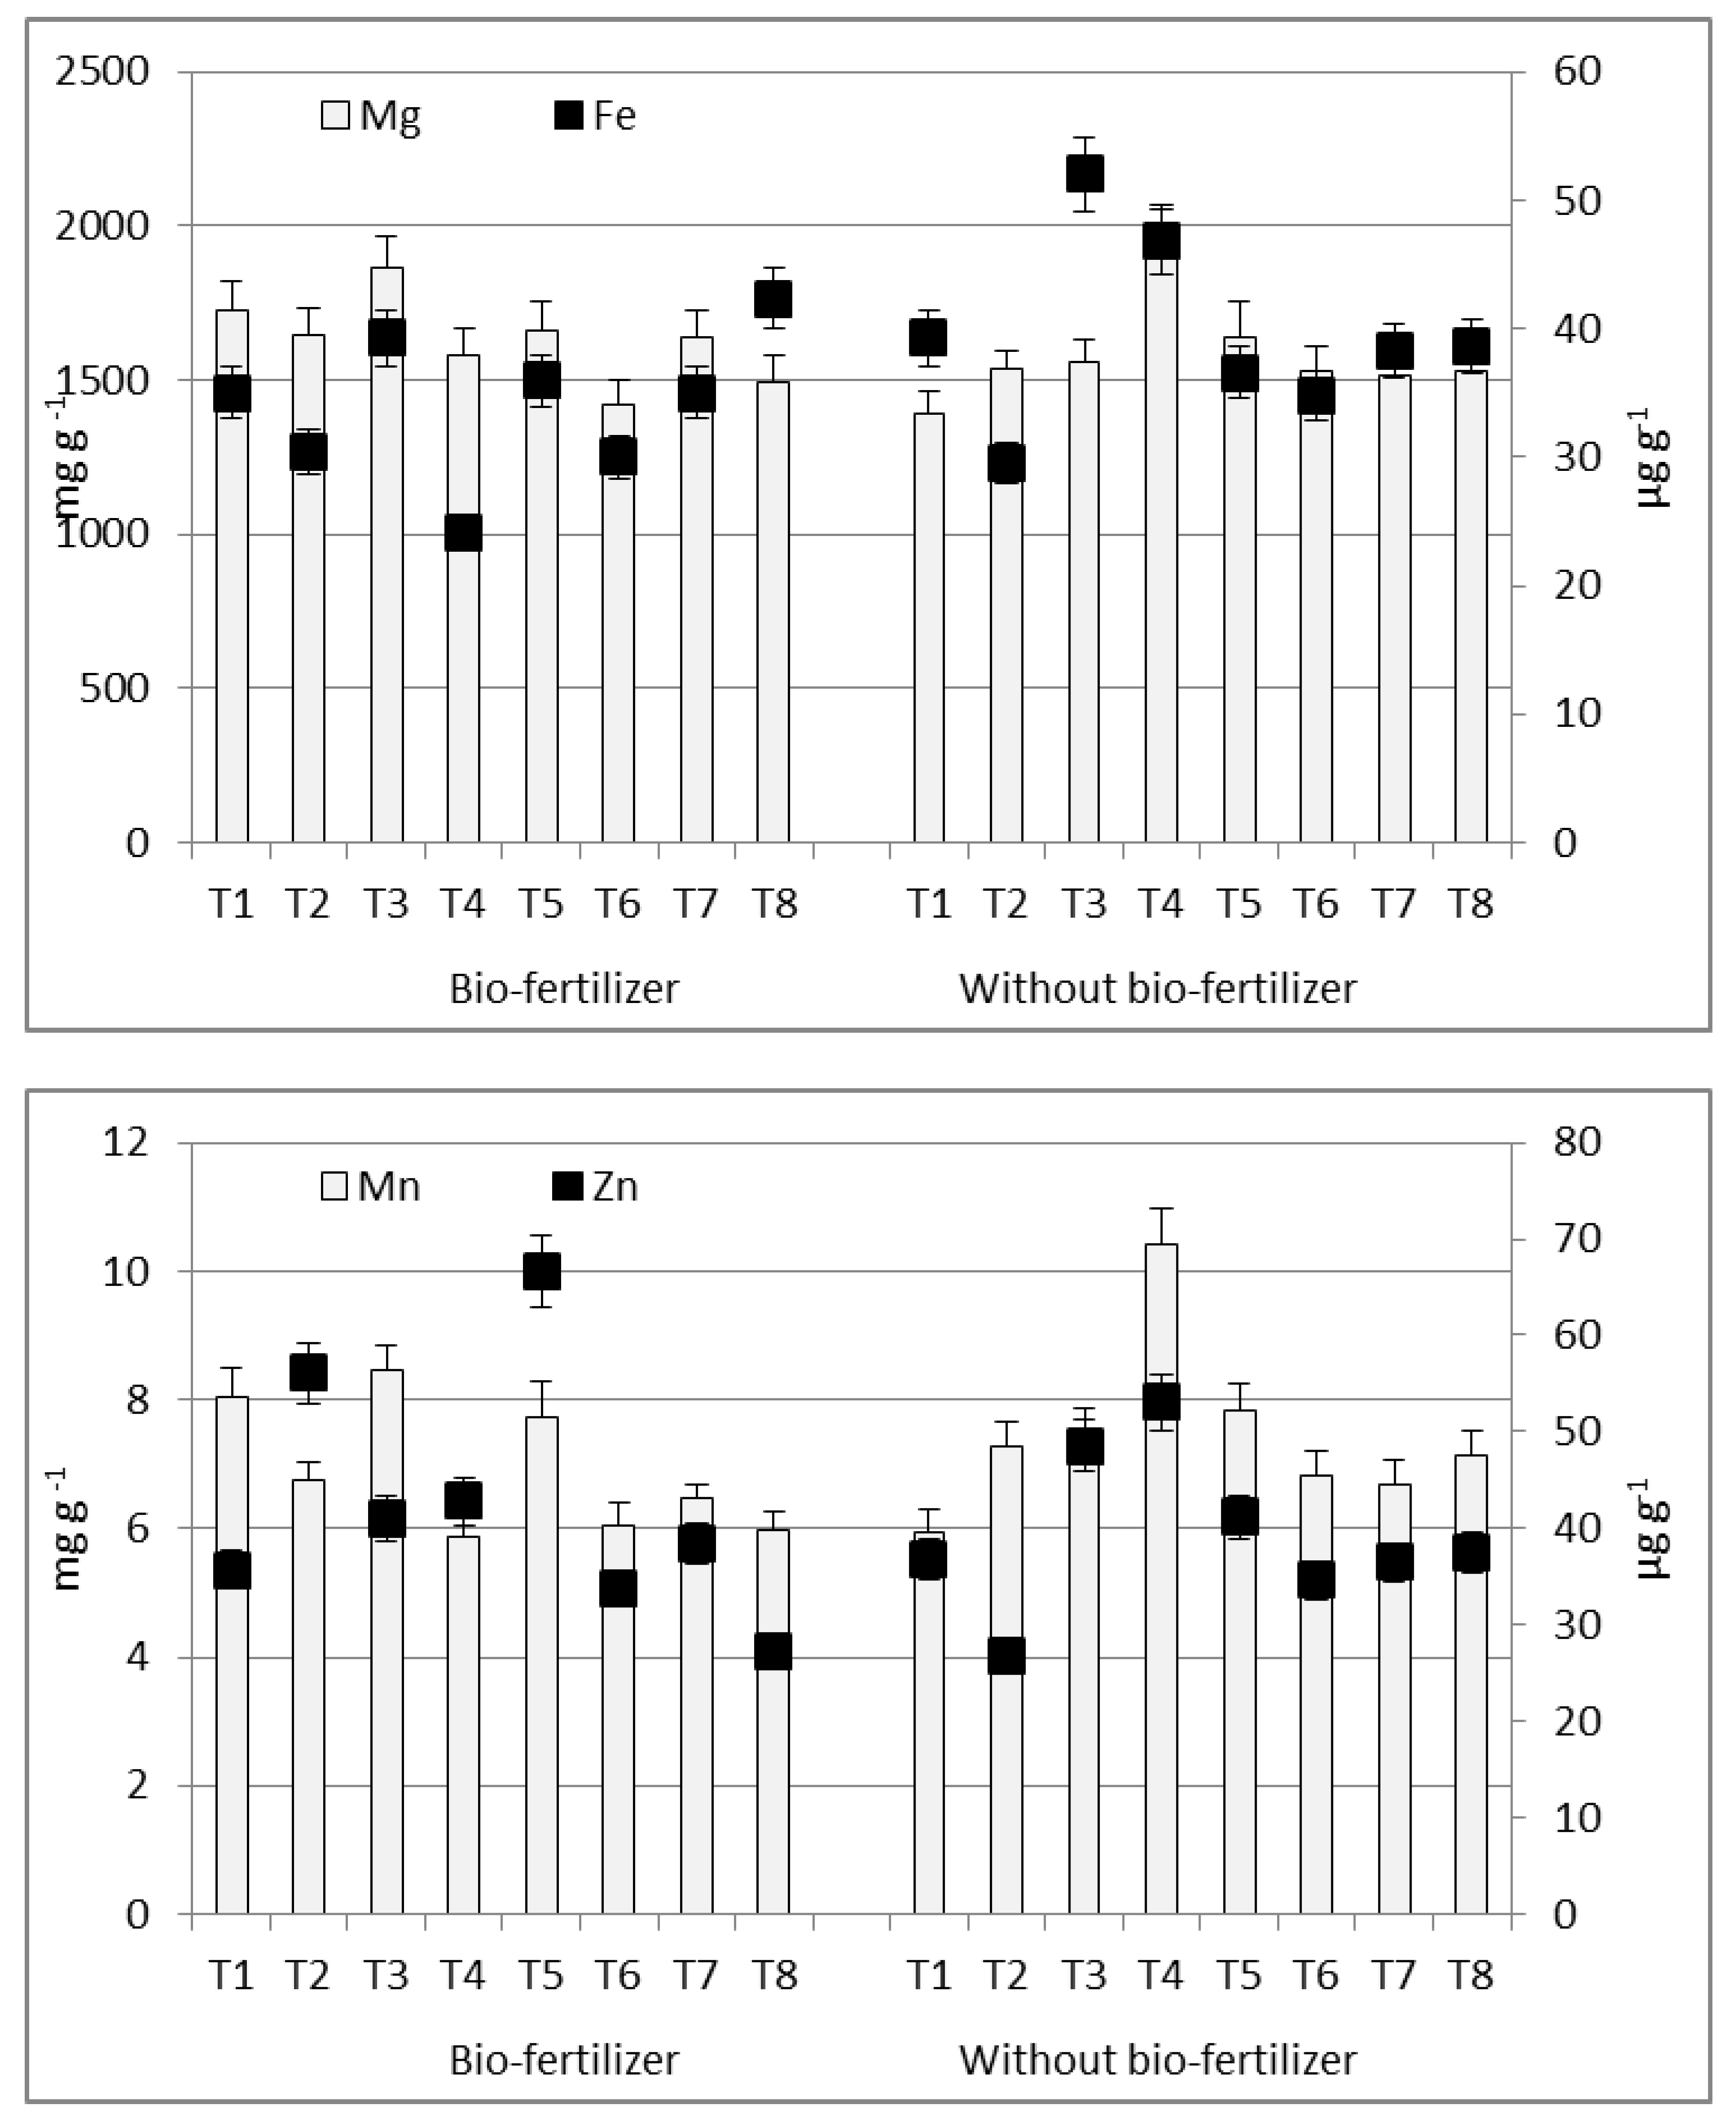
3.2. Variability in Chemical Composition of Sweet Maize Kernel

All three sources of variations: CC, BF, Y, and their interactions induced significant variations in concentration of all examined kernel constituents (Table 4). The exceptions were present only for fructose concentration (BF × CC interaction), as well as Zn concentration (BF and Y × BF interaction). CC influence on variability in concentration of examined kernel constituents was complex. Accordingly, the highest concentration of glucose and phenolics was present in T8 treatment; sucrose, fructose and GSH in T7 treatment; YP, Mg, and Mn concentration in T4, Pphy in T5 treatment; vitamin C in T6; Fe in T1 and Zn in T3 treatment. The BF was reflected on slightly higher concentration of glucose and fructose, vitamin C, Mg, and Zn in sweet maize kernel. The differences among seasons indicated slight decrease in sugars concentration and increase in concentration of GSH and vitamin C in 2018. However, concentration of phenolics, YP, and other elements (Mg, Fe, Mn and Zn) was greater in 2016 even several fold than it was in 2017.
Considering the effect of CC and BF present as a three year average (Figure 1), it is noticeable that Pphy had the lowest value in T7 + BF combination and T2 + without BF, with 2.73 mg g−1 and 2.75 mg g−1, respectively. The highest concentration of phenolics in sweet maize kernels was noticed in T8 + BF variant, while the lowest values were achieved in T4 treatment in both variants, with and without BF (621 and 340 µg g−1, respectively). The highest GSH concentration in sweet maize kernel was observed in T7 + BF combination, while the highest vitamin C and YP concentration in kernel was in T5 + BF combination (30.51 mg 100 g−1 and 13.39 µg g−1, respectively) (Figure 2).
The differences among CC treatments in essential elements accumulation in sweet maize kernel (Figure 3) were present mainly in BF variant, with the highest values of Mg and Mn obtained in T3 + BF treatment (1863.6µg g−1 and 8.44µg g−1, respectively). Though, the highest Fe concentration was noticed in T8 + BF (42.3 µg g−1) and the highest Zn concentration was in T5 + BF treatment (66.6 µg g−1). When variant without BF application was taken into consideration, the highest concentration of Mg, Mn and Zn in maize kernel (1961.6µg g−1, 10.4µg g−1 and 53.0 µg g−1, respectively) was obtained in T4, while the highest Fe concentration was noticed in T3 (52.1µg g−1).

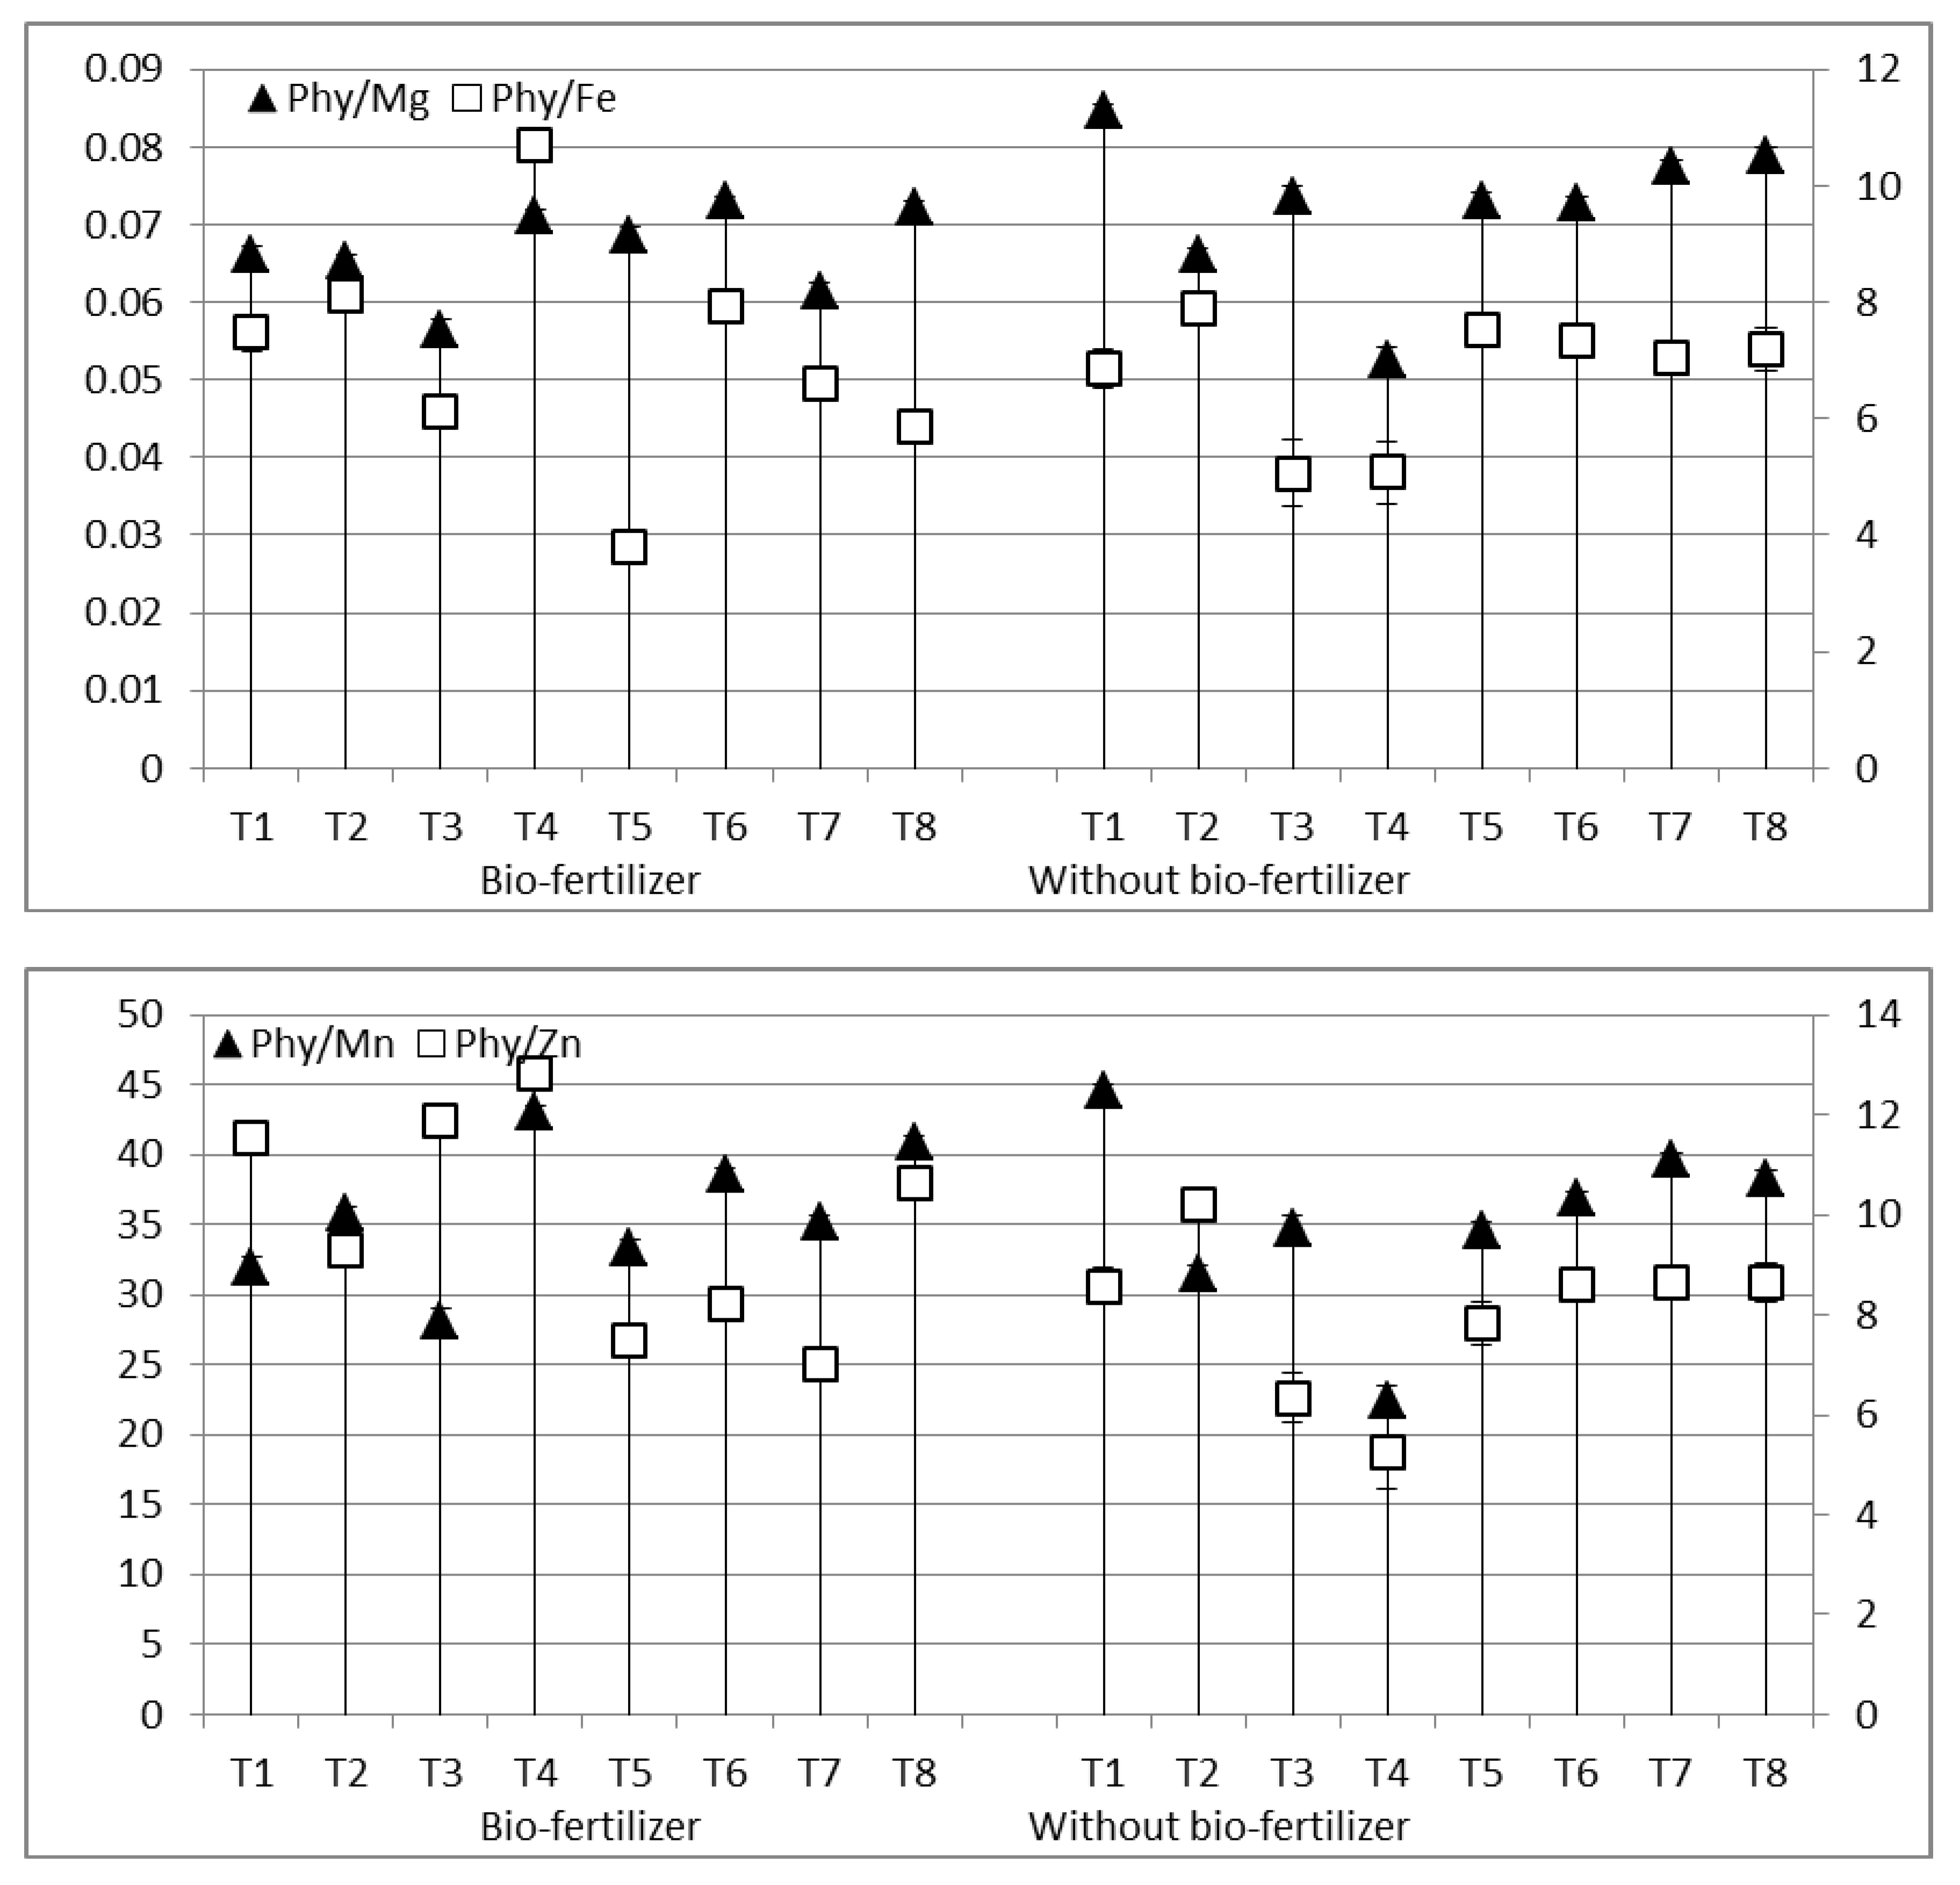
3.3. Potential Bio-Availability of Essential Elements

CC and BF affected also a molar ratio between phytic acid and essential elements. Three-year average shown that in BF variant, the lowest values of Phy/Mg and Phy/Mn in maize kernels were in T3 + BF (0.056 and 28.11, respectively), while the lowest Phy/Fe ratio was in T5 + BF treatment (3.79) and Phy/Zn ratio in T7 + BF (7.02). Compared to BF, in variant without BF the lowest Phy/Fe ratio was in T3 (5.06), while other ratios, Phy/Mg, Phy/Mn and Phy/Zn had lower values in T4 treatment (0.053, 5.07, 22.04 and 5.23, respectively) (Figure 4).
PCA revealed that Mg, Mn, and Zn contributed positive, while vitamin C negative to PC1, which explained 28.08% of the total variability (Figure 5). The second axis (PC2), which explained 18.91% of the variability, was defined with GSH, fructose and Fe. The third axis (PC3), explained with 16.32% of variability, and was defined by Pphy and sucrose and the fourth axis (PC4) was defined positive by YP and negative by phenolics and glucose and was explained with 11.56% of the total variability.
According to the results presented on Figure 5, T1 was tied to the highest variability of Pphy and phenolics, in both variants, with and without BF, while T1 + BF induced variability of sucrose, but to a lesser extent. T2 + BF combination induced slight variation of fructose, vitamin C, Mg, and Mn. T3 also expressed an impact on Pphy variability and in lesser extent impact on phenolics and sucrose, while T3 + BF combination expressed influence on Mg, Mn, and Zn variability. T4, in combination with and without BF, was presumable involved to increased variability of YP, Mg, Mn, and Zn and in lesser degree to variability of fructose and vitamin C. T5 was mainly responsible for variations in concentration of Pphy and phenolics and in lesser extent of sucrose, while T5 + BF was involved in greater variations of YP and Fe concentration. T6, as well asT6 + BF expressed a slight influence on variations of YP, vitamin C, Mg, Fe, and Mn. T7, in the combination with and without BF, as well as T8 + BF, induced great variability in concentration of glucose, fructose, sucrose, GSH, and vitamin C.

4. Discussion

4.1. Cover Crops Biomass and Sweet Maize Kernel Yield

The plant species used as CC should have a potential to produce great aboveground biomass, together with balanced C/N ratio, without rapid decomposition, protecting soil surface, and main crops in early growth phases [28]. The experimental results indicated that CC biomass was very significantly prone to meteorological conditions present during the late autumn and winter. Earlier CC growth and biomass accumulation was supported by moderate precipitation during November and April in 2016/17, as well as higher temperature present during February–March in 2015/16 and 2016/17. By contrast with the claim that mixtures are not advantageous in regard to monocrops in biomass production and water-use efficiency [29,30], in this research, field pea + winter oats (T6) achieved the highest value of produced biomass in a three-year average [31,32]. Furthermore, in 2017/2018, as relative mild season, field pea + winter oats (T6) and common vetch + winter oats (T5) produced the greatest biomass, too.
For the main crop, a higher precipitation amount in 2018 facilitated the highest kernel yield, while the lowest yield was achieved in 2016, with unequally distributed precipitations, (only 3 mm during July-beginning of the grain filling period), thus severely affecting kernel filling and yield. Considering CC impact, advantage was given to legume covers, as well as CC mixtures that include legumes, due to the fact that cereal covers can immobilize greater N amounts and have prolonged effect on soil moisture, opposite to legumes that increase N availability and dry matter accumulation in maize crop [4,33]. High CC biomass, i.e., soil coverage enables better weed suppression, prevents soil N from leaching, therefore increasing N accumulation in biomass [4,28,30], what could be the main reason for greater kernel yield of sweet maize in treatment with fodder kale (T4). Particular importance for sweet maize kernel yield plays BF, which contain cellulolytic and proteolytic bacteria, thereby increasing availability and nutrient profile of the main crops, as well as stress tolerance [12], thus resulting in the greater average kernel yield, especially in the treatment with organic mulch (T7 + BF). Even more, a synergic action of applied sustainable practices, such as BF + T5 (common vetch + winter oats) in 2018, resulted in the highest sweet maize kernel yield (9051.1kg ha−1).

4.2. Variability in Chemical Composition of Sweet Maize Kernel

Food security is not addressed only to the achievement of high crop yields in conditions of variable meteorological factors (climate change), but also to the production of nutrient dense crops which will contribute to the reduction of globally present malnutrition in humans and animals [2]. Irrespective to a high glycaemic index, [15] as well as an unique nutritional profile of sweet maize kernels, there is a lack of the information how diverse cropping systems and techniques influence chemical composition and potential health benefits of sweet maize kernel.
Very significant variability of examined constituents of sweet maize kernel (sugars, antioxidants, and essential elements) under the influence of CC, BF, Y, and their interaction was observable. In regard, that higher sugars concentration in sweet maize kernel follow optimal precipitation amount [34], in this research the higher concentration of all three sugars was obtained in 2016 and 2017, as years with the a low to moderate precipitation quantity. However, low a precipitation level in July 2016, not only seriously affected the kernel yield, but also kernel chemical composition, particularly from the viewpoint of increased concentration of antioxidants (phenolics and YP) which are highly prone to variable conditions [35,36]. Concentration of essential elements: Mg, Fe, Mn, and Zn were also increased, together with decrease in Pphy and GSH concentration [37,38]. Organic mulch (T7) and fallow (T8) contributed to the increased concentration of sugars, phenolics, and GSH in the sweet maize kernel, particularly in the combination with BF application, confirming that bio-fertilizers are able to improve crop quality [12]. Fodder kale (T4) expressed the greatest impact on YP concentration, while winter oats and its combination with field pea (T3 and T6) increased vitamin C concentration. Rosa [10] has argued that winter turnip rape (Brassicaceae) and white clover (Fabaceae) positively affected the quality of sweet maize kernels by increase of vitamin C concentration and reduction of P concentration, which was partially supported by results achieved in this experiment. Furthermore, increased kernel yield and concentration of glucose, fructose, vitamin C, Mg, Fe, and Zn in the variant with BF proves its importance as sustainable practice [12,13,14]. BF could play a pivotal role, when reduction of phytic acid was considered [14], which is supported in this research, too. Lower average concentration of antioxidants: phenolics, GSH, and YP in sweet maize kernels could be explained by BF ability to increase stress tolerance of plants [12].
The great differences in ability to accumulate essential minerals in sweet maize kernel was brought by CC + BF combination, where the highest Zn concentration was obtained in the winter oats + common vetch (T5) + BF combination. In contrast, fodder kale (T4) + BF expressed the greatest impact on Mg and Mn concentration and winter oats (T3) without BF application on Fe increase in maize kernels. The results support a statement that BF can significantly affect Fe, Mn, and Zn concentration in plant tissues, but its impact mainly depends on environment [8,37].

4.3. Potential Bio-Availability of Essential Elements

Since absorption and accumulation of essential elements in maize kernel depend on various agro-ecological conditions [37,38], while further bio-availability from the kernel during digestion depends on its chemical composition [9], it is important to evaluate relations between essential elements and factors that contribute or restrain their bio-availability. This presents novelty of the research, promoting not just enhanced availability and accumulation of essential elements in sweet maize kernel, but further bio-availability from digested kernels, established by sustainable cropping system.
It was shown by PCA that high variability in concentration of Pphy and phenolics, as the main factors that restrain availability of essential elements [9] was present in treatments with common vetch (T1 and T1 + BF), winter oats (T3), as well as their mixture (T5). Variation of Mg, Mn, and Zn in sweet maize kernels was observed in treatments with fodder kale (T4), and winter oats (T3) + BF, while variation of Fe concentration was mainly related to common vetch + winter oats + BF. It was shown that oats, mostly in combination with rye, expressed a positive effect on rhizosphere microbial activity, increasing mycorrhizal colonization of sweet maize roots, thus increasing mineral nutrients uptake [9], what is in this research additionally supported by BF application.
However, organic mulch (T7), with and without BF application, as well as control (T8) + BF expressed the highest impact on concentration of examined sugars, as well as factors that enhance bio-availability of mineral elements: vitamin C and GSH in sweet maize kernel. Previous research has shown that mulches (foils) expressed positive impact on total sugar accumulation, while the highest concentration of vitamin C was in kernel of sweet maize that was grown uncovered [39]. It was also established that some cropping practices, like fertilization, and herbicide application [40] could affect carotenoids level in sweet maize kernel, but data about CC influence on carotenoids accumulation in sweet maize kernel are still unknown. In this research, concentration of YP, as another promoter, varied mainly under the influence of fodder kale (T4) and common vetch + winter oats + BF (T5 + BF), indicating that larger amount of organic residues (present after incorporation), resulted in increased amount of available N in soil [7,11], thus affecting positively the yield YP accumulation in kernels of sweet maize.
The factor that gives more precise information about potential bio-availability of essential elements is their molar ratio with phytic acid. Since the lower values of ratio are considered as a desirable trait [41,42,43], it could be assumed that CC + BF combinatiomn is more important for reduction of this ratio than the impact of CC or BF sole. Accordingly, the lowest value of Phy/Mg, Phy/Mn and Phy/Zn ratio was observed in T4 treatment (fodder kale), while the lowest value of Phy/Fe was in T5 (common vetch + winter oats) + BF combination. Higher CC biomass of the same treatments, indicated accumulation of greater P amounts, which in the combination with slower mineralization could reduce P availability to the main crop and thus the synthesis of phytic acid. It was reported that crucifer CC are high in mycorrhizal microorganisms that scavenge P from a greater soil volume, while, legume and cereal CC has predominantly phytate-mineralizing bacteria, as well as P-solubilising bacteria in their rhizosphere, thus increasing P availability to the main crop [42]. Phenolics could also reduce the bio-availability of essential elements [17], so CC with reducing potential of phenolics accumulation in maize kernel, such as fodder kale (T4) and field pea + winter oats (T5) are advantageous. In general, higher values of ratio between phytic acid and essential elements were noticed in BF variant, contributing to the increased availability of essential macro- and micro-elements from poorly accessible forms [13,14,44]. It is important to emphasize that enhanced absorption of essential elements from the maize kernel during digestion could be enhanced by the increased YP concentration [18,19], what was obtained in variants without BF.

5. Conclusions

From the viewpoint of food security, sustainable practices, such as cover crops and bio-fertilizers application, are able to increase not just soil fertility and crop yield but also crop nutritional quality. Proper CC selection for particular agro-ecological conditions, including climate and facilitates production of nutrient-dense food, which represents the novelty of this study.
It was proven that stressful conditions of the season decreased kernel yield, Pphy, and GSH concentration, but in parallel increased the nutritional quality of sweet maize kernel through increased concentration of sugars, phenolics, YP, and essential elements (Mg, Fe, Mn, and Zn). The importance of BF application was accentuated through enhancement of the kernel yield, concentration of sugars, vitamin C, Mg, Fe, and Zn, with the reduction in Pphy concentration, thus positively affecting further potential bio-availability of essential elements.
CC mixtures field pea + winter oats, and common vetch + winter oats, as well as fodder kale are advantageous, providing greater biomass, as well as increase the sweet maize kernel yield and concentration of sugars and antioxidants, together with reduction in Pphy concentration. Even more, BF in combination with fodder kale enhanced Mg and Mn concentrations in kernel. Winter oats + common vetch + BF increased Zn concentration, while winter oats + BF enhanced Fe concentration. The same CC treatments, expressed the highest impact on variability in concentration of anti-nutrients: Pphy and phenolcs, as well as promoter-YP, thus affecting bio-availability of essential elements. Benefits of organic mulch are reflected through increased concentration of sugars and GSH. The three year study pointed that in semi-arid climate under rain-fed conditions, fodder kale and winter oats + common vetch are suitable CC to enhance the sweet maize productivity and in particular kernel quality, serving as an important part of sustainable cropping system, facilitating food security.

Author Contributions

Conceptualization: V.D., Ž.D., M.S. (Milena Simić); Methodology: V.D., Ž.D., B.J., M.B., M.S. (Milena Simić); Statistical analysis: V.D., Ž.D., M.B.; Validation: V.D., B.J., M.S. (Milovan Stoiljkovic), M.S.D.; Chemical Analysis: V.D., M.B., M.S. (Milovan Stoiljkovic), M.S.D.; Investigation: V.D., Ž.D., B.J., M.B., M.S. (Milena Simić); Writing—Original Draft Preparation: V.D., Ž.D., B.J.; Visualization: V.D., Ž.D., M.S. (Milena Simić); Resources: Ž.D., B.J., M.S. (Milovan Stoiljkovic), M.S.D., M.S. (Milena Simić); Supervision: Ž.D., M.S. (Milena Simić); Project Administration: Ž.D., M.S. (Milena Simić); Data Curation: M.B.; Writing—Review and Editing: M.B., M.S. (Milena Simić); Funding Acquisition: M.S. (Milena Simić); Vesna—V.D.; Željko Dolijanović—Ž.D.; Biljana Janosevic—B.J.; Milan Brankov—M.B.; Milovan Stoiljkovic—M.S.; Margarita S. Dodevska—M.S.D.; Milena Simić—M.S. All authors have read and agreed to the published version of the manuscript.

Funding

This study was funded by the Ministry of Education, Science and Technological Development, the Republic of Serbia (grant No. TR31037) and the Maize Research Institute “Zemun Polje” Belgrade-Zemun, Serbia.

Institutional Review Board Statement

Not applicable.

Informed Consent Statement

Not applicable.

Acknowledgments

The authors thank Biljana Noro, Branka Radovanović, Milan Kostić, Miroslav Maksimović and students of the Faculty of Agriculture, University of Belgrade for their technical support in experiment.

Conflicts of Interest

The authors declare no conflict of interest.

References

  1. Garnett, T. Food sustainability: Problems, perspectives and solutions. Proc. Nutr. Soc. 2013, 72, 29–39. [Google Scholar] [CrossRef] [Green Version]
  2. Gillespie, S.; Bold, M.V.D. Agriculture, Food Systems, and Nutrition: Meeting the Challenge. Glob. Chall. 2017, 1, 1600002. [Google Scholar] [CrossRef]
  3. Restovich, S.B.; Andriulo, A.E.; Portela, S.I. Introduction of cover crops in a maize–soybean rotation of the Humid Pampas: Effect on nitrogen and water dynamics. Field Crop. Res. 2012, 128, 62–70. [Google Scholar] [CrossRef]
  4. Reberg-Horton, S.C.; Grossman, J.M.; Kornecki, T.S.; Meijer, A.D.; Price, A.J.; Place, G.T.; Webster, T.M. Utilizing cover crop mulches to reduce tillage in organic systems in the southeastern USA. Renew. Agric. Food Syst. 2011, 27, 41–48. [Google Scholar] [CrossRef] [Green Version]
  5. Baijukya, F.; de Ridder, N.; Giller, K. Nitrogen Release from Decomposing Residues of Leguminous Cover Crops and their Effect on Maize Yield on Depleted Soils of Bukoba District, Tanzania. Plant Soil 2006, 279, 77–93. [Google Scholar] [CrossRef]
  6. Deguchi, S.; Uozumi, S.; Tawaraya, K.; Kawamoto, H.; Tanaka, O. Living Mulch with White Clover Improves Phosphorus Nutrition of Maize of Early Growth Stage. Soil Sci. Plant Nutr. 2005, 51, 573–576. [Google Scholar] [CrossRef] [Green Version]
  7. Salmerón, M.; Isla, R.; Cavero, J. Effect of winter cover crop species and planting methods on maize yield and N availability under irrigated Mediterranean conditions. Field Crop. Res. 2011, 123, 89–99. [Google Scholar] [CrossRef] [Green Version]
  8. Vessey, J.K. Plant growth promoting rhizobacteria as biofertilizers. Plant Soil 2003, 255, 571–586. [Google Scholar] [CrossRef]
  9. Kabir, Z.; Koide, R.T. Effect of autumn and winter mycorrhizal cover crops on soil properties, nutrient uptake and yield of sweet corn in Pennsylvania, USA. Plant Soil 2002, 238, 205–215. [Google Scholar] [CrossRef]
  10. Rosa, R. Quality of sweet corn yield depending on winter catch crops and weed control method. Hortorum Cultus 2015, 14, 59–74. [Google Scholar]
  11. Janoševic, B.; Dolijanovic, Z.; Dragicevic, V.; Simic, M.; Dodevska, M.; Djordjevic, S.; Moravcevic, D.; Miodragovic, R. Cover crop effects on the fate of N in sweet maize (Zea mays L. saccharata Sturt.) production in a semiarid region. Int. J. Plant. Prod. 2017, 11, 285–294. [Google Scholar]
  12. Bhardwaj, D.; Ansari, M.W.; Sahoo, R.K.; Tuteja, N. Biofertilizers function as key player in sustainable agriculture by improving soil fertility, plant tolerance and crop productivity. Microb. Cell Factories 2014, 13, 66. [Google Scholar] [CrossRef] [PubMed] [Green Version]
  13. Maris, S.; Capra, F.; Ardenti, F.; Chiodini, M.; Boselli, R.; Taskin, E.; Puglisi, E.; Bertora, C.; Poggianella, L.; Amaducci, S.; et al. Reducing N Fertilization without Yield Penalties in Maize with a Commercially Available Seed Dressing. Agronomy 2021, 11, 407. [Google Scholar] [CrossRef]
  14. Hussain, A.; Zahir, Z.A.; Ditta, A.; Tahir, M.U.; Ahmad, M.; Mumtaz, M.Z.; Hayat, K.; Hussain, S. Production and Implication of Bio-Activated Organic Fertilizer Enriched with Zinc-Solubilizing Bacteria to Boost up Maize (Zea mays L.) Production and Biofortification under Two Cropping Seasons. Agronomy 2019, 10, 39. [Google Scholar] [CrossRef] [Green Version]
  15. Swapna, G.; Jadesha, G.; Mahadevu, P. Assessment of Correlation and Path Coefficient Analysis for Yield and it’s Attributing Traits in Rice (Oryza sativa L.) Genotypes. Int. J. Curr. Microbiol. Appl. Sci. 2020, 9, 3859–3865. [Google Scholar] [CrossRef]
  16. Khanduri, A.; Prasanna, B.M.; Firoz, H.; Lakhera, P.C. Genetic analyses and association studies of yield components and kernel sugar concentration in sweet corn. Indian J. Genet. Plant. Breed. 2010, 70, 257–263. [Google Scholar]
  17. Acosta-Estrada, B.A.; Gutiérrez-Uribe, J.A.; Serna-Saldivar, S.O. Chapter 14—Minor constituents and phytochemicals of the kernel. Corn Chem. Technol. 2019, 369–403. [Google Scholar] [CrossRef]
  18. Platel, K.; Srinivasan, K. Bioavailability of Micronutrients from Plant Foods: An Update. Crit. Rev. Food Sci. Nutr. 2015, 56, 1608–1619. [Google Scholar] [CrossRef]
  19. Zhang, Y.Y.; Stockmann, R.; Ng, K.; Ajlouni, S. Opportunities for plant-derived enhancers for iron, zinc, and calcium bioavailability: A review. Compr. Rev. Food Sci. Food Saf. 2021, 20, 652–685. [Google Scholar] [CrossRef]
  20. Watanabe, F.S.; Olsen, S.R. Test of an ascorbic acid method for determining phosphorus in water and NaHCO3 extracts from the soil. Soil Sci. Soc. Am. J. 1965, 29, 677–678. [Google Scholar] [CrossRef]
  21. Mehlich, A. Mehlich 3 soil test extractant: A modification of Mehlich 2 extractant. Commun. Soil Sci. Plant Anal. 1984, 15, 1409–1416. [Google Scholar] [CrossRef]
  22. Dragičević, V.D.; Sredojević, S.D.; Perić, V.A.; Nišavić, A.R.; Srebrić, M.B. Validation study of a rapid colorimetric method for the determination of phytic acid and inorganic phosphorus from seeds. Acta Period. Technol. 2011, 11–21. [Google Scholar] [CrossRef]
  23. Sari-Gorla, M.; Ferrario, S.; Rossini, L.; Frova, C.; Villa, M. Developmental expression of glutathione-S-transferase in maize and its possible connection with herbicide tolerance. Euphytica 1993, 67, 221–230. [Google Scholar] [CrossRef]
  24. Simić, A.; Sredojevic, S.; Todorovic, M.; Đukanović, L.; Radenović, Č. Studies on the relationship between the content of total phenolics in exudates and germination ability of maize seed during accelerated aging. Seed Sci. Technol. 2004, 32, 213–218. [Google Scholar] [CrossRef]
  25. Vancetovic, J.; Zilic, S.; Bozinovic, S.; Ignjatovic-Micic, D. Simulating of Top-Cross system for enhancement of antioxidants in maize grain. Span. J. Agric. Res. 2014, 12, 467. [Google Scholar] [CrossRef] [Green Version]
  26. Fuchs, G.; Wretling, S. Determination of fructose, glucose and sucrose in foods (Bestämningavfruktos, glukosochsackarosil-ivsmedel). Our Food 1979, 31, 435–439. [Google Scholar]
  27. Rikovski, I.; Džamić, M.; Rajković, M. Practicum of Analytical Chemistry; Construction Book; Faculty of Agriculture: Belgrade, Serbia, 1989. (In Serbian) [Google Scholar]
  28. Wallace, J.M.; Williams, A.; Liebert, J.A.; Ackroyd, V.J.; Vann, R.A.; Curran, W.S.; Keene, C.L.; VanGessel, M.J.; Ryan, M.R.; Mirsky, S.B. Cover Crop-Based, Organic Rotational No-Till Corn and Soybean Production Systems in the Mid-Atlantic United States. Agriculture 2017, 7, 34. [Google Scholar] [CrossRef] [Green Version]
  29. Nielsen, D.C.; Lyon, D.J.; Hergert, G.W.; Higgins, R.K.; Holman, J.D. Cover Crop Biomass Production and Water Use in the Central Great Plains. Agron. J. 2015, 107, 2047–2058. [Google Scholar] [CrossRef]
  30. Finney, D.M.; White, C.M.; Kaye, J.P. Biomass Production and Carbon/Nitrogen Ratio Influence Ecosystem Services from Cover Crop Mixtures. Agron. J. 2016, 108, 39–52. [Google Scholar] [CrossRef] [Green Version]
  31. Boselli, R.; Fiorini, A.; Santelli, S.; Ardenti, F.; Capra, F.; Maris, S.C.; Tabaglio, V. Cover crops during transition to no-till maintain yield and enhance soil fertility in intensive agro-ecosystems. Field Crop. Res. 2020, 255, 107871. [Google Scholar] [CrossRef]
  32. Appelgate, S.R.; Lenssen, A.W.; Wiedenhoeft, M.H.; Kaspar, T.C. Cover Crop Options and Mixes for Upper Midwest Corn-Soybean Systems. Agron. J. 2017, 109, 968–984. [Google Scholar] [CrossRef] [Green Version]
  33. Kramberger, B.; Gselman, A.; Kristl, J.; Lešnik, M.; Šuštar, V.; Muršec, M.; Podvršnik, M. Winter cover crop: The effects of grass–clover mixture proportion and biomass management on maize and the apparent residual N in the soil. Eur. J. Agron. 2014, 55, 63–71. [Google Scholar] [CrossRef]
  34. Kara, B.; Atar, B.; Gul, H. Effects of different sowing dates on protein, sugar and dry matter of sweet corn. Res. Crops 2012, 13, 493–497. [Google Scholar]
  35. Păcurar, L.; Apahidean, M.; Haş, V. Morpho-Productive and Chemical Composition of Local and Foreign Sweet Corn Hybrids Grown in the Conditions of Transylvania Plateau. Bull. Univ. Agric. Sci. Vet. Med. Cluj Napoca Hortic. 2017, 74, 168. [Google Scholar] [CrossRef] [Green Version]
  36. Dragicevic, V.; Oljaca, S.; Simic, M.; Dolijanovic, Z.; Kresovic, B.; Brankov, M. Content of some antioxidants in intercropped maize and soybean grain. J. Agric. Sci. 2017, 62, 31–40. [Google Scholar] [CrossRef] [Green Version]
  37. Dragicevic, V.; Oljaca, S.; Stojiljkovic, M.; Simic, M.; Dolijanovic, Z.; Kravic, N. Effect of the maize–soybean intercropping system on the potential bioavailability of magnesium, iron and zinc. Crop. Pasture Sci. 2015, 66, 1118. [Google Scholar] [CrossRef]
  38. Jin, J.; Wang, G.; Liu, X.; Pan, X.; Herbert, S.J.; Tang, C. Interaction Between Phosphorus Nutrition and Drought on Grain Yield, and Assimilation of Phosphorus and Nitrogen in Two Soybean Cultivars Differing in Protein Concentration in Grains. J. Plant Nutr. 2006, 29, 1433–1449. [Google Scholar] [CrossRef]
  39. Adamczewska-Sowińska, K.; Sowiński, J. Reaction of Sweet Maize to the Use of Polyethylene Film and Polypropylene Non-Woven Fabric in the Initial Growth Phase. Agronomy 2020, 10, 141. [Google Scholar] [CrossRef] [Green Version]
  40. Mesarović, J.; Srdić, J.; Mladenović-Drinić, S.; Dragičević, V.; Simić, M.; Brankov, M.; Milojković-Opsenica, D. Evaluation of the nutritional profile of sweet maize after herbicide and foliar fertilizer application. J. Cereal Sci. 2019, 87, 132–137. [Google Scholar] [CrossRef] [Green Version]
  41. Cakmak, I. Enrichment of cereal grains with zinc: Agronomic or genetic biofortification? Plant Soil 2008, 302, 1–17. [Google Scholar] [CrossRef]
  42. Šimić, D.; Drinić, S.M.; Zdunić, Z.; Jambrović, A.; Ledenčan, T.; Brkić, J.; Brkić, A.; Brkić, I. Quantitative Trait Loci for Biofortification Traits in Maize Grain. J. Hered. 2011, 103, 47–54. [Google Scholar] [CrossRef] [PubMed] [Green Version]
  43. Dragicevic, V.; Mladenovic-Drinic, S.; Stojiljkovic, M.; Filipovic, M.; Nikolic, B.; Babic, V.; Kravic, N. Maize inbreds from different heterotic groups as favorable sources for increased potential bioavailability of magnesium, iron, manganese and zinc. Chil. J. Agric. Res. 2016, 76, 213–218. [Google Scholar] [CrossRef] [Green Version]
  44. Hallama, M.; Pekrun, C.; Lambers, H.; Kandeler, E. Hidden miners—The roles of cover crops and soil microorganisms in phosphorus cycling through agroecosystems. Plant Soil 2019, 434, 7–45. [Google Scholar] [CrossRef] [Green Version]
Figure 1. The effect of cover crops (T1-T8) and bio-fertilizer on concentration of phytic phosphorus (Pphy) and phenolics (Phen) in sweet maize kernel (2016–2018 average; bars represent SD values).
Agronomy 11 00981 g001
Figure 2. The effect of cover crops (T1-T8) and bio-fertilizer on concentration of glutathione (GSH), yellow pigment (YP), (Phy) and vitamin C (VitC) in sweet maize kernel (2016-2018 average; bars represent SD values).
Agronomy 11 00981 g002
Figure 3. The effect of cover crops (T1-T8) and bio-fertilizer on concentration of essential elements, Mg, Fe, Mn and Zn in sweet maize kernel (2016–2018 average; bars represent SD values).
Agronomy 11 00981 g003
Figure 4. The effect of cover crops (T1-T8) and bio-fertilizer on molar ratios between phytic acid (Phy)/Mg, Phy/Fe, Phy/Mn and Phy/Zn (2016–2018 average; bars represent SD values).
Agronomy 11 00981 g004
Figure 5. Principal component analysis for sucrose (Sucr), glucose (Glu), fructose (Fruc), vitamin C (vitC), yellow pigment (YP), glutathione (GSH), phytic (Phy), phenolics (Phen), Mg, Fe, Mn, and Zn contents in sweet maize kernel, influenced by different cover crops (T1–common vetch; T2–field pea; T3–winter oats; T4–fodder kale; T5–common vetch + winter oats; T6–field pea + winter oats; T7–organic mulch; T8–fallow) and bio-fertilizer (B). Black spots present kernel components, while white spots present applied CC treatments solely (T), as well as in combination with bio-fertilizer (T-B).
Agronomy 11 00981 g005
Table 1. Mean temperature (°C) and precipitation sum (mm) at Zemun Polje during the vegetative seasons of 2015/16, 2016/17 and 2017/18 in comparison to the 1991–2019 average.
Average Temperature (°C)Precipitation Sum (mm)
Months2015/162016/172017/181991–20192015/162016/172017/181991–2019
November9.27.47.98.363.458.842.351.1
December4.30.24.53.03.80.617.455.6
January2.5−1.85.02.046.36.831.947.6
February9.05.31.93.838.518.141.743.2
March9.1116.48.2102.621.332.448.8
April15.512.41813.653.947.124.652.5
Aver./Sum8.35.77.36.5308.5152.7190.3298.8
May17.518.621.718.171.349.239.072.8
June22.524.422.721.9152.239150.192.0
July24.425.523.623.83.026.761.967.9
August22.325.825.723.860.823.744.055.0
Aver./Sum21.723.623.420.2287.3138.6295.0340.2
Table 2. Analysis of variance for the effect of cover crop (CC), year (Y), and their interaction on the variation of cover crops biomass during three year period (kg ha−1).
Treatment2015/162016/172017/18Aver.
T121,400 d45,600 l18,310 b28,437 b
T238,440 hi38,240 h20,760 cd32,480 c
T316,610 a29,240 e19,675 c21,842 a
T443,515 k54,040 n31,175 f42,910 e
T539,500 i44,500 kl41,150 j41,717 d
T636,100 g57,150 o49,860 m47,703 f
Aver.32,594 b44,795 c30,155 a
Source of variationCCYCC × Y
df.5210
Anova (p values) 0.069
df–degrees of freedom; Different letters indicate significant differences according to the least significant difference (LSD)-test at p < 0.05 (for average, letters in row indicate differences between Years and letters in the last column indicate differences between Treatments); T1–common vetch; T2–field pea; T3–winter oats; T4–fodder kale; T5–common vetch + winter oats; T6–field pea + winter oats.
Table 3. Analysis of variance for the effect of cover crop (CC), bio-fertilizer application (BF), year (Y), and their interaction on kernel yield (kg ha−1).
CCBFY CC × BFCC × YBF × Y
BFWithout BF201620172018 201620172018
T15446.8 aBF5920.0 b20163733.7 aT15535.9 ab5357.8 a3972.2 b4070.4 b8297.9 efBF3617.2 a5372.1 b8770.8 c
T26050.3 bWithout BF5717.1 a20175224.0 bT26575.2 b5525.4 ab3796.4 b5612.5 cd8742.0 efWithout BF3855.1 a5076 b8220.1 c
T35600.3 ab 20188495.5 cT35759.3 ab5441.4 a3196 ab5589.1 cd8015.9 e
T46489.6 b T46284.6 b6694.5 b4941.1c6261.7 d8265.9 ef
T55410.2 a T55636.9 ab5196.7 a2977.4a4538.5 bc8714.5 ef
T65519.7 a T65234.7 a5804.7 ab2732.9 a5433.4 c8392.7 ef
T76173.9 b T76787.8 b5560.1 ab4446.4 bc5367.6 c8707.7 ef
T85851.0 ab T85545.9 ab6156.2 b3807.0 b4919.2 c8826.8 f
df.7127142
Anova (p values)0.000 **0.040 *0.000 **0.000 **0.000 **0.005 *
* Significant at 5% probability level; ** Significant at 1% probability level; df–degrees of freedom; Different letters indicate significant differences according to LSD-test at p < 0.05; CC–cover crop treatment; BF–bio-fertilizer treatment; Y–year; T1–common vetch; T2–field pea; T3–winter oats; T4–fodder kale; T5–common vetch + winter oats;T6–field pea + winter oats; T7–organic mulch; T8–fallow.
Table 4. Analysis of variance for the effect of cover crop (CC), bio-fertilizer application (BF), year (Y), and their interaction on kernel yield, sucrose, glucose, fructose, vitamin C, yellow pigment (YP), glutathione (GSH), phytic phosphorus (Pphy), phenolics, Mg, Fe, Mn, and Zn contents in sweet maize kernel.
SucroseGlucoseFructosePphyPhenolicsGSHYPVitam. CMgFeMnZn
% DMmg g−1µg g−1nmol g−1µg g−1mg 100 g−1µg g−1
T11.39 b1.65 ab1.23 a3.14 c892 e1383 a11.74 b23.47 a1555 c45.65 g7.00 b36.15 ab
T21.18 a1.64 a1.39 b2.83 a763 bc1629 e11.57 a27.57 c1588 d35.40 c7.01 b38.26 ab
T31.16 a1.67 ab1.27 a2.98 b812 d1468 b11.58 a26.25 b1711 f36.26 d7.94 c41.04 b
T41.22 a1.63 a1.24 a2.92 b631 a1513 c12.66 d26.06 b1770 g32.41 a8.15 d34.21 ab
T51.38 b1.7 b1.44 c3.18 c750 b1519 c12.63 d28.55 d1651 e36.67 d7.77 c37.49 ab
T61.14 a1.63 a1.36 b2.91 b737 b1397 a12.29 c30.31 e1473 a40.45 f6.43 a32.42 ab
T71.50 c1.64 a1.52 d2.96 b789 c1704 f11.71 b28.45 d1575 cd34.01 b6.57 a30.68 a
T81.23 a1.74 b1.46 c3.11 c894 e1599 d12.35 c28.55 d1513 b39.48 e6.55 a39.36 ab
BF1.25 a1.71 b1.372.93 a771 a1518 a11.60 a28.37 b1628 b37.16 b6.92 a31.70
Without BF1.3 b1.61 a1.363.07 b796 b1536 b12.53 b26.44 a1581 a29.95 a7.44 b28.89
20161.29 b1.71 b1.41 b2.52 a1299 c1379 a26.25 c27.04 a2426 c69.59 c12.29 c68.36 c
20171.29 b1.71 b1.41 b3.29 c595 b1545 b1.85 a27.04 a533 a5.62 a0.84 a5.33 a
20181.26 a1.56 a1.26 a3.19 b456 a1656 c8.09 b28.12 b1855 b35.02 b8.40 b31.37 b
Source of variationdf.Anova (p values)
CC70.000 **0.000 **0.090.000 **0.000 **0.000 **0.000 **0.000 **0.000 **0.055 *0.000 **0.042 *
BF10.000 **0.000 **0.164 ns0.000 **0.003 **0.000 **0.000 **0.000 **0.000 **0.000 **0.000 **0.322 ns
Y20.000 **0.000 **0.000 **0.000 **0.000 **0.000 **0.000 **0.000 **0.000 **0.000 **0.000 **0.000 **
CC × BF70.000 **0.000 **0.000 **0.000 **0.000 **0.000 **0.000 **0.000 **0.000 **0.000 **0.000 **0.005 **
CC × Y140.000 **0.000 **0.000 **0.000 **0.000 **0.000 **0.000 **0.000 **0.000 **0.000 **0.000 **0.000 **
BF × Y20.000 **0.000 **0.000 **0.000 **0.000 **0.000 **0.000 **0.000 **0.000 **0.000 **0.000 **0.097 ns
CC × BF× Y140.000 **0.000 **0.000 **0.000 **0.000 **0.000 **0.000 **0.000 **0.000 **0.000 **0.000 **0.002 **
* Significant at 5% probability level; ** Significant at 1% probability level; df—degrees of freedom; Different letters indicate significant differences according to LSD-test at p < 0.05; CC–cover crop treatment; BF–bio-fertilizer treatment; Y–year; T1–common vetch; T2–field pea; T3–winter oats; T4–fodder kale; T5–common vetch + winter oats; T6–field pea +winter oats; T7–organic mulch; T8–fallow.
Publisher’s Note: MDPI stays neutral with regard to jurisdictional claims in published maps and institutional affiliations.

