Article

The Effect of Crop Rotation and Cultivation History on Predicted Carbon Sequestration in Soils of Two Experimental Fields in the Moscow Region, Russia

by
Kristina Prokopyeva
1,
Vladimir Romanenkov
1,2,
Nadezhda Sidorenkova
3,
Vera Pavlova
4,
Stanislav Siptits
5 and
Pavel Krasilnikov
1,*
1
Faculty of Soil Science, Lomonosov Moscow State University, 119991 Moscow, Russia
2
Geographical Network Department, All-Russian Research Institute of Agrochemistry Named after D. Pryanishnikov, 127550 Moscow, Russia
3
RSAU-MAA Named after K.A. Timiryazev, 127550 Moscow, Russia
4
National Research Institute of Agricultural Meteorology, 249030 Obninsk, Russia
5
All-Russian Institute of Agrarian Problems and Informatics Named after A. Nikonov, 107078 Moscow, Russia
*
Author to whom correspondence should be addressed.
Agronomy 2021, 11(2), 226; https://doi.org/10.3390/agronomy11020226
Submission received: 29 November 2020 / Revised: 17 January 2021 / Accepted: 22 January 2021 / Published: 26 January 2021

Abstract

:
Soil organic carbon (SOC) sequestration in arable soils is a challenging goal. We focused on the effect of crop rotation and previous land use for future carbon sequestration on two experimental fields on Retisols with four contrasting fertilization treatments each. We analyzed the SOC dynamics and used the RothC model to forecast the SOC. We found a consistent increase in SOC stocks and stable fractions of the soil organic matter (SOM) with C accumulation in the next 70 years compared to the 90-year experimental period, more evident under the Representative Concentration Pathway 4.5 (RCP4.5) compared with the RCP8.5 scenario. The expected increase in SOC will be higher in the crop rotation with a grass field than in the experiment with an alternation of row crops and cereals. The efficiency depended on stable SOM fractions, and fields with more extended cultivation history showed higher SOM stability. Proper crop rotations are more important for SOC stability than the uncertainty associated with the climate change scenarios that allows timely adaptation. The goal of a 4‰ annual increase of SOC stocks may be reached under rotation with grasses in 2020–40 and 2080–90 when applying a mineral or organic fertilizer system for scenario RCP4.5 and a mineral fertilizer system in 2080–2090 for scenario RCP8.5.

1. Introduction

Global climatic warming is a significant threat to the well-being of humankind. During the last decade, the importance of soil organic carbon (SOC) in the global carbon cycle became a vital topic in the climatic change agenda [1,2]. On the one hand, soils under a warmer climate may release a significant part of the carbon stored in their mineral and organic horizons. On the other hand, under proper management, we can expect SOC sequestration in agricultural soils as outlined by the “4 per 1000” initiative [3] and Coronivia Joint Work for Agriculture [4]. In this context, the potential SOC accumulation in arable soils is of significant importance for reducing the greenhouse gases concentration in the atmosphere and the consequent mitigation of the climatic change. The assessment of this potential is done through modeling, and there were several successful attempts to predict the SOC potential fixation in soils using different scales [5,6]. Land use and the application of mineral and organic fertilizers are believed to be the most important variables affecting the accumulation and stability of SOC. However, various other factors should be considered for the prediction of the soil capacity to fix atmospheric carbon. In practice, assessing the contribution of multiple factors to the carbon accumulation in soils is a challenging task because of the scarcity of data on the long-term dynamics of SOC under controlled conditions [7]. Two important gaps in our knowledge on the factors affecting SOC accumulation are the lack of information on the effect of particular crop rotations on specific soils and the absence of understanding of the role of the previous land use on the future C dynamics in soils. Recent studies gave promising results for the use of conservation agriculture for C sequestration in arable soils, but the studies are still few in number [8].
We do not know if previous soil use may be easily smoothed by the subsequent management or have a long-term effect. In this research, we had a unique situation with two fields with the same soil and almost identical fertilizer inputs but differing in crop rotations and land use on the starting date of the experiment. The SOC dynamics modeling results for the past were presented in our previous publication [9]. Modeling showed that fertilization and crop rotation modification could provide a steady increase in the C input and soil C accumulation in the 0–20-cm layer. However, the gain is finite, and the C stock can be quickly lost with the reducing crop rotation productivity. The present study aimed to model the future dynamics of soil organic matter (SOM) and its fractions under two climatic scenarios for two experimental fields situated at one geographical point but that have different crop rotations and a range of fertilization practices. We intended to find the best fertilization practices under future climate conditions that would favor SOC accumulation and potentially ensure the annual increase in C stock in soils by 4‰, as required by the “4 per 1000” initiative.

2. Materials and Methods

We based the research on two long-term field experiments of the DAOS—Dolgoprudny Agrochemical Experimental Station (Dolgoprudny Town, Moscow region), included in the Geographical network of field experiments with fertilizers (Geoset). This network was created in the Soviet Union in 1941 as the scientific base of agrochemical science in the country. Until now, Geoset has developed recommendations for the most efficient use of fertilizers and other agrochemicals within principal crops and crop rotations following the requirements of contemporary agricultural technologies in different soil–climatic zones and regions of the Russian Federation, conducts research on the conservation and improvement of soil fertility and sustainability of agricultural landscapes [10].
The territory of DAOS consists of a cluster of long-term experiments initiated in the 1930s by academician D. Pryanishnikov based mainly on the Rothamsted experience [11]. The climate is Dfb-humid continental without a dry season and with a warm summer. The soil is an Albic Retisol (Loamic, Aric and Cutanic) formed on glaciofluvial “cover loam”.
The first experiment was a part of the project “Efficiency of increasing doses of mineral fertilizers” initiated in 1937. The site was under long-term agricultural use before the beginning of the experiment. The four-field fodder crop rotation beet–spring wheat–potato–oats was replaced in 1965 by a three-field rotation with two fields of row crops (beet, potatoes and sunflowers) and a field of barley and continued until 2011. This experiment is referred to below as DAOS 3. The initial SOC concentration in the 0–20-cm layer was 1.0% to 1.1%, which corresponded to a stock of 28.6–28.8 Mg·ha−1; the organic C content was assessed in the laboratory using wet oxidation with potassium bichromate + sulphuric acid [12]. Bulk density was measured using the cylinder method. In the absence of a temporal trend in the bulk density, which was within 1.3 to 1.4 g∙cm3 during the experimentation period, an equivalent soil mass basis [13] was not applied, and the SOC stock for the layer 0–20 cm was assessed by multiplying the C content and bulk density. The experiment included four fields—one per each crop in the crop rotation, with an identical plan of fertilization treatment distributions and replications: absolute control without fertilizers (control), NPK 1.5 rates with a farmyard manure (FYM) application of 40 Mg·ha−1 per rotation (20 Mg·ha−1 for potatoes and 20 Mg·ha−1 for beets) (NPK1.5 + FYM), NPK 3 rates without manure application (3NPK) and NPK 3 rates with manure application (NPK3 + FYM). For the modeling, we used the data from the first field of the rotation. The single rate of the mineral fertilizers for the first seven rotations was N60P75K90 for potatoes, N80P100K120 for beets and N30P38K45 for cereals, later adjusted for PK and remaining unchanged for N. At the end of the experiment in 2006, the topsoil was strongly acidic, with the pHKCl ranging from 3.7 on the field under 3NPK to 4.8 under the control with manure.
The other experiment, DAOS 4, “Efficiency of ballast and concentrated forms of mineral fertilizers”, was launched in 1933. The site was under natural forest vegetation until 1925; no fertilizers were applied before the experiment. Five-field crop rotation (clover–winter rye–potatoes–fodder beets–oats with grass sowing) was established in five fields. In 1978, starting with the 10th rotation, the scheme was changed to a four-field rotation: clover–winter wheat–potatoes–barley with grass seedings. In the experiment, clover was used together with a spring crop. Clover was not mowed and continued vegetating for the second year. In Russia, this system is considered a perennial grass. This experiment is referred to below as DAOS 4. The initial carbon content in the 0–20-cm layer was 1.0–1.3%, and the bulk density was 1.39 g·cm−1; consequently, the SOC stock was 30.3–32.4 Mg·ha−1. The sampling scheme for SOC monitoring was the same as in the DAOS 3 experiment. For modeling, data from 1935–2011 of the first field were used for the following treatments: absolute control (control); farmyard manure 50 Mg·ha−1 per rotation (the corresponding amount of N 230–250 kg·ha−1) and, since 1978, 40 Mg·ha−1 (FYM); a treatment with low-analysis NPK fertilizers—ammonium sulfate, simple superphosphate and potash salt (NPK1) and the equivalent application of diammophos DAP and potassium chloride (NPK2). N90P90K90 was added for row crops and winter wheat, N90P90K120 for potatoes, N45P45K45 for oats and grasses and N60P80K80 for barley. The pHKCl values of the topsoil in 2011 ranged from 4.5 on the field under NPK to 5.0 under manure. For additional data on the abovementioned experiments, interested readers may consult the monograph [14].
To assess the SOC dynamics, we used the model developed for the Rothamsted Experimental Station RothC version 26.3, which calculates the organic matter cycle in the arable layer of mineral soils with a monthly step, taking into account the influence of the soil textural class, temperature, soil humidity and vegetation cover [15]. In the RothC model, the soil organic matter (SOM) is divided into five pools: carbon of rapidly decomposing plant residues (DPM), resistant plant material (RPM), microbial biomass (BIO) and humified (HUM) and inert (IOM) organic matter, which have different mineralization rates described by first-order equations. Each pool except IOM undergoes first-order kinetic decomposition, and each has a constant rate of decay (k) per year: for DPM, k = 10, for RPM, k = 0.3, for BIO, k = 0.66 and, for HUM, k = 0.02. Decomposition of the active compartment is given by the expression
Y = Y0 (1 − eabckt),
where Y0 is the initial C content; a, b and c are factors that modify k (temperature, moisture and soil cover, respectively) and t = 1/12. The model input data include monthly rainfall, potential evapotranspiration, monthly mean air temperature, soil clay content, IOM stock, soil layer depth, monthly C input with plant residues and farmyard manure and the absence or presence of plant cover. Potential evapotranspiration from an open water surface was calculated according to the method used in Russia (Ivanov’s Index), based on vapor pressure and mean air temperature [16]:
PEVT = 0.0018 × (25 + T)2 × (100 − a)
A = eA/EA × 100
EA = 6.11 × exp(17.4 × T/(T + 239))
where PEVT is the potential evapotranspiration (mm/month), a is the relative air humidity (%), T is the air temperature (C), eA is the aqueous tension (hPa) and EA is the moisture saturation (hPa).
Earlier, the model was successfully tested for reproducing the SOC dynamics of long-term experiments in the study region. To launch the model, a database of the EuroSOMNET (European Network of Field Experiments on Soil Organic Matter) standard was created, which included the Geoset experiments described above [17]. During the experiment, the SOC content and bulk density were measured eight times. We ran RothC with the current C input for each treatment to compare the simulated and measured SOC values. To achieve the best fit between the simulated and measured values, the initial steady-state size of the C pools in the control treatment were changed iteratively, assuming nonequilibrium conditions at the beginning of the modeling. Other treatments were used as independent variables to test the accuracy of the simulations based on the Modeval Statistical Evaluation model, Excel version [18]. The correlation coefficient, root mean square error, coefficient of determination, simulation efficiency and the mean difference between the measured and simulated values [19] were used to evaluate the model performance. Further details may be found in our previous publication [20].
The monthly amount of C in the soil was calculated using the dependence of plant residue depositions in the soil on the yield and reference data on the quality of the FYM. The initial distribution of C across the pools, which is required to run the model, was modeled for the C content under equilibrium conditions. The content of the IOM pool was precalculated, as described by Falloon et al. [21]. After calculating the IOM pool, the RothC model was run in the mode of calculating the distribution of C across the pools by selecting the average long-term value of C input to the soil in such a way that the C reserves obtained by modeling corresponded to the experimentally determined values. For the DAOS 3 experiment, the average annual amount of calculated C input was 830–840 kg·ha−1, and, for DAOS 4—880–940 kg·ha−1. The RothC model configuration was fitted to the control treatments, using the other treatments as independent ones to validate the quality of the configuration. In the process of fitting, the initial RPM content increased by a proportional reduction in the HUM, and the input of C with the applied FYM decreased.
Our previous research modeled and verified the SOC dynamics in the DAOS 3 and DAOS 4 experiments for the period 1935–2011 [9]. In the present study, the forecast of organic carbon stock dynamics under the future climate was made for two climate scenarios (Representative Concentration Pathways—RCPs): RCP4.5 and RCP8.5 from four representative concentration pathway scenarios used in the Intergovernmental Panel on Climate Change (IPCC) fifth assessment report (AR5). They describe four different 21st century pathways of changes in greenhouse gas emissions and concentrations and land use [22]. The selected scenarios correspond to the moderate and the extreme scenarios of anthropogenic impacts on the Earth’s climate system, respectively. CO2 concentrations by 2100 will range from 580–650 ppm CO2 for RCP4.5 to more than 1000 ppm for RCP8.5. We selected these two RCPs because of their reliability for the 21st century and because the climatic scenarios were contrasting under these two pathways. The calculations were based on the regional climate model developed at the Voeikov Main Geophysical Observatory for an ensemble scenario of 31 CMIP5 models [23]. The DAOS climate data were calculated based on the “Climate–Soil–Yield” simulation system [24]. The output data were temperature, precipitation and potential evapotranspiration with a monthly resolution up to 2100.
The obtained climate data were used to forecast the crop rotation yield for each of the experiments until 2090. The calculation was carried out separately for each treatment of the experiment. For modeling, Seylyaninov’s hydrothermal coefficient (HTC), which characterizes the degree of moisture availability for plants, was used as the basis for calculating the predicted yield [25]. The HTC is calculated according to the formula
H T C =   P t > 10 T 10
where P is the sum of precipitation (mm), and T is the sum of temperature (°C) for the months with the mean temperatures > 10 °C, which mainly correspond to the vegetation period—namely, April–October. This index was calculated at the monthly level for the same period. The dependence of the relative crop yield U on the moisture availability was approximated with the following expression:
U = Y Y m a x ; f o r   H T C > 1.15     U = 0.20 · h 2   + 0.41 · h + 0.2 Otherwise ,   U = 0.92 · h 2   0.36 · h + 0.2
According to Equation (5), the maximum yield value Y_max coincides with HTC = 1.15, which corresponds to slightly humid climate conditions ranging from arid to a very humid climate. The Y_max required for calculations was estimated by fitting the average yield obtained in each treatment of the long-term experiment to the average yield values for the first ten years of the forecast period with an Excel spreadsheet. A linear trend was calculated for each crop/treatment during the experiment to consider the factor associated with the technological progress. The predicted crop yield for each crop rotation was used to calculate the carbon input with plant residues using Levin’s approach [26]. The model was adjusted previously using the measured SOC concentrations during the experiment.

3. Results

3.1. DAOS 3 Experiment

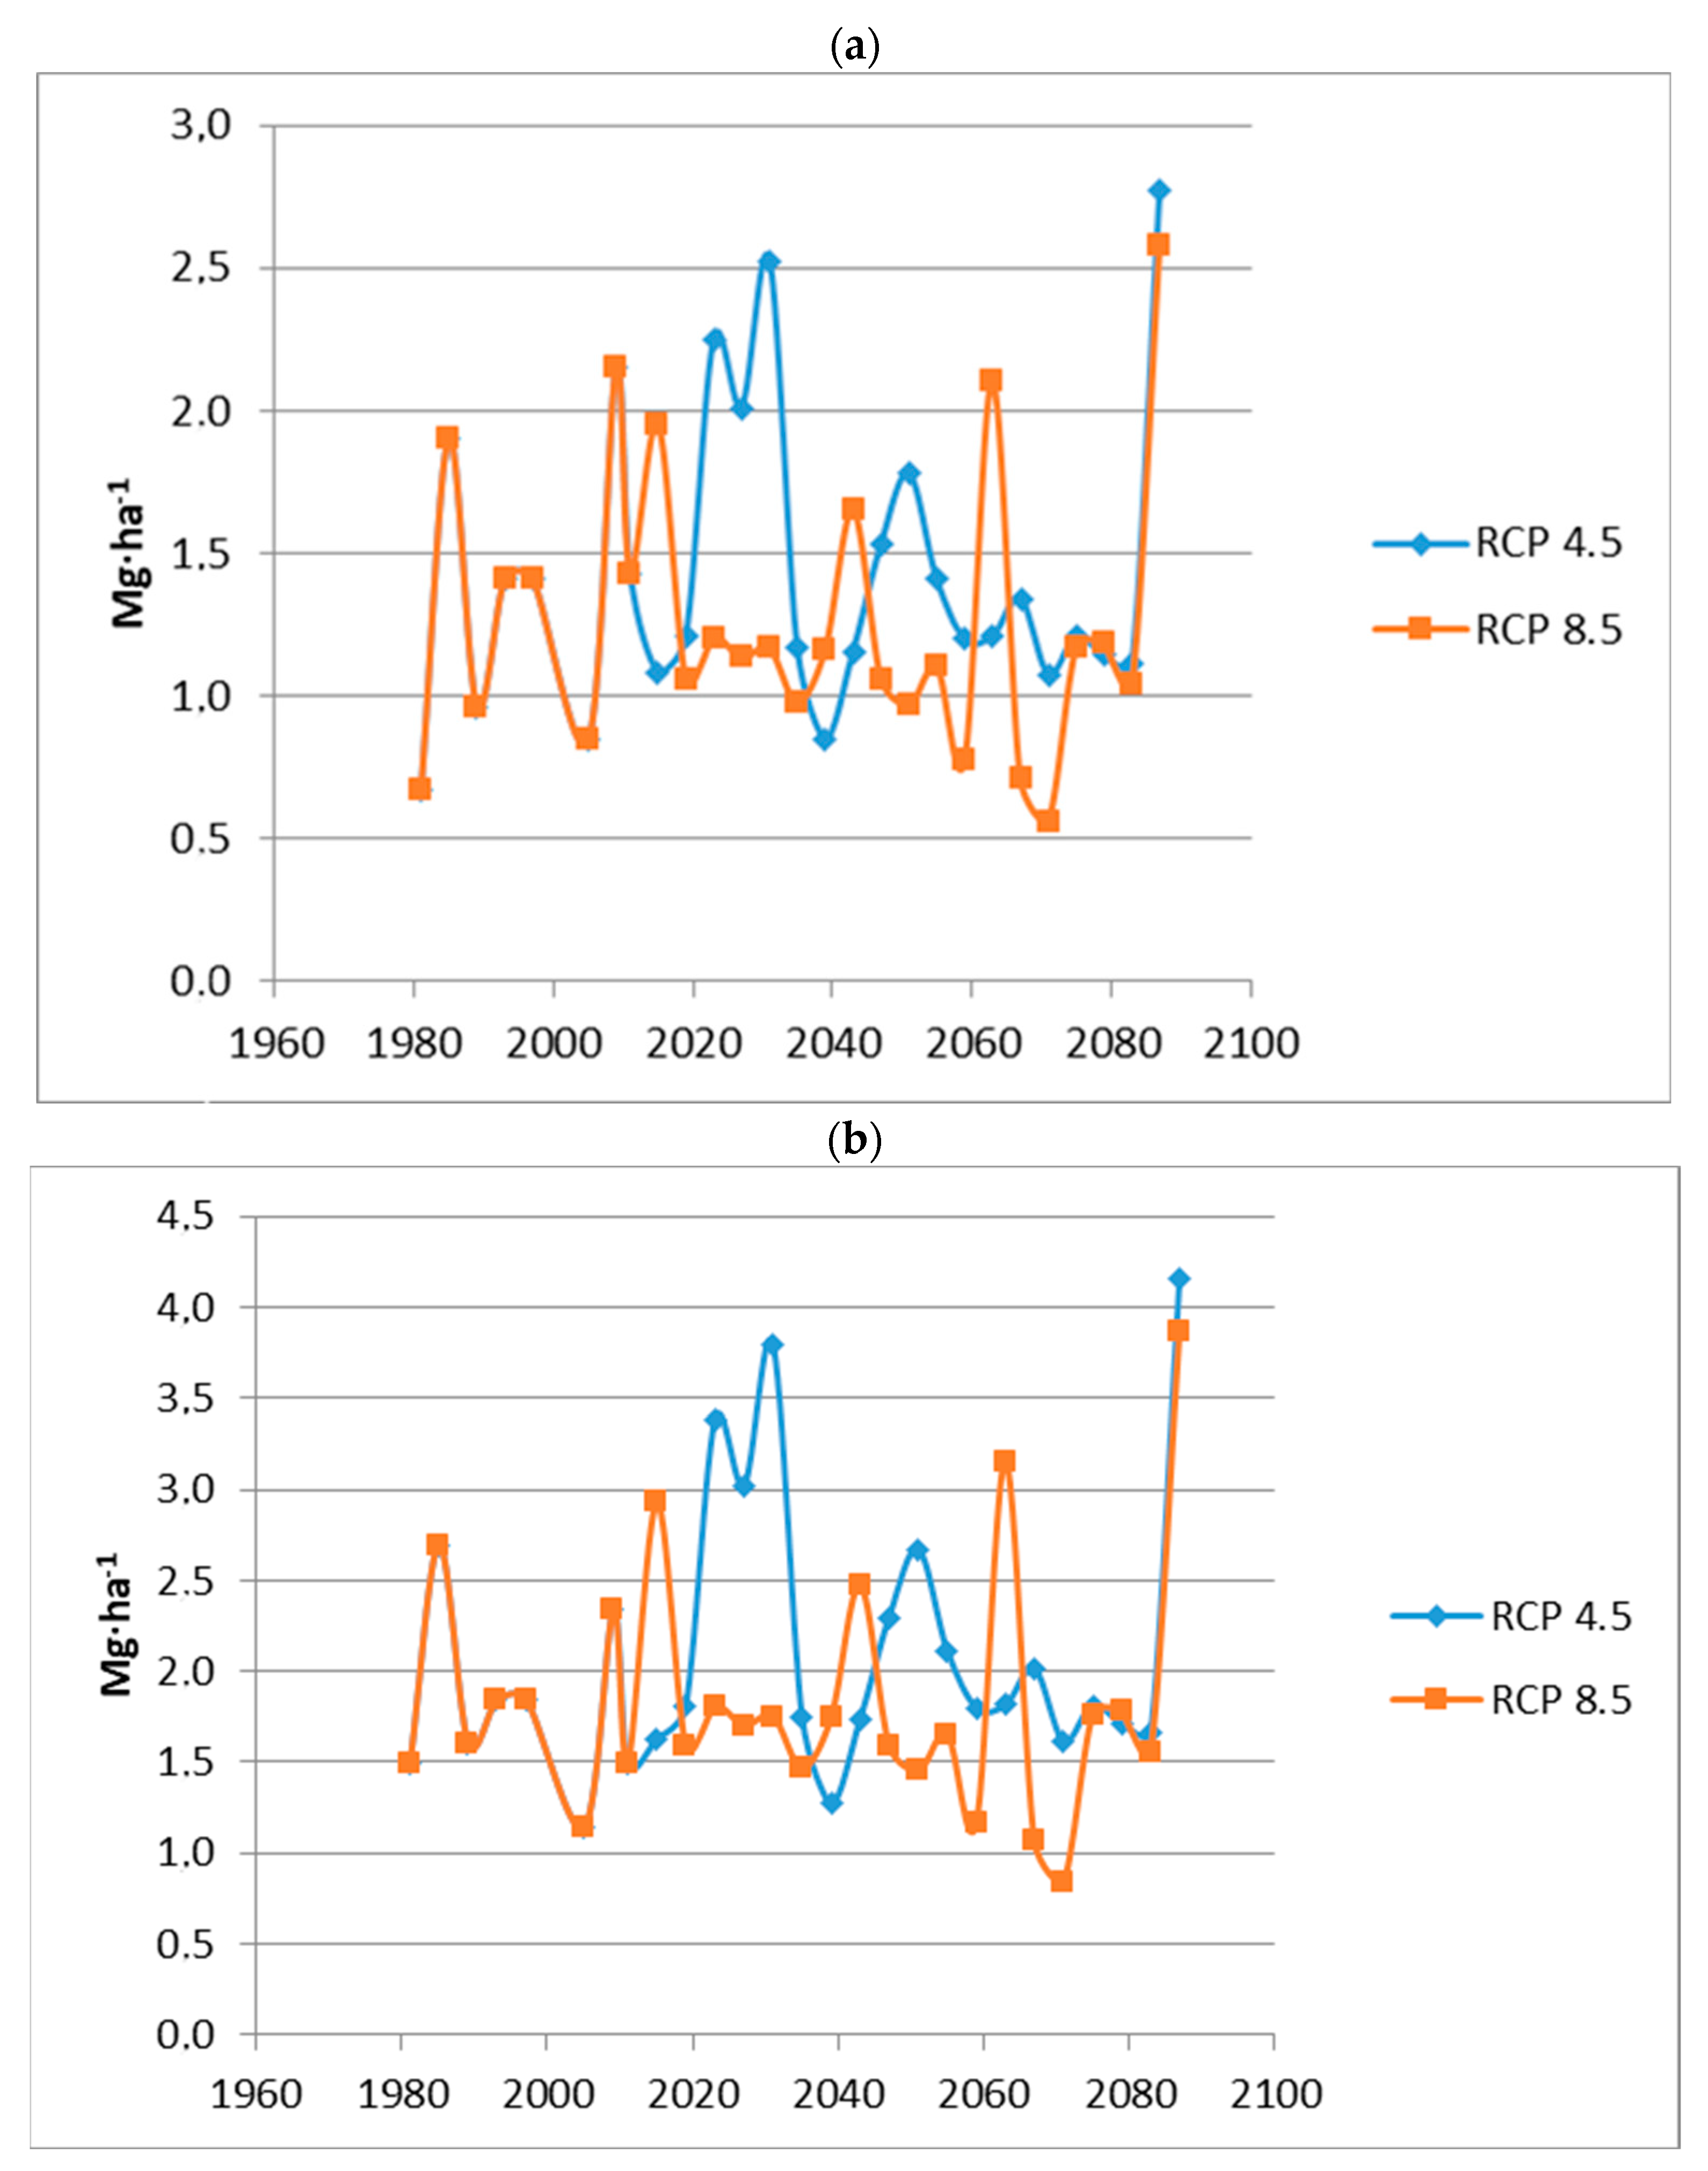
The mean values for the yields for the different crops and the ranges of the yields obtained during the experimental period are shown in Table 1. The predicted values varied depending on the climatic parameters during each of the periods of time used in the model. The observed and predicted yields of winter wheat for the two climatic scenarios are presented in Figure 1.
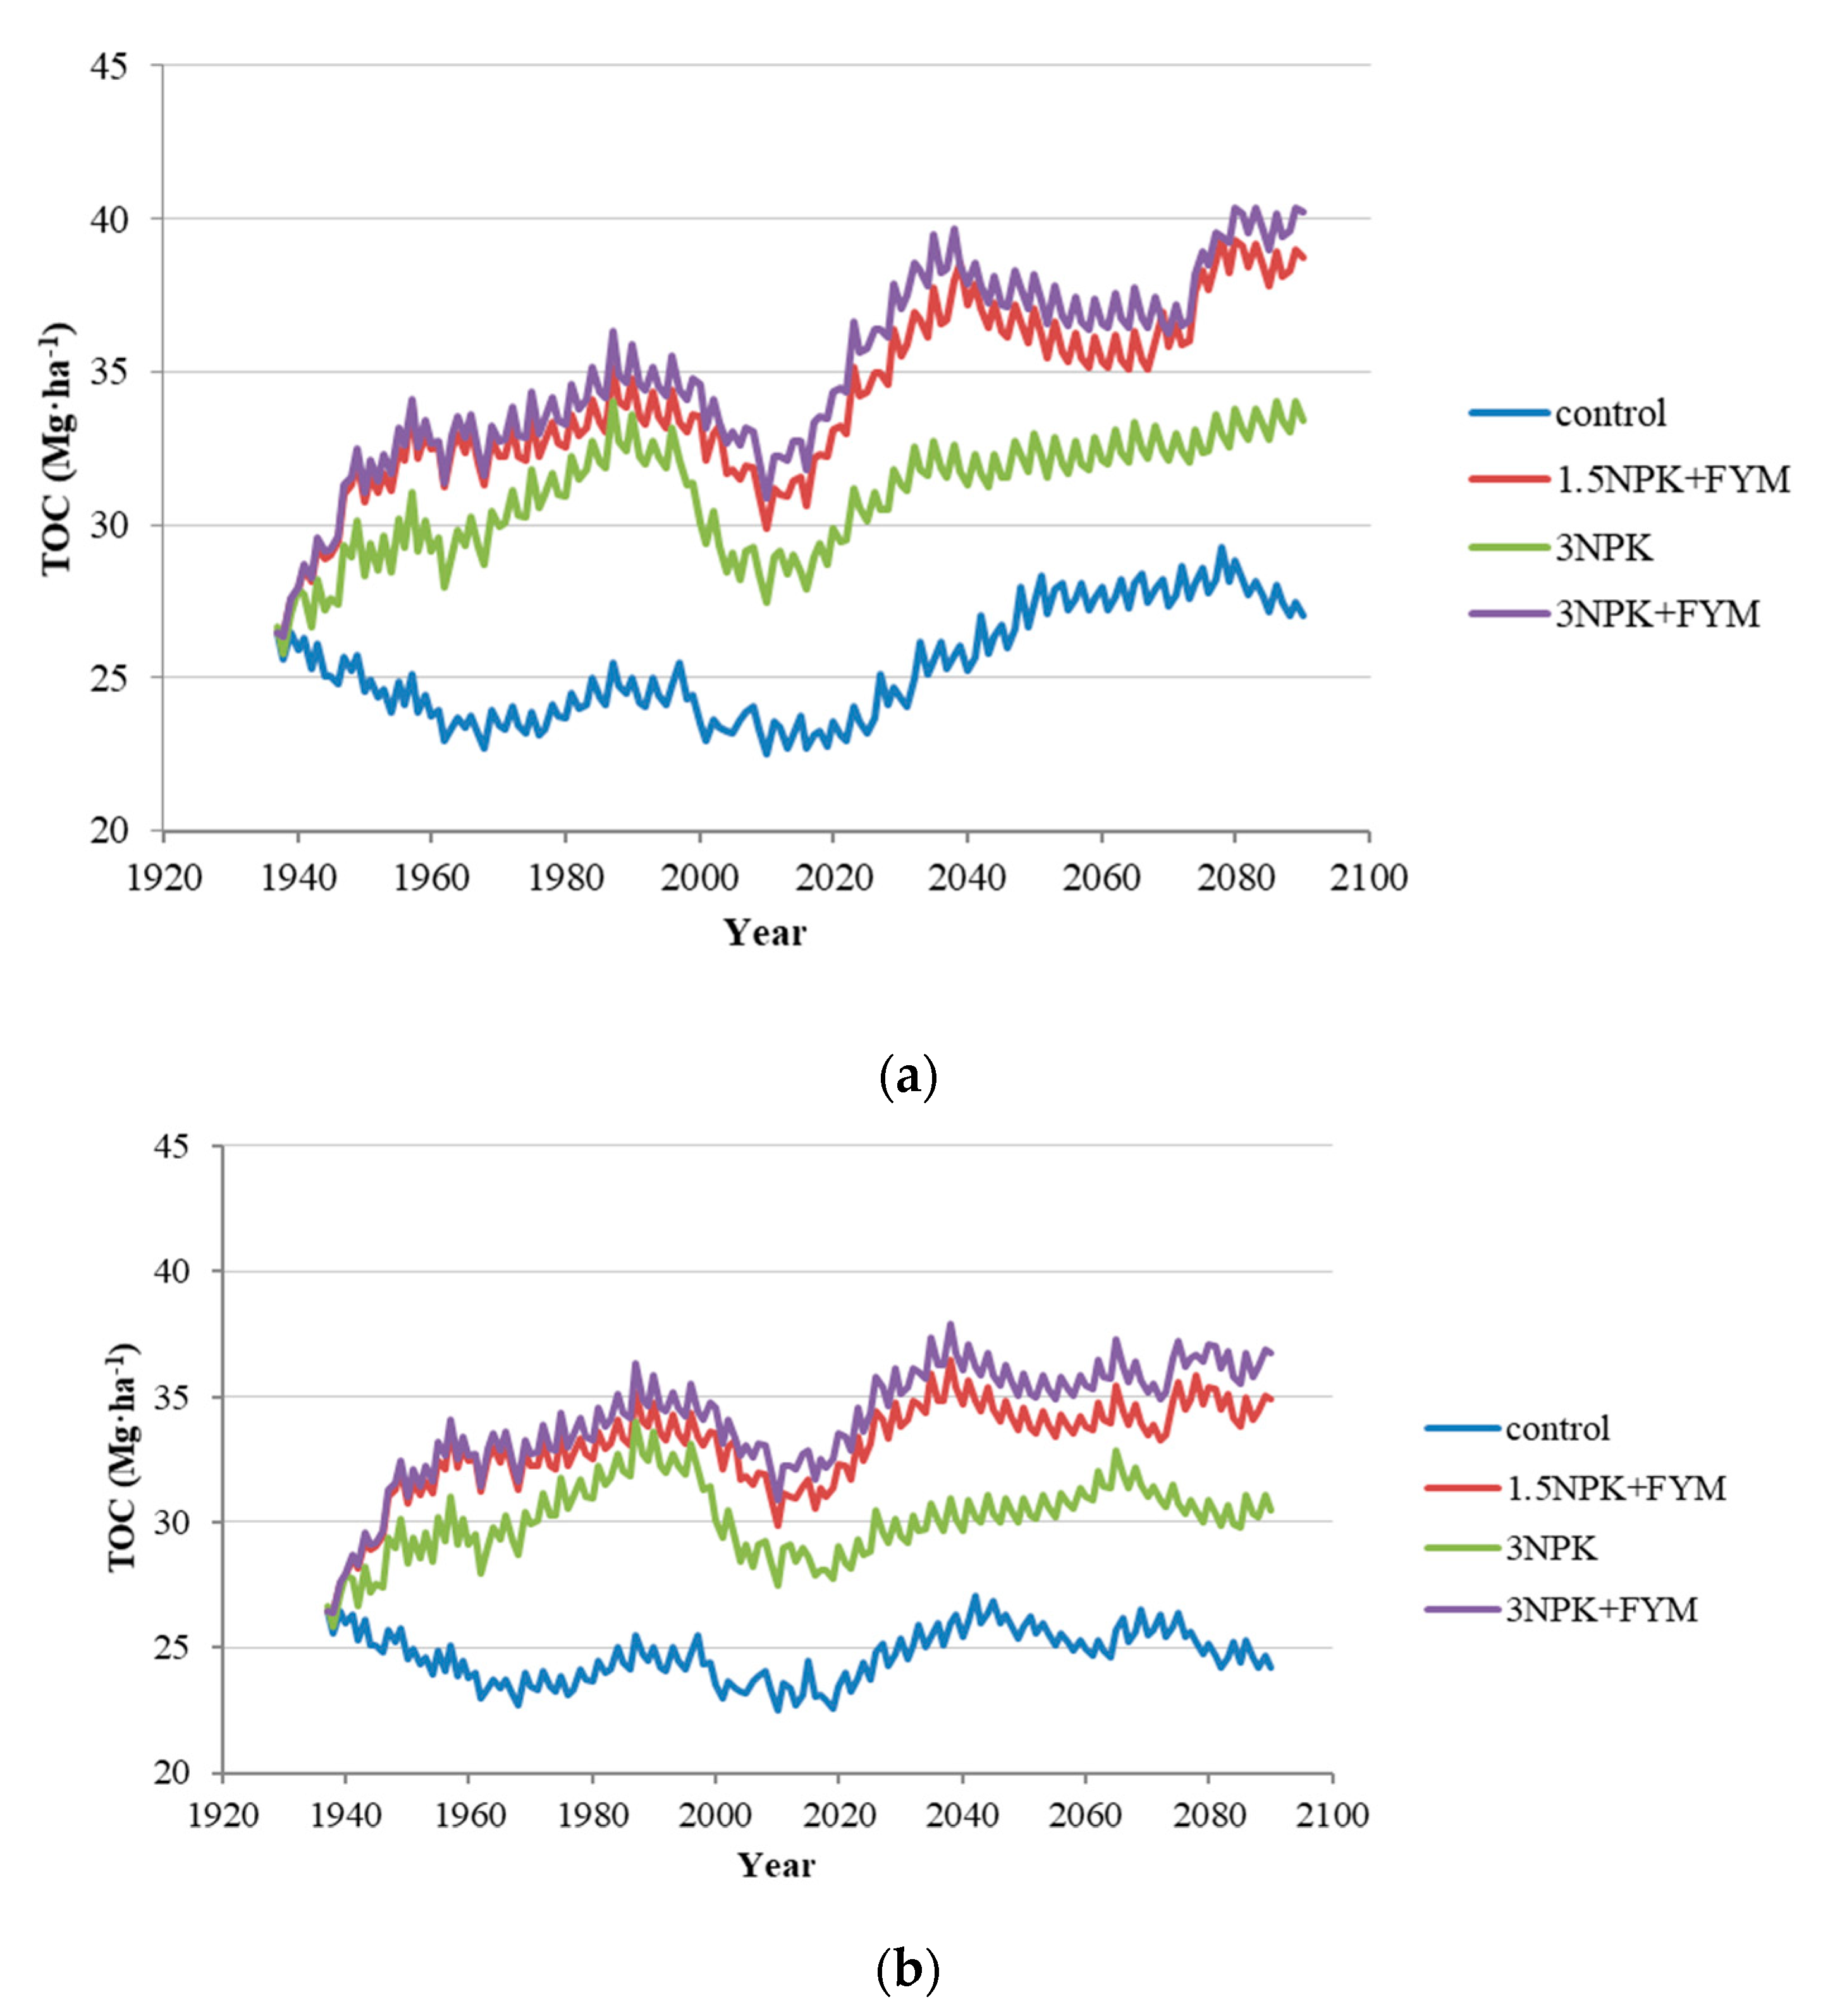
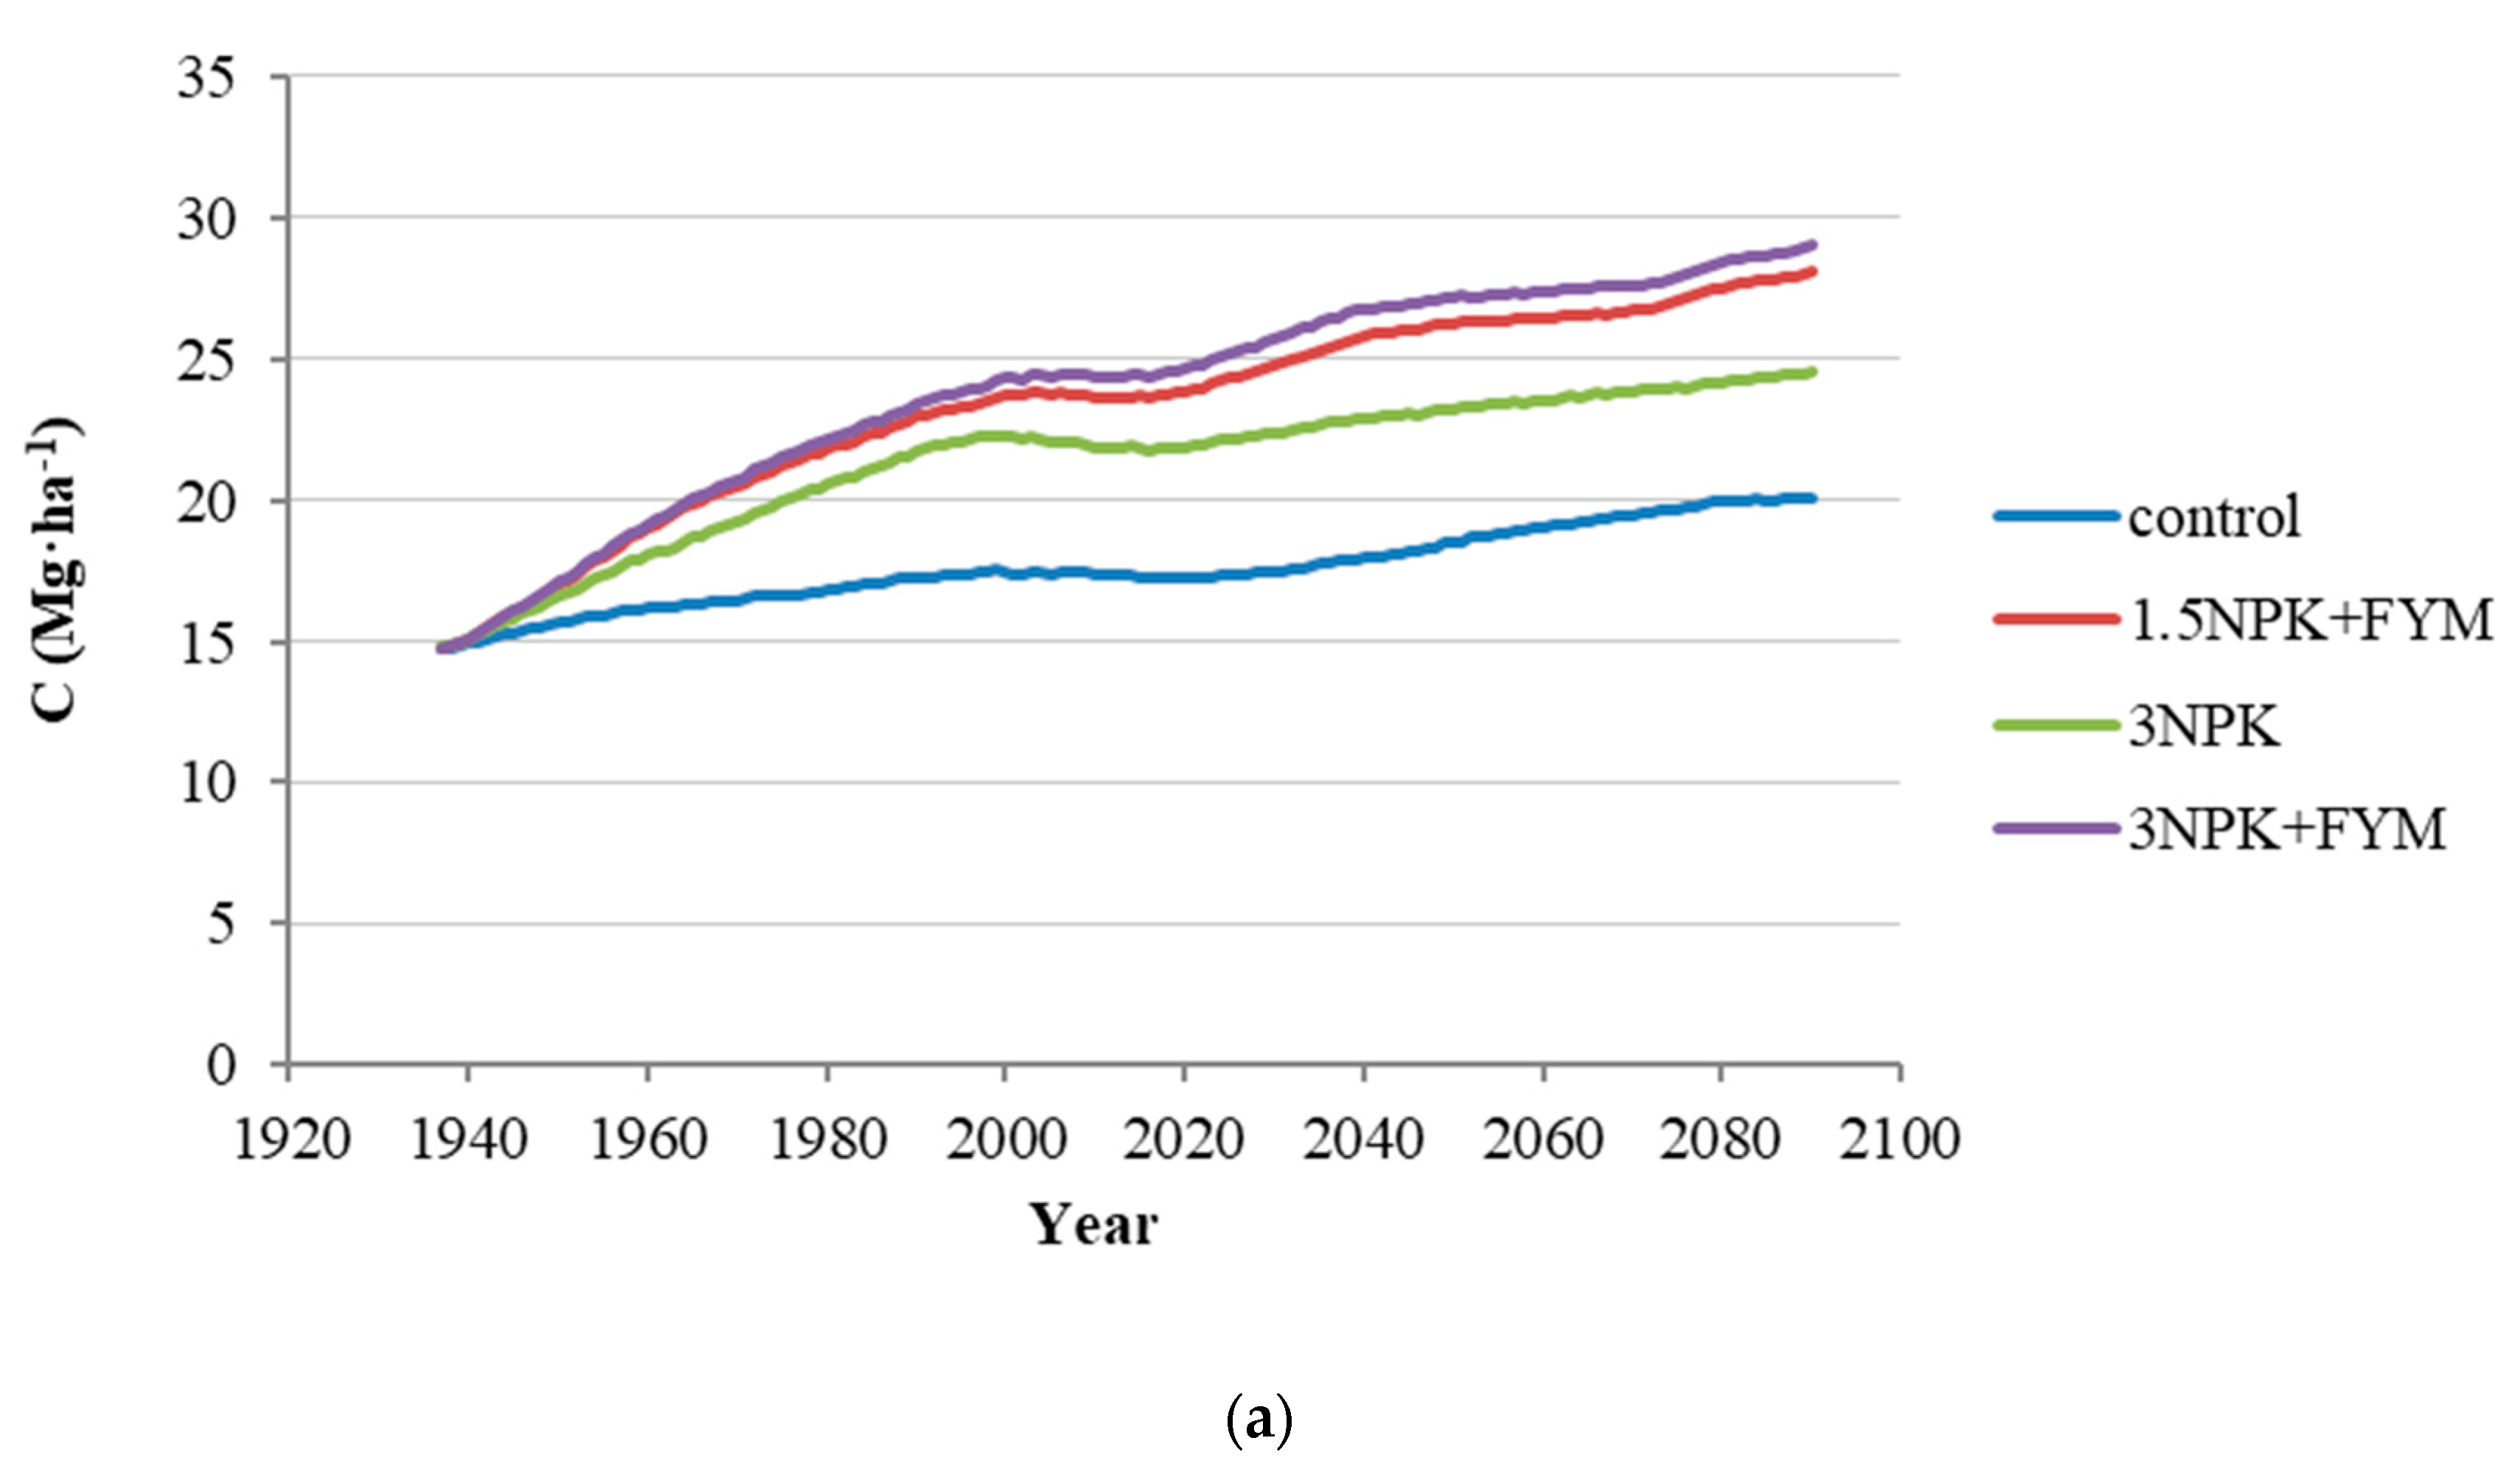
Figure 2 shows the dynamics of carbon stocks in the arable soil horizon calculated for two climate scenarios. Starting from 2020, the forecast of C stocks was made over twenty-year periods, with the calculation of the rate of the SOC dynamics and C input (Table 2). This period is recommended for evaluating the effectiveness of the “4 per 1000” initiative [3].
Under the RCP4.5 scenario, an increase in the SOC stock was detected for all treatments from 2020 to 2090, which was not constant. A relatively more intensive increase in the soil carbon stocks was predicted for the period 2020–2040, with a decrease in the growth rate (control and mineral fertilizers) or a loss of up to 2 Mg·ha−1 of the previously accumulated C (organic plus mineral fertilizers) until 2071 to 2072. In the treatment with the organic and mineral fertilizers, the SOC stock grew until 2081 and reached 39 to 40 Mg·ha−1 and then decreased 1 to 2.5 Mg·ha−1 over the last decade. Under the RCP4.5 scenario, similar patterns were observed in the 3NPK + manure and 1.5NPK + FYM treatments. The absolute growth in C stocks in 2020–2090 under this scenario varied between 4 and 7 Mg·ha−1, decreasing in the series 3NPK + FYM ≈ 1.5NPK + FYM > NPK > control. Thus, the dynamics of C in the treatments of the DAOS 3 experiment under the RCP4.5 scenario are expected to be quite contrasting. The most noticeable growth occurred in the first twenty years, decreasing in the series 3NPK + FYM > 1.5NPK + FYM > NPK > control.
As shown in Table 2, the highest C inputs are expected in 2020–2040 and 2060–2080, while in 2040–2060, there should be a decrease in the C input, which is especially noticeable in the treatments with organic and mineral fertilizer applications. Such a decline was not detected in the control and was also less pronounced in the treatment with mineral fertilizers in 2040–2060 than in the periods mentioned above. These results show the expected instability of yield in the crop rotations of the experiment under the future climate, which is only partially compensated by the additional C input with organic fertilizers. Indeed, for these treatments, the annual increase in the most favorable 20-year periods was 5.1–6.2‰, which is two-to-three times higher than the increase in the treatment with mineral fertilizers. In 2080–2090, the decline in SOC stock occurred against the background of continued C input to the soil, indicating the predominant effect of climate changes that accelerates the mineralization of previously accumulated SOC. In general, under this climate scenario, to maintain the SOC stocks for the entire simulated period, an average of 1.19 Mg·ha−1 should be applied annually in the soil in the DAOS 3 experiment, which is less than the one determined for the experimental period of 1937–2011, when an average of 1.39 Mg·ha−1 was required.
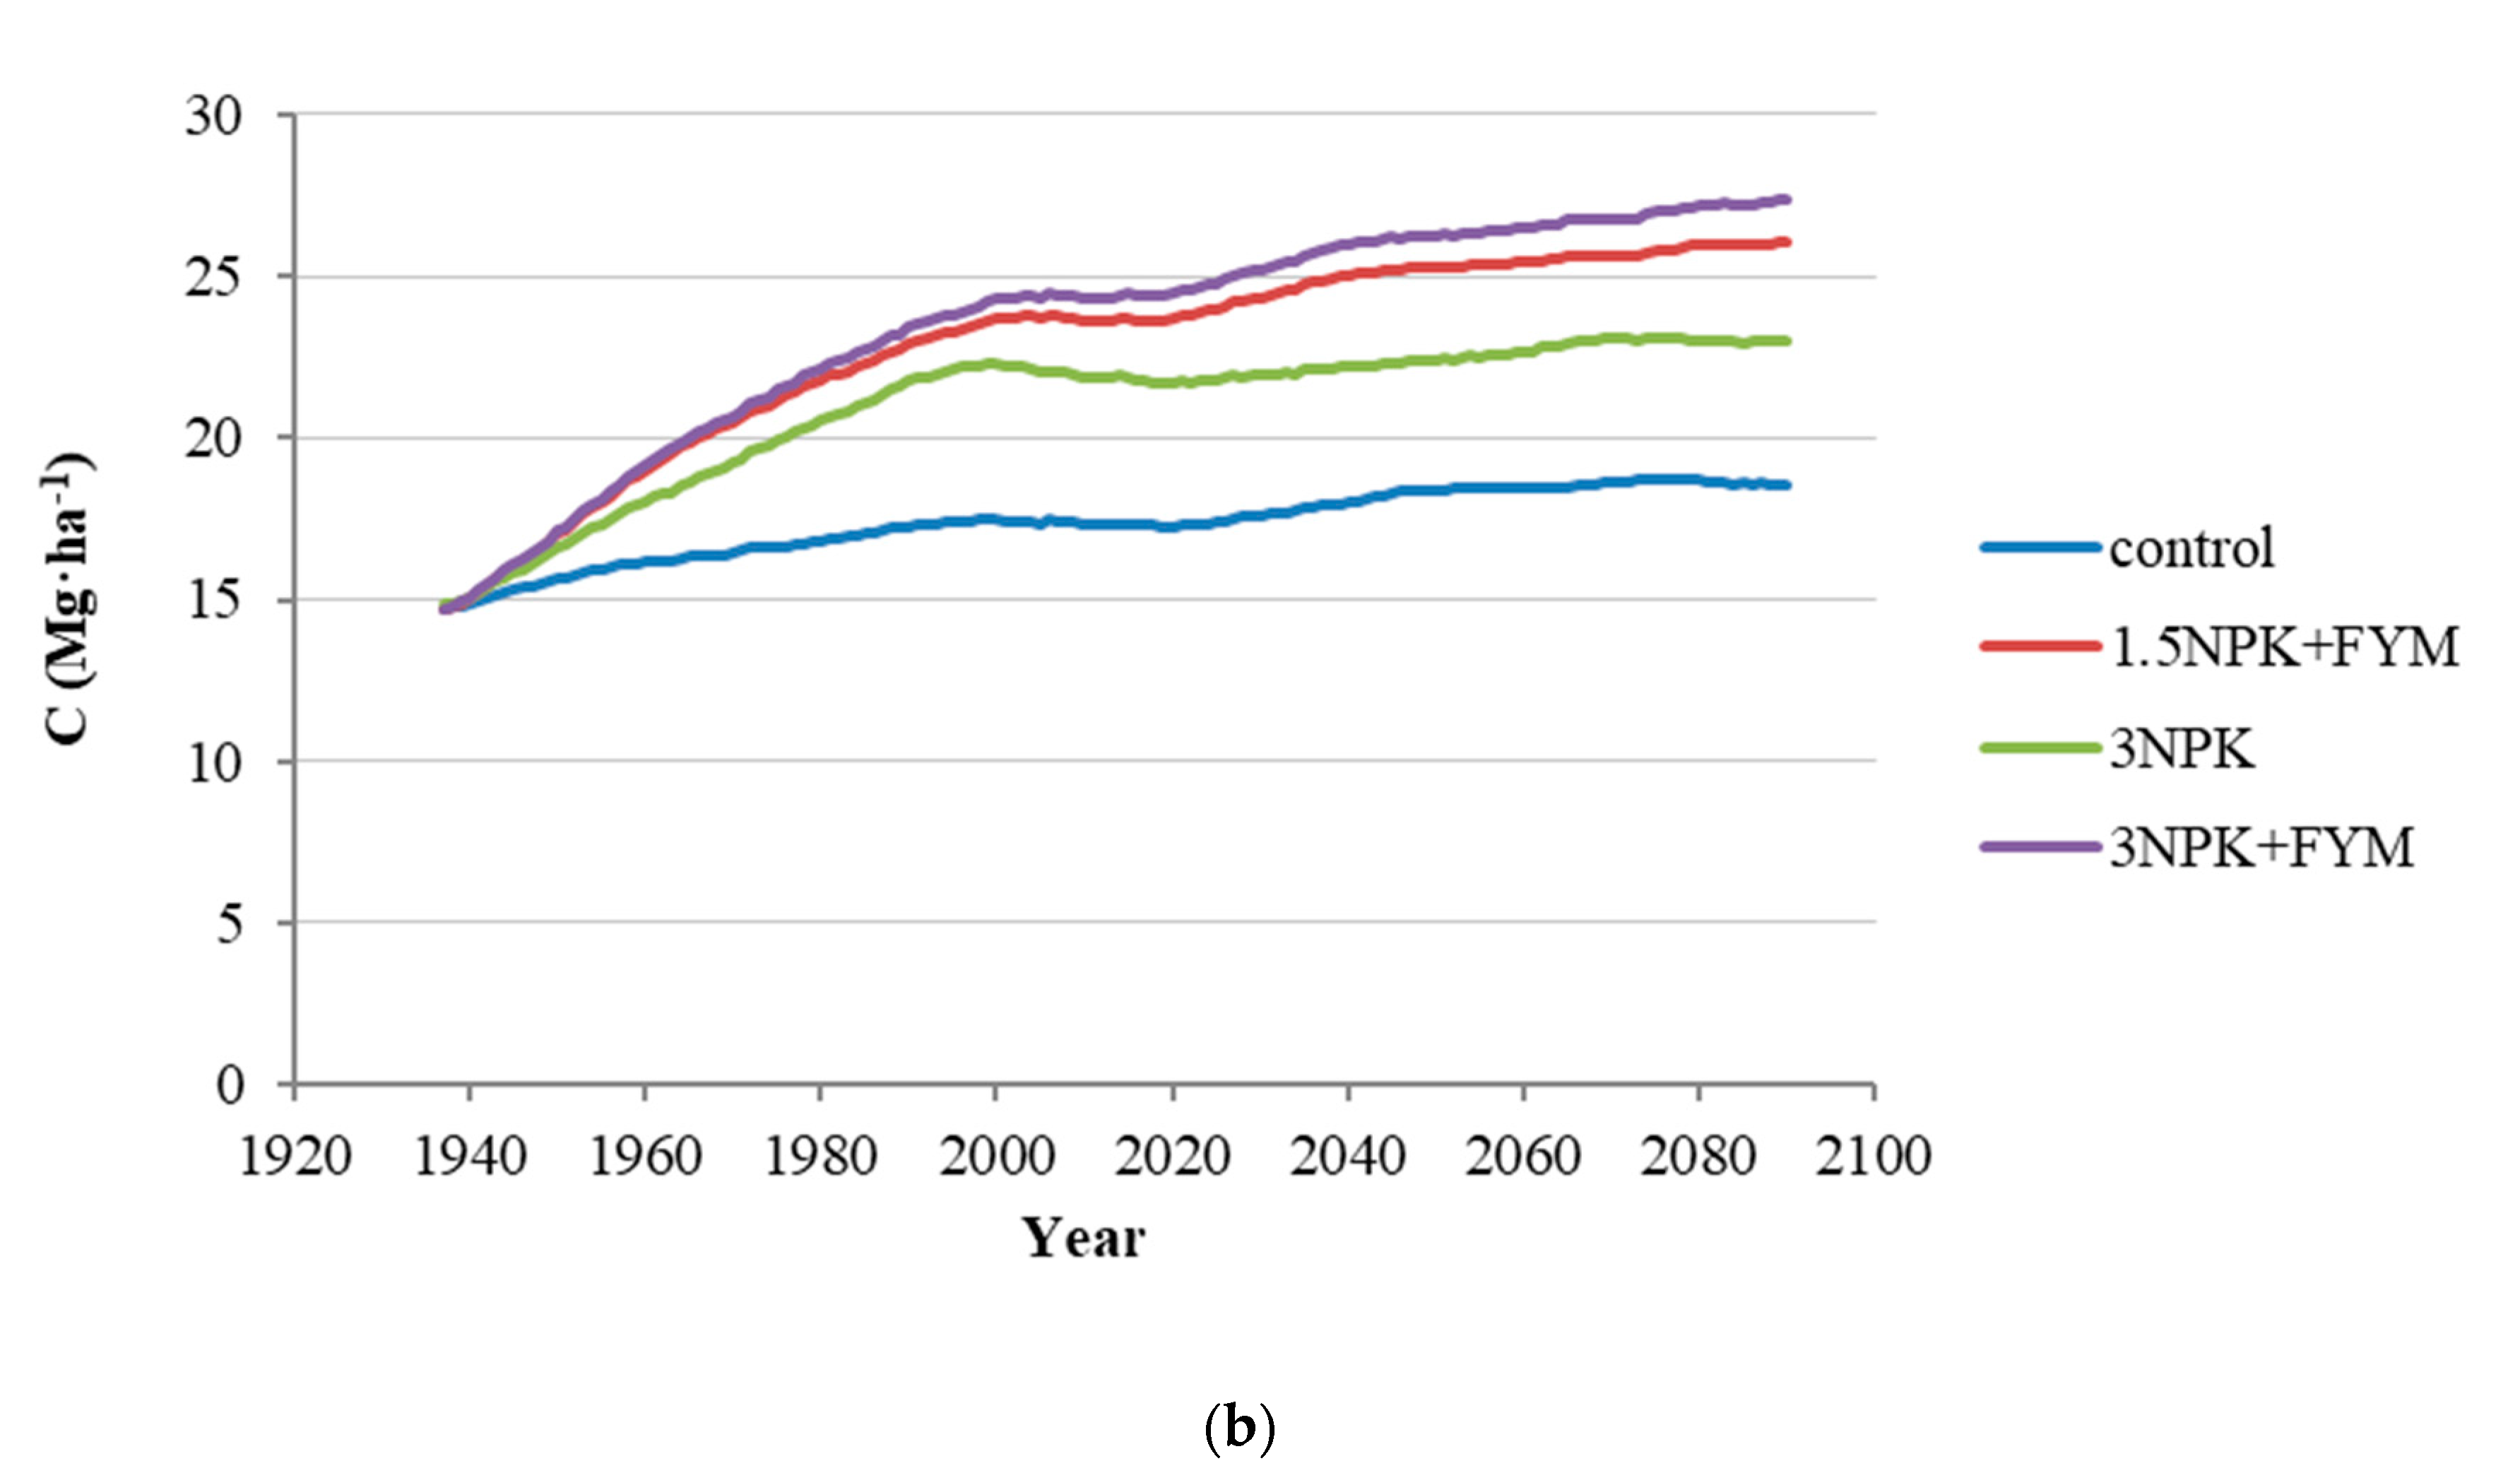
Under the RCP8.5 scenario, a less noticeable change in the soil C stocks is expected, which leads to a smoother forecast schedule. Similarly, as for the RCP4.5 scenario, we can distinguish periods of increase and loss of the SOC that occur at different rates. Similar dynamics were observed for both treatments of the organo–mineral fertilizer system: intensive growth until 2038 up to 37 to 38 Mg·ha−1, which is 1 to 2 Mg·ha−1 less than for the RCP4.5 scenario. Further, until 2065, 3 to 4 Mg·ha−1 of previously accumulated C is lost, with a relative stabilization at the level of 34–36 Mg·ha−1 until the end of the modeling period.
In the case of the NPK experiment, an increase from 28 to 33 Mg·ha−1 is expected from 2020 to 2065, less intense after 2040, and then a loss of accumulated stocks with a tendency to stabilization. In the control, growth is expected until 2042 from 23 to 27 Mg·ha−1, followed by short periods of growth and losses in the range of 24–27 Mg·ha−1 until 2090.
The absolute C stocks gain in 2020–2090 under this scenario was 2–4 Mg·ha−1. The gains increased and losses decreased in the 3NPK + FYM > 1.5 NPK + FYM > NPK > control series, as in the RCP4.5 scenario.
Table 2 shows that the dynamics of the C input to the soil is expected to be similar to the RCP4.5 scenario. Additionally, in the periods 2040–2060 and 2080–2090, the absolute values were identical in the fertilization treatments under both scenarios. In the remaining periods, which were relatively more favorable for the realization of the yield, it was less than in the RCP4.5 scenario by 3–18% for the treatments with fertilization, and for the control in all periods, except 2020–2040, it remained 11–39% less. As in the RCP4.5 climate scenario, the maximum annual increase in the C stocks was observed for the organo–mineral treatments (except for the 2020–2040 period for the control treatment, where the increase was 4.2‰), amounting to 3.7 to 3.8‰, which is about half the increase under the RCP4.5 scenario. The period 2080–2090, as for the RCP4.5 scenario, was very unfavorable. With a slight increase in C inputs compared to the previous period, the drop in stocks occurred at a faster rate than with RCP4.5. On average, 1.14 Mg·ha−1 of C should be applied annually for the entire simulated period to maintain the C stocks, close to the results obtained for the RCP4.5 scenario. For both scenarios, the most favorable period for C accumulation was 2020–2040, and among the treatments is the organo–mineral fertilizer system. An increase in the rate of mineral fertilizer against the background of organic did not significantly affect the increase in the C input. Therefore, the dynamics of both options were predicted to be similar. The accumulated stock of C was not stable and may be partially lost in the next period when crop rotation productivity decreases.
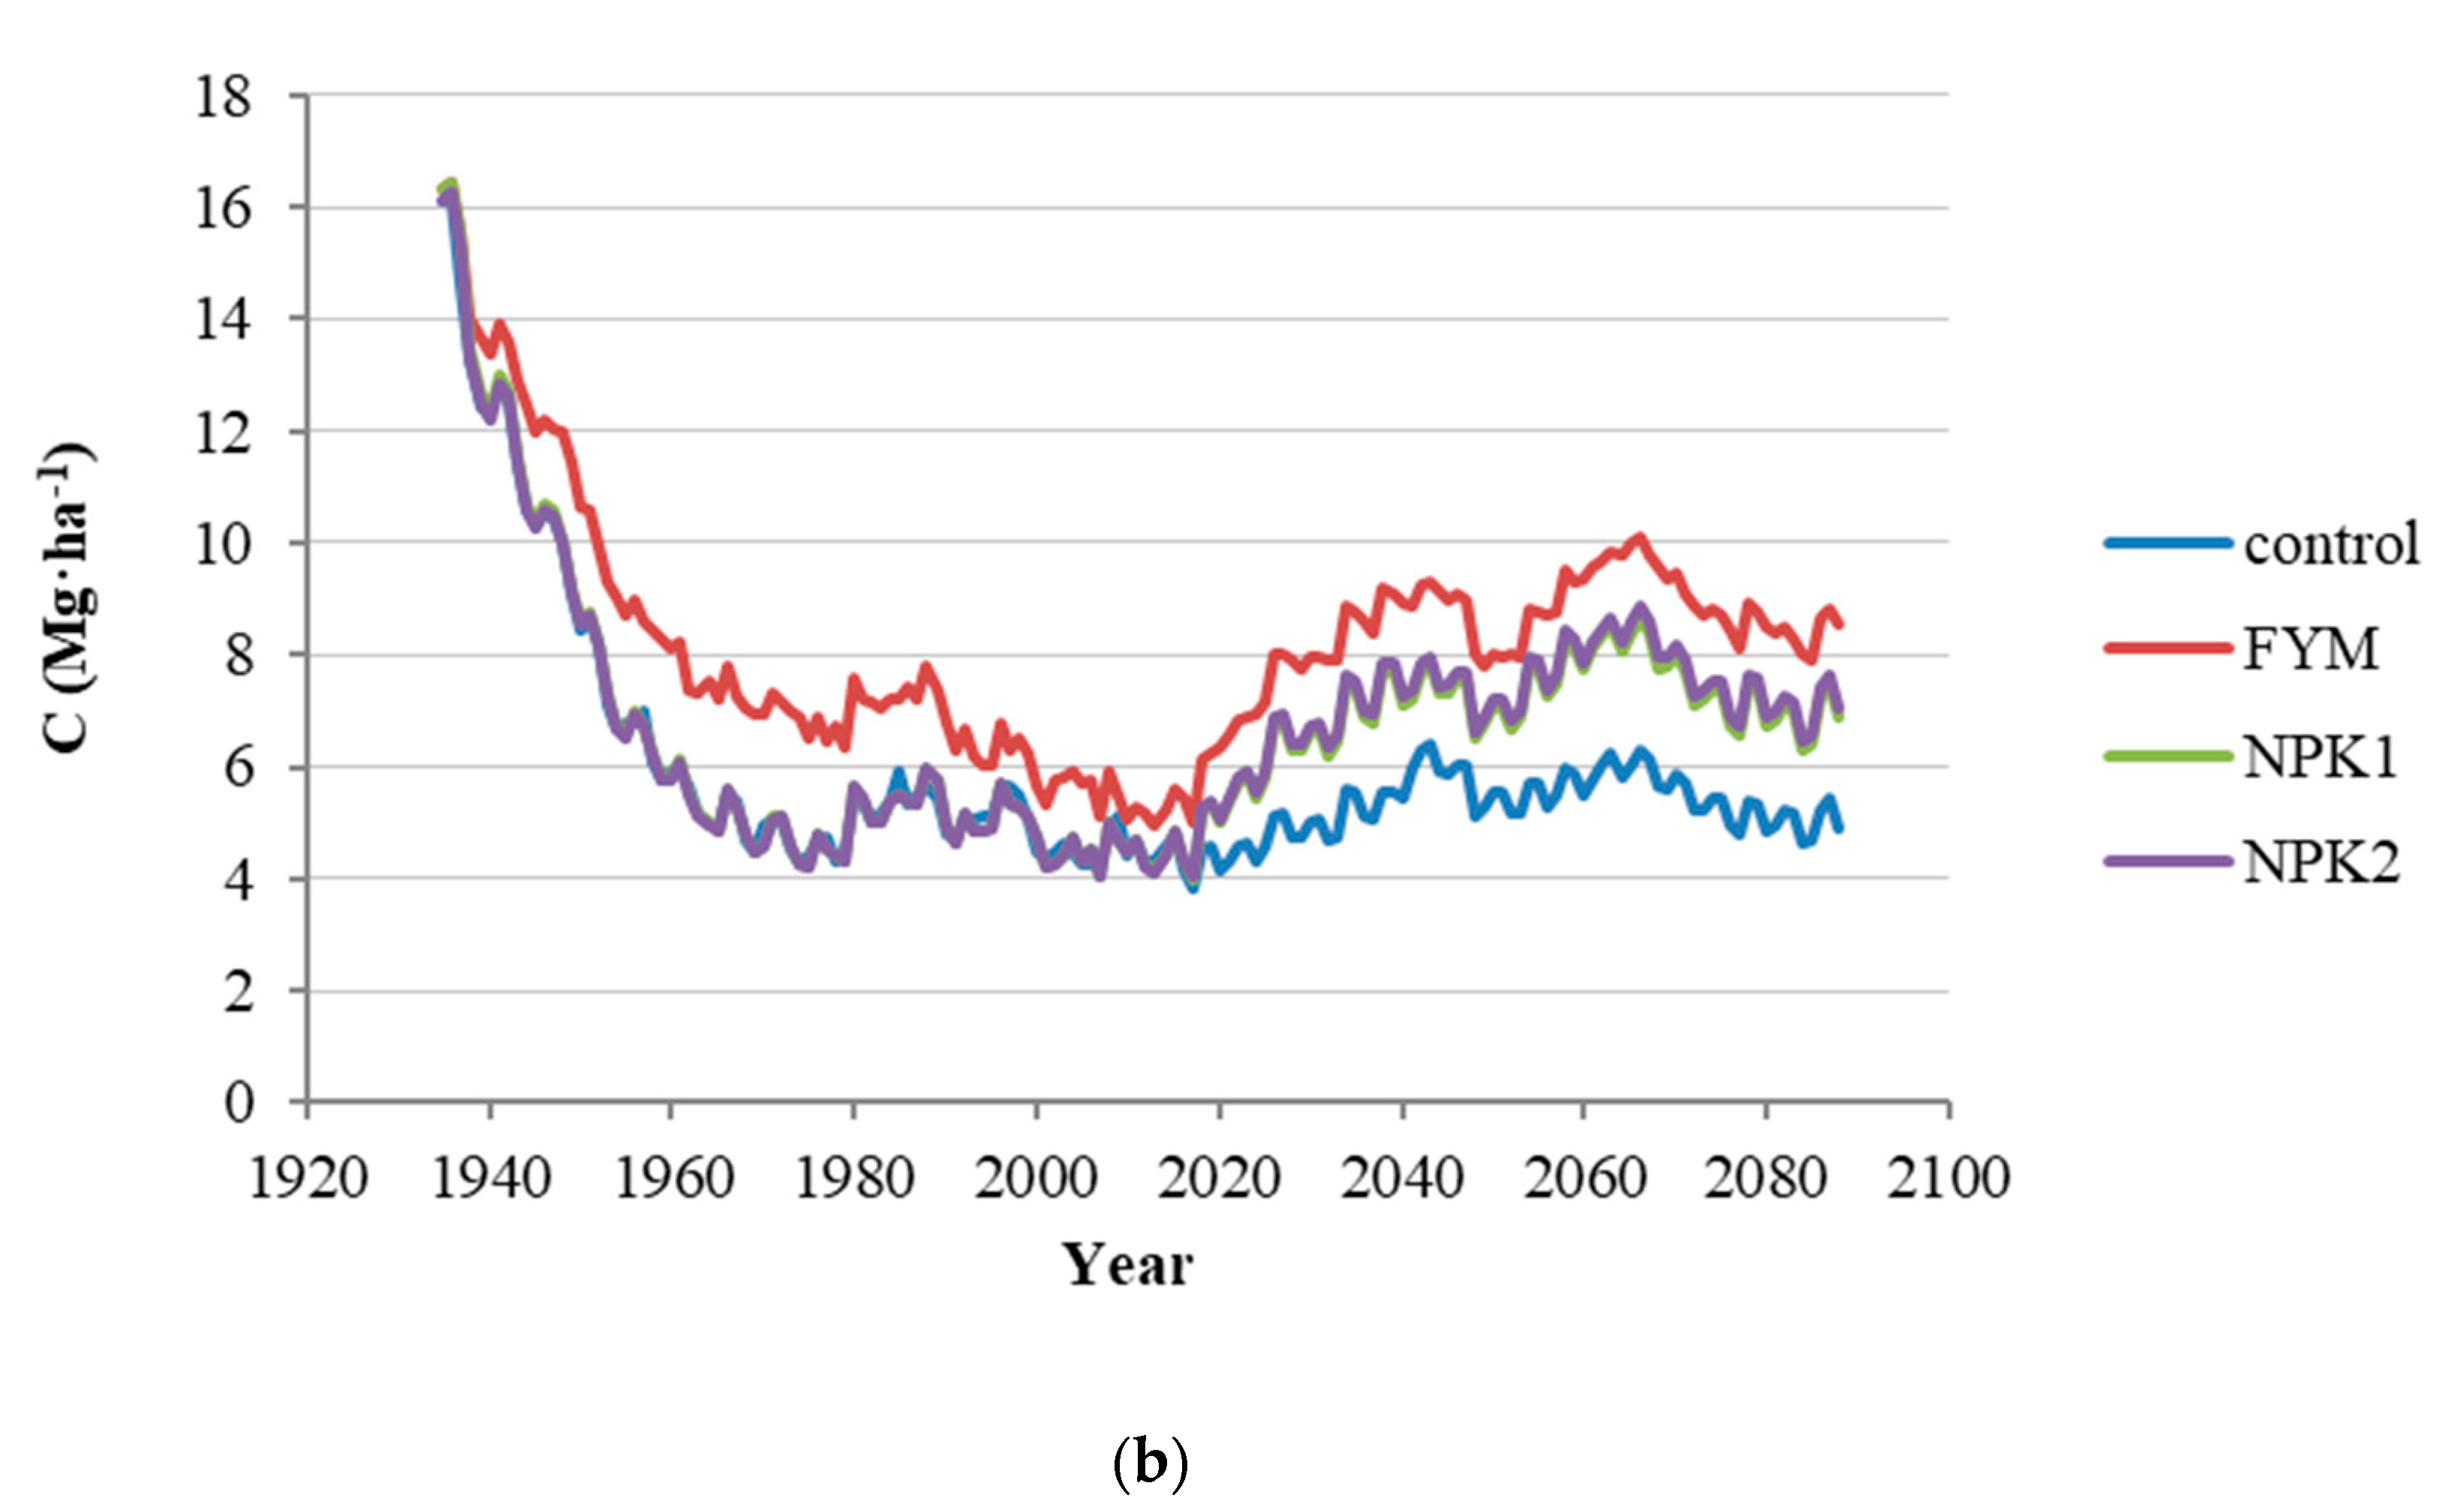
The analysis of the RPM and HUM pool dynamics shows that, during the experiment, as well as during the forecast period, in both experiments, a consistent increase of the C stocks also coincided with stabilization of organic C (Figure 3, Figure 4, Figure 5 and Figure 6). In the DAOS 3 experiment, the initial increase in the SOC stock was followed by some equalization in 1995–2011—during which, up to 4 to 5 Mg·ha−1 of the previously accumulated C was lost—and then new growth was predicted for both climate scenarios. As a result, the expected size of the HUM pool increased approximately two times in the organic–mineral fertilizer system, 1.7 times in the mineral system and 1.3 times in the control. For the RCP8.5 scenario, the absolute increase of this pool is expected to be approximately 2 Mg·ha−1 lower than for the RCP4.5 scenario.
The stabilization tendency of C is also quite revealing in the RPM pool dynamics, which characterizes the active C fraction. In the DAOS 3 experiment, almost all the losses of C stocks in the period 1995–2010 were associated with a decrease in the size of this pool. The forecast of C stock changes showed the possibility of this pool’s rapid growth—by 2.0–2.3 times over 2010–2040. At the same time, in the organic–mineral fertilizer system, such an increase for the RCP4.5 climate scenario allowed reaching the level of 1975–1995, when the stock of C in the RPM fraction was 8 Mg·ha−1, while, for the mineral fertilizer system, it remained at the level of 6 Mg·ha−1.

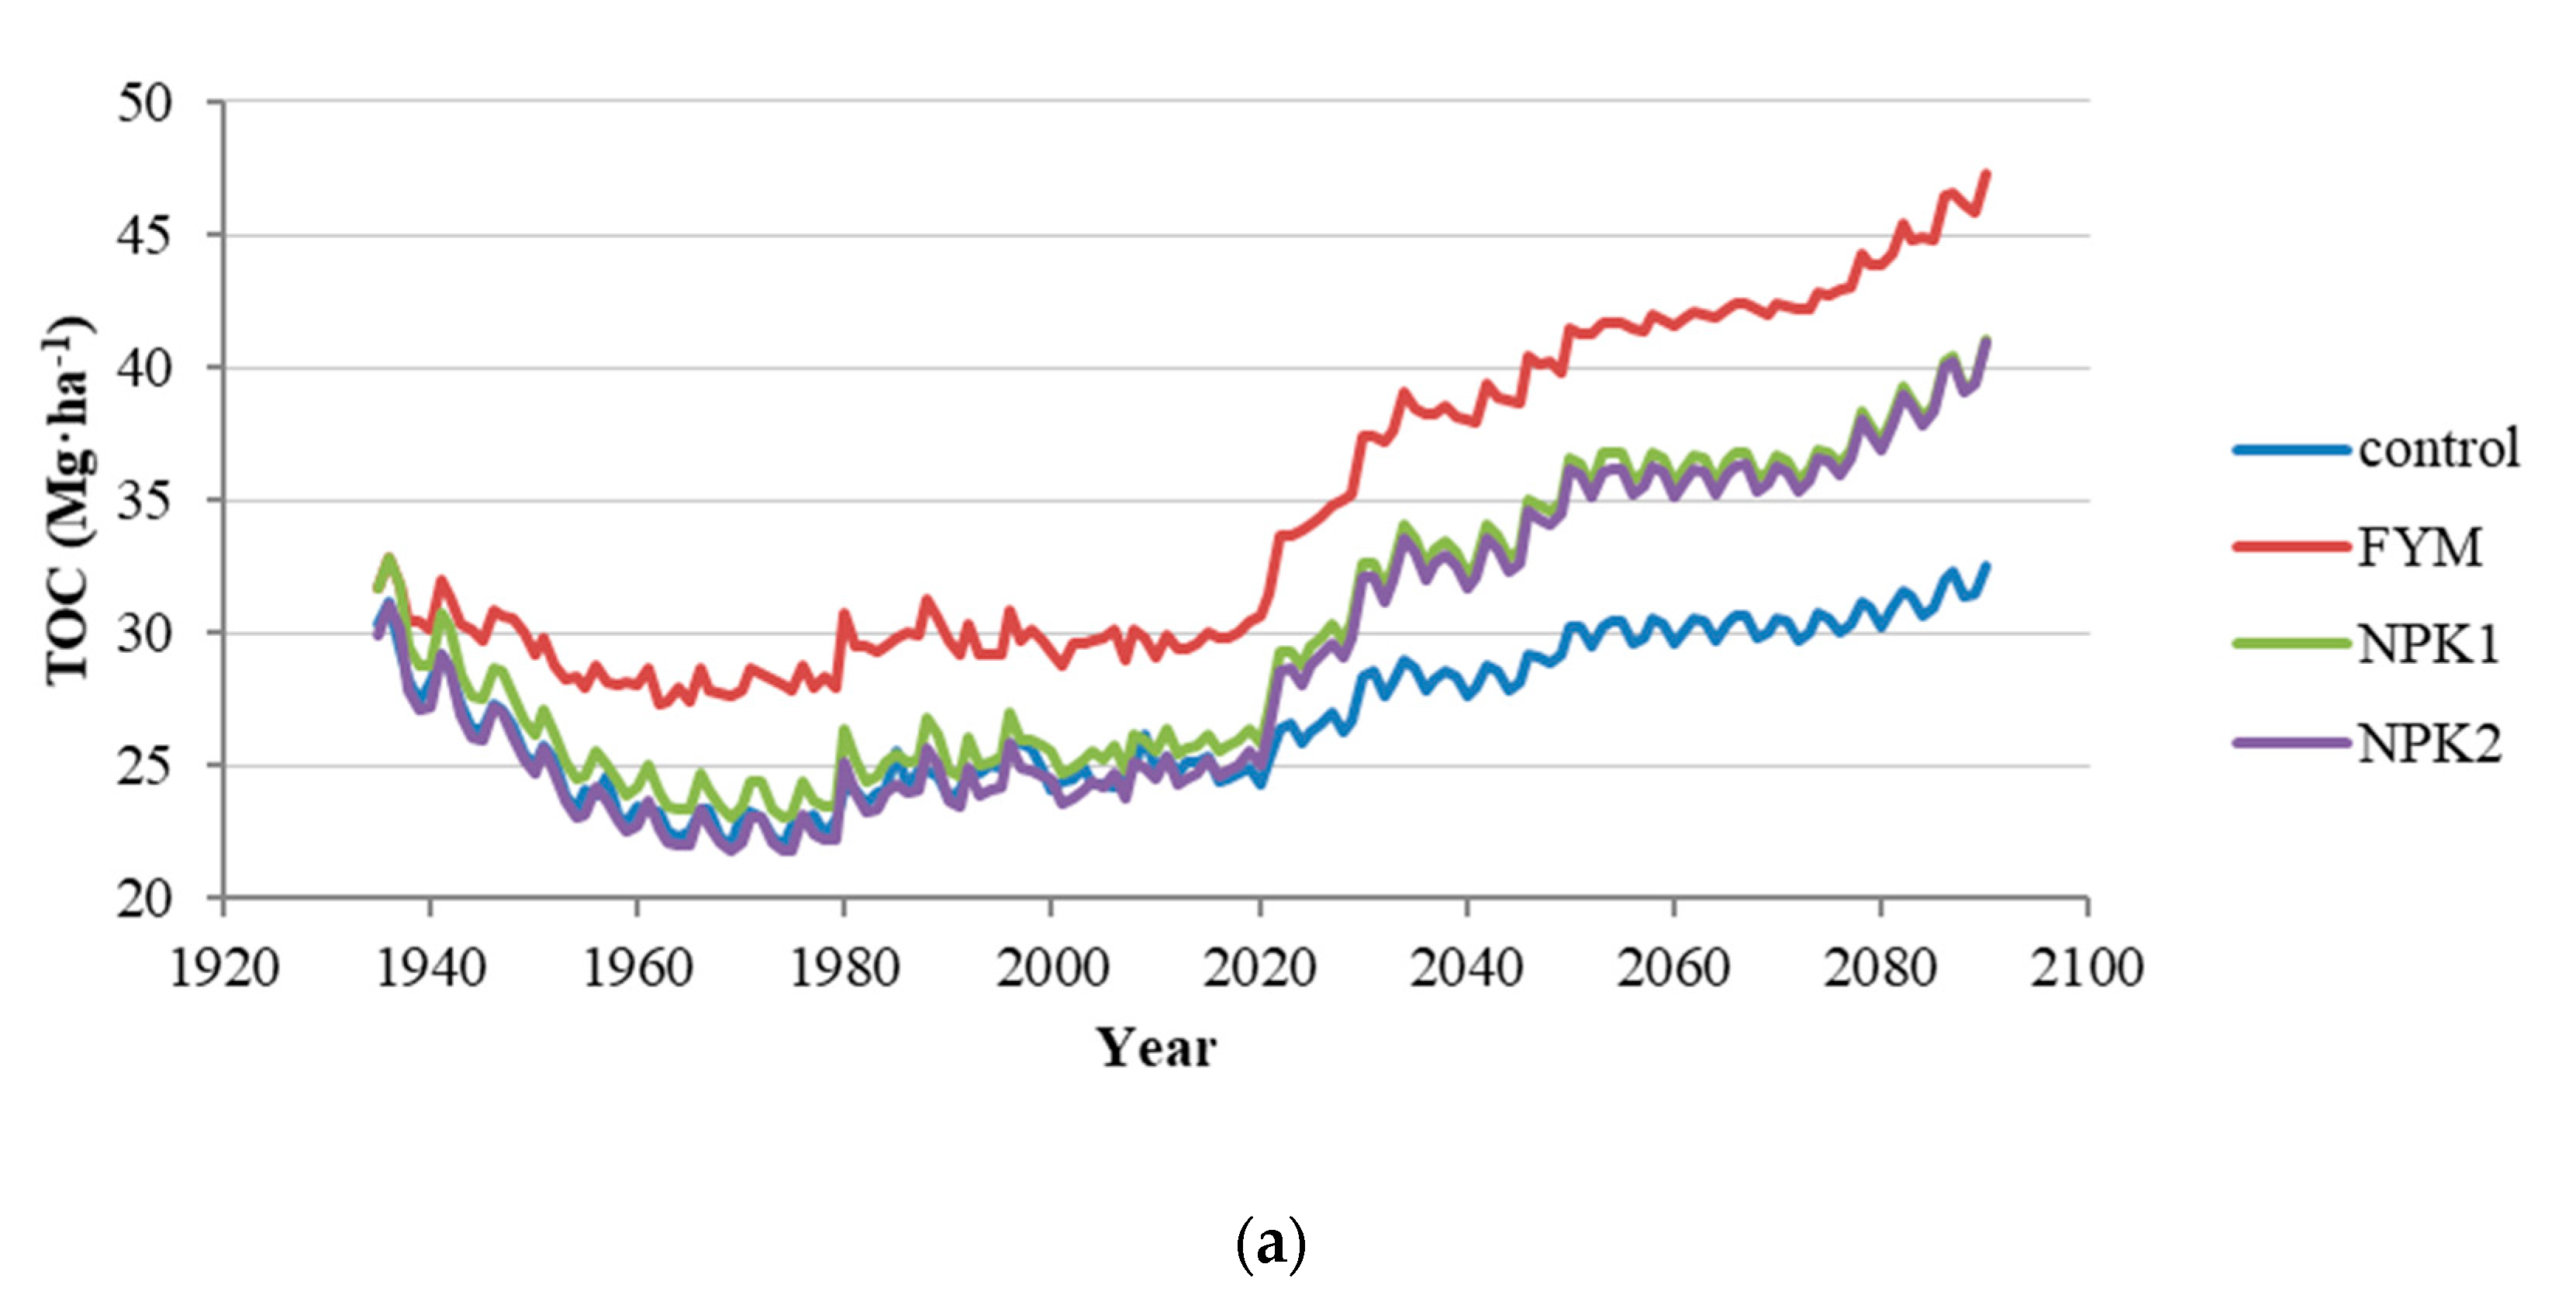
3.2. DAOS 4 Experiment

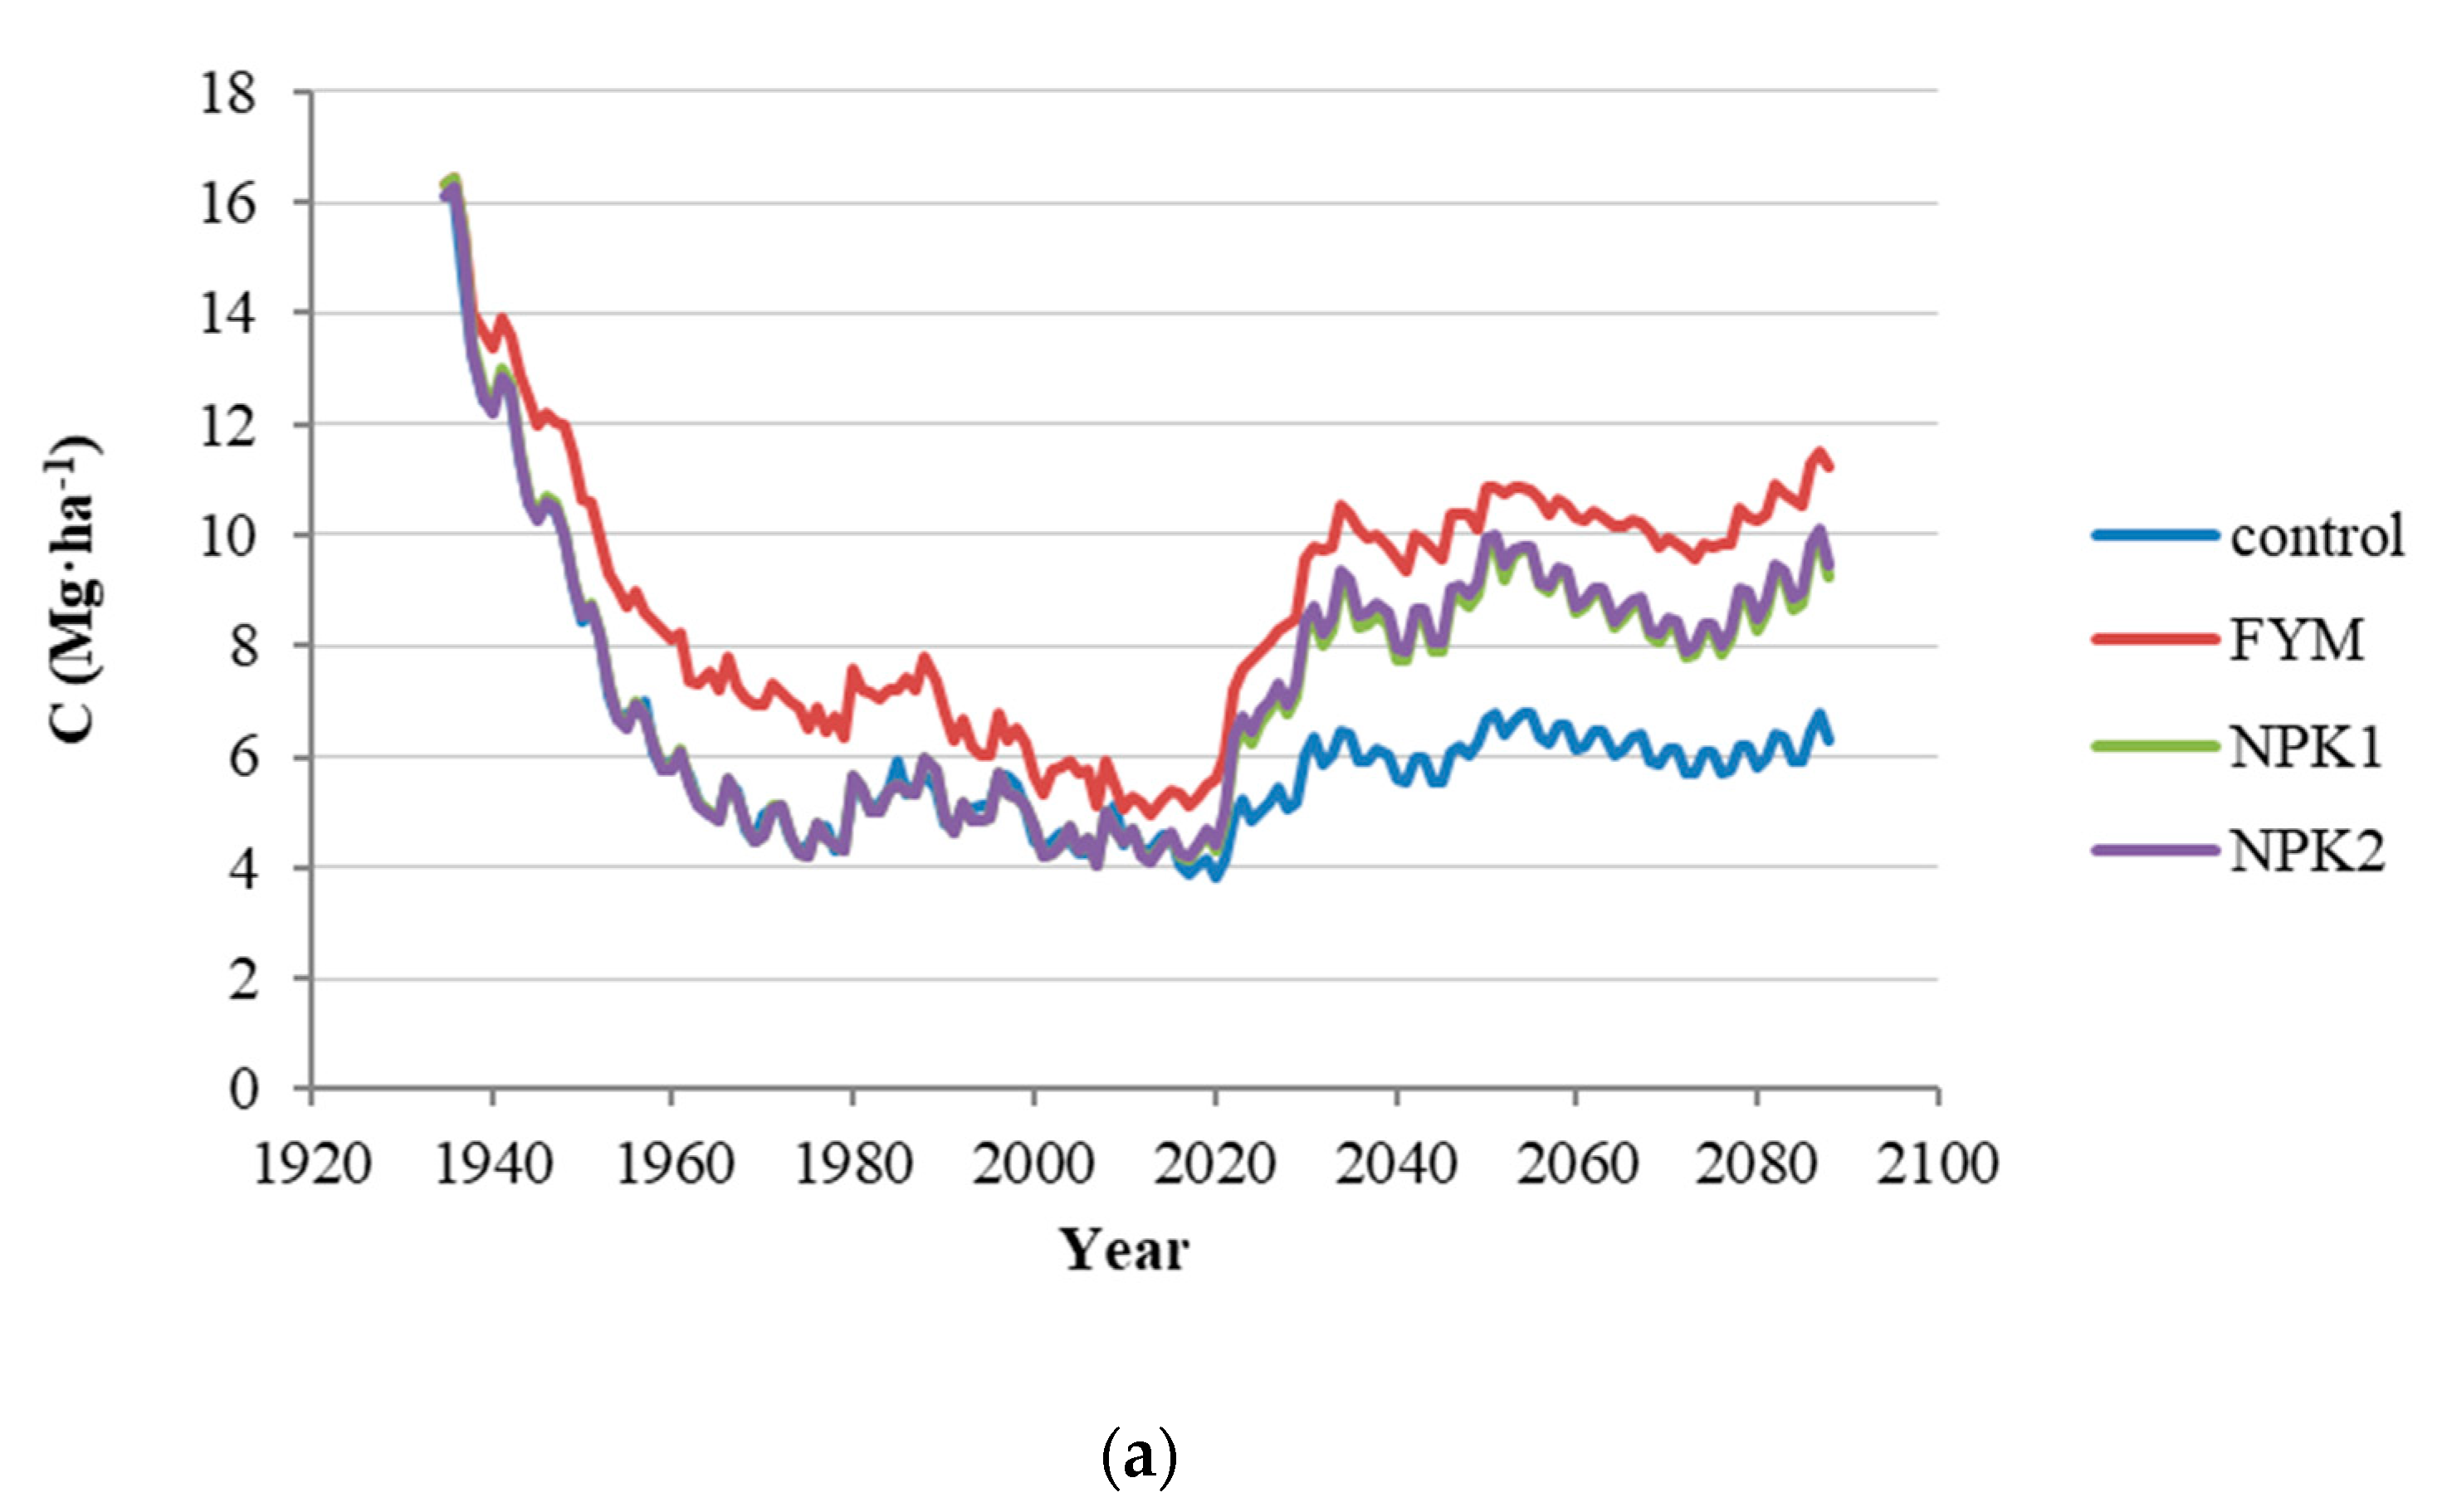
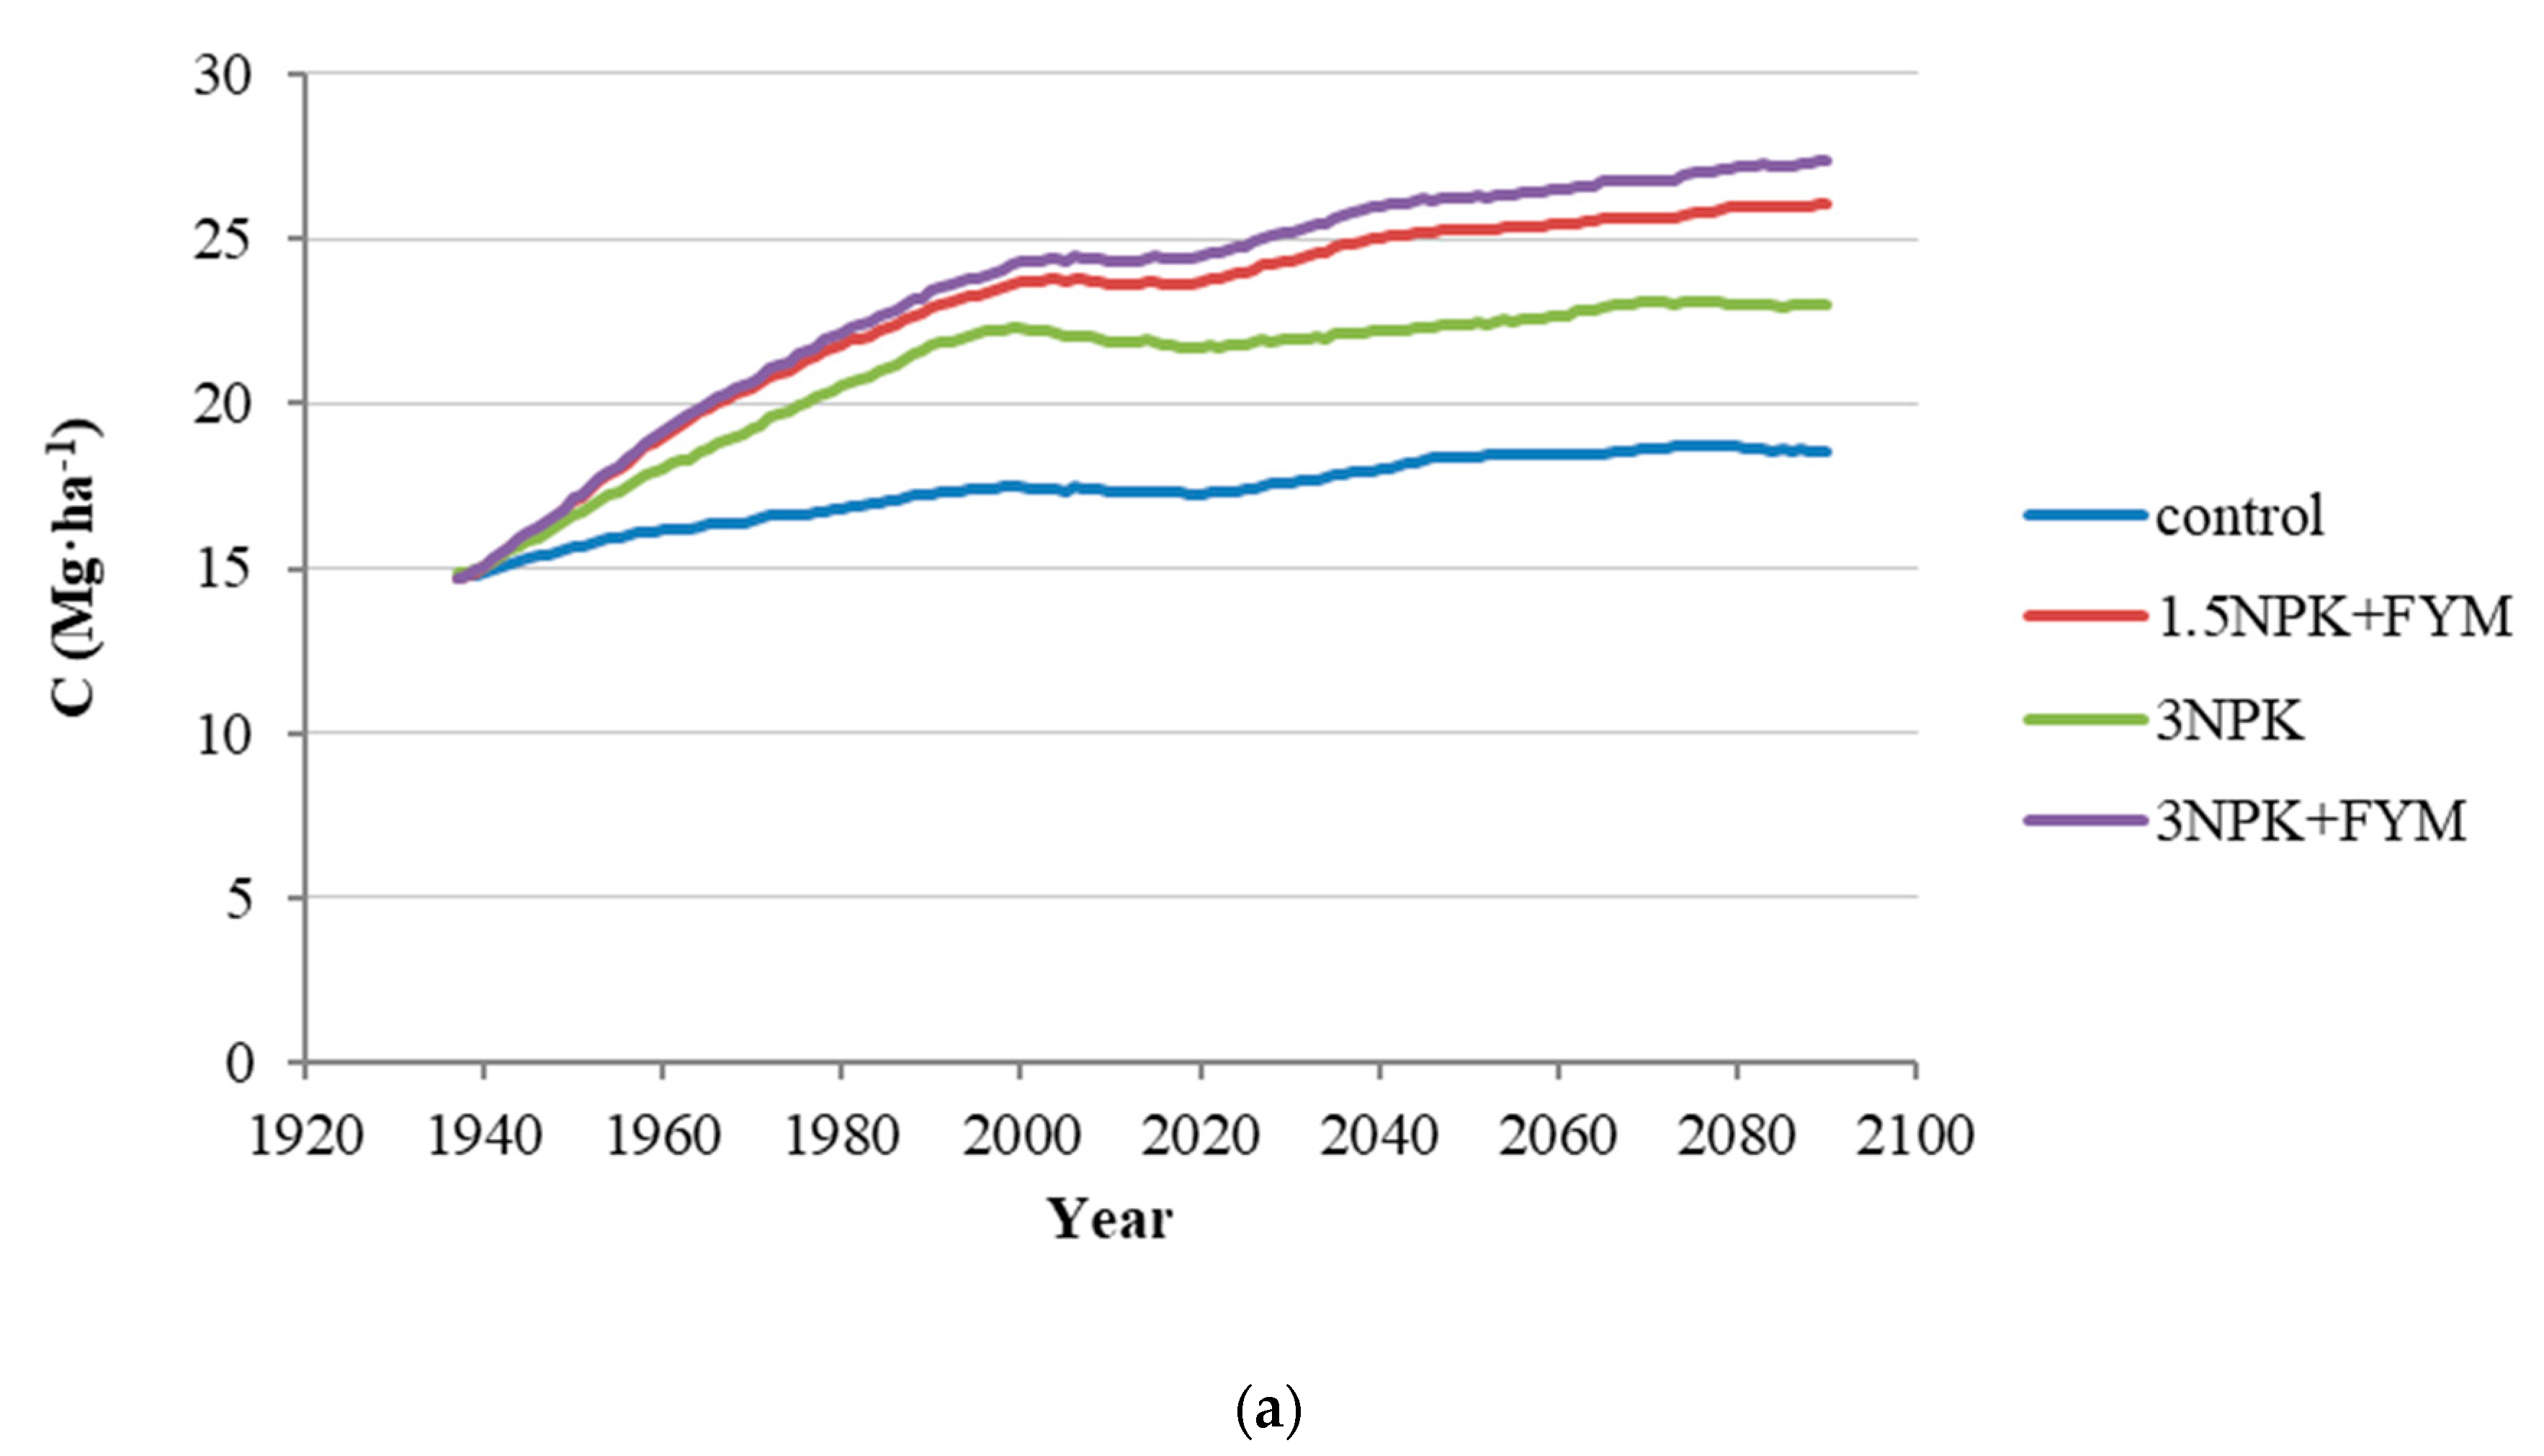
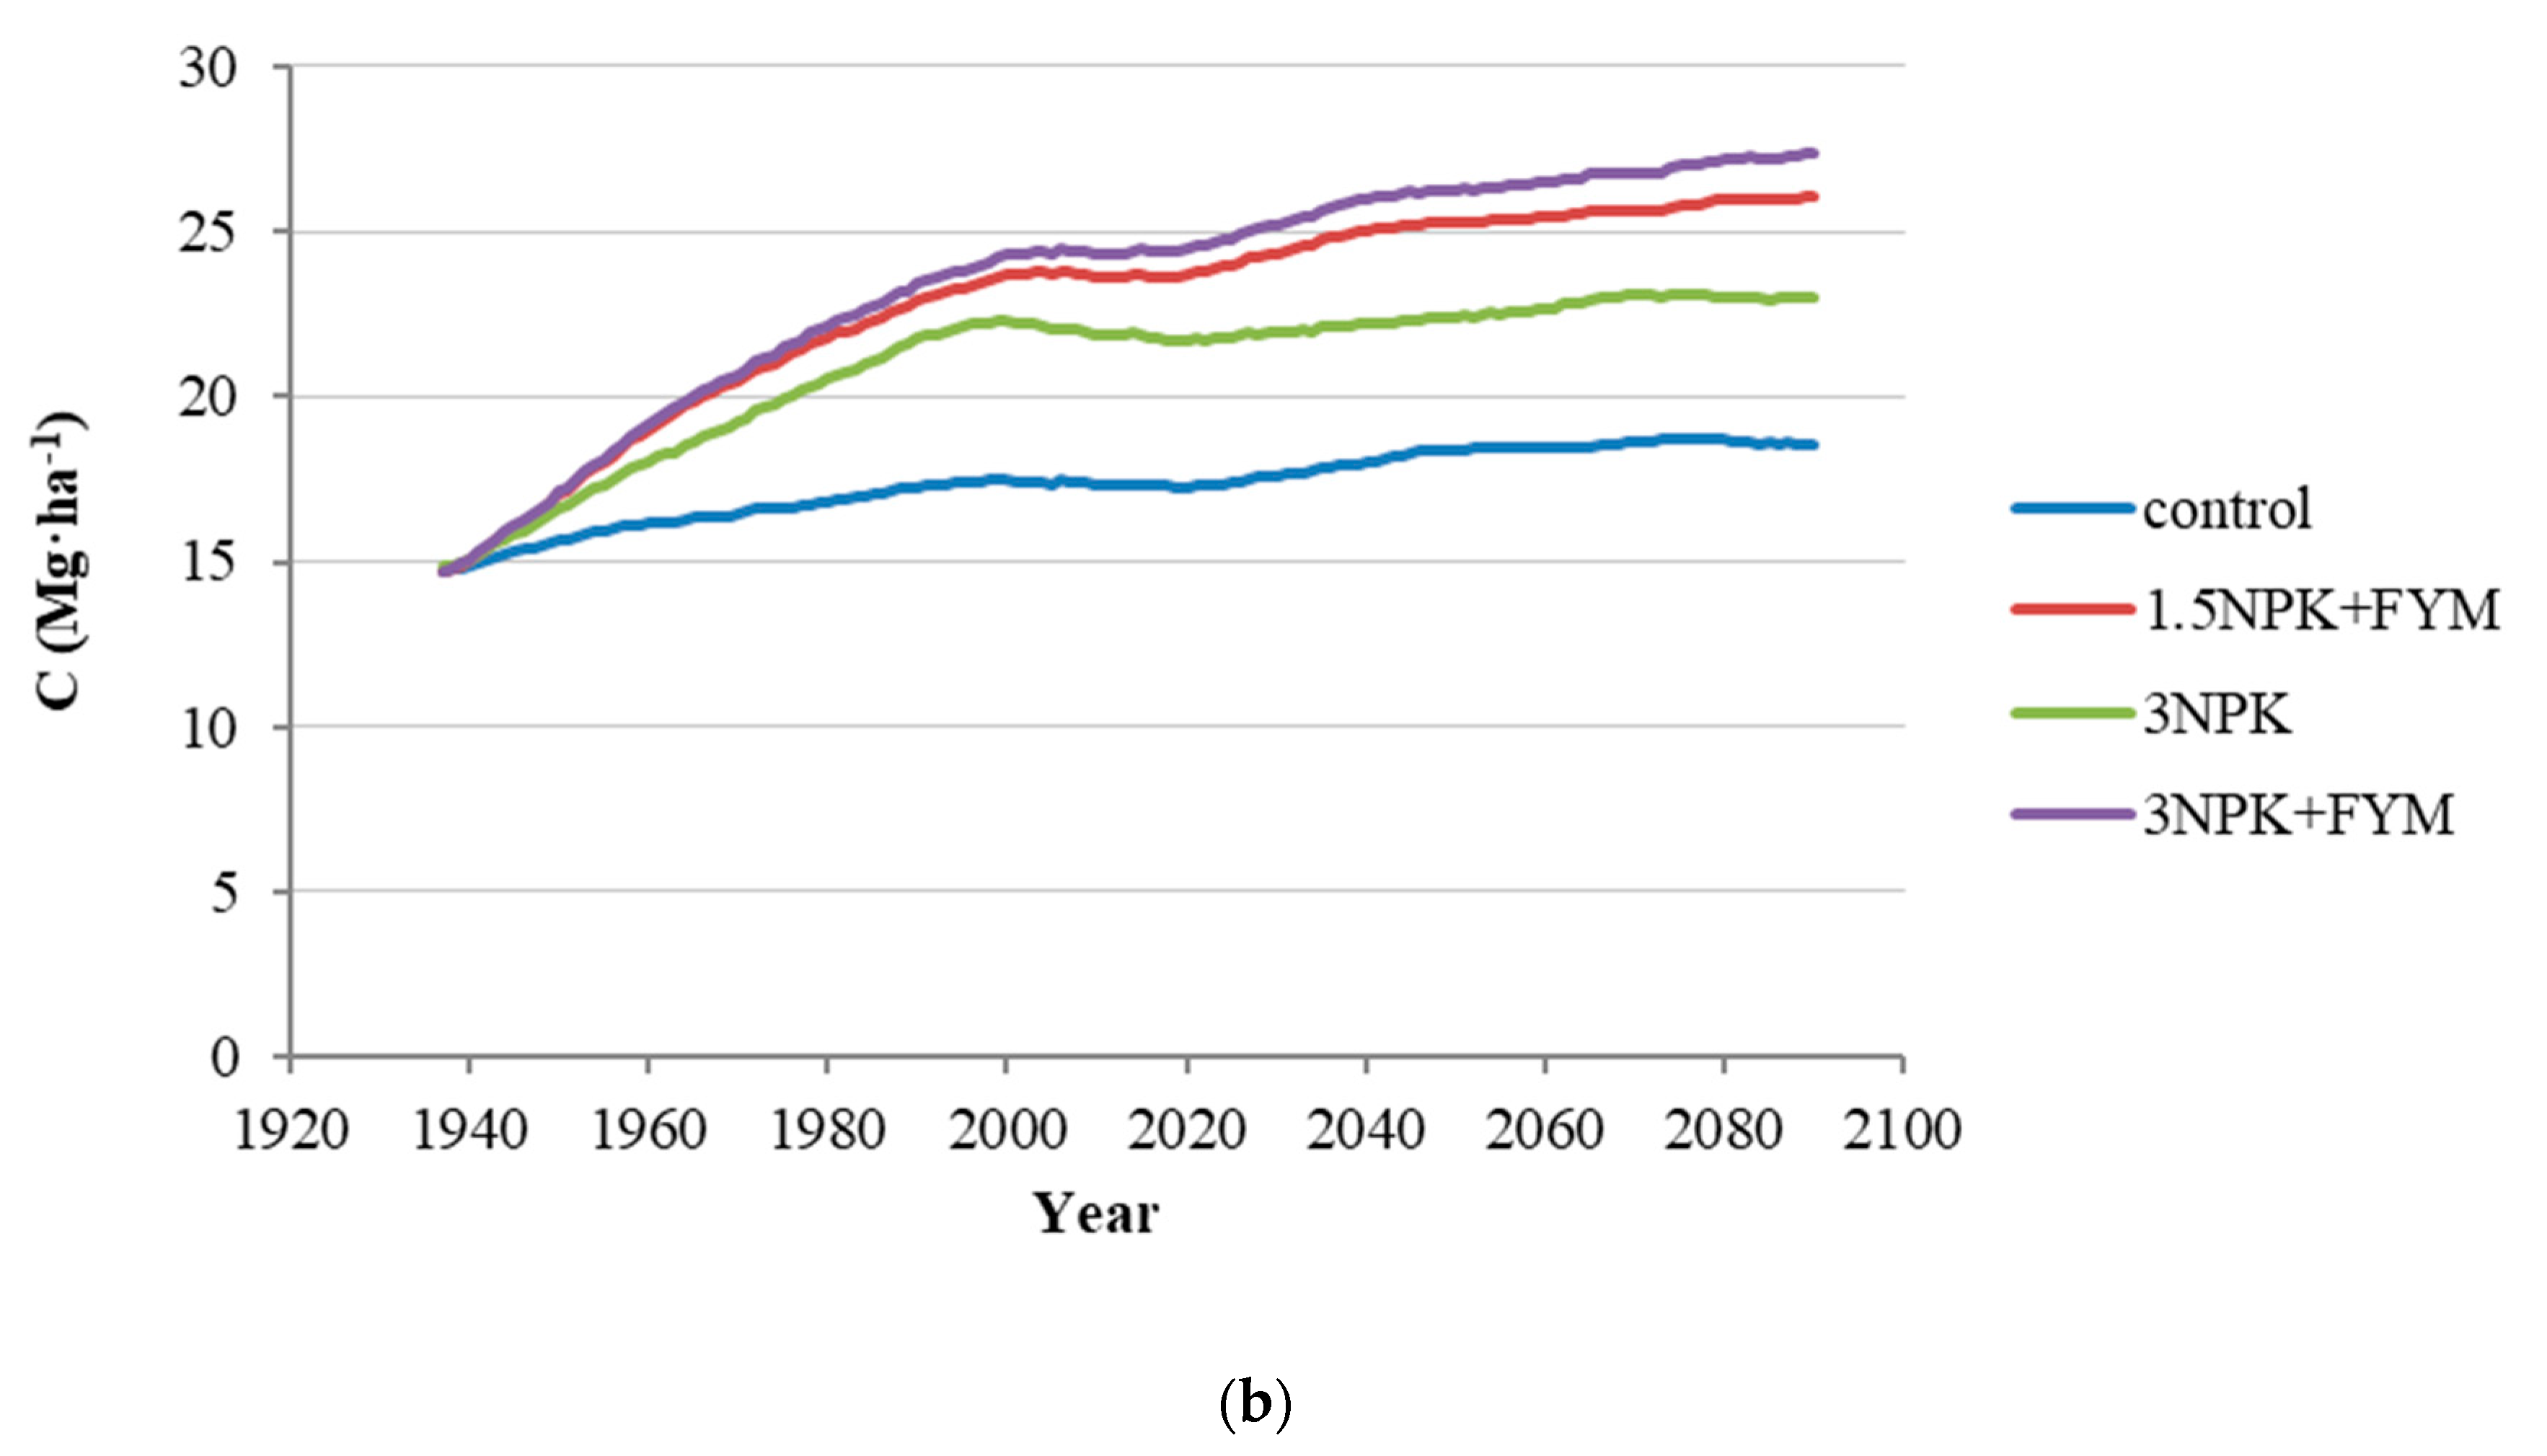
The forecast based on the DAOS 4 experiment shows similar trends for both climate scenarios, except for the last period (Figure 7). From 2020, all treatments of the RCP4.5 scenario experience an intensive increase in the soil C stocks until 2050. Further, there is a trend towards stabilization (mineral fertilizer system and control) or slight growth (organic system) until 2073–2075 and a new increase until 2090. In the control, all these periods are weakly expressed. The total expected increase in C stocks from 2020–2090 is 8–15 Mg·ha−1 in the RCP4.5 scenario and 5–11 Mg·ha−1 in the RCP8.5 scenario. This growth is two-to-three times higher than the increase in C stocks expected in the DAOS 3 experiment over the same period, with close initial C stocks to date.
The absolute stocks will stabilize in 2050–2079 at 36 and 34 Mg·ha−1 for the mineral fertilizer systems under the RCP4.5 and RCP8.5 scenarios, respectively. During the same period, the C stock in the organic fertilizer system will increase from 41 to 42 Mg·ha−1 and from 37 to 41 Mg·ha−1 for the same climate scenarios.
Under the RCP8.5 scenario of the experiment, an increase is observed until 2066. Further, there is a stable state in the control and a weak increase in the other treatments until the end of the modeling period. In the RCP4.5 scenario, a C accumulation of up to 47 Mg·ha−1 is also observed, while, in RCP8.5, the maximum value does not exceed 43 Mg·ha−1.
The highest rate of increase in the C content is observed in the first twenty years—2020–2040 (12‰ to 13‰) under the climate scenario RCP4.5 and 8‰ in the climate scenario RCP8.5. The increase was approximately equal for the organic and mineral fertilizer systems. The second period of maximum accumulation of C in 2080–2090 was characterized by the maximum growth rates of the annual C content of 10‰ to 11‰ and 9‰ for the RCP4.5 and RCP8.5 scenarios, respectively, while it was approximately 50% higher for the mineral fertilizer system. The comparison of predicted C inputs in 2020–2090 with the period 1935–2011 shows that the crop rotation’s expected productivity will increase under the considered climate scenarios. This increase for fertilizer treatments is 6% to 7% higher for RCP4.5 than RCP8.5 in 2040–90 and increases to 20% for the mineral fertilizer treatments in 2020–40. In the period 2060–80, with a relatively lower accumulation of C, ranging from 1% to 3%, the decrease in C inputs was, in most cases, less than 10%. It can be assumed that clover cultivation will allow for a more efficient use of climate resources in the DAOS 4 crop rotation compared to the crop rotation without grasses and the predominance of the row crops in the DAOS 3 experiment. In particular, this leads to a more significant increase in C stocks in favorable years and a relatively smaller drop in unfavorable ones. If the increased mineralization of organic C is compensated by a corresponding increase in plant residue biomass, the overall effect of climate change can be positive for fulfilling the conditions for the accumulation of C in arable soil. This result is consistent with the previously obtained conclusions about the prospects of the territory of Russia’s non-Chernozem zone for the accumulation of additional stocks of C in future climate conditions [27].
To maintain the C stocks for the entire simulated period, an average of 1.31–1.38 Mg·ha−1 must be applied annually, which is significantly less than that determined for the experimental period 1935–2011, when an average of 2.13 Mg·ha−1 was required. This result reflects the loss of approximately 15% of the initial SOC stock in the control treatment and with the mineral fertilizer system during the experimental period. However, in the case of the DAOS 3 experiment, it also indicates more favorable opportunities for sequestration with arable soil in the future climate than the current one.
In the DAOS 4 experiment, the increase in the HUM fraction in the total C pool occurs almost linearly, which leads to an increase in the absolute size of this pool by 1.5–2 times compared to the initial one. The expected increase in C in the 21st century will increase three times for the organic system, 2.5 times for the mineral system and more than twice for the control. In the DAOS 4 experiment, where the C stock in this pool is stabilized at 4–6 Mg·ha−1 by 1980–90, the increase under future climate conditions can reach two or more times the most significant increase occurring in the period 2020–40. In this experiment, the relatively large role of the active fraction of organic C in increasing or decreasing the C stocks growth rate is noticeable. It can be assumed that, with an increase in the absolute amount of sequestered carbon for this system, we get a relatively higher amount of C accumulated in the active fraction, which will be more susceptible to C loss processes under changing external conditions.
Since the “4 per 1000” initiative considers a layer of 0–40 cm, the absolute increase only in the upper horizon should be higher than 4‰. Based on the results of the long-term experiments at Rothamsted, it is proposed to use a value > 7‰ in the 0–23-cm layer as equivalent to 4‰ in the upper 40-cm layer [15]. In this case, it is clear that C accumulation in the future climate will occur but will remain below the standard indicators. It is only achieved in the experiment DAOS 4 in 2020–40 and 2080–90 when applying a mineral or organic fertilizer system for scenario RCP4.5 and the mineral fertilizer system in the last period for scenario RCP8.5.
In both experiments, a tendency was revealed that the gain is increased and losses are reduced in a series of organo–mineral fertilizer > organic fertilizer > mineral fertilizer > control. In DAOS 3, the treatments form the following series: 3NPK + FYM > 1.5NPK + FYM > 3NPK > control. In DAOS 4, manure > NPK1 > NPK2 > control.

4. Discussion

4.1. The Importance of the Land Use History

The simulation of SOC dynamics in the two adjacent fields of the same experimental station with the RothC model demonstrates the ability of Retisols to maintain or increase the current soil C stocks, even if the C input is less than 2.0 Mg·ha−1·year−1. This figure was discussed in a global meta-analysis of published data on the responses of the SOC to fertilizer managements in the 1741 field experiments of Han et al. [28]. Wang et al. [29] estimated with RothC the critical carbon input rate to maintain the current SOC level in Russia as 1.9 Mg·ha−1·year−1, with the current average and potential inputs 1.3 and 2.8 Mg·ha−1·year−1, respectively. Earlier, we demonstrated that, for long-term experiments on Chernozem soil, the average annual amount of C 1.9 Mg·ha−1·year−1 is sufficient to maintain an initial stock of 70 Mg·ha−1 in the arable soil layer. In contrast, for an initial stock of 89 Mg·ha−1, an annual C input level of 2.9 Mg·ha−1·year−1 will be necessary [30]. At the same time, for Retisols of different textures with an initial C stock 19–32 Mg·ha−1, a C input 1.5 Mg·ha−1·year−1 was needed, but the C input was estimated as high as 2.0 Mg·C·ha−1 ·year−1 for maintaining a sustainable C stock of 41–43 Mg·ha−1 [20]. The present results demonstrate that, for DAOS 3 with a 28.6–28.8 Mg·ha−1 initial C stock, an average current input of 1.39 Mg·ha−1·year−1 C was required, while, for DAOS 4 with a 30.3–32.4 Mg·ha−1 C stock at the beginning of the experiment, the average input needed to be 0.74 Mg·ha−1·year−1 or higher. This fact illustrates the higher C rates to keep higher soil C stocks but does not explain the required C input for the DAOS 4 field. For example, the calculated C input for the equilibrium model run was 0.83 to 0.84 Mg·ha−1·year−1 for DAOS 3 and, very close, 0.88–0.94 Mg·ha−1·year−1 for DAOS 4 at the beginning of both experiments. It reflects the necessity of requalifying the critical C input for developing site-specific management strategies of soil C sequestration with more detailed information on the temporal and spatial resolution [29].
We can assume that, in the case of the DAOS 3 and DAOS 4 fields, different land use histories had a strong effect on the SOC stock temporal dynamics. The DAOS 3 plot was used as an arable field for more than 200 years before the experimentation. In contrast, the DAOS 4 plot was clear-felled from the forest only in 1926 and, before the beginning of the experiment, was used as a test sowing field without any fertilization. The comparison of the RPM dynamics of the different treatments at DAOS 3 represents other steady-state conditions around an initial 8 Mg·ha−1 for the NPK treatment in the first 20 years after launching the experiment, the same level around 1960–90 for all fertilization plots, and loss of half the initial RPM pool at the control during the first 25 years of experimentation, with a steady-state of 4 Mg·ha−1 after this period (Figure 3). At the same time, the RPM pool was much higher at DAOS 4, and during the first 20 years, 10–12 Mg·ha−1 C was lost; after that, it was within 4–6 Mg·ha−1 for the control and mineral treatments and slightly more for the FUM treatment, with a slight loss trend until the current period (Figure 4). It demonstrates that the effect of land-use change, despite the initial period of about 25 years, can be traced in the long term. It made it impossible to achieve any C sequestration in DAOS 3 until the 1980s, when the C stock was as low as 24–31 Mg·ha−1. For the fertilization plots of DAOS 4 with a consistent gain of C, it was 5–8 Mg·ha−1 higher, even though the annual C input was 1.54–1.70 for DAOS 3 and 1.88–2.10 Mg·ha−1·year−1 for DAOS 4 (Figure 2 and Figure 7).
Eglin et al. [31] used the ORCHIDEE simulation results for determining the relative importance of land cover change on regional soil C stocks. They found that, in the former Soviet Union, forest clearing, which took place during the first half of the 20th century, impacted the SOC balance in the second half of the same century. This founding indicates that land cover change still affects the SOC stocks, unlike in Europe, where no significant change in the forest area occurred during the 20th century. These results are consistent with our data about the long-term effects of the previous land use (under natural forest vegetation) visible in different SOC dynamics in long-term field experiments. Morais et al. [32] simulated with the RothC model changes in the annual SOC stock in 2014–2100 (without a climate change effect) globally for all land use classes. They demonstrated that the conversion of forest to cropland generally results in SOC loss, and SOC loss is typically faster than SOC recovery. For DAOS 4, the SOC gain to reach the initial C level was expected to take 60 years for mineral fertilization plots and about 50 years for FYM fertilization. In contrast, losses take place mainly in the initial 25-year period (Figure 7). Koso et al. [33] and Skalsky et al. [34] found that the application of RothC for modeling SOC stock in 1970–2020 for different regions of Slovakia would require detailed information on where the land cover changes occurred both in space and time, as it had a strong effect on the SOC stock temporal dynamics. However, in a study of the spatial evolution of topsoil SOC driven by climate change and land use change for France up to the year 2100, Meersmans et al. [35] concluded that climate change would have a much more significant influence on future SOC losses in mid-latitude mineral soils than land use change dynamics.

4.2. The Effect of Crop Rotation

For the Moscow region, with the abundance of Retisols, mainly in loam and heavy loam sediments, traditional rotations include alternations of spring (barley and oats) and winter (primarily wheat) cereals; row crops (potatoes, fodder beet and silage corn) and perennial grass [24]. In this paper, the sustainability of intensive management technologies under future climate conditions was discussed, and the comparatively more significant effects of changes in the crop rotation system than FYM rates changes in the additional C sequestration. Our data for RCP4.5 and RCP8.5 also demonstrate the importance of perennial grass in the crop rotation structure. Under future climate conditions, with a calculated smaller than necessary C annual input for DAOS 3 and significantly less for DAOS 4, the highest gain of C is expected for NPK treatments of the DAOS 4 experiment, which are 2 to 2.5 times higher than in DAOS 3 (Table 2). This fact corresponds with the potential effective management of SOC stocks on Retisols with alternating cereals and row crops but, also, a much higher effect on fodder crop rotations with grasses. Interestingly, the FYM treatment of DAOS 4 has average C inputs 0.3–0.5-Mg·ha−1·year higher than C inputs of the NPK treatments, but the latter more frequently demonstrate a higher C gain (Table 2). This contradiction can be attributed to a 5-Mg·ha−1 smaller C stock in the 1980s last century in the NPK compared with the FYM treatment, indicating a more rapid C gain in C-depleted arable soil.
Based on the metadata paper of Han et al. [28], with the potential C increase in arable topsoil by 1.7 and 3.4 g∙kg−1 for mineral and organic–mineral fertilization, respectively, our TOC stocks before 2100 are within this range. The additional C gain under FYM fertilization for DAOS 3 in a future climate was 5–7 Mg·ha−1, more pronounced under the RCP4.5 scenario. The application of three rates of NPK in the FYM background is expected to have a small additional effect on the C sequestration in comparison with the NPK1.5 rate. For DAOS 4, only FYM fertilization is expected to provide 7 to 8-Mg·ha−1 further accumulation when applied at NPK equivalent rates for both future climate scenarios so that we can expect an even higher C accumulation under organic–mineral fertilization. DAOS 4 under the future climate demonstrates a constant SOC gain with the varying growth rates. The duration of the C gain is 60–70 years for both mineral and organic fertilization treatments.
In contrast, DAOS 3 demonstrates an average increase of C stock for all fertilization treatments over 155 years but with alternating periods of gain and loss. These changes are connected with comparatively more or less favorable climate conditions, which affect the crop yield, C input and, in the end, change the C stocks. It is easier to maintain a C accumulation when a perennial grass field is present in the crop rotation, as in experiment DAOS 4. Han et al. [28] estimated the duration of C sequestration in a cool, temperate climate as 72–117 years under the organic–mineral system and 46–73 years for mineral fertilization with the straw addition. Our data demonstrate that the period of C sequestration in Retisols exceeds 100 years for organic and mineral fertilization, which stresses the study region’s importance in future C sequestration by arable soil.
The simulation results demonstrate the vital role of crop rotation selection as a measure of adaptation to climate change. In particular, grass cultivation allows for a more efficient use of the climate resources compared to crop rotation, which reflects an increase in the intensification of agricultural production, with a focus on the cultivation of only row crops and cereals. The use of grasses leads to a more considerable increase in C stocks in favorable years and a relatively smaller drop in unfavorable ones.

5. Conclusions

If a perennial grass field is present in a crop rotation, it allows a more efficient use of the climate resources, with a more significant increase in C stocks in favorable years and a relatively smaller drop in unfavorable ones. This result was not evident during the experimentation, even though both LTEs had close initial and current SOC stocks and a crop rotation with clover provided 30–70% higher current C input. This fact can be attributed to the different land use histories of the plots. One of the fields, which was clear-felled from a forest shortly before launching the LTE, will lose 50–70% of one of the C active pools before reaching a new near steady-state condition in the next 50 years. This effect was difficult to estimate based on the total SOC dynamics but was captured by the RothC model.
On the other hand, a progressive SOC gain reveals the role of the active C fractions, which will be relatively more susceptible to SOM decomposition processes because of climate changes that accelerate the mineralization of previously accumulated C stocks compared to stable fractions of soil humus. As a result, the previously accumulated C is subjected to a rapid loss if the increased mineralization is not compensated by a corresponding increase in the plant residue biomass. The simulation shows that, with a C accumulation in arable soil, its stocks’ long-term management becomes an increasingly difficult practical task. In this respect, a higher content of stable humified SOM fractions associated with a longer duration of cultivation favors soil C’s resistivity to mineralization under a warmer climate, even if the total SOC stock was the same in two fields with different management histories. Including grasses in the crop rotation increases the resistivity of the SOM to mineralization processes. For both climate scenarios, the most favorable period for the accumulation of C is 2020–40, and organic–mineral or organic fertilizer systems would allow a partial compensation of the expected instability of crop yields under the future climate through adding C with organic fertilizers.
Besides, two more results that are important follow from our work. First, it demonstrated that the C input estimates the uncertainty for maintaining SOC stocks, obtained in regional assessments. This uncertainty is mainly due to the critical C input, which demonstrates a high spatial and temporal variability with the long-term effect of land-use history. We showed that, even if the total SOC stocks are similar, the efficiency of their management may differ significantly, reflecting the different qualitative compositions of organic C under site-specific crop rotation.
The results of SOC stock modeling under the future climate show the prospects for using the non-Chernozem zone as an area where a significant sequestration of C in arable soils may be achieved over several decades, provided that the crop rotation productivity remains at a level corresponding to the current farming systems. The latter can be reached with the choice of proper fertilization practices. With an opportunity to conduct a similar study for Geonet LTEs of Russia, it would be a good time to connect the experimental data for a variety of soil and climatic conditions across the country’s vast area with climate projections based on dynamic C modeling.

Author Contributions

Conceptualization, P.K. and V.R.; methodology and software, V.R.; investigation, N.S., V.P. and S.S.; data curation, K.P.; writing—original draft preparation, K.P.; writing—review and editing, P.K. and V.R.; visualization, K.P. and supervision, project administration and funding acquisition, P.K. All authors have read and agreed to the published version of the manuscript.

Funding

The research was a part of the activities of the Horizon 2020 project Coordination of International Research Cooperation on soil CArbon Sequestration in Agriculture (CIRCASA). Financial support for this research was obtained from the project “Management of atmospheric carbon sequestration in arable soils of Russia” of the Federal Task Program “Research and development in priority areas of development of Russia’s scientific and technological complex for 2014–2020”, with the unique project identifier RFMEFI61618X0105.

Data Availability Statement

3rd Party Data.

Acknowledgments

This research was performed according to the Development program of the Interdisciplinary Scientific and Educational School of M.V.Lomonosov Moscow State University «The future of the planet and global environmental change».

Conflicts of Interest

The authors declare no conflict of interest. The funders had no role in the design of the study; in the collection, analyses or interpretation of data; in the writing of the manuscript or in the decision to publish the results.

References

  1. Paustian, K.; Lehmann, J.; Ogle, S.; Reay, D.; Robertson, G.P.; Smith, P. Climate-smart soils. Nature 2016, 532, 49–57. [Google Scholar] [CrossRef] [Green Version]
  2. Rumpel, C. Soils linked to climate change. Nature 2019, 572, 442–443. [Google Scholar] [CrossRef]
  3. Soussana, J.F.; Lutfalla, S.; Ehrhardt, F.; Rosenstock, T.; Lamanna, C.; Havlík, P.; Richards, M.; Wollenberg, E.; Chotte, J.-L.; Torquebiau, E.; et al. Matching policy and science: Rationale for the ‘4 per 1000-soils for food security and climate’ initiative. Soil Tillage Res. 2019, 188, 3–15. [Google Scholar] [CrossRef]
  4. Vermeulen, S.; Bossio, D.; Lehmann, J.; Luu, P.; Paustian, K.; Webb, C.; Augé, F.; Bacudo, E.; Baedeker, T.; Havemann, T.; et al. A global agenda for collective action on soil carbon. Nat. Sustain. 2019, 2, 2–4. [Google Scholar] [CrossRef]
  5. Qin, Z.; Huang, Y.; Zhuang, Q. Soil organic carbon sequestration potential of cropland in China. Glob. Biogeochem. Cycles 2013, 27, 711–722. [Google Scholar] [CrossRef]
  6. Lugato, E.; Bampa, F.; Panagos, P.; Montanarella, L.; Jones, A. Potential carbon sequestration of European arable soils estimated by modelling a comprehensive set of management practices. Glob. Chang. Biol. 2014, 20, 3557–3567. [Google Scholar] [CrossRef] [Green Version]
  7. Stockmann, U.; Adams, M.A.; Crawford, J.W.; Field, D.J.; Henakaarchchi, N.; Jenkins, M.; Minasny, B.; McBratney, A.B.; Courcelles, V.D.R.D.; Singh, K.; et al. The knowns, known unknowns and unknowns of sequestration of soil organic carbon. Agric. Ecosyst. Environ. 2013, 164, 80–99. [Google Scholar] [CrossRef]
  8. Valkama, E.; Kunypiyaeva, G.; Zhapayev, R.; Karabayev, M.; Zhusupbekov, E.; Perego, A.; Schillaci, C.; Sacco, D.; Moretti, B.; Grignani, C.; et al. Can conservation agriculture increase soil carbon sequestration? A modelling approach. Geoderma 2020, 369, 114298. [Google Scholar] [CrossRef]
  9. Prokopyeva, K.O.; Romanenkov, V.A.; Sidorenkova, N.K.; Krasilnikov, P.V. Soil organic carbon sequestration according to two Geoset long-term field experiments in the Moscow region. In E3S Web of Conferences; EDP Sciences: London, UK, 2020; Volume 176. [Google Scholar] [CrossRef]
  10. Romanenkov, V.A.; Shevtsova, L.K.; Rukhovich, O.V.; Belichenko, M.V. Geographical network: Legacy of the Soviet era long-term field experiments in Russian agriculture. In Long-Term Farming Systems Research Ensuring Food Security in Changing Scenarios; Academic Press: London, UK, 2020; pp. 147–166. [Google Scholar] [CrossRef]
  11. Pryanishnikov, D.N. The Centenary of Rothamsted. Pochvovedenie 1943, 9–10, 77–92. (In Russian) [Google Scholar]
  12. Tyurin, I.V. Soil Organic Matter and Its Role in Pedogenesis and Soil Productivity. Study of Soil Humus; Seľskozgiz: Moskva, Russia, 1937; 322p. (In Russian) [Google Scholar]
  13. Vijayakumar, S.; Bazrgar, A.B.; Coleman, B.; Gordon, A.; Voroney, P.; Thevathasan, N. Carbon stocks in riparian buffer systems at sites differing in soil texture, vegetation type and age compared to adjacent agricultural fields in southern Ontario, Canada. Agric. Ecosyst. Environ. 2020, 304, 107149. [Google Scholar] [CrossRef]
  14. Khlystovsky, A.D. Soil Fertility with Long-Term Use of Fertilizers and Lime; Nauka Publ.: Moscow, Russia, 1992; 192p. (In Russian) [Google Scholar]
  15. Coleman, K.; Jenkinson, D.S. RothC -26.3–a model for the turnover of carbon in soil, evaluation of soil organic matter models using existing long-term datasets. In Proceedings of the NATO Advanced Research Workshop; NATO ASI Series I; Springer: Berlin, Germany, 1996; Volume 38, pp. 237–246. [Google Scholar]
  16. Ivanov, N.N. World Potential Evaporation Map; Hydrometeoizdat: Leningrad, Russia, 1957; pp. 1–12. (In Russian) [Google Scholar]
  17. Franko, U.; Schramm, G.; Rodionova, V.; Körschens, M.; Smith, P.; Coleman, K.; Romanenkov, V.; Shevtsova, L. EuroSOMNET—A database for long-term experiments on soil organic matter in Europe. Comput. Electron. Agric. 2002, 33, 233–239. [Google Scholar] [CrossRef]
  18. Smith, J.U.; Smith, P.; Addiscott, T. Quantitative methods to evaluate and compare soil organic matter (SOM) models. In Proceedings of the NATO Advanced Research Workshop; NATO ASI Series I; Springer: Berlin, Germany, 1996; Volume 38, pp. 181–200. [Google Scholar]
  19. Smith, P.; Smith, J.U.; Powlson, D.S.; McGill, W.B.; Arah, J.R.M.; Chertov, O.G.; Coleman, K.; Franko, U.; Frolking, S.; Jenkinson, D.S.; et al. A comparison of the performance of nine soil organic matter models using datasets from seven long-term experiments. Geoderma 1997, 81, 153–225. [Google Scholar] [CrossRef]
  20. Romanenkov, V.; Belichenko, M.; Petrova, A.; Raskatova, T.; Jahn, G.; Krasilnikov, P. Soil organic carbon dynamics in long-term experiments with mineral and organic fertilizers in Russia. Geoderma Reg. 2019, 17, e00221. [Google Scholar] [CrossRef]
  21. Falloon, P.; Smith, P.; Coleman, K.; Marshall, S. Estimating the size of the inert organic matter pool from total soil organic carbon content for use in the Rothamsted carbon model. Soil Biol. Biochem. 1998, 30, 1207–1211. [Google Scholar] [CrossRef]
  22. IPCC. Climate Change 2014: Synthesis Report. Contribution of Working Groups I, II and III to the Fifth Assessment Report of the Intergovernmental Panel on Climate Change; Core Writing Team, Pachauri, R.K., Meyer, L.A., Eds.; IPCC: Geneva, Switzerland, 2014; 151p. [Google Scholar]
  23. Second Roshydromet Assessment Report on Climate Change and Its Consequences in the Russian Federation. General Summary; Roshydromet: Moscow, Russia, 2014; 54p, Available online: http://cc.voeikovmgo.ru/ru/publikatsii/2016-03-21-16-23-52 (accessed on 25 December 2020).
  24. Pavlova, V.; Shkolnik, I.; Pikaleva, A.; Efimov, S.; Karachenkova, A.; Kattsov, V. Future changes in spring wheat yield in the European Russia as inferred from a large ensemble of high-resolution climate projections. Environ. Res. Lett. 2019, 14, 034010. [Google Scholar] [CrossRef]
  25. Selyaninov, G.T. The nature and dynamics of the droughts. In Droughts in the USSR, Their Nature, Recurrences and Impact on Crops Yields; Gidrometeoizdat: Leningrad, Russia, 1958; pp. 5–30. (In Russian) [Google Scholar]
  26. Levin, F.I. The amount of plant residues in field crops and its determination by the yield of the main product. Agrochimia 1977, 8, 36–42. (In Russian) [Google Scholar]
  27. Romanenkov, V.A.; Smith, J.U.; Smith, P.; Sirotenko, O.D.; Rukhovitch, D.I.; Romanenko, I.A. Soil organic carbon dynamics of croplands in European Russia: Estimates from the model of humus balance. Reg. Environ. Chang. 2007, 7, 93–104. [Google Scholar] [CrossRef]
  28. Han, P.; Zhang, W.; Wang, G.; Sun, W.; Huang, Y. Changes in soil organic carbon in croplands subjected to fertilizer management: A global meta-analyzis. Sci. Rep. 2016, 6, 27199. [Google Scholar] [CrossRef] [Green Version]
  29. Wang, G.; Luo, Z.; Han, P.; Chen, H.; Xu, J. Critical carbon input to maintain current soil organic carbon stocks in global wheat systems. Sci. Rep. 2016, 6. [Google Scholar] [CrossRef] [Green Version]
  30. Husniev, I.; Romanenkov, V.; Minakova, O.; Krasilnikov, P. Modelling and prediction of organic carbon dynamics in arable soils based on a 62-year field experiment in the Voronezh Region, European Russia. Agronomy 2020, 10, 1607. [Google Scholar] [CrossRef]
  31. Eglin, T.; Ciais, P.; Piao, S.L.; Barre, P.; Bellassen, V.; Cadule, P.; Chenu, C.; Gasser, T.; Koven, C.; Reichstein, M.; et al. Historical and future perspectives of global soil carbon response to climate and land-use changes. Tellus B 2010, 62, 700–718. [Google Scholar] [CrossRef] [Green Version]
  32. Morais, T.G.; Teixeira, R.F.M.; Domingos, T. Detailed global modelling of soil organic carbon in cropland, grassland and forest soils. PLoS ONE 2019, 14, e0222604. [Google Scholar] [CrossRef] [Green Version]
  33. Koco, Š.; Skalsky, R.; Barančíková, G.; Tarasovičová, Z.; Gutteková, M.; Koleda, P. Effect of soil management in agricultural land for the development of soil organic carbon stocks. Folia Geogr. 2016, 58, 22–33. [Google Scholar]
  34. Skalsky, R.; Koco, Š.; Barančíková, G.; Tarasovičová, Z.; Halas, J.; Koleda, P.; Makovníková, J.; Gutteková, M.; Tobiášová, E.; Gömöryová, E.; et al. Land cover and land use change-driven dynamics of soil organic carbon in North-East Slovakian croplands and grasslands between 1970 and 2013. Ekológia 2020, 39, 159–173. [Google Scholar] [CrossRef]
  35. Meersmans, J.; Arrouays, D.; Van Rompaey, A.J.; Pagé, C.; De Baets, S.; Quine, T.A. Future C loss in mid-latitude mineral soils: Climate change exceeds land use mitigation potential in France. Sci. Rep. 2016, 6, 35798. [Google Scholar] [CrossRef] [Green Version]
Figure 1. Observed (1980–2011) and simulated (2012–2090) yields of winter: (a) control and (b) NPK1. RCP: Representative Concentration Pathways.
Agronomy 11 00226 g001
Figure 2. Simulated annual dynamics of total organic carbon (TOC) stocks in the DAOS 3 experiment (1937–2090): (a) RCP4.5 and (b) RCP8.5. DAOS: Dolgoprudny Agrochemical Experimental Station and FYM: farmyard manure.
Agronomy 11 00226 g002
Figure 3. Simulated annual dynamics of C in the resistant plant material (RPM) pool in the DAOS 3 experiment: (a) RCP4.5 and (b) RCP8.5.
Agronomy 11 00226 g003aAgronomy 11 00226 g003b
Figure 4. Simulated annual dynamics of C in the resistant plant material (RPM) pool in the DAOS 4 experiment: (a) RCP4.5 and (b) RCP8.5.
Agronomy 11 00226 g004aAgronomy 11 00226 g004b
Figure 5. Simulated annual dynamics of C in the humified (HUM) pool in the DAOS 3 experiment: (a) RCP4.5 and (b) RCP8.5.
Agronomy 11 00226 g005aAgronomy 11 00226 g005b
Figure 6. Simulated annual dynamics of C in the HUM pool in the DAOS 4 experiment: (a) RCP4.5 and (b) RCP8.5.
Agronomy 11 00226 g006aAgronomy 11 00226 g006b
Figure 7. Simulated annual dynamics of the total SOC stocks in the DAOS 4 experiment (1933–2090): (a) RCP4.5 and (b) RCP8.5.
Agronomy 11 00226 g007aAgronomy 11 00226 g007b
Table 1. Observed yields of the main crops used in the rotations by their treatments. DAOS: Dolgoprudny Agrochemical Experimental Station and FYM: farmyard manure.
CropTreatments of the DAOS 3 Experiment
Mean Yields and Their Ranges, Mg·ha−1
Control1.5NPK + FYM3NPK3NPK + FYM
Sunflower2.6 (1.1–4.6)5.8 (1.8–7.9)6.5 (2.3–12.6)6.6 (2.2–11.5)
Beet4.5 (2.0–28.4)45.6 (14.8–77.6)49.3 (12.9–88.4)56.0 (19.0–99.1)
Barley1.4 (0.3–2.7)2.9 (0.5–4.4)3.0 (0.6–5.0)3.1 (0.8–4.8)
CropTreatments of the DAOS 4 Experiment
Mean Yields and Their Ranges, Mg·ha−1
ControlFYMNPK1NPK2
Winter wheat1.8 (0.5–3.6)3.0 (1.2–6.2)2.7 (1.3–5.1)2.8 (1.5–4.9)
Potatoes8.9 (5.3–13.7)18.7 (8.9–28.2)20.2 (13.2–36.0)22.0 (13.9–36.9)
Barley1.2 (0.1–5.7)1.8 (0.1–3.8)2.1 (0.2–4.5)2.1 (0.2–4.5)
Perennial grasses2.4 (0.4–4.7)3.7 (1.2–7.7)3.6 (1.1–7.2)3.7 (1.7–7.0)
Table 2. Annual gain/loss and input of C by treatments. RCP: Representative Concentration Pathways.
PeriodTreatments of the DAOS 3 Experiment
Annual Gain/Loss, ‰/C Input, Mg·ha−1
Control1.5NPK + FYM3NPK3NPK + FYM
RCP4.5
2020–20403.7/0.996.2/1.742.3/1.285.1/1.77
2040–20605.4/1.10−2.5/1.021.3/1.05−1.7/1.09
2060–20801.6/1.065.6/1.432.6/1.125.1/1.43
2080–2090−6.3/0.88−1.4/1.39−1.1/1.19−0.2/1.49
RCP8.5
2020–20404.2/1.053.7/1.471.1/1.093.8/1.56
2040–2060−0.8/0.79−1.3/1.012.2/1.05−0.9/1.09
2060–20800.3/0.862.3/1.29−0.2/1.082.3/1.39
2080–2090−3.8/0.79−1.2/1.40−1.3/1.21−0.9/1.51
PeriodTreatments of the DAOS 4 Experiment
Annual Gain/Loss, ‰/C Input, Mg·ha−1
ControlFYMNPK1NPK2
RCP4.5
2020–20406.9/1.2712.0/2.1612.3/1.8513.2/1.90
2040–20603.5/1.124.7/1.935.3/1.625.4/1.66
2060–20801.1/1.062.8/1.832.2/1.512.6/1.55
2080–20907.3/1.317.8/2.3010.3/2.0011.0/2.07
RCP8.5
2020–20405.6/1.168.0/2.047.6/1.558.4/1.58
2040–20601.7/1.163.9/1.864.6/1.564.8/1.58
2060–20800.1/1.091.2/1.830.6/1.520.9/1.55
2080–20905.5/1.305.8/2.188.5/1.878.9/1.92
Publisher’s Note: MDPI stays neutral with regard to jurisdictional claims in published maps and institutional affiliations.

