Article

Genetic Variation and Sequence Diversity of Starch Biosynthesis and Sucrose Metabolism Genes in Sweet Potato

1
College of Agronomy and Biotechnology, Southwest University, Beibei, Chongqing 400715, China
2
Key Laboratory of Biology and Genetic Breeding for Tuber and Root Crops in Chongqing, Beibei, Chongqing 400715, China
3
State Cultivation Base of Crop Stress Biology for Southern Mountainous Land of Southwest University, Beibei, Chongqing 400715, China
4
The Agricultural Science Research Institute of Liupanshui, Guizhou 553001, China
*
Author to whom correspondence should be addressed.
Agronomy 2020, 10(5), 627; https://doi.org/10.3390/agronomy10050627
Submission received: 27 March 2020 / Revised: 19 April 2020 / Accepted: 23 April 2020 / Published: 29 April 2020
(This article belongs to the Special Issue Analysis of Crop Genetic and Germplasm Diversity)

Abstract

:
Knowledge of genetic variations can provide clues into the molecular mechanisms regulating key crop traits. Sweet potato (Ipomoea batatas (L.) Lam.) is an important starch-producing crop, but little is known about the genetic variations in starch biosynthesis and sucrose metabolism genes. Here, we used high-throughput sequencing of pooled amplicons of target genes to identify sequence variations in 20 genes encoding key enzymes involved in starch biosynthesis and sucrose metabolism in 507 sweet potato germplasms. After filtering potential variations between gene copies within the genome, we identified 622 potential allelic single nucleotide polymorphisms (SNPs) and 85 insertions/deletions (InDels), including 50 non-synonymous SNPs (nsSNPs) and 12 frameshift InDels. Three nsSNPs were confirmed to be present in eight sweet potato varieties with various starch properties using cleaved amplified polymorphic sequence (CAPS) markers. Gene copy with loss of the fifth intron was detected in IbAGPb3 genes, and loss of multiple introns were observed in IbGBSS1-1 genes and various among germplasms based on intron length polymorphism (ILP) markers. Thus, we identified sequence variations between germplasms in 20 genes involved in starch biosynthesis and sucrose metabolism, and demonstrated the diversity in intron-loss alleles among sweet potato germplasms. These findings provide critical genetic information and useful molecular markers for revealing regulatory mechanism of starch properties.

1. Introduction

The discovery of genetic variation is essential for revealing the molecular mechanism controlling important traits. Many sequence variations, such as single nucleotide polymorphisms (SNPs), insertions/deletions (InDels), and intron length polymorphisms (ILPs), have been identified in crops [1,2,3,4], providing comprehensive tools for analyzing the genome and identifying genes and genomic regions that contribute to phenotypes of interest. Many variations associated with disease resistance or important agronomic traits have been identified in crops [5,6]. Genetic markers developed from sequence variations have been used extensively for diverse genetic analyses, including genetic diversity assessment, trait association mapping, and fine-mapping of QTLs regulating important agronomic traits [7].
Sweet potato (Ipomoea batatas (L.) Lam.) is widely grown throughout the world and is critical for food security and nutrition due to its high yield, rich nutrient content, low input requirements, multiple uses, and adaptability under a range of environmental conditions [8,9,10]. Sweet potato yields a large amount of energy per unit area per unit time [11]. Starch levels in the storage root are 20% to 30% of the wet weight [12] and 50% to 80% of the dry weight [10]. The high starch content and reliable starch yield of sweet potato make it a good source of carbohydrates and, thus, an excellent raw material for starch-based industries and environmentally friendly ethanol biofuel production. Indeed, sweet potato may have an even greater potential than maize (Zea mays) as an ethanol source [11,12,13].
The quality and yield of carbohydrates and ethanol from sweet potato depend on starch properties such as yield, content, and composition. The starch content of the storage root influences post-harvest processing and ethanol yield [11,14]. The starch composition, particularly the amylose–amylopectin ratio, affects the starch structure and physicochemical properties of the starch [15] and also the ethanol yield [11]. A higher proportion of short amylopectin branched chains may lower the gelatinization temperature of starch and thereby help reduce energy consumption and CO2 emission in ethanol biofuel production [12]. Thus, improving the starch content and starch quality remains an important goal, especially in the field of biotechnology [16]. Starch content and composition vary greatly among different sweet potato varieties [14,15,17], but the genetic basis and regulatory mechanism of these important traits is insufficiently understood.
Starch is synthesized through a complex biosynthetic pathway, and the properties of the starch are determined by the activities of several key starch biosynthetic and metabolic enzymes [18]. Natural genetic variations of genes encoding these key enzymes are associated with starch properties in crops. For example, Kharabian-Masouleh et al. [19] identified two SNPs in the Granule bound starch synthase I (GBSSI) gene—a G/T SNP at the exon1/intron1 boundary and a C/T SNP in exon 10—with a significant association with amylose content in rice (Oryza sativa). Candidate gene association mapping showed that rice amylose content was also associated with SNPs in starch synthases (SS). SNPs in sucrose synthase, starch-branching enzyme (SBE), adenosine diphosphate (ADP)-glucose pyrophosphorylase (AGPase) large subunit, α-amylase, and β-amylase (BMY) genes were associated with starch properties of maize (Zea may) kernels [20]. SNPs in the BMY gene BMY-8/2, the starch phosphorylase gene PHO1b, and the AGPase large (β) subunit gene AGPaseS were associated with tuber starch content and starch yield in potato (Solanum tuberosum) [21]. These sequence variations will provide a basis for further study of the regulation of starch-related traits.
In sweet potato, the key enzymes involved in starch biosynthesis and metabolism, and their associated genes, have been isolated and studied [10,18]. RNA interference studies confirmed that several of these genes directly regulate starch properties. The starch content of storage roots was reduced in transgenic sweet potato plants in which the expression of the starch branching enzyme II gene (IbSBEII) [22] or GBSSI [23] was suppressed by RNA interference. Overexpression of the soluble starch synthase I gene IbSSI resulted in a significant increase in starch content and granule size, as well as in the proportion of amylopectin [24]. Using CRISPR/Cas9 technology, Wang et al. [25] knocked out IbGBSSI and IbSBEII in sweet potato and, thereby, altered the starch content, amylopectin chain length distribution, and amylose percentage. These results demonstrated that starch biosynthesis genes could be exploited to improve the starch properties of sweet potato through biotechnology. However, the genetic variation in these genes, which may provide critical clues into the genetic basis of starch properties, has rarely been investigated.
Sequence variation in candidate genes can be mined by sequencing PCR amplicons from bulk DNA from a population or germplasm collection. The development of next-generation sequencing (NGS) technology and improved computational algorithms for sequence analysis, along with the availability of increasing sequence information in public databases, make it possible to identify all existing genetic variation in an entire genome and in targeted sequences of interest. The major advance offered by NGS methods is the ability to cheaply and reliably sequence DNA on a large scale and generate large volumes of sequence data [26,27]. Many genetic variations have been identified from amplicon, transcriptome, exome, and genome resequencing [1,2,3]. Su et al. [28] developed 795,794 SNP sites in sweet potato based on specific length amplification fragment sequencing (SLAF-seq) technology. Based on transcriptome data, SNPs were detected between two sweet potato varieties, Xushu 18 and Xu 781, and 32 SNP markers were verified in these two varieties using Tetra-primer Amplification Refractory Mutation System PCR (ARMS-PCR) [29]. Using double-digest restriction site-associated DNA sequencing (ddRAD-Seq), based on NGS technology, 94,361 SNPs were identified in an S1 population generated through self-pollination of Xushu 18, and a high-density genetic map of sweet potato was constructed [30].
Despite this progress, it remains a challenge to discover allelic variations in sweet potato, which is an allohexaploid and has a large, heterozygous genome [31]. Variations may arise both between allelic (homologous) sequences within individual subgenomes and between homoeologous sequences among subgenomes, in addition to paralogous variation between duplicated gene copies [32]. Deep sequencing of target genes or gene regions is an effective method to discover homologous variations, but potential paralogous variations between duplicated gene copies need to be eliminated.
In the present study, to discover sequence variations in genes encoding key enzymes regulating starch biosynthesis and metabolism in sweet potato, we performed deep sequencing of target sequences/genes in a large natural population with wide genetic and phenotypic diversity. SNPs, InDels, and ILPs were detected by aligning the reads to the reference sequences. Through alignment of all the gene copies explored in the hexaploid sweet potato genome, potential variations within the genome were filtered, and SNPs and InDels between germplasms were identified. CAPS and ILP markers were developed and verified in sweet potato germplasms. The sequence variations detected in this work will provide powerful tools for association analysis, marker-assisted selection, high-resolution genetic mapping, and research into regulatory mechanisms in sweet potato.

2. Materials and Methods

2.1. Plant Materials

To capture the widest possible variability in the gene sequences, 507 sweet potato germplasms, including varieties, breeding lines, wild varieties, farmer varieties, and landraces, were used (Supplementary Materials Table S1). These germplasms have a wide range of morphological types, and are derived from prominent sweet potato production regions in China and other countries, including Japan, Nigeria, Brazil, and the USA. These sweet potato germplasms were conversed by our lab and collected from other four institutions, and have been identified based on morphological characteristics, quality traits and molecular markers. Most of these germplasms have been reported in our previous genetic diversity and association analysis studies [14,33,34]. The sweet potato germplasms were planted in the experimental field of the Key Laboratory of Biology and Genetic Breeding for Tuber and Root Crops in Chongqing, China.

2.2. Sample Preparation and DNA Extraction

The fresh young leaves of each sweet potato germplasm were harvested from the experimental field and immediately stored in liquid nitrogen. Genomic DNA was extracted following the CTAB protocol [35]. The resulting DNA samples were examined by agarose gel electrophoresis, and the concentration and quality of RNA were determined with a NanoDrop ND-2000 Spectrophotometer (Thermo Scientific, Waltham, MA, USA) following the manufacturer’s protocol. All DNA samples were normalized to 50 ng/μL concentration.

2.3. Genetic Diversity Analysis, Population Structure Analysis, and Starch Properties Evaluation

The genetic diversity and population structure of the 507 germplasms were analyzed based on inter-simple sequence repeat (ISSR) markers selected in our previous study [33]. Genomic DNA of each germplasm was used as template for PCR amplification using previously described method [33], and ISSR bands were used to assign loci for each primer and scored as present (1) or absent (0). The band presence/absence data matrix was analyzed using NTSYS pc2.10 [36] to estimate the Nei’s standard genetic distance [37] between the tested germplasm. The genetic distance matrix was computed and clustered using the neighbor-joining (NJ) method [38] using MEGA X [39].
Population structure was assessed using the model-based method implemented in STRUCTURE v2.3.3 [40]. The number of subgroups (K) was set from 1 to 20 based on models characterized by admixture and correlated allele frequencies. For each K, five runs were performed separately, with 100,000 iterations carried out for each run after a burn-in period of 10,000 iterations. A K value was selected when the estimate of LnPr (X|K) peaked in the range of 1 to 20 subpopulations. Since the distribution of LnP (D) did not show a clear cut-off point for the true K value, an ad hoc measure, ΔK, was used to determine the numbers of subpopulations [41]. The run with the maximum likelihood was applied to subdivide the accessions into different subpopulations using a membership probability threshold of 0.55 as well as the maximum membership probability among subgroups. Those accessions with a membership probability of less than 0.55 were retained in the admixed group (AD). The results from STRUCTURE were displayed by DISTRUCT 1.1 software [42].
The starch properties, including the storage root starch content and amylose–amylopectin ratio, of these germplasms were evaluated using previously described methods [14].

2.4. Candidate Gene Selection

Genes encoding key enzymes involved in starch biosynthesis and metabolism, which have been confirmed to show different expression patterns in sweet potato varieties with different starch properties in our previous study [10], were considered as candidate genes.

2.5. Sequence Analysis and Primer Design

Candidate sequences of these genes were explored against National Center for Biotechnology Information (NCBI) (http://www.ncbi.nlm.nih.gov/) and previously reported sweet potato transcriptome sequencing data. The nucleotide sequences of each target gene were analyzed on Geneious 4.8.5 to determine the open reading frame (ORF), untranslated region (UTR), and exon and intron regions. The sequences, including complete coding sequences, were used for primer design. Forward and reverse primer sequences were up- and downstream of the ORF sequence, respectively, to ensure that the entire ORF was obtained in the PCR products. Primers were designed using Primer Premier 6 according to the manual.

2.6. Gene Cloning and Reference Sequence Determination

The candidate genes were cloned from 10 sweet potato germplasms, i.e., Yushu No.2, Xushu22, Shangqiu52-7, D01414, Yushu33, Chaoshu No.1, Xinxiang, Suyu No.1, Mianfen No.1, and S1-5, that had diverse starch content and quality properties, or from the other germplasms listed in Supplementary Materials Table S1, using PCR. TransStart FastPfu Fly DNA polymerase (TransGen Biotech, Beijing) was used to amplify sequences in PCR reactions, containing 50 ng genomic DNA, 1 µL of each forward and reverse primer (10 µm), 10 µL of 5×TransStart FastPfu Fly Buffer (50 µm), 4 µL dNTPs (10 mM), 1 µL TransStart FastPfu DNA polymerase, and ddH2O to a final volume of 50 µL. The PCR reactions were conducted using a 9700 Thermal Cycler (ABI, USA) under the following cycle profile: 1 cycle of 95 °C for 2 min, followed by 35 cycles of 95 °C for 1 min, annealing temperature based on the Tm of the primers (Tm–5 °C) for 30 s, and 72 °C for 1–4 min. The final extension was performed at 72 °C for 10 min. The amplicons were cloned into pMD19-T vectors (TARAKA) and Sanger sequencing (Invitrogen, Shanghai) was performed to ensure that the target gene sequences were obtained.

2.7. DNA Equivalent Pooling

To obtain the gene sequences from 507 sweet potato germplasms, a uniform pooling strategy was applied for all samples. The genomic DNA of 507 sweet potato germplasms was divided into 25 individual pools based on starch content, containing equally mixed genomic DNA of 20–21 germplasms with various (high, medium, and low) levels of starch content each. The starch contents of germplasms in each pool were listed in Supplementary Materials Table S1. For each gene, PCR was carried out using each genomic DNA pool as template, respectively, as above. The concentration of PCR products from these pools was measured using a NanoDrop 2000c Spectrophotometer, and the final mega pool containing 5 µg of amplicons from each pool was prepared according to the sequencing manufacturer’s protocol (Illumina, San Diego, CA).

2.8. Amplicon Sequencing

The pooled amplicons were subjected to Illumina paired-end (PE125) sequencing using the Hiseq2000 platform at Novogene Biotech, Beijing, China. Quality control, such as filtering and trimming, was performed using the DNASeq-QC software package, which includes DNASeq-PrimerFilter, DNASeq-LowqFilter, and DNASeq-KHHNBaseFilter, established by Novogene Bioinformatics Technology Co. Ltd, Beijing, China.

2.9. Genotype Calling and Variation Filtering

Data analysis, including reads assembly, filtering, trimming, and mapping to the reference sequences, was performed using CLC genomic workbench 7.5.1. The CLC genomic workbench general parameters were set as follows: the conflict resolution was changed into all four nucleotides (select A, C, G, and T), and nonspecific and masking references were ignored. The mismatch cost, insertion cost, deletion cost and length fraction for all of the paired end reads were 2, 3, and 3, respectively. The sequence data were assembled de novo with a sequence similarity of 0.8 over 0.5 of the read length. To minimize the bias introduced by PCR amplification, and errors caused by sequencing and read alignment, the variations were called with a minimum coverage of 10 and a minimum variant frequency of 20%. Thus, sequences that varied by less than 20% were excluded in this test, but the authenticity of the identified variations was ensured.
The reference sequences were aligned to the hexaploid sweet potato genome (http://public-genomes-ngs.molgen.mpg.de/SweetPotato/) [31] using BLASTN (E value cut-off of 1E-5) in Geneious Prime, and potential homologous, homoeologous, or paralogous genes of target genes were explored using an E value of 1e-5 and identity of above 85%. The sequence variations between these genes or gene copies were filtered.

2.10. Total Polymorphism Rate Calculation and Non-Synonymous SNP (nsSNP) Detection

The SNPs/InDels identified in the coding regions were detected, and SNPs/InDels that caused amino acid changes or reading frame shifts were analyzed. The total polymorphism rate and nsSNP rate were calculated as described by Kharabian-Masouleh et al. [1]. To predict the impact of the detected SNPs/InDels to enzyme activity or protein function, the conserved domain and site of each proteins encoded by the candidate genes were analyzed on InterProscan (http://www.ebi.ac.uk/interpro/search/sequence/) [43], and the likelihood of nsSNP to cause a functional impact on the protein was estimated using PANTHER (http://www.pantherdb.org/tools/csnpScoreForm.jsp) [44].

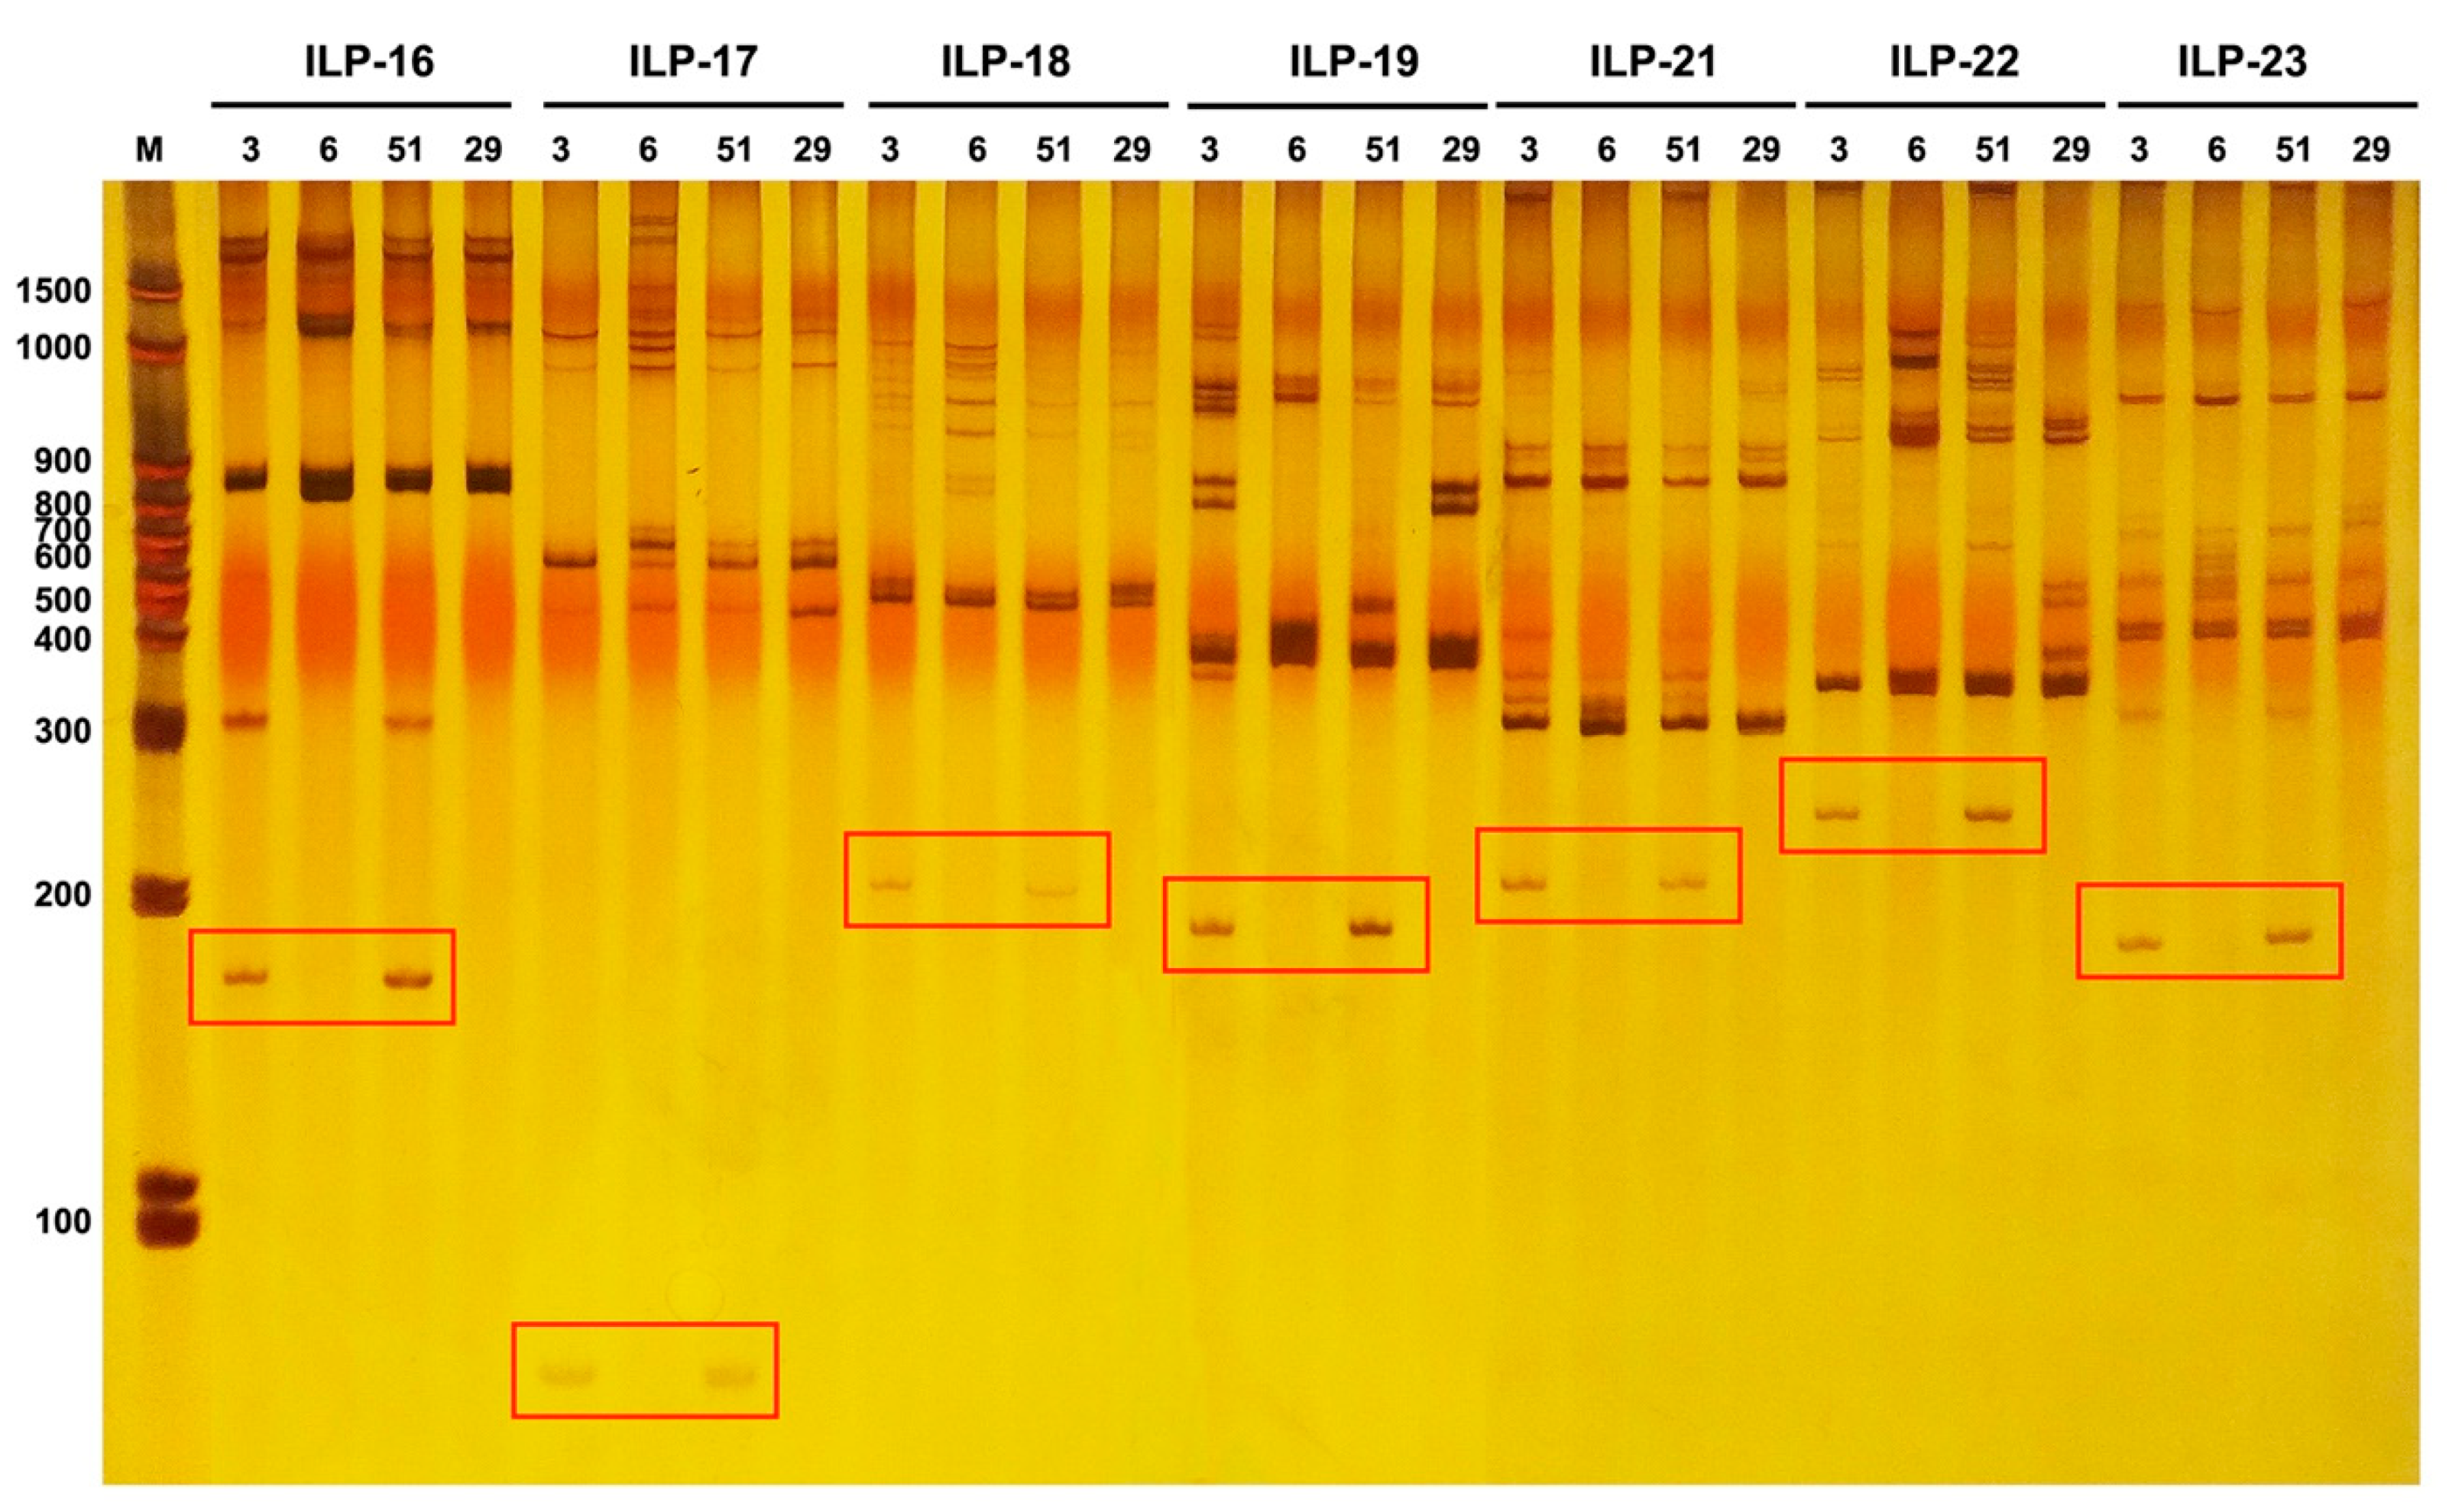
2.11. Marker Development and Identification

CAPS markers were developed using the online restriction/SNP-RFLP analysis tool Watcut (http://watcut.uwaterloo.ca). Eight sweet potato germplasms with various starch properties were used as templates and PCRs were performed using CAPS marker primers. The PCR products were digested using the corresponding restriction endonucleases and the products were compared. For InDel, primers were designed based on the Insert/Deletion region using Primer Premier 6. DNA extracted from the sweet potato germplasms was used as templates for PCRs using the InDel marker primers, and the length of PCR amplicons was detected using agarose or PAGE electrophoresis. Association analysis between marker and starch properties was performed as described [14].

2.12. ILP Marker Development and Identification

The sequences of each candidate gene and the corresponding mRNA sequences were aligned to examine the gene structure (number of introns and positions of splice sites). Putative ILPs among the obtained sequences were identified by aligning the entire sequences of available genes (gDNA) and their corresponding cDNA using Geneious Prime. ILP markers were developed and exon-primed intron crossing PCR (EPIC-PCR) primers were designed using Primer Premier 6. ILP markers were identified by PCR amplification on a population of 192 sweet potato germplasms, and the amplified products were isolated on an 8% non-denaturing PAGE gel. Silver staining was used to visualize DNA bands.

3. Results

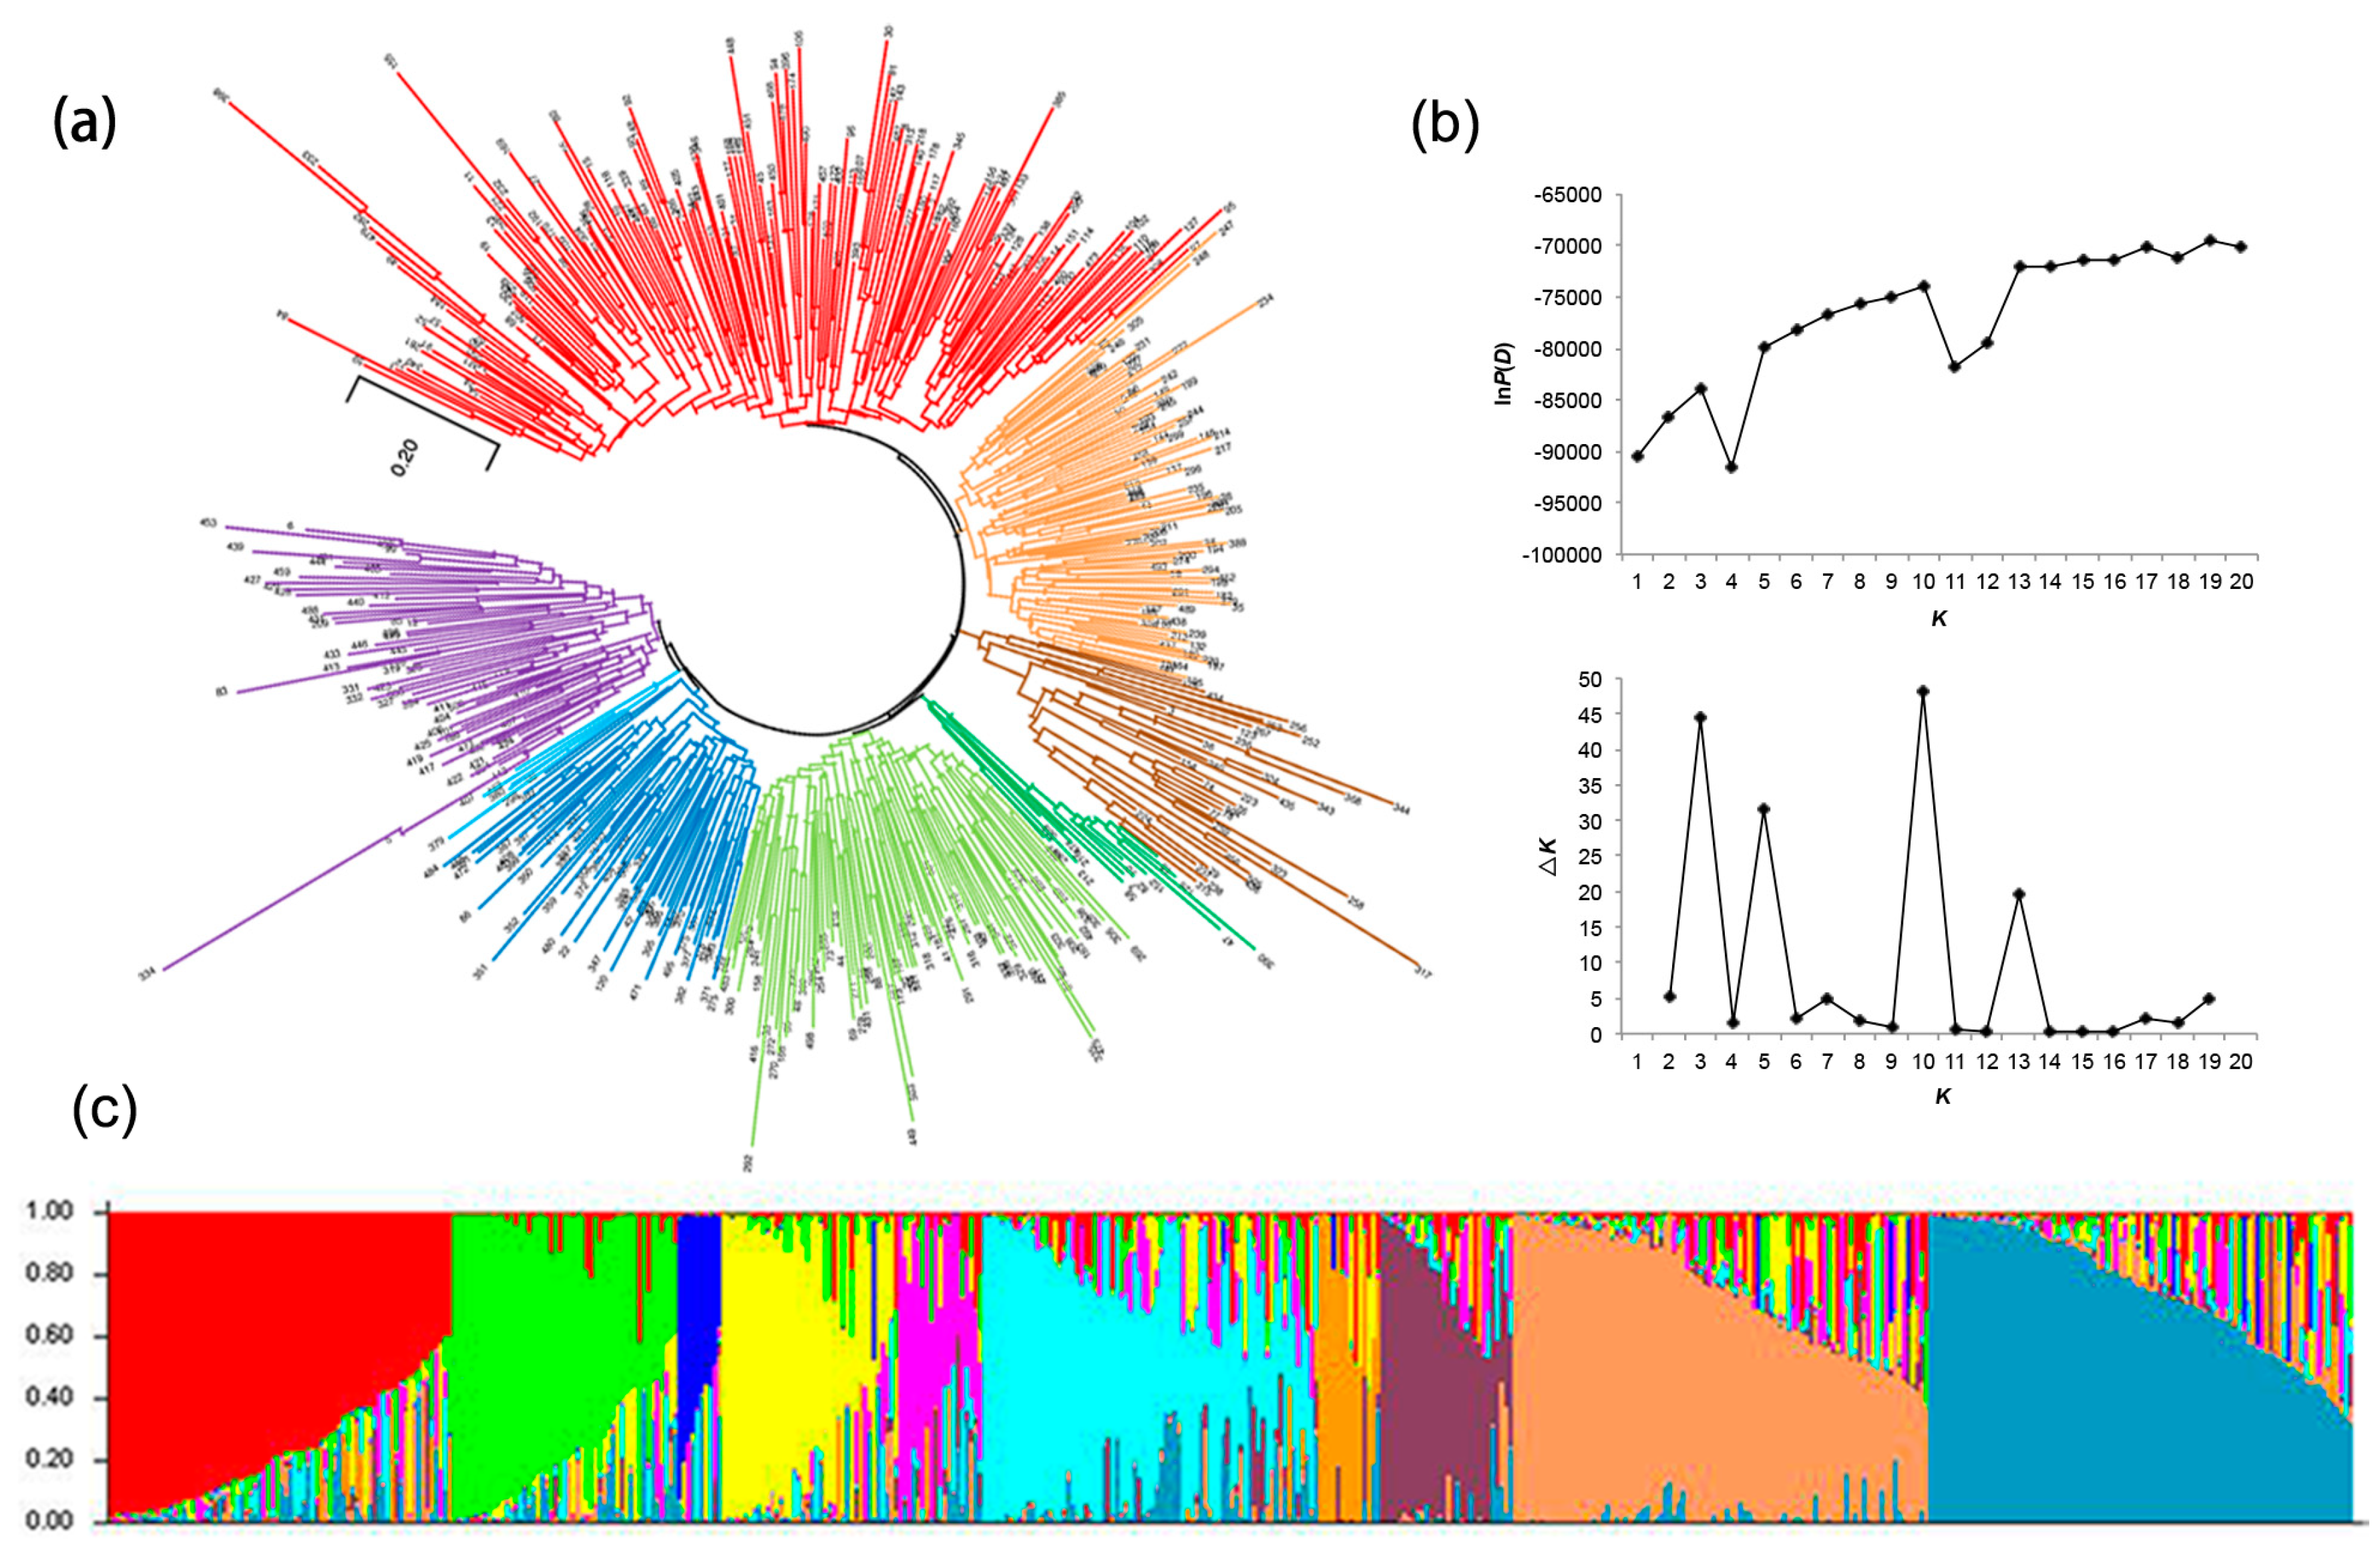
3.1. The Sweet Potato Germplasms Exhibited High Genetic and Phenotypic Diversity

To evaluate the genetic diversity and structure of 507 sweet potato germplasms, the genetic distances between germplasms were calculated and the population structure was analyzed using ISSR markers. Based on the 216 polymorphic bands generated using 17 ISSR markers, the calculated Nei’s genetic distances [37] among 507 sweet potato germplasms ranged from 0.1286 to 1.9869. Cluster analysis revealed eight subgroups and high genetic diversity in the tested sweet potato population (Figure 1a, Supplementary Materials Table S2).
Population structure analysis revealed the presence of ten main subpopulations within the 507 germplasms (Figure 1b). With membership probabilities of 0.55, 66, 44, 8, 31, 9, 54, 8, 23, 72, and 76 accessions were assigned into the ten subpopulations, respectively, and 116 germplasms exhibited various membership probabilities between the two subpopulations and were assigned to the admixed group (AD) (Figure 1c, Supplementary Materials Table S3).
The starch properties of the 507 sweet potato germplasms were tested; the storage root starch content ranged from 4.480% to 29.131% and the amylose–amylopectin ratio ranged from 0.247 to 0.429. However, no relationship was detected between starch properties and subgroup assignment in the cluster analysis, or subpopulation assignment in the population structure analysis on the 507 germplasms, based on the 17 ISSR markers. The storage root starch content of germplasms assigned to each subgroup and each subpopulation were listed in Supplementary Materials Table S2 and Table S3, respectively.
In summary, these results showed the 507 germplasms exhibited high levels of genetic diversity, complex population structure, and various starch properties, and sufficient genetic variations could be explored from this set of germplasms.

3.2. Twenty Candidate Genes Were Captured for Variation Detection

By searching against the NCBI database and sweet potato transcriptome sequencing data, we collected sequences of genes that had previously been reported to encode key enzymes involved in starch biosynthesis and metabolism, and were differentially expressed in sweet potato germplasms with various starch properties [10]. The primers were designed based on the downloaded sequences and candidate genes were amplified using DNA extracted from 10 sweet potato varieties as templates. The primers used for PCR amplification of each gene are listed in Supplementary Materials Table S4.
Twenty genes were successfully amplified, and no unspecific PCR product was detected in the sequenced clones. The cloned sequences showed polymorphisms among different sweet potato germplasms. These genes encode key enzymes involved in starch granule formation, starch degradation, and starch and sucrose metabolism: (1) AGPase (EC 2.7.7.27) large (β) subunit 1 gene IbAGPb1A; (2) AGPase large (β) subunit 2 gene IbAGPb1B; (3) AGPase large (β) subunit 3 gene IbAGPb2; (4) AGPase large (β) subunit 4 gene IbAGPb3; (5) AGPase small (α) subunit 1 gene IbAGPa1; (6) AGPase small (α) subunit 2 gene IbAGPa2; GBSSI (EC 2.4.1.242) genes (7) IbGBSS1-1, (8) IbGBSS1-2, and (9) IbSPSS67; (10) granule-bound starch synthase 2 (GBSS2, EC 2.4.1.21) gene IbGBSS2; (11) soluble starch synthase (SSS, EC 2.4.1.21) gene IbSSS1; (12) starch-branching enzyme (SBE, EC 2.4.1.18) gene IbSBE1; (13) isoamylase (ISA, EC 3.2.1.68) gene IbIsal; (14) starch phosphorylase/α-1,4 glucan phosphorylase L isozyme (EC 2.4.1.1) gene IbSP; sucrose synthase (EC 2.4.1.13) genes (15) IbSuSy1, (16) IbSuSy2, and (17) IbSuSy3; and uridine diphosphate glucose dehydrogenase/UDP-glucose 6-dehydrogenase (UDPGH, EC 1.1.1.22) genes (18) IbUDPGH3, (19) IbUDPGH, and (20) IbUDPGH13.
IbSSS, which encodes soluble starch synthase in sweet potato, was first isolated based on our sweet potato transcriptome data [10], and we used the clone from sweet potato variety Shangqiu52-7 as the reference gene in this study. The gene names, accession numbers, and reference gene lengths are listed in Supplementary Materials Table S5 and the reference gene sequences are provided in Supplementary Materials File S1.

3.3. Number of Reads and Average Coverage Obtained from NGS

To detect sequence polymorphisms in sweet potato, the candidate genes were amplified from pooled DNA and NGS was performed on the pooled PCR products. Two pools, Mix1 and Mix2, were subjected to NGS; genes that generated insufficient reads were amplified again, pooled (Mix3), and sequenced. A total of 5.594, 5.038, and 1.715 Gb of raw data was obtained for Mix 1, 2, and 3, respectively, which yielded 5.496, 4.954, and 1.704 Gb of clean data. The sequencing data are deposited in the BIG Data Center under BioProject accession code PRJCA002386.
Sequencing of pooled amplicons of 20 candidate genes generated approximately 90,206,712 reads of clean data, of which 71,696,295 (79.48%) mapped to the reference sequences (Supplementary Materials Table S6). The highest and lowest numbers of reads were obtained for IbAGPa1 and IbSBE1, with 13,734,507 and 912 reads, respectively. The average coverage of genes ranged from 28.56 to 1,458,236.09. The average coverage was above 6,000 for all target genes except IbSBE1. Thus, sufficient sequencing data were obtained for variation exploration.

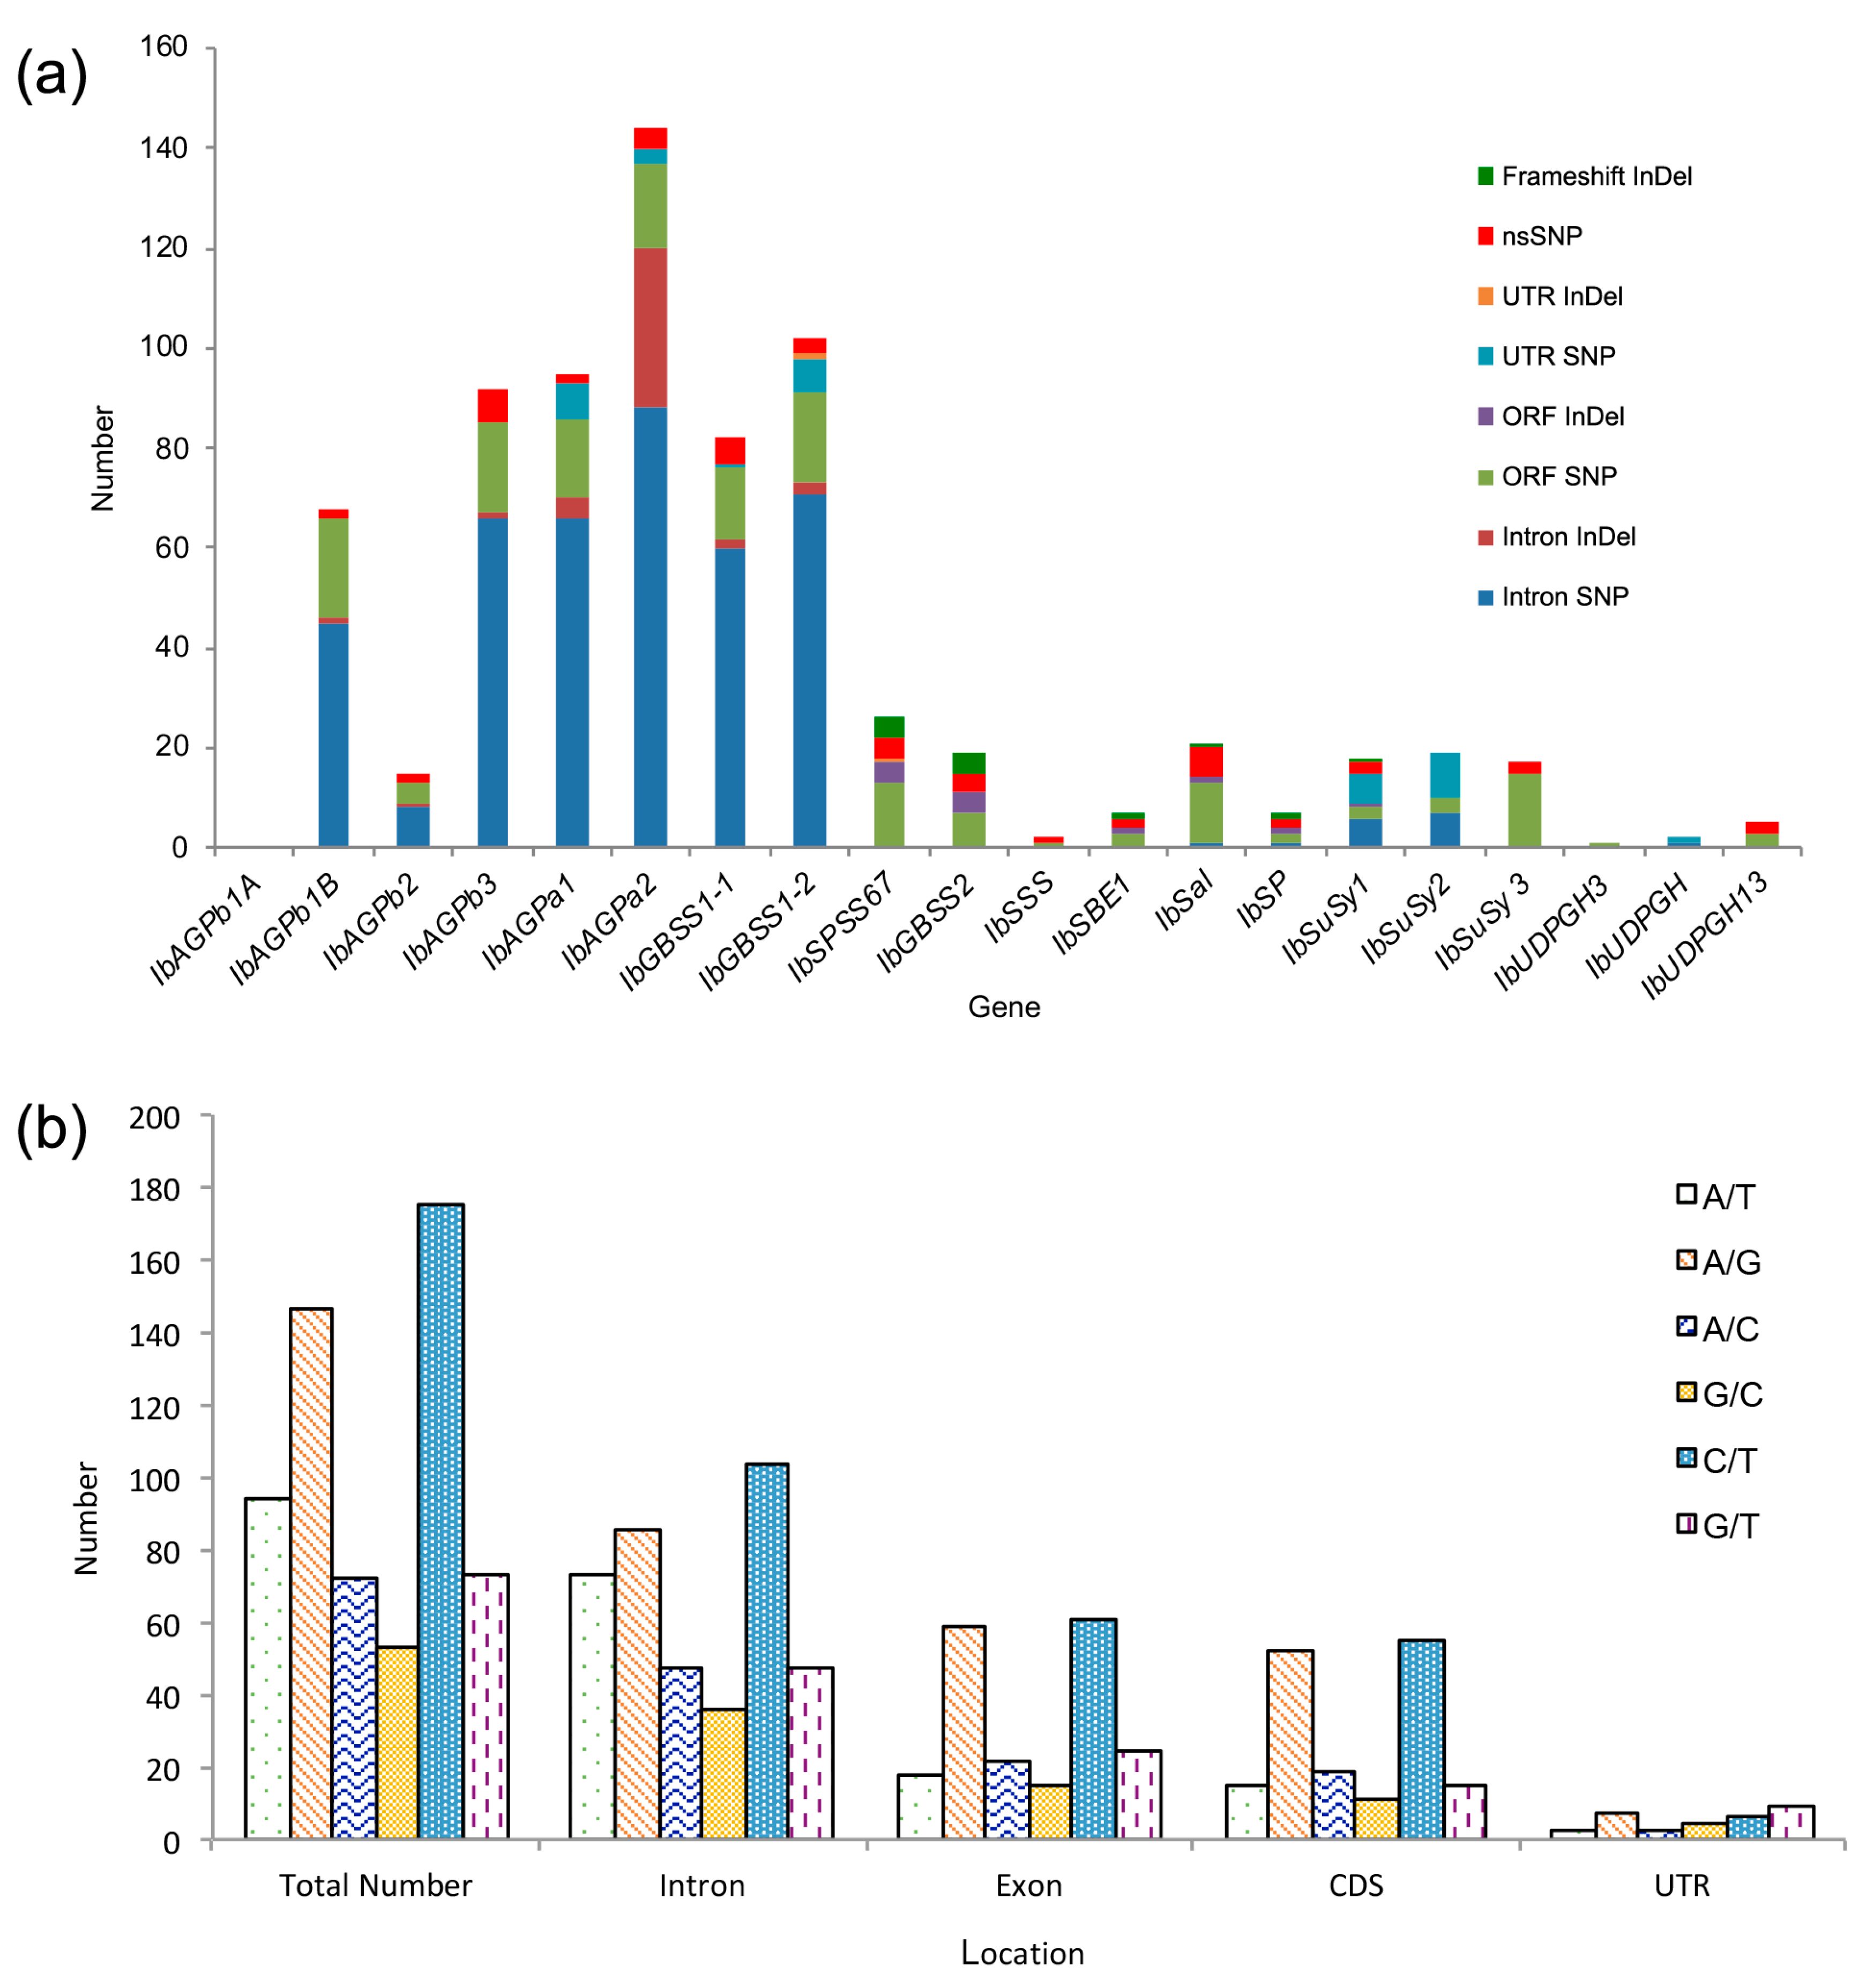
3.4. Detection of SNPs and InDels

SNPs and single/multi-base InDels were detected in the target gene sequence by alignment with the reference genes. In total, we detected 1,113 SNPs and 85 InDels across the 20 studied genes. To further select allelic variation between germplasms, all of the potential homologous genes or gene copies of target genes were explored in the hexaploid sweet potato genome and aligned. For each gene, 1 to 37 potential homologous genes or gene copies were identified (Supplementary Materials Table S7), and 350 SNPs and 17 InDels, which were identified as being variations between genomic sequences, were filtered. Surprisingly, 145 variants were detected only in our cloned sequences but not in the genomic sequences. These variants were also filtered. Furthermore, six SNPs were further identified as PSVs by alignment of the gene sequences cloned from the same germplasm and filtered. A total of 44.115% and 31.765% of the SNPs and InDels were filtered from the variations identified from pooled gene amplicons, respectively. Finally, a total of 622 SNPs and 58 InDels were detected in the 20 gene sequences. The position and characteristics of the SNPs and InDels are listed in Supplementary Materials Table S8.
The SNPs and InDels rates in the detected gene sequences were 10.568 and 0.985/kb, respectively. SNP rates in intron, UTR, and coding sequences (CDS) were 7.136, 0.578, and 2.871 /kb, respectively, and the corresponding InDel rates were 0.731, 0.034, and 0.204/kb.
The number and distribution of SNPs and InDels in each gene are listed in Supplementary Materials Table S5. On average, the SNP rate ranged from 0 SNPs/kb (IbAGPb1A) to 26.792 SNPs/kb (IbAGPa2) for these candidate genes within this set of germplasms. Of the 622 SNPs identified, 169 (27.170% of the total) were located in coding regions, and of these, 50 SNPs were recognized as non-synonymous SNPs (nsSNPs) predicted to cause a change in amino acid sequence or ORF pre-termination. Most of the SNPs and InDels were detected in intron regions of the candidate gene sequences. We detected fewer polymorphisms in the 5’ and 3’ untranslated regions (UTRs) than in the ORF regions (Figure 2a, Supplementary Materials Table S5).
The C/T and A/G transitions were the top two frequent substitutions, which accounted for 28.502% and 23.941% of the detected SNPs, respectively. Except for transitions, a high proportion of A/C transversions was detected in CDS regions, which accounted for 11.377% of the SNPs detected in the CDS; and the G/T transversion accounted for 28.125% of detected substitutions in the CDS (Figure 2b).
The number of polymorphisms varied among the individual genes in our study. The AGPase large subunit genes IbAGPb1B and IbAGPb3, the small subunit genes IbAGPa1 and IbAGPa2, and two IbGBSS1 genes showed a high degree of polymorphism in the germplasm collection, with more than 100 SNPs and InDels detected in their sequences. By contrast, we detected zero SNPs in IbAGPb1A, three SNPs in IbSP, and one SNP in IbSSS, even though we obtained high sequence coverage for these genes (101,057.31, 137,132.69, and 104,531.88 respectively, Supplementary Materials Table S6).
Low sequence coverage might have contributed to the low level of variation detected in the IbSBE1 and IbSuSy3 gene sequences. The three UDP-glucose 6-dehydrogenase genes also showed a low level of sequence polymorphism in this study, although an average coverage of 42,870.36 to 72,770.73 was obtained for SNP calling in the three genes.

3.5. Non-Synonymous Substitutions were Identified in Starch Biosynthesis and Metabolism Genes

We next analyzed the non-synonymous substitutions we detected. Synonymous substitutions outnumbered non-synonymous substitutions in the ORF regions (Supplementary Materials Table S8). In the set of germplasms we analyzed, we detected 50 nsSNPs in the 20 candidate gene sequences (Table 1), 16 of which would cause a change in polarity at the corresponding amino acid position and thus might affect the structure or activity of the resulting protein.
Nineteen nsSNPs would cause amino acid change in conserved domain of the protein, but 16 of them would not cause functional impact on protein as estimated using PANTHER (Table 1). Three nsSNPs, the SNP detected in IbAGPb2 (1,572 bp), in IbSPSS67 (421 bp) and in IbUDPGH13 (140 bp) would cause amino acid change in conserved domain of protein and possibly damage the function of enzyme as estimated using PANTHER. Two nsSNPs detected in IbSP (3,584 bp and 3,743 bp) would not cause amino acid change in the conserved domain or site, but possibly damage the function of enzyme as estimated using PANTHER.
Four SNPs, detected in the reference sequences of IbGBSS1-1 (4,276 bp), IbSBE1 (658bp), IbSal1 (1,467 bp), and IbUDPGH13 (1,318 bp), would cause premature termination of translation. SNP in IbSBE1 (658bp) would result in a 170 aa amino acid sequence and loss of the conserved domains of SBE. The SNP detected in IbSal1 (1,467 bp) would change the length of translated amino acid sequence from 786 to 484 aa, and lost the glycosyl hydrolase domain. The SNP in IbUDPGH13 (1,318 bp) would change the sequence of a conserved domain. Furthermore, the SNP detected in IbAGPb3 (2 bp) would cause loss of the first 10 aa in amino acid sequence, but would not affect the conserved domain sequences.

3.6. Development of CAPS Markers and Verification of SNPs

To further test the authenticity of these nsSNPs and to develop markers that could be used for further study, six of the nsSNPs were converted to CAPS markers (Table 2) and tested in eight sweet potato varieties with various starch properties. DNA of these sweet potato varieties was used as template for PCR amplification using the marker primers, and the PCR products were purified and digested with the appropriate restriction endonucleases.
As shown in Figure 3, no digestion products or polymorphic bands were produced when marker CAPS1 (Figure 3a,b), CAPS5 (Figure 3c,d), and CAPS6 (Figure 3e,f) were tested in the eight sweet potato varieties. There would be digestion products if the minor alleles existed, thus the results indicate there were no minor alleles, but only major alleles of IbAGPa1-T2263, IbSP-T3584, and IbSuSy1-A110 in the genomes of eight sweet potato varieties. For CAPS3 (Figure 3g,h), CAPS2 (Figure 3i,j), and CAPS4 (Figure 3k,l), we obtained PCR products and digestion products of the predicted size, and the bands were polymorphic among the eight sweet potato varieties. However, the DNA of some varieties yielded both digested and undigested products, indicating either incomplete digestion of the PCR products or the presence of both major and minor alleles in the same genome.
The result of CAPS3 detection confirmed the SNP in IbAGPa2-G2971. InterProscan analysis predicted that the G2971/C2971 transversion in IbAGPa2 would change Leu423 to Val423 in the N-terminal domain interface of the protein. Even though this substitution results in no change in polarity, it could affect enzyme activity because of its location. However, no functional impact of this single amino acid polymorphism on the protein was detected using PANTHER, and the biological role of this variation need to be further investigated.

3.7. Frameshift InDels were Detected

InDels detected in the sequences of the 20 candidate genes mainly ranged from 1 to 10 bp in size. Most of the InDels were located in introns and would not be expected to significantly affect protein activity or function (Supplementary Materials Table S8). Twelve of the InDels were located in ORFs and could lead to frameshifts, premature termination of translation, or amino acid changes (Table 3) and thus to loss of function of the gene or protein.
The insertion at position 1982 bp in Ibsal causes a premature termination of translation and result in a protein without a glycosyl hydrolase domain, and the insertion at position 3581 bp in IbSP causes the change of amino acid sequence and would affect the conserved site. The deletion at position 96 bp in IbSuSy1 result in a protein without conserved domain. Interestingly, a deletion at position 1,776 bp in IbSPSS67 causes a shift in reading frame that would extend the ORF from 1827 to 2025 bp and the encoded protein from 608 to 674 amino acids. Although this frameshift would also change the amino acid sequence downstream of the deletion site, bioinformatics analysis showed that this sequence change is not located in conserved domains. Therefore, further research is needed to determine if this mutation would alter the activity or function of the enzyme.

3.8. Two Gene Forms were Detected in IbAGPb3

We detected a 79-bp InDel in the fifth exon of the IbAGPb3 reference gene (Figure 4) that could potentially change the gene’s structure. Gene structure analysis suggested that the 79-bp fragment is an intron; if indeed so, insertion of this fragment would change the number of exons in IbAGPb3 from 13 to 14, and the number of introns from 12 to 13 (Figure 4a).
To verify the InDel, we designed primers to amplify the IbAGPb3 gene sequence containing 79-bp InDel (Supplementary Materials Table S4), and cloned and sequenced this sequence from several sweet potato germplasms. We detected both 79-bp fragment inserted form and deleted form of IbAGPb3 (Figure 4b). However, alignment of the cloned sequences showed that the two forms were two alleles. Except for the difference in the 79-bp sequences, the two alleles showed 95.679%–96.752% of sequence identities, indicating that the “delete” form might be the intron-loss gene copy with loss of the fifth intron of “inserted” form.
We next used PCR to screen the presence of the two gene forms in 126 sweet potato germplasms (Figure 4c shows the PCR products amplified from 10 of the germplasms). DNA from 81 germplasms showed both forms of the gene, 44 showed only the “inserted” form, and 1 (Yanshu No.20, Figure 4d) only the “deleted” form. We performed an association analysis of the presence/absence of the gene forms with starch content and composition, but detected no significant association.

3.9. Intron Loss in the IbGBSS1-1 Genes

Abundant ILPs were detected in the 20 genes, especially in IbGBSS1 genes. Surprisingly, we cloned a IbGBSS1-1 gene with a length of 1893-bp that lacked all 13 introns from the genomic DNA of sweet potato variety Suyu No.1. To confirm that this allele actually exists in the plant, and did not occur because of errors in cloning or sequencing, we developed ILP markers to detect the intron-loss form in IbGBSS1-1 genes (Table 4). Alleles lacking introns 1–4 and 7–13 could be detected in the Shangqiu 52-7 and 0929-106 genomes, but not in the D01414 and Sanheshu genomes (Figure 5 and Supplementary Materials Figure S1). Because we did not successfully develop markers to detect introns 5 and 6, the sequences containing the two introns were cloned from 23 sweet potato germplasms using primers FIbGBSS1-B and RIbGBSS1-B (Supplementary Materials Table S4). The sequences with intron loss were obtained in 15 of the germplasms (Supplementary Materials Figure S2). We further tested these ILP markers in 192 of the 507 sweet potato germplasms. Intron-loss alleles could be detected in 86–92 of the tested germplasms, indicating the intron-loss allele exists in the genomes of approximately half of the germplasms. Thus, there were intron-loss IbGBSS1-1 genes in the sweet potato genome, and these intron losses were variations between germplasms.

4. Discussion

4.1. Effective Strategies for Capturing and Identifying Allelic Variations in Hexaploid Sweet Potato

The large polyploid genome of sweet potato presents a challenge for genetic variation discovery, because variations are present within and between germplasms, and the potential presence of multiple homoeologous sequence variants (HSVs) and paralogous sequence variants (PSVs) will hinder the discovery of allelic variations [32]. In this study, we used several strategies to discover allelic variations. First, when we prepared the amplicons for sequencing, we normalized the PCR system to confirm that only target gene sequences were obtained. No non-specific PCR products were obtained in the clones from 10 sweet potato varieties, and the high mapping rate of reads to target genes also exhibited the specificity of amplicons used for NGS. Thus, the sequence variations were called from pooled amplicons of each target gene in 507 germplasms, and deep sequencing and alignments were performed only in target regions using a candidate gene sequence as reference. Second, except for strict quality control and criteria setting, additional filtering was performed based on alignment of all the potential gene copies explored from genome data. The within-genomic sequence variations, which were shown as variations between gene copies, were eliminated. Over 50% of variations were filtered at this step, indicating the high level of variations between gene copies in the individual genome.
However, due to the complexity and heterozygosity of the allohexaploid (B1B1B2B2B2B2) genome [31], it is challenging to distinguish homologous, homoeologous, and paralogous genes of target genes in the genome, and thus to discriminate all the HSVs and PSVs. Deeply re-sequencing of a hexaploid genome in multiple germplasms will help uncover additional sequence information and DNA sequence polymorphisms. Detailed information of each component of the allohexaploid genome would facilitate the identification of homozygous variations in sweet potato [2,45].
NGS data can have high error rates due to multiple factors, including base-calling and alignment errors [27]. In this study, several strategies were used to ensure the efficiency and accuracy of sequence variation detection. Pooling influences SNP discovery, because not each sample will be amplified with the same efficiency, even if the DNA samples are extracted using the same method, which may introduce bias when the pooling DNA is prepared [46]. We used small pools of DNA isolated from 20–21 germplasms each for the PCRs to minimize the chance of biased amplification of target genes and to improve the chance of generating amplicons from each germplasm. As each pool contained DNA isolated from germplasms with various starch contents, the chance of capturing variations between germplasms with different starch properties were also improved. Furthermore, the genes that did not generate enough amplicons were amplified and sequenced again. These approaches would produce lower false-positive rates in SNP screens [27]. Thus, these pooling, amplification, sequencing, calling, and filtering strategies might ensure the identification of allelic variations in sweet potato, and the variations identified in this study might serve as yardsticks in further variation discovery in sweet potato through genome re-sequencing.,

4.2. Characteristics of Gene Sequence Variation in Target Genes

Of the 622 SNPs and 58 InDels detected in this study, 169 SNPs (27.170%) and 12 InDels (20.690%) were located in coding regions. The density of SNPs and InDels was higher in introns than in UTRs and CDS in the 20 genes. All of the coding region InDels we detected cause frameshifts or premature termination. Of the coding region SNPs, 70.414% were synonymous and 29.586% were nsSNPs. Although the nsSNPs are clearly of interest because of their potential to change protein function or structure, increasing numbers of non-coding SNPs and synonymous SNPs are being identified as functionally critical in humans and plants [5,47,48]. Thus, the other SNPs we detected are also worth functional studies to further elucidate their effects on phenotype. Furthermore, we detected fewer polymorphisms in the 5’ and 3’ UTRs than in the CDS, perhaps because short sequences of UTRs were amplified in this study, and more SNPs and InDels might be detected in the entire UTRs sequences.
In this study, we obtained an SNP rate of 10.568/kb and an InDel rate of 0.985/kb in the 20 target genes, which are higher than the 4.31 SNPs/kb and 0.97 Indels/kb reported in starch-related genes of diploid rice using a similar method [1]. The high SNP rate for sweet potato could be attributed to multiple factors. First, we used 507 germplasms with high genetic and phenotypic diversity, which would be expected to provide abundant polymorphisms. Second, the high coverage ensured effective variation discovery. Furthermore, the high heterozygosity of sweet potato might contribute to an actual high SNP frequency, or to a high error rate in SNP calling, which would alter the SNP frequency [49]. Considering the large number of germplasms and high read coverage, we set the SNP parameters minimum counts and minimum frequency to 2 and 20%, respectively. Thus, alleles that were considered SNPs were represented in at least two independent sequences and had a frequency of or above 20%, and SNPs with a variant frequency of less than 20% were excluded, but the accuracy of SNP calling was high.
AGPase and GBSSI are critical enzymes in starch and sucrose metabolism in plants [21]. High levels of variations were detected in their encoding genes in this study, possibly due to the higher read coverage when compared with other key enzyme encoding genes. The difference among average coverage obtained for each target gene might be attributed to a difference in amplification efficiency of these genes. Interestingly, the subunit-encoding genes of AGPase showed different levels of sequence polymorphisms. The large subunit genes IbAGPb1B and IbAGPb3 and the small subunit genes IbAGPa1 and IbAGPa2 showed high levels of sequence variation in the germplasm collection, and IbAGPa2 and IbAGPb3 had the highest SNP frequencies (26.792 and 26.266 SNPs/kb, respectively) and high number of nsSNPs among the 20 genes. By contrast, only 0 and 12 SNPs were detected in IbAGPb1A and IbAGPb2, respectively, although both genes were sequenced at high coverage (101,057.31 for IbAGPb1A and 61,443.71 for IbAGPb2, respectively, Supplementary Materials Table S6), indicating actual low sequence variation in these subunit genes. Although small number of SNPs was detected in IbAGPb2, the two nsSNPs detected in this gene would cause single amino acid change in the conserved domain, and one of them would influence protein function, indicating the importance of detected variations in IbAGPb2. As the subunits of AGPase had individual functions and expression patterns [50], they might be under different selection pressures, which could contribute to different degrees of sequence variation [51]. Our results provide a basis for further investigation and utilization of each subunit of AGPase in sweet potato.

4.3. CAPS Markers are An Effective Tool for SNP Genotyping in Sweet Potato

SNP genotyping is a major limitation for the comprehensive utilization of SNPs in crops. To address this problem, an efficient, low-cost, and versatile SNP genotyping method must be developed. We tried to genotype the detected SNPs using qPCR and MALDI-TOF mass spectrometry, but found these methods were not available for SNP genotyping in our sweet potato population, due to the polyploidy and high degree of heterozygosity of the sweet potato genome.
Since we did not find a suitable high-throughput SNP genotyping method for the allohexaploid sweet potato, we developed CAPS markers to examine the SNPs identified in this study. CAPS markers are based on PCR amplifications of DNA fragments with specific primers, followed by digestion with restriction endonucleases and separation of the products in an agarose gel. When compared with other PCR-based SNP genotyping methods, the restriction enzyme digestion step would eliminate errors caused by PCR amplification efficiency, and the products would be easier to separate through electrophoresis. As restriction endonucleases only recognize and digest specific sequences, the accuracy of genotyping would be markedly improved. Furthermore, the most important characteristics of CAPS marker is both homo- and heterozygotes could be easily recognized during genotyping [52], possibly rendering CAPS markers the most accurate and suitable method for SNP or InDel genotyping in sweet potato.
In this study, using six CAPS markers developed based on nsSNPs, genotyping was performed and SNP genotypes were easily distinguished among the different sweet potato germplasms. However, considering that not all of the SNPs could be converted into CAPS or derived CAPS (dCAPS) markers, and that it is time-consuming and challenging to perform high-throughput genotyping of the association population [52], using quantitative liquid chromatography-tandem mass spectrometry (LC-MSMS) method [53], or establishing an SNP chip/array through detecting and collecting a set of accurate SNPs might be the ideal strategies to perform high-throughput SNP genotyping of sweet potato.
Three developed CAPS in sweet potato germplasms did not show polymorphisms, possibly because of the minor alleles present in other germplasms used for polymorphism detection, but were not present in the eight germplasms used in the marker test. However, these SNPs were called with a minimum variant frequency of 20%, meaning that these variations should be present in no less than 20% of the 507 sweet potato germplasms. Thus, these markers should be polymorphic in a larger set of germplasms.

4.4. Creation of Intron-Loss Alleles Might Be a Characteristic Mechanism of Regulating Gene Expression in Sweet Potato

Intron losses were detected in IbGBSS1-1 genes. An 1893-bp IbGBSS1-1 gene without any of the 13 introns was isolated from sweet potato variety Suyu No.1 during cloning of reference sequences and was identified as an experimental error. However, a number of intron losses were detected in the sequencing data. We then cloned gene fragments from various germplasms, and designed ILP markers to identify intron-loss IbGBSS1-1 alleles in various sweet potato germplasms. The results confirmed that intron loss might occur in each of the 13 introns, and that the intron-loss alleles were present in some germplasms but absent in others.
We also detected a potential intron-loss gene copy of IbAGPb3, and this gene copy was also shown to be present in some germplasms but absent in others. However, different with that in IbGBSS1-1 genes, the intron loss only occurred in the fifth intron but not exhibited in other intron regions. Because association analysis showed no significant association between the presence/absence of this gene copy and starch properties, the biological relevance of loss of the fifth intron and the diversity of gene copies among sweet potato germplasms remains to be determined.
Intron use is an important component of genome adaptation, and intron gain and loss are the results of genome responses to strong selective pressures. Introns could be lost by exact genomic deletion, or by gene double recombination with a reverse-transcribed copy [54]. The all intron-loss allele might be a new gene created by reverse transcription of mRNA followed by insertion of this cDNA into the genome [54]. Introns have been shown to increase the transcriptional efficiency of genes and enhance gene expression [55,56], but increase the time needed for transcription, and intron-less alleles could be transcribed faster [56].
Genes that are strongly expressed and expressed in all tissues tend to have short introns in humans [56], and intron losses occur preferentially in highly expressed housekeeping genes in mammals [57]. Although IbGBSS1-1 is not a housekeeping gene, it plays key roles in starch biosynthesis in plants, and our previous transcriptome and qRT-PCR analysis demonstrated that IbGBSS1-1 (the unigene comp84815_c0_seq1 shown in Zhang et al., [10]) was expressed at very high levels in sweet potato. We speculate that intron loss is an important mechanism affecting IbGBSS1-1 gene expression through regulating the efficiency, expense, and time of transcription.
However, we did not identify multiple intron losses in other target genes, which also showed high levels of expression in our previous study [10], the function of all intron-loss IbGBSS1-1 alleles and the biological meaning of multiple intron losses in IbGBSS1-1 genes require further investigation. Nevertheless, these discoveries indicated that the creation of intron-loss alleles might be a characteristic mechanism of regulating gene expression in sweet potato genome and should be emphasized in the further studies.

4.5. The Impact of Genetic Variations to Phenotype in Allohexaploid Sweet Potato

In this study, we detected genetic variations in 20 genes. It should be mentioned that there might be approximate six copies of each gene in the allohexaploid (B1B1B2B2B2B2) sweet potato genomes [31,58], and our results also showed 1–37 potential homologs or paralogs of each studied gene in the genome database. During the formation and evolution of polyploid genomes, the duplicated genes might exhibit expressional, regulatory or functional divergence [53,59]. Thus, the impact of variations in a specific gene copy on the phenotype might be determined by the contribution of this gene copy to the phenotype. The SNP or InDel detected in this study might directly affect starch properties of germplasms, if the gene copy is the major one controlling the phenotype, and this variation cause a change in the gene expression or function. Otherwise, if the gene copy is not the major loci controlling starch properties, or its function can be compensated by other gene copy [60], then, the variations detected in this gene copy probably not impact the starch properties. To reveal the effect of single gene copy and single genetic variation to the phenotype will help to elucidate the genetic basis and regulatory mechanism of starch properties in sweet potato.
Furthermore, our results showed that there were a number of multiple copy genes in the sweet potato genome, and some are unusual alleles, such as the intron-loss alleles. Given the potential functional divergence among genes, the orthologous and paralogous genes, and also unusual alleles, should be considered in gene function studies or genetic engineering efforts in sweet potato.

Supplementary Materials

The following are available online at https://www.mdpi.com/2073-4395/10/5/627/s1, Figure S1: Detection of the 13th intron loss in IbGBSS1-1 genes in four sweet potato germplasms using the ILP marker ILP-24 shown in Table 4. M, marker. The numbers 3, 6, 51, and 29 in the figure represent the sweet potato germplasms shown in Table S1, namely, Shangqiu 52-7, D01414, 0929-106, and Sanheshu, respectively. Figure S2: The gene sequences cloned from 23 sweet potato germplasms exhibited the 5th and 6th intron losses of IbGBSS1-1 genes in some of the germplasms. R, the reference gene sequence. The numbers present the sweet potato germplasms shown in Table S1. Table S1: The sweet potato germplasms used in this study. Table S2: Cluster analysis of 507 sweet potato germplasms. Table S3: Subpopulation assignment of the sweet potato germplasms in the population structure analysis. Table S4: Primers used for gene amplification. Table S5: Variation analysis of 20 genes. Table S6. Summary of statistics of reads mapping to the reference sequences. Table S7: Number of potential homologous gene copies of 20 genes identified on each pseudochromosome in the sweet potato genome. Table S8: SNPs and InDels detected in this study. File S1: Reference gene sequences.

Author Contributions

Methodology, K.Z.; software, K.Z., K.L., and H.L.; validation, K.L., S.L., and D.P.; formal analysis, K.Z. and K.L.; investigation, K.Z.; resources, D.T., C.L., and Y.Z.; data curation, K.Z.; writing—original draft preparation, K.Z.; writing—review and editing, K.Z.; visualization, K.Z.; supervision, J.W.; project administration, K.Z.; funding acquisition, C.L. and J.W. All authors have read and agreed to the published version of the manuscript.

Funding

This research was funded by National Key Research and Development Plan (2018YFD1000705, 2018YFD1000700), Fundamental Research Funds for the Central Universities (XDJK2020B032) and the Technology Innovation Fund of Chongqing (cstc2019jscx-msxmX0326).

Acknowledgments

We thank Nanchong Institute of Agricultural Sciences, Chongqing Three Gorges Academy of Agricultural Sciences, Jingsu Xuzhou Sweet potato Research Center and Chongqing Sweet Potato Engineering and Technology Research Center for plant materials.

Conflicts of Interest

The authors declare no conflict of interest. The funders had no role in the design of the study; in the collection, analyses, or interpretation of data; in the writing of the manuscript, or in the decision to publish the results.

References

  1. Kharabian-Masouleh, A.; Waters, D.L.E.; Reinke, R.F.; Henry, R.J. Discovery of polymorphisms in starch-related genes in rice germplasm by amplification of pooled DNA and deeply parallel sequencing. Plant Biotech. J. 2011, 9, 1074–1085. [Google Scholar] [CrossRef] [PubMed]
  2. Lai, K.; Duran, C.; Berkman, P.J.; Lorenc, M.T.; Stiller, J.; Manoli, S.; Hayden, M.J.; Forrest, K.L.; Fleury, D.; Bumann, U.; et al. Single nucleotide polymorphism discovery from wheat next-generation sequence data. Plant Biotechnol. J. 2012, 10, 743–749. [Google Scholar] [CrossRef] [PubMed] [Green Version]
  3. Lu, K.; Wei, L.; Li, X.; Wang, Y.; Wu, J.; Liu, M.; Zhng, C.; Chen, Z.; Xiao, Z.; Jian, H.; et al. Whole-genome resequencing reveals Brassica napus origin and genetic loci involved in its improvement. Nat. Commun. 2019, 10, 1154. [Google Scholar] [CrossRef] [PubMed] [Green Version]
  4. Jayaswall, K.; Sharma, H.; Bhandawat, A.; Sagar, R.; Yadav, V.K.; Sharma, V.; Mahajan, V.; Roy, J.; Singh, M. Development of intron length polymorphic (ILP) markers in onion (Allium cepa L.), and their cross-species transferability in garlic (A. sativum L.) and wild relatives. Genet. Resour. Crop. Evol. 2019, 66, 1379–1388. [Google Scholar] [CrossRef]
  5. Li, W.; Zhu, Z.; Chern, M.; Yin, J.; Yang, C.; Ran, L.; Cheng, M.; He, M.; Wang, K.; Wang, J.; et al. A natural allele of a transcription factor in rice confers broad-spectrum blast resistance. Cell 2017, 170, 114–126. [Google Scholar] [CrossRef] [PubMed] [Green Version]
  6. Li, F.; Chen, B.; Xu, K.; Wu, J.; Song, W.; Bancroft, I.; Harper, A.L.; Trick, M.; Liu, S.; Gao, G.; et al. Genome-wide association study dissects the genetic architecture of seed weight and seed quality in rapeseed (Brassica napus L.). DNA Res. 2014, 21, 355–367. [Google Scholar] [CrossRef] [Green Version]
  7. Mammadov, J.; Aggarwal, R.; Buyyarapu, R.; Kumpatla, S. SNP markers and their impact on plant breeding. Int. J. Plant Genom. 2012, 2012, 728398. [Google Scholar] [CrossRef]
  8. Burri, B.J. Evaluating sweet potato as an intervention food to prevent vitamin A deficiency. Compr. Rev. Food Sci. Food Saf. 2011, 10, 118–130. [Google Scholar] [CrossRef]
  9. Mitra, S. Nutritional status of orange-fleshed sweet potatoes in alleviating Vitamin A malnutrition through a food-based approach. J. Nutr. Food Sci. 2012, 2, 8. [Google Scholar] [CrossRef] [Green Version]
  10. Zhang, K.; Wu, Z.; Tang, D.; Luo, K.; Lu, H.; Liu, Y.; Dong, J.; Wang, X.; Lv, C.; Wang, J.; et al. Comparative transcriptome analysis reveals critical function of sucrose metabolism related-enzymes in starch accumulation in the storage root of sweet potato. Front. Plant Sci. 2017, 8, 914. [Google Scholar] [CrossRef]
  11. Nedunchezhiyan, M.; Byju, G.; Jata, S.K. Sweet Potato Agronomy. Fruit Veg. Cereal. Sci. Biotech. 2012, 6, 1–10. [Google Scholar]
  12. Srichuwong, S.; Orikasa, T.; Matsuki, J.; Shiina, T.; Kobayashi, T.; Tokuyasu, K. Sweet potato having a low temperature-gelatinizing starch as a promising feedstock for bioethanol production. Biomass Bioenergy 2012, 39, 120–127. [Google Scholar] [CrossRef]
  13. Koçar, G.; Civaş, N. An overview of biofuels from energy crops: Current status and future prospects. Renew. Sustain. Energy Rev. 2013, 28, 900–916. [Google Scholar] [CrossRef]
  14. Zhang, K.; Wu, Z.; Tang, D.; Lv, C.; Luo, K.; Zhao, Y.; Liu, X.; Huang, Y.; Wang, J. Development and identification of SSR markers associated with starch properties and β-Carotene content in the storage root of sweet potato (Ipomoea batatas L.). Front. Plant Sci. 2016, 7, 223. [Google Scholar] [CrossRef] [PubMed] [Green Version]
  15. Zhou, W.; Yang, J.; Hong, Y.; Liu, G.; Zheng, J.; Gu, Z.; Zhang, P. Impact of amylose content on starch physicochemical properties in transgenic sweet potato. Carbohydr. Polym. 2015, 122, 417–427. [Google Scholar] [CrossRef] [PubMed]
  16. Ren, Z.; He, S.; Zhao, N.; Zhai, H.; Liu, Q. A sucrose non-fermenting-1-related protein kinase-1 gene, IbSnRK1, improves starch content, composition, granule size, degree of crystallinity and gelatinization in transgenic sweet potato. Plant Biotechnol. J. 2019, 17, 21–32. [Google Scholar] [CrossRef]
  17. Tumwegamire, S.; Kapinga, R.; Rubaihayo, P.R.; Labonte, D.R.; Grüneberg, W.J.; Burgos, G.; Felde, T.Z.; Carpio, R.; Pawelzik, E.; Mwanga, R.O.M. Evaluation of dry Matter, protein, starch, sucrose, β-carotene, iron, zinc, calcium, and magnesium in East African sweetpotato [Ipomoea batatas (L.) Lam] germplasm. HortScience 2011, 46, 348–357. [Google Scholar] [CrossRef]
  18. Lai, Y.C.; Wang, S.Y.; Gao, H.Y.; Nguyen, K.M.; Nguyen, C.H.; Shih, M.C.; Lin, K.H. Physicochemical properties of starches and expression and activity of starch biosynthesis-related genes in sweet potatoes. Food Chem. 2016, 199, 556–564. [Google Scholar] [CrossRef]
  19. Kharabian-Masouleh, A.; Waters, D.L.E.; Reinke, R.F.; Ward, R.; Henry, R.J. SNP in starch biosynthesis genes associated with nutritional and functional properties of rice. Sci. Rep. 2012, 2, 557. [Google Scholar] [CrossRef]
  20. Cook, J.P.; McMullen, M.D.; Holland, J.B.; Tian, F.; Bradbury, P.; Ross-Ibarra, J.; Buckler, E.S.; Flint-Garcia, S.A. Genetic architecture of maize kernel composition in the nested association mapping and inbred association panels. Plant Physiology 2012, 158, 824–834. [Google Scholar] [CrossRef] [Green Version]
  21. Schreiber, L.; Nader-Nieto, A.C.; Schönhals, E.M.; Walkemeier, B.; Gebhardt, C. SNPs in genes functional in starch-sugar interconversion associate with natural variation of tuber starch and sugar content of potato (Solanum tuberosum L.). G3 Genes Genomes Genet. 2014, 4, 1797–1811. [Google Scholar] [CrossRef] [PubMed] [Green Version]
  22. Shimada, T.; Otani, M.; Hamada, T.; Kim, S.H. Increase of amylose content of sweetpotato starch by RNA interference of the starch branching enzyme II gene (IbSBEII). Plant Biotech. 2006, 23, 85–90. [Google Scholar] [CrossRef] [Green Version]
  23. Otani, M.; Hamada, T.; Katayama, K.; Kitahara, K.; Kim, S.H.; Takahata, Y.; Kim, S.-H.; Yasuhiro Takahata, Y.; Suganuma, T.; Shimada, T. Inhibition of the gene expression for granule-bound starch synthase I by RNA interference in sweet potato plants. Plant Cell Rep. 2007, 26, 1801–1807. [Google Scholar] [CrossRef] [PubMed]
  24. Wang, Y.; Li, Y.; Zhang, H.; Zhai, H.; Liu, Q.; He, S. A soluble starch synthase I gene, IbSSI, alters the content, composition, granule size and structure of starch in transgenic sweet potato. Sci. Rep. 2017, 7, 2315. [Google Scholar] [CrossRef] [Green Version]
  25. Wang, H.X.; Wu, Y.L.; Zhang, Y.D.; Yang, J.; Fan, W.J.; Zhang, H.; Zhao, S.S.; Yuan, L.; Zhang, P. CRISPR/Cas9-based mutagenesis of starch biosynthetic genes in sweet potato (Ipomoea Batatas) for the improvement of starch quality. Int. J. Mol. Sci. 2019, 20, 4702. [Google Scholar] [CrossRef] [Green Version]
  26. Metzker, M.L. Sequencing technologies—The next generation. Nat. Rev. Genet. 2010, 11, 31–46. [Google Scholar] [CrossRef] [Green Version]
  27. Nielsen, R.; Paul, J.S.; Albrechtsen, A.; Song, Y.S. Genotype and SNP calling from next-generation sequencing data. Nat. Rev. Genet. 2011, 12, 443–451. [Google Scholar] [CrossRef]
  28. Su, W.J.; Zhao, N.; Lei, J.; Wang, L.J.; Chai, S.S.; Yang, X.S. SNP sites developed by specific length amplification fragment sequencing (SLAF-seq) in Sweetpotato. Sci. Agric. Sinica 2016, 49, 27–34. [Google Scholar]
  29. Kou, M.; Xu, J.; Li, Q.; Liu, Y.; Wang, X.; Tang, W.; Yan, H.; Zhang, Y.G.; Ma, D.F. Development of SNP markers using RNA-seq technology and tetra-primer ARMS-PCR in sweetpotato. J. Integr. Agric. 2017, 16, 464–470. [Google Scholar] [CrossRef]
  30. Shirasawa, K.; Tanaka, M.; Takahata, Y.; Ma, D.F.; Cao, Q.H.; Liu, Q.C.; Zhai, H.; Kwak, S.-S.; Jeong, J.C.; Cheol, J.; et al. A high-density SNP genetic map consisting of a complete set of homologous groups in autohexaploid sweetpotato (Ipomoea batatas). Sci. Rep. 2017, 7, 44207. [Google Scholar] [CrossRef] [Green Version]
  31. Yang, J.; Moeinzadeh, M.H.; Kuhl, H.; Helmuth, J.; Xiao, P.; Haas, S.; Liu, G.; Zheng, J.L.; Sun, Z.; Weijuan Fan, W.J.; et al. Haplotype-resolved sweet potato genome traces back its hexaploidization history. Nat. Plants 2017, 3, 696–703. [Google Scholar] [CrossRef] [PubMed]
  32. Kaur, S.; Francki, M.G.; Forster, J.W. Identification, characterization and interpretation of single-nucleotide sequence variation in allopolyploid crop species. Plant Biotech. J. 2012, 10, 125–138. [Google Scholar] [CrossRef] [PubMed]
  33. Zhang, K.; Wu, Z.D.; Li, Y.H.; Zhang, H.; Wang, L.P.; Zhou, Q.L.; Tang, D.B.; Fu, Y.F.; He, F.F.; Jiang, Y.C.; et al. ISSR-based molecular characterization of an elite germplasm collection of sweet potato (Ipomoea batatas L.) in China. J. Integr. Agric. 2014, 13, 2346–2361. [Google Scholar] [CrossRef] [Green Version]
  34. Luo, K.; Lu, H.X.; Wu, Z.D.; Wu, X.L.; Yin, W.; Tang, D.B.; Wang, J.C.; Zhang, K. Genetic diversity and population structure analysis of main sweet potato breeding parents in southwest China. Sci. Agric. Sinica 2016, 49, 593–608. [Google Scholar]
  35. Kim, S.H.; Hamada, T. Rapid and reliable method of extracting DNA and RNA from sweetpotato, Ipomoea batatas (L). Lam. Biotechnol. Lett. 2005, 27, 1841–1845. [Google Scholar] [CrossRef]
  36. Rohlf, F.J. NTSYS-pc: Numerical Taxonomy and Multivariate Analysis System, Version 2.1. Exeter Software; Setauket: New York, NY, USA, 2002. [Google Scholar]
  37. Nei, M. Genetic distance between populations. Am. Nat. 1972, 106, 283–292. [Google Scholar] [CrossRef]
  38. Saitou, N.; Nei, M. The neighbor-joining method: A new method for reconstructing phylogenyetic trees. Mol. Biol. Evol. 1987, 4, 406–425. [Google Scholar]
  39. Kumar, S.; Stecher, G.; Li, M.; Knyaz, C.; Tamura, K.; Notes, A. MEGA X: Molecular evolutionary genetics analysis across computing platforms. Mol. Biol. Evol. 2018, 35, 1547–1549. [Google Scholar] [CrossRef]
  40. Hubisz, M.J.; Falush, D.; Stephens, M.; Pritchard, J.K. Inferring weak population structure with the assistance of sample group information. Mol. Ecol. Resour. 2009, 9, 1322–1332. [Google Scholar] [CrossRef] [Green Version]
  41. Evanno, G.; Regnaut, S.; Goudet, J. Detecting the number of clusters of individuals using the software STRUCTURE: A simulation study. Mol. Ecol. 2005, 14, 2611–2620. [Google Scholar] [CrossRef] [Green Version]
  42. Rosenberg, N.A. DISTRUCT: A program for the graphical display of population structure. Mol. Ecol Notes 2004, 4, 137–138. [Google Scholar] [CrossRef]
  43. Jones, P.; Binns, D.; Chang, H.Y.; Fraser, M.; Li, W.; McAnulla, C.; McWilliam, H.; Maslen, J.; Mitchell, A.; Nuka, G.; et al. InterProScan 5: Genome-scale protein function classification. Bioinformatics 2014, 30, 1236–1240. [Google Scholar] [CrossRef] [PubMed] [Green Version]
  44. Tang, H.; Thomas, P.D. PANTHER-PSEP: Predicting disease-causing genetic variants using position-specific evolutionary preservation. Bioinformatics 2016, 32, 2230–2232. [Google Scholar] [CrossRef] [PubMed]
  45. Isobe, S.; Shirasawa, K.; Hirakawa, H. Current status in whole genome sequencing and analysis of Ipomoea spp. Plant Cell Rep. 2019, 38, 1365–1371. [Google Scholar] [CrossRef] [PubMed] [Green Version]
  46. Ingman, M.; Gyllensten, U. SNP frequency estimation using massively parallel sequencing of pooled DNA. Eur. J. Hum. Genet. 2009, 17, 383–386. [Google Scholar] [CrossRef] [PubMed]
  47. Madelaine, R.; Notwell, J.H.; Skariah, G.; Halluin, C.; Chen, C.C.; Bejerano, G.; Mourrain, P. A screen for deeply conserved non-coding GWAS SNPs uncovers a MIR-9-2 functional mutation associated to retinal vasculature defects in human. Nucleic Acids Res. 2018, 46, 3517–3531. [Google Scholar] [CrossRef] [Green Version]
  48. Deng, N.; Zhou, H.; Fan, H.; Yuan, Y. Single nucleotide polymorphisms and cancer susceptibility. Oncotarget 2017, 8, 110635–110649. [Google Scholar] [CrossRef] [Green Version]
  49. Hyma, K.E.; Barba, P.; Wang, M.; Londo, J.P.; Acharya, C.B.; Mitchell, S.E.; Sun, Q.; Reisch, B.; Cadle-Davidson, L. Heterozygous mapping strategy (HetMappS) for high resolution genotyping-by-sequencing markers: A case study in grapevine. PLoS ONE 2015, 10, 0134880. [Google Scholar] [CrossRef] [Green Version]
  50. Mugford, S.T.; Fernandez, O.; Brinton, J.; Flis, A.; Krohn, N.; Encke, B.; Regina Feil, R.; Sulpice, R.; Lunn, J.E.; Stitt, M.; et al. Regulatory properties of ADP glucose pyrophosphorylase are required for adjustment of leaf starch synthesis in different photoperiods. Plant Physiol. 2014, 166, 1733–1747. [Google Scholar] [CrossRef] [Green Version]
  51. Henry, R.J.; Nevo, E. Exploring natural selection to guide breeding for agriculture. Plant Biotechnol. J. 2014, 12, 655–662. [Google Scholar] [CrossRef]
  52. Shavrukov, Y.N. CAPS markers in plant biology. Russ. J. Genet. Appl. Res. 2016, 6, 279–287. [Google Scholar] [CrossRef]
  53. van Wesemael, J.; Hueber, Y.; Kissel, E.; Campos, N.; Swennen, R.; Carpentier, S. Homeolog expression analysis in an allotriploid non-model crop via integration of transcriptomics and proteomics. Sci. Rep. 2018, 8, 1353. [Google Scholar] [CrossRef] [PubMed]
  54. Deshmukh, R.K.; Sonah, H.; Singh, N.K. Intron gain, a dominant evolutionary process supporting high levels of gene expression in rice. J. Plant Biochem. Biotechnol. 2016, 25, 142–146. [Google Scholar] [CrossRef]
  55. Hir, H.L.; Nott, A.; Moore, M.J. How introns influence and enhance eukaryotic gene expression. TRENDS Biochem. Sci. 2003, 28, 215–220. [Google Scholar] [CrossRef]
  56. Jeffares, D.C.; Mourier, T.; Penny, D. The biology of intron gain and loss. TRENDS Genet. 2006, 22, 16–22. [Google Scholar] [CrossRef] [PubMed]
  57. Mourier, T.; Jeffares, D.C. Eukaryotic Intron Loss. Science 2003, 300, 1393. [Google Scholar] [CrossRef] [Green Version]
  58. Gao, M.; Soriano, S.F.; Cao, Q.H.; Yang, X.S.; Lu, G.Q. Hexaploid sweetpotato (Ipomoea batatas (L.) Lam.) may not be a true type to either auto- or allopolyploid. PLoS ONE 2020, 15, e0229624. [Google Scholar] [CrossRef] [Green Version]
  59. Fan, Y.H.; Yu, M.N.; Liu, M.; Zhang, R.; Sun, W.; Qian, M.C.; Duan, H.C.; Chang, W.; Ma, J.Q.; Qu, C.M.; et al. Genome-wide identification, evolutionary and expression analyses of the GALACTINOL SYNTHASE gene family in rapeseed and tobacco. Int. J. Mol. Sci. 2017, 18, 2768. [Google Scholar] [CrossRef] [Green Version]
  60. Gu, Z.; Steinmetz, L.M.; Gu, X.; Scharfe, C.; Davis, R.W.; Li, W.-H. Role of duplicate genes in genetic robustness against null mutations. Nature 2003, 421, 63–66. [Google Scholar] [CrossRef]
Figure 1. Genetic diversity and population structure analysis of 507 sweet potato germplasms. (a) The 507 germplasms could be divided into eight subgroups based on neighbor-joining (NJ) clustering. The different colored lines represent the subgroups inferred by NJ cluster analysis. (b) STRUCTURE estimation of the number of subpopulations for K ranging from 1 to 20 by LnP (D) did not show a clear cut-off point for the true K value, and delta K values (ΔK) indicating the presence of ten subpopulations; (c) Ten subpopulations in the 507 germplasms inferred from population structure analysis. The vertical coordinate of each subgroup indicates the membership coefficient of each individual, and the colors of the bar indicate the ten subpopulations identified using STRUCTURE.
Agronomy 10 00627 g001
Figure 2. Summary of the single nucleotide polymorphisms (SNPs) and insertions/deletions (InDels) identified in this study. (a) Summary of the number of SNPs and InDels detected in the 20 genes. ORF, open reading frame; UTR, untranslated region. (b) Number of substitutions in the detected SNPs. CDS, coding sequence;
Agronomy 10 00627 g002
Figure 3. Test of CAPS markers in eight sweet potato germplasms. The numbers 3, 8, 492, 9, 10, 273, 2, and 1 represent the sweet potato germplasms shown in Supplementary Materials Table S1, which were Shangqiu52-7, Yushu33, Yanshu No.5, Chaoshu No.1, Xinxiang, Xiaohuaye, Mianfen No.1, and Suyu No.1, respectively. The measured starch contents of the eight germplasms were 4.476%, 25.611%, 11.036%, 10.206%, 19.584%, 14.728%, 29.386%, and 16.853%, respectively. The measured amylose–amylopectin ratio of the eight germplasms was 0.300, 0.308, 0.277, 0.309, 0.290, 0.282, 0.315, and 0.282, respectively. (a), (c), (e), (g), (i), and (k), PCR products obtained using CAPS1, CAPS5, CAPS6, CAPS3, CAPS2, and CAPS4 primers, respectively. (b), (d), (f), (h), (j) and (l), PCR products were digested using the corresponding restriction endonucleases. M, marker (Trans2K Plus II DNA marker, TransGen Biotech), the band size from top to bottom is 8000; 5000; 3000; 2000; 1000; 750; 500; 250; and 100 bp, respectively.
Agronomy 10 00627 g003
Figure 4. The two gene forms detected in the IbAGPb3 gene sequence. (a) Gene structure analysis of a 79-bp insertion and deletion form of IbAGPb3. (b) Cloning and sequencing of the IbAGPb3 sequences in sweet potato germplasms. R: reference sequence; the numbers 3, 6, 10, 11, 14, 18, 29, and 51 represent the sweet potato germplasms shown in Supplementary Materials Table S1. (c) and (d) Detection of the two gene forms in sweet potato germplasms. M: marker; the numbers represent the sweet potato germplasms shown in Supplementary Materials Table S1; Y20, sweet potato variety Yanshu No.20.
Agronomy 10 00627 g004
Figure 5. Detection of intron losses in IbGBSS1-1. The intron losses in IbGBSS1-1 genes were detected in four sweet potato germplasms using the ILP markers shown in Table 4. M, marker. The numbers 3, 6, 51, and 29 represent the sweet potato germplasms shown in Supplementary Materials Table S1, namely, Shangqiu 52-7, D01414, 0929-106, and Sanheshu, respectively. The measured starch content of the four germplasms was 4.476%, 26.637%, 10.934%, and 22.360%, respectively. The measured amylose–amylopectin ratio of the four germplasms was 0.300, 0.291, 0.300, and 0.302, respectively. The bands in red boxes are the PCR products of intron-loss IbGBSS1-1 genes.
Agronomy 10 00627 g005
Table 1. Non-synonymous SNPs (nsSNPs) detected in the candidate gene sequences.
No.GenePositionNucleotide SubstitutionAmino acid ChangePolarity ChangedAmino Acid Change in Conserved Domain
1IbAGPb1B2,992 bp/457 aaC/GHis to GlnNo
23,304 bp/507 aaT/CVal to AlaNo
3IbAGPb21,572 bp/205 aaG/AAsp to AsnYesYes
42,454 bp/340 aaA/GTry to HisNoYes
5IbAGPb32 bp/1 aaT/AStart codon
629 bp/10 aaC/GAla to GlyNo
7160 bp/54 aaG/AGly to SerYes
8163 bp/55 aaG/AThr to AlaYes
9166 bp/56 aaA/GLys to GluNo
101,526 bp/294 aaC/APro to GlnYesYes
112,511 bp/445 aaT/APhe to TryYes
12IbAGPa1125 bp/19 aaG/TGlu to ThrYes
132,263 bp/310 aaC/TAla to ValNo
14IbAGPa22,140 bp/286 aaC/APhe to LeuNoYes
152,538 bp/342 aaA/CGln to ProYesYes
162,717 bp/376 aaG/CPhe to LeuNo
172,971 bp/423 aaG/CVal to LeuNoa
18IbGBSS1-12,296 bp/217 aaA/CLys to AsnYes
194,276 bpG/Tpre-termination
204,280 bp/585 aaT/GVal to GlyYes
214,283 bp/586 aaC/ACys to AspYes
224,311 pb/595 aaC/GAsp to GluNo
23IbGBSS1-21,372 bp/137aaA/GIle to ValNoYes
241,892 bp/216aaA/GSer to GlyNoYes
252,736 bp/376 aaT/GVal to GlyYes
26IbSPSS67198 bp/59 aaT/CLeu to ProNo
27421 bp/133 aaDA/TGlu to AspNoYes
28441 bp/140 aaC/TPro to LeuNoYes
291,779 bp/586 aaC/AAla to AspNo
30IbGBSS2779 bp/209 aaT/CPhe to LeuNoYes
31797–798 bp/238 aaAA/GGAsn to GlyYesYes
32915 bp /277 aaT/AVal to GluNoYes
331,985 bp/634 aaA/GSer to GlyYes
34IbSSS691 bp/111 aaG/AGlu to LysNo
35IbSBE1658 bpG/Tper-termination
361,654 bp/493 aaT/CSer to ProYesYes
37IbSal139 bp/42 aaA/GLys to ArgNo
38453 bp/147 aaC/AGln to LysYesYes
39641–642 bp/210 aaTA/GTThr to SerNo
40898 bp/295 aaA/GLys to ArgNoYes
411467 bpG/Tper-termination
421472 bp/486 aaG/TTrp to CysNoYes
43IbSP3,584 bp/458 aaT/CSer to ProYes
443,743 bp/511 aaA/GLys to GluNo
45IbSuSy194 bp/9 aaC/AThr to AsnNo
46110 bp/12 aaA/CGln to ProYes
47IbSuSy3911–912 bp/289 aaGG/CCGly to AlaNoYes
481,280–1,281 bp/412 aaGT/ACSer to AsnNoYes
49IbUDPGH13140 bp/38 aaG/AArg to GlnYesYes
501,318 bp/431 aaA/TLys to stop codon
Table 2. Cleaved amplified polymorphic sequence (CAPS) markers developed based on nsSNPs and tested in sweet potato germplasms.
MarkerGenePositionBase ChangeRestriction EndonucleasePrimer PositionPrimer Sequence
CAPS1IbAGPa12263C/TBtgZI1875CGCTGGAGATCACCTATACCGAATGG
2511CAGTGAGACTTCACATAGAGCTACTG
CAPS2IbAGPa22538A/CHindIII2242CCCTGGAGCCAATGACTTTGGAAGTG
2794CACTGTCCGTGACATCAGCATCAAGC
CAPS3IbAGPa22971G/CDdeI2730GCTCCAATCTACACTCAGCCTCGATA
3274GCCAATGCCAATTGGGATGCTGCCC
CAPS4IbGBSS1-14283C/ABseYI3878GTTGCTTGTGCTCAGTGTGAAACTG
4327CAAGTGGTGCAATTTCGTCTCCTTC
CAPS5IbSP3584T/CRsaI3407TGGAGTTATGAGCTGATGGAGAAGC
3937ATGAATCTCGGCAACTCCATTTACA
CAPS6IbSuSy1110A/CEcoRII6TGTGACACCCGGGGAGCCTTCGTTCA
470GCCACGTGTACCTATTTCAAGCAAAC
Table 3. Frameshift InDels detected in the 20 gene sequences.
No.GenePosition
(bp)
Deletion(D)/Insertion(I)Deletion/Insertion nucleotideInfluence on protein
1IbSPSS67188–189ICReading frame shift, and translation pre-terminate 64 bp downstream of the insertion site
2234DAReading frame shift, and translation pre-terminate 32 bp downstream of the deletion site
3437–438IC Glu to Ala (139 aa), reading frame shift and translation pre-terminate 22 bp downstream of the insertion site
41776DTReading frame shift, amino acid changed and ORF become longer
5IbGBSS2681–682IAMet to Ile (176 aa), and reading frame shift, and translation pre-terminate 30 bp downstream of the insertion site
6873DAAsp to Ala (240 aa), reading frame shift and translation pre-terminate 5 bp downstream of the deletion site
7914DG Val to Trp (254 aa), and reading frame shift, translation pre-terminate 51 bp downstream of the deletion site
8915DTVal to Gly (254 aa), and reading frame shift and translation pre-terminate 50 bp downstream of the deletion site
9IbSBE1 1835DCAla to Val (553 aa), translation pre-terminate 32 bp downstream of the deletion site
10IbSal1981–1982IGHis to Gln, reading frame shift and translation pre-termination
11IbSP3580–3581ITAmino acid changed from the insertion site and translation pre-terminate 26 bp downstream of the insertion site
12IbSuSy196ITEnd coding and translation pre-termination
Table 4. Intron length polymorphism (ILP) markers developed based on ILPs detected in IbGBSS1-1.
No.Primer NamePrimer SequencePrimer LengthTm
(°C)
Intron No. DetectedStart/Stop Site in Reference SequenceLength of PCR Products without and with Intron Loss
1FIbILP-16CGTGCTTCCACACTCTTGCAGTAGCTG2769.161412662/166
RIbILP-16CCCCACTTTTGATTCTCCAGAAGTGGCA2767.541074
2FIbILP-17GGACTTGGAGATGTTCTTGGAGGATTGCC2968.8721294444/77
RIbILP-17CGGGGACACACTGTCATAACTCTATGCC2869.011737
3FIbILP-18GTACAAAGATGCTTGGGATACCTGTGTG2866.083 and 41747392/196
RIbILP-18GTCCTTGTAATCTTTCCCAGCCTTGGG2767.642139
4FIbILP-19CAACCAGTTGCGGTTCAGTTTGTTGTGCC2968.875 and 62139357/173
RIbILP-19TCATGTAGATTCCTCTCGACTGGTACATGG3067.372496
5FIbILP-21CACGGGTACTTGTAATGGAATGGATACCCA3067.3792985287/206
RIbILP-21TGTCTGAGCCTTTCTGCTCTTCAAGTCTG2967.453272
6FIbILP-22GCAGAAAGGCTCAGACATTCTTTATGCTGC3067.37103256325/235
RIbILP-22GAGACCACACGGCTCAAATCTGCTCG2669.323581
7FIbILP-23GAGCCGTGTGGTCTCTTTCAGTTGCA2667.7511 and 123567371/178
RIbILP-23CAGTGGTTATCACCTTCAGCACGTCCT2767.643938
8FIbILP-24CACTGAAATGATCAAGAACTGCATGTCAC2964.62133976351/137
RIbILP-24CAAGTGGTGCAATTTCGTCTCCTTCAA2764.64327

