The Performance of Mesotrophic Arrhenatheretum Grassland under Different Cutting Frequency Regimes for Biomass Production in Southwest Germany

 ,
,  ,
, 
Abstract
:1. Introduction
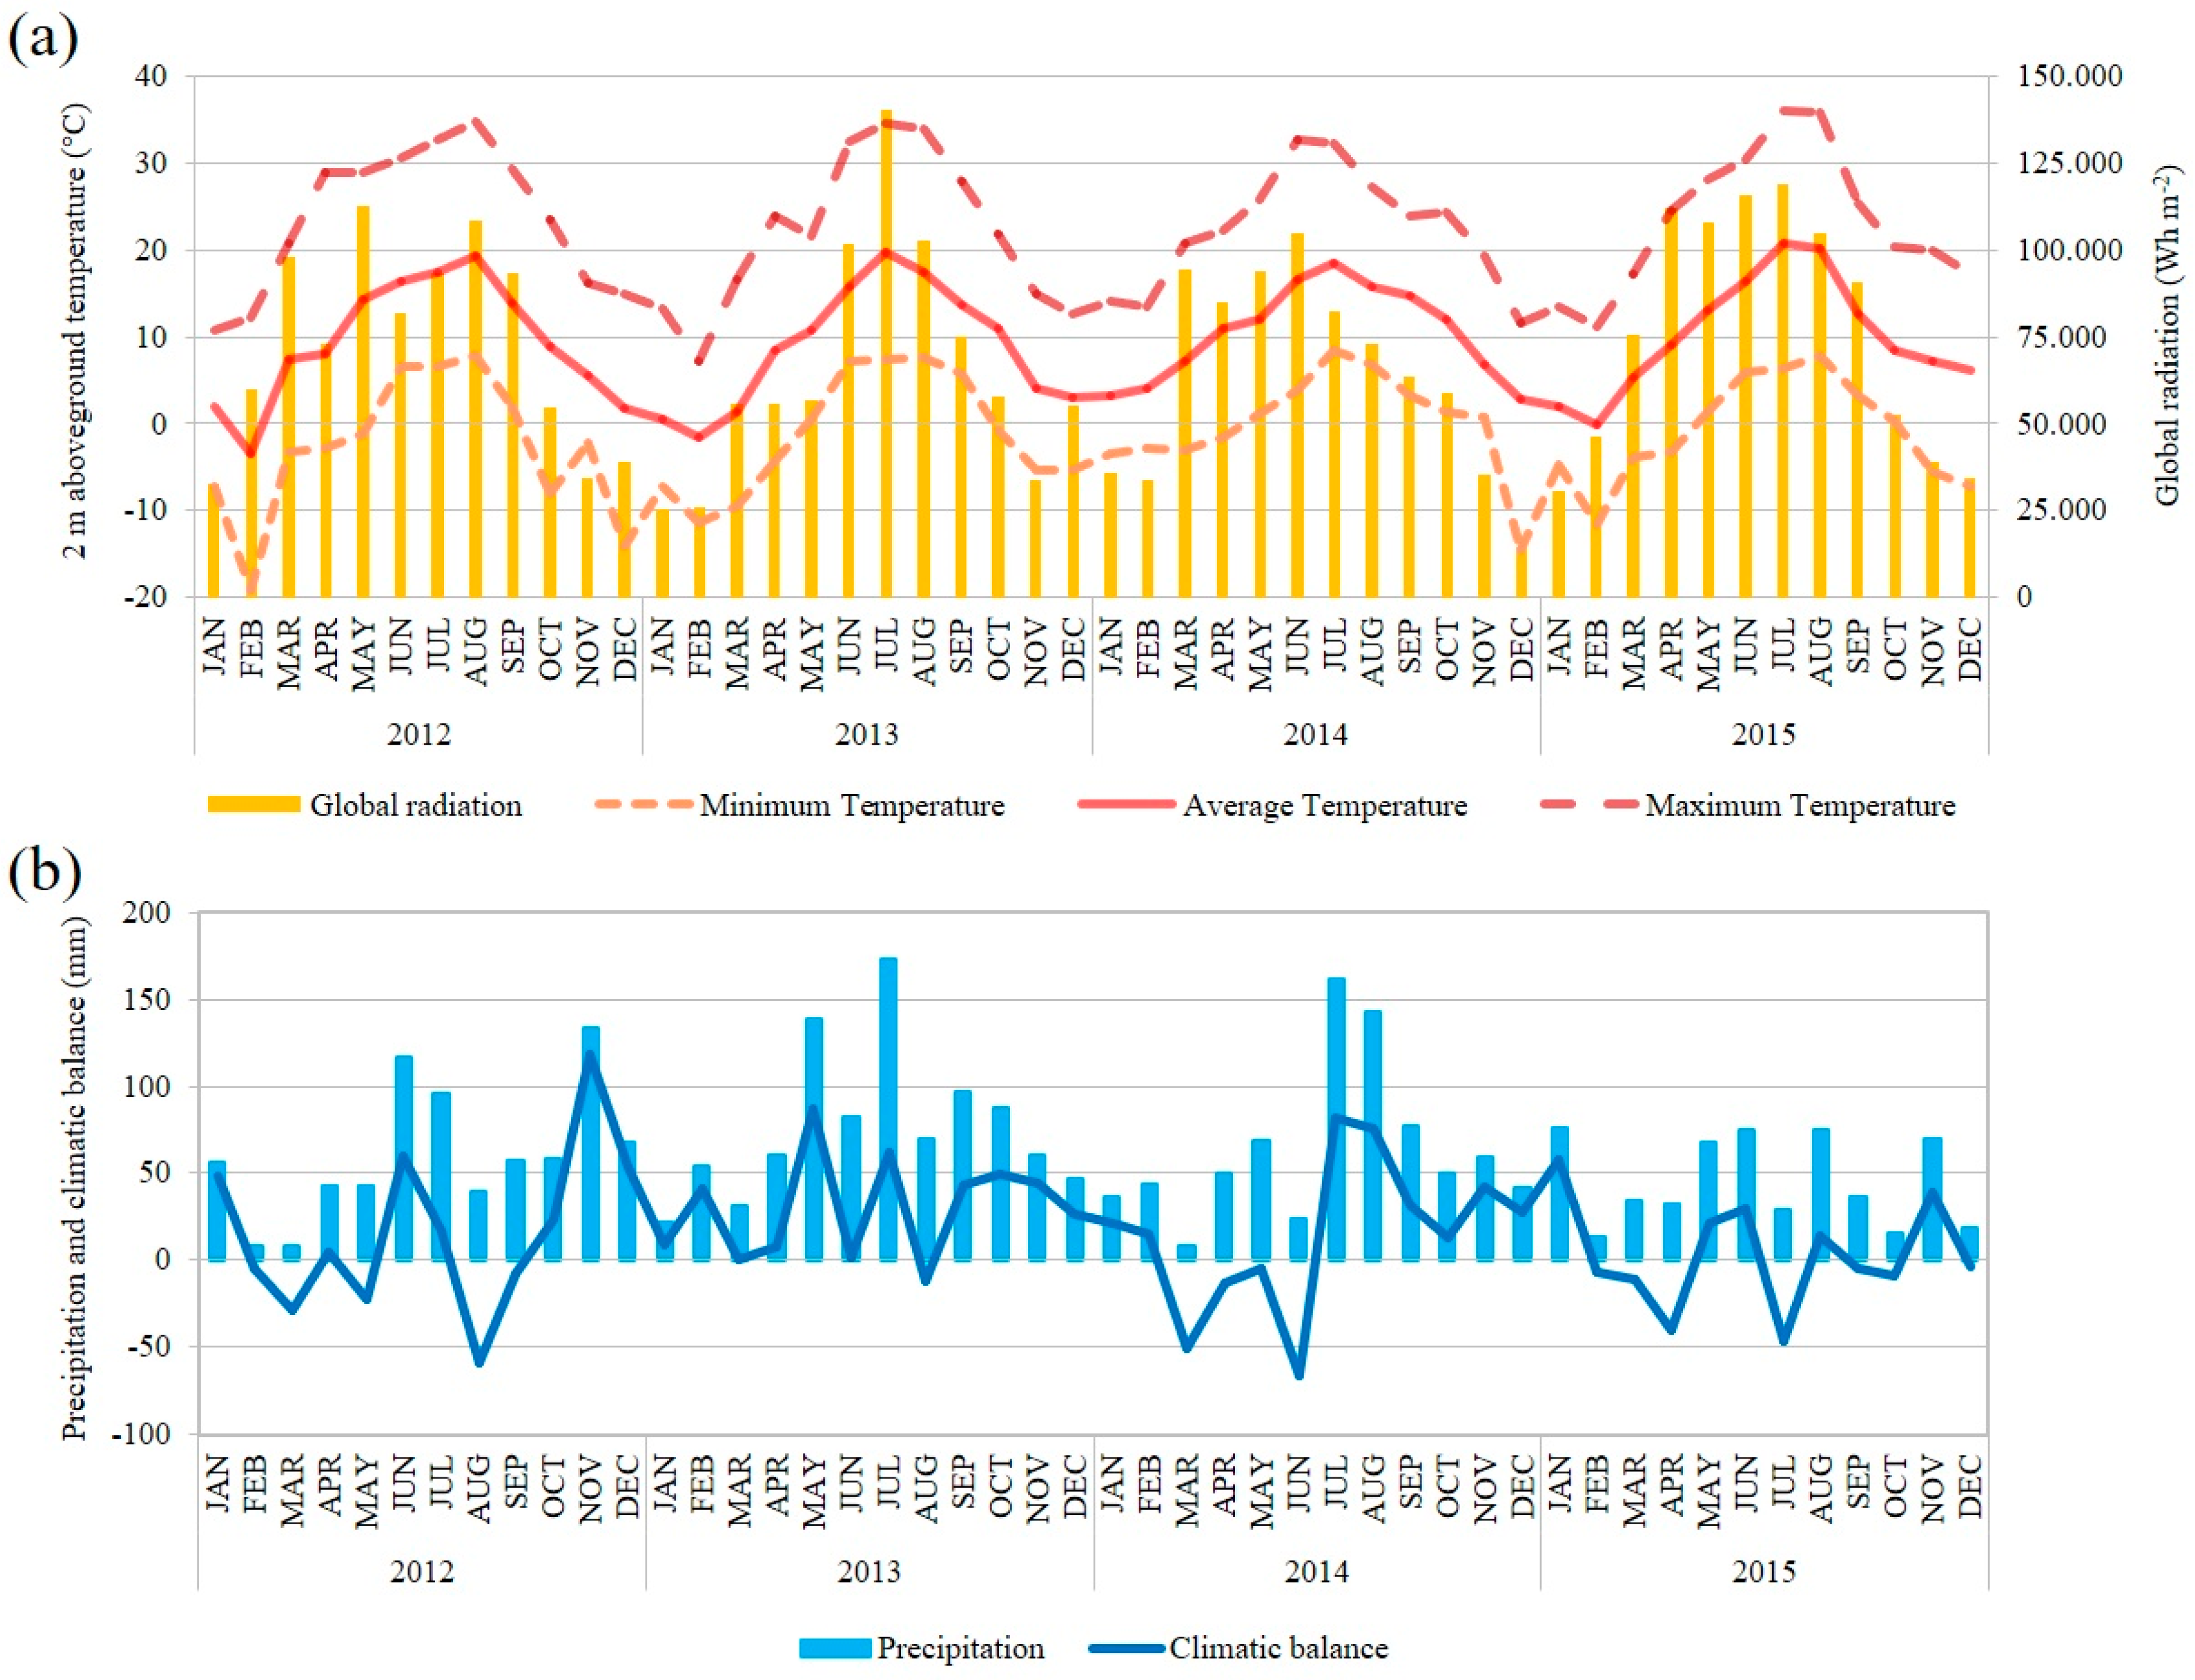
2. Materials and Methods
2.1. Fertilization and Harvest Management
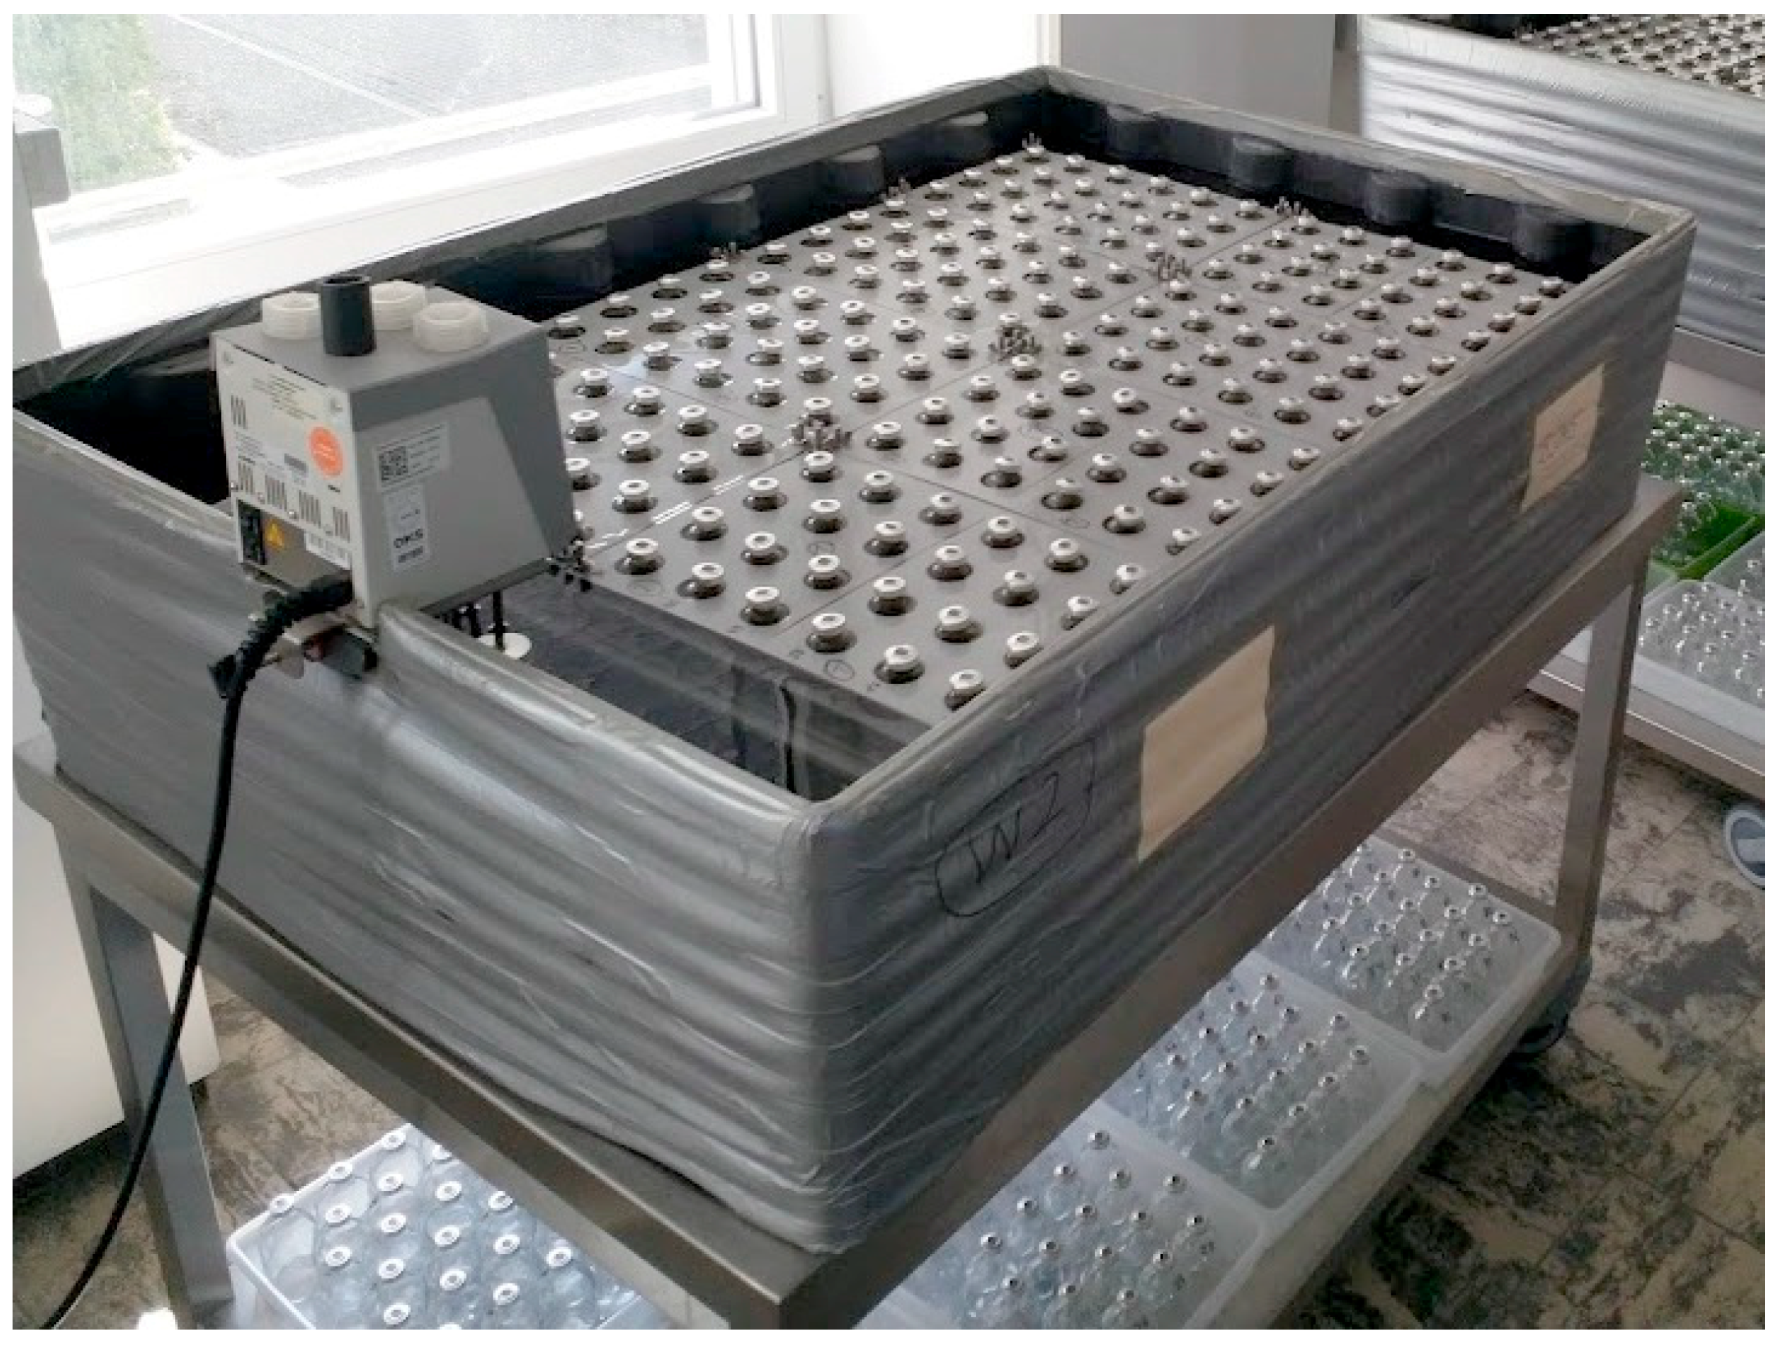
2.2. Fiber Analysis and Preliminary Biogas Batch Test
2.3. Statistical Analysis
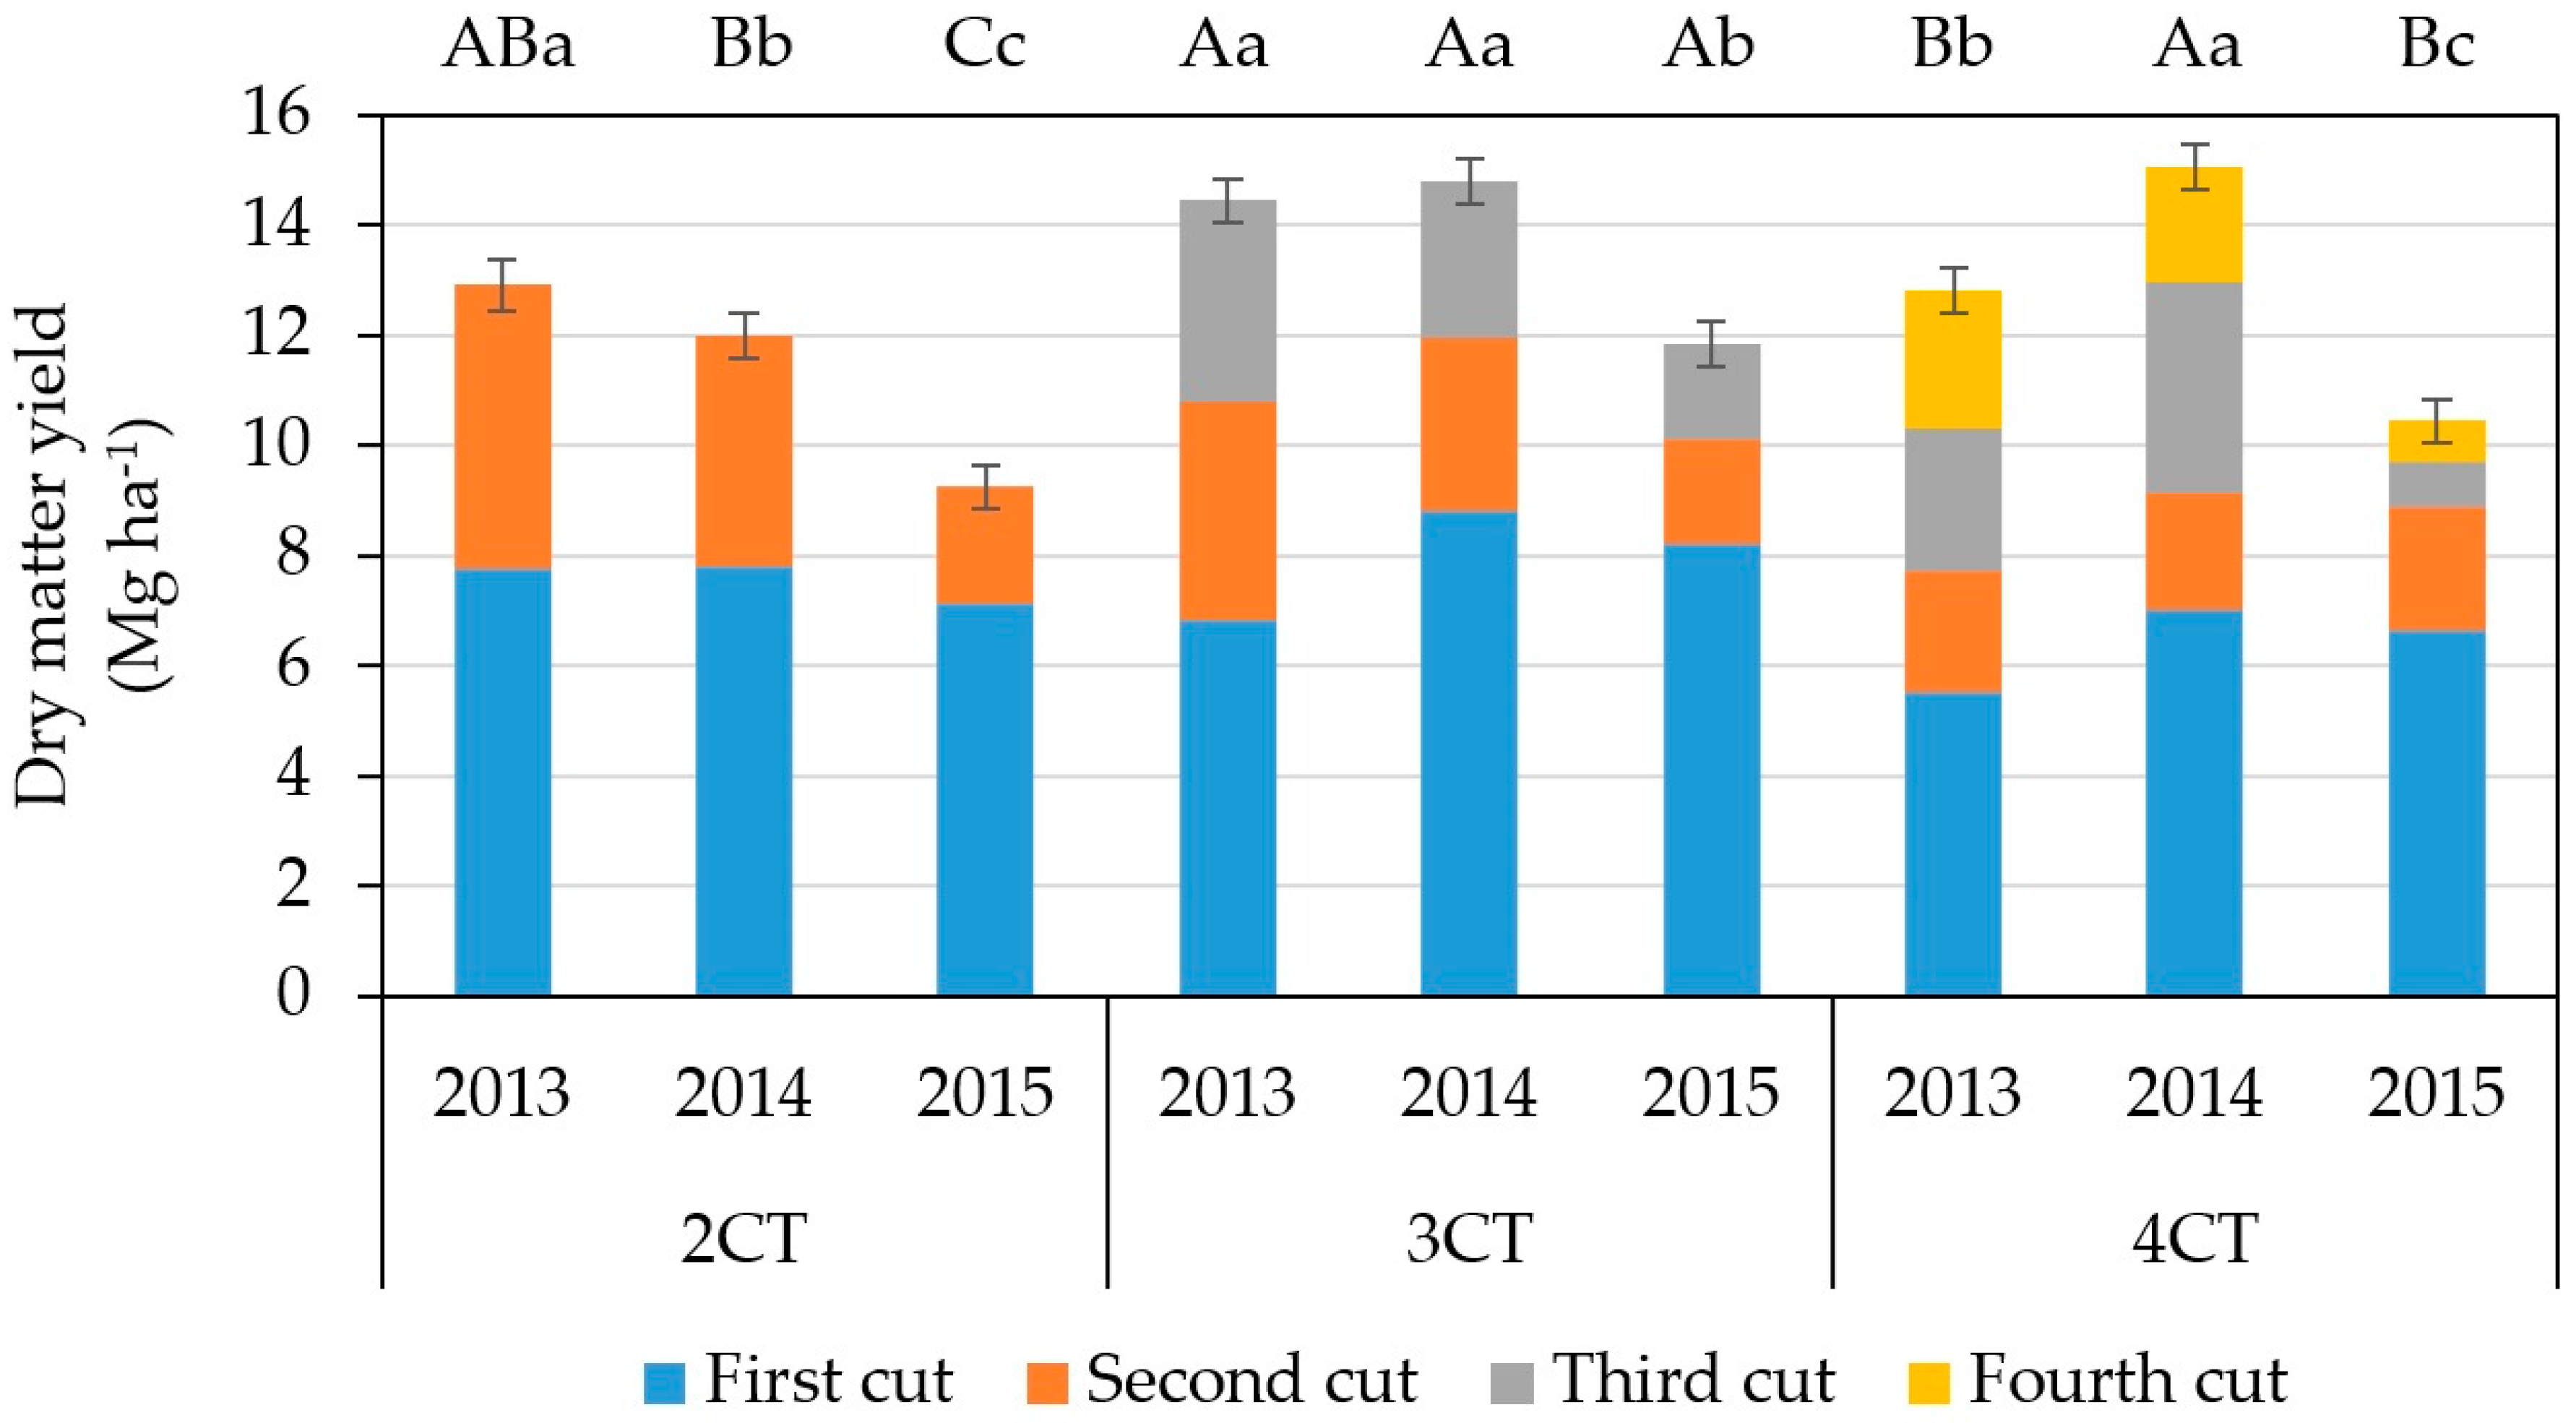
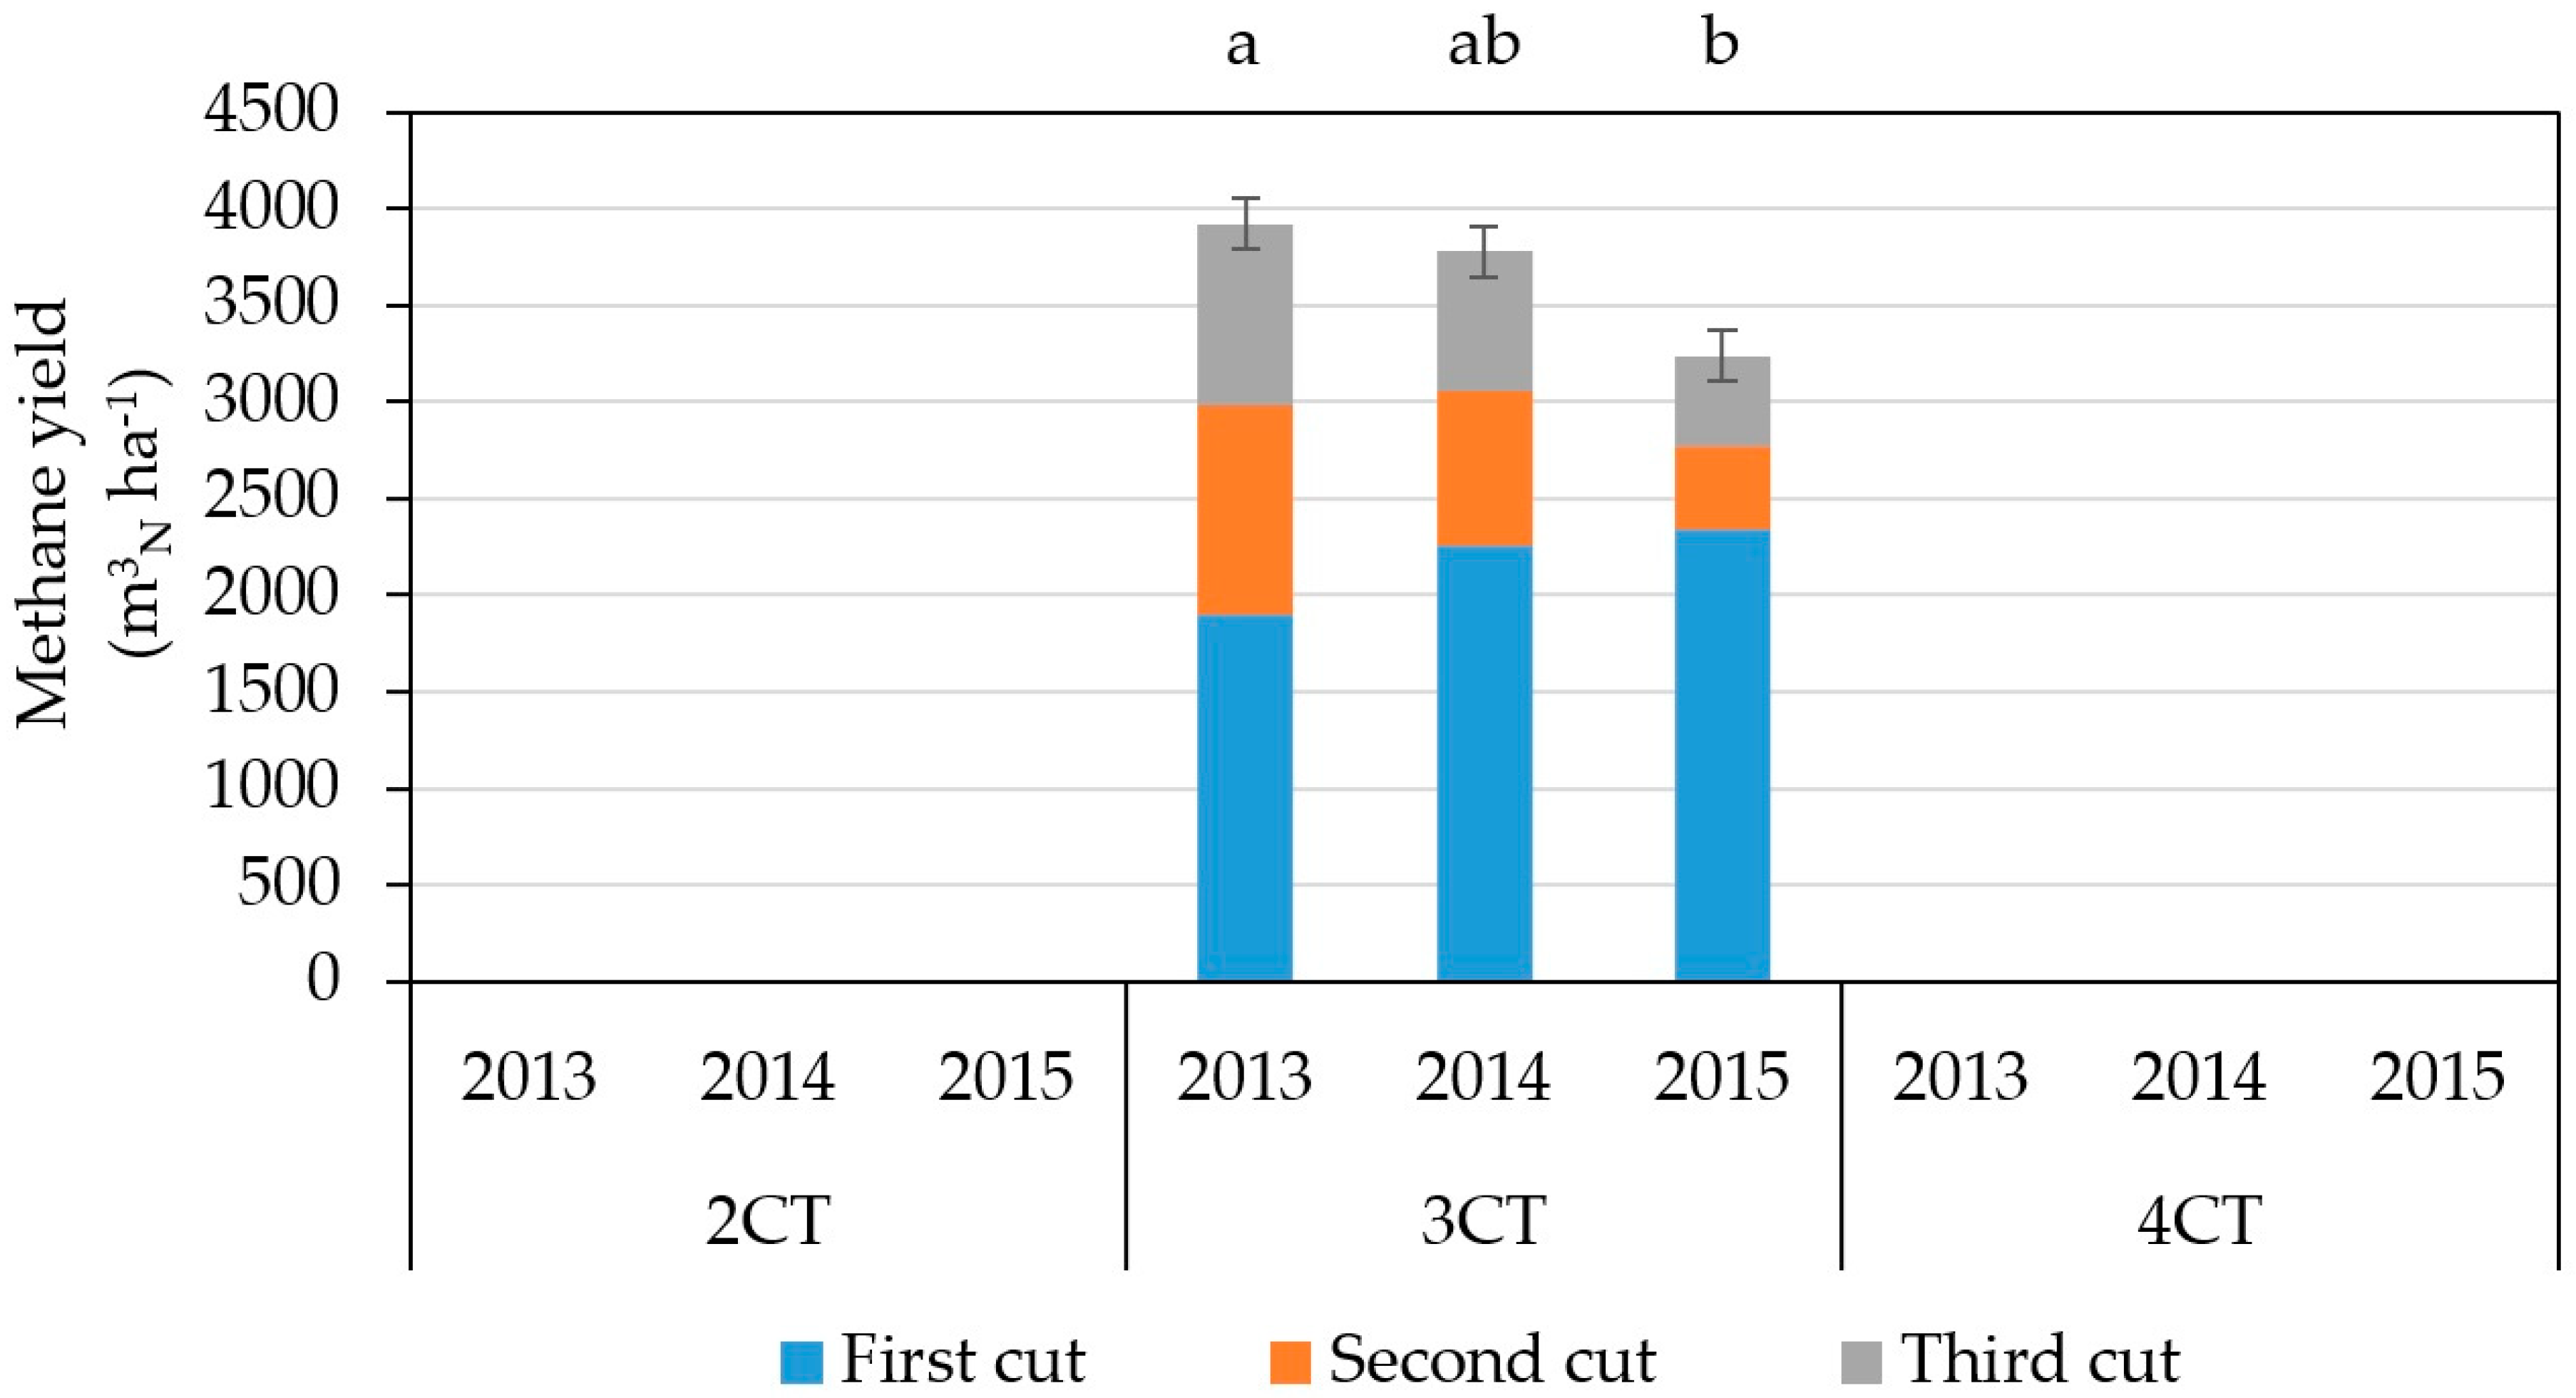
3. Results
- accumulated annual values (yield) and mean values (quality parameters) for each cutting regime and year.
- values for the individual cuts of each cutting regime and year.
3.1. Accumulated Yield and Mean Quality Parameter Values per Cutting Regime and Year
3.2. Cut-Specific Values per Cutting Regime and Year
4. Discussion
5. Conclusions
Author Contributions
Funding
Acknowledgments
Conflicts of Interest
Appendix A

References
- Tilman, D.; Reich, P.B.; Knops, J.M. Biodiversity and ecosystem stability in a decade-long grassland experiment. Nature 2006, 441, 629–632. [Google Scholar] [CrossRef] [PubMed]
- Tilman, D.; Hill, J.; Lehman, C. Carbon-Negative Biofuels from Low-Input High-Diversity Grassland Biomass. Science 2006, 314, 1598–1600. [Google Scholar] [CrossRef] [PubMed] [Green Version]
- Gibon, A. Managing grassland for production, the environment and the landscape. Challenges at the farm and the landscape level. Livest. Prod. Sci. 2005, 96, 11–31. [Google Scholar] [CrossRef]
- Fernando, A.L.; Boléo, S.; Barbosa, B.; Costa, J.; Duarte, M.P.; Monti, A. Perennial grass production opportunities on marginal Mediterranean land. BioEnergy Res. 2015, 8, 1523–1537. [Google Scholar] [CrossRef]
- Fernando, A.L.; Barbosa, B.; Costa, J.; Alexopoulou, E. Perennial Grass Production Opportunities and Constraints on Marginal Soils; ETA-Florence Renewable Energies: Florence, Italy, 2016; Volume 2016, pp. 133–137. [Google Scholar] [CrossRef]
- Herrero, M.; Havlík, P.; Valin, H.; Notenbaert, A.; Rufino, M.C.; Thornton, P.K.; Blümmel, M.; Weiss, F.; Grace, D.; Obersteiner, M. Biomass use, production, feed efficiencies, and greenhouse gas emissions from global livestock systems. Proc. Natl. Acad. Sci. USA 2013, 110, 20888–20893. [Google Scholar] [CrossRef] [PubMed] [Green Version]
- Styles, D.; Gonzalez-Mejia, A.; Moorby, J.; Foskolos, A.; Gibbons, J. Climate mitigation by dairy intensification depends on intensive use of spared grassland. Glob. Chang. Biol. 2018, 24, 681–693. [Google Scholar] [CrossRef] [PubMed]
- Wang, D.; Wang, L. A new perspective on the concept of grassland management. Kexue Tongbao Chin. Sci. Bull. 2019, 64, 1106–1113. [Google Scholar] [CrossRef] [Green Version]
- Greenhalgh, J.F.D. Factors limiting animal production from grazed pasture. Grass Forage Sci. 1975, 30, 153–160. [Google Scholar] [CrossRef]
- Von Cossel, M.; Lewandowski, I. Perennial wild plant mixtures for biomass production: Impact of species composition dynamics on yield performance over a five-year cultivation period in southwest Germany. Eur. J. Agron. 2016, 79, 74–89. [Google Scholar] [CrossRef]
- Von Cossel, M.; Steberl, K.; Hartung, J.; Agra Pereira, L.; Kiesel, A.; Lewandowski, I. Methane yield and species diversity dynamics of perennial wild plant mixtures established alone, under cover crop maize (Zea mays L.) and after spring barley (Hordeum vulgare L.). GCB Bioenergy 2019. [Google Scholar] [CrossRef]
- Schmidt, A.; Lemaigre, S.; Delfosse, P.; von Francken-Welz, H.; Emmerling, C. Biochemical methane potential (BMP) of six perennial energy crops cultivated at three different locations in W-Germany. Biomass Convers. Biorefinery 2018, 8, 873–888. [Google Scholar] [CrossRef]
- Carlsson, G.; Mårtensson, L.-M.; Prade, T.; Svensson, S.-E.; Jensen, E.S. Perennial species mixtures for multifunctional production of biomass on marginal land. GCB Bioenergy 2017, 9, 191–201. [Google Scholar] [CrossRef]
- Finn, J.A.; Kirwan, L.; Connolly, J.; Sebastia, M.T.; Helgadottir, A.; Baadshaug, O.H.; Bélanger, G.; Black, A.; Brophy, C.; Collins, R.P.; et al. Ecosystem function enhanced by combining four functional types of plant species in intensively managed grassland mixtures: A 3-year continental-scale field experiment. J. Appl. Ecol. 2013, 50, 365–375. [Google Scholar] [CrossRef]
- Messner, J.; Elsaesser, M. Gas aus Gras-Welche Gruenlandaufwuechse eignen sich für die Biogaserzeugung? Landinfo 2012, 4, 28–31. [Google Scholar]
- Nitsche, M.; Hensgen, F.; Wachendorf, M. Using Grass Cuttings from Sports Fields for Anaerobic Digestion and Combustion. Energies 2017, 10, 388. [Google Scholar] [CrossRef]
- Isselstein, J.; Michaelis, T. Innovative Use of Grassland for Resource Protection. The DAFA Research Strategy; Technical Report for the Grassland Expert Forum; Deutsche Agrarforschungsallianz (DAFA) c/o Thünen-Institut: Braunschweig, Germany, 2015. [Google Scholar]
- Schellberg, J.; Moseler, B.M.; Kuhbauch, W.; Rademacher, I.F. Long-term effects of fertilizer on soil nutrient concentration, yield, forage quality and floristic composition of a hay meadow in the Eifel mountains, Germany. Grass Forage Sci. 1999, 54, 195–207. [Google Scholar] [CrossRef]
- Smith, R.S.; Buckingham, H.; Bullard, M.J.; Shiel, R.S.; Younger, A. The conservation management of mesotrophic (meadow) grassland in northern England. 1. Effects of grazing, cutting date and fertilizer on the vegetation of a traditionally managed sward. Grass Forage Sci. 1996, 51, 278–291. [Google Scholar] [CrossRef]
- Tonn, B.; Elsaesser, M. Wie bewirtschafte ich eine FFH-Wiese; Infoblatt Natura 2000; Ministerium für Ländlichen Raum und Verbraucherschutz: Stuttgart, Germany, 2013. [Google Scholar]
- Boob, M.; Truckses, B.; Seither, M.; Elsäßer, M.; Thumm, U.; Lewandowski, I. Management effects on botanical composition of species-rich meadows within the Natura 2000 network. Biodivers. Conserv. 2019, 28, 729–750. [Google Scholar] [CrossRef]
- Prochnow, A.; Heiermann, M.; Plöchl, M.; Linke, B.; Idler, C.; Amon, T.; Hobbs, P.J. Bioenergy from permanent grassland—A review: 1. Biogas. Bioresour. Technol. 2009, 100, 4931–4944. [Google Scholar] [CrossRef]
- Benke, M.; Elsaesser, M. Evolution des systèmes fourragers en Allemagne: Compétition ou complémentarité entre le lait et le biogaz? Fourrages 2009, 197, 1–9. [Google Scholar]
- Destatis Landwirtschaftliche Betriebe. Available online: https://www.destatis.de/DE/Themen/Branchen-Unternehmen/Landwirtschaft-Forstwirtschaft-Fischerei/Landwirtschaftliche-Betriebe/Tabellen/ausgewaehlte-merkmale-zv.html (accessed on 31 July 2019).
- Elsaesser, M.; Keymer, U.; Roßberg, R. Biogas aus Gras-Wie Grünlandaufwüchse zur Energieerzeugung beitragen können; DLG-Merkblätter; DLG e.V.: Frankfurt am Main, Germany, 2012. [Google Scholar]
- Sieling, K.; Herrmann, A.; Wienforth, B.; Taube, F.; Ohl, S.; Hartung, E.; Kage, H. Biogas cropping systems: Short term response of yield performance and N use efficiency to biogas residue application. Eur. J. Agron. 2013, 47, 44–54. [Google Scholar] [CrossRef]
- Melts, I.; Lanno, K.; Sammul, M.; Uchida, K.; Heinsoo, K.; Kull, T.; Laanisto, L. Fertilising semi-natural grasslands may cause long-term negative effects on both biodiversity and ecosystem stability. J. Appl. Ecol. 2018, 55, 1951–1955. [Google Scholar] [CrossRef]
- Walsh, J.J.; Jones, D.L.; Chadwick, D.R.; Williams, A.P. Repeated application of anaerobic digestate, undigested cattle slurry and inorganic fertilizer N: Impacts on pasture yield and quality. Grass Forage Sci. 2018, 73, 758–763. [Google Scholar] [CrossRef]
- Ehmann, A.; Thumm, U.; Lewandowski, I. Fertilizing Potential of Separated Biogas Digestates in Annual and Perennial Biomass Production Systems. Front. Sustain. Food Syst. 2018, 2. [Google Scholar] [CrossRef] [Green Version]
- Virkajärvi, P.; Hyrkäs, M.; Kykkänen, S.; Pyykkönen, V.; Laakso, J.; Kekkonen, P.; Ervasti, S.; Luostarinen, S. Effect of digestate application, N fertilisation and forage species on biomass and biogas production. In Proceedings of the 27th General Meeting of the European Grassland Federation, Cork, Ireland, 17–21 June 2018. [Google Scholar]
- Elsaesser, M. Two cuts-and afterwards?—Effects of adapted management on permanent grassland. In Proceedings of the 14th Symposium of the European Grassland Federation; Belgian Society for Grassland and Forage Crops: Ghent, Belgium, 2007; Volume 12, pp. 580–583. [Google Scholar]
- Gützloe, A.; Thumm, U.; Lewandowski, I. Influence of climate parameters and management of permanent grassland on biogas yield and GHG emission substitution potential. Biomass Bioenergy 2014, 64, 175–189. [Google Scholar] [CrossRef]
- Von Cossel, M.; Möhring, J.; Kiesel, A.; Lewandowski, I. Optimization of specific methane yield prediction models for biogas crops based on lignocellulosic components using non-linear and crop-specific configurations. Ind. Crops Prod. 2018, 120, 330–342. [Google Scholar] [CrossRef]
- Herrmann, C.; Prochnow, A.; Heiermann, M.; Idler, C. Biomass from landscape management of grassland used for biogas production: Effects of harvest date and silage additives on feedstock quality and methane yield. Grass Forage Sci. 2014, 69, 549–566. [Google Scholar] [CrossRef]
- Amon, T.; Amon, B.; Kryvoruchko, V.; Machmüller, A.; Hopfner-Sixt, K.; Bodiroza, V.; Hrbek, R.; Friedel, J.; Pötsch, E.; Wagentristl, H.; et al. Methane production through anaerobic digestion of various energy crops grown in sustainable crop rotations. Bioresour. Technol. 2007, 98, 3204–3212. [Google Scholar] [CrossRef]
- Chiumenti, A.; Boscaro, D.; Da Borso, F.; Sartori, L.; Pezzuolo, A. Biogas from fresh spring and summer grass: Effect of the harvesting period. Energies 2018, 11, 1466. [Google Scholar] [CrossRef]
- Rodriguez, C.; Alaswad, A.; Benyounis, K.Y.; Olabi, A.G. Pretreatment techniques used in biogas production from grass. Renew. Sustain. Energy Rev. 2017, 68, 1193–1204. [Google Scholar] [CrossRef]
- Seppälä, M.; Paavola, T.; Lehtomäki, A.; Rintala, J. Biogas production from boreal herbaceous grasses–Specific methane yield and methane yield per hectare. Bioresour. Technol. 2009, 100, 2952–2958. [Google Scholar] [CrossRef] [PubMed]
- Von Cossel, M.; Möhring, J.; Kiesel, A.; Lewandowski, I. Methane yield performance of amaranth (Amaranthus hypochondriacus L.) and its suitability for legume intercropping in comparison to maize (Zea mays L.). Ind. Crops Prod. 2017, 103, 107–121. [Google Scholar] [CrossRef]
- Kerschberger, M.; Deller, B.; Hege, U.; Heyn, J.; Kape, H.E.; Krause, O.; Pollehn, J.; Rex, M.J.; Severin, K. Bestimmung des Kalkbedarfs von Acker-und Grünlandböden. In Standpunkte des VDLUFA; Verband Deutscher Landwirtschaftlicher Untersuchungs-und Forschungsanstalten: Speyer, Germany, 2000. [Google Scholar]
- Wiesler, F.; Appel, T.; Dittert, K.; Ebertseder, T.; Müller, T.; Nätscher, L.; Olfs, H.W.; Rex, M.; Schweitzer, K.; Steffens, D.; et al. Phosphordüngung nach Bodenuntersuchung und Pflanzenbedarf; Standpunkte des VDLUFA; Verband Deutscher Landwirtschaftlicher Untersuchungs und Forschungsanstalten e.V.: Speyer, Germany, 2018. [Google Scholar]
- Baumgärtel, G.; Früchtenicht, K.; Hege, U.; Heyn, J.; Orlovius, K. Kalium-Düngung nach Bodenuntersuchung und Pflanzenbedarf Richtwerte für die Gehaltsklasse C. In Standpunkte des VDLUFA; Verband Deutscher Landwirtschaftlicher Untersuchungs-und Forschungsanstalten: Speyer, Germany, 1999. [Google Scholar]
- Nordrhein-Westfalen, L. Düngung mit Phosphat, Kali, Magnesium. Ratgeber 2015. [Google Scholar]
- VDI. VDI 4630: Fermentation of Organic Materials—Characterization of the Substrate, Sampling, Collection of Material Data, Fermentation Tests; Verein Deutscher Ingenieure e.V.—Gesellschaft Energie und Umwelt: Dusseldorf, Germany, 2016. [Google Scholar]
- Wolfinger, R. Covariance structure selection in general mixed models. Commun. Stat.-Simul. Comput. 1993, 22, 1079–1106. [Google Scholar] [CrossRef]
- Kenward, M.G.; Roger, J.H. Small sample inference for fixed effects from restricted maximum likelihood. Biometrics 1997, 53, 983–997. [Google Scholar] [CrossRef]
- Kiesel, A.; Lewandowski, I. Miscanthus as biogas substrate—Cutting tolerance and potential for anaerobic digestion. GCB Bioenergy 2017, 9, 153–167. [Google Scholar] [CrossRef]
- Mast, B.; Lemmer, A.; Oechsner, H.; Reinhardt-Hanisch, A.; Claupein, W.; Graeff-Hönninger, S. Methane yield potential of novel perennial biogas crops influenced by harvest date. Ind. Crops Prod. 2014, 58, 194–203. [Google Scholar] [CrossRef]
- Stolzenburg, K.; Bruns, H.; Monkos, A.; Ott, J.; Schickler, J. Produktion von Kosubstraten für die Biogasanlage-Ergebnisse der Versuche mit Durchwachsener Silphie (Silphium perfoliatum L.) in Baden-Württemberg. Informationen für die Pflanzenproduktion; Landwirtschaftliches Technologiezentrum Augustenberg: Karlsruhe, Germany, 2016; Available online: https://www.google.com/url?sa=t&rct=j&q=&esrc=s&source=web&cd=1&cad=rja&uact=8&ved=2ahUKEwjEi-O6_d7hAhVFaFAKHdNiDzIQFjAAegQIBhAC&url=https%3A%2F%2Fwww.landwirtschaft-bw.info%2Fpb%2Fsite%2Fpbs-bw-new%2Fget%2Fdocuments%2FMLR.LEL%2FPB5Documents%2Fltz_ka%2FService%2FSchriftenreihen%2FInformationen%2520f%25C3%25BCr%2520die%2520Pflanzenproduktion%2FIfPP_2016-04_Silphie%2FIFPP%252004-2016%2520Durchwachsene%2520Silphie.pdf%3Fattachment%3Dtrue&usg=AOvVaw1vx30z5MhNcKkiu3d4Tptk (accessed on 31 July 2019).
- Haag, N.L.; Nägele, H.-J.; Reiss, K.; Biertümpfel, A.; Oechsner, H. Methane formation potential of cup plant (Silphium perfoliatum). Biomass Bioenergy 2015, 75, 126–133. [Google Scholar] [CrossRef]
- Gansberger, M.; Montgomery, L.F.R.; Liebhard, P. Botanical characteristics, crop management and potential of Silphium perfoliatum L. as a renewable resource for biogas production: A review. Ind. Crops Prod. 2015, 63, 362–372. [Google Scholar] [CrossRef]
- Herrmann, C.; Plogsties, V.; Willms, M.; Hengelhaupt, F.; Eberl, V.; Eckner, J.; Strauß, C.; Idler, C.; Heiermann, M. Methane production potential of various crop species grown in energy crop rotations. Landtechnik 2016, 71, 194–209. [Google Scholar]
- Herrmann, C.; Idler, C.; Heiermann, M. Biogas crops grown in energy crop rotations: Linking chemical composition and methane production characteristics. Bioresour. Technol. 2016, 206, 23–35. [Google Scholar] [CrossRef] [Green Version]
- Eberl, V.; Fahlbusch, W.; Fritz, M.; Sauer, B. Screening und Selektion von Amarantsorten und -linien als spurenelementreiches Biogassubstrat. In Berichte aus dem TFZ; Technologie- und Förderzentrum im Kompetenzzentrum für Nachwachsende Rohstoffe: Straubing, Germany, 2014; p. 120. Available online: www.tfz.bayern.de/mam/cms08/service/dateien/37_bericht.pdf (accessed on 31 July 2019).
- Mangold, A.; Lewandowski, I.; Hartung, J.; Kiesel, A. Miscanthus for biogas production: Influence of harvest date and ensiling on digestibility and methane hectare yield. GCB Bioenergy 2019, 11, 50–62. [Google Scholar] [CrossRef]
- Von Cossel, M.; Mangold, A.; Iqbal, Y.; Hartung, J.; Lewandowski, I.; Kiesel, A. How to Generate Yield in the First Year—A Three-Year Experiment on Miscanthus (Miscanthus × giganteus (Greef et Deuter)) Establishment under Maize (Zea mays L.). Agronomy 2019, 9, 237. [Google Scholar] [CrossRef]
- Dandikas, V.; Heuwinkel, H.; Lichti, F.; Drewes, J.E.; Koch, K. Correlation between Biogas Yield and Chemical Composition of Grassland Plant Species. Energy Fuels 2015, 29, 7221–7229. [Google Scholar] [CrossRef]
- Vetter, A.; Barthelmes, G.; Benke, M.; Deumlich, D.; Deiglmayr, K.; Ebel, G.; Fritz, M.; Glemnitz, M.; Grunewald, J.; Gurgel, A.; et al. Standortangepasste Anbausysteme für Energiepflanzen, 3rd ed.; Agency for Renewable Resources (FNR): Gultsov, Germany, 2010; ISBN 978-3-942147-02-6. [Google Scholar]
- Herrmann, A.; Rath, J. Biogas production from maize: Current state, challenges, and prospects. 1. Methane yield potential. BioEnergy Res. 2012, 5, 1027–1042. [Google Scholar] [CrossRef]
- Küchenmeister, F.; Küchenmeister, K.; Kayser, M.; Wrage-MAlnnig, N.; Isselstein, J. Effects of drought stress and sward botanical composition on the nutritive value of grassland herbage. Int. J. Agric. Biol. 2014, 16, 1560–8530. [Google Scholar]
- Buttler, A.; Mariotte, P.; Meisser, M.; Guillaume, T.; Signarbieux, C.; Vitra, A.; Preux, S.; Mercier, G.; Quezada, J.; Bragazza, L.; et al. Drought-induced decline of productivity in the dominant grassland species Lolium perenne L. depends on soil type and prevailing climatic conditions. Soil Biol. Biochem. 2019, 132, 47–57. [Google Scholar] [CrossRef]
- Pachauri, R.K.; Allen, M.R.; Barros, V.R.; Broome, J.; Cramer, W.; Christ, R.; Church, J.A.; Clarke, L.; Dahe, Q.; Dasgupta, P. Climate Chang. 2014: Synthesis Report. Contribution of Working Groups I, II and III to the Fifth Assessment Report of the Intergovernmental Panel on Climate Change; IPCC: Geneva, Switzerland, 2014. [Google Scholar]
- Von Cossel, M.; Wagner, M.; Lask, J.; Magenau, E.; Bauerle, A.; Von Cossel, V.; Warrach-Sagi, K.; Elbersen, B.; Staritsky, I.; Van Eupen, M.; et al. Prospects of Bioenergy Cropping Systems for a more Social-Ecologically Sound Bioeconomy. Agronomy. under review.
- Samaniego, L.; Thober, S.; Kumar, R.; Wanders, N.; Rakovec, O.; Pan, M.; Zink, M.; Sheffield, J.; Wood, E.F.; Marx, A. Anthropogenic warming exacerbates European soil moisture droughts. Nat. Clim. Chang. 2018, 8, 421–426. [Google Scholar] [CrossRef]
- Teuling, A.J. A hot future for European droughts. Nat. Clim. Chang. 2018, 8, 364–365. [Google Scholar] [CrossRef]
- Kuhn, W.; Zeller, J.; Bretschneider-Herrmann, N.; Drenckhahn, K. Energy from Wild Plants-Practical Tips for the Cultivation of Wild Plants to Create Biomass for Biogas Generation Plants; Netzwerk Lebensraum Feldflur: Berlin, Germany, 2014; Volume 1, ISBN 978-3-936802-16-0. Available online: www.cic-wildlife.org/wp-content/uploads/2014/09/English_Praxisratgeber2014.pdf (accessed on 31 July 2019).
- Čop, J.; Vidrih, M.; Hacin, J. Influence of cutting regime and fertilizer application on the botanical composition, yield and nutritive value of herbage of wet grasslands in Central Europe. Grass Forage Sci. 2009, 64, 454–465. [Google Scholar] [CrossRef]
- Hector, A.; Schmid, B.; Beierkuhnlein, C.; Caldeira, M.C.; Diemer, M.; Dimitrakopoulos, P.G.; Finn, J.A.; Freitas, H.; Giller, P.S.; Good, J.; et al. Plant Diversity and Productivity Experiments in European Grasslands. Science 1999, 286, 1123–1127. [Google Scholar] [CrossRef] [PubMed] [Green Version]
- Folke, C.; Carpenter, S.; Walker, B.; Scheffer, M.; Elmqvist, T.; Gunderson, L.; Holling, C.S. Regime shifts, resilience, and biodiversity in ecosystem management. Annu. Rev. Ecol. Evol. Syst. 2004, 35, 557–581. [Google Scholar] [CrossRef]
- Siebert, J.; Thakur, M.P.; Reitz, T.; Schädler, M.; Schulz, E.; Yin, R.; Weigelt, A.; Eisenhauer, N. Extensive grassland-use sustains high levels of soil biological activity, but does not alleviate detrimental climate change effects. Adv. Ecol. Res. 2019, 60, 25–58. [Google Scholar]
- Von Cossel, M.; Lewandowski, I.; Elbersen, B.; Staritsky, I.; Van Eupen, M.; Iqbal, Y.; Mantel, S.; Scordia, D.; Testa, G.; Cosentino, S.L.; et al. Marginal agricultural land low-input systems for biomass production. Energies 2019, 12, 3123. [Google Scholar] [CrossRef]
- Van Oijen, M.; Bellocchi, G.; Höglind, M. Effects of Climate Change on Grassland Biodiversity and Productivity: The Need for a Diversity of Models. Agronomy 2018, 8, 14. [Google Scholar] [CrossRef]


| Parameter | Unit | Value |
|---|---|---|
| Sand | % | 14.9 |
| Silt | % | 60.7 |
| Clay | % | 24.4 |
| Humus | % | 4.7 a |
| pH | - | 5.8 a |
| Nmin b in spring 2013 | kg ha−1 | 8.8 |
| Nmin b in spring 2014 | kg ha−1 | 4.6 |
| Phosphorus | mg CAL-P (100 g soil)−1 | 7.7 c |
| Potassium | mg CAL-K(100 g soil)−1 | 14.0 d |
| Magnesium | mg (100 g soil)−1 | 11.5 e |
| Two-cut Regime | Three-cut Regime | Four-cut Regime | ||||
|---|---|---|---|---|---|---|
| Date | Annual Cut Number | Nitrogen Fertilization (kg ha−1) | Annual Cut Number | Nitrogen Fertilization (kg ha−1) | Annual Cut Number | Nitrogen Fertilization (kg ha−1) |
| 21.03.2013 | 60 | 60 | 60 | |||
| 21.05.2013 | 1 | 30 | ||||
| 04.06.2013 | 1 | 30 | ||||
| 17.06.2013 | 1 | 30 | ||||
| 25.06.2013 | 2 | 30 | ||||
| 31.07.2013 | 2 | 30 | ||||
| 14.08.2013 | 3 | 30 | ||||
| 01.10.2013 | 2 | 3 | 4 | |||
| 20.03.2014 | 60 | 60 | 60 | |||
| 09.05.2014 | 1 | 30 | ||||
| 04.06.2014 | 1 | 30 | ||||
| 16.06.2014 | 2 | 30 | ||||
| 27.06.2014 | 1 | 30 | ||||
| 01.08.2014 | 2 | 30 | ||||
| 22.08.2014 | 3 | 30 | ||||
| 14.10.2014 | 2 | 3 | 4 | |||
| 17.032015 | 60 | 60 | 60 | |||
| 11.05.2015 | 1 | 30 | ||||
| 01.06.2015 | 1 | 30 | ||||
| 22.06.2015 | 2 | 30 | ||||
| 06.07.2015 | 1 | 30 | ||||
| 30.07.2015 | 2 | 30 | ||||
| 27.08.2015 | 3 | 30 | ||||
| 12.10.2015 | 2 | 3 | 4 | |||
| Total per year | 2 | 90 | 3 | 120 | 4 | 150 |
| Date | P | K | Mg | S |
|---|---|---|---|---|
| 21.03.2013 | 60 | 60 | 0 | 0 |
| 11.03.2014 | 44 | 208 | 24 | 60 |
| 17.03.2015 | 44 | 208 | 24 | 60 |
| Parameter | Year | Cutting Regime | Year × Cutting Regime |
|---|---|---|---|
| Dry matter yield | - a | - | * |
| Dry matter content | - | - | *** |
| Ash content | n.s. b | *** | n.s. |
| Lignin content | - | - | *** |
| Cellulose content | * | *** | n.s. |
| Hemicellulose content | ** | * | n.s. |
| Nitrogen content | ** | *** | n.s. |
| Methane content of biogas | n.s. | n.a. c | n.a. |
| Specific methane yield | n.s. | n.a. | n.a. |
| Methane yield per hectare | n.s. | n.a. | n.a. |
| Cutting regime | Year | Dry matter | Ash | Lignin | Cellulose |
| % of fresh matter | % of dry matter | % of dry matter | % of dry matter | ||
| 2CT | 2013 | 29.3 ± 0.5 Ac | 6.8 ± 0.6 Ba | 5.0 ± 0.2 Bb | 31.1 ± 0.9 Aa |
| 2014 | 37.7 ± 0.5 Ab | 6.7 ± 0.6 Ba | 6.8 ± 0.2 Aa | 33.1 ± 0.9 Aa | |
| 2015 | 42.5 ± 0.5 Aa | 6.6 ± 0.6 Ba | 7.0 ± 0.2 Aa | 32.2 ± 0.9 Aa | |
| 3CT | 2013 | 25.9 ± 0.5 Bc | 8.6 ± 0.5 Aa | 5.7 ± 0.1 Ab | 27.9 ± 0.8 Ba |
| 2014 | 25.1 ± 0.5 Bb | 7.8 ± 0.6 Ba | 5.9 ± 0.2 Ba | 29.9 ± 1.0 Ba | |
| 2015 | 29.7 ± 0.5 Ba | 7.5 ± 0.5 Ba | 6.1 ± 0.1 Ba | 28.3 ± 0.9 Ba | |
| 4CT | 2013 | 20.7 ± 0.5 Cc | 10.0 ± 0.6 Aa | 5.3 ± 0.2 ABb | 23.7 ± 0.9 Ca |
| 2014 | 21.9 ± 0.5 Bb | 11.7 ± 0.6 Aa | 4.9 ± 0.2 Ca | 24.5 ± 0.9 Ca | |
| 2015 | 21.9 ± 0.5 Ca | 9.9 ± 0.6 Aa | 5.9 ± 0.2 Ba | 21.8 ± 1.0 Ca | |
| Cutting regime | Year | Hemicellulose | Nitrogen | Methane | Specific methane yield |
| % of dry matter | % of dry matter | % | m3N kg−1 volatile solids−1 | ||
| 2CT | 2013 | 21.7 ± 1.2 Ab | 1.5 ± 0.1 Ca | n.a. a | n.a. |
| 2014 | 22.3 ± 1.2 Ab | 1.0 ± 0.1 Cb | n.a. | n.a. | |
| 2015 | 26.3 ± 1.2 Aa | 1.0 ± 0.1 Cb | n.a. | n.a. | |
| 3CT | 2013 | 20.3 ± 1.0 Ab | 1.8 ± 0.1 Ba | 53.1 ± 0.5 | 0.290 ± 0.003 |
| 2014 | 20.3 ± 1.2 Ab | 1.6 ± 0.1 Bb | 53.0 ± 0.5 | 0.289 ± 0.003 | |
| 2015 | 24.2 ± 1.0 Aa | 1.8 ± 0.1 Bb | 52.5 ± 0.5 | 0.294 ± 0.003 | |
| 4CT | 2013 | 20.6 ± 1.2 Ab | 2.6 ± 0.1 Aa | n.a. | n.a. |
| 2014 | 21.0 ± 1.2 Ab | 2.2 ± 0.1 Ab | n.a. | n.a. | |
| 2015 | 20.8 ± 1.2 Ba | 2.3 ± 0.1 Ab | n.a. | n.a. |
| Parameter | Year | Cut Number | Year × Cut Number |
|---|---|---|---|
| Dry matter yield | - a | - | *** |
| Dry matter content | - | - | *** |
| Ash content | n.s. b | *** | n.s. |
| Lignin content | * | *** | n.s. |
| Cellulose content | *** | *** | n.s. |
| Hemicellulose content | *** | n.s. | n.s. |
| Nitrogen content | n.s. | *** | n.s. |
| Methane content of biogas produce | n.s. | n.s. | n.s. |
| Specific methane yield | n.s. | * | n.s. |
| Methane yield per hectare | - | - | ** |
| Dry Matter | Ash | Lignin | Cellulose | Hemicellulose | Nitrogen | |||
|---|---|---|---|---|---|---|---|---|
| Year | Cutting Regime | Cut Number | % of Fresh Matter | % of Dry Matter | % of Dry Matter | % of Dry Matter | % of Dry Matter | % of Dry Matter |
| 2013 | 2CT | 1 | 27.7 ± 0.8Ab | 6.5 ± 0.8Ba | 5.5 ± 0.3Aa | 31.1 ± 0.8Aa | 21.8 ± 1.3Aa | 1.3 ± 0.1Ba |
| 2 | 31.4 ± 0.8Aa | 7.1 ± 1.2Aa | 4.3 ± 0.4Bb | 30.2 ± 1.1Aa | 20.9 ± 1.8Aa | 1.7 ± 0.2Ba | ||
| 3CT | 1 | 24.0 ± 0.8Bb | 8.1 ± 0.9ABa | 4.7 ± 0.3Bb | 30.5 ± 0.8Aa | 20.7 ± 1.4Aa | 1.7 ± 0.1Bb | |
| 2 | 29.9 ± 0.8Aa | 9.1 ± 0.9Aa | 6.7 ± 0.3Aa | 25.7 ± 0.8Bb | 20.5 ± 1.4Aa | 1.8 ± 0.1Bab | ||
| 3 | 25.0 ± 0.8Ab | 9.1 ± 1.0Aa | 6.7 ± 0.3Aa | 24.8 ± 0.9Ab | 19.0 ± 1.5Aa | 2.2 ± 0.2Ba | ||
| 4CT | 1 | 19.1 ± 0.8Cb | 9.3 ± 0.8Ab | 5.0 ± 0.3ABa | 28.0 ± 0.8Ba | 20.2 ± 1.3Aa | 2.4 ± 0.1Ab | |
| 2 | 18.6 ± 0.8Bb | 9.6 ± 1.2Aab | 5.8 ± 0.4Aa | 23.4 ± 1.1Bb | 20.7 ± 1.8Aa | 2.5 ± 0.2Aab | ||
| 3 | 22.7 ± 0.8Ba | 10.0 ± 0.8Aab | 5.4 ± 0.3Ba | 23.3 ± 0.8Ab | 22.2 ± 1.3Aa | 2.7 ± 0.1Aab | ||
| 4 | 24.1 ± 0.8a | 12.2 ± 0.8a | 5.6 ± 0.3a | 21.7 ± 0.8b | 19.5 ± 1.3a | 2.9 ± 0.1a | ||
| 2014 | 2CT | 1 | 45.2 ± 0.8Aa | 6.6 ± 0.8Ba | 7.0 ± 0.3Aa | 33.5 ± 0.8Aa | 23.0 ± 1.3Aa | 1.0 ± 0.1Ca |
| 2 | 23.7 ± 0.8Cb | 6.0 ± 1.2Ba | 6.3 ± 0.4Aa | 30.7 ± 1.1Ab | 20.8 ± 1.9Aa | 1.2 ± 0.2Aa | ||
| 3CT | 1 | 27.5 ± 0.8Ba | 7.0 ± 0.9ABb | 5.5 ± 0.3Bb | 31.9 ± 0.8Aa | 21.3 ± 1.4Aa | 1.4 ± 0.1Bb | |
| 2 | 20.1 ± 0.8Cc | 9.5 ± 0.9Ba | 6.7 ± 0.3Aa | 28.8 ± 0.8Ab | 22.2 ± 1.4Aa | 2.2 ± 0.1Aa | ||
| 3 | 22.9 ± 0.8Ab | 10.1 ± 1.2Ba | 6.2 ± 0.4Aab | 26.0 ± 1.1Ac | 21.0 ± 1.8Aa | 2.3 ± 0.2Aa | ||
| 4CT | 1 | 20.5 ± 0.8Cc | 9.1 ± 0.8Ac | 4.3 ± 0.3Cc | 25.8 ± 0.8Ba | 19.7 ± 1.3Aa | 2.1 ± 0.1Ab | |
| 2 | 26.2 ± 0.8Aa | 16.8 ± 1.2Aa | 6.1 ± 0.4Aa | 23.9 ± 1.1Bab | 21.8 ± 1.8Aa | 2.2 ± 0.2Ab | ||
| 3 | 23.7 ± 0.8Ab | 14.1 ± 0.8Aa | 5.0 ± 0.3Bbc | 24.6 ± 0.8Aab | 22.8 ± 1.3Aa | 2.2 ± 0.1Ab | ||
| 4 | 18.5 ± 0.8c | 11.5 ± 0.8b | 5.7 ± 0.3ab | 23.6 ± 0.8b | 21.5 ± 1.3a | 2.8 ± 0.1a | ||
| 2015 | 2CT | 1 | 47.0 ± 0.8Aa | 6.4 ± 0.8Ba | 7.4 ± 0.3Aa | 32.5 ± 0.8Aa | 26.4 ± 1.3Aa | 0.9 ± 0.1Ca |
| 2 | 27.0 ± 0.8Bb | 6.3 ± 1.2Ba | 5.6 ± 0.4Bb | 29.6 ± 1.1Ab | 24.2 ± 1.8ABa | 1.3 ± 0.2Ba | ||
| 3CT | 1 | 29.7 ± 0.8Bb | 7.3 ± 0.9Bb | 5.7 ± 0.3Bb | 29.3 ± 0.8Ba | 25.2 ± 1.4Aa | 1.5 ± 0.1Bb | |
| 2 | 34.7 ± 0.8Aa | 9.8 ± 0.9Aa | 7.3 ± 0.3Aa | 21.7 ± 0.8Bb | 25.4 ± 1.4Aa | 2.4 ± 0.1Aa | ||
| 3 | 24.1 ± 0.8Bc | 8.9 ± 1.0Aab | 7.7 ± 0.3Aa | 20.4 ± 0.9Ab | 24.5 ± 1.5Aa | 2.9 ± 0.2Aa | ||
| 4CT | 1 | 22.4 ± 0.8Cb | 11.2 ± 0.8Aa | 5.5 ± 0.3Bb | 23.4 ± 0.8Ca | 21.1 ± 1.3Bb | 2.2 ± 0.1Ab | |
| 2 | 18.6 ± 0.8Cc | 9.3 ± 0.8Aab | 6.9 ± 0.3Aa | 20.4 ± 0.8Bb | 21.9 ± 1.3Bab | 2.6 ± 0.1Ab | ||
| 3 | 28.1 ± 0.8Aa | 9.3 ± 1.2Aab | 7.1 ± 0.4Aa | 19.2 ± 1.1Abc | 26.0 ± 1.8Aa | 3.2 ± 0.2Aa | ||
| 4 | 21.4 ± 0.8b | 8.8 ± 0.8b | 6.2 ± 0.3ab | 17.0 ± 0.8c | 22.3 ± 1.3ab | 3.2 ± 0.1a |
| Dry Matter Yield | Methane | Specific Methane Yield | Methane Yield | |||
|---|---|---|---|---|---|---|
| Year | Cutting Regime | Cut Number | Mg ha−1 | % | m3N kg−1 volatile solids−1 | m³N ha−1 |
| 2013 | 2CT | 1 | 7.8 ± 0.2 Aa | n.a. a | n.a. | n.a. |
| 2 | 5.1 ± 0.2 Ab | n.a. | n.a. | n.a. | ||
| 3CT | 1 | 6.8 ± 0.2 Ba | 52.6 ± 0.8 a | 0.296 ± 0.004 a | 1903.7 ± 95.3 a | |
| 2 | 4.0 ± 0.2 Bb | 53.4 ± 0.8 a | 0.281 ± 0.004 b | 1081.1 ± 95.3 b | ||
| 3 | 3.6 ± 0.2 Ab | 53.8 ± 0.8 a | 0.286 ± 0.004 ab | 938.2 ± 95.3 b | ||
| 4CT | 1 | 5.5 ± 0.2 Ca | n.a. | n.a. | n.a. | |
| 2 | 2.2 ± 0.2 Cb | n.a. | n.a. | n.a. | ||
| 3 | 2.6 ± 0.2 Bb | n.a. | n.a. | n.a. | ||
| 4 | 2.5 ± 0.2 b | n.a. | n.a. | n.a. | ||
| 2014 | 2CT | 1 | 7.8 ± 0.2 Ba | n.a. | n.a. | n.a. |
| 2 | 4.2 ± 0.2 Bb | n.a. | n.a. | n.a. | ||
| 3CT | 1 | 8.8 ± 0.2 Aa | 52.4 ± 0.8 a | 0.289 ± 0.004 a | 2254.3 ± 95.3 a | |
| 2 | 3.1 ± 0.2 Bb | 53.7 ± 0.8 a | 0.290 ± 0.004 a | 803.1 ± 95.3 b | ||
| 3 | 2.8 ± 0.2 Bb | 54.0 ± 0.8 a | 0.287 ± 0.004 a | 723.2 ± 95.3 b | ||
| 4CT | 1 | 7.0 ± 0.2 Ca | n.a. | n.a. | n.a. | |
| 2 | 2.1 ± 0.2 Cc | n.a. | n.a. | n.a. | ||
| 3 | 3.8 ± 0.2 Ab | n.a. | n.a. | n.a. | ||
| 4 | 2.1 ± 0.2 c | n.a. | n.a. | n.a. | ||
| 2015 | 2CT | 1 | 7.1 ± 0.2 Ba | n.a. | n.a. | n.a. |
| 2 | 2.1 ± 0.2 Ab | n.a. | n.a. | n.a. | ||
| 3CT | 1 | 8.2 ± 0.2 Aa | 52.8 ± 0.8 a | 0.297 ± 0.004 a | 2338.4 ± 95.3 a | |
| 2 | 1.9 ± 0.2 Ab | 54.0 ± 0.8 a | 0.281 ± 0.004 b | 438.2 ± 95.3 b | ||
| 3 | 1.7 ± 0.2 Ab | 54.0 ± 0.8 a | 0.297 ± 0.004 a | 460.4 ± 95.3 b | ||
| 4CT | 1 | 6.7 ± 0.2 Ba | n.a. | n.a. | n.a. | |
| 2 | 2.2 ± 0.2 Ab | n.a. | n.a. | n.a. | ||
| 3 | 0.8 ± 0.2 Bc | n.a. | n.a. | n.a. | ||
| 4 | 0.7 ± 0.2 c | n.a. | n.a. | n.a. |
© 2019 by the authors. Licensee MDPI, Basel, Switzerland. This article is an open access article distributed under the terms and conditions of the Creative Commons Attribution (CC BY) license (http://creativecommons.org/licenses/by/4.0/).
Share and Cite
von Cossel, M.; Bauerle, A.; Boob, M.; Thumm, U.; Elsaesser, M.; Lewandowski, I. The Performance of Mesotrophic Arrhenatheretum Grassland under Different Cutting Frequency Regimes for Biomass Production in Southwest Germany. Agriculture 2019, 9, 199. https://doi.org/10.3390/agriculture9090199
von Cossel M, Bauerle A, Boob M, Thumm U, Elsaesser M, Lewandowski I. The Performance of Mesotrophic Arrhenatheretum Grassland under Different Cutting Frequency Regimes for Biomass Production in Southwest Germany. Agriculture. 2019; 9(9):199. https://doi.org/10.3390/agriculture9090199
Chicago/Turabian Stylevon Cossel, Moritz, Andrea Bauerle, Meike Boob, Ulrich Thumm, Martin Elsaesser, and Iris Lewandowski. 2019. "The Performance of Mesotrophic Arrhenatheretum Grassland under Different Cutting Frequency Regimes for Biomass Production in Southwest Germany" Agriculture 9, no. 9: 199. https://doi.org/10.3390/agriculture9090199