Article

Organic but Also Low-Input Conventional Farming Systems Support High Biodiversity of Weed Species in Winter Cereals

by
Adam Kleofas Berbeć
1,*,
Mariola Staniak
2,
Beata Feledyn-Szewczyk
1,
Anna Kocira
3 and
Jarosław Stalenga
1
1
Department of Systems and Economics of Crop Production, Institute of Soil Science and Plant Cultivation-State Research Institute, Czartoryskich 8, 24-100 Puławy, Poland
2
Department of Forage Crop Production, Institute of Soil Science and Plant Cultivation-State Research Institute, Czartoryskich 8, 24-100 Puławy, Poland
3
State School of Higher Education in Chełm, Institute of Agricultural Sciences, Pocztowa 54, 22-100 Chełm, Poland
*
Author to whom correspondence should be addressed.
Agriculture 2020, 10(9), 413; https://doi.org/10.3390/agriculture10090413
Submission received: 10 August 2020 / Revised: 15 September 2020 / Accepted: 16 September 2020 / Published: 18 September 2020
(This article belongs to the Special Issue Weed Ecology and New Approaches for Management)

Abstract

:
In recent years, the European Union has been paying particular attention to the problem of biodiversity loss. The possibilities of its assessment and conservation are included in the latest European Union (EU) policies and reflected in the European Biodiversity Strategy. The biodiversity of weeds in winter cereals in organic and conventional low-input farms in Eastern Poland was investigated during a 3-year period. Significantly more species and larger abundance were found in organic than in conventional farming systems. The biodiversity of these communities was described by Shannon’s diversity and Simpson’s dominance indices, which showed diversity to be well maintained in both farming systems; however, significantly higher Shannon’s index and significantly lower Simpson’s index values were observed in organic farms. Both farming systems were the mainstay of endangered and rare species, as well as some invasive weed species. Weed communities of organic farms were dominated mostly by Setaria pumila and Elymus repens, while conventional farms were dominated by Juncus bufonius and Setaria pumila. The study showed the importance of organic farming systems for biodiversity conservation. It was also shown that low-input (traditional) conventional farms are also beneficial for biodiversity conservation.

1. Introduction

An agri-ecosystem is an exceptional living environment for wild species of plants (weeds) but also other organisms, such as microorganisms, invertebrates and other higher organisms, which all, including the crop diversity, build up the biodiversity of agricultural lands. Biodiversity is inextricably linked with the provision of ecosystem services. High biodiversity of microorganisms and predatory invertebrates can, for example, bring positive results in the form of biological pest control, organic matter decomposition rate, carbon cycle enhancement, etc. [1]. Higher biodiversity means greater stability of the ecosystem and hence better delivery of ecosystem services. This has a direct impact on the results of agricultural production, especially in farming systems based on these services (e.g., organic farming) [2,3,4,5]. The European Union has implemented the European Biodiversity Strategy as one of the major objectives of the EU policies. The main goals of the strategy are conservation of biodiversity, ecosystem services and loss prevention in all ecosystems and also in agricultural areas [6]. Lately, the intensification of agricultural production, excessive water consumption and environmental pollution (mostly with pesticides and nutrient contamination) caused the loss of plant, invertebrate and vertebrate species on arable fields [7,8,9]. The main aim of the strategy is to prevent further species loss, conservation of their natural habitats and sustainable use of biodiversity of species. Plants occupy the lowest level in the trophic chain; therefore, conservation of their biodiversity will enhance species richness of organisms at higher trophic levels (e.g., animals) [10,11,12].
Weed infestation is currently one of the most important factors limiting agricultural production, especially in organic farming. Weeds cause loss of both yield quality and quantity. According to Oerke [13], the potential crop losses due to weed–crop competition can amount to around 34% and can be higher than losses caused by pests (18%) and pathogens (16%). On the other hand, weeds are an important, integral part of the agro-ecosystem as they are the basis of the food chain [12]. Some authors reported that the limited abundance of weeds in agricultural production (by even up to 64%) is mostly due to use of herbicides and fertilizers but also due to agricultural practices that promote crop competitiveness against weeds (indirect weed control practices like new varieties of crops) [14,15,16]. Currently, a few species that were able to adapt to the intensive production conditions of conventional agriculture are dominating the weed species community. According to Arslan [17], the changes in agricultural production in the last 50 years resulted in a threefold reduction in the biodiversity of weeds in wheat production. The abundance of some species, common on arable fields in the past, is currently dramatically low. Moreover, species that used to represent the greatest threat to crops and crop yield are currently disappearing, which was confirmed by Chamorro et al. [18]. Those authors also showed the loss of biodiversity of weed species that are particularly important for birds, pollinators and other animals by nearly 50%. The investigation into weed functional groups showed a reduction in the number of segetal and rare species by 75% and 87%, respectively. Interestingly, the biodiversity of weeds in organic farming systems was twice as high for segetal and species important for fauna and four times as high for rare species compared to the conventional farming system [18]. Travlos et al. [19] reported that, in many cases, organic farming causes on average 30% higher species richness than conventional farming systems and also favors the existence of habitats for rare weed species. Successful agricultural production under organic farming conditions requires a high provision of ecosystem services to ensure efficient functioning of key processes such as biological pest control, cycling of carbon and nutrients, soil fertility building and proper water management [20].
Organic farming is an environmentally friendly alternative to conventional farming. However, the agriculture of Poland is strongly polarized, with high-input agriculture in the northern–western regions of the country and low-input, traditional family farms in the east. This polarization of the county is clearly visible in the numbers shown by Kopiński and Matyka [21], e.g., the average farm size in western regions is more than twice as high (14–18 ha) as that in eastern regions (6 ha), the average nitrogen, phosphorus and potassium fertilizers (NPK) usage is also almost twice as high in western regions (139–194 kg ha−1) than in eastern regions (113 kg ha−1), and annual work unit (AWU) per hectare of agricultural land is also more than three times lower in western regions (8–11 AWU ha−1 AL) than in eastern regions (29 AWU ha−1 AL). The differences are caused by many natural, organizational and production conditions. It would be interesting to evaluate how these agricultural conditions are reflected in the biodiversity of wild flora, especially when compared to organic farming systems, in which biodiversity of weeds should be well-maintained. The aim of the study was to compare species diversity in two farming systems—organic and low-input conventional—in Eastern Poland.

2. Materials and Methods

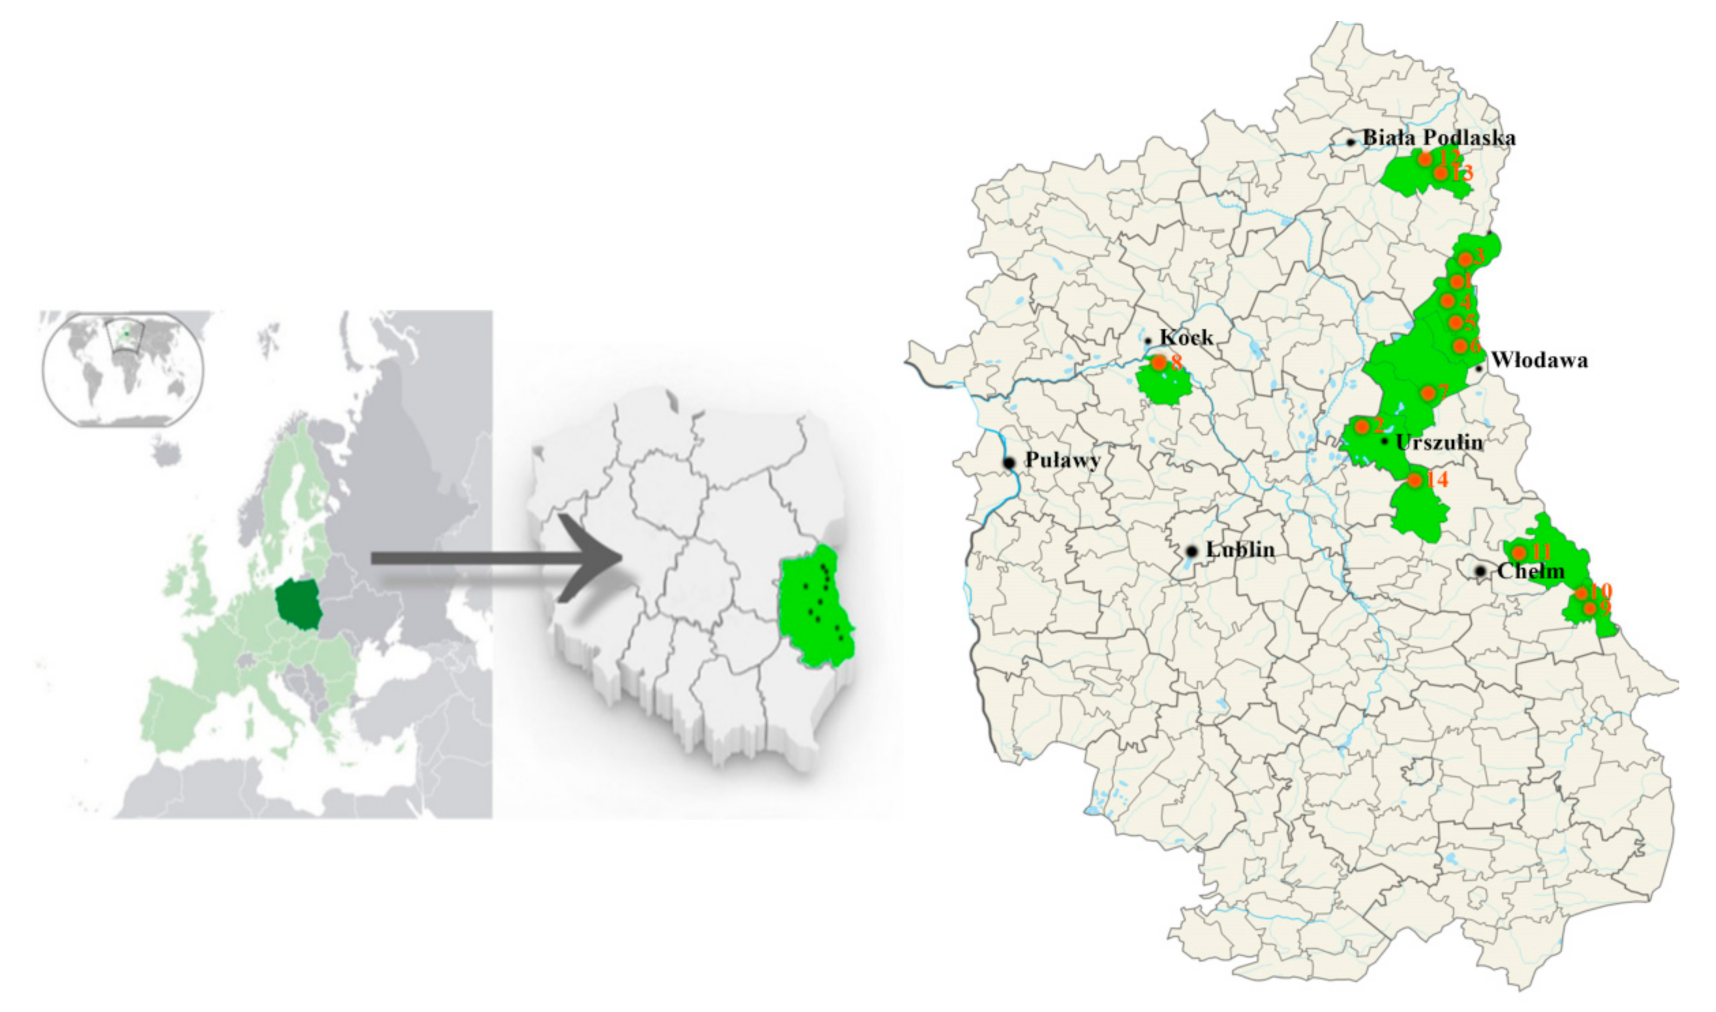
2.1. Site Characteristics and Experimental Design

The study on the biodiversity of weeds in winter cereals was carried out in 2012–2014 within the project on the protection of species diversity of valuable natural habitats on agricultural lands on Natura 2000 areas in the Lublin Voivodeship (KIK/25). Biodiversity monitoring took place annually, between 10 June and 5 July. Fourteen pairs of study surfaces (study squares of a surface of 9 ha), with a predominant share of conventional farming system or a predominant share of certified organic farming system, were selected. Each square had at least a 50% share of organic or conventional agricultural area. Pairs of organic–conventional squares were located as close to each other as possible, to ensure similar soil and climate conditions. Moreover, study squares were at least 500 m away from forests and other shelterbelts to minimize the impact of non-agricultural ecosystems. The fields with winter cereals—wheat (Triticum L.), rye (Secale cereale L.), triticale (×Triticosecale Wittm. ex A. Camus), barley (Hordeum L.) or cereal mixtures—were selected annually within 14 pairs of study squares. In the first year of the study (2012), each study square was included in the study, as there was at least one field with winter cereals. In the following years (2013 and 2014), the number of tested pairs of organic–conventional fields was lower due to lack of appropriate crops (winter cereals) within the given squares. The total sample size (2012–2014) involved 38 conventional and 38 organic winter cereal fields (14 pairs in 2012, 12 pairs in 2013 and 12 pairs in 2014). All fields were located in the valleys of Wieprz, Tysmienica and Bug rivers, in the vicinity of Natura 2000 areas in one of the easternmost regions of Poland—the region of Lublin. Light, sandy soils dominated on tested fields. The locations of Lublin region in Poland and fourteen study squares in the Lublin region are shown in Figure 1.

2.2. Weed Infestation Analyses

All plant species present in the winter crop field that were not winter cereals were considered as weeds (wild flora). Weed species and their abundance were counted on each field once during the growing season in late June or early July. Five surfaces (replications) of 1 m2 each were investigated on all selected fields. The surfaces were lined up in a straight line with 10 m spacing between them. Species that were not recorded within the surface, but present in its direct vicinity (2 m2), were also recorded and added to species list (with the minimal abundance of 1 plant m−2). The biodiversity of weeds was described with the total number of species and their abundance, Shannon’s diversity index (H’) [22] and Simpson’s dominance index (SI) [23]. Shannon’s diversity index (H’) and Simpson’s dominance index (SI) were calculated according to the following equations:
H =   i = 1 s p i ln p i
S I = p i 2
where p—the proportion (n/N) of individuals of one particular species found (n) divided by the total number of individuals found (N), ln—the natural log, s—the number of species.
Shannon’s index (H′) depends on the number of species and their mutual quantitative proportions. The higher the value of the index, the more diversified the community is. Simpson’s dominance index (SI) can range from 0 to 1; values close to 1 indicate a clear dominance of one or several species.

2.3. Statistical Analyses

Non-parametric Mood’s test (median-based) was used to determine the significance of differences as most of the biodiversity parameters deviated from the normal distribution. The significance level of the test was set at α = 0.05. The significance of differences of diversity indices was calculated using t-test for diversity indices also set at α = 0.05. The differences between years of the study was estimated on the basis of single factor ANOVA and pairwise Mann–Whitney post-hoc test (α = 0.05). All results of statistical analysis with p-values lower than or equal to 0.05 were considered statistically significant. The statistical analysis was done with Real Statistic add-in for Microsoft Excel.

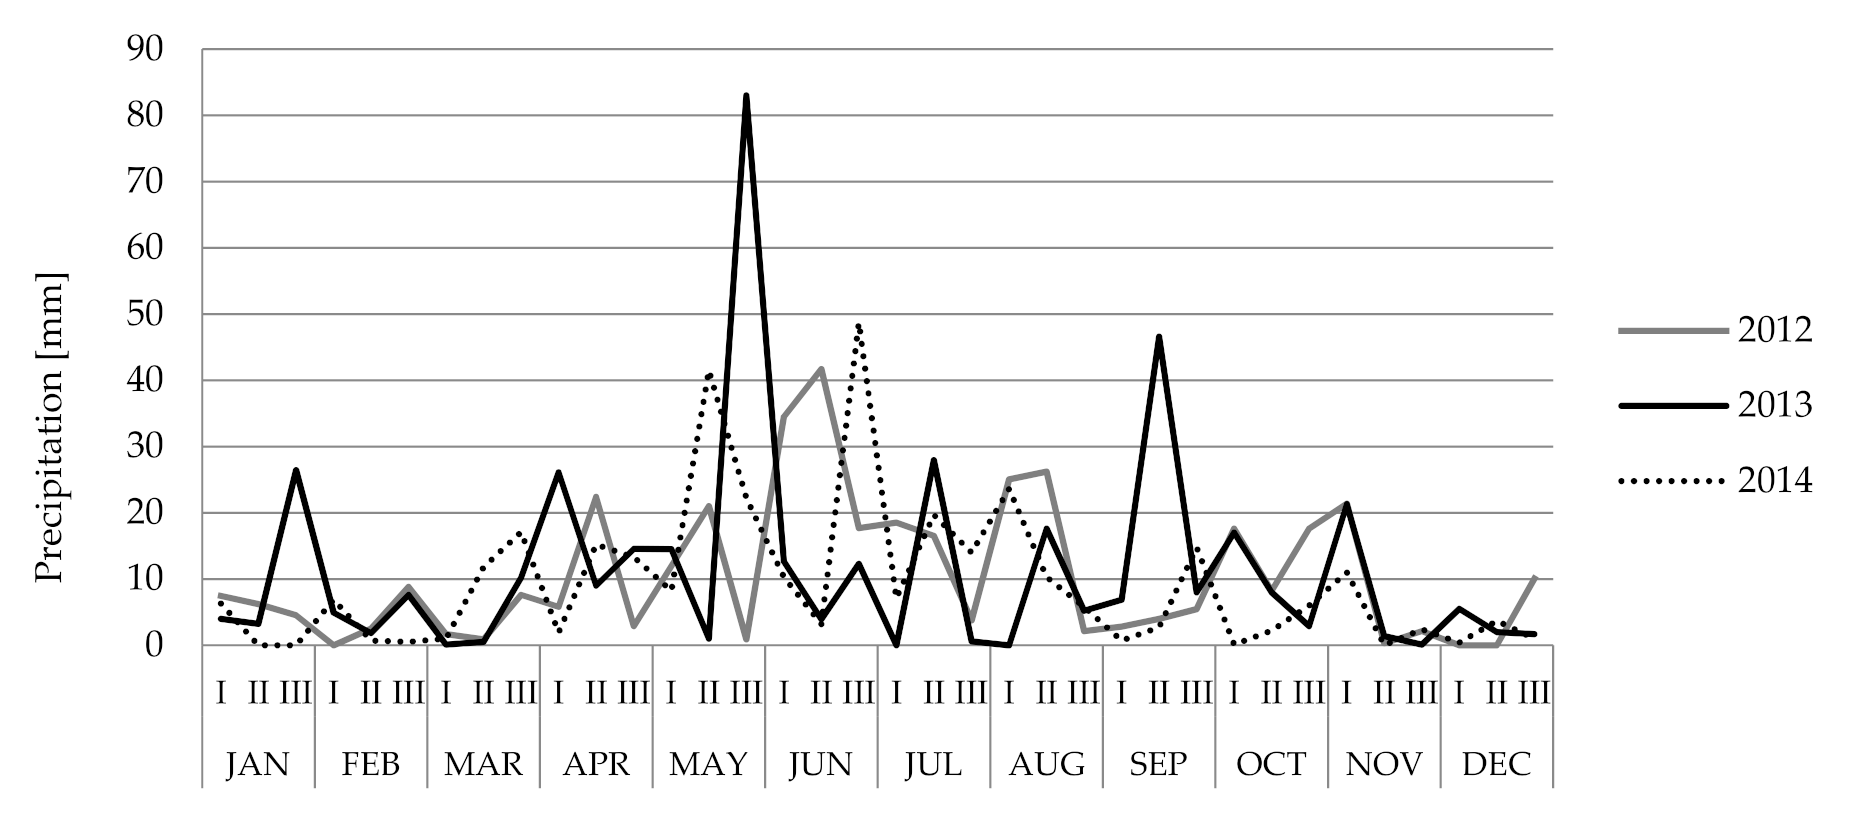
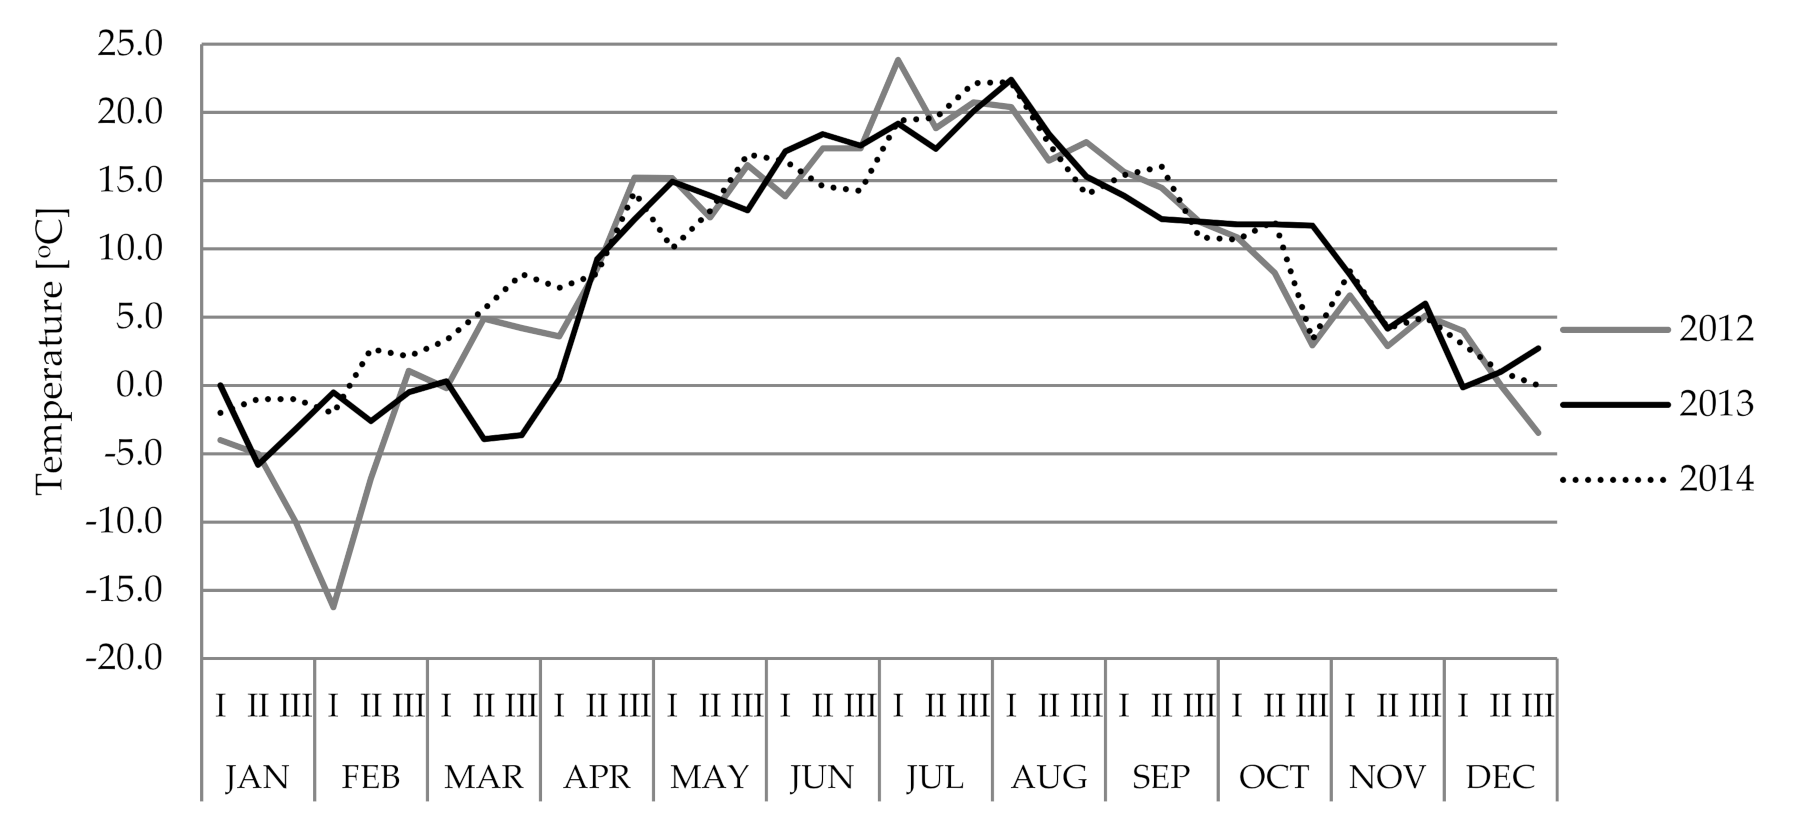
2.4. Weather Conditions

The average temperature and the sum of precipitations on test sites was similar in all 3 years of the study, with a few exceptions. The year of 2013 had almost twice as much precipitation in May as years 2012 and 2013 (Figure 2). In 2012, the average temperature in the first decade of February was twice as low as in 2013 and 2014 (Figure 3).

2.5. Organic and Conventional Farms

A survey with farm owners of winter cereal fields was conducted annually in November (after harvesting of crops) to gather the details of agricultural practices on the fields included in the study. Selected features of tested organic and conventional farms are given in Table 1. Organic and conventional farms had similar agricultural areas, of 28.3 and 24.5 ha, respectively. Organic farms included in the study were slightly larger than the regional average (average area of organic farm in the region of Lublin—15.6 ha) [24]. This was most probably due to the study squares (preselected 9 ha study surface) selection criteria (fields at least 500 m away from forest and possible biodiversity reservoirs), which promoted fields of larger area. Farms of both farming systems had similar quality of soils (mostly sandy soils of IV and V class) (Table 1). The use of some certified mineral fertilizers of natural origin is allowed in organic farming systems in Poland. However, the share of fields with natural mineral fertilization was so low (5%) that the median of the sum of mineral NPK for organic farms was 0 kg ha−1 (Table 1). The main difference between organic and conventional farms was the fertilization strategy. In total, 92.1% of conventional and only 42.1% of organic fields were fertilized. More fields were organically fertilized in organic than in conventional farms (36.8% and 13.2%, respectively). There were no organic fields with mixed organic and mineral fertilizers, while 21.0% of conventional fields were treated with both organic and mineral fertilizers. The amount of used mineral fertilization was significantly higher in conventional farms (Table 1). Plant protection products (PPP) were used only in conventional farming systems. Ninety-five percent of fields were sprayed with PPP, 74% of fields were sprayed with only herbicides, while 21% of fields were sprayed with insecticides or fungicides. The average yield of winter cereals was significantly higher in conventional farming systems than in organic farming systems (3.1 and 2.0 Mg ha−1, respectively).

2.6. Correlation Analysis

Spearman’s correlation coefficients were calculated to determine the influence and strength of the relationship between various habitat and agrotechnical factors on the diversity of segetal flora. For the analysis of the correlation, some survey data characterizing the habitat and management strategy were selected, which could affect the biodiversity of flora and soil seed bank, such as area of the tested winter cereal field, number of commercial crops cultivated (complexity of crop rotation), amounts of nitrogen (N), phosphorus (P) and potassium (K) brought in along with mineral and natural fertilization, number of mechanical and chemical treatments of weed infestation, grain yield and share of fields in farms that are covered with vegetation during winter period (share of “green” fields). The correlation was considered significant if correlation coefficient was equal or lower than 0.05 (ρ ≤ 0.05).

3. Results and Discussion

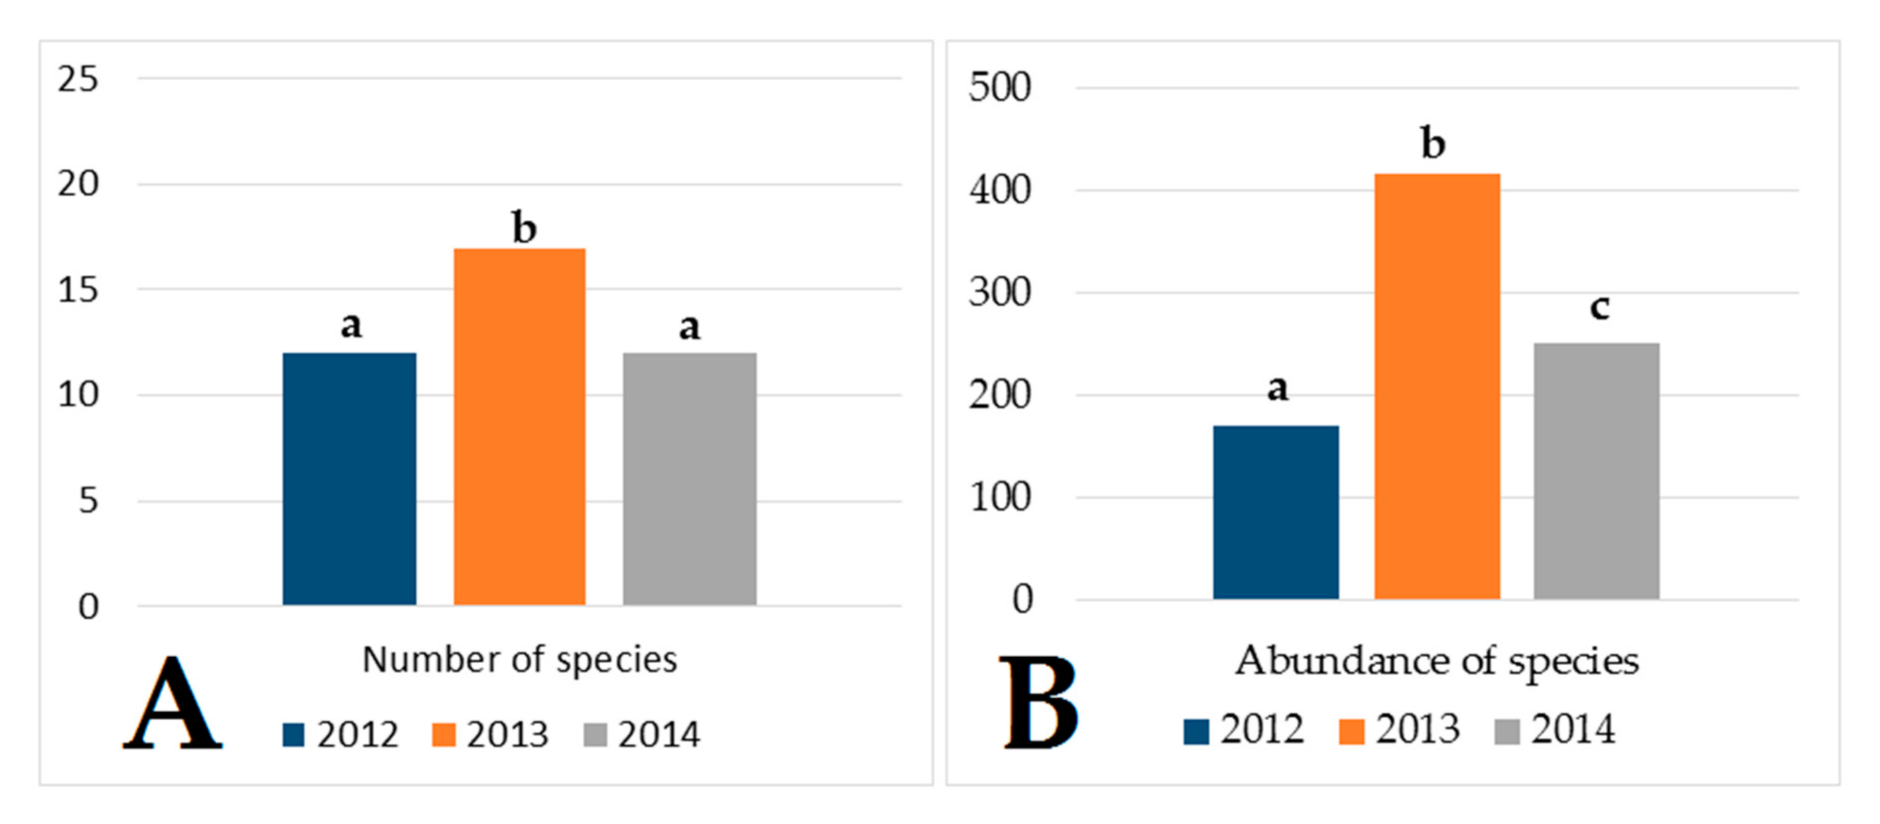
3.1. Number of Species and Their Abundance

The results showed significant differences in the number and the abundance of weed species between the years of the study (Figure 4). This was most probably due to the differences in weather conditions in subsequent years of research. In 2013, March was colder than in 2012 and 2014, with snow cover lasting even until mid-April, which caused a delay in cereals development. The sum of rainfall in 2013, which was almost twice as high as in 2012 and 2014, could also have been particularly important as it made it impossible for some farmers to perform weed control at the optimal time (local inundations of fields). In connection with the above, further statistical analysis was conducted separately for each year of the study.
In total, there were 149 weed species found in both organic and conventional farming systems. No statistically significant differences between the number of species in organic (133) and conventional farming systems (123) were found (Table 2). In total, 107 species were found in fields of both farming systems (72%). Significantly more (26) weed species occurred only in organic farming systems than only in conventional winter cereals (16).
Most of the unique species for both farming systems were found only in one year and on one field. Trifolium repens, Bromus hordeaceus, Persicaria amphibia, Rhinanthus serotinus and Scutellaria galericulata were found in organic winter cereals in more than one year and in more than one place, while Lamium purpureum and Hypericum perforatum were found in more than one year and more than one place in the conventional farming system (these were the most widespread and the most constant over time, unique species for the given farming system). A list of species that were unique for organic and conventional farming systems is given in Table 3. In the previous study (unpublished data) on the biodiversity of weeds in spring cereals (the same study area), more unique weed species were found in organic than in conventional farming systems. Moreover, Rhinanthus serotinus was also found to be one of the species unique to the organic farming system (it was found in two years of the study in one field of spring cereals). The average (median) number of species was significantly higher in all years of the study in the organic farming system. The same refers to the abundance of weeds (Table 2). According to Kleijn et al. [25], there are many weed species adapted to extensive agriculture, but it is hard to choose species that are typical for the intensive conventional farming conditions of Western Europe. There is a common trend that weed abundance and richness are positively affected by organic farming [26]. Furthermore, diversity of weed species seems to be enhanced under low-input farming system conditions, while low N fertilization enhanced the effective control of weeds [18]. Moreover, a low frequency of PPP application supported the biodiversity of weed flora.

3.2. Shannon’s Diversity and Simpson’s Dominance Indices

The values of Shannon’s diversity (H’) index were higher for weed communities present in organic than for conventional farming systems in 2012 and 2014. In 2013, the opposite relation was visible (higher Shannon’s diversity index values in conventional farming system). This could be due to the almost twice as high rainfall in May of 2013 as in 2012 and 2014, which resulted in local floods of fields. This made it impossible to carry out weed management practices on time, which resulted in increased numbers of weed species and abundance of weeds. The effects became particularly visible in the conventional farming system, as it is, to a greater extent, dependent on the timeliness of weed control treatments, especially spraying with herbicides. The increased weed infestation resulted in increased Shannon’s diversity index values, which, in 2013, was significantly higher than in organic farms. Moreover, biodiversity of weeds described by Simpson’s dominance (SI) index performed better (lower values of index) in organic than in conventional farms in 2012 and 2013, with no differences in 2014 (Table 4). The lack of differences in Simpson’s dominance index in 2014 might be the result of higher weed infestation in 2013. More weeds were able to germinate, bloom and produce seeds that made greater inflow of seeds into soil seed bank. This might result in higher weed infestation in following years, which made the differences between the two systems a little blurred, in this case, causing no differences in Simpson’s dominance index. Both Shannon’s and Simpson’s biodiversity indices showed that weed communities are significantly better maintained in organic farming systems, but relatively high values of Shannon’s index (H’ = 3.9–4.8) and low values of Simpson’s index (SI = 0.03–0.07) prove that biodiversity of weeds in conventional farms was also high. This was probably due to the fact that conventional farms were mostly of extensive character (low PPP use, low mineral fertilization) (Table 1). This proves the importance of low-input conventional farming for biodiversity conservation. This type of farming is common especially in Eastern and South-Eastern Poland, where economic and organizational conditions (small farms, fragmentation of agricultural land and low profitability) resulted in widespread low-input farming that, in these specific regions, can be considered traditional (low fertilizer input, especially mineral fertilizers, very low PPP consumption). The Lubelskie region, where the presented study was located, is one of the regions of Poland with the lowest intensity of agricultural production [21]. The high value of biodiversity of weeds of both organic and low-input conventional farming systems was confirmed by Berbeć and Feledyn-Szewczyk [27] for spring cereals and soil seed banks as well as by Jastrzębska et al. [28] for, among others, winter triticale. The results showed that the biodiversity of more intensive farming systems (high-input conventional, monoculture) is lower than in more sustainable farming systems (integrated and organic farming systems), which was confirmed by the presented study [29,30]. Armengot et al. [31] found that values of Shannon’s biodiversity index in organic farming systems can be almost twice as high as for conventional farming systems (H′ = 2.5 and H′ = 1.5 respectively). It was shown that the biodiversity of organic farms and low-input conventional farms can be much more similar, but still some significant differences can be found. The results revealed very low values of Simpson’s dominance index for both farming systems, which indicates that weed communities were not dominated by a single species. Despite the low values of Simpson’s index, the differences between the tested systems were still significant. Feledyn Szewczyk and Duer [29] also found that conventional cereals were more dominated by single species than organic ones. This was also confirmed by the presented study.

3.3. Dominant Species

Weed species with a total share in community exceeding 5% are given in Table 5 and Table 6 (organic and conventional farming system, respectively). Winter cereals were dominated by Poaceae weeds (Setaria pumila, Elymus repens, Apera spica-venti) and Juncus bufonius. These species are common in cereals of different farming systems all over Europe [32]. As for all annual weed species, their survival in agricultural (arable) ecosystems depends on the success of seed germination in subsequent growing seasons [33,34,35]. Setaria pumila and Elymus repens seemed to be the most dominant species of the organic farming system (27–42% of weed community annually). A large share of Elymus repens in the organic weed community may indicate the rather poor quality of agricultural treatments (especially weed control), which indirectly contributed to rather low yields of cereals. This may also be related to high share of cereals in crop rotation. Elymus repens was also dominant in conventional farming systems, which shows that weed control was an issue for farmers in both farming systems.
Echinochloa crus-galli and Setaria pumila used to be considered in the past as weeds typical to root crops and maize, with rather occasional occurrence in cereals [36]. The presented study showed a large share of Echinochloa crus-galli and Setaria pumila in the cereals in both farming systems. Its dominance in the weed community of cereals of the Lubelskie region was confirmed by Ziemińska-Smyk [37] and the previous study of the current authors [25].

3.4. Endangered Species

Endangered weed species have been selected on the basis of the Polish Red List of Plant and Fungi [38]. In total, five endangered weed species were found in winter cereals (Table 7). In the organic farming system, three species marked as vulnerable in the Polish Red List of Plant and Fungi were found (Bromus secalinus, Ranunculus arvensis, Anagallis foemina) and one species which is subject to partial legal protection in Poland (Helichrysum arenarium). Additionally, a few specimens of Myosurus minimus (vulnerable species according to Polish Red List of Plant and Fungi) were found in conventional farming system. Moreover, other weed species which are currently disappearing under conventional, intensive agriculture conditions were found in both farming systems. Those species included Agrostema githago L., Arnoseris minima L., Consolida regalis S.F. Gray, Euphorbia exigua L., Geranium sanguineum L., Lathyrus tuberosus L. and Veronica dillenii Crantz. Spring cereals seem to be slightly more important to rare and endangered weed species as one more endangered weed species and a few more rare species were found by the authors in their previous study in spring cereals [27] than in the presented study in the same study area. The presence of endangered and rare weed species proves the high environmental value of both organic and low-input conventional farming systems (which are still common in Eastern Poland) and their importance in biodiversity conservation.

3.5. Invasive Weed Species

Invasive weed species are currently observed in all types of ecosystems in Poland [39,40]. According to Tokarska-Guzik et al. [40], 84 species of plants are considered as invasive plant species in Poland. Ten of these species are typical segetal plants (weeds) that can be found on arable fields. These species are Alopecurus myosuroides Huds., Amaranthus retroflexus L., Anthoxanthum aristatum Boiss., Avena fatua L., Echinochloa crus-galli (L.) Beauv, Galinsoga ciliata Ruiz and Pav., Galinsoga parviflora Cav., Setaria pumila (Poir.) Roem. and Schult., Setaria viridis (L.) P. Beauv. and Veronica persica Poir. Most of those species were found in winter cereals in organic and conventional farming systems in the presented study (Table 8). Rural areas are made of both agricultural land which is devoted to the cultivation of plants and livestock raising and other habitats which are not being used in agricultural production (fallow lands, field boundaries, roads, ponds, in- and mid-fields shrubs, etc.), which can be a habitat for invasive plants. Such habitats, subjected to human activity, under favorable conditions, are the mainstay from which invasive plant species can penetrate into adjacent ecosystems [41], but they are also the sources of agricultural biodiversity [42].
In the presented study, there were in total 10 invasive weed species observed both in organic and conventional farming systems (Table 8). Nine species were observed in both faming systems; one extra species (Amaranthus retroflexus) was observed only in the conventional farming system. Most of the observed invasive weed species were classified as weeds of the first (the lowest) class of invasiveness according to Tokarska-Guzik et al. [36]. Only one species of the second class (Erigeron annuus) was observed (in both organic and conventional farming systems). There were no invasive weed species of the third and fourth (the highest) invasiveness classes. The most common invasive weed species in both farming systems were Setaria pumila and Echinochloa crus-galli. Unfortunately, these species were also one of the most dominant species in the investigated weed community of organic and conventional farming systems (Table 5 and Table 6). Other authors found Conyza canadensis, which was found in the presented study in both farming systems with rather low average abundance of 2 plants per m−2 (organic farming system) and less than 1 plant per m−2 (conventional farming system). This invasive plant species was found by other authors to be one of the most abundant invasive weed species in both agricultural and other ecosystems [43,44].

3.6. Correlation Analysis

The main cause of biodiversity loss in conventional farms is the intensification of agricultural production linked with high consumption of PPPs, including herbicides [45,46,47,48]. The results of the correlation analysis of the presented study are shown in Table 9. In most cases, tested biodiversity parameters in conventional farms were significantly negatively correlated with the number of chemical weed control treatments and field area (higher biodiversity on smaller fields). In conventional farms, Shannon’s diversity index was negatively correlated with the sum of mineral NPK fertilization. This relationship was confirmed also by other authors [49,50]. The loss of biodiversity on fields with higher NPK might be caused by higher intensity of production (e.g., use of herbicides), but also higher mineral NPK fertilization can cause a drop in soil pH, which changes the conditions of the habitat and makes fewer species from soil seed banks able to grow in more acidic habitats. Confirmation of this may be the fact that organic fertilization had no effect on biodiversity on conventional fields. Fried et al. (2020) [51] found increased fertilization to be one of the most important factors that caused changes in weed population (mainly due to the occurrence of more nutrient-demanding weed species).
Shannon’s diversity index in conventional farms was also positively correlated with percentage of fields in farms that were covered with vegetation during wintertime (share of “green fields”). A literature study shows that conventional farms that cultivated aftercrops as green manure can have an increased Shannon diversity index of weeds [52,53].
Armengot et al. (2013) [27] found that mechanical weed management had no negative effect on the biodiversity of weeds. The presented study confirmed this. Moreover, the tested biodiversity parameters (number of weed species and their abundance, Shannon’s diversity and Simpson’s dominance indices) in the tested organic farming system were not correlated with any of the tested field or farm parameters (farm or field area, number of cultivated crop species, percentage of fields that were covered with vegetation during wintertime, soil class, sum of NPK fertilization, number of mechanical weed management treatments, crop species or yield). This shows that biodiversity in the tested organic farms was less sensitive to disturbances caused by management strategy or organizational conditions than biodiversity in conventional farms. Pressure from external factors caused conventional farms to be less stable in terms of biodiversity.

4. Conclusions

The current research has shown significantly higher species diversity and abundance of weeds in the organic than in the conventional farming system. Shannon’s diversity index had high values and Simpson’s dominance index had low values in both farming systems, which showed their high biodiversity importance. The presence of the rare and endangered species showed that both organic and low-input conventional farming systems are the mainstays of valuable weed species. Winter cereal fields were dominated by some Poacea species, which might be due to less intense weed management. Correlation analysis showed weed community diversity of organic fields of winter cereals to be more resistant to external disturbances linked with management strategy than biodiversity of conventional fields.

Author Contributions

Conceptualization, J.S.; methodology, J.S., B.F.-S., M.S.; investigation, B.F.-S., M.S., A.K.B.; statistical analysis, A.K.B.; references, A.K.B., M.S., B.F.-S., A.K.; writing—original draft preparation, A.K.B.; writing—review and editing, M.S.; visualization, M.S., B.F.-S.; supervision, J.S.; project administration and technical preparation, A.K. All authors have read and agreed to the published version of the manuscript.

Funding

The research was funded by “Protection of species diversity of valuable natural habitats on agricultural lands on Natura 2000 areas in the Lublin Voivodeship (KIK/25)” project, a part of Polish–Swiss cooperation programme. The APC was funded by the Polish Ministry of Science and Higher Education within the statutory activity of the Institute of Soil Science and Plant Cultivation–State Research Institute.

Acknowledgments

The study was conducted within the project, Protection of species diversity of valuable natural habitats on agricultural lands on Natura 2000 areas in the Lublin Voivodeship (KIK/25), as part of Polish–Swiss cooperation.

Conflicts of Interest

The authors declare no conflict of interest. The funders had no role in the design of the study; in the collection, analyses, or interpretation of data; in the writing of the manuscript, or in the decision to publish the results.

References

  1. Garbach, K.; Milder, J.C.; Montenegro, M.; Karp, D.S. Biodiversity and Ecosystem Services in Agroecosystems. Encycl. Agric. Food Syst. 2014, 2. [Google Scholar] [CrossRef]
  2. Loreau, M.; Naeem, S.; Inchausti, P.; Bengtsson, J.; Grime, J.P.; Hector, A.; Hooper, D.U.; Huston, M.A.; Raffaelli, D.; Schmid, B.; et al. Biodiversity and ecosystem functioning: Current knowledge and future challenges. Science 2001, 294, 804–808. [Google Scholar] [CrossRef] [Green Version]
  3. Hooper, D.U.; Chapin Iii, F.S.; Ewel, J.J.; Hector, A.; Inchausti, P.; Lavorel, S.; Lawton, J.H.; Lodge, D.M.; Loreau, M.; Naeem, S.; et al. Effects of biodiversity on ecosystem functioning: A consensus of current knowledge. Ecol. Monogr. 2005, 75, 3–35. [Google Scholar] [CrossRef]
  4. Balvanera, P.; Pfisterer, A.B.; Buchmann, N.; He, J.S.; Nakashizuka, T.; Raffaelli, D.; Schmid, B. Quantifying the evidence for biodiversity effects on ecosystem functioning and services. Ecol. Lett. 2006, 9, 1146–1156. [Google Scholar] [CrossRef] [Green Version]
  5. Cardinale, B.J.; Matulich, K.L.; Hooper, D.U.; Byrnes, J.E.; Duffy, E.; Gamfeldt, L.; Balvanera, P.; O’Connor, M.I.; Gonzalez, A. The functional role of producer diversity in ecosystems. Am. J. Bot. 2011, 98, 572–592. [Google Scholar] [CrossRef] [Green Version]
  6. European Commission. Communication from the Commission to the European Parliament, the Council, the Economic and Social Committee and the Committee of the Regions Our Life Insurance, Our Natural Capital: An Eu Biodiversity Strategy to 2020. COM/2011/0244 Final. Available online: www.eur-lex.europa.eu/legal-content/EN/TXT/?uri=CELEX%3A52011DC0244 (accessed on 4 August 2020).
  7. Wagner, M.; Bullock, J.M.; Hulmes, L.; Hulmes, S.; Pywell, R. Cereal density and N-fertilizer effects on the flora and biodiversity value of arable headlands. Biodivers. Conserv. 2017, 26, 85–102. [Google Scholar] [CrossRef] [Green Version]
  8. Meyer, S.; Wesche, K.; Krause, B.; Leuschner, C. Dramatic losses of specialist arable plants in Central Germany since the 1950s/60s–A cross-regional analysis. Divers. Distrib. 2013, 19, 1175–1187. [Google Scholar] [CrossRef]
  9. Hallmann, C.A.; Sorg, M.; Jongejans, E.; Siepel, H.; Hofland, N.; Schwan, H.; Stenmans, W.; Müller, A.; Sumser, H.; Hörren, T.; et al. More than 75 percent decline over 27 years in total flying insect biomass in protected areas. PLoS ONE 2017, 12, e0185809. [Google Scholar] [CrossRef] [Green Version]
  10. Schumacher, M.; Ohnmacht, S.; Rosenstein, R.; Gerhards, R. How management factors influence weed communities of cereals, their diversity and endangered weed species in Central Europe. Agriculture 2018, 8, 172. [Google Scholar] [CrossRef] [Green Version]
  11. Scherber, C.; Eisenhauer, N.; Weisser, W.W.; Schmid, B.; Voigt, W.; Fischer, M.; Schulze, E.-D.; Roscher, C.; Weigelt, A.; Allan, E.; et al. Bottom-up effects of plant diversity on multitrophic interactions in a biodiversity experiment. Nature 2010, 468, 553–556. [Google Scholar] [CrossRef]
  12. Marshall, E.J.P.; Brown, V.K.; Boatman, N.D.; Lutman, P.J.W.; Square, G.R.; Ward, L.K. The role of weeds in supporting biological diversity within crop fields. Weed Res. 2003, 43, 77–89. [Google Scholar] [CrossRef] [Green Version]
  13. Oerke, E.-C. Crop losses to pests. J. Agric. Sci. 2006, 144, 31–43. [Google Scholar] [CrossRef]
  14. Gerhards, R.; Dieterich, M.; Schumacher, M. Rückgang von ackerunkräutern in baden-württemberg—Ein vergleich von vegetationskundlichen erhebungen in den jahren 1948/49, 1975–1978 und 2011 im raum mehrstetten—Empfehlungen für landwirtschaft und naturschutz. Gesunde Pflanz. 2013, 65, 151–160. [Google Scholar] [CrossRef]
  15. Urban, M.; Adamczewski, K.; Dobrzański, A. Ecological niche of weeds in spring cereals cultivars grown after winter oilseed rape. Prog. Plant Prot. 2013, 53, 105–109. (In Polish). Available online: https://pdfs.semanticscholar.org/c950/1dabafdfba2d60e8f1ca16ae81739e92ee67.pdf (accessed on 18 September 2020).
  16. Feledyn-Szewczyk, B.; Nakielska, M.; Jończyk, K.; Berbeć, A.K.; Kopiński, J. Assessment of the suitability of 10 winter triticale cultivars (x Triticosecale Wittm. ex A. Camus) for organic agriculture: Polish case study. Agronomy 2020, 10, 1144. [Google Scholar] [CrossRef]
  17. Arslan, Z.F. Decrease in biodiversity in wheat fields due to changing agricultural practices in five decades. Biodivers. Conserv. 2018, 27, 3267–3286. [Google Scholar] [CrossRef]
  18. Chamorro, L.; Masalles, R.M.; Sans, F.X. Arable weed decline in Northeast Spain: Does organic farming recover functional biodiversity? Agric. Ecosyst. Environ. 2016, 223, 1–9. [Google Scholar] [CrossRef]
  19. Travlos, I.S.; Chelmona, N.; Roussis, I.; Bilalls, D.J. Weed-species abundance and diversity indicates in relation to tillage systems and fertilization. Front. Environ. Sci. 2018, 6, 11. [Google Scholar] [CrossRef] [Green Version]
  20. Clergue, B.; Amiaud, B.; Pervanchon, F.; Lasserre-Joulin, F.; Plantureux, S. Biodiversity: Function and assessment in agricultural areas. A review. Agron. Sustain. Dev. 2005, 25, 309–327. [Google Scholar] [CrossRef]
  21. Kopiński, J.; Matyka, M. Ocena regionalnego zróżnicowania współzależności czynników przyrodniczych i organizacyjno-produkcyjnych w polskim rolnictwie. Zagadnienia Ekon. Rolnej 2016, 1, 57–79. [Google Scholar] [CrossRef] [Green Version]
  22. Shannon, C.E.A. Mathematical theory of communications. Bell Syst. Tech. 1948, 27, 379–423. [Google Scholar] [CrossRef] [Green Version]
  23. Simpson, E.H. Measurement of diversity. Nature 1949, 163, 688. [Google Scholar] [CrossRef]
  24. Central Statistical Office. Statistical Yearbook; Central Statistical Office: Warsaw, Poland, 2019; p. 94. (In Polish) [Google Scholar]
  25. Kleijn, D.; Rundlöf, M.; Scheper, J.; Smith, H.G.; Tscharntke, T. Does conservation on farmland contribute to halting the biodiversity decline? Trends Ecol. Evol. 2011, 26, 474–481. [Google Scholar] [CrossRef] [PubMed]
  26. Armengot, L.; Sans, F.X.; Fischer, C.; Flohre, A.; José-Maria, L.; Tscharntke, T.; Thies, C. The β-diversity of arable weed communities on organic and conventional cereal farms in two contrasting regions. Appl. Veg. Sci. 2012, 15, 571–579. [Google Scholar] [CrossRef]
  27. Berbeć, A.K.; Feledyn-Szewczyk, B. Biodiversity of weeds and soil seed bank in organic and conventional farming systems. Res. Rural Dev. 2018, 2, 12–19. [Google Scholar] [CrossRef]
  28. Jastrzębska, M.; Jastrzębski, W.P.; Hołdyński, C.; Kostrzewska, M.K. Weed species diversity in organic and integrated farming systems. Acta Agrobot. 2013, 66, 113–124. [Google Scholar] [CrossRef] [Green Version]
  29. Feledyn-Szewczyk, B.; Duer, I. Weed infestation in spring wheat cultivated in organic crop production system in comparison with other crop production systems. J. Res. Appl. Agric. Eng. 2007, 52, 40–44. (In Polish) [Google Scholar]
  30. Feledyn-Szewczyk, B.; Matyka, M.; Staniak, M. Comparison of the effect of perennial energy crops and agricultural crops on weed flora diversity. Agronomy 2019, 9, 695. [Google Scholar] [CrossRef] [Green Version]
  31. Armengot, L.; José-María, L.; Chamorro, L.; Sans, F.X. Weed harrowing in organically grown cereal crops avoids yield losses without reducing weed diversity. Agron. Sustain. Dev. 2013, 33, 405–411. [Google Scholar] [CrossRef] [Green Version]
  32. Glemnitz, M.; Radics, L.; Hoffmann, J.; Czimber, G. Weed species richness ad species composition of different arable field types—A comparative analysis along a climate gradient from South to North Europe. J. Plant Dis. Protect. 2006, 20, 577–586. [Google Scholar]
  33. Froud-Williams, R.J.; Chancellor, R.J.; Drennan, D.S.H. Influence of cultivation regime upon buried weed seeds in arable cropping systems. J. Appl. Ecol. 1983, 20, 199–208. [Google Scholar] [CrossRef]
  34. Kremer, R.J. Management of weed seed banks with microorganisms. Ecol. Appl. 1993, 3, 42–52. [Google Scholar] [CrossRef] [PubMed]
  35. Graziani, F.; Onofri, A.; Pannacci, E.; Tei, F.; Guiducci, M. Size and composition of weed seedbank in long-term organic and conventional low-input cropping systems. Eur. J. Agron. 2012, 39, 52–61. [Google Scholar] [CrossRef]
  36. Wesołowski, M. Występowanie wybranych gatunków chwastów w uprawach rolniczych. In Makroregion Południowo-Wschodni; IUNG: Pulawy, Poland, 1988; R220/8; pp. 1–43. (In Polish) [Google Scholar]
  37. Ziemińska-Smyk, M. Zmiany w zachwaszczeniu upraw zbóż na Zamojszczyźnie gatunkami z rodziny traw (Poaceae). Zesz. Nauk. UP Wrocław Rol. C 2012, 584, 159–163. (In Polish) [Google Scholar]
  38. Mirek, Z. Red List of Plants and Fungi in Poland; Szafer Institute of Botany, Polish Academy of Sciences: Krakow, Poland, 2006. [Google Scholar]
  39. Tokarska-Guzik, B.; Bzdęga, K.; Nowak, T.; Lewandowska, A.; Gancarek, M.; Frelich, M. Alien plants in Poland: Research directions and putting the results into practice. Biodiv. Res. Conserv. 2014, 35, 57–74. [Google Scholar] [CrossRef] [Green Version]
  40. Tokarska-Guzik, B.; Dajdok, Z.; Zając, M.; Zając, A.; Urbisz, A.; Danielewicz, W.; Hołdyński, C. Rośliny Obcego Pochodzenia w Polsce ze Szczególnym Uwzględnieniem Gatunków Inwazyjnych; Generalna Dyrekcja Ochrony Środowiska: Warsaw, Poland, 2012; pp. 35–69. (In Polish) [Google Scholar]
  41. Jackowiak, B. Modele ekspansji roślin synantropijnych i transgenicznych. Phytocoen. 11 Semin. Geobot. 1999, 6, 4–16. [Google Scholar]
  42. Kujawa, K.; Bernacki, Z.; Arczyńska-Chudy, A.; Janku, K.; Karg, J.; Kowalska, J.; Oleszczuk, M.; Sienkiewicz, P.; Sobczyk, D.; Weyssenhoff, H. Flower strips as rarely used in Poland tool for enhancement of Integrated Pest Management in cultivated fields, and for enlargement of biodiversity in agricultural areas. Prog. Plant Prot. 2018, 58, 115–128. (In Polish) [Google Scholar] [CrossRef]
  43. Bomanowska, A.; Ferchmin, M.; Kirpluk, I.; Otręba, A. Inwazyjne gatunki roślin we florze Puszczy Kampinoskiej. In Inwazyjne Gatunki Roślin w Kampinoskim Parku Narodowym i w Jego Sąsiedztwie; Kampinoski Park Narodowy: Izabelin, Poland, 2014; pp. 25–35. (In Polish) [Google Scholar]
  44. Chmielecki, B.; Kucharski, L. Gatunki inwazyjne w dolinie środkowej Warty. Biul. Uniejowski 2018, 7, 77–95. (In Polish) [Google Scholar] [CrossRef]
  45. Hyvönen, T.; Salonen, J. Weed species diversity and community composition in cropping practices at two intensity levels—A six-year experiment. Plant Ecol. 2002, 154, 73–81. [Google Scholar] [CrossRef]
  46. Szeleźniak, E.; Grabiński, J.; Nieróbca, P. Wpływ intensywności technologii produkcji wybranych gatunków zbóż na ich zachwaszczenie. Acta Sci. Pol. Agric. 2007, 6, 83–90. (In Polish) [Google Scholar]
  47. Koocheki, A.; Nassiri, M.; Alimoradi, L.; Ghorbani, R. Effect of cropping systems and crop rotations on weeds. Agron. Sustain. Dev. 2009, 29, 401–408. [Google Scholar] [CrossRef]
  48. Berbeć, A.K. Weed Diversity in Spring Cereals and Weed Seed Bank in Conventional and Organic Farms in the Province of Lublin. Ph.D. Thesis, Institute of Soil Science and Plant Cultivation State Research Institute, Puławy, Poland, 2016. [Google Scholar]
  49. Tang, L.; Cheng, C.; Wan, K.; Li, R.; Wang, D.; Tao, Y.; Pan, J.; Xie, J.; Chen, F. Impact of fertilizing pattern on the biodiversity of a weed community and wheat growth. PLoS ONE 2014, 9, e84370. [Google Scholar] [CrossRef] [PubMed]
  50. Haliniarz, M.; Gawęda, D.; Kwiatkowski, C.; Frant, M.; Różańska-Boczula, M. Weed biodiversity in field Pea under reduced tillage and different mineral fertilization conditions. Bulg. J. Agric. Sci. 2014, 20, 1340–1348. [Google Scholar]
  51. Fried, G.; Chauvel, B.; Munoz, F.; Reboud, X. Which traits make weeds more successful in maize crops? Insights from a three-decade monitoring in France. Plants 2020, 9, 40. [Google Scholar] [CrossRef] [PubMed] [Green Version]
  52. Majchrzak, L.; Piechota, T. Wpływ technologii uprawy na zachwaszczenie pszenicy jarej. Fragm. Agron. 2013, 31, 94–101. [Google Scholar]
  53. Wortman, S.E.; Lindquist, J.L.; Haar, M.J.; Francis, C.A. Increased weed diversity, density and above-ground biomass in long-term organic crop rotations. Renew. Agric. Food Syst. 2010, 25, 281–295. [Google Scholar] [CrossRef] [Green Version]
Figure 1. The locations of fourteen pairs of study squares.
Agriculture 10 00413 g001
Figure 2. The 10-day sum of precipitations in following months in the years of investigation. I, II, II—the first, the second and the third ten days of month.
Agriculture 10 00413 g002
Figure 3. The 10-day average temperature in following months in the years of investigation. I, II, II—the first, the second and the third ten days of month.
Agriculture 10 00413 g003
Figure 4. Comparison of median numbers of species (A) and their abundance (B) (plants m−2) in years of investigation. Different letters indicate significant differences according to single factor ANOVA and pairwise Mann–Whitney post-hoc test (p < 0.05).
Agriculture 10 00413 g004
Table 1. The main features (medians) of the tested organic (ORG) and conventional (CONV) farms.
FeatureMedian
ORGCONV
Soil class (I—best; VI—worse)IV and VIV and V
Agricultural area of the farm (ha)28.3 a24.5 a
Sum of mineral NPK (kg ha−1)0 a121 b
Number of mechanical weed control treatments1 a1 a
Number of plant protection product treatments0 a1 b
Average yields of cereals (Mg ha−1)2.0 a3.1 b
Share (%) of fields with:
Single harrowing44.750.0
Double harrowing36.826.3
More than two harrowings10.55.3
No mechanical weed control7.918.4
Only mineral fertilization5.357.9
Only organic fertilization36.813.2
Mineral and organic fertilization0.021.0
No fertilization57.97.9
Herbicide use074.0
Use of PPP other than herbicides021.0
PPP—plant protection products; different lowercase letters indicate significant differences according to Mood’s test (p < 0.05).
Table 2. Number and abundance of weed species (plants m−2) in organic (ORG) and conventional (CONV) farming systems in 2012–2014.
ParametersORGCONV
Total number of species149
Total number of species in the farming system133 a123 a
Species unique for system26 a16 b
Species common for both farming systems107
Median of Number of Weed Species per Field
201213.0 a9.0 b
201319.0 a14.0 b
201414.5 a9.0 b
Median of Abundance of Weed Flora (Plants m−2)
2012225 a94 b
2013470 a319 b
2014339 a128 b
Different lowercase letters indicate significant differences according to Mood’s test (p < 0.05).
Table 3. List of species unique to organic (ORG) and conventional (CONV) farming systems with number of years of study when given species were found and number of places (study squares) where species were found.
SpeciesNumber of Years in Which Species Was FoundNumber of Study Squares Where Species Was Found
ORG
Trifolium repens L.24
Bromus hordeaceus L.22
Persicaria amphibia (L.) Delarbre22
Rhinanthus serotinus (Schönh.) Obornţ22
Scutellaria galericulata L.22
Carduus crispus L.21
Vicia villosa Roth14
Trifolium hybridum L.12
Matricaria chamomilla L.12
Rumex obtusifolius L.12
Phragmites australis (Cav.) Trin. ex Steud11
Campanula persicifolia L.11
Peucedanum palustre (L.) Moench11
Pisum sativum L.11
Brassica juncea (L.) Czern.11
Lotus corniculatus L11
Valeriana officinalis L.11
Linaria vulgaris Mill.11
Lupinus albus L.11
Lupinus angustifolius L.11
Gypsophila paniculata L.11
Papaver argemone L.11
Potentilla anserina L.11
Erysimum cheiranthoides L.11
Rorippa palustris L. Besser11
Lysimachia vulgaris L.11
CONV
Lamium purpureum L.24
Hypericum perforatum L.22
Agrostis gigantea Roth13
Cardaminopsis arenosa (L.) Hayek12
Festuca rubra L.11
Helictotrichon pubescens (Huds.) Besser ex Schult. and Schult. f.11
Geranium sanguineum L.11
Geranium dissectum L.11
Campanula rapunculoides L.11
Lathyrus tuberosus L.11
Myosurus minimus L.11
Matricaria discoidea DC.11
Arabidopsis thaliana (L.) Heynh.11
Amaranthus retroflexus L.11
Thlaspi arvense L.11
Bidens frondosa L.11
Table 4. Values of Shannon’s diversity (H′) and Simpson’s dominance (SI) indices for weed communities in organic (ORG) and conventional (CONV) farming systems.
YearIndexORGCONV
Biodiversity Indices
2012Shannon (H’)4.152 b3.860 a
Simpson (SI)0.031 a0.045 b
2013Shannon (H’)4.518 a4.777 b
Simpson (SI)0.021 a0.071 b
2014Shannon (H’)4.305 b4.138 a
Simpson (SI)0.028 a0.025 a
Table 5. Share (%) of dominant (more than 5% of the community) species in organic winter cereals.
Species2012201320142012–2014
Setaria pumila (Poir.) Roem. and Schult32.323.914.823.4
Elymus repens (L.) Gould9.29.811.810.3
Apera spica-venti (L.) P. Beauv8.53.06.25.4
Poa bulbosa L.0.05.110.25.3
Rumex acetosella L.10.03.41.84.7
Polygonum lapathifolium L. subsp. lapathifolium6.15.32.44.6
Scleranthus annuus L.4.53.15.94.3
Echinochloa crus-galli (L.) P. Beauv.0.07.61.53.7
Anthemis arvensis L.0.03.05.22.9
Number of dominant species (>5% of weed community)5564
Table 6. Share (%) of dominant (more than 5% of the community) weed species in conventional farming system.
Species2012201320142012–2014
Juncus bufonius L.6.031.93.421.3
Setaria pumila (Poir.) Roem. and Schult25.212.64.913.4
Echinochloa crus-galli (L.) P. Beauv.16.04.67.77.3
Apera spica-venti (L.) P. Beauv2.76.115.47.3
Poa bulbosa L.0.010.01.86.5
Viola arvensis Murr.4.93.612.05.5
Elymus repens (L.) Gould6.02.78.04.4
Centaurea cyanus L.0.60.68.32.2
Spergula arvensis L.6.80.30.11.4
Anthemis arvensis L.0.00.25.81.3
Scleranthus annuus L.0.00.05.51.2
Rumex acetosella L.5.80.10.11.1
Number of dominant species (>5% of weed community)6476
Table 7. Average abundance (plants m−2) of endangered weed species in organic (ORG) and conventional (CONV) winter cereals.
Species and Endangerment CategoryAverage Abundance (Plants m2)
ORGCONV
Bromus secalinus L. v0.10.5
Ranunculus arvensis L. v0.30.1
Anagallis foemina Mill. v0.30.2
Myosurus minimus L. v<0.1
Helichrysum arenarium (L.) Moench p0.80.3
v—vulnerable according to Polish Red List of Plant and Fungi [31]; p—subject to partial legal protection in Poland.
Table 8. Average abundance of invasive weed species in organic (ORG) and conventional (CONV) winter cereals (average for 2012–2014).
SpeciesInvasiveness Class *Average Abundance (Plants m−2)
ORGCONV
Setaria pumila (Poir.) Roem. and Schult.I88.737.0
Echinochloa crus-galli L.I14.220.3
Setaria viridis (L.) P. Beauv.I5.11.2
Avena fatua L.I<0.10.7
Conyza Canadensis (L.) CronquistI2.30.7
Veronica persica Poir.I0.71.3
Galinsoga parviflora Cav.I0.1<0.1
Oxalis stricta L.I0.50.9
Amaranthus retroflexus L.I00.3
Erigeron annuus (L.) PersII0.31.1
* Invasiveness class from I (the lowest) to IV (the highest) according to Tokarska Guzik et al. [36].
Table 9. Spearman’s correlation coefficient matrix of selected variables for organic and conventional farming system.
NSAbH’SINCSGFFAMin NPKOrg NPKNHPPPYield
NS 0.1860.707 *−0.608 *0.1170.200−0.1500.1430.1450.17300.130
Ab0.678 * 0.008−0.0130.1710.154−0.1240.1420.0550.03700.024
H’0.529 *0.283 −0.971 *−0.104−0.0590.0480.0370.0970.26400.114
SI−0.388 *−0.202−0.943 * 0.0620.092−0.100−0.067−0.054−0.2070−0.151
NC−0.184−0.260−0.1130.129 0.029−0.2100.2790.124−0.01300.077
SGF0.2210.1610.322 *−0.194−0.108 −0.372 *0.2540.2230.21500.031
FA−0.517 *−0.400 *−0.390 *0.351 *0.029−0.158 0.008−0.537 *−0.0310−0.169
Min NPK−0.145−0.095−0.378 *0.2860.143−0.465 *0.301 −0.121−0.12100.069
Org NPK0.1650.0760.238−0.248−0.395 *0.095−0.251−0.265 0.30600.260
NH0.0270.1070.203−0.2160.0440.043−0.217−0.176−0.152 0−0.079
PPP−0.430 *−0.430 *−0.548 *0.448 *−0.059−0.1370.402 *0.356 *0.044−0.481 * 0.000
Yield−0.232−0.395 *−0.147−0.003−0.324 *−0.0910.1380.309−0.027−0.2120.503 *
Significant Spearman’s correlation coefficient at * p < 0.05. Correlations for organic farming system are in upper right part of the matrix. Correlations for conventional farming systems are in lower left part of the matrix. NS—number of species; Ab—abundance; H′—Shannon’s index; SI—Simpson’s index; NC—number of crops; SGF—share of “green” fields; FA—field area; Min NPK—mineral NPK fertilization; Org NPK—organic NPK fertilization; NH—number of harrowings; PPP—number of PPP treatments.

