Article

The Perceived Benefits, Challenges, and Environmental Effects of Cover Crop Implementation in South Carolina

by
Lucas Clay
1,*,
Katharine Perkins
1,
Marzieh Motallebi
2,
Alejandro Plastina
3 and
Bhupinder Singh Farmaha
4
1
Department of Forestry and Environmental Conservation, Clemson University, 261 Lehotsky Hall Box 340317, Clemson, SC 29634, USA
2
Baruch Institute of Coastal Ecology and Forest Science, Clemson University, P.O. Box 596, Georgetown, SC 29442, USA
3
Department of Economics, Iowa State University, 478 Heady Hall, Ames, IA 50011, USA
4
Department of Plant and Environmental Sciences, Edisto Research and Education Center, Clemson University, 64 Research Rd, Blackville, SC 29817, USA
*
Author to whom correspondence should be addressed.
Agriculture 2020, 10(9), 372; https://doi.org/10.3390/agriculture10090372
Submission received: 30 June 2020 / Revised: 14 August 2020 / Accepted: 18 August 2020 / Published: 21 August 2020
(This article belongs to the Section Agricultural Systems and Management)

Abstract

:
Cover crops are becoming more accepted as a viable best management practice because of their ability to provide important environmental and soil health benefits. Because of these benefits, many land managers are strongly encouraging the use of cover crops. Additionally, there is limited information on farmers′ perceptions of the benefits and challenges of implementing cover crops. Many farmers state that they do not have enough money or time to implement cover crops. In an attempt to gather more data about the adoption rate and perceptions of cover crops in South Carolina, a survey was sent to 3000 row crop farmers across the state. Farmers were asked whether they implement cover crops and their perceptions of the benefits and challenges associated with implementation. Furthermore, questions were asked regarding the impact of row cropping on their environment to gauge farmer′s education level on environmental impacts. Responses showed many people are implementing cover crops; however, there are still differences in perceptions about benefits and challenges between those who are adopting cover crops and those who are not. This research assesses these differences and aims to provide a baseline for focusing cover crop programs to tackle these certain challenges and promote the benefits.

1. Introduction

Soil erosion is a major issue in the agriculture sector of the United States, and was determined to be a serious crisis in the 1970s and onward [1]. The southeastern United States, and especially South Carolina, has been especially affected by soil degradation from early agriculture operations, where forestlands are converted to agriculture, and the land is subject to significant erosion [2]. The soil organic matter that is lost (carbon) can be upwards of 20–40%, significantly affecting both soil and water quality [3]. Soil quality decreases by limiting microbial activity that is important for healthy and robust agriculture [3]. Additionally, the eroded soil finds its way into waterways, causing increased sedimentation. Cover crops are one effective option for a reduction in soil erosion; they are known by both researchers and stakeholders to be an effective form of environmental management in agriculture systems [4,5].
Cover crops are a promising solution to soil erosion and degraded soil; they are effective in reducing soil and nutrient losses, increasing soil health, and providing increased microbial activity [6,7,8]. With the implementation of cover crops, soils are less likely to remain bare at any point during the year, and the soil loss is abated [5,9]. Furthermore, a continuous use of cover crops helps retain the soil organic matter, thus conserving water, nutrients, and providing aeration, all of which would be significantly reduced during a period of bare soil [6,10]. Additional conservation practices coupled with cover crops often prove more effective than simply utilizing cover crops [11]. The ideas of conservation agriculture are encouraged when implementing cover crops, such as no-till fields, reduced use of fertilizers, and more efficient irrigation systems [12]. Studies have shown that no-till agriculture has significantly decreased soil erosion compared to erosion that results from conventional till agriculture [13,14,15].
Additionally, the impact of agriculture on water quality is a major concern among scientists and the public [7]. Sediments account for the largest quantity of water pollutants from agriculture, limiting fish growth and making water treatment more difficult [5]. The use of cover crops is one of the primary nature-based methods to retain soil and nutrients within the crop system, benefitting both the farm yield and the water quality that affects those external to the farm [10]. Increasing water quality is an important driver for the increased use of best management practices in agriculture systems, due to the commonly held belief that water quality is reduced due to non-point source pollution [7,16,17,18].
Despite the many benefits of implementing cover crops, the cover crop adoption rate remains low. One of the major challenges for farmers implementing cover crops is the lack of perceived financial and environmental benefits [19]. It is understandably difficult for farmers to justify the use of new conservation farming methods, such as cover crops, when it is already difficult year after year to profit. Some additional challenges in a variety of different cover crops include: disease problems [20,21], lack of available species that are shade and cold tolerant [22], and high costs with limited returns [23,24]. Furthermore, the implementation of cover crops and other conservation measures are often viewed as a long term commitment and result in limited or nonexistent short term gains. The possibility of no short term gains is undesirable for many farmers and reduces the implementation of conservation actions [8].
Since land managers have recently focused on the use of cover crops as a best management practice, surveys involving cover crop adoption and perceptions of farmers are limited in number. A few surveys indicate the continued but limited use of cover crops. In 2012, less than 5% of farmers in the United States utilized cover crops, as determined through a national survey by the Sustainable Agriculture Research and Education (SARE) program [8]. In many locations, US federal and state government agencies have been using cost share programs to encourage the implementation of conservation farming practices. These cost share programs aim to incentivize farmers to participate in conservation practices, since they are only implemented on a voluntary basis [25]. In 2011, the United States Department of Agriculture (USDA) spent over USD 5 billion on cost share programs, as defined in the Farm Bill [26]. Specifically, the Environmental Quality Incentives Program (EQIP) is one of the most comprehensive conservation cost share programs, funded by the federal government. This program is comprehensive in the sense that it provides over 200 options for conservation projects with cost share funding, and farmers have the opportunity to create an individualized program [27].
Understanding the perceptions towards and challenges of planting cover crops can help agencies and Cooperative Extension provide better information to those farmers who have the potential to include cover crops in their crop rotation. There are limited data for South Carolina when it comes to understanding these perceptions among row crop farmers.
The main objective of this study was to understand the opportunities for and barriers to planting cover crops in South Carolina (SC). Additionally, the study aimed to identify the type of cover crops that farmers are using and to understand their motivations behind the use. To achieve these goals, a survey was designed to study cover crop (CC) users′ and non-users′ perceptions towards and challenges for implementing cover crops. Information obtained through this survey is crucial for policy makers and outreach/extension personnel to determine ways to encourage farmers to implement cover crops and other conservation practices.

2. Materials and Methods

2.1. Survey

To obtain data on the farming community in SC, a mail survey and its follow up was sent to 3000 farmers growing one or more row crops between January and March 2019. These farmers were randomly selected from a Farm Service Agency database of SC row crop farmers. We designed our survey using a variety of resources, particularly a study by Plastina et al. [24]. The survey was broken into two parts: (1) a part for CC users and (2) a part for CC non-users. Both the non-users and the CC users were then asked identical questions where they would rank a variety of perceived benefits and challenges about implementing cover crops. This information will be crucial to understanding any differences in perceived challenges and benefits. The CC users were required to answer additional questions for us to understand their motivations for utilizing cover crops. They were also asked about the certain cover crops they used, how long they had been using them, and the cash and cover crop yields. All participants were asked to answer questions regarding education and demographics.

2.2. Pretest

The survey was pre-tested to establish that the terminology and questions were understandable and relevant to SC farmers. We pre-tested the survey in a cover crops educational event hosted by the Richland County Soil and Water Conservation district in October 2018. The survey was distributed to 26 farmers that attended the event, and 14 surveys were returned to us for analysis. Respondents provided beneficial feedback that was used to simplify and improve the questionnaire.

2.3. Statistical Analysis

Statistical analysis was completed to determine the relationships between cover crop non users and cover crop users, looking at a variety of demographic data and the implementation of cover crops. The association of demographic characteristics with cover crop use was analyzed using the ANOVA least significant difference (LSD) model. The similarity of perceptions across groups of cover-crop users and non-users was analyzed using a Chi-Square test of homogeneity. Both procedures were implemented in IBM SPSS™ (Armonk, NY, USA), and the chosen critical confidence level to determine significance was 95%.

3. Results

3.1. Overview

We received 308 survey responses out of 3000 distributed surveys, for a response rate of 10.3%. In total, 143 respondents, or 46.4% of the sample, indicated that they planted cover crops at some point while they owned or rented the land and 148, or 48.1%, reported not ever planting cover crops (Figure 1). The remaining 18 respondents did not respond to this question.
Based on the zip codes of the respondents, we can affirm that, while the survey covered the entire state, the higher concentration of responses came from counties in the center of the state (Figure 2). Out of all the survey respondents, the majority of respondents planted corn, soybeans, and raised poultry and livestock. There is still a significant number of farmers across the state that plant other crops, including cotton, wheat, hay, and peanuts. These responses are indicative of agriculture across the state. Much of the row crop farming takes place in the midlands, in the counties that have the highest cover crop usage (Richland, Lexington, Calhoun, and Orangeburg).
Farm sizes represented in the sample ranged from very small to large farms, but the most prevalent farm size category was that of 200 to 499 acres (Figure 3). In our sample, larger farms were more likely to have used cover crops than smaller farms. When analyzing the regression between those who implemented cover crops and farm size, the positive r-squared value (0.26) does provide some evidence that those respondents who had larger farmers were more likely to implement cover crops.

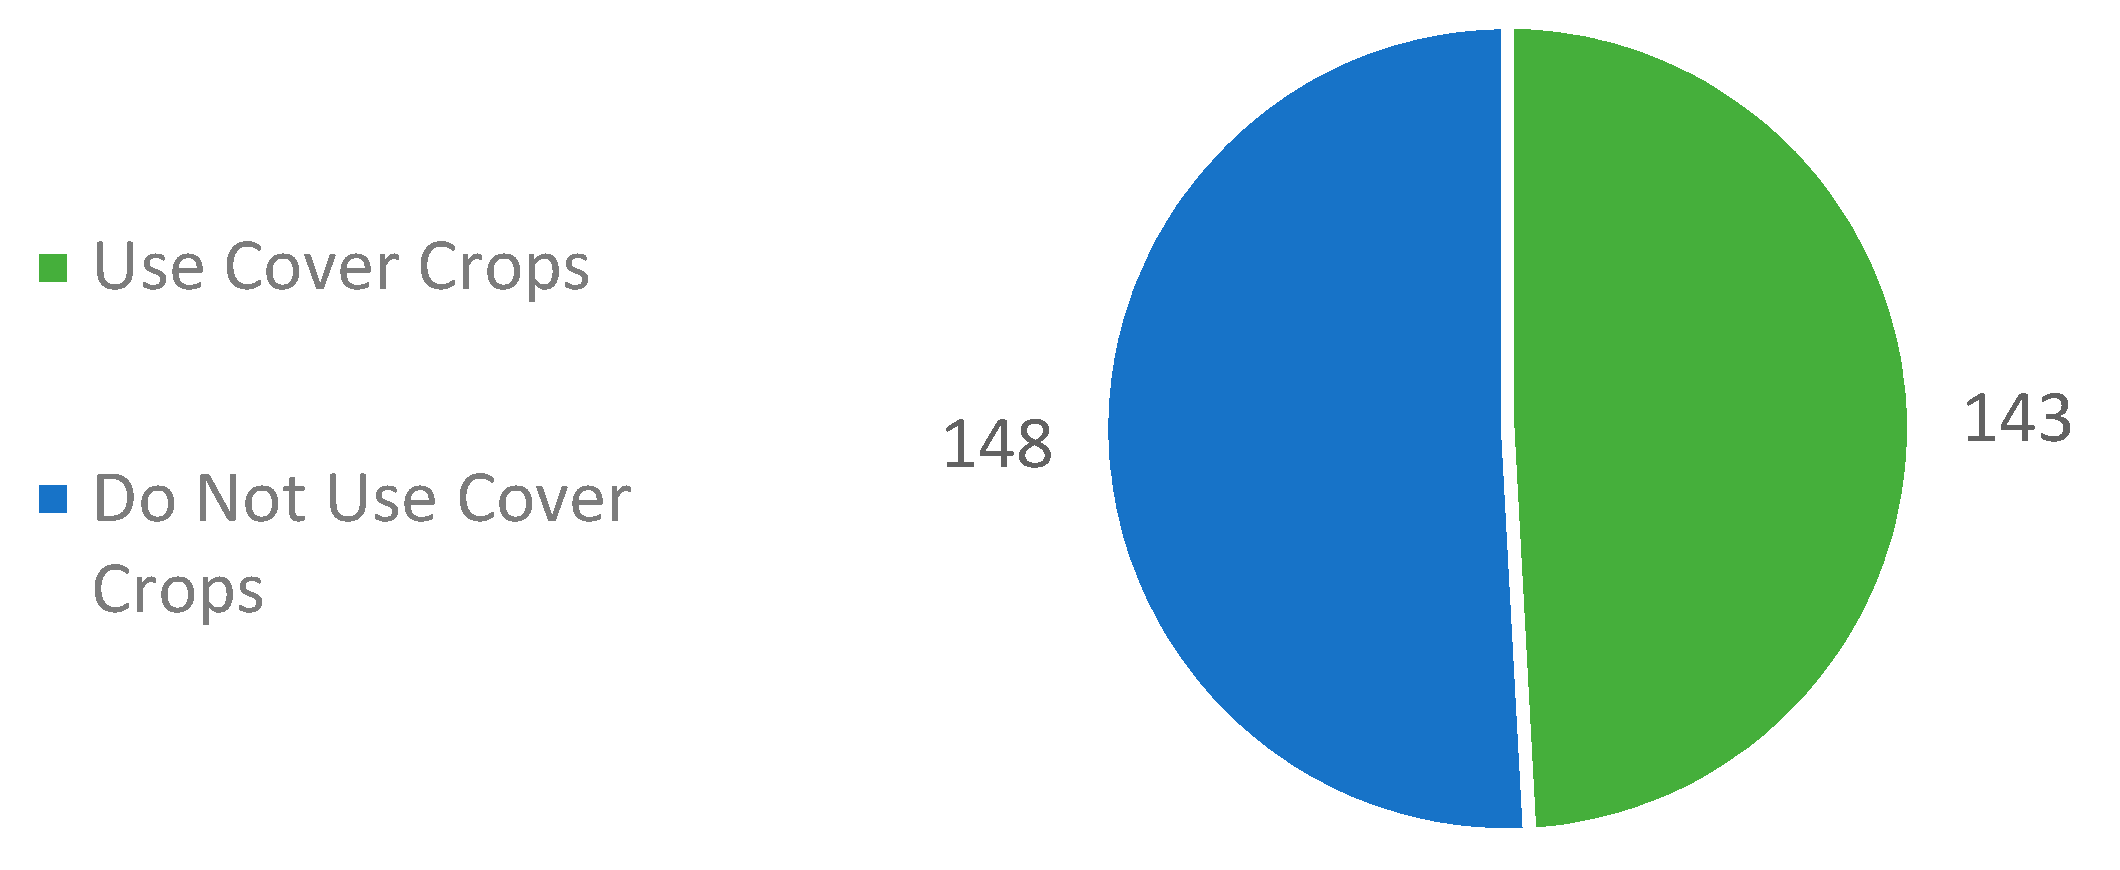
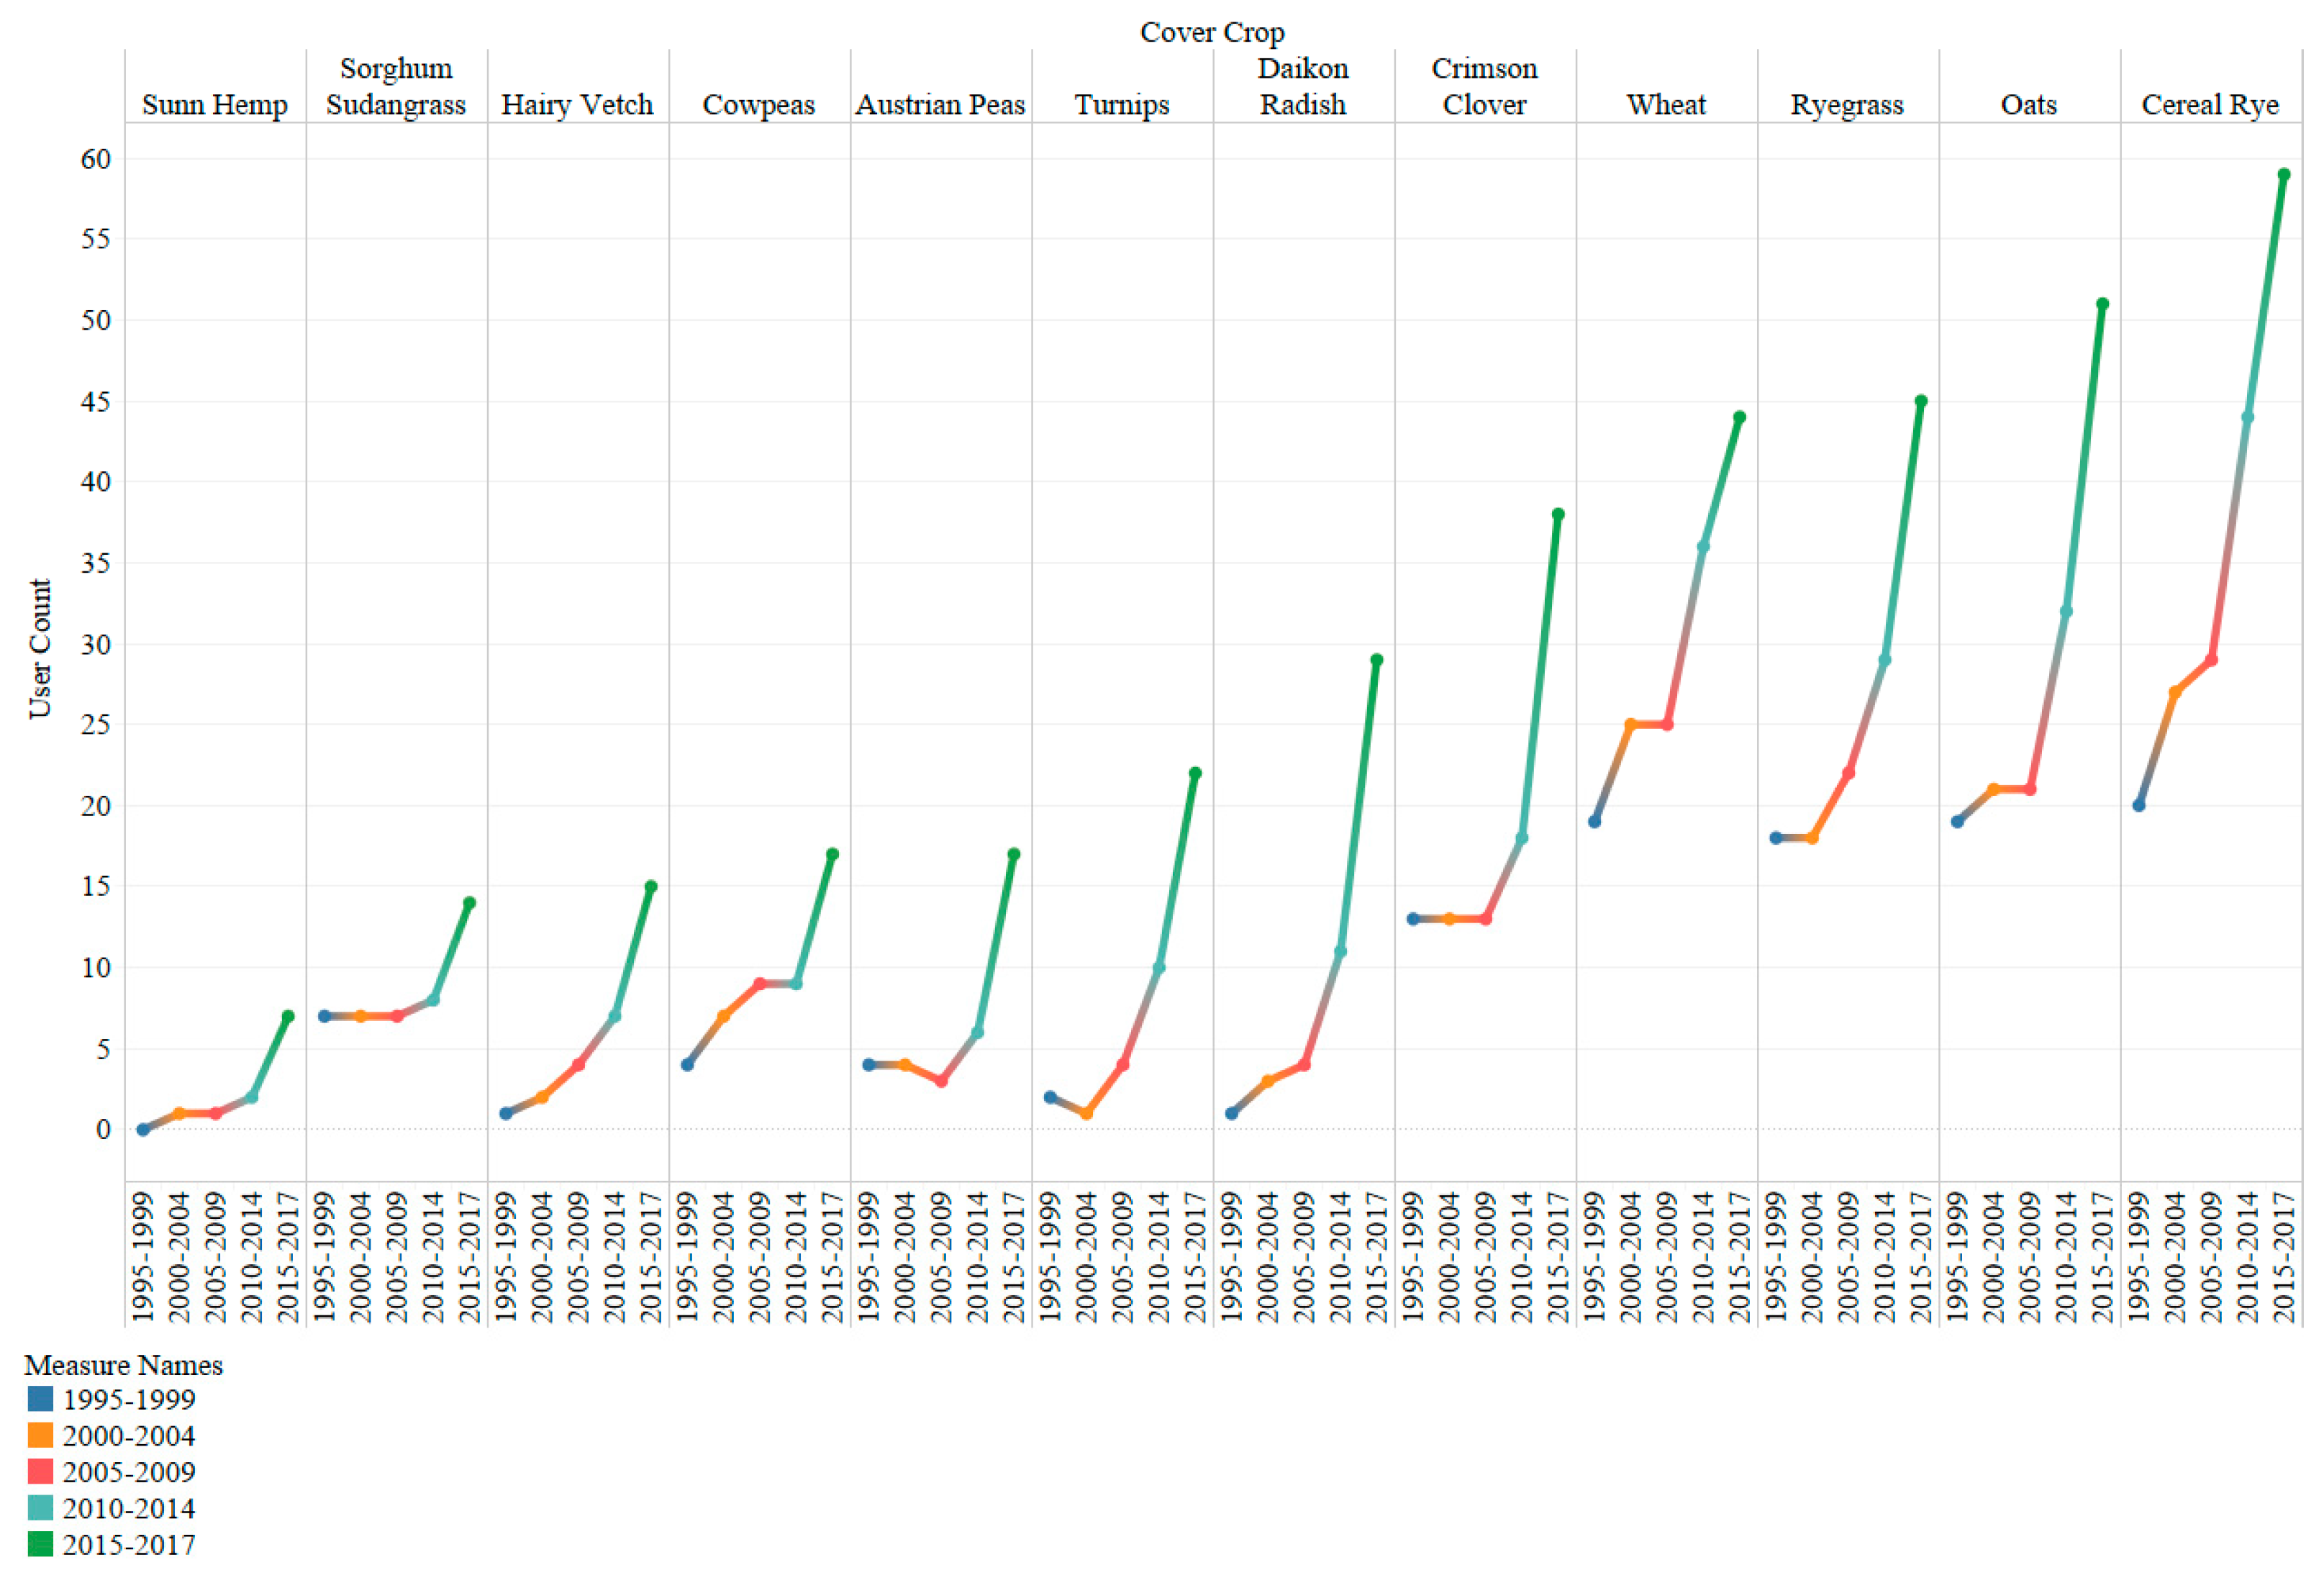
3.2. Cover Crop Usage

Respondents that implemented cover crops in the past were asked to describe which cover crops they used and how long they had been using them (Figure 4). The results indicate that almost all of the cover crops had an increase in usage between 1995 and 2017. It must also be taken into consideration that many farmers used a multi-species cover crop over a single species cover crop.
Respondents were asked a series of questions regarding their perceptions of the challenges and benefits of planting cover crops. The questions regarding challenges (Table 1) were answered through a ranking scale with the following response options: 1—Not a Problem I Considered; 2—Not a Challenge; 3—Neutral; 4—Somewhat of a Challenge; 5—A Difficult Challenge.
Table 1 details the mean number selected on the ranking scale and is compared between those who had used cover crops and those who had never used cover crops. A Chi-Squared test was also carried out to determine if the sample data for benefits and challenges have the same or equal distribution between CC users and non-users. The highest values for both categories, considered the most challenging aspect for cover crops, were the cover crop seed costs for both users and non-users. The cost of planting and managing cover crops for non-users was the most challenging option and was also significantly challenging for users. Cover crops sometimes using too much moisture was the least challenging option for both users and non-users. The second least challenging option was yield reduction in the following cash crop for CC users and nitrogen converting to organic forms for non-users.
We selected a list of cover crop benefits, which are outlined in Table 2. Respondents were asked to gauge the importance of these benefits from cover crops. The questions regarding benefits (Table 2) were answered through a ranking scale with the following response options: 1—Does not matter to me; 2—Not Important; 3—Indifferent/Neutral; 4—Somewhat Important; 5—Very Important.
According to the responses received, regardless of their cover crop usage, farmers do believe that these general factors regarding soil health, the importance of nutrients, and environmental quality are benefits gained from cover crops. Both CC users and non-users indicated that increasing soil organic matter and soil health was the most important benefit of cover crops. The next most important benefit of cover crops was the same for both groups as well, to reduce soil erosion. The least important benefit for both CC users and non-users was that the winter would kill the cover crop easily.

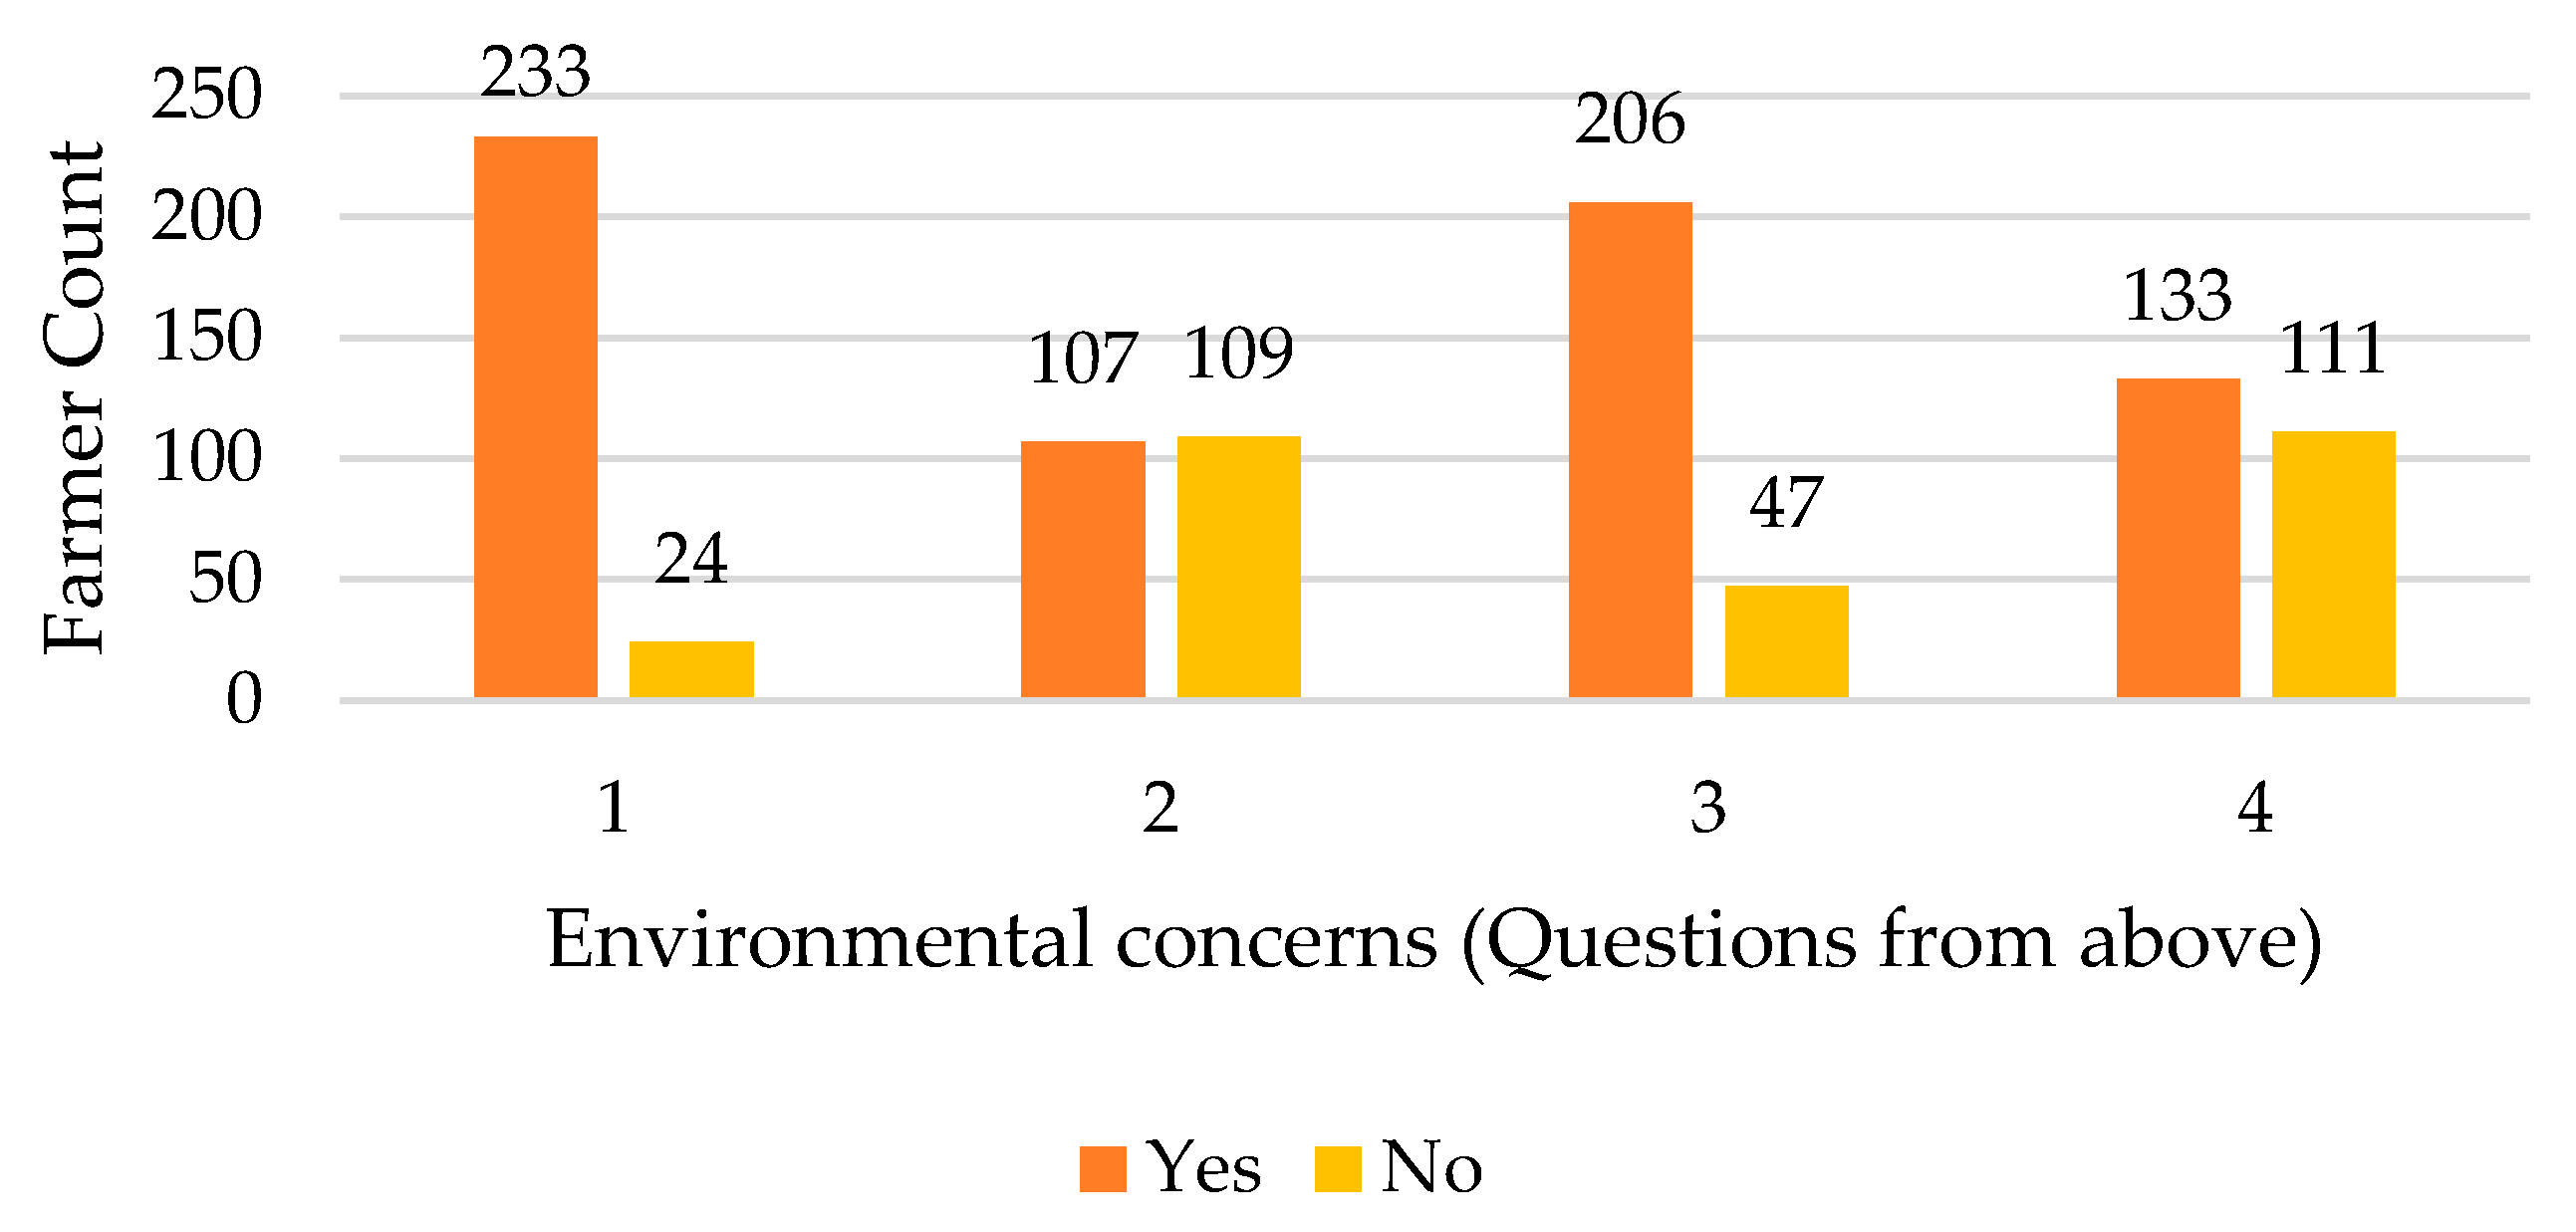
3.3. Environmental Considerations

Farmers were asked four “yes” or “no” questions that attempted to gauge their understanding of and attitudes towards environmental issues that occur from nutrient runoff from agriculture operations. The questions were as follows:
  • South Carolina farmers should do more to reduce nutrient runoff into waterways.
  • Nutrients from farms contribute to algae blooms and red tide in the ocean.
  • I am concerned about agriculture′s impact on water quality.
  • I would be willing to have someone evaluate how my farm is doing to reduce runoff into waterways.
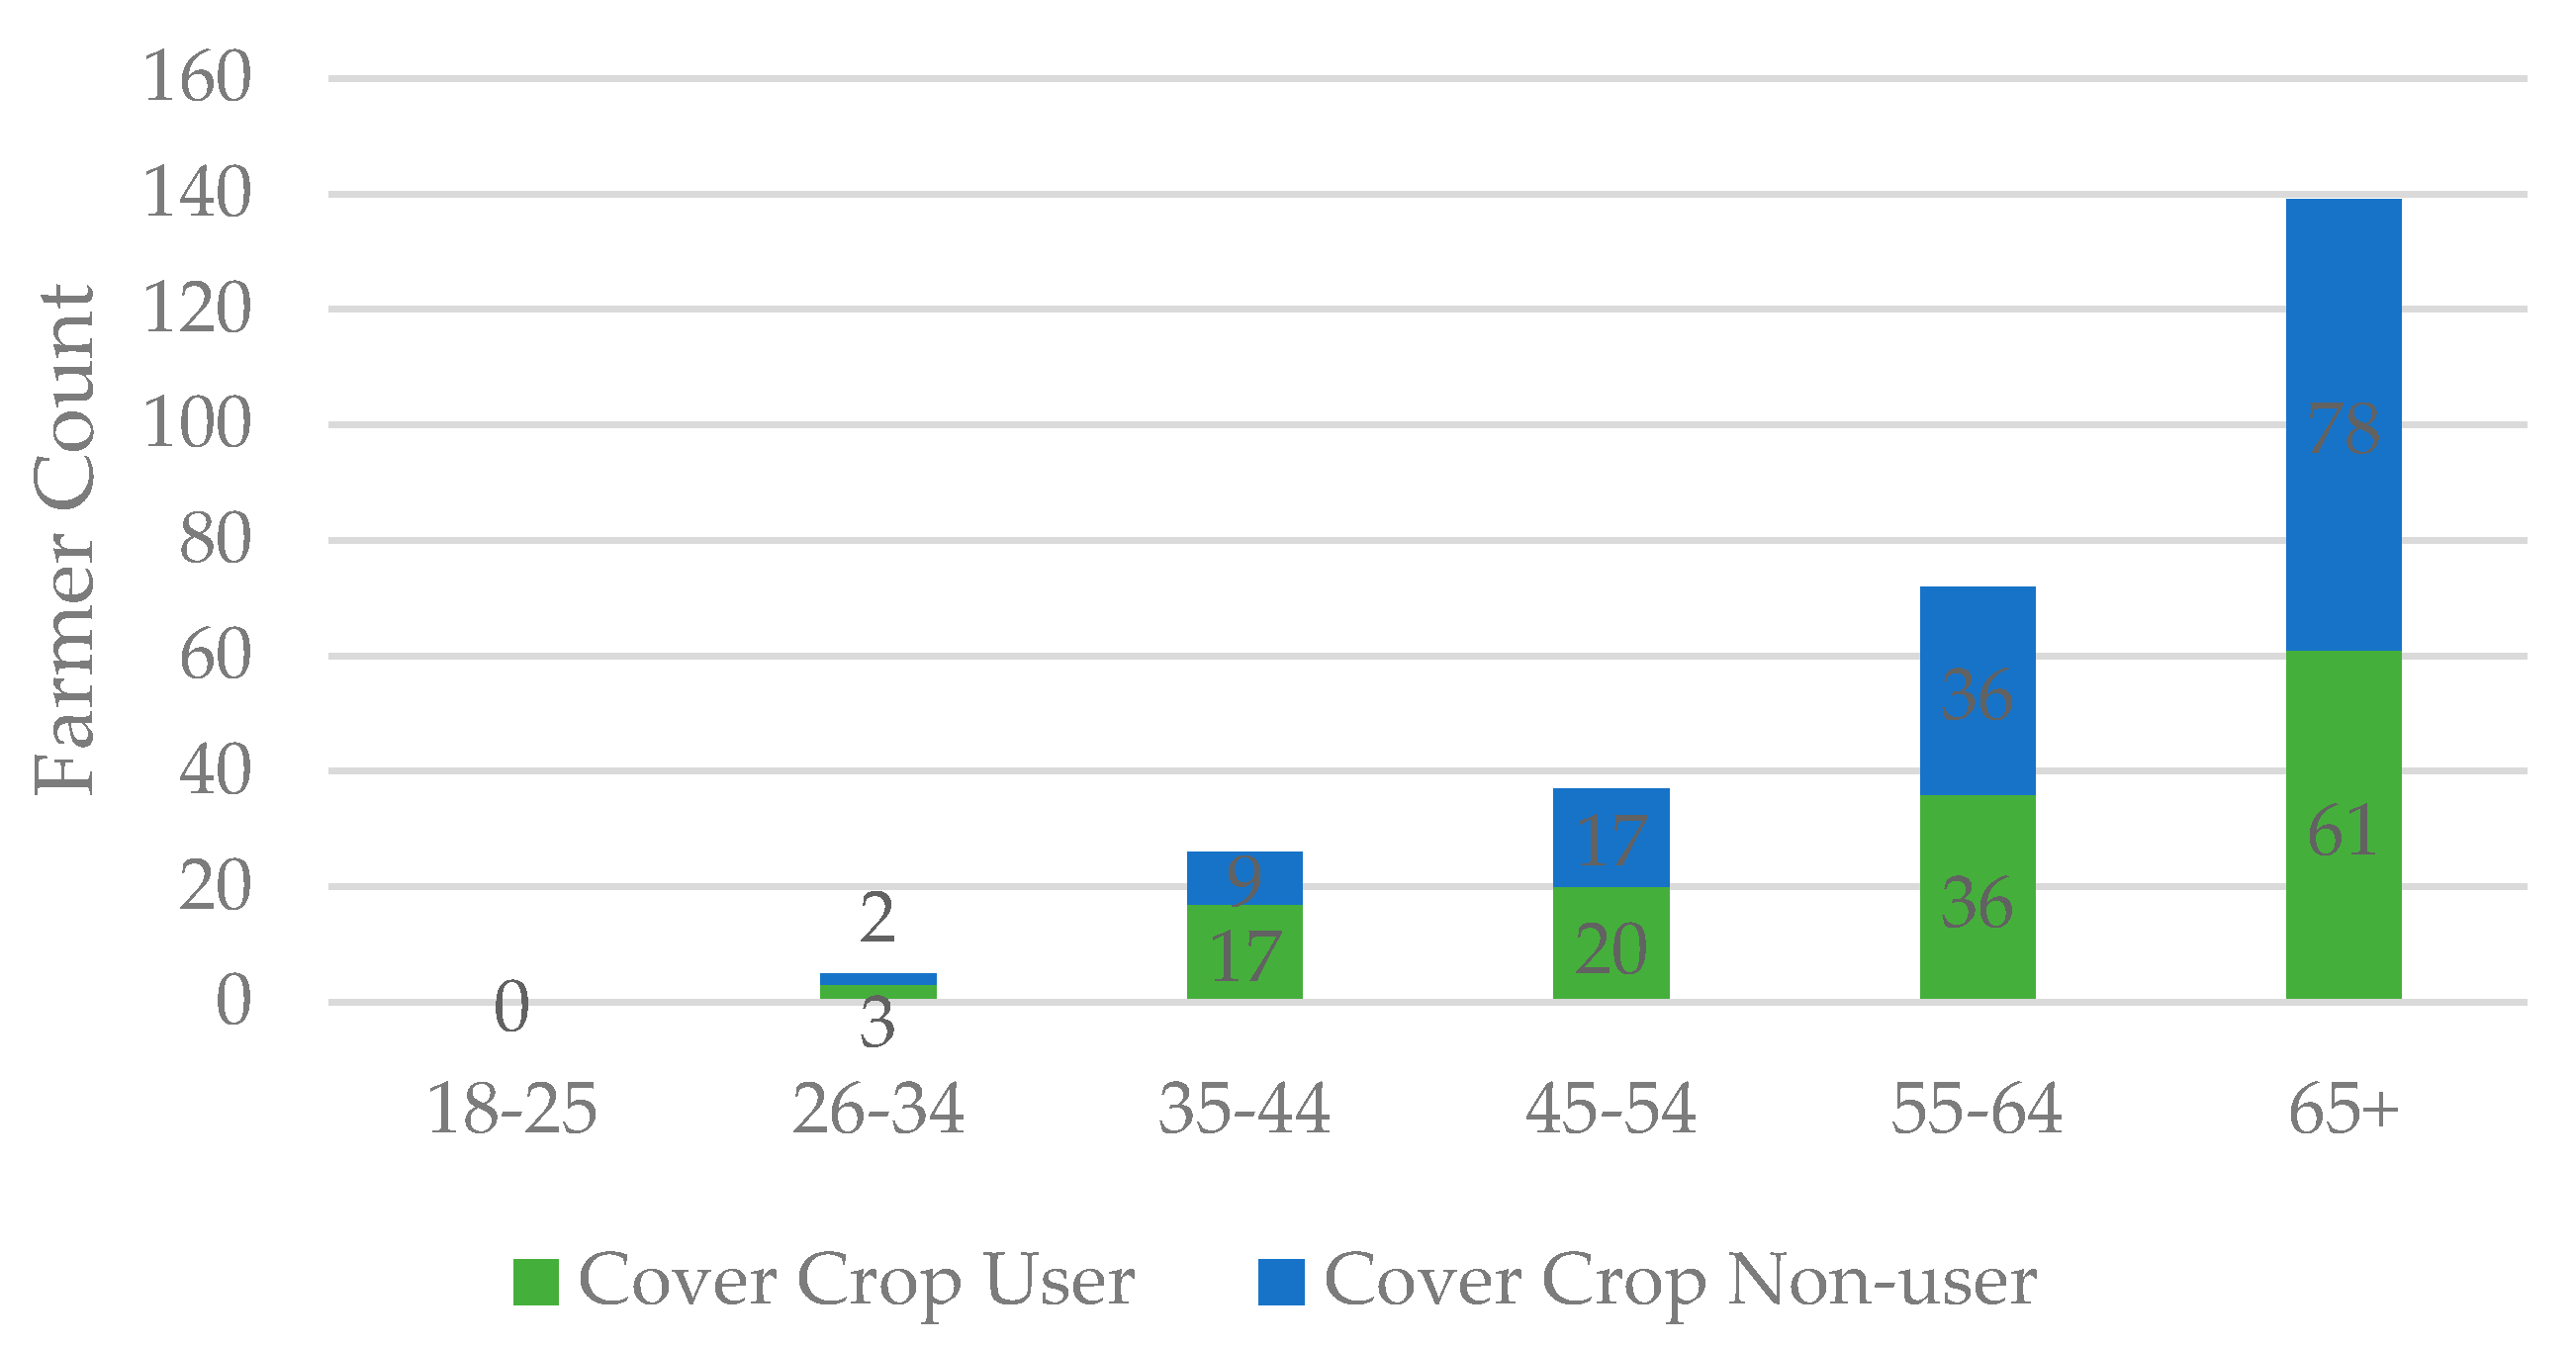
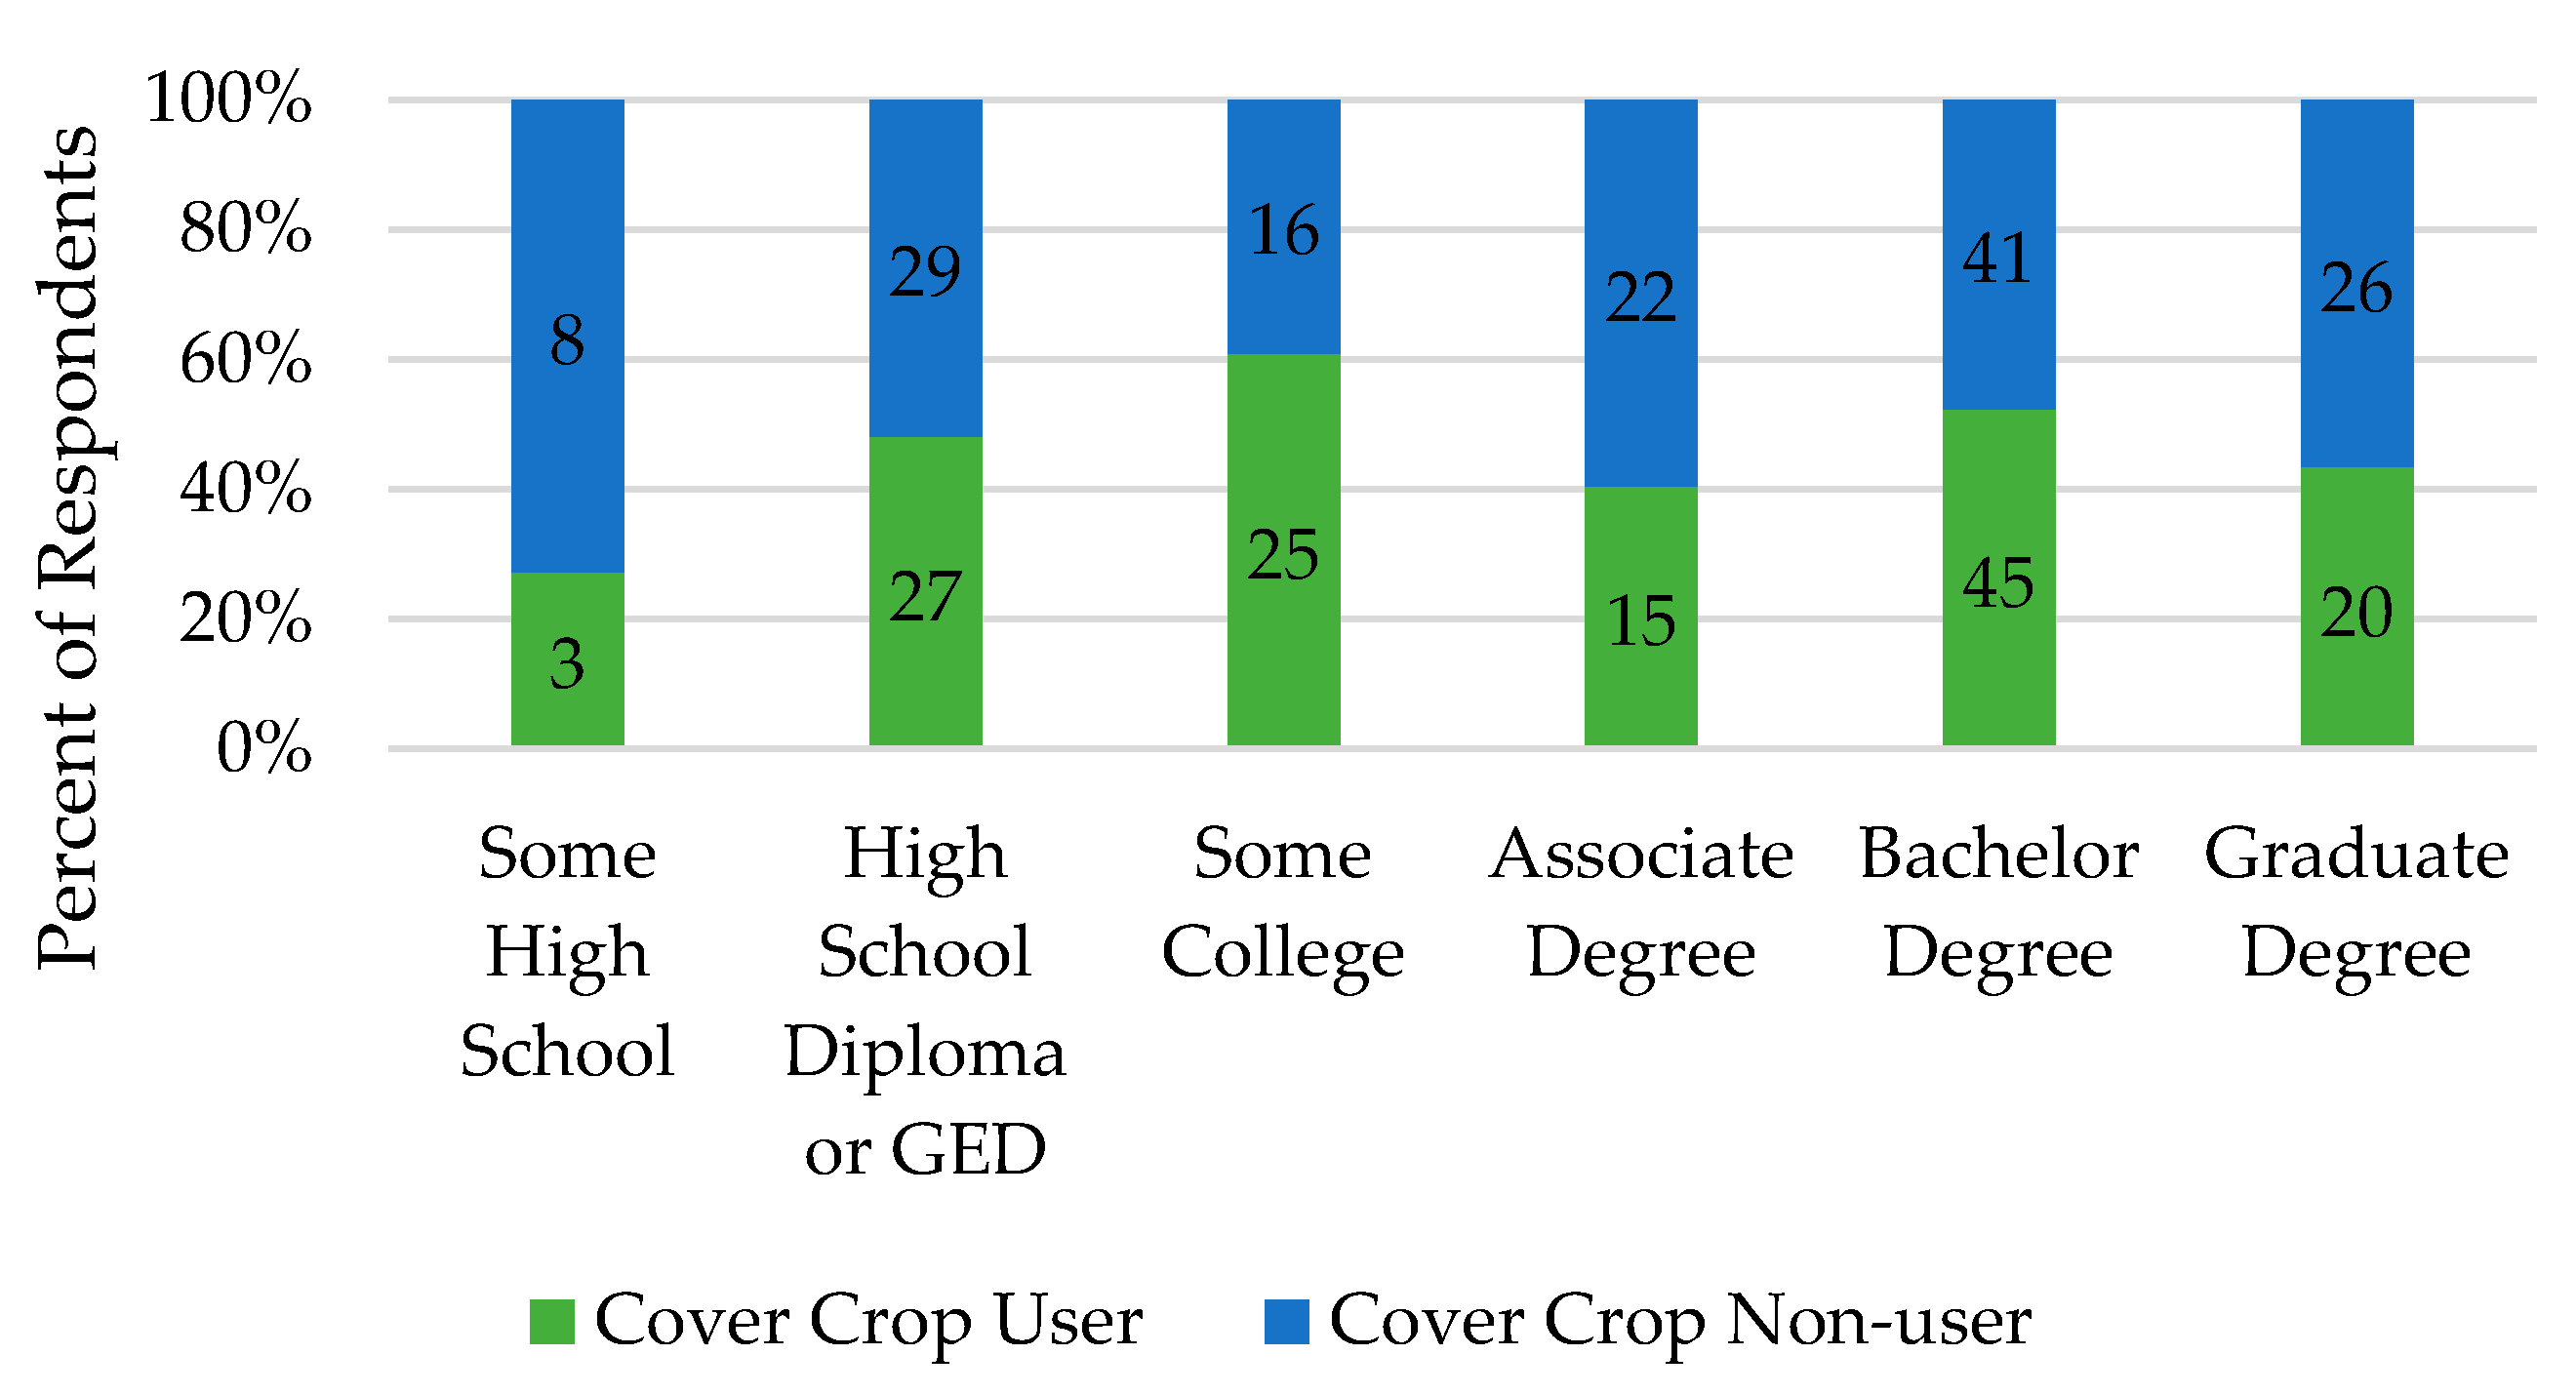
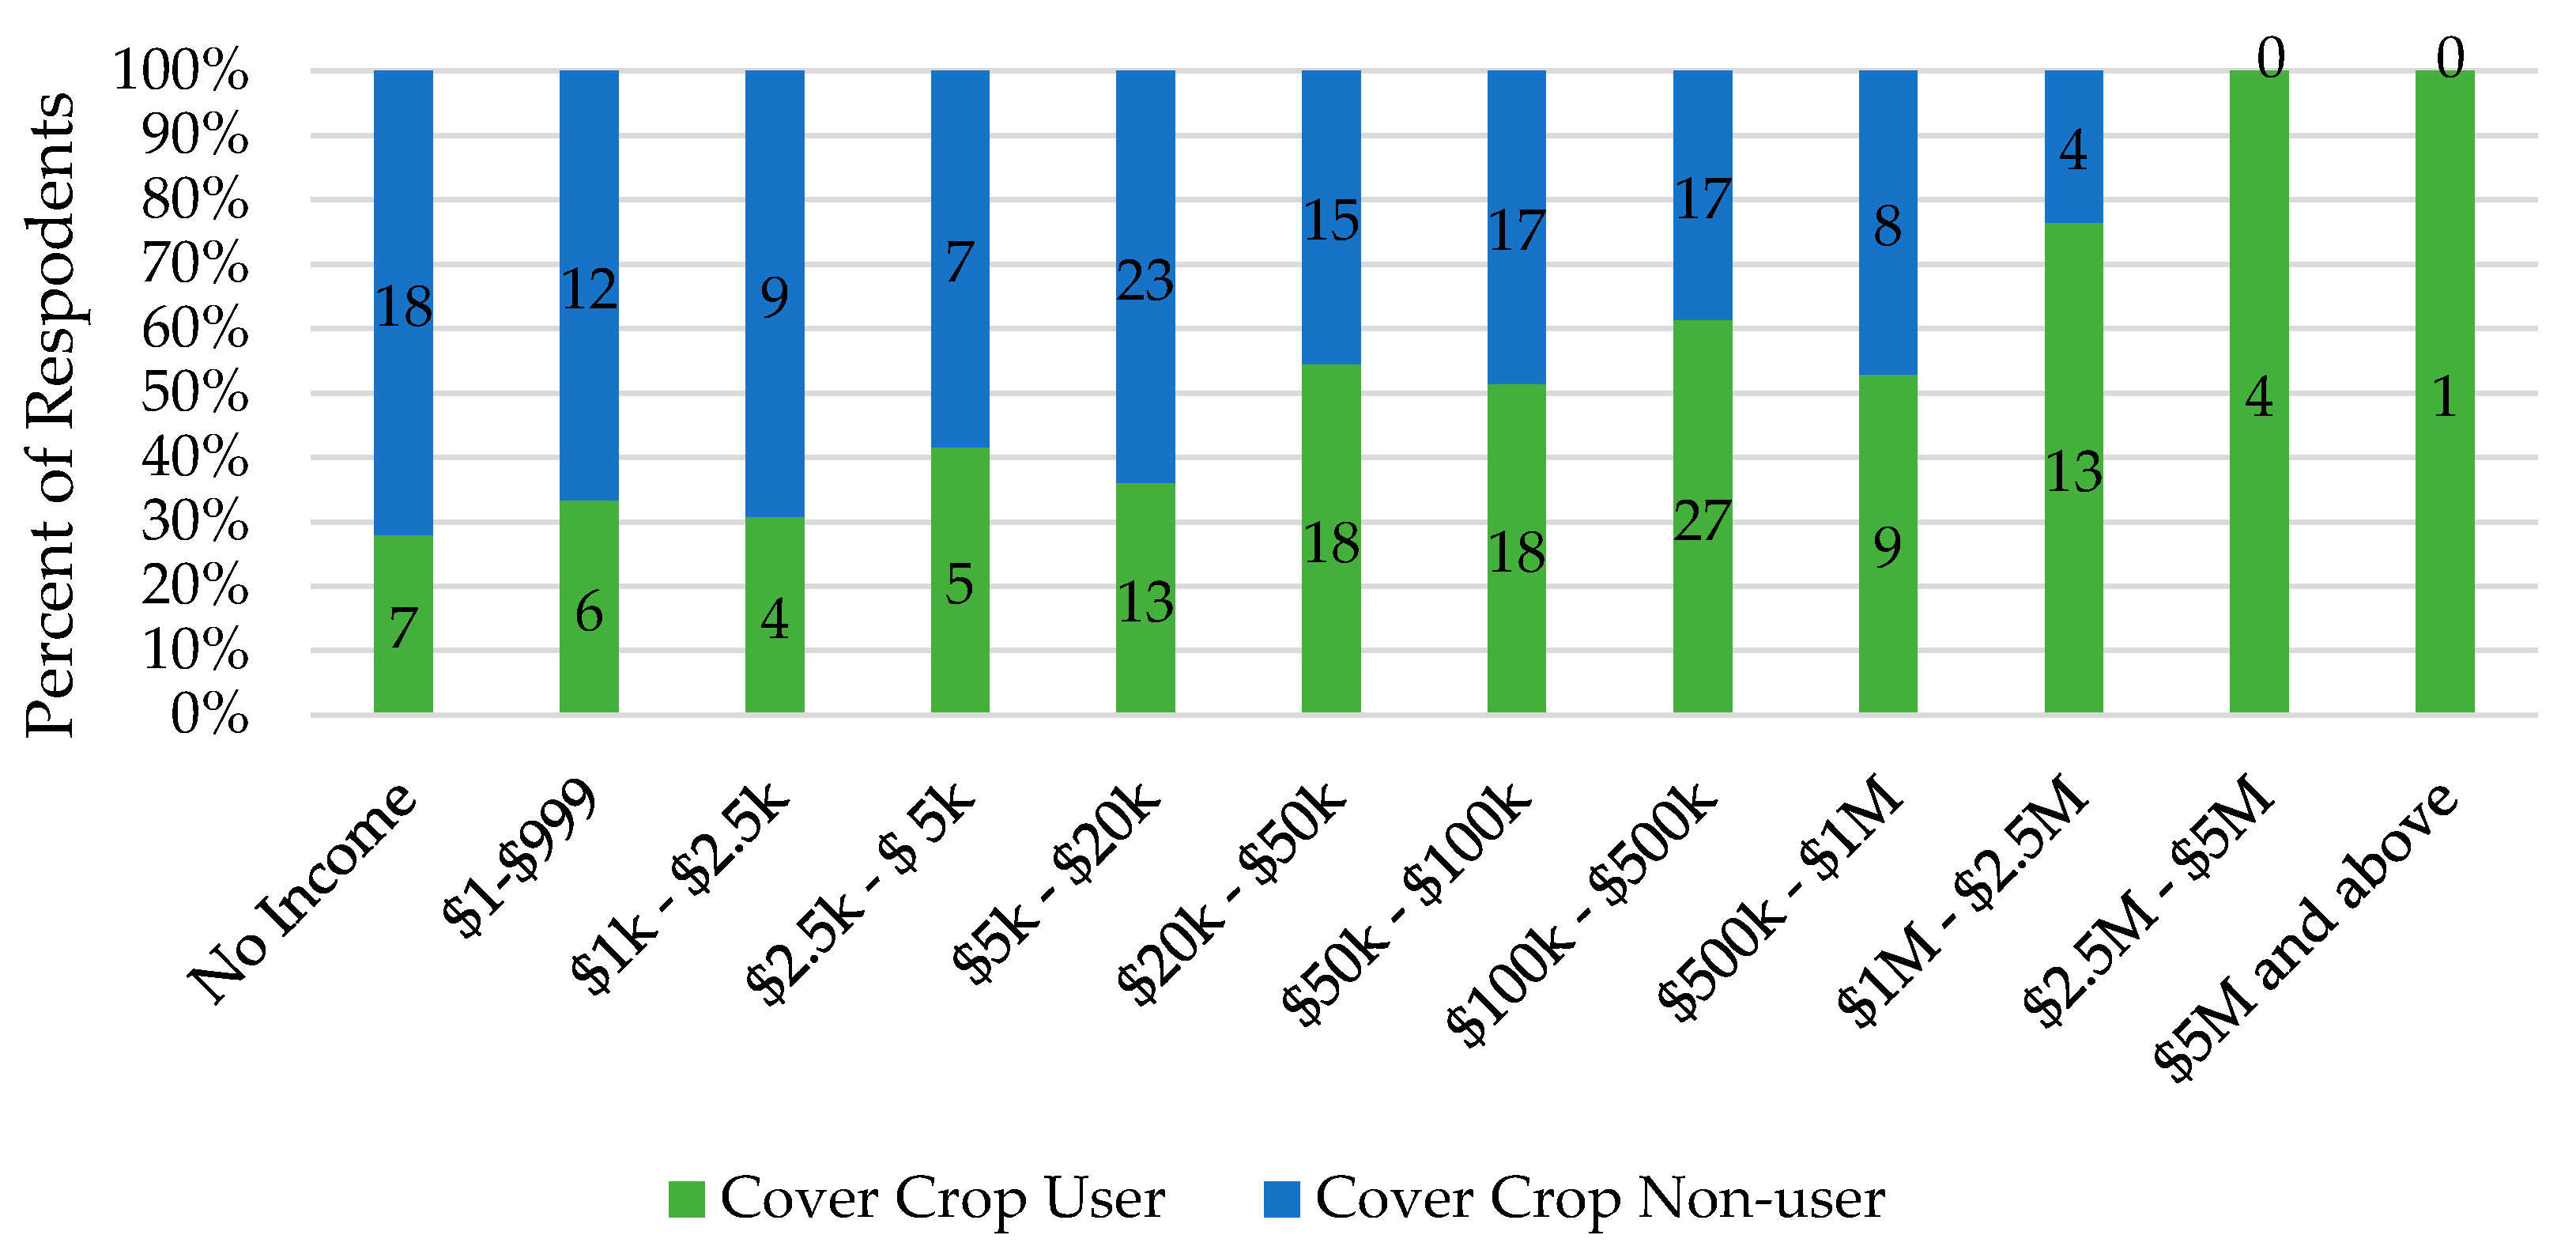
The responses are shown in Figure 5, with the numbers corresponding to each above question. This graph shows an interesting pattern that, while respondents are typically concerned about agriculture′s impact on water quality and a strong opinion is shared that farmers as a group should do more to reduce nutrient runoff, a much smaller proportion of the respondents are willing to take the specific action suggested in the survey of allowing a third party evaluation of their own performance. Finally, farmers seem to be equally distributed among those who accept the premise that nutrients from farms damage ocean life and those who reject the premise.

3.4. Demographics

We asked about the age of survey recipients. It has been shown that age is often a determinant for the implementation of conservation practices, and older farmers were less likely to adopt these practices [7].
Figure 6 shows the distribution of respondents by age and whether they implemented cover crops. There is a statistically significant age difference between cover crop users and non-users—while the mean age of the former group is 45–54, the mean age of the latter group is 55–64. Older farmers are less likely to have used cover crops than younger farmers; however, the mean age of all farmers is also in the 45–54 age range, showing most farmers are already older, thus providing an explanation as to why the age difference is statistically significant.
Farmers were also asked to indicate their highest level of education attained. More than 90% (283 out of 308) of survey respondents answered this question, and the largest group of respondents was that comprising those with bachelor′s degrees. ″Some high school″ education had the smallest group of respondents. Figure 7 shows the education distribution among users and non-users. There was no statistically significant difference between education attained and implementation of cover crops when tested using one-way ANOVA.
Gross income was also asked of all the respondents. Response options were broken down into twelve different categories. Figure 8 shows the distribution of income for respondents based on whether they used cover crops or not. A one-way ANOVA test showed that income is significant when considering whether farmers will implement cover crops or not. The analysis indicates that those with a higher income were more likely to implement cover crops. Furthermore, farm size and income level were highly correlated (p < 0.05) in a one-way ANOVA test.
Many of the selected demographic variables and farm size are associated with cover crop adoption are also correlated among themselves, making it difficult to determine which single factor is the most important to foster cover crop adoption. Nevertheless, the results do provide important information regarding the factors necessary to consider when designing and implementing programs that promote cover crops and provide technical advice to farmers.

4. Discussion

4.1. Overview

We received 308 responses from the originally distributed 3000 surveys (10.3% response rate). There was significant representation of farmers that plant the following cash crops: corn, cotton, hay, oats, peanuts, soybeans, and wheat. There were also significant responses from those who have livestock and poultry. Almost half of respondents (49.1%) indicated that they currently use or have used cover crops on their farmland. While this number of survey respondents who utilize cover crops is potentially indicative of a large number of CC users, the U.S. Census agriculture survey that was distributed in 2017 shows that cover crop implementation comprises only 6% of agriculture lands in South Carolina. Furthermore, there has only been a 1.9 percent increase in cover crop implementation since 2012 [28]. Even with a random sampling, it is plausible that farmers who have a heightened interest in cover crops or even utilize cover crops are those that completed the survey. It is possible that those who do not have any interest in cover crops or even disagree with the science behind cover crops did not complete the survey, creating a non-response bias [29]. Follow up mail surveys were used in this study to attempt to mitigate this problem and were included in these results.

4.2. Cover Crop Usage

A variety of cover crops were found to be utilized in SC. While it was difficult to capture when a cover crop mix was used, the data showed that cereal rye, ryegrass, oats, and wheat were dominantly used. Crimson clover and sorghum sudangrass are increasing in usage and all cover crops had significant increases in their usage between 1995 and 2017. These data may indicate that farmers are branching out to other cover crops and cover crops in general are becoming more prevalent. This may also show that seed is becoming more available for the specific practice of cover cropping. Seed availability has been a challenge for many medium to small operation producers.

4.3. Challenges and Benefits

The challenges and benefits of cover crops questions were designed to determine if CC users and non-users perceive the effectiveness of cover crops differently. For many questions, it was apparent that the challenges farmers face to implement cover crops and the benefits gained are different between groups. Those who are implementing cover crops report larger perceived benefits than those who do not utilize cover crops.
Challenges that exist for SC farmers are mostly those related to the cost of cover crop seed, availability of the seed, and the time and labor required to plant and manage the cover crop. Challenges, such as no measurable economic return, cover crop seed cost and availability, and cost of planting and management, are statistically significant issues in terms of the way non-users and users perceive these challenges. All the challenges presented may limit the capacity of farmers to plant cover crops, especially those who have never used cover crops or do not fully grasp the benefits obtained from cover crops. Based on the survey of challenges for both users and non-users, those who already use cover crops have the same challenges, but they may have additional resources and motivations not assessed in this study to plant cover crops. These case by case scenarios that consider minor factors, such as accessibility to seed/resources, size of farm, income, and weather, can be important factors when determining if a farmer can effectively and economically implement cover crops.
Regarding the benefits of cover crops, both users and non-users seem to have an understanding that cover crops provide a variety of benefits. While many of the non-user and user perceptions towards cover crop benefits are significantly different, the average perception among non-users was that cover crops are “somewhat important” (4.14 in a scale of 5) for increasing soil organic matter. This may be indicative of farmers learning and understanding the benefits of cover crops but not having the resources and time to actually carry out a cover crop operation [30]. Some farmers even indicated in the comments section of the survey that they would like to learn about the economic benefits of cover crops, not simply to implement cover crops because a subsidy is available to help them.

4.4. Environmental Considerations

Understanding farmer′s considerations on the environment can help us better understand their motivations behind utilizing cover crops. Eventually, this understanding can inform educational methods for best management practices. The response to environmental considerations relating to how farms affect water quality was indicative of farmers already having some or extensive education on this topic. The results of our survey show that 90% of farmers agreed that they should do more to reduce nutrient runoff into waterways. Likewise, 81% of farmers are concerned about the impact of agriculture on water quality. One of the major barriers that remains is the general uncertainty associated with agriculture production [31]. Growing conditions, weather, and location can have a significant effect on how farmers choose to apply fertilizers and herbicides. The over-application of fertilizers to offset the potential losses due to adverse conditions can negatively affect soil and water quality.
On the contrary, when asked if nutrients from farms are contributing to algae blooms and red tide in the ocean, only 49% of respondents believed that this is occurring. It is possible that farmers in general understand the direct impacts of the nutrient runoff but not the long term or long distance impacts of the transfer of nutrients through river systems. Additionally, increased publicity in mainstream media of the effects of nutrient runoff and hypoxia in the Gulf of Mexico and around Florida may contribute to farmers denying that they contribute to this problem. Furthermore, as media coverages aims to identify the source of the problem, farmers are quick to deny that they are the source, even if science does indicate that this is occurring [32].
55% of farmers would be interested in an analysis of how their farm is doing to reduce runoff into waterways. These types of mitigation efforts would benefit farmers in multiple ways; they would be protecting the environment from nutrient runoff and they would be saving top soil and nutrients, resulting in less fertilizers needing to be applied to the soil.

5. Conclusions

While our results do not necessarily indicate that farmers in South Carolina are increasing their adoption of cover crops, it does show when the respondents started using cover crops and provides needed insight into farmers′ perceptions of cover crops. Furthermore, the results indicate that more respondents have implemented cover crops in recent years. The environmental benefits of increased usage are well documented, and the understanding of the economic benefits from cover crops is increasing. Cover crops have been shown to provide economic benefit when fertilizer inputs are reduced; they are sold as feed or foraged [33]. Many farmers seem to be aware of these benefits and subsequently have made it a priority to implement cover crops. The present study documents that adopting cover crops remains challenging for many farmers, due to time, labor, and funds required to change the crop rotations to include cover crops. It was also found that age and income are statistically significant when determining the likelihood that farmers implement cover crops.
Our study also highlights farmers′ understanding of the localized effects of nutrient and soil runoff on the environment. Education efforts in the state through Clemson University Cooperative Extension, the SC Natural Resources Conservation Service, and the Richland County Soil and Water District provide resources to help farmers understand the connections between soil runoff, environmental degradation and ultimately crop yield. It is imperative that these education efforts continue to provide sound science that will help farmers understand these connections and show why cover crops and other best management practices, such as no-till, are viable methods to protect the environment and increase crop yields. Challenges in the realms of seed cost and labor requirements can and should also be addressed at educational sessions so farmers can be better informed of their options to make budgeting for cover crops easier. Outreach to more farmers will also be crucial for implementing conservation practices.
A natural extension of the present study is the analysis of farmers′ willingness to accept cost share payments for implementing cover crops. These types of funds can help spur a farmer′s cover crop operation to the point where it is more sustainable economically. Information obtained through this survey provides a basis for policy makers and Cooperative Extension personnel to understand the challenges better and determine ways to encourage farmers to implement cover crops and other conservation practices.

Author Contributions

For research articles with several authors, a short paragraph specifying their individual contributions must be provided. Conceptualization for the project was carried out by M.M. and L.C. Methodology was developed by M.M., L.C., B.S.F., and A.P. Data curation was carried out by L.C., M.M., and K.P. Formal Analysis was carried out by K.P. and L.C. Original draft preparation was carried out by L.C. Reviewing and editing was carried out by L.C., K.P., A.P., B.S.F., and M.M. Project administration and funding acquisition was carried out by M.M. All authors have read and agreed to the published version of the manuscript.

Funding

This project was funded by the U.S. Dept. of Agriculture through the National Institute for Food and Agriculture, grant # 2018-67020-27854. This project was also partially funded by the Natural Resources Conservation Service (NRCS) grant # NR184639XXXXG002.

Acknowledgments

The authors would like to acknowledge all of the students and staff at the Baruch Institute of Forest Ecology and Coastal Science who helped prepare surveys for distribution. Additionally, we would also like to acknowledge the Richland County Soil and Water Conservation District (SC) for allowing us to pretest our survey at their meeting.

Conflicts of Interest

The authors declare no conflict of interest. The funders had no role in the design of the study; in the collection, analyses, or interpretation of data; in the writing of the manuscript, or in the decision to publish the results.

References

  1. Trimble, S.W.; Crosson, P.U.S. Soil Erosion Rate—Myth and Reality. Science 2000, 289, 248–250. [Google Scholar] [CrossRef] [Green Version]
  2. Eleazer, J.M. Our Land is Our Life; Conservation of South Carolina’s Natural Resources; South Carolina Department of Education: Columbia, SC, USA, 1955; pp. 54–56. [Google Scholar]
  3. Garten, C.T. Soil carbon storage beneath recently established tree plantations in Tennessee and South Carolina, USA. Biomass Bioenergy 2002, 23, 93–102. [Google Scholar] [CrossRef]
  4. Frye, W.W.; Blevins, R.L. Economically sustainable crop production with legume cover and conservation tillage-crops. J. Soil Water Conserv. 1989, 44, 57–60. [Google Scholar]
  5. Dabney, S.M.; Delgado, J.A.; Reeves, D.W. Using winter cover crops to improve soil and water quality. Commun. Soil Sci. Plant Anal. 2001, 32, 1221–1250. [Google Scholar] [CrossRef]
  6. Hoorman, J.J.; Islam, R.; Sundermeier, A.; Reeder, R. Using Cover Crops to Convert to No-Till. Crop Soils 2009, 42, 9–13. [Google Scholar]
  7. Arbuckle, J.G.; Roesch-McNally, G. Cover crop adoption in Iowa: The role of perceived practice characteristics. J. Soil Water Conserv. 2015, 70, 418–429. [Google Scholar] [CrossRef] [Green Version]
  8. Dunn, M.; Ulrich-Schad, J.D.; Prokopy, L.S.; Myers, R.L.; Watts, C.R.; Scanlon, K. Perceptions and use of cover crops among early adopters: Findings from a national survey. J. Soil Water Conserv. 2016, 71, 29–40. [Google Scholar] [CrossRef]
  9. Kaspar, T.C.; Singer, J.W. The Use of Cover Crops to Manage Soil. USDA-ARS 2011, 321–337. [Google Scholar] [CrossRef] [Green Version]
  10. Snapp, S.; Labarta, S.; Mutch, R.; Black, D.; Leep, R.; Nyiraneza, J.; O′Neil, K. Evaluating cover crops for benefits, costs and performance within cropping system niches. Agron. J. 2005, 97, 322–332. [Google Scholar] [CrossRef] [Green Version]
  11. Pittelkow, C.M.; Liang, X.; Linquist, B.A.; Van Groenigen, L.J.; Lee, J.; Lundy, M.E.; Van Gestel, N.; Six, J.; Venterea, R.T.; Van Kessel, C. Productivity limits and potentials of the principles of conservation agriculture. Nature 2015, 517, 365–368. [Google Scholar] [CrossRef]
  12. Hobbs, P.R. Conservation Agriculture: What is it and why is it important for future sustainable food production. J. Agric. Sci. 2007, 145, 127–137. [Google Scholar] [CrossRef] [Green Version]
  13. Montgomery, D. Soil erosion and agricultural sustainability. Proc. Natl. Acad. Sci. USA 2007, 96, 13268–13272. [Google Scholar] [CrossRef] [PubMed] [Green Version]
  14. Sasal, M.C.; Castiglioni, M.G.; Wilson, M.G. Effect of crop sequences on soil properties and runoff on natural-rainfall erosion plots under no tillage. Soil Tillage Res. 2010, 108, 24–29. [Google Scholar] [CrossRef]
  15. Bogunovic, I.; Pereira, P.; Kisic, I.; Sajko, K.; Sraka, M. Tillage management impacts on soil compaction, erosion and crop yield in Stagnosols (Croatia). Catena 2018, 160, 376–384. [Google Scholar] [CrossRef]
  16. Christensen, L.A.; Norris, P.E.; Walter, J. Soil conservation and water quality: What farmers think. J. Soil Water Conserv. 1983, 38, 15–20. [Google Scholar]
  17. Centner, T.J.; Houston, J.E.; Keeler, A.G.; Fuchs, C. The adoption of best management practices to reduce agricultural water contamination. Limnologica 1999, 29, 366–373. [Google Scholar] [CrossRef] [Green Version]
  18. Dowd, B.M.; Press, D.; Huertos, M.L. Agricultural nonpoint source water pollution policy: The case of California′s Central Coast. Agric. Ecosyst. Environ. 2008, 128, 151–161. [Google Scholar] [CrossRef]
  19. Arellanes, P.; Lee, D.R. The Determinants of Adoption of Sustainable Agriculture Technologies: Evidence from the Hillsides of Honduras. In Proceedings of the International Conference of Agricultural Economists 2003 Annual Meeting, Durban, South Africa, 16–22 August 2003. [Google Scholar]
  20. Mutch, D.R.; Martin, T.E. Cover crops: Key concepts and questions. In Michigan State Field Crop Ecology; Michigan State Extension: East Lansing, MI, USA, 1998; pp. 44–53. [Google Scholar]
  21. Marcillo, G.S.; Carlson, S.; Filbert, M.; Kaspar, T.; Plastina, A.; Miguez, F.E. Maize system impacts of cover crop management decisions: A simulation analysis of rye biomass response to planting populations in IA, USA. Agric. Syst. 2019, 176, 1–12. [Google Scholar] [CrossRef] [Green Version]
  22. Vyn, T.J.; Janovicek, K.J.; Miller, M.H.; Beauchamp, E.G. Soil nitrate accumulation and corn response to preceding small-grain fertilization and cover crops. Agron. J. 1999, 91, 17–24. [Google Scholar] [CrossRef]
  23. Abawi, G.S.; Widmer, T.L. Impact of soil health management practices on soilborne pathogens, nematodes and root diseases of vegetable crops. Appl. Soil Ecol. 2000, 20. [Google Scholar] [CrossRef]
  24. Plastina, A.; Liu, F.; Miguez, F.; Carlson, S. Cover crops use in Midwestern US agriculture: Perceived benefits and net returns. Renew. Agric. Food Syst. 2018. [Google Scholar] [CrossRef] [Green Version]
  25. Reimer, A.P.; Prokopy, L.S. Farmer Participation in U.S. Farm Bill Conservation Programs. Environ. Manag. 2014, 53, 318–332. [Google Scholar] [CrossRef] [PubMed]
  26. USDA (U.S. Department of Agriculture). FY 2012 Budget Summary and Annual Performance Plan; U.S. Department of Agriculture: Washington, DC, USA, 2012.
  27. EQIP (Environmental Quality Incentives Program). NRCS. Available online: https://www.nrcs.usda.gov/wps/portal/nrcs/main/national/programs/financial/eqip/ (accessed on 24 January 2019).
  28. Cover Crops. 2017 US Census of Agriculture. Available online: https://farmdocdaily.illinois.edu/2019/07/cover-crops-2017-us-census-of-agriculture.html (accessed on 16 April 2020).
  29. Mccaffrey, S.M. Understanding Public Perspectives of Wildfire Risk. In Wildfire Risk: Human Perceptions and Management Implications, 1st ed.; Martin, W., Raish, C., Kent, B., Eds.; Resources for the Future: Washington, DC, USA, 2008; Volume 1, pp. 11–22. [Google Scholar]
  30. Roesch-Mcnally, G.E.; Basche, A.D.; Arbuckle, J.G.; Tyndall, J.C.; Miguez, F.E.; Bowman, T.; Clay, R. The trouble with cover crops: Farmers′ experiences with overcoming barriers to adoption. Renew. Agric. Food Syst. 2018, 33. [Google Scholar] [CrossRef] [Green Version]
  31. Sheriff, G. Efficient Waste? Why Farmers Over-Apply Nutrients and the Implications for Policy Design. Rev. Agric. Econ. 2005, 27, 542–557. [Google Scholar] [CrossRef]
  32. Paolisso, M.; Chambers, E. Culture, Politics, and Toxic Dinoflagellate Blooms: The Anthropology of Pfiesteria. Hum. Organ. 2001, 60, 1–12. [Google Scholar] [CrossRef]
  33. Gabriel, J.L.; Garrido, A.; Quemada, M. Cover crops effect on farm benefits and nitrate leaching: Linking economic and environmental analysis. Agric. Syst. 2013, 121, 23–32. [Google Scholar] [CrossRef]
Figure 1. Count of Farmers by Cover Crop Use.
Agriculture 10 00372 g001
Figure 2. Distribution of respondents from each county in SC, count indicated by color.
Agriculture 10 00372 g002
Figure 3. Distribution of responses by farm size.
Agriculture 10 00372 g003
Figure 4. User Count for each specific cover crop based on year range.
Agriculture 10 00372 g004
Figure 5. Respondent′s answers to environmental questions (Yes or No).
Agriculture 10 00372 g005
Figure 6. The distribution of respondents based on age (p < 0.05).
Agriculture 10 00372 g006
Figure 7. Education level of survey respondents; respondent count is indicated in each bar.
Agriculture 10 00372 g007
Figure 8. Income distribution of cover crop users and non-users; respondent count is indicated in each bar.
Agriculture 10 00372 g008
Table 1. Selected challenges associated with planting cover crops; means compared between cover crop users and non-users.
Count—Cover Crop (CC) UsersCount—CC Non-Users
12345MeanRank12345MeanRank
Cover crops sometimes use too much moisture583222621.85144114391102.775*
Not knowing most effective seeding rate3341172712.3492721302342.1911*
Selecting the right cover for my operation2736223052.5852118312883.252
No measurable economic return24253915132.72119124121122.775*
Cover crop becomes a weed the following year405018912.34930173216102.1911*
Nitrogen conversion to organic forms213656432.5853018461012.248
Yield reduction in the following cash crop304334652.721291347872.775
Increased insect potential3235351141.99112711461642.1911*
Time and labor required for planting and management18291647102.5851682831252.248
Cover crop seed cost16133148142.7211563727203.103*
Cover crop seed availability1930322961.9911199462482.1911
Increased disease potential343739712.4382816461052.248*
Increases overall crop production risk314138822.7212213511253.103*
Cost of planting and managing cover crops1915304981.99111373032253.461
* significantly different at p < 0.05 (Chi-Squared test).
Table 2. Selected benefits associated with planting cover crops; means compared between cover crop users and non-users.
Count–CC UsersCount–CC Non-Users
12345MeanRank12345MeanRank
Reduces soil erosion45528834.452841629544.052*
Controls weeds331336684.334542732413.926*
Provides nitrogen scavenging562531544.0210663331333.7210*
Increases yields in following cash crop762721634.029664123323.6413*
Economic return452426634.146553525413.837*
Deep tap roots6102739383.7813854926223.4517*
Attracts pollinators to my farm5123825393.6814863730283.5914*
Reduces nutrient/pesticide runoff581533564.097843129353.749*
Winter kills easily8264916183.0918894433163.3618*
Winter hardiness/survival7123427373.6415944528233.4816
Controls insects7105122253.42171043828293.5715*
Reduces diseases8104028303.5316972833333.6712*
Increases soil organic matter and soil health23629834.531731432554.131*
Reduces soil compaction431131714.353822333443.944
Provides a nitrogen source562234544.048722432453.963
Fibrous root system762935403.8112823231363.788*
Decreases the cost of producing the following cash crops573726443.8211923630333.6911
Environmental Benefits to protect waterways541928624.175822432443.935
* significantly different at p < 0.05 (Chi-Squared test).

